Survey of Emerging Market Conditions
|
|
|
- Margery Lee
- 5 years ago
- Views:
Transcription


1 Survey of Emerging Market Conditions Quarter Published University of Florida Bergstrom Center for Real Warrington Estate Studies College of Business Administration 1

2 Lead Researcher Dr. Wayne R. Archer, Executive Director University of Florida Bergstrom Center for Real Estate Studies Professor of Real Estate Warrington College of Business Administration Researcher and Analyst Timothy S. Becker, CCIM, Director University of Florida Bergstrom Center for Real Estate Studies Editorial Board Mr. Lewis Goodkin, President Goodkin Consulting, Miami, FL Dr. Hank Fishkind, President Fishkind & Associates, Inc., Orlando, FL Mr. Jeff Conn, Principal NAI Hallmark, Jacksonville, FL The Survey of Emerging Market Conditions is provided to all invited survey respondents who completed the survey during the July 2014 fielding. For more information about the survey or the Bergstrom Center for Real Estate Studies, visit our 2 website at realestate.ufl.edu
3 Table of Contents Executive Summary & Conclusions...5 Highlights...5 The Survey...6 General...6 Single Family & Condominium Development...6 Apartments...6 Industrial...6 Office...6 Retail...6 Land Investment...6 Capital Availability...6 UF Commercial Real Estate Sentiment Index...7 Section 1:...8 Section 2: Residential Development...8 Expected Absorption Rates...8 Expected Price Changes Section 3: Apartments... 9 Expected...9 Expected Rental Rates Section 4: Industrial Expected...12 Expected Rental Rates Section 5: Office...14 Expected...14 Expected Rental Rates Section 6: Retail...16 Expected...16 Expected Rental Rates Section 7: Outlook for Investment in Undeveloped Land...19 Land Without Entitlements or with Residential Entitlements...19 Land with Office or Retail Entitlements...19 Land with Hospitality Entitlements...19 Land with Entitlements for or R&D Land for Urban Renewal Section 8: Business and Capital Availability Outlook Capital Availability UF Commercial Real Estate...21 Sentiment Index...21 Section 9: Dominant Investors...22 Section 10: Characteristics of Survey Respondents...22 Profession of Respondents Markets of Familiarity Property types of Familiarity Section 11: Details of, and Expected Changes Section 12: Local Markets Regional Market Report for Dade...27 Multi-Family Properties Industrial Properties Office Properties Retail Properties
4 Regional Market Report for Broward Multi-Family Properties...31 Industrial Properties Office Properties Retail Properties...34 Regional Market Report for Palm Beach...35 Multi-Family Properties Industrial Properties Office Properties Retail Properties Regional Market Report for Treasure Coast Multi-Family Properties Industrial Properties...40 Office Properties Retail Properties...42 Regional Market Report for Southwest Coast Multi-Family Properties...43 Industrial Properties...44 Office Properties...45 Retail Properties...46 Regional Market Report for Daytona Beach...47 Multi-Family Properties...47 Industrial Properties...48 Office Properties...49 Retail Properties...50 Regional Market Report for Orlando Multi-Family Properties...51 Industrial Properties Office Properties Retail Properties...54 Regional Market Report for Lakeland...55 Multi-Family Properties Industrial Properties Office Properties Retail Properties Regional Market Report for Tampa Multi-Family Properties Industrial Properties...60 Office Properties...61 Retail Properties...62 Regional Market Report for Sarasota Multi-Family Properties Industrial Properties...64 Office Properties Retail Properties...66 Regional Market Report for Jacksonville...67 Multi-Family Properties Industrial Properties...68 Office Properties...69 Retail Properties...70 Regional Market Report for Gainesville/ Ocala Multi-Family Properties...71 Industrial Properties Office Properties Retail Properties Regional Market Report for Tallahassee/ Panhandle...75 Multi-Family Properties Industrial Properties Office Properties Retail Properties
5 Executive Summary & Conclusions Optimism for Florida real estate remains strong among practitioners as UF s Commercial Real Estate Sentiment Index, an outlook of our respondents own businesses, improved to its highest level since the third quarter of Florida s improving economy continues to drive real estate markets. Through the first quarter, Florida added over 57,000 jobs crossing the eight million mark for the first time since June Unemployment remained at its lowest level since June 2008 at 5.5%. The largest increase in employment has occurred in hospitality, construction, and education and health services. The increase in employment for hospitality continues to be driven by record tourism. According to Visit Florida, the state continues to see record setting levels of tourism with total visitation up 5.1% in 2014, reaching over 98 million visitors. We expect that trend to continue with Florida visitation surpassing 100 million visitors in While survey respondents are positive about the future, they remained concerned about the prospect of interest rate increases in the near term. The first quarter sluggishness of the U.S. economy may postpone rate increases, providing additional buoyancy to the real estate markets as capital continues to flow into real estate because of these historically low rates. A measured increase by the Federal Reserve would allow real estate markets to absorb the increases through compression of the historically high spreads between cap rates and the 10 year yield. Additionally, the increased interest rates may be offset by improving rents and net operating incomes. Despite the uncertainties, Florida s economy and therefore the real estate markets continue to improve and that trend should continue. HIGHLIGHTS ɀɀ The UF Commercial Real Estate Sentiment Index increased this quarter to its highest level since the 3rd quarter of The continued improvement in the job market along with tremendous growth in the tourism industry has been positive for consumer confidence. The UF Bureau of Economic and Business Research (BEBR) consumer sentiment index has increased dramatically over the first quarter, reaching 96.8, its highest level in over 10 years. These factors are having a positive impact on the commercial market in Florida, driving increasing development in multifamily and retail properties throughout the state. However, the outlook for single family residential development remains mixed. The NAHB/ Wells Fargo Regional Housing Index for the south remains muted at 54 while single family housing starts in Florida remain steady but at almost half the average monthly average over the past 20 years. ɀɀ ɀɀ ɀɀ ɀɀ ɀɀ The outlook for occupancy and rents remained positive across all property types with expectations that they will remain stable or increase. Cap rates remained stable across most property types. Expectations for cap rates were mixed as uncertainty on interest rates had impacts on certain property types. have remained relatively stable across most property types. The outlook for investment remained positive across all property types. Respondents outlook for capital availability remained stable this quarter with most expecting it to increase in the future. 5
6 THE SURVEY Our quarterly survey, conducted by the Bergstrom Center for Real Estate Studies, Warrington College of Business Administration, University of Florida is in its thirty-seventh fielding. The total number of participants, at 97, is the most extensive survey of Florida professional real estate analysts and investors conducted on an ongoing basis. It includes respondents representing thirteen urban regions of the state and up to fifteen property types. GENERAL INVESTMENT OUTLOOK Our general index of real estate investment outlook, weighted 40 percent for single family and condo development, 40 percent for apartments and commercial rental property and 20 percent for developable land, improved this quarter to a survey high. Most respondents believe it is a good time to invest in Florida real estate. Land continues to improve as an investment alternative as development heats up across the state. SINGLE FAMILY & CONDOMINIUM DEVELOPMENT The outlook for new single family development remained positive. Florida continues to have positive population growth and employment growth which is driving demand for new homes. Extreme winter conditions prompt more people to consider Florida, particularly retirees or near retirees. However, higher interest rates, declining incomes and higher land prices will dampen optimism slightly in this sector. APARTMENTS The outlook for multi-family properties continues to be positive. has been increasing at a rapid pace over the past few years; however, because of increases to inventory from new construction along with current units near capacity, respondents believe that occupancy will level off. Respondents remain optimistic that rents will rise with inflation. Cap rates remained steady this quarter with more respondents believing they will increase in the next year. INDUSTRIAL The outlook for investment in industrial properties increased dramatically this quarter to its highest level since the beginning of the survey. and occupancy are expected to increase in coming quarters. Cap rates and yields remained relatively stable for both sectors, a trend that is expected to continue in future quarters. OFFICE The outlook for the office remained positive this quarter, with a majority of respondents believing it is a good time to buy. Increasing occupancy and rent expectations are driving the investment outlook. Cap rates and yields have remained relatively stable, and most respondents expect that trend to continue. RETAIL The outlook for retail properties remained positive this quarter for all four sectors. Growth in rents and occupancy are driving the optimism. The positive fundamentals continue to drive cap rates and yields lower across all sectors. Respondents remained mixed on the future direction of cap rates and yields across the four sectors with decreases expected in large retail centers. LAND INVESTMENT The outlook for investment in land reached new survey highs across all land sectors. Improving fundamentals, job growth and population growth are driving development across the state. This is increasing the need for land to attract more development. CAPITAL AVAILABILITY The low interest rate environment continues to drive capital to real estate. Improving fundamentals is driving the need for more development and capital is following the demand. Respondents believe these trends will continue in future quarters despite the threat of interest rate increases this year. 6
7 UF COMMERCIAL REAL ESTATE SENTIMENT INDEX The Sentiment index increased this quarter to its highest level since the 3rd quarter of Developers continue to drive the index as development activity picks across the state. Appraisers continue to have the least optimistic view as regulation has driven fees lower. Lender expectations dropped this quarter, but remain positive about the next year. 7
8 Section 1: The investment outlook for Florida improved to a survey high this quarter. Despite uncertainty in the national economic view, Florida s economy continues to improve. Increased employment, record tourism and international investment have proven a catalyst for the real estate markets. These factors are leading respondents to believe that fundamentals will continue improving in future quarters across all sectors. These improving fundamentals along with a shortage of supply are increasing development activity across the state and therefore the outlook for investment in land, which reached a survey high. Good Time To Buy Mixed Time To Buy Bad Time To Buy : Florida Real Estate Q1 06- Q4 07- Q3 08- Q2 09- Q1 09- Q4 10- Q3 11- Q2 12- Q1 12- Q4 13- Q3 14- Q2 Respondents remain concerned about the uncertainty in Washington D.C. and the effect on interest rates. Consensus among the respondents is that interest rates will increase but worry about the rate of increase and the timing. This investment index is weighted 40 percent on single family and residential condominium development, 40 percent on rental property of all types, and 20 percent on undeveloped land. Thus, it is at least fifty percent driven by the residential development outlook. Section 2: Residential Development EXPECTED ABSORPTION RATES The outlook for residential absorption improved this quarter with respondents continuing to believe that absorption will increase. The improved Florida economy will help the housing market as we continue to see net population growth and job growth in the state. Additionally, a robust winter selling season boosted expectations and drove builders to expand lot inventories to drive growth. Banks are starting to lend more in this market which will help additional potential borrowers take advantage of the current interest rates before they go up again. However, there remains a credit crunch in the housing market that continues to hold down growth opportunities. Increase No Change Decrease Outlook for Residen0al Absorp0on Rates 06- Q1 06- Q4 07- Q3 08- Q2 09- Q1 09- Q4 10- Q3 11- Q2 12- Q1 12- Q4 Single Family Development Condominium Development The condo market is primarily driven by South Florida. Foreign buyers and all cash transaction continue to dominate the marketplace. 13- Q3 14- Q2 8
9 EXPECTED PRICE CHANGES Expectations for price changes increased this quarter for both single family and condo developments after several quarters of decline. Continued improvement of Florida s economy will continue to have a positive impact on pricing. However, there are increasing headwinds as real employee wages remain stagnant and expectations that interest rates will again start increasing. Continuation of these trends will have a significant impact on builders ability to increase pricing. In the meantime, builders are able to increase pricing to offset the increased cost of materials and labor. Rising Faster Than Inflation Rising at the Rate of Inflation Rising Slower than the rate - 1 of Inflation Declining Single Family Development Section 3: Apartments Outlook for Prices of New Residences 06- Q1 06- Q3 07- Q1 07- Q3 08- Q1 08- Q3 09- Q1 09- Q3 10- Q1 10- Q3 11- Q1 11- Q3 12- Q1 12- Q3 13- Q1 13- Q3 14- Q1 14- Q3 Condominium Development EXPECTED OCCUPANCY The outlook for occupancy in market rate apartments improved slightly this quarter, with respondents expecting occupancy to stabilize. Their views reflect the additional inventory being delivered to the market as well as the already high levels of occupancy in the market. Respondents continue to believe that demographics are favorable for this sector in the near future, which will have a positive impact on absorption of additional supply. Additionally, any increase in interest rates will prevent more buyers from purchasing and force them to remain renters. Good Time To Buy Mixed Time To Buy Outlook for Investment: Residential Development Bad Time To Buy - 2 Single Family Development Q1 06- Q4 07- Q3 08- Q2 09- Q1 09- Q4 10- Q3 11- Q2 12- Q1 12- Q4 13- Q3 14- Q2 Condominium Development INVESTMENT OUTLOOK The outlook for investment in residential development increased again this quarter. Better fundamentals for new residential development are having a positive impact on the investment outlook. A strong selling season for our part-time winter residents boosted builder confidence. An improving economy continues to drive additional investment in the residential market. Continued job growth and population growth will drive the need for additional housing in key markets which will spur investment. Investors will continue to keep a close eye on the interest rates as they make investment decisions in this sector. An increase in investment in land will drive land prices higher which could have a negative impact on this sector moving forward. Increase No Change Decrease Outlook for : Apartments Q1 06- Q4 07- Q3 08- Q2 09- Q1 09- Q4 10- Q3 11- Q2 12- Q1 12- Q4 13- Q3 14- Q2 Apartments - Market Rent Apartments - Condo Conversion 9
10 If developers remain disciplined and don t overbuild, the apartment sector will remain a good investment. EXPECTED RENTAL RATES Expectations for rental rates improved slightly this quarter for market rent apartments as respondents continue to expect rental rates to increase with inflation. Demand continues to outweigh supply which has driven both occupancy and rents higher. This trend will continue as demographic preferences lean toward rental living in urban areas. However as the large number of new units under construction are delivered to the market there will be increased pressure on rents to maintain occupancy at older well located properties. This should continue over the near future. Rising Faster 1 Than Inflation Rising at the Rate 0 of Inflation RisingSlower than - 1 the Rate of Inflation Declining - 2 Outlook for Rental Rates - Apartments 06- Q1 06- Q4 07- Q3 08- Q2 09- Q1 09- Q4 10- Q3 11- Q2 12- Q1 12- Q4 13- Q3 14- Q2 Apartments- - Market Rent Apartments- For Condo Conversion INVESTMENT OUTLOOK With strong occupancy and rent expectations, the investment outlook remains positive for apartments. Despite rising interest rates that may impact cap rates, investors still like this market. In part, they are buffered from rising cap rates because occupancy and rent has grown faster than inflation over the past couple years. This sector continues to benefit from a tremendous amount of capital availability, however, rising interest rates will make core deals harder to underwrite. Another potential risk, although more long term, is the ultimate resolution of Fannie Mae and Freddie Mac. The GSAs provide a lot of the liquidity in the apartment market and winding them down will have a negative impact on the market. Good Time To Buy Mixed Time To Buy Bad Time To Buy Outlook for Investment: Apartments Q1 06-Q4 07-Q3 08-Q2 09-Q1 09-Q4 10-Q3 11-Q2 12-Q1 12-Q4 13-Q3 14-Q2 Apartments-Market Rent Apartments-For Condo Conversion Another factor in the investment outlook is the availability of core deals. Fewer opportunities exist in this market which is driving capital to secondary markets. This movement is keeping cap rates stable as fewer of the very low cap rate deals get completed. 10
11 CAP RATES Cap rates remained stable at 6.25% this quarter for market rent apartments. Despite the outlook for higher interest rates, rental growth continues at rates above inflation. Large amounts of capital continue to look for deals in this sector. However, with fewer core deals available capital has started pursuing secondary market deals or new development. These factors work to maintain cap rates at current levels. Increasing interest rates and the additional supply coming to the market may work together to slightly increase caps rates over the next year. REQUIRED YIELDS Required yields remained stable at 9% this quarter. Despite the prospect of higher interest rates, apartment fundamentals provide assurance to investors that they are appropriately pricing risk in their yield requirements. Demographics, population growth and preferences will continue to drive investment in this sector and that competition for deals should insure that yields remain low in the coming quarters. 16.0% 14.0% 12.0% 10.0% 8.0% 6.0% 4.0% 2.0% 0.0% 06- Q1 06- Q4 Current - Apartments 07- Q3 08- Q2 09- Q1 09- Q4 10- Q3 11- Q2 12- Q1 Apartments - Market Rent 12- Q4 Apartments - Condo Conversion 13- Q3 14- Q2 Increase No Change Decrease Expected Change in - Apartments Q1 06- Q4 07- Q3 08- Q2 09- Q1 09- Q4 10- Q3 11- Q2 12- Q1 12- Q4 13- Q3 14- Q2 Apartments - Market Rent Apartments - Condo conversion 26.0% 24.0% 22.0% 20.0% 18.0% 16.0% 14.0% 12.0% 10.0% 8.0% 6.0% 4.0% 2.0% 0.0% Required - Apartments 06- Q1 06- Q4 07- Q3 08- Q2 09- Q1 09- Q4 10- Q3 11- Q2 12- Q1 12- Q4 Apartments - Market Rent Apartments - Condo Conversion 13- Q3 14- Q2 Increase No Change Decrease Expected Change in Required - Apartments Q1 06- Q4 07- Q3 08- Q2 09- Q1 09- Q4 10- Q3 11- Q2 12- Q1 12- Q4 13- Q3 14- Q2 Apartments - Market Rent Apartments - Condo conversion 11
12 Section 4: Industrial EXPECTED OCCUPANCY The outlook for occupancy in the industrial sector declined this quarter but remains strong with most respondents believing that occupancy will increase. Continued improvement in the economy is generating more construction employment and small business starts which traditionally use flex space. Additionally, the continued strong trade with Latin America is having a positive impact on warehouse space. Retailers continue to reinvent their business models in a race to provide next day or same day delivery. This is changing the face of industrial real estate as warehouse space is becoming a necessity to get closer to the end consumer. Amazon s two distribution facilities in the Tampa/Lakeland markets are just the start of what will be a continuous expansion of warehouse space. EXPECTED RENTAL RATES Industrial rents are expected to rise with inflation over the next year. Continued improvement in occupancy will put upward pressure on rents. New development is coming, especially in the single tenant space, which will also push rental rates higher. Continued growth in construction employment is expected across Florida which will continue to push occupancy and therefore rents in the near term. Locations with multimodal connections will continue to command the highest rents and rent growth along with technology parks. Increase No Change Decrease Rising Faster Than Inflation Rising at the Rate of Inflation Rising Slower than the Rate of Inflation Declining Good Time 2 To Buy Mixed Time 0 To Buy -0.5 Bad Time To Buy Outlook for : Industrial Q1 06- Q1 06- Q4 07- Q3 08- Q2 09- Q1 09- Q4 10- Q3 11- Q2 12- Q1 12- Q4 13- Q3 14- Q and Distribu<on: Class A Flex Space, R & D, Office- : Class A 06- Q1 06- Q4 07- Q3 08- Q2 09- Q1 09- Q4 10- Q3 11- Q2 12- Q1 12- Q4 13- Q3 14- Q2 Outlook for Investment: Industrial 06-Q4 Outlook for Rental Rates - Industrial and Distribu<on: Class A Flex Space, R & D, Office- : Class A 07-Q3 08-Q2 09-Q1 09-Q4 10-Q3 11-Q2 12-Q1 12-Q4 13-Q3 14-Q2 and Distribution: Class A Flex Space, R & D, Office- 12
13 INVESTMENT OUTLOOK The outlook for investment in industrial real estate rebounded this quarter with expectations reaching survey highs. The continued transformation of the retail supply trade and improved exports are influencing investor expectations for and distribution space. The completion of the Panama Canal expansion and the increase in imports will also require more distribution space, particularly at multimodal locations. CAP RATES Cap rates have increased slightly for both sectors with flex space at 8.5% and warehouse at 7.5%. Respondents expect that rates will remain stable in this sector. Continued fundamental growth appears to offset any uncertainty with interest rate increases this year. YIELDS Required yields for warehouse space increased to 9.7% while yields for flex space increased to 10.3%. Respondents expect yields to remain stable over the next year as improving fundaments offsets potential interest rate increases. 12.0% 10.0% 8.0% 6.0% 4.0% 2.0% 0.0% Increase Current - Industrial 06- Q1 No Change 06- Q Q3 06- Q1 08- Q2 06- Q4 09- Q1 09- Q4 10- Q3 11- Q2 12- Q1 12- Q4 and Distribu=on Flex, R&D, Office- 07- Q3 08- Q2 09- Q1 09- Q4 10- Q3 11- Q2 12- Q1 13- Q3 12- Q4 13- Q3 14- Q2 Expected Change in - Industrial 14- Q2 Decrease - 1 and Distribu=on Flex, R&D, Office- warehouse 16.0% 14.0% 12.0% 10.0% 8.0% 6.0% 4.0% 2.0% 0.0% Required - Industrial 06- Q1 06- Q4 07- Q3 08- Q2 09- Q1 09- Q4 10- Q3 11- Q2 12- Q1 12- Q4 13- Q3 14- Q2 and Distribu=on: Class A Flex Space, R & D, Office- : Class A Increase No Change Decrease Expected Change in Required - Industrial Q1 06- Q4 07- Q3 08- Q2 09- Q1 09- Q4 10- Q3 11- Q2 12- Q1 12- Q4 13- Q3 14- Q2 and Distribu=on Flex, R&D, Office- warehouse 13
14 Section 5: Office EXPECTED OCCUPANCY The outlook for occupancy in Class A office dropped significantly this quarter. While the outlook remains strong, fewer respondents believe that occupancy will increase over the coming year. The outlook for Class B increased slightly with almost 60% of respondents believing occupancy will grow in this sector. The continued recovery of jobs in Florida, particularly office space jobs is influencing respondents outlook. This segment is also benefitting from little new development which is allowing current buildings time to improve occupancies with a slowly improving economy. Despite the improvement in office jobs, companies continue to be very cautious about the amount of space they need per worker. As these companies bring in new staff, they do so in existing office space. This trend will continue to regulate new development and continue to have a positive impact on occupancy. However, the continued reduction in office space per worker puts tremendous demands on current space that was not designed for the number of people using the space. Demands on plumbing, heating and air systems and parking will provide challenges to landlords and may drive new development that can plan for these trends. Given these competing trends, we should expect that occupancy will continue to improve in the short term but level off as development starts. Rising Faster Than Inflation Rising at the Rate of Inflation Rising Slower than the Rate of Inflation Declining Outlook for Rental Rates - Office Q1 06- Q4 07- Q3 08- Q2 09- Q1 09- Q4 10- Q3 11- Q2 12- Q1 12- Q4 13- Q3 14- Q2 Class A Office Class B Office Increase No Change Decrease Outlook for : Office Q1 06- Q4 07- Q3 08- Q2 09- Q1 09- Q4 10- Q3 11- Q2 12- Q1 12- Q4 13- Q3 14- Q2 Class A Office Class B Office EXPECTED RENTAL RATES The outlook for rental rates increased for Class A space as more respondents believe that rents will increase slightly more than inflation. Class B space remains stable with stable rents over the next year. An improving job market and little new development in the office sector is helping occupancy grow and allowing owners to raise rates and reduce concessions. Well located office properties in urban environments are benefiting from the shift of young employees to the urban core. In the face of increasing demand from job growth and more companies moving to Florida, development of new office space should be needed over the next year. However current rents in most markets don t justify the new development. In the short term this will positively impact existing buildings with better rental rates. 14
15 INVESTMENT OUTLOOK The outlook for investment remains strong for both office sectors. Limited development, improvement in office employment and growing rents are attracting investors to the office sector. Issues will remain with increasing stress on office infrastructure as companies continue to put more people in the same space. Newer buildings that can adapt to the new space per employee ratios and provide operating cost savings will benefit over other buildings. CAP RATES Cap rates increased slightly this quarter with Class A cap rates at 7.5% and Class B cap rates at 8.1%. Respondents expect the rates to remain stable over the next year. Improving fundamentals should offset any interest rate increase. Additionally, as this sector continues to improve additional debt capital will enter the market and improve liquidity which will help maintain current cap rates. 12.0% Current - Office YIELDS Required yields increased slightly this quarter with Class A yields at 8.6% while Class B yields increased to 10.1%. Like cap rates, respondents believe that yields will continue to be stable at the current levels over the next year. Improving fundamentals will offset any interest rate increases over that period. Continued growth in office employment and limited development of new office space will limit any increases in the risk adjusted returns for this sector. Good Time To Buy Mixed Time To Buy Bad Time To Buy Outlook for Investment: Office 06-Q1 06-Q4 07-Q3 08-Q2 09-Q1 09-Q4 10-Q3 11-Q2 12-Q1 12-Q4 13-Q3 Class A Office Class B Office 14-Q2 10.0% 8.0% 6.0% 4.0% 2.0% 0.0% 06- Q1 06- Q4 07- Q3 08- Q2 09- Q1 09- Q4 10- Q3 11- Q2 12- Q1 12- Q4 13- Q3 14- Q2 Increase No Change Expected Change in - Office Class A Office Class B Office Decrease Q1 06- Q4 07- Q3 08- Q2 09- Q1 09- Q4 10- Q3 11- Q2 12- Q1 12- Q4 13- Q3 14- Q2-1 Class A Office Class B Office 15
16 16.0% 14.0% Required - Office Increase Expected Change in Required - Office % 10.0% % 6.0% 4.0% 2.0% 0.0% 06- Q1 06- Q4 07- Q3 08- Q2 09- Q1 Class A Office 09- Q4 10- Q3 11- Q2 12- Q1 12- Q4 13- Q3 Class B Office 14- Q2 No Change Decrease Q1 06- Q4 07- Q3 08- Q2 09- Q1 09- Q4 Class A Office 10- Q3 11- Q2 12- Q1 12- Q4 13- Q3 14- Q2 Class B Office Section 6: Retail EXPECTED OCCUPANCY The outlook for occupancy remains strong for retail occupancy across all sectors this quarter. Despite slight declines in free standing retail and strip centers, respondents expect increasing occupancy over the next year. This optimism is being driven by the improving economy, consumer confidence, and growth within Florida. Retailers continue to look for quality locations throughout Florida and have increased their store openings for the coming year. The University of Florida Bureau of Business and Economic Research s consumer sentiment index was 96.8 in June, the highest level in over ten years. Additionally, the state continues to set records with the number of visitors coming to Florida which is also helping to boost retail sales. These factors should continue to drive occupancy in retail going forward. Increase No Change Decrease Outlook for : 1 Retail Q1 06- Q4 07- Q3 08- Q2 09- Q1 09- Q4 10- Q3 11- Q2 12- Q1 12- Q4 13- Q3 14- Q2 Large Centers Neighborhood Centers Strip Centers Free Standing 16
17 EXPECTED RENTAL RATES The outlook for rental rates remained positive this quarter with most respondents believing that rental rates will rise with inflation. A larger number of respondents this quarter think that large centers will drive rents higher than inflation. Given the strong outlook for occupancy, we would expect that rental rates will grow in the absence of new supply and reduction in available space. Continued growth in job production and an improving economy should maintain consumers confidence which will encourage continued spending. Retailer expansion and competition for the best locations will continue to have a positive effect on rental rates. INVESTMENT OUTLOOK The outlook for investment in retail remains positive across all sectors. Improving fundamentals continue to drive investment outlook. Florida s economy and job growth are having a positive impact on consumers which will benefit retailers. As long as Washington does nothing to negatively impact consumers, this trend will continue. Online retailing continues to exert pressure on retailers particularly in the electronics Rising Faster Than Inflation Rising at the Rate of Inflation Rising Slower than the Rate of Inflation Declining Outlook for Rental Rates - Retail 06- Q1 06- Q4 07- Q3 08- Q2 09- Q1 09- Q4 10- Q3 11- Q2 12- Q1 12- Q4 13- Q3 14- Q2 Large Centers Neighborhood Centers Strip Centers Free Standing and book sectors, however, retails have adapted to the online space with multichannel platforms of their own. They ve also done a great job of integrating the online and in-store shopping experience. Grocery anchored centers continue to be the favored investment option for investors, who prefer best in class grocers in primary locations. Outlook for Investment: Retail Good Time To Buy Mixed Time To Buy Q1 06- Q4 07- Q3 08- Q2 09- Q1 09- Q4 10- Q3 11- Q2 12- Q1 12- Q4 13- Q3 14- Q2-1 Bad Time To Buy Large Centers Neighborhood Centers Strip Centers Free Standing 17
18 CAP RATES Cap rates continue a slow decline in the retail sector with rates for large centers, neighborhood centers, strip centers and free standing retail at 6.8%, 6.8%, 8.1% and 6.5% respectively. Respondents currently believe that cap rates will remain stable over the coming year as continued improvement in fundamentals will offset any increase in interest rates. YIELDS remained relatively stable this quarter. for Large Centers, Neighborhood Centers, Strip Centers and Free Standing retail reached 8.7%, 8.8%, 9.7% and 7.7%. reflected improved fundamentals this quarter along with increased competition for investment capital. Respondents believe that yields will remain steady as improving fundamentals will offset any increase in interest rates over the next year. 12.0% 10.0% 8.0% 6.0% 4.0% 2.0% 0.0% Current - Retail 06- Q1 06- Q4 07- Q3 08- Q2 09- Q1 09- Q4 10- Q3 11- Q2 12- Q1 12- Q4 13- Q3 14- Q2 Larger Centers Neighborhood Centers Strip Centers Free Standing Increase No Change Decrease Expected Change in - Retail Q1 06- Q4 07- Q3 08- Q2 09- Q1 09- Q4 10- Q3 11- Q2 12- Q1 12- Q4 13- Q3 14- Q2 Larger Centers Neighborhood Centers Strip Centers Free Standing 16.0% 14.0% 12.0% 10.0% 8.0% 6.0% 4.0% 2.0% 0.0% Required - Retail 06- Q1 06- Q4 07- Q3 08- Q2 09- Q1 09- Q4 10- Q3 11- Q2 12- Q1 12- Q4 13- Q3 14- Q2 Large Centers Neighborhood Centers Strip Centers Free Standing Increase No Change Decrease Expected Change in Required - Retail Q1 06- Q4 07- Q3 08- Q2 09- Q1 09- Q4 10- Q3 11- Q2 12- Q1 12- Q4 13- Q3 14- Q2 Larger Centers Neighborhood Centers Strip Centers Free Standing 18
19 Section 7: Outlook for Investment in Undeveloped Land LAND WITHOUT ENTITLEMENTS OR WITH RESIDENTIAL ENTITLEMENTS The outlook for investment in land continues to be positive in both sectors with both reaching survey highs. The improving housing sector is driving land pricing higher as they continue to buy entitled property to help maintain the current growth levels. This is driving investment in non-entitled land as investors look to entitle the land and capture the home builders attention. Additionally, land for apartment investment is in high demand and driving pricing significantly higher. Investors will continue to keep an eye on interest rates as that could have a negative impact on the housing market. Good Time To Buy Mixed Time To Buy Bad Time To Buy Q1 Outlook for Investment in Land: Hospitality, Industrial, Urban Renewal 06- Q4 07- Q3 08- Q2 09- Q1 09- Q4 10- Q3 11- Q2 12- Q1 12- Q4 Land With Hospitality En>tlements With /R & D En>tlements For Urban Renewal 13- Q3 14- Q2 Good Time To Buy Mixed Time To Buy Bad Time To Buy Q1 Outlook for Investment in Land: No Entitlements, Residential, Commercial 06-Q4 07-Q3 08-Q2 09-Q1 09-Q4 10-Q3 11-Q2 12-Q1 12-Q4 Land Without Entitlements With Residential Entitlements With Office/Retail Entitlements LAND WITH OFFICE OR RETAIL ENTITLEMENTS The outlook for investment in land with office or retail entitlements increased this quarter reaching a new survey high. Respondents believe that office and retail fundamentals are improving to the point that new development is warranted. The retail sector is still the favored of the two sectors and new retail entitled land will be purchased for investment and development. However, with an improving office market and office job growth, investors will start buying land for future office development. LAND WITH HOSPITALITY ENTITLEMENTS The investment outlook for land with hospitality entitlements declined slightly this quarter but remains positive. Tourism in Florida continues to set records and is driving resurgence in the hotel sector. This trend is having the most impact in Orlando and Miami which will see the bulk of the new hotel development. This trend should continue with a higher percentage of visitors from foreign markets. 13-Q3 14-Q2 19
20 LAND WITH ENTITLEMENTS FOR WAREHOUSE OR R&D The investment outlook for land with warehouse or R&D entitlements declined slightly this quarter but remains positive. Investment in warehouse projects is picking up in port areas, particularly Miami, where exports to South America are up and require additional warehouse space. Ports throughout Florida continue to focus on expansion in preparation for the expansion of the Panama Canal. Retail companies continue to refine their business models to compete with online shopping which is driving additional demand for warehouse space closer to the consumer. This trend will have a positive impact on areas connected with major roads and multi-modal sites. LAND FOR URBAN RENEWAL The outlook for investment in urban renewal improved this quarter. As more people move toward urban areas investment in land for urban renewal will continue to increase. This trend is not limited to the major markets as secondary and even tertiary markets like Gainesville are focused on urban design and development. The real question is how long the trend will continue as Generation Y ages and starts having kids. Will urban areas continue to see a renaissance or will Gen. Y move to the burbs with better schools and more room for the kids to play? Section 8: Business and Capital Availability Outlook CAPITAL AVAILABILITY The outlook for capital availability increased slightly this quarter for both acquisition and development capital. Respondents continue to believe that capital will increase over the coming year. An increase in interest rates will not impact the capital flowing to real estate unless the risk adjusted returns decline in relation to other asset classes. Additionally, in an inflationary economy, more investors will look for hard assets to invest in, which will keep real estate in a favorable position. Debt capital is continuing to increase for all asset classes as more banks get back into the lending business. Improving asset prices are improving bank balance sheets and allowing them to loan more. This should continue, albeit with higher rates as interest rates rise. Capital Availability Increase No Change 0 Decrease Q1 06- Q4 07- Q3 08- Q2 09- Q1 09- Q4 10- Q3 11- Q2 12- Q1 12- Q4 Capital for Development Capital for AcquisiBons 13- Q3 14- Q2 20
21 UF COMMERCIAL REAL ESTATE SENTIMENT INDEX The UF Commercial Real Estate Sentiment Index increased this quarter to its highest level since the 3rd quarter of Florida s improved economy along with improved job growth and record tourism are having a positive impact on our respondents outlook. The increase in the index was driven by growing optimism from developers, owners and brokers. Improved fundamentals are generating the need for new development across several sectors, which is boosting the outlook for developers and other service providers who generally focus on the development side of the business UF Commercial Real Estate Sen3ment Index The least optimistic of the respondents are the appraisers, who continue to face tremendous pressure from the Dodd-Frank legislation which is pushing fees and quality lower. Our respondents believe there could be a growing crisis in the appraisal industry as the industry grows older with fewer young professionals entering the business Q4 07- Q3 08- Q2 09- Q1 09- Q4 10- Q3 11- Q2 12- Q1 12- Q4 13- Q3 14- Q2 Owner/investor/manager Broker Appraiser UF Commercial Real Estate Sen3ment Index (by profession) Lender Developer Other service provider, (consultant, legal other) 21
22 Section 9: Dominant Investors Respondents were asked to indicate which of five investor groups they perceived to be the most active for each type of property they analyze. Private owners have returned as the dominant buyer across most property types. However, real estate companies and REITS remain strong buyers. Free- standing- net leased Hospitality - Economy Hospitality - Business Strip Retail Neighborhood Centers Large Retail Office - Class B Office - Class A Flex Space, R&D and Dist. Condo Conversions Apartments - Mkt Rent Apartments - Low Inc. Condominiums SF Development Investors Q1-15 0% 10% 20% 30% 40% 50% 60% 70% 80% 90% Private RE Co.s REITs InsYtuYon Foreign Section 10: Characteristics of Survey Respondents PROFESSION OF RESPONDENTS Survey responses increased this quarter to 97 respondents. Approximately 57 % of the respondents reported being an appraiser; 78% with designations of MAI, SREA or SRPA. The next largest groups were other service providers and brokers. 15- Q Q Q Q Owner/ Investor Lender Broker Developer Appraiser: MAI, SREA, SRPA Appraiser: Other DesignaKon Other Appraiser/ Consultant Other Service Provider 22
23 MARKETS OF FAMILIARITY Each respondent was asked to select up to four regional markets with which they are familiar. In the latest survey, these choices accumulated to 137 observations. The highest number of responses was for the Tampa-St. Pete and Orlando markets, which had 19 observations. The lowest respondent support came from the Treasure Coast with Q Q Q Q Dade Broward Palm Beach Treasure Coast Southwest coast Daytona Beach Orlando Lakeland - Winter Haven Tampa - St Petersburg Sarasota - Bradenton Jacksonville Gainesville - Ocala Pensacola - Tallahassee PROPERTY TYPES OF FAMILIARITY Each respondent was asked to select up to three property types with which they were familiar. Altogether, 206 selections were made in the latest survey round. Single family development was selected by 20 respondents while condominium development was selected by 9. The largest response for commercial property was in Class B Office with 36 responses. The lowest response was for Low Income Apartments with Q1 14- Q3 14- Q2 14- Q Single Family Development Condominium Development Apartments - Low Income Apartments - Market Rent Condo Conversion & Dist. Flex Space, R & D Office: Class A Office: Class B Retail - Large Neighborhood Centers Strip Centers Hospitality- Business Hospitality - Economy Free Standing 23
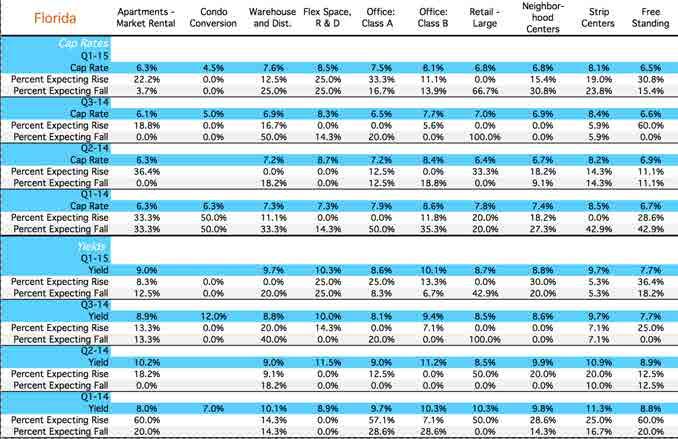
24 Section 11: Details of, and Expected Changes Table 1 summarizes estimates of cap rates and yields for twelve property types over the last four quarters of the survey. In addition, this table shows the distribution of expectations for changes in each reported cap rate and yield. In particular, the table reports the percent of respondents expecting each cap rate and yield to either rise or fall in the future. Excluded from this table is the percentage of respondents whom are expecting no change. This third percentage can be computed as 100 less the two percentages reported. Since prior sections discuss the content of Table 1, further comment is not given here. The table is simply provided as a reference to facilitate application of the survey results. 24
25 25
26 Section 12: Local Markets Starting with the 3rd quarter of 2011, we have changed the presentation of the local market data to a more graphical format. This makes it easier, at a glance, to get a sense of what is happening in each market. As part of the transition you will notice that each report is broken up into property types. Additionally, you will see a table with indicating the direction of our respondents expectations for the various indicators. Please use the following legend to interpret the results. For future expectations you will see the following symbols. Please refer to their definition for interpretation: increasing trend. An upward but diagonal pointing arrow indicates a slightly positive or increasing trend. A side pointing arrow indicates a neutral trend. A downward but diagonal pointing arrow indicates a slightly negative or slightly declining trend. A downward pointing arrow indicates a decreasing or negative trend. 26
27 Regional Market Report for Dade MULTI-FAMILY PROPERTIES Apartments Market Condo Conversions Apartments Market Condo Conversions Apartments Condo Conversion Apartments Institutions 25% Foreign Buyers 8% REITs 17% Private Buyers 25% R.E. Companies 25% Condo Conversion Private Buyers, 27
28 INDUSTRIAL PROPERTIES Flex Space Flex Space Flex Space Flex Space Institutions 33% Private Buyers 67% 28
29 OFFICE PROPERTIES Office:Class A Office:Class B Office:Class A Office:Class B Office: Class A Office: Class B Office: Class A Office: Class B R.E. Companies Private Buyers, 29
30 RETAIL PROPERTIES Retail Large REITs 33% R.E. Companies 33% Private Buyers 34% Retail Large Neighborhood Retail Strip Centers Free Standing Retail Large Neighborhood Retail Strip Centers Free Standing Neighborhood Center Strip Centers Free Standing Institutions, 50% Private Buyers, REITs, 25% Foreign Buyers Private Buyers 50% Private Buyers Retail Large Neighborhood Centers Strip Centers Free Standing 30
31 Regional Market Report for Broward MULTI-FAMILY PROPERTIES Apartments Market Condo Conversions Apartments Market Condo Conversions Apartments Condo Conversion Apartments Institutions 38% Private Buyers 12% R.E. Companies 25% Condo Conversion REITs 25% Private Buyers, 31
32 INDUSTRIAL PROPERTIES Flex Space Flex Space Flex Space Flex Space Private Buyers 32
33 OFFICE PROPERTIES Office:Class A Office:Class B Office:Class A Office:Class B Office: Class A Office: Class B Office: Class A Office: Class B R.E. Companies Private Buyers, 33
34 RETAIL PROPERTIES Retail Large REITs 50% Private Buyers 50% Retail Large Neighborhood Retail Strip Centers Free Standing Retail Large Neighborhood Retail Strip Centers Free Standing Neighborhood Center Strip Centers Free Standing Institutions, 33% REITs, 33% Private Buyers, Foreign Buyers Private Buyers 67% Private Buyers Retail Large Neighborhood Centers Strip Centers Free Standing 34
35 Regional Market Report for Palm Beach MULTI-FAMILY PROPERTIES Apartments Market Condo Conversions Apartments Market Condo Conversions Apartments Condo Conversion Apartments Institutions 40% Private Buyers 20% R.E. Companies 40% Condo Conversion R.E. Companies, 50% Private Buyers, 50% 35
36 INDUSTRIAL PROPERTIES Flex Space Flex Space Flex Space Flex Space Private Buyers R.E. Companies, 36
37 OFFICE PROPERTIES Office:Class A Office:Class B Office:Class A Office:Class B Office: Class A Office: Class B Office: Class A Office: Class B R.E. Companies Private Buyers, 37
38 RETAIL PROPERTIES Retail Large Private Buyers Retail Large Neighborhood Retail Strip Centers Free Standing Retail Large 7.96 Neighborhood Retail Strip Centers Free Standing Neighborhood Center Strip Centers Free Standing Private Buyers, Private Buyers Private Buyers Retail Large Neighborhood Centers Strip Centers Free Standing 38
39 Regional Market Report for Treasure Coast MULTI-FAMILY PROPERTIES Apartments Market Condo Conversions Apartments Market Condo Conversions Apartments Condo Conversion Apartments Condo Conversion 39
40 INDUSTRIAL PROPERTIES Flex Space Flex Space Flex Space Flex Space Private Buyers R.E. Companies, 40
41 OFFICE PROPERTIES Office:Class A Office:Class B Office:Class A Office:Class B Office: Class A Office: Class B Office: Class A Office: Class B Private Buyers, 41
42 RETAIL PROPERTIES Retail Large Retail Large Neighborhood Retail Strip Centers Free Standing Retail Large Neighborhood Retail Strip Centers Free Standing Neighborhood Center Strip Centers Free Standing Private Buyers Private Buyers Retail Large Neighborhood Centers Strip Centers Free Standing 42
Survey of Emerging Market Conditions
 Survey of Emerging Market Conditions Quarter 2 2014 Published September 2014 Warrington College of Business Administration Lead Researcher Dr. Wayne R. Archer, Executive Director University of Florida
Survey of Emerging Market Conditions
 Bergstrom Center for Real Estate Studies Warrington College of Business Administration University of Florida Survey of Emerging Market Conditions Quarter 2 2013 Published August 2013 Lead Researcher Dr.
Survey of Emerging Market Conditions
 Bergstrom Center for Real Estate Studies Warrington College of Business Administration University of Florida Survey of Emerging Market Conditions Quarter 1 2012 Published May 4, 2012 Lead Researcher Dr.
Survey of Emerging Market Conditions
 Survey of Emerging Market Conditions Quarter 2 27 Published June 27 Lead Researcher and Analyst Dr. Wayne R. Archer, Director University of Florida Bergstrom Center for Real Estate Studies Professor of
Survey of Emerging Market Conditions
 Survey of Emerging Market Conditions Quarter 1 2008 Preview Edition Published March 18, 2008 Lead Researcher and Analyst Dr. Wayne R. Archer, Executive Director University of Florida Bergstrom Center for
ECONOMIC CURRENTS. Vol. 4, Issue 3. THE Introduction SOUTH FLORIDA ECONOMIC QUARTERLY
 ECONOMIC CURRENTS THE Introduction SOUTH FLORIDA ECONOMIC QUARTERLY Vol. 4, Issue 3 Economic Currents provides an overview of the South Florida regional economy. The report presents current employment,
ECONOMIC CURRENTS. Vol. 5 Issue 2 SOUTH FLORIDA ECONOMIC QUARTERLY. Key Findings, 2 nd Quarter, 2015
 ECONOMIC CURRENTS THE Introduction SOUTH FLORIDA ECONOMIC QUARTERLY Economic Currents provides an overview of the South Florida regional economy. The report presents current employment, economic and real
Survey of Emerging Market Conditions
 Survey of Emerging Market Conditions Quarter 27 Published March 27 Lead Researcher and Analyst Dr. Wayne R. Archer, Director University of Florida Bergstrom Center for Real Estate Studies Professor of
Mueller. Real Estate Market Cycle Monitor Second Quarter 2018 Analysis
 Mueller Real Estate Market Cycle Monitor Second Quarter 2018 Analysis Real Estate Market Cycle analysis of 5 property types in 54 Metropolitan Statistical Areas (MSAs). Graphic Clarification! Point 11
INLAND EMPIRE REGIONAL INTELLIGENCE REPORT. School of Business. April 2018
 INLAND EMPIRE REGIONAL INTELLIGENCE REPORT April 2018 Key economic indicators suggest that the Inland Empire s economy will continue to expand throughout the rest of 2018, building upon its recent growth.
THE REAL ESTATE BOARD OF NEW YORK REAL ESTATE BROKER CONFIDENCE INDEX THIRD QUARTER 2016
 THE REAL ESTATE BOARD OF NEW YORK REAL ESTATE BROKER CONFIDENCE INDEX THIRD QUARTER 2016 EXECUTIVE SUMMARY REAL ESTATE BROKER CONFIDENCE INDEX THIRD QUARTER 2016 The Real Estate Board of New York s (REBNY)
ECONOMIC CURRENTS. Vol. 3, Issue 1. THE SOUTH FLORIDA ECONOMIC QUARTERLY Introduction
 ECONOMIC CURRENTS THE SOUTH FLORIDA ECONOMIC QUARTERLY Introduction Economic Currents provides an overview of the South Florida regional economy. The report contains current employment, economic and real
ECONOMIC CURRENTS. Vol. 3, Issue 3 SOUTH FLORIDA ECONOMIC QUARTERLY. Introduction
 ECONOMIC CURRENTS THE Introduction SOUTH FLORIDA ECONOMIC QUARTERLY Economic Currents provides an overview of the South Florida regional economy. The report presents current employment, economic and real
NATIONAL ASSOCIATION of REALTORS RESEARCH DIVISION. Prepared for Florida REALTORS
 NATIONAL ASSOCIATION of REALTORS RESEARCH DIVISION Prepared for Florida REALTORS NATIONAL ASSOCIATION OF REALTORS RESEARCH DIVISION Page 1 Page 3 Page 4 Page 6 Page 7 Page 8 Page 9 Page 10 Page 11 Page
Connecticut First Nine Months Housing Report 2014
 Connecticut First Nine Months Housing Report 2014 First Nine Months of 2014 Highlight Positive Outlook for Multi-family Home Construction Millennial buyers are finally increasing their rate of household
Cycle Monitor Real Estate Market Cycles Third Quarter 2017 Analysis
 Cycle Monitor Real Estate Market Cycles Third Quarter 2017 Analysis Real Estate Physical Market Cycle Analysis of Five Property Types in 54 Metropolitan Statistical Areas (MSAs). Income-producing real
MULTIFAMILY MARKET REPORT GREATER TORONTO AREA FALL 2017
 MULTIFAMILY MARKET REPORT GREATER TORONTO AREA FALL 2017 Table of Contents 1.0 Demand Indicators 2.0 Economic Snapshot 3.0 Multifamily Housing Market Summary 4.0 Rental Market Summary 5.0 Secondary Rental
Housing Price Forecasts. Illinois and Chicago PMSA, May 2018
 Housing Price Forecasts Illinois and Chicago PMSA, May 2018 Presented To Illinois Realtors From R E A L Regional Economics Applications Laboratory, Institute of Government and Public Affairs University
INLAND EMPIRE REGIONAL INTELLIGENCE REPORT
 INLAND EMPIRE REGIONAL INTELLIGENCE REPORT June 2016 EMPLOYMENT After a slow start to 2016, the Inland Empire s labor market returned to form, in recent job figures. Seasonally adjusted nonfarm employment
Nothing Draws a Crowd Like a Crowd: The Outlook for Home Sales
 APRIL 2018 Nothing Draws a Crowd Like a Crowd: The Outlook for Home Sales The U.S. economy posted strong growth with fourth quarter 2017 Real Gross Domestic Product (real GDP) growth revised upwards to
Housing Price Forecasts. Illinois and Chicago PMSA, April 2018
 Housing Price Forecasts Illinois and Chicago PMSA, April 2018 Presented To Illinois Realtors From R E A L Regional Economics Applications Laboratory, Institute of Government and Public Affairs University
HOUSING MARKET OUTLOOK
 HOUSING MARKET INFORMATION HOUSING MARKET OUTLOOK Ottawa 1 C A N A D A M O R T G A G E A N D H O U S I N G C O R P O R A T I O N Date Released: Fall 2017 Figure 1 10,000 8,000 6,000 4,000 2,000 0 Ottawa
Mueller. Real Estate Market Cycle Monitor Third Quarter 2018 Analysis
 Mueller Real Estate Market Cycle Monitor Third Quarter 2018 Analysis Real Estate Physical Market Cycle Analysis - 5 Property Types - 54 Metropolitan Statistical Areas (MSAs). It appears mid-term elections
April 2015, Volume 24 Issue 4. Q Round Up
 April 2015, Volume 24 Issue 4 Q1 2015 Round Up Wayne Williams President, ALN Apartment Data, Inc. Wayne@alndata.com Evan Takacs Account Executive 1.800.643.6416 x 220 Evan@alndata.com Laura Reese-Williams,
For the Reno MSA employment has historically been based largely on construction and the leisure and hospitality industry. The construction industry
 For the Reno MSA employment has historically been based largely on construction and the leisure and hospitality industry. The construction industry has lost almost 15,000 construction jobs since 2006,
ANALYSIS OF THE CENTRAL VIRGINIA AREA HOUSING MARKET 1st quarter 2013 By Lisa A. Sturtevant, PhD George Mason University Center for Regional Analysis
 ANALYSIS OF THE CENTRAL VIRGINIA AREA HOUSING MARKET 1st quarter By Lisa A. Sturtevant, PhD George Mason University Center for Regional Analysis Economic Overview Key economic factors in the first quarter
Housing Price Forecasts. Illinois and Chicago PMSA, October 2014
 Housing Price Forecasts Illinois and Chicago PMSA, October 2014 Presented To Illinois Association of Realtors From R E A L Regional Economics Applications Laboratory, Institute of Government and Public
THE REAL ESTATE BOARD OF NEW YORK
 THE REAL ESTATE BOARD OF NEW YORK REAL ESTATE BROKER CONFIDENCE INDEX FIRST QUARTER 2018 EXECUTIVE SUMMARY The Real Estate Board of New York s (REBNY) Real Estate Broker Index for the first quarter of
Brokers Forum Report
 Brokers Forum Report March 24, 2015 Forecast for April 2015 September 2015 The Center for Real Estate Theory and Practice 1 ASU Commercial Brokers Forum Survey Forecast for April 2015 September 2015 "Without
Soaring Demand Drives US Industrial Market to New Heights
 Soaring Demand Drives US Industrial Market to New Heights Capitas (DIFC) Limited I June Issue: 2017 THIS ISSUE COVERS: The Amazon Factor a seismic shift in the way people shop Industrial real estate hitting
SELF-STORAGE REPORT VIEWPOINT 2017 / COMMERCIAL REAL ESTATE TRENDS. By: Steven J. Johnson, MAI, Senior Managing Director, IRR-Metro LA. irr.
 SELF-STORAGE REPORT VIEWPOINT 2017 / COMMERCIAL REAL ESTATE TRENDS By: Steven J. Johnson, MAI, Senior Managing Director, IRR-Metro LA The Self Storage Story The self-storage sector has been enjoying solid
Housing Price Forecasts. Illinois and Chicago PMSA, January 2019
 Housing Price Forecasts Illinois and Chicago PMSA, January 2019 Presented To Illinois Realtors From R E A L Regional Economics Applications Laboratory, Institute of Government and Public Affairs University
Summary. Houston. Dallas. The Take Away
 Page Summary The Take Away The first quarter of 2017 was marked by continued optimism through multiple Texas metros as job growth remained positive and any negatives associated with declining oil prices
Monthly Market Snapshot
 SEPTEMBER 2018 Vacancy continues to fall. Nearing the end of the third quarter, the vacancy rate dropped 10 basis points to 6.4%, compared to this time last month at 6.5%. Occupancy of the 1.1 million
The Coldwell Banker Carlson Real Estate Market Report
 The Coldwell Banker Carlson Real Estate Market Report 2017 Year-End Stowe Area Report Our 2017 Year-End Market Report uses market-wide data, based on transactions that closed in 2017 in the Multiple Listing
FLORIDA CHICA Q LEADERS IN COMMERCIAL REAL ESTATE
 FLORIDA CHICA Q3 2012 Q3 AND Q4 2012 ECONOMIC AND COMMERCIAL REAL ESTATE TRENDS REPORT NATIONAL AND FLORIDA MARKET UPDATES LEADERS IN COMMERCIAL REAL ESTATE 2 NATIONAL ECONOMY Page 2 National*and*Florida*Economic*Update*
Housing Market Update
 Housing Market Update March 2017 New Hampshire s Housing Market and Challenges Market Overview Dean J. Christon Executive Director, New Hampshire Housing Finance Authority New Hampshire s current housing
Economic Highlights. Payroll Employment Growth by State 1. Durable Goods 2. The Conference Board Consumer Confidence Index 3
 August 26, 2009 Economic Highlights Southeastern Employment Payroll Employment Growth by State 1 Manufacturing Durable Goods 2 Consumer Spending The Conference Board Consumer Confidence Index 3 Real Estate
Americas Office Trends Report
 AMERICAS OFFICE TRENDS REPORT Americas Office Trends Report Summary The overall national office market recovery slowed slightly in the first quarter of 2016 amid financial market volatility. However, as
REAL ESTATE SENTIMENT INDEX 1 st Quarter 2016
 About Real Estate Sentiment Index (RESI) The Real Estate Sentiment Index (RESI) is jointly developed by the Real Estate Developers Association of Singapore (REDAS) and the Department of Real Estate (DRE),
Market Overview TAMPA BAY OFFICE THIRD QUARTER
 Market Overview TAMPA BAY OFFICE THIRD QUARTER 29 COLLIERS ARNOLD TAMPA BAY Insights on the Market OFFICE THIRD QUARTER 29 MARKET INDICATORS TAMPA BAY INVENTORY 8,58,612 Sq. Ft. Q3 Q4* OVERALL VACANCY
Housing Price Forecasts. Illinois and Chicago PMSA, March 2018
 Housing Price Forecasts Illinois and Chicago PMSA, March 2018 Presented To Illinois Realtors From R E A L Regional Economics Applications Laboratory, Institute of Government and Public Affairs University
September 2016 RESIDENTIAL MARKET REPORT
 September 2016 RESIDENTIAL MARKET REPORT The real estate investment market in Japan has had an abundance of capital (both domestic & foreign) over the past couple of years. This, along with the low (now
OBSERVATION. TD Economics IS THE AMERICAN HOUSING REBOUND SUSTAINABLE?
 OBSERVATION TD Economics IS THE AMERICAN HOUSING REBOUND SUSTAINABLE? Highlights 2012 was a very good year for the U.S. housing market. Home prices were up almost 8% and housing starts by close to 30%.
Florida REALTORS Commercial Real Estate Lending Study. Market Enhancement Group, Inc.
 Florida REALTORS Commercial Real Estate Lending Study June 2013 Survey Objectives To assess the commercial real estate lending market in Florida with a special emphasis on: The impact of credit availability
High-priced homes have a unique place in the
 Livin' Large Texas' Robust Luxury Home Market Joshua G. Roberson December 3, 218 Publication 2217 High-priced homes have a unique place in the overall housing market. Their buyer pool, home characteristics,
Cycle Monitor Real Estate Market Cycles Second Quarter 2018 Analysis
 Black Creek Research Cycle Monitor Real Estate Market Cycles Second Quarter 0 Analysis Real Estate Market Cycle analysis of five property types in Metropolitan Statistical Areas (MSAs). Important note:
Centre ATLANTA PROPERTY TOUR
 Parkway Acquisition Acquires of Courvoisier Centre ATLANTA PROPERTY TOUR April 204 April April 0, 2, 204 204 Disclaimer This presentation (the "Presentation") is provided for informational purposes and
Single-Family vs. Multi-Family? Dietrich Heidtmann, Managing Director
 U.S. Rented Residential Sector Single-Family vs. Multi-Family? Dietrich Heidtmann, Managing Director Demand: U.S. Household Formations Are Returning to Normalized Levels and the Entry of Millenials Continues
REAL ESTATE SENTIMENT INDEX 2 nd Quarter 2018
 About Real Estate Sentiment Index (RESI) The Real Estate Sentiment Index (RESI) is jointly developed by the Real Estate Developers Association of Singapore (REDAS) and the Department of Real Estate (DRE),
STATE OF THE MULTIFAMILY MARKET MACRO VIEW
 STATE OF THE MULTIFAMILY MARKET MACRO VIEW JEANETTE I. RICE, CRE AMERICAS HEAD OF MULTIFAMILY RESEARCH APRIL 19, 2018 Westchester/ Fairfield 2 JEANETTE I. RICE STATE OF U.S. MULTIFAMILY MARKET KEY INVESTMENT
Q2:11. Transwestern Outlook WASHINGTON, D.C.
 11 Office Property Owners Invest in Renovating Older Product to Class A; Vacancy Edges Up as Rents Edge Down; Investment Sales Strong and Net Absorption Notable The District of Columbia office market experienced
Multifamily Outlook 2018
 Multifamily Outlook 2018 Page 1 Canada Multifamily From strength to strength The Canadian commercial real estate sector continues its steady upward performance amid a silently moving economic engine. Owners,
Office Market Continues to Improve
 Research & Forecast Report LAS VEGAS OFFICE Q3 2016 Office Market Continues to Improve > > Southern Nevada s office market is improving at a steady rate > > Net absorption has been positive in twelve of
Linkages Between Chinese and Indian Economies and American Real Estate Markets
 Linkages Between Chinese and Indian Economies and American Real Estate Markets Like everything else, the real estate market is affected by global forces. ANTHONY DOWNS IN THE 2004 presidential campaign,
REAL ESTATE BROKER CONFIDENCE INDEX
 REAL ESTATE BROKER CONFIDENCE INDEX FIRST QUARTER 2013 Rob SpeyeR, ChaiRman Steven Spinola, president 570 Lexington Avenue / New York, NY 10022 / 212.532.3100 www.rebny.com EXECUTIVE SUMMARY REAL ESTATE
Reveals National Economy Hurting Local Commercial Markets
 Latest SIOR Index Reveals National Economy Hurting Local Commercial Markets Lawrence Yun is Senior Vice President and Chief Economist at the NATIONAL ASSOCIATION OF REALTORS. He writes regular columns
City of Lonsdale Section Table of Contents
 City of Lonsdale City of Lonsdale Section Table of Contents Page Introduction Demographic Data Overview Population Estimates and Trends Population Projections Population by Age Household Estimates and
Housing Price Forecasts. Illinois and Chicago PMSA, September 2016
 Housing Price Forecasts Illinois and Chicago PMSA, September 2016 Presented To Illinois Realtors From R E A L Regional Economics Applications Laboratory, Institute of Government and Public Affairs University
Housing Price Forecasts. Illinois and Chicago PMSA, January 2018
 Housing Price Forecasts Illinois and Chicago PMSA, January 2018 Presented To Illinois Realtors From R E A L Regional Economics Applications Laboratory, Institute of Government and Public Affairs University
Released: February 8, 2011
 Released: February 8, 2011 Commentary 2 The Numbers That Drive Real Estate 3 Recent Government Action 10 Topics for Home Buyers, Sellers, and Owners 13 Brought to you by: KW Research Commentary Gradual
Economy. Denmark Market Report Q Weak economic growth. Annual real GDP growth
 Denmark Market Report Q 1 Economy Weak economic growth In 13, the economic growth in Denmark ended with a modest growth of. % after a weak fourth quarter with a decrease in the activity. So Denmark is
The supply of single-family homes for sale remains
 Oh Give Me a (Single-Family Rental) Home Harold D. Hunt and Clare Losey December, 18 Publication 2218 The supply of single-family homes for sale remains tight in many markets across the United States.
Kitchener-Cambridge-Waterloo and Guelph CMAs
 H o u s i n g M a r k e t I n f o r m a t i o n Housing Now Kitchener-Cambridge-Waterloo and Guelph CMAs C a n a d a M o r t g a g e a n d H o u s i n g C o r p o r a t i o n Date Released: Kitchener-Cambridge-Waterloo
The Improvement of the Industrial Market
 Research & Forecast Report Long Island industrial MARKET Q2 2015 The Improvement of the Industrial Market Rose Liu Research & Financial Analyst Long Island Takeaways The overall economy on Long Island
HOUSING MARKET OUTLOOK St. John s CMA
 H o u s i n g M a r k e t I n f o r m a t i o n HOUSING MARKET OUTLOOK St. John s CMA C a n a d a M o r t g a g e a n d H o u s i n g C o r p o r a t i o n Date Released: Fall 2014 Highlights New home
Young-Adult Housing Demand Continues to Slide, But Young Homeowners Experience Vastly Improved Affordability
 Young-Adult Housing Demand Continues to Slide, But Young Homeowners Experience Vastly Improved Affordability September 3, 14 The bad news is that household formation and homeownership among young adults
Residential Commentary Sydney Apartment Market
 Residential Commentary Sydney Apartment Market April 2017 Executive Summary Sydney Apartment Market: Key Indicators 14,200 units are currently under construction in Inner Sydney with completion expected
Rents Spike, Brightening the Second-Half Outlook
 Research & Forecast Report GREATER PHOENIX MULTIFAMILY Q2 217 Rents Spike, Brightening the Second-Half Outlook Key Takeaways > > The Greater Phoenix multifamily market recorded an active first half of
IAAO Annual Conference
 IAAO Annual Conference Tampa, Florida August 28-31, 2016 1 Multi - Family Appraisal Terry Taylor, CAE, RES, CFE Commercial Real Estate Manager Saint Lucie County Taylort@paslc.org 772 460 3321 2 3 Apartment
Profile of International Home Buyers in Florida
 Profile of International Home Buyers in Florida Research Division National Association of REALTORS 2009 Prepared for the Florida Association of REALTORS 2009 National Association of REALTORS Profile of
Housing Price Forecasts. Illinois and Chicago PMSA, March 2017
 Housing Price Forecasts Illinois and Chicago PMSA, March 2017 Presented To Illinois Realtors From R E A L Regional Economics Applications Laboratory, Institute of Government and Public Affairs University
Lancaster Commercial & Industrial Market Overview. February 14, 2018
 Lancaster Commercial & Industrial Market Overview February 14, 2018 2017 Macro Economic Assumptions GDP (2017 Average for 4 Quarters) 2.6% 2017 Actual 2018 Forecast Total GDP 2.6% 2.75% to 3.5% Consumer
Las Vegas Valley Executive Summary
 ARROYO MARKET SQUARE Las Vegas Valley Executive Summary Retail Market 4th Quarter 2013 THE DISTRICT AT GREEN VALLEY RANCH January 23, 2014 Re: Commercial Real Estate Survey: 4th Quarter, 2013 Dear Reader,
RESURGENCE OF RENTAL DEMAND
 5 Rental Housing The rental market has gained strength over the past year, bringing good news to investors. Demand has picked up sharply, vacancy rates have started to retreat, and rents are turning up.
Housing Price Forecasts. Illinois and Chicago PMSA, August 2017
 Housing Price Forecasts Illinois and Chicago PMSA, August 2017 Presented To Illinois Realtors From R E A L Regional Economics Applications Laboratory, Institute of Government and Public Affairs University
The Impact of Market Rate Vacancy Increases Eleven-Year Report
 The Impact of Market Rate Vacancy Increases Eleven-Year Report January 1, 1999 - December 31, 2009 Santa Monica Rent Control Board April 2010 TABLE OF CONTENTS Summary 1 Vacancy Decontrol s Effects on
The Current Outlook for Student Housing NMHC 2014
 The Current Outlook for Student Housing NMHC 2014 Moderated by: Peter Katz Executive Director NMHC Student Housing 2014 Moderator: Peter Katz, Executive Director, Institutional Property Advisors Panel
Housing Price Forecasts. Illinois and Chicago PMSA, June 2012
 Housing Price Forecasts Illinois and Chicago PMSA, June 2012 Presented To Illinois Association of REALTORS From R E A L Regional Economics Applications Laboratory, Institute of Government and Public Affairs
Value Fluctuations in a Real Estate Investment Financed with Debt
 Working Draft of New Case Study 4A Value Fluctuations in a Real Estate Investment Financed with Debt (which will be added to AICPA Accounting and Valuation Guide Valuation of Portfolio Company Investments
INVESTOR PRESENTATION MAY 2013
 INVESTOR PRESENTATION MAY 2013 Forward-Looking Statements This presentation includes forward-looking statements. These statements are subject to a number of risks, uncertainties and other factors that
2016 Multifamily Outlook: Another Year of Opportunity
 2016 Multifamily Outlook: Another Year of Opportunity A BERKSHIRE RESEARCH VIEWPOINT February 2016 2016 Multifamily Outlook: A Year of Opportunity A BERKSHIRE RESEARCH VIEWPOINT February 2016 2 2016 MULTIFAMILY
Multifamily Research. Market Report Third Quarter South Florida. Rent Growth Holds Upward Momentum As New Supply Peaks in South Florida
 Multifamily Research Market Report Third Quarter 2017 South Florida Rent Growth Holds Upward Momentum As New Supply Peaks in South Florida High homeownership cost keeps rental demand elevated. Rising employment
Myth Busting: The Truth About Multifamily Renters
 Myth Busting: The Truth About Multifamily Renters Multifamily Economics and Market Research With more and more Millennials entering the workforce and forming households, as well as foreclosed homeowners
COMMERCIAL PROPERTY PRICES REMAIN IN SLOWDOWN PATTERN AS MARKET REACTS TO INVESTOR PULLBACK
 CCRSI RELEASE MARCH 2016 (With data through February 2016) COMMERCIAL PROPERTY PRICES REMAIN IN SLOWDOWN PATTERN AS MARKET REACTS TO INVESTOR PULLBACK DESPITE DECLINE IN PROPERTY PRICING, LEASING ACTIVITY
HOULIHAN LAWRENCE COMMERCIAL GROUP
 HOULIHAN LAWRENCE COMMERCIAL GROUP TH QUARTER EXECUTIVE SUMMARY FOURTH QUARTER Dear Clients, With behind us and the new year in full swing, we can now reflect, summarize and gain insight from the past
Has The Office Market Reached A Peak? Vacancy. Rental Rate. Net Absorption. Construction. *Projected $3.65 $3.50 $3.35 $3.20 $3.05 $2.90 $2.
 Research & Forecast Report OAKLAND METROPOLITAN AREA OFFICE Q1 Has The Office Market Reached A Peak? > > Vacancy remained low at 5. > > Net Absorption was positive 8,399 in the first quarter > > Gross
Housing Bulletin Monthly Report
 February 21 1 Housing Bulletin Monthly Report Housing Starts 25, 2, 15, 1, 5, Alberta Housing Starts up 5 per cent from 29 From February 29 to 21, preliminary housing starts increased 82.7 per cent across
Housing: Where The Action Is. Presented by: Mary Bujold Maxfield Research Inc.
 Housing: Where The Action Is Presented to: Sensible LandUseCoalition Presented by: Mary Bujold Maxfield Research Inc. February 26, 2014 Headlines 2013: Widespread Market Recovery Twin Cities Housing Market
Regional Update: Cautious Optimism Grows Even More Cautious
 Regional Update: Cautious Optimism Grows Even More Cautious In the previous issue of EconSouth, we wrote in the early spring months, Feedback from Atlanta Fed contacts in the Southeast remained generally
Multifamily Market Commentary February 2017
 Multifamily Market Commentary February 2017 Affordable Multifamily Outlook Incremental Improvement Expected in 2017 We expect momentum in the overall multifamily sector to slow in 2017 due to elevated
Annual Market Report for 2010 for Naples, Bonita, Estero market area
 Annual Market Review Closed Sales The number of closed sales in once again increased over prior year, making it the third consecutive year to show an increase. Properties priced under $25, continued to
17th Annual Real Estate Review & Forecast
 2017 17th Annual Real Estate Review & Forecast This Year s Sponsors Member FDIC Construction: Review & Forecast 2017 Page 2 Permits Issued 142 New Commercial Construction Permits issued for all Elkhart
Housing and Economy Market Trends
 Housing and Economy Market Trends Mainstreet Organization Prices of single-family, detached homes in suburban Chicago increased 12.1 percent in May 2014 compared with the same period a year ago. Overall,
REAL ESTATE SENTIMENT INDEX 3 rd Quarter 2014
 About Real Estate Sentiment Index (RESI) The Real Estate Sentiment Index (RESI) is jointly developed by the Real Estate Developers Association of Singapore (REDAS) and the Department of Real Estate (DRE),
Housing Price Forecasts. Illinois and Chicago PMSA, March 2019
 Housing Price Forecasts Illinois and Chicago PMSA, March 2019 Presented To Illinois Realtors From R E A L Regional Economics Applications Laboratory, Institute of Government and Public Affairs University
Multifamily Research. Market Report Third Quarter New York City. Surging Household Formation Pushes Vacancy to Multiyear Lows
 Multifamily Research Market Report Third Quarter 217 New York City Surging Household Formation Pushes to Multiyear Lows Multiple high-wage industries power household formation and rental demand across
Commercial Real Estate Finance: Going Green. Dan Kastilahn Urban Habitat Chicago March 5, 2008
 Commercial Real Estate Finance: Going Green Dan Kastilahn Urban Habitat Chicago March 5, 2008 1 Topics Traditional real estate finance in the capital markets Portfolio lenders Securitization (CMBS) Underwriting
LANDLORDS CAUTIOUS AHEAD OF TAX CHANGES
 FEBRUARY 2017 Q4 2016 LANDLORDS CAUTIOUS AHEAD OF TAX CHANGES Despite turbulence in the Private Rented Sector (PRS) dating back to the Government s 2015 Summer Budget, Paragon Mortgages latest PRS Trends
WAREHOUSE MARKET REPORT
 H1 2017 WAREHOUSE MARKET REPORT HIGHLIGHTS The total warehouse stock delivered in H1 2017 fell by one half to 135,500 sq m year on year. The Q2 vacancy rate came up to 11.7% about 1.5 million sq m in absolute