Survey of Emerging Market Conditions
|
|
|
- Rosalyn Briggs
- 5 years ago
- Views:
Transcription
1 Survey of Emerging Market Conditions Quarter Preview Edition Published March 18, 2008 Lead Researcher and Analyst Dr. Wayne R. Archer, Executive Director University of Florida Bergstrom Center for Real Estate Studies Professor of Real Estate and Wachovia Fellow - Warrington College of Business Administration Editorial Board Mr. Lewis Goodkin, President Goodkin Consulting, Miami, FL Dr. Hank Fishkind, President Fishkind & Associates, Inc., Orlando, FL Mr. Chuck Davis, Director MetLife Real Estate Investments, Tampa, FL For more information about the survey or the Bergstrom Center for Real Estate Studies, visit our website at University of Florida Bergstrom Center for Real Estate Studies
2 Survey of Emerging Market Conditions January 2008 Executive Summary & Conclusions A somberness has settled over residential real estate as the world has come to realize the depth of the sub-prime meltdown and the extremity of price inflation in some sectors of housing. Amplified through the financial markets, these clouds are finally extending their shadows into the nonresidential sectors of Florida real estate as well. How dire is the forecast? Though there is increasing concern among analysts, the jury is still out on the prospects for a general recession, and for timely correction of the debilitating paralysis of many financial markets. In near defiance of these clouds, our respondents report that rental real estate in Florida still persists with a generally much more optimistic outlook. We summarize these views below. Prominent Features Despite the growing concerns about recession, residential foreclosures, falling house prices and disruption of financial markets, our survey respondents maintain an unchanged, even slightly positive view of investment in Florida real estate at this time. (This view appears consistent with rumored growing activity of vulture funds and other speculative ventures in Florida housing acquisitions.) The outlook of our respondents concerning new single family absorption continues to be for only slight declines from the present state. The outlook for condominiums, while more pessimistic, improved slightly. For market rent apartments occupancy is expected to hold steady while rental rates are expected to rise, but lag inflation. For Industrial property, office property and retail property, occupancy now is expected by some respondents to decline and rental rate increases will lag inflation. Despite the widespread concerns about financial markets, respondents expect capital to remain available for acquisition of existing rental properties. Respondents own business outlook continued a decline for the tenth straight quarter. The stability of cap rates for all except apartments, which increased by one percentage point, continues to suggest stable expectations for the value of Florida s rental real estate. This is in sharp contrast to the value of many financial assets today. The Survey Our quarterly survey, conducted by the Bergstrom Center for Real Estate Studies, Warrington College of Business Administration, University of Florida is in its tenth fielding. The total number of participants, at 287, is the most extensive survey of Florida professional real estate analysts and investors conducted on an ongoing basis. It includes respondents representing thirteen urban regions of the state and up to fifteen property types. General Investment Outlook Our general index of real estate investment outlook, weighted 40 percent for single family and condo development, 40 percent for apartments and commercial rental property and 20 percent for developable land, shows surprising stability and resilience in contrast to the media picture of Florida real estate. Expectations continue to be neutral or mixed, and even trending slightly upward University of Florida Bergstrom Center for Real Estate Studies 1
3 Survey of Emerging Market Conditions January 2008 Single Family & Condominium Development The outlook for absorption of new single family homes, for the fifth quarter running, indicates only a mild decline. While the outlook for absorption of new condominiums remains more pessimistic, it has improved slightly from the fourth quarter of 2007, and dramatically from the fourth quarter of Expected prices are more clearly pessimistic. Both for new single family and for condominiums, expectations have continued a five quarter decline, and a majority of respondents now expect price declines ahead. Despite this pessimism, the outlook for investment in single family and condo development has, for the second quarter, improved, suggesting that an increasing number of respondents are seeing relief for residential development ahead. Our respondents now see both single family development and condominiums, in Florida as a whole, as a mixed investment opportunity. Apartments After declining through 2007, the occupancy outlook for market rent apartments has turned upward very slightly, with a majority of respondents expecting positive change. While expected occupancy of apartments targeted for condo conversion is slightly negative, it also has reversed its late 2007 decline, showing a very small improvement. Expectations for rental rate growth in apartments, already below the rate of inflation, edged slightly more negative from the third and fourth quarters of The outlook for investment in market rent apartments remains positive and slightly improved from fourth quarter of The investment outlook for apartments targeted for condo conversion is more pessimistic, extending its downward drift into a third quarter. Industrial The outlook for occupancy in industrial property has declined for a fourth consecutive quarter. Some respondents, for the first time, expect industrial occupancy to decrease. Similarly, the outlook for industrial rental rates has declined, with expectations increasingly for rental rate growth to trail the rate of inflation. Despite these continued weakening expectations, the outlook for investment in industrial property remains mixed to positive, still very much as it has been for the last year. Office The outlook for office occupancy declined for still another quarter, the sixth straight. A slight majority of respondents now expect actual declining occupancy. The outlook for rental rates, after gradually drifting downward for the last year, has turned sharply downward. The balance of respondents now expects office rental rates to lag inflation, or even to decline. Despite this growing pessimism about near-term market conditions, the outlook for office investment has remained unchanged from the last quarter of 2007, with respondents giving a mixed to slightly positive assessment. Retail The outlook for retail occupancy has extended its decline to four straight quarters. The majority of respondents now expect actual occupancy declines for all types of retail. They are most pessimistic for large centers, and least so for neighborhood centers. The outlook for rental rates in most retail properties also has drifted downward over four quarters. Ironically, the exception is large centers, where the outlook has improved from last quarter, and where rental rate growth now is expected to match inflation. Despite declining expectations for retail occupancy and rental rate growth, respondents continue to view investment in retail as mixed. They are actually slightly more positive than in the last quarter of Land Investment The outlook for investment for all categories of land has continued a four quarter downward drift. Despite this the outlook remains mixed or neutral for land with entitlements for hospitality, 2007 University of Florida Bergstrom Center for Real Estate Studies 2
4 Survey of Emerging Market Conditions January 2008 warehouse and R and D, and for office. However, the outlook tends negative for land with entitlements for residential, for urban renewal or with no entitlements. Capital Availability Once again, in contrast to capital for single family mortgages, our respondents see no decline in availability of capital for acquisition of existing investment property. With capital for development there remains more pessimism, and some respondents continue for the fourth quarter running to believe the availability of capital for development has declined. Cap Rates & Yields With one exception, our respondents report cap rates that are little changed since first quarter of The exception is for apartments, where cap rates are reported to have increased roughly 100 basis points (one full percentage point) over the last two quarters. The steadiness of cap rates again has been in sharp contrast to the expectations of respondents, who have uniformly expected all cap rates to increase. Required yields have increased notably for apartments targeted for conversion. Otherwise they have remain unchanged for all property types. Own Business Outlook The own business outlook of our respondents, which has declined in all but one quarter since early 2006, continued a steady path downward. The contrast between this outlook and all the other results of the survey may be because many of our respondents derive a significant portion of their income from housing transactions University of Florida Bergstrom Center for Real Estate Studies 3
5 Survey of Emerging Market Conditions January 2008 Table of Contents Executive Summary & Conclusions... 1 Introduction... 6 Methodology... 6 Respondents... 6 Scope... 6 About the Bergstrom Center... 7 Section 1: Overall Investment Outlook... 8 Section 2: Residential Development... 9 Expected Absorption Rates... 9 Expected Price Changes... 9 Investment Outlook Section 3: Apartments Expected Occupancy Expected Rental Rates Investment Outlook Cap Rates Required Yields Section 4: Industrial Expected Occupancy Expected Rental Rates Investment Outlook Cap Rates Yields Section 5: Office Expected Occupancy Expected Rental Rates Investment Outlook Cap Rates Yields Section 6: Retail Expected Occupancy Expected Rental Rates Investment Outlook Cap Rates University of Florida Bergstrom Center for Real Estate Studies 4
6 Survey of Emerging Market Conditions January 2008 Yields Section 7: Outlook for Investment in Undeveloped Land Land Without Entitlements or with Residential Entitlements Land With Office or Retail Entitlements Land with Hospitality Entitlements Land with Entitlements for Warehouse or R & D Land for Urban Renewal Section 8: Business and Capital Availability Outlook Capital Availability Outlook of Own Business Section 9: Dominant Investors Section 10: Characteristics of Survey Respondents Profession of Respondents Markets of Familiarity Property types of Familiarity Section 11: Details of Cap Rates, Yields and Expected Changes University of Florida Bergstrom Center for Real Estate Studies 5
7 Survey of Emerging Market Conditions February 2008 Introduction The Survey of Emerging Market Conditions targets the experienced leadership of Florida s real estate development and investment community to gain insights and market intelligence on matters of fundamental importance to real estate practitioners and policy-makers across Florida. A full report, including comments from respondents and analysis of specific geographic markets, will be available online by early September at Methodology This Survey is the only Florida-centered survey of leaders and professional advisors in the real estate industry. It analyzes prospective data to produce extensive forecasting information pertinent to 37 of the state s 67 counties. The survey is administered by the Bergstrom Center for Real Estate Studies at the University of Florida. With the highly fragmented nature of real estate, no survey can encompass all aspects of the real estate industry. To face this challenge, our Survey employs a quarterly sounding from multiple groups of market leaders and professional groups advising them. Respondents Our respondent group boasts some of the most impressive credentials in the industry. Members of the 140-member UF Real Estate Advisory Board are some of our most prominent and valuable resources, providing years of experience and unparalleled success in every geographic area of Florida, and in every market type. Other participants include members of the Florida Chapter of the CCIM (Certified Commercial Investment Member) Institute, Society of Industrial and Office Realtors (SIOR), Appraisal Institute Chapter X, and leadership from the International Council of Shopping Centers (ICSC). Scope Like virtually all surveys of investment real estate markets, this survey gathers opinion. Thus, it distills complex judgments, and amounts to a carefully controlled and structured conversation with truly qualified real estate experts. The survey asks questions carefully designed to avoid ambiguities, a major problem in collecting complex information. The Survey of Emerging Market Conditions screens respondents at two levels of refinement to assure truly expert opinions. First, only persons with established real estate credentials are invited to participate. Second, each respondent is asked to respond only for those localities and property types where he or she is an active expert. The result is that all the data collected can be regarded as authoritative, no matter how small the sample of responses for a property type-locality cell. (We maintain a minimum of at least four respondents for any market cell to guard against response mistakes.) In short, even data from the least actively covered markets that we report have value as an additional expert opinion. In the more actively reported market cells, our data represent an extraordinary consensus of the experts. Survey results are anecdotal findings about required returns and investment objectives of owners and investors contemplating acquisitions or deciding about the timing of dispositions. Therefore the survey is a measure of current and prospective market perceptions, including the confidence levels exhibited by leading real estate professionals and market participants. In other words, the Survey of Emerging Market Conditions is a report of anticipated returns, business outlook and other forecasting views, rather than an analysis of actual or historical performance. The most 2008 University of Florida Bergstrom Center for Real Estate Studies 6
8 Survey of Emerging Market Conditions February 2008 valuable benefit for many may be interpretation of survey results over time to better comprehend market trends and shifts. About the Bergstrom Center For more than 30 years, the Bergstrom Center for Real Estate Studies at the University of Florida has been cultivating synergy between research, academics, students, and industry leaders who drive the real estate marketplace. The Bergstrom Center supports the UF real estate courses and degree programs housed in the Warrington College of Business Administration s Department of Finance, Insurance, and Real Estate University of Florida Bergstrom Center for Real Estate Studies 7
9 Survey of Emerging Market Conditions February 2008 Section 1: Overall Investment Outlook Our survey respondents seemingly continue to defy media reports on Florida real estate in their general outlook for investing in property. Despite the increasingly pessimistic picture of current conditions in Florida s housing markets, the outlook for investment in rental property and developable land remains mixed and stable, with even a slight upward trend. Investment Outlook for Florida Real Estate Good Time to Buy Mixed Time to Buy Poor Time to Buy 2 06 Q1 06 Q2 06 Q3 06 Q4 07 Q1 07 Q2 07 Q3 07 Q4 08 Q1 Since this investment index is weighted 40 percent on single family and residential condominium development, 40 percent on rental property of all types and 20 percent on undeveloped land, it is at least fifty percent driven by the residential development outlook. Thus the stability in views of our survey respondents is particularly noteworthy as a contrast to media images of Florida real estate University of Florida Bergstrom Center for Real Estate Studies 8
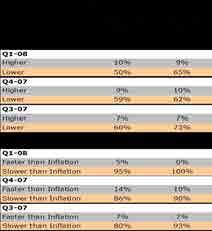
10 Survey of Emerging Market Conditions February 2008 Section 2: Residential Development Expected Absorption Rates Following a notable improvement in the first quarter of 2007, the outlook for residential absorption rates in single family development appears to have leveled off over the last four quarters as a return to neutral expectations appears to be occurring. Not surprisingly, expectations for condo absorption rates are more pessimistic than for single family. Expected Price Changes The expectation for new residence prices appears to continue its weakening trend. Despite a notable move toward stability in the first quarter of 2007, expectations have settled for price increases that lag inflation University of Florida Bergstrom Center for Real Estate Studies 9
11 Survey of Emerging Market Conditions February 2008 Investment Outlook Following two quarters of decline, the outlook for investment in residential development has experienced two quarters of growth and has moved toward a more optimistic outlook for The outlook for condo development is less optimistic than for single family University of Florida Bergstrom Center for Real Estate Studies 10
12 Survey of Emerging Market Conditions February 2008 Section 3: Apartments Expected Occupancy Following four quarters of decline, occupancy expectations for market rent apartments stabilized in the first quarters of 2008 with survey respondents expecting no change. Occupancy expectations for condo conversion also appear to have settled towards neutrality in the last quarter. Expected Rental Rates Expectations for apartment rental rates in Florida stabilized after experiencing dramatic movements in the third quarter of For apartments considered to be potential condo conversions, expectations are for rental rates to increase slower than inflation, a sharp contrast from two quarters ago. Expectations for market rent apartments, on the other hand, have remained unchanged from the third quarter of Growth in rental rates for market rent apartments appears to be moving toward rate increases that will lag inflation University of Florida Bergstrom Center for Real Estate Studies 11

13 Survey of Emerging Market Conditions February 2008 Investment Outlook Following a decline in 2007, the outlook for investment in market rent apartments appears to have leveled off as neutral expectations appear to be prevailing. As a result, it appears that it is a mixed time to buy. Again, the outlook for condo development is less optimistic than for single family, and is moving towards negative expectations University of Florida Bergstrom Center for Real Estate Studies 12


14 Survey of Emerging Market Conditions February 2008 Cap Rates Cap rates are a significant indicator of fundamental condition in real estate markets. The fact that apartment cap rates in Florida have remained at a relatively low level, with virtually no movement until the fourth quarter of 2007, signals that investors have remained steady in their confidence and risk perceptions of apartments during that time. Despite the relative stability that has been witnessed over the past few quarters, our respondents expectations still vary and appear to indicate a potential move toward neutral expectations University of Florida Bergstrom Center for Real Estate Studies 13
15 Survey of Emerging Market Conditions February 2008 Required Yields Required yields for condo conversions have understandably been higher than for market rent apartments. However, required yields for condo conversions have increased significantly in the past quarter. Required yields for market rent apartments appear to have leveled off over the past six quarters, experiencing relatively no change during this time period. Despite the change in required yields for condo conversions, expectations for yields appear to be neutral in the future for both condo conversions and market rent apartments University of Florida Bergstrom Center for Real Estate Studies 14
16 Survey of Emerging Market Conditions February 2008 Section 4: Industrial Expected Occupancy Occupancy expectations in the industrial sector have continued a year long decline, after briefly stabilizing last quarter. There appears to have been a dramatic movement away from the optimism of the first quarter of 2007 and subsequently towards more neutral expectations of no change. Expected Rental Rates Rental rate expectations for the industrial sector appear to have continued their downward trend beyond the limits of a neutral outlook. Rental expectations for warehouse and distribution appear to be rising slower than the rate of inflation while the expectations for flex space are slightly more pessimistic University of Florida Bergstrom Center for Real Estate Studies 15
17 Survey of Emerging Market Conditions February 2008 Investment Outlook Following a decline in expectations during the second quarter of 2007, it appears that the outlook for investment in industrial property has leveled off at neutral expectations. As a result, it appears that our respondents believe that it is currently a mixed time to buy. Cap Rates Over the last nine quarters, actual cap rates for industrial properties have remained relatively stable. However, expectations over the same period have not been as consistent. The volatility of 2008 University of Florida Bergstrom Center for Real Estate Studies 16

18 Survey of Emerging Market Conditions February 2008 expectations in 2006 appears to have stabilized in 2007, during which the outlook continues to lean slightly toward increasing cap rates. Yields The overall trend in required yields for warehouse and distribution, as well as flex space, appears to be relatively stable over the past nine quarters, though there has been some slight volatility from quarter to quarter. Following a notable change in the first quarter of 2007, respondents have expected yields to remain relatively constant over the next three quarters University of Florida Bergstrom Center for Real Estate Studies 17
19 Survey of Emerging Market Conditions February University of Florida Bergstrom Center for Real Estate Studies 18
20 Survey of Emerging Market Conditions February 2008 Section 5: Office Expected Occupancy While occupancy expectations for office properties were positive for most of 2006, there was a dramatic decrease throughout Optimism has weakened significantly and it appears that expectations have continued to move away from the optimistic views of nearly two years ago. Expected Rental Rates Expectations for office rental rates have continued to decline from levels reported in late This quarter saw a dramatic change in expectations as rental rates are expected to rise at a rate that is slower than inflation University of Florida Bergstrom Center for Real Estate Studies 19
21 Survey of Emerging Market Conditions February 2008 Investment Outlook It appears that the outlook for investment in offices has been scaled back from the predictions of early The solid positive expectations for investment that were apparent through the first quarter of 2007 appear to have weakened significantly though the third quarter of Current expectations appear to have reverted back to a mixed time to buy University of Florida Bergstrom Center for Real Estate Studies 20

22 Survey of Emerging Market Conditions February 2008 Cap Rates Over the past nine quarters, actual cap rates for offices have remained relatively stable. While expectations have not been as free of volatility over this same period, the past four quarters seem to indicate a more stable picture for changes in Class B office cap rates, than is the case for Class A offices University of Florida Bergstrom Center for Real Estate Studies 21

23 Survey of Emerging Market Conditions February 2008 Yields While perceptions of required yields for offices have shown some volatility throughout 2006, there appears to have been more stability throughout 2007 and into the beginning of Over this period, Class B yields have been slightly higher than those of Class A, reflecting more perceived risk in Class B. However, the two appear to have converged in the third quarter of In the first two quarters of 2007, expected changes in required yields appeared to have exhibited a decreasing trend, gravitating toward a neutral outlook for the future. However, over the past quarter, respondents have shown some indication that required yields for Class A offices may increase in the future University of Florida Bergstrom Center for Real Estate Studies 22
24 Survey of Emerging Market Conditions February 2008 Section 6: Retail Expected Occupancy For all four types of retail large centers, neighborhood centers, strip centers and free standing the outlook for occupancy has been fairly volatile since early It appears that over the past quarter, the outlook for each type of retail is beginning to move towards expectations for potential rate decreases in the future. Expected Rental Rates While expected rental rates for retail had been mixed throughout 2006, there appeared to be a consistent expectation for rental rates to increase at the rate of inflation. However, in the first quarter of 2008, the outlook appears to have weakened and is moving towards rate increases that lag inflation for all retail types, except for large centers University of Florida Bergstrom Center for Real Estate Studies 23
25 Survey of Emerging Market Conditions February 2008 Investment Outlook Despite the sharp volatility that occurred throughout 2007, the investment outlook has tended toward neutrality for all four retail types. As a result, it appears that it is currently a mixed time to buy within this market University of Florida Bergstrom Center for Real Estate Studies 24
26 Survey of Emerging Market Conditions February 2008 Cap Rates Over the past nine quarters, expected changes in cap rates have experienced a great deal of volatility. Despite these fluctuations, results dating back to the first quarter of 2007 have shown strengthening support for all retail cap rates to increase. However, actual cap rates have remained virtually constant over this horizon University of Florida Bergstrom Center for Real Estate Studies 25

27 Survey of Emerging Market Conditions February 2008 Yields Though required retail yields appear to have been quite volatile throughout 2006, 2007 produced a more consistent pattern which has continued into the first quarter of Required yields over the past three quarters appear to have leveled off around ten percent. Expectations of yield changes have been extremely volatile over this same time period. They presently indicate neutral expectations for all classifications except large centers, for which respondents indicate the potential for yield increases University of Florida Bergstrom Center for Real Estate Studies 26
28 Survey of Emerging Market Conditions February 2008 Section 7: Outlook for Investment in Undeveloped Land Land Without Entitlements or with Residential Entitlements The outlook for investment in land without entitlements and land with residential entitlements has continued to weaken throughout 2007 and into Despite indication of an improved outlook in the first quarter of 2007, the following four quarters have signaled that a downward trend may resume. Currently, it remains a mixed time to buy within this market. Land With Office or Retail Entitlements While the outlook for investment in land with office or retail entitlements remained positive and steady throughout 2006, it appears that it has weakened throughout 2007 and into Expectations appear to be falling, thus making it a mixed to time to buy within this market. Land with Hospitality Entitlements The outlook for land with hospitality entitlements appears to have remained relatively neutral over the past nine quarters. It appears that the present quarter s results reinforce that it remains a mixed time to buy within this market Land with Entitlements for Warehouse or R & D While fairly volatile throughout 2006, the outlook on land with entitlements for warehouse or R&D appears to be settling toward neutrality in the first quarter of Thus, it appears that it remains a mixed time to buy within this market. Land for Urban Renewal While 2006 exhibited a weakening outlook for investment in land for urban renewal, it appears that expectations remain neutral for the first quarter of University of Florida Bergstrom Center for Real Estate Studies 27
29 Survey of Emerging Market Conditions February University of Florida Bergstrom Center for Real Estate Studies 28
30 Survey of Emerging Market Conditions February 2008 Section 8: Business and Capital Availability Outlook Capital Availability While the past has shown some volatility in expectations of capital availability, results for the first quarter of 2008 appear to indicate that there are no expected changes in available capital for either acquisitions or development. Outlook of Own Business The survey respondents perception of their own business outlook has continued its dramatic decline over the past nine quarters, yet again experiencing a significant decrease in the latest quarter University of Florida Bergstrom Center for Real Estate Studies 29

31 Survey of Emerging Market Conditions February University of Florida Bergstrom Center for Real Estate Studies 30


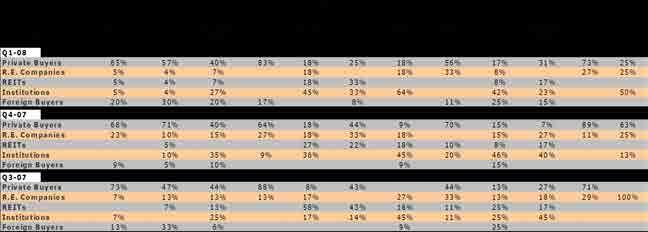
32 Survey of Emerging Market Conditions February 2008 Section 9: Dominant Investors Respondents indicated which of five investor groups they perceived to be the most active for their types of property. For twelve of fifteen property types, private investors were the most dominant. The exceptions included large retail, neighborhood retail centers, and Class A offices. REITs were perceived to be the most active in neighborhood centers. Institutional investors played a large part in Class A offices, Hospitality-Business, and Large Retail. Foreign investment was perceived to remain limited University of Florida Bergstrom Center for Real Estate Studies 31


33 Survey of Emerging Market Conditions February 2008 Section 10: Characteristics of Survey Respondents In the latest survey, approximately 61 percent of the 287 respondents reported being an appraiser, just under half with designations of MAI, SREA or SRPA. The next largest groups, each representing about ten percent of respondents, were consultants and brokers. Profession of Respondents Markets of Familiarity Each respondent selected up to four regional markets with which they are familiar. In the latest survey, these choices accumulated to 535 observations. Every region, with the exception of Lakeland Winter Haven, was represented by a minimum of 20 observers, with five of the regions having over 50 observers. The highest number of responses was for the Broward market with 66 representatives. The lowest was Lakeland Winter Haven with University of Florida Bergstrom Center for Real Estate Studies 32

34 Survey of Emerging Market Conditions February 2008 Property types of Familiarity Each respondent selected up to three property types with which they were familiar. Altogether, 671 selections were made in the latest survey round. Single family development was selected by 125 respondents while condominium development was selected by 91. Ten property types were selected by at least 30 respondents, and two more had at least 20 respondents University of Florida Bergstrom Center for Real Estate Studies 33
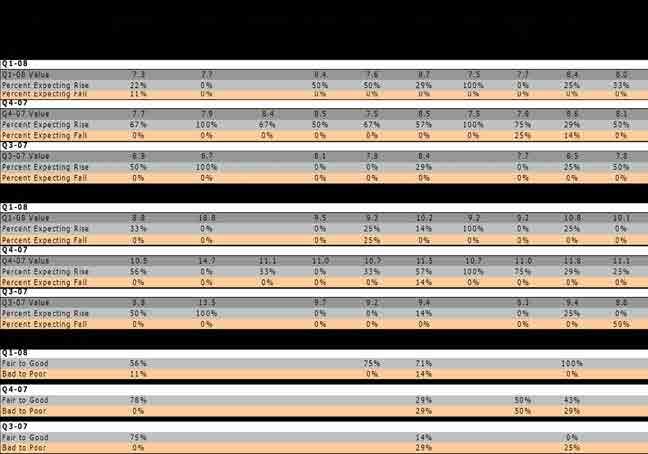
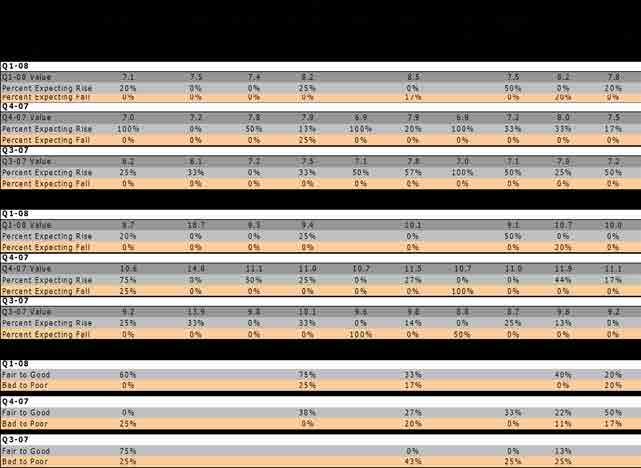
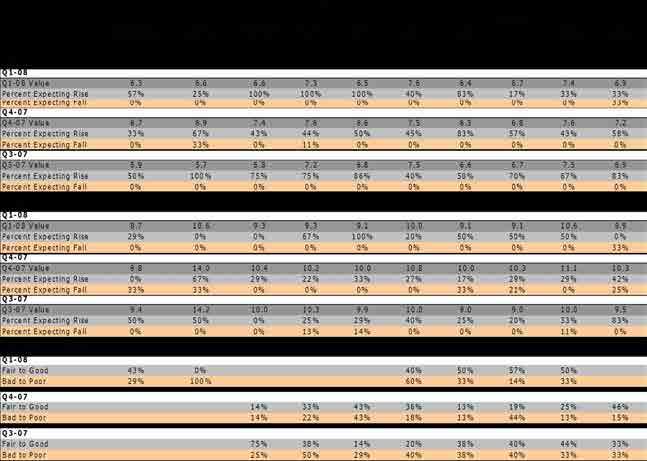
35 Survey of Emerging Market Conditions February 2008 Section 11: Details of Cap Rates, Yields and Expected Changes Table 1 summarizes estimates of cap rates and yields for twelve property types over the last four quarters of the survey. In addition, it shows the distribution of expectations for changes in each reported cap rate and yield. For expectations, the table reports the percent of respondents expecting each cap rate and yield to either rise or fall in the future. Excluded from this table is the percentage of respondents whom are expecting no change. This third percentage can be computed as 100 less the two percentages reported. Since prior sections discuss the content of Table 1, further comment is not given here. The table is simply provided as a reference to facilitate application of the survey results University of Florida Bergstrom Center for Real Estate Studies 34
36 Survey of Emerging Market Conditions February 2008 Table 1: Detailed Cap Rates, Yields and Expectations for Change Florida Cap Rates Apartments - Market Rental Condo Conversion Warehouse and Dist. Flex Space, R & D Office: Class A Office: Class B Retail - Large Neighborhood Centers Strip Centers Hospitality Business Hospitality Economy Free Standing Q1-08 Q1-08 Value 7.0% 7.1% 7.0% 7.7% 7.0% 8.1% 6.6% 6.9% 7.8% 9.0% 10.1% 7.5% Percent Expecting Rise 43.4% 27.8% 42.4% 40.4% 45.7% 37.5% 57.1% 51.6% 41.5% 37.5% 40.0% 40.6% Percent Expecting Fall 5.7% 22.2% 3.0% 6.4% 2.9% 7.8% 4.8% 0.0% 5.7% 0.0% 0.0% 9.4% Q4-07 Q4-07 Value 7.0% 7.1% 7.6% 7.7% 6.8% 7.7% 6.6% 7.0% 7.9% 8.9% 10.1% 7.5% Percent Expecting Rise 55.2% 47.1% 39.6% 45.5% 58.3% 35.5% 59.1% 58.8% 40.9% 38.5% 40.0% 37.8% Percent Expecting Fall 1.7% 23.5% 2.1% 7.3% 0.0% 2.6% 4.5% 3.9% 1.5% 7.7% 20.0% 2.2% Q3-07 Q3-07 Value 6.3% 6.0% 7.1% 7.4% 7.3% 7.8% 6.9% 6.9% 7.8% 8.8% 9.3% 7.4% Percent Expecting Rise 44.7% 56.5% 33.3% 40.0% 48.6% 40.3% 59.1% 51.4% 48.3% 25.0% 33.3% 56.0% Percent Expecting Fall 6.4% 8.7% 4.4% 2.0% 0.0% 4.8% 0.0% 2.7% 3.4% 0.0% 0.0% 0.0% Q2-07 Q2-07 Value 6.5% 5.6% 7.4% 7.6% 6.9% 7.8% 6.7% 7.1% 7.7% 10.0% 11.4% 7.4% Percent Expecting Rise 33.3% 46.2% 31.7% 31.0% 37.8% 36.9% 50.0% 42.9% 37.3% 66.7% 28.6% 31.4% Percent Expecting Fall 5.1% 3.8% 4.8% 1.7% 6.7% 1.5% 4.2% 2.4% 3.4% 33.3% 28.6% 2.9% Yields Q1-08 Q1-08 Value 9.4% 18.6% 10.0% 10.0% 9.9% 10.4% 9.5% 9.6% 10.8% 11.6% 12.3% 10.7% Percent Expecting Rise 28.3% 5.6% 18.2% 25.5% 40.0% 26.6% 47.6% 41.9% 24.5% 37.5% 40.0% 15.6% Percent Expecting Fall 3.8% 27.8% 3.0% 8.5% 8.6% 10.9% 4.8% 9.7% 11.3% 0.0% 0.0% 9.4% Q4-07 Q4-07 Value 9.7% 15.3% 10.1% 10.1% 10.1% 10.9% 9.9% 10.0% 10.9% 10.8% 11.5% 10.6% Percent Expecting Rise 44.8% 29.4% 25.0% 32.7% 36.1% 26.3% 36.4% 35.3% 28.8% 46.2% 40.0% 24.4% Percent Expecting Fall 5.2% 5.9% 0.0% 3.6% 2.8% 3.9% 22.7% 11.8% 3.0% 0.0% 0.0% 6.7% Q3-07 Q3-07 Value 10.5% 14.5% 10.5% 11.1% 10.0% 10.2% 9.3% 9.4% 10.2% 11.7% 13.0% 9.6% Percent Expecting Rise 34.0% 43.5% 15.6% 28.0% 21.6% 22.6% 40.9% 27.0% 29.3% 25.0% 33.3% 40.0% Percent Expecting Fall 6.4% 8.7% 0.0% 2.0% 8.1% 1.6% 4.5% 2.7% 5.2% 0.0% 0.0% 4.0% Q2-07 Q2-07 Value 10.0% 14.1% 9.9% 10.8% 10.2% 11.4% 10.5% 10.4% 10.7% 13.7% 13.0% 10.2% Percent Expecting Rise 23.1% 38.5% 20.6% 17.2% 28.9% 16.7% 37.5% 28.6% 26.7% 66.7% 42.9% 20.0% Percent Expecting Fall 7.7% 0.0% 4.8% 5.2% 4.4% 6.1% 4.2% 7.1% 5.0% 0.0% 0.0% 2.9% 2008 University of Florida Bergstrom Center for Real Estate Studies 35
37 Jacksonville Cap rates in Jacksonville are, on average, lower than that of the state (0.20 percentage points) and range from 6.9% (Apartments) to 8.2% (Office: Class B) Cap rates have increased across the majority of property types in the last quarter, with the largest increases in Office: Class B (+0.46% change) and Office: Class A (+0.33% change). However, a notable decrease in cap rates occurred in Warehouse and Dist. (-0.48% change). For the majority of property types, cap rates expectations are neutral to positive over the next quarter. The most significant respondent support for cap rate increases appears to be occurring in Large Retail and Free Standing Retail. Required yields for Jacksonville are, on average, higher than that of the state, 11.49% compared to 11.06% statewide. Required yields are highest for Condo Conversion at 19.7% and lowest for Apartments at 9.8%. Required yields decreased significantly across all property types, except Condo Conversion in the last quarter. The largest shifts occurred in Condo Conversion (+4.40% change) and Neighborhood Centers (-1.42% change). The investment outlook is mixed across property types this quarter. Market Rental Apartments, Class A Office and Flex Space show the most respondent support for a positive outlook. The outlook for Land Development is again mixed across several classifications. It appears that the most neutral to negative outlook occurs for Land without Entitlements and Land with Residential Entitlements. Expectations of future occupancy rates are mixed across property types. Respondents expect occupancy rates to be lower in Market Rental Apartments and Warehouse and Dist., and higher in Office: Class B and Free Standing Retail. Rental rate expectations are mixed across property types. Rental rates are expected to increase faster than inflation in Condo Conversion and Office: Class A, but slower than inflation in Neighborhood Centers and Free Standing Retail. Future absorption rates are expected to either remain the same or decrease for Single Family Development and Condominium Development. Respondents expect future prices to increase at a rate slower than inflation for both Single Family and Condominium Development.
38
39
40
41 Pensacola-Tallahassee Cap rates in Pensacola-Tallahassee are, on average, higher than that of the state (0.26 percentage points) and range from 7.3% (Apartments) to 8.7% (Office: Class B) Cap rates have decreased over the past quarter for the majority of available property types. The largest cap rate movement occurred in Apartments (-0.35% change). Cap rate outlooks are neutral to positive across available property types. Respondents show the most support for rate increases in Large Retail. Required yields for Pensacola-Tallahassee are, on average, lower than that of the state, 10.64% compared to 11.06% statewide. Required yields are highest for Condo Conversion at 18.8% and lowest for Apartments at 8.8%. For available property types, required yields have decreased significantly over the past quarter, with one exception being Condo Conversion. The largest shifts occurred in Condo Conversion (+4.04% change) and Neighborhood Centers (-1.78% change). For available property types, the investment outlook is positive. Strip Centers, Office: Class A, and Office: Class B show the most respondent support for a positive outlook. Data is only available for four property types. The outlook for Land Development is neutral to negative across classifications. It appears that the most negative outlooks occur for Land without Entitlements and Land with Residential Entitlements. For the majority of available property types, future occupancy rate expectations are neutral to negative. The exception is Apartments, for which respondents provide a more neutral to positive expectation. Expectations for rental rates are mixed across available property types. Respondents expect rates to increase slower than inflation in Apartments and Strip Centers, but faster than inflation in Condo Conversion. Future absorption rates are expected to either remain neutral or decrease in Single Family Development and to increase in Condominium Development. Future price increases are expected to occur at a rate slower than inflation for both Single Family and Condominium Development.
42
43
44
45 Gainesville-Ocala Cap rates in Gainesville-Ocala are, on average, higher than that of the state (0.20 percentage points) and range from 7.3% (Apartments) to 8.6% (Office: Class B) For available property types, cap rates decreased over the last quarter, with the largest changes occurring in Apartments (-0.56% change) and Strip Centers (-0.40% change). For the majority of available property types, cap rate expectations are neutral to positive. Respondents provide the most support for expected rate increases in Condo Conversion, Flex Space, and Free Standing Retail. Required yields for Gainesville-Ocala are, on average, lower than that of the state, 10.46% compared to 11.06% statewide. Required yields are highest for Condo Conversion at 18.4% and lowest for Apartments at 8.5%. For the majority of available property types, required yields decreased over the past quarter. The largest negative shift was in Neighborhood Centers (-0.75% change). However, the most significant change was the rate increase that occurred in Condo Conversion (+5.07%). Data regarding the investment outlook is only available for three property types in this region. Respondents indicate a positive outlook for Market Rental Apartments, Class A Office and Strip Centers. The outlook for Land Development is fairly uncertain across classifications as there appears to be a significant difference in opinion across respondents. Expectations of future occupancy rates are mixed across available property types. Respondents expect lower occupancy rates in Office: Class B, Large Retail, and Free Standing Retail, but higher occupancy rates in Condo Conversion. Expectations of future rental rates are mixed across available property types. Respondents expect rates to increase slower than inflation in Condo Conversion, Office: Class B, and Neighborhood Centers, but faster than inflation in Free Standing Retail. Expectations of future absorption rates have declined, and are uncertain as there appears to be a significant difference in opinion across respondents. Future prices are expected to increase slower than inflation for both Single Family and Condominium Development.
46
47
48
49 Daytona Beach Area Cap rates in Daytona Beach are, on average, higher than that of the state (0.13 percentage points) and range from 7.1% (Apartments) to 8.5% (Office: Class B) Cap rates have increased over the last quarter across most property types, with the exception being Warehouse and Dist. The largest movements in cap rates have occurred in Office: Class B (+0.61% change) and Neighborhood Centers (+0.38% change). Cap rate expectations are primarily neutral across property types for the upcoming quarter. Required yields for Daytona Beach are, on average, lower than that of the state, 10.76% compared to 11.06% statewide. Required yields are highest for Condo Conversion at 18.7% and lowest for Apartments at 8.7%. Required yields have decreased significantly over the past quarter for all property types except Condo Conversion. The largest shifts occurred in Condo Conversion (+3.93% change) and Neighborhood Centers (-1.89% change). For available property types, the investment outlook is neutral to positive. The most positive outlook over the next quarter appears to be for Apartments and Flex Space. The outlook for Land Development is again mixed across several classifications. It appears that the most negative outlook occurs for Land with Residential Entitlements. Future occupancy expectations are mostly neutral across available property types. However, respondents do indicate an expectation for lower rates in Apartments over the next quarter. For available property types, rental rate expectations are mixed. Respondents believe that rental rates will increase faster than inflation for Condo Conversion, Warehouse and Dist., and Free Standing, but slower than inflation for Flex Space. Future absorption rates are expected to be neutral to lower in Single Family and Condominium Development. Future price increases are expected to be slower than inflation in both Single Family and Condominium Development.
50
51
52
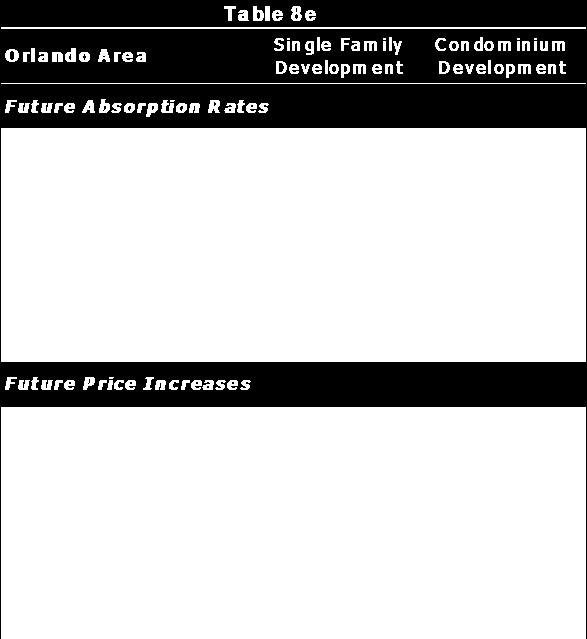
53 Orlando Area Cap Rates in Orlando are, on average, lower than that of the state (0.68 percentage points) and range from 6.4% (Apartments) to 7.8% (Office: Class B) Cap rates have declined over the past quarter for all but one property type, with the largest changes being seen in Warehouse and Dist. (- 0.89% change) and Apartments (-0.48% change). Cap rate outlooks appear to signal expectations for an increase in rates over the next quarter, with the most respondent support occurring for Flex Space and Strip Centers. Required yields for Orlando are, on average, lower than that of the state, 10.82% compared to 11.06% statewide. Required yields are highest for Condo Conversion at 19.1% and lowest for Apartments at 9.1%. The largest shifts in required yields occurred in Condo Conversion (+5.29% change) and Neighborhood Centers (-0.52% change). The investment outlook is mixed across property types. It is worth noting that a positive outlook is broadly held for Neighborhood Centers, and that the outlook is notably improved from the previous two quarters for Free Standing Retail. The outlook for Land Development is again mixed across several classifications. It appears that the most negative outlooks occur for Land without Entitlements and Land with Residential Entitlements. Future occupancy expectations are mixed across property types. Respondents indicate that there is potential for lower future occupancy rates in Warehouse and Dist. and higher future occupancy rates in Apartments. Future rental rate expectations are mixed across property types. The majority of respondents believe that rental rates will increase at a rate that is slower than inflation in Warehouse and Dist., and at a rate faster than inflation in Strip Centers. Future absorption rates are expected to be neutral to lower in Condominium Development and Single Family Development. Future price increases are expected to be slower than inflation in both Single Family and Condominium Development.
54
55
56
57 Lakeland-Winter Haven Cap Rates in Lakeland-Winter Haven are, on average, lower than that of the state (0.19 percentage points) and range from 6.9% (Apartments) to 8.2% (Office: Class B) For the majority of property types, cap rates rose over the last quarter. The largest positive change occurred in Office: Class B (+0.46% change) while the largest negative change occurred in Warehouse and Dist. (-0.48% change). Cap rate outlooks for the majority of property types indicate expectations for rates to remain neutral. Worth noting, however, is significant respondent support for rate increases in Large Retail. Required yields for Lakeland-Winter Haven are, on average, lower than that of the state, 10.35% compared to 11.06% statewide. Required yields are highest for Condo Conversion at 18.6% and lowest for Apartments at 8.6%. Required yields have decreased across all available property types in the last quarter. The largest shifts occurred in Neighborhood Centers (- 1.06% change) and Apartments (-0.99% change). For available property types, the investment outlook is neutral to positive across property types. The most respondent support for a positive outlook occurs in Warehouse and Dist. The outlook for Land Development is again mixed across several classifications. It appears that the most negative outlooks occur for Land without Entitlements and Land with Residential Entitlements. Expectations of future occupancy rates are mixed across property types. Respondents expect rates to be higher in Apartments and Office: Class A, and neutral to lower in the remaining property types. Expectations for rental rates are mixed across property types. Respondents expect rates to rise faster than inflation in Apartments and slower than inflation in Condo Conversion and Free Standing. Future absorption rates are expected to be lower in both Single Family and Condominium Development. Future price increases are expected to be slower than inflation for both Single Family and Condominium Development.
58
59
60
61 Tampa-St Petersburg Cap rates in the Tampa-St. Petersburg area are, on average, lower than that of the state (0.12 percentage points) and range from 7.0% (Apartments) to 8.3% (Office: Class B) Cap rates increased over the past quarter for all but one property type, with the exception being Warehouse and Dist. The most positive change occurred in Office: Class B (+0.53% change). Cap rate outlooks indicate that rates are expected to increase across most property types in the next quarter. However, respondents indicate that this may not be the case for Condo Conversion, as the majority of respondents expect a rate decrease for this property type. Required yields for Tampa-St. Petersburg are higher, on average, than that of the state, 11.70% compared to 11.06% statewide. Required yields are highest for Condo Conversion at 19.9% and lowest for Apartments at 10.0%. The largest shifts in required yields occurred in Condo Conversion (+6.03% change) and Free Standing Retail (+0.99% change). The investment outlook is mostly neutral to positive across property types, with the most positive outlook among respondents for Free Standing Retail. Notable improvement has occurred from the previous two quarters for Large Retail, Neighborhood Centers and Free Standing Retail. The outlook for Land Development is again mixed across several classifications. It appears that the most negative outlooks occur for Land with Residential Entitlements and Land without Entitlements. Future occupancy rate expectations are mixed across property types. The broadest respondent expectation for occupancy rate decreases occurs in Free Standing Retail, while the balance of expectations favors increases for Market Rental Apartments and Class A Office. Rental rate expectations are also mixed across property types. Respondents expect rental rates to increase faster than inflation in Apartments, Class B Office and Large Retail, while they expect increases slower than inflation in Free Standing Retail. Future absorption rate expectations are uncertain for both Condominium Development and Single Family Development as there appears to be a significant difference in opinion across respondents. Future price increases are expected to occur at a rate that is slower than inflation in both Single Family and Condominium Development.
62
63
64
65 Sarasota-Bradenton Cap rates in the Sarasota-Bradenton area are, on average, lower than that of the state (0.40 percentage points) and range from 6.7% (Apartments) to 8.0% (Office: Class B) Cap rate movements over the past quarter were mixed across property types, with the largest changes occurring in Warehouse and Dist. (- 0.72% change) and Apartments (-0.31% change). Cap rate outlooks are mixed across property types. Respondents expect cap rates to decrease in Condo Conversion and increase in Large Retail. Required yields for Sarasota-Bradenton are, on average, lower than that of the state, 10.51% compared to 11.06% statewide. Required yields are highest for Condo Conversion at 18.8% and lowest for Apartments at 8.8%. Movements in required yields over the past quarter were positive across property types, with the exception being Neighborhood Centers. The largest shifts occurred in Condo Conversion (+5.76% change) and Free Standing Retail (+0.72% change). The investment outlook for this quarter is mixed across available property types, but tending positively. Worth noting is that respondents favor a negative outlook in Condo Conversion for the upcoming quarter. It has improved for Market Rental Apartments, Flex Space R & D, and for Free Standing Retail. The outlook for Land Development is again mixed across several classifications. It appears that the most negative outlook occurs for Land without Entitlements. For available property types, future occupancy rate expectations are mixed. The broadest expectation for lower future occupancy rates occurs in Large Retail, while the broadest expectation of increases is for Market Rental Apartments and Class A Office. Rental rate expectations are mixed across property types. Respondents expect rental rates to increase slower than inflation in Neighborhood Centers and Free Standing Retail, and faster than inflation in Apartments. Future absorption rates are expected to remain the same or move higher for both Condominium and Single Family Development. Respondents indicate that future prices will increase at a rate slower than inflation for both Single Family and Condominium Development.
66
67
68
69 Treasure Coast Cap Rates in the Treasure Coast area are, on average, lower than that of the state (0.79 percentage points) and range from 6.3% (Apartments) to 7.6% (Office: Class B) Cap rates have decreased in all but one property type (Office: Class B) within the last quarter. The largest changes have occurred in Warehouse and Dist. (-0.85% change) and Apartments (-0.43% change). Cap rate outlooks for this quarter indicate potential rate increases, with Neighborhood Centers, Strip Centers, Warehouse and Dist., and Office: Class A receiving the highest response for increases. Required yields for the Treasure Coast are slightly higher, on average, than that of the state, 11.11% compared to 11.06% statewide. Required yields are highest for Condo Conversion at 19.4% and lowest for Apartments at 9.4%. Required yields have increased significantly across property types, with the largest shifts occurring in Condo Conversion (+6.77% change) and Free Standing (+1.72% change). For available property types, the investment outlook is mixed. The most positive expectations appear to be for Neighborhood Centers, while the most negative expectations appear to be for Flex Space. The outlook for Land Development is neutral to negative across classifications. It appears that the most negative outlooks occur for Land with Residential Entitlements and Land without Entitlements. For the majority of property types, expectations of future occupancy rates are neutral to negative. The highest expectation for occupancy rate decreases occurs in Office: Class A, Office: Class B, Strip Centers, and Flex Space. For the majority of property types, rental rate increases are expected to occur at a rate that is slower than inflation. The most respondent support for this type of rate increase occurs in Apartments and Flex Space. Future absorption rates are expected to remain at current levels in both Condominium Development and Single Family Development. Future price increases are expected to be slower than inflation in both Single Family and Condominium Development.

70
71
72
73 Palm Beach County Cap Rates in Palm Beach County are, on average, lower than that of the state (0.90 percentage points) and range from 6.2% (Apartments) to 7.5% (Office: Class B). Changes in cap rates from last quarter are mixed across property types, with the largest changes being seen in Warehouse and Dist. (- 0.67% change) and Office: Class B (+0.26% change). Cap rate outlooks for this quarter reveal expectations of rate increases across most property types, with Apartments and Free Standing Retail showing the highest response for increases. Required yields for Palm Beach County are, on average, lower than that of the state, 10.7% compared to 11.06% statewide. Required yields are highest for Condo Conversion at 18.9% and lowest for Apartments at 9.0%. Required yields have increased across the majority of property types over the last quarter. The largest shifts occurred in Condo Conversion (+5.52% change) and Free Standing Retail (+0.48% change). The investment outlook is mixed across property types. The most notable negative outlook occurs for Condo Conversion while the most positive outlook occurs for Large Retail. The outlook shows improvement for all Industrial, for Strip Centers and Free Standing Retail. The outlook for Land Development is neutral to negative across all classifications. It appears that the most negative outlooks occur for Land without Entitlements and Land with Residential Entitlements. Indications of future occupancy rate decreases continue for most property types. The highest respondent expectation for rate decreases occurs in Office: Class A and Free Standing Retail. Generally, expectations for rental rte increases have weakened. Most notably, respondents indicate that rental rates may increase slower than inflation for Apartments and Warehouse and Dist., and faster than inflation for Free Standing Retail. Future absorption rates are expected to be lower in Single Family and Condominium Development. Future price increases are expected to be slower than inflation in both Single Family and Condominium Development.
74
75
76
77 Broward County Cap rates in Broward County are, on average, lower than the rest of the state (6.8% compared to 7.65%) and range from 6.3% (Apartment) to 7.6% (Office: Class B). Cap rates increased across the majority of property types, with the largest positive movements appearing in Office: Class B (+0.35% change) and Office: Class A (+0.23% change). Also worth noting, however, is a decrease in cap rates over the last quarter in Warehouse and Dist. (-0.58 percentage points) Cap rate outlooks favor increases this quarter, with Condo Conversion and Neighborhood Centers receiving the highest response for future rate increases. Required yields for Broward County are, on average, lower than that of the state, 10.6% compared to 11.06% statewide. Required yields are highest for Condo Conversion at 18.8% and lowest for Apartments at 8.8%. Over the past quarter, required yields have increased across property types, with the largest shifts occurring in Condo Conversion (+5.75% change) and Free Standing Retail (+0.71% change). The investment outlook across property types is mixed. The most notable negative outlook occurs for Condo Conversion while the most positive and improved outlook occurs for Large Retail. The investment outlook for Land Development has declined. It tends to be negative for Land without Entitlements and Land with Residential Entitlements. However, there is a more neutral outlook for the four remaining land classifications. In Broward Country, expectations for future occupancy rates are moving from neutral to negative over the next quarter. Office: Class A, Office: Class B, and Free Standing Retail show the most respondent expectation for lower future occupancy. Rental rate expectations are neutral to negative for most property types. Apartments received the highest response for rental rate increases that are expected to be slower than inflation. Future absorption rates are expected to be lower in both Single Family and Condominium Development. Future price increases are expected to be slower than inflation in Single Family and Condominium Development
78
79
80
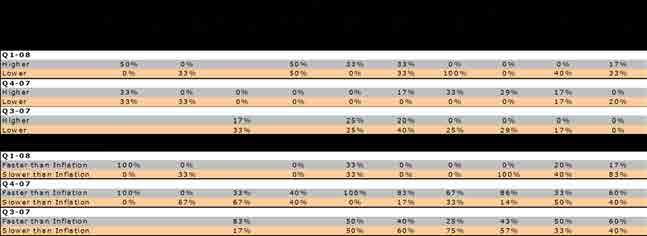
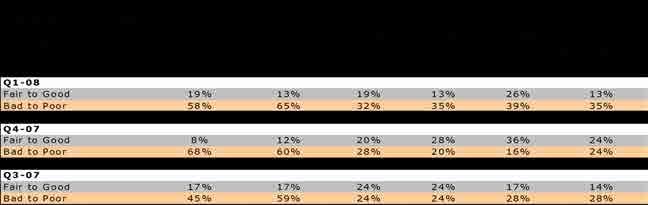
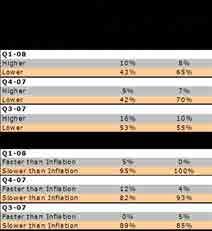
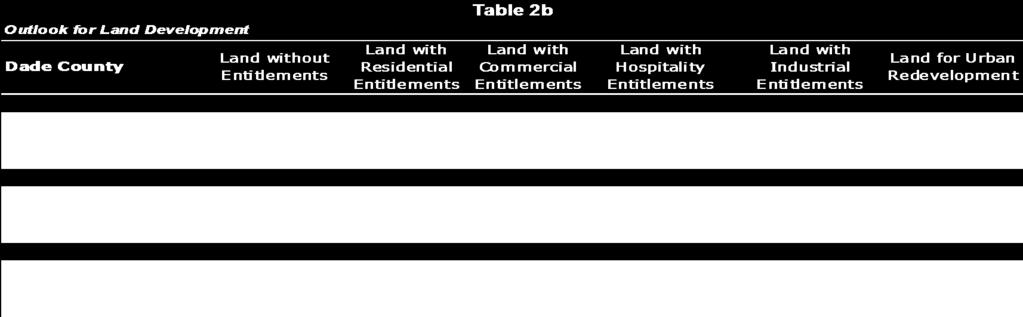
81 Dade County Cap rates in Dade County, on average, are lower than the state mean (0.80 percentage points) and range from 6.3% (Apartment) to 7.6% (Office: Class B) Over the past quarter, cap rates have increased across most property types with Office: Class B (+0.37 percentage points) and Office: Class A (+0.24 percentage points) representing the largest positive changes. Also worth noting, however, is a decrease in cap rates over the last quarter in Warehouse and Dist. (-0.57 percentage points) Cap rate outlooks for the next quarter appear to favor rate increases, with Neighborhood Centers and Free Standing Retail showing the most respondent support. Required yields for Dade County (10.83%) are, on average, lower (.23 percentage points) than the state mean (11.06%). Required yields have increased, on average, over the last quarter from 9.9% to 10.83%. The largest shifts in required yields occurred in Condo Conversion ( +5.86% change) and Free Standing Retail ( +0.82% change) The investment outlook across property types is mixed but generally improved from the previous two quarters. The poorest outlook is for Condo Conversion, while the most positive is for Large Retail. The investment outlook for Land Development is negative for Land without Entitlements, and Land with Residential Entitlements. However, the outlook is mixed for the four remaining land classifications. Generally, the outlook for investment in land has declined. Expectation of future occupancy rates in Dade County are neutral to negative for most property types. The Condo Conversion and Office: Class B property types show the strongest expectation for lower future occupancy rates. On average, rental rates are expected to increase either at the rate of inflation or slower than inflation. It is worth noting that Free Standing Retail, however, appears to be the exception as rental rates are expected to increase faster than the rate of inflation. Future absorption rates are expected to be lower in both Single Family and Condominium Development. Future price increases are expected to occur slower than inflation in both Single Family and Condominium Development.
82
83
84
85 Southwest Coast Cap Rates in the Southwest Coast area are, on average, lower than that of the state (0.82 percentage points) and range from 6.3% (Apartments) to 7.6% (Office: Class B) Cap rates have decreased across most property types during the last quarter, with the largest changes being seen in Warehouse and Dist. (-0.84% change) and Apartments (-0.43% change). Cap rate outlooks for this quarter indicate potential rate increases across the majority of property types, with Office: Class A, Flex Space, and Warehouse and Dist. receiving the most respondent support. Required yields for the Southwest Coast are lower, on average, than that of the state, 10.38% compared to 11.06% statewide. Required yields are highest for Condo Conversion at 18.6% and lowest for Apartments at 8.7%. The largest shifts in required yields occurred in Condo Conversion (+4.62% change) and Neighborhood Centers (-1.20% change). For available property types, the investment outlook is mixed. Respondents appear to be leaning toward positive expectations for Neighborhood Centers and negative expectations for Condo Conversion. The outlook for Land Development is mixed across several classifications, with the largest proportion of respondents often taking a neutral position. It appears that a more negative outlook is expected for Land without Entitlements than its counterparts. Future occupancy expectations are neutral to negative across the majority of property types, with the most frequent indication of occupancy decreases occurring in Condo Conversion, Large Retail, and Flex Space. Rental rates are expected to increase either at the rate of inflation or slower than inflation for the majority of property types. The most respondent support for rate increases that will be slower than inflation occur in Flex Space, Free Standing, and Strip Centers. Future absorption rates are expected to either remain the same or become lower for both Single Family and Condominium Development. Future price increases are expected to occur at a rate slower than inflation in both Single Family and Condominium Development.
86
Survey of Emerging Market Conditions
 Survey of Emerging Market Conditions Quarter 2 27 Published June 27 Lead Researcher and Analyst Dr. Wayne R. Archer, Director University of Florida Bergstrom Center for Real Estate Studies Professor of
Survey of Emerging Market Conditions
 Bergstrom Center for Real Estate Studies Warrington College of Business Administration University of Florida Survey of Emerging Market Conditions Quarter 2 2013 Published August 2013 Lead Researcher Dr.
Survey of Emerging Market Conditions
 Survey of Emerging Market Conditions Quarter 2 2014 Published September 2014 Warrington College of Business Administration Lead Researcher Dr. Wayne R. Archer, Executive Director University of Florida
Survey of Emerging Market Conditions
 Survey of Emerging Market Conditions Quarter 1 2015 Published 2012-15 University of Florida Bergstrom Center for Real Warrington Estate Studies College of Business Administration 1 Lead Researcher Dr.
Survey of Emerging Market Conditions
 Bergstrom Center for Real Estate Studies Warrington College of Business Administration University of Florida Survey of Emerging Market Conditions Quarter 1 2012 Published May 4, 2012 Lead Researcher Dr.
Survey of Emerging Market Conditions
 Survey of Emerging Market Conditions Quarter 27 Published March 27 Lead Researcher and Analyst Dr. Wayne R. Archer, Director University of Florida Bergstrom Center for Real Estate Studies Professor of
ECONOMIC CURRENTS. Vol. 5 Issue 2 SOUTH FLORIDA ECONOMIC QUARTERLY. Key Findings, 2 nd Quarter, 2015
 ECONOMIC CURRENTS THE Introduction SOUTH FLORIDA ECONOMIC QUARTERLY Economic Currents provides an overview of the South Florida regional economy. The report presents current employment, economic and real
SELF-STORAGE REPORT VIEWPOINT 2017 / COMMERCIAL REAL ESTATE TRENDS. By: Steven J. Johnson, MAI, Senior Managing Director, IRR-Metro LA. irr.
 SELF-STORAGE REPORT VIEWPOINT 2017 / COMMERCIAL REAL ESTATE TRENDS By: Steven J. Johnson, MAI, Senior Managing Director, IRR-Metro LA The Self Storage Story The self-storage sector has been enjoying solid
ECONOMIC CURRENTS. Vol. 4, Issue 3. THE Introduction SOUTH FLORIDA ECONOMIC QUARTERLY
 ECONOMIC CURRENTS THE Introduction SOUTH FLORIDA ECONOMIC QUARTERLY Vol. 4, Issue 3 Economic Currents provides an overview of the South Florida regional economy. The report presents current employment,
NATIONAL ASSOCIATION of REALTORS RESEARCH DIVISION. Prepared for Florida REALTORS
 NATIONAL ASSOCIATION of REALTORS RESEARCH DIVISION Prepared for Florida REALTORS NATIONAL ASSOCIATION OF REALTORS RESEARCH DIVISION Page 1 Page 3 Page 4 Page 6 Page 7 Page 8 Page 9 Page 10 Page 11 Page
ARLA Members Survey of the Private Rented Sector
 Prepared for The Association of Residential Letting Agents ARLA Members Survey of the Private Rented Sector Second Quarter 2014 Prepared by: O M Carey Jones 5 Henshaw Lane Yeadon Leeds LS19 7RW June, 2014
University of St. Thomas Minnesota Commercial Real Estate Survey
 University of St. Thomas Minnesota Commercial Real Estate Survey December 2016 Minnesota Commercial Real Estate Outlook Showing Few Changes Following Election, says University of St Thomas Minnesota Commercial
ARLA Members Survey of the Private Rented Sector
 Prepared for The Association of Residential Letting Agents & the ARLA Group of Buy to Let Mortgage Lenders ARLA Members Survey of the Private Rented Sector Fourth Quarter 2010 Prepared by: O M Carey Jones
ECONOMIC CURRENTS. Vol. 3, Issue 1. THE SOUTH FLORIDA ECONOMIC QUARTERLY Introduction
 ECONOMIC CURRENTS THE SOUTH FLORIDA ECONOMIC QUARTERLY Introduction Economic Currents provides an overview of the South Florida regional economy. The report contains current employment, economic and real
Performance of the Private Rental Market in Northern Ireland
 Summary Research Report July - December Performance of the Private Rental Market in Northern Ireland Research Report July - December 1 Northern Ireland Rental Index: Issue No. 8 Disclaimer This report
Housing and Economy Market Trends
 Housing and Economy Market Trends Mainstreet Organization Prices of single-family, detached homes in suburban Chicago increased 12.1 percent in May 2014 compared with the same period a year ago. Overall,
REAL ESTATE SENTIMENT INDEX 1 st Quarter 2016
 About Real Estate Sentiment Index (RESI) The Real Estate Sentiment Index (RESI) is jointly developed by the Real Estate Developers Association of Singapore (REDAS) and the Department of Real Estate (DRE),
For the Reno MSA employment has historically been based largely on construction and the leisure and hospitality industry. The construction industry
 For the Reno MSA employment has historically been based largely on construction and the leisure and hospitality industry. The construction industry has lost almost 15,000 construction jobs since 2006,
2 July 2018 FNB HOUSE PRICE INDEX RESULTS FOR JUNE 2018 ACCELERATION, BUT FOR HOW LONG?
 2 July 2018 MARKET ANALYTICS AND SCENARIO FORECASTING UNIT JOHN LOOS: HOUSEHOLD AND PROPERTY SECTOR STRATEGIST 087-328 0151 john.loos@fnb.co.za THULANI LUVUNO: ANALYST 087-730 2254 thulani.luvuno@fnb.co.za
ECONOMIC CURRENTS. Vol. 3, Issue 3 SOUTH FLORIDA ECONOMIC QUARTERLY. Introduction
 ECONOMIC CURRENTS THE Introduction SOUTH FLORIDA ECONOMIC QUARTERLY Economic Currents provides an overview of the South Florida regional economy. The report presents current employment, economic and real
THE REAL ESTATE BOARD OF NEW YORK REAL ESTATE BROKER CONFIDENCE INDEX THIRD QUARTER 2016
 THE REAL ESTATE BOARD OF NEW YORK REAL ESTATE BROKER CONFIDENCE INDEX THIRD QUARTER 2016 EXECUTIVE SUMMARY REAL ESTATE BROKER CONFIDENCE INDEX THIRD QUARTER 2016 The Real Estate Board of New York s (REBNY)
2015 First Quarter Market Report
 2015 First Quarter Market Report CAAR Member Copy Expanded Edition Charlottesville Area First Quarter 2015 Highlights: Median sales price for the region was up 5.1% over Q1-2014, rising from $244,250 to
RESIDENTIAL MARKET ANALYSIS
 RESIDENTIAL MARKET ANALYSIS CLANCY TERRY RMLS Student Fellow Master of Real Estate Development Candidate Oregon and national housing markets both demonstrated shifting trends in the first quarter of 2015
2011 SECOND QUARTER RESIDENTIAL REAL ESTATE SALES REPORT Westchester and Putnam Counties, New York
 Westchester Putnam Association of REALTORS, Inc. Empire Access Multiple Listing Service, Inc. 60 South Broadway, White Plains, NY 10601 914.681.0833 Fax: 914.681.6044 www.wpar.com Putnam Office: 155 Main
Cycle Monitor Real Estate Market Cycles Third Quarter 2017 Analysis
 Cycle Monitor Real Estate Market Cycles Third Quarter 2017 Analysis Real Estate Physical Market Cycle Analysis of Five Property Types in 54 Metropolitan Statistical Areas (MSAs). Income-producing real
Single Family Sales Maine: Units
 Maine Home Connection 19 Commercial St Portland, Maine 04101 MaineHomeConnection.com Office: (207) 517-3100 Email: Info@MaineHomeConnection.com For the fourth consecutive year, Maine home sales set a new
KTI St. Petersburg Property Barometer: Real estate market professionals concluded the year 2011
 KTI St. Petersburg Property Barometer: Real estate market professionals concluded the year 2011 KTI Finland continues to study the professionals opinions on the development of the St. Petersburg property
Reveals National Economy Hurting Local Commercial Markets
 Latest SIOR Index Reveals National Economy Hurting Local Commercial Markets Lawrence Yun is Senior Vice President and Chief Economist at the NATIONAL ASSOCIATION OF REALTORS. He writes regular columns
nd Quarter Market Report
 2015 2 nd Quarter Market Report The voice of real estate in Central Virginia CAAR Member Copy Expanded Edition Charlottesville Area 2 nd Quarter 2015 Highlights: Closed sales in the Greater Charlottesville
NAB COMMERCIAL PROPERTY SURVEY Q4 2017
 EMBARGOED UNTIL 11.30 AM WEDNESDAY 21 FEBRUARY 2018 NAB COMMERCIAL PROPERTY SURVEY Q4 2017 Date February 2018 NAB Behavioural & Industry Economics KEY FINDINGS The NAB Commercial Property Index (a measure
PURDUE AGRICULTURAL ECONOMICS REPORT SEPTEMBER 2000
 PURDUE AGRICULTURAL ECONOMICS REPORT SEPTEMBER T he Purdue Land Values Survey indicates that the value of an acre of average bare Indiana cropland was $2,173 per acre in June. This was $81 more than the
CHAPTER 3. HOUSING AND ECONOMIC DEVELOPMENT
 CHAPTER 3. HOUSING AND ECONOMIC DEVELOPMENT This chapter analyzes the housing and economic development trends within the community. Analysis of state equalized value trends is useful in estimating investment
Housing Price Forecasts. Illinois and Chicago PMSA, May 2018
 Housing Price Forecasts Illinois and Chicago PMSA, May 2018 Presented To Illinois Realtors From R E A L Regional Economics Applications Laboratory, Institute of Government and Public Affairs University
1 February FNB House Price Index - Real and Nominal Growth
 1 February 2017 MARKET ANALYTICS AND SCENARIO FORECASTING UNIT JOHN LOOS: HOUSEHOLD AND PROPERTY SECTOR STRATEGIST 087-328 0151 john.loos@fnb.co.za THEO SWANEPOEL: PROPERTY MARKET ANALYST 087-328 0157
Monthly Market Snapshot
 SEPTEMBER 2018 Vacancy continues to fall. Nearing the end of the third quarter, the vacancy rate dropped 10 basis points to 6.4%, compared to this time last month at 6.5%. Occupancy of the 1.1 million
MANHATTAN MARKET REPORT
 MANHATTAN MARKET REPORT 2nd Quarter 2018 RESALE bhhsnyp.com 1 NOTE FROM THE PRESIDENT While temperatures and humidity levels have risen in New York City, consumers have continued to show apprehension this
Housing Price Forecasts. Illinois and Chicago PMSA, April 2018
 Housing Price Forecasts Illinois and Chicago PMSA, April 2018 Presented To Illinois Realtors From R E A L Regional Economics Applications Laboratory, Institute of Government and Public Affairs University
CITI HABITATS. Manhattan Residential Sales Market Report
 Manhattan Residential Sales Market Report Contents 4/7 12/17 3 8 9 10 Market Wide 4 Sales / Days on Market 5 / Months of Supply 6 7 Market Share Resale Co-ops Resale Condos New Developments 11 Luxury Neighborhoods
INLAND EMPIRE REGIONAL INTELLIGENCE REPORT
 INLAND EMPIRE REGIONAL INTELLIGENCE REPORT June 2016 EMPLOYMENT After a slow start to 2016, the Inland Empire s labor market returned to form, in recent job figures. Seasonally adjusted nonfarm employment
San Francisco Housing Market Update
 San Francisco Housing Market Update California Economic and Housing Market Outlook The national economy maintained a healthy growth rate in the first quarter of 2005 and appeared to be settling in for
University of St. Thomas Minnesota Commercial Real Estate Survey
 University of St. Thomas Minnesota Commercial Real Estate Survey December 2017 Minnesota Commercial Real Estate Outlook Remains Optimistic With Some Concerns on the Horizon The December 2017 University
Las Vegas Valley Executive Summary
 ARROYO MARKET SQUARE Las Vegas Valley Executive Summary Retail Market 4th Quarter 2013 THE DISTRICT AT GREEN VALLEY RANCH January 23, 2014 Re: Commercial Real Estate Survey: 4th Quarter, 2013 Dear Reader,
The Seattle MD Apartment Market Report
 The Seattle MD Apartment Market Report Volume 16 Issue 2, December 2016 The Nation s Crane Capital Seattle continues to experience an apartment boom which requires constant construction of new units. At
rd Quarter Market Report
 2012 3 rd Quarter Market Report The voice of real estate in Central Virginia CAAR Member Copy Expanded Edition Charlottesville Area 3 rd Quarter 2012 Highlights: Overall sales in Greater Charlottesville
LANDLORDS CAUTIOUS AHEAD OF TAX CHANGES
 FEBRUARY 2017 Q4 2016 LANDLORDS CAUTIOUS AHEAD OF TAX CHANGES Despite turbulence in the Private Rented Sector (PRS) dating back to the Government s 2015 Summer Budget, Paragon Mortgages latest PRS Trends
April 2015, Volume 24 Issue 4. Q Round Up
 April 2015, Volume 24 Issue 4 Q1 2015 Round Up Wayne Williams President, ALN Apartment Data, Inc. Wayne@alndata.com Evan Takacs Account Executive 1.800.643.6416 x 220 Evan@alndata.com Laura Reese-Williams,
Multifamily Market Commentary February 2017
 Multifamily Market Commentary February 2017 Affordable Multifamily Outlook Incremental Improvement Expected in 2017 We expect momentum in the overall multifamily sector to slow in 2017 due to elevated
The Corcoran Report 4Q16 MANHATTAN
 The Corcoran Report 4Q16 MANHATTAN Contents Fourth Quarter 2016 4/7 12/23 3 Overview 8 9 10 Market Wide 11 Luxury 24 2 Sales / Days on Market 3 Inventory / Months of Supply 4 5 Market Share Resale Co-ops
REAL ESTATE MARKET OVERVIEW 1 st Half of 2015
 REAL ESTATE MARKET OVERVIEW 1 st Half of 2015 With Comparisons to the 2 nd Half of 2014 September 4, 2015 Prepared for: First Bank of Wyoming Prepared by: Ken Markert, AICP MMI Planning 2319 Davidson Ave.
Economic Highlights. Payroll Employment Growth by State 1. Durable Goods 2. The Conference Board Consumer Confidence Index 3
 August 26, 2009 Economic Highlights Southeastern Employment Payroll Employment Growth by State 1 Manufacturing Durable Goods 2 Consumer Spending The Conference Board Consumer Confidence Index 3 Real Estate
MARKET REPORT. Manhattan Office Sector Continues Recovery as Downtown Breaks Record MANHATTAN SNAPSHOT 4.2% 0.8PP 1.98MM SF MANHATTAN OFFICE
 3Q 2014 OFFICE MANHATTAN OFFICE MARKET REPORT MANHATTAN Leasing ACTIVITY Availability RATE ABSORPTION 4.2% 0.8PP Asking RENTS 2.3% Note: Compared to 2Q 2014 Statistics 1.98MM SF Manhattan Office Sector
MarketREVIEW INSIGHT TRENDS PERSPECTIVE. Adams County, PA 2nd Quarter 2015
 MarketREVIEW INSIGHT TRENDS PERSPECTIVE Adams County, PA 2nd Quarter 2015 RESEARCH & MAPPING TABLE OF CONTENTS RETAIL MARKET REVIEW Adams County Retail Vacancy Remains Low 3 Dear Reader, This report provides
DIFI-Report. Assessment of the Real Estate Financing Market. Germany 1 st Quarter 2019 Published in February 2019
 DIFI-Report Assessment of the Real Estate Financing Market Germany 1 st Quarter 2019 Published in February 2019 New version of DIFI remains in negative territory Bricks-and-mortar retail: recovery in sight?
CONSUMER CONFIDENCE AND REAL ESTATE MARKET PERFORMANCE GO HAND-IN-HAND
 CONSUMER CONFIDENCE AND REAL ESTATE MARKET PERFORMANCE GO HAND-IN-HAND The job market, mortgage interest rates and the migration balance are often considered to be the main determinants of real estate
Q Cap Rate Report
 RESEARCH Q1 2018 CALKAIN RESEARCH 12930 Worldgate Dr Suite 150 Herndon, VA 20170 703.787.4714 calkain.com Q1 2018 Overview A counter-intuitive trend marked cap rate movement in the first quarter of 2018.
Minneapolis St. Paul Residential Real Estate Index
 University of St. Thomas Minneapolis St. Paul Residential Real Estate Index Welcome to the latest edition of the UST Minneapolis St. Paul Residential Real Estate Index. The University of St Thomas Residential
High-priced homes have a unique place in the
 Livin' Large Texas' Robust Luxury Home Market Joshua G. Roberson December 3, 218 Publication 2217 High-priced homes have a unique place in the overall housing market. Their buyer pool, home characteristics,
The Corcoran Report 3Q17 MANHATTAN
 The Corcoran Report 3Q17 MANHATTAN Contents Third Quarter 2017 4/7 12/23 3 Overview 8 9 10 Market Wide 11 Luxury 24 4 Sales / Days on Market 5 Inventory / Months of Supply 6 7 Market Share Resale Co-ops
Final 2011 Residential Property Owner Customer Survey
 TOP-LINE REPORT Final 2011 Residential Property Owner Customer Survey Prepared for: Prepared by: Malatest & Associates Ltd. CONTENTS SECTION 1: INTRODUCTION...3 1.1 Project Background... 3 1.2 Survey Objectives...
Connecticut Full Year Housing Report
 Connecticut 2014 Full Year Housing Report As 2014 Closes, Increasing Market Confidence Predicts a Solid Start to 2015 With an influx of Millennial, Gen X and Baby Boomer buyers, a strong spring market
Status of HUD-Insured (or Held) Multifamily Rental Housing in Final Report. Executive Summary. Contract: HC-5964 Task Order #7
 Multifamily Rental Housing in Final Report. Executive Summary. Contract: HC-5964 Task Order #7") Status of HUD-Insured (or Held) Multifamily Rental Housing in 1995 Final Report Executive Summary Cambridge, MA Lexington, MA Hadley, MA Bethesda, MD Washington, DC Chicago, IL Cairo, Egypt Johannesburg,
Status of HUD-Insured (or Held) Multifamily Rental Housing in 1995 Final Report Executive Summary Cambridge, MA Lexington, MA Hadley, MA Bethesda, MD Washington, DC Chicago, IL Cairo, Egypt Johannesburg,
FOR SALE $350,000 $300,000
 MEDICAL OFFICE CONDO 4123 UNIVERSITY BLVD. S, UNIT E JACKSONVILLE, FL 32216 FEATURES GREAT LOCATION CONVENIENTLY LOCATED ON UNIVERSITY BOULEVARD IN CLOSE PROXIMITY TO MEMORIAL HOSPITAL +/- 1,842 SQ. FT.
6 April 2018 KEY POINTS
 6 April 2018 MARKET ANALYTICS AND SCENARIO FORECASTING UNIT JOHN LOOS: HOUSEHOLD AND PROPERTY SECTOR STRATEGIST 087-328 0151 john.loos@fnb.co.za THULANI LUVUNO: STATISTICIAN 087-730 2254 thulani.luvuno@fnb.co.za
When valuing multitenant office properties, the income capitalization
 FEATURES Office Property DCF Assumptions: Lessons from Two Decades of Investor Surveys by Barrett A. Slade, PhD, MAI, and C. F. Sirmans, PhD When valuing multitenant office properties, the income capitalization
Economy. Denmark Market Report Q Weak economic growth. Annual real GDP growth
 Denmark Market Report Q 1 Economy Weak economic growth In 13, the economic growth in Denmark ended with a modest growth of. % after a weak fourth quarter with a decrease in the activity. So Denmark is
Peter Comitini Senior VP Associate Broker The Corcoran Group
 Sutton Area TriBeCa Upper East Side Upper West Side Washington Heights West Village Battery Park City Beekman Carnegie Hill Central Park South Chelsea Flatiron Clinton East Harlem East Village Financial
Caution: Vacancy Increases Ahead
 MARKET REPORT DISTRICT OF COLUMBIA OFFICE Fourth Quarter 2016 Caution: Vacancy Increases Ahead Market Indicators Q4 2016 2017 (Projected) NET Despite year-to-date negative absorption, the Washington, DC
Leasing strength concentrated in new assets
 MARKETVIEW Midtown Manhattan Office, Q4 216 Leasing strength concentrated in new assets Leasing Activity 4.25 MSF Net Absorption.62 MSF Availability Rate 11.8% Vacancy Rate 7.9% Average Asking Rent $8.18
Housing Price Forecasts. Illinois and Chicago PMSA, March 2019
 Housing Price Forecasts Illinois and Chicago PMSA, March 2019 Presented To Illinois Realtors From R E A L Regional Economics Applications Laboratory, Institute of Government and Public Affairs University
RP Data - Nine Rewards Consumer housing market sentiment survey Released: Thursday 24 October, 2013
 National Media Release RP Data - Nine Rewards Consumer housing market sentiment survey Released: Thursday 24 October, 2013 Housing market confidence dips in October 1,045 Australian residents respond to
Housing Price Forecasts. Illinois and Chicago PMSA, January 2019
 Housing Price Forecasts Illinois and Chicago PMSA, January 2019 Presented To Illinois Realtors From R E A L Regional Economics Applications Laboratory, Institute of Government and Public Affairs University
Manhattan New Dev. Market Report st Quarter mns.com
 Manhattan New Dev. Market Report 2013 1st Quarter TABLE OF CONTENTS Manhattan New Development Report 1Q13 TABLE OF CONTENTS 03 Introduction 04 Market Snapshot 09 Neighborhood Trends 09 Battery Park City
ARLA Survey of Residential Investment Landlords
 Prepared for The Association of Residential Letting Agents & the ARLA Group of Buy to Let Mortgage Lenders ARLA Survey of Residential Investment Landlords March 2010 Prepared by O M Carey Jones 5 Henshaw
Linkages Between Chinese and Indian Economies and American Real Estate Markets
 Linkages Between Chinese and Indian Economies and American Real Estate Markets Like everything else, the real estate market is affected by global forces. ANTHONY DOWNS IN THE 2004 presidential campaign,
Wi n t e r 2008 In this issue: Housing Market Update Affordable Housing Update Special Focus: Tracking Subsidized Housing
 www.neighborhoodinfodc.org District of Columbia Housing Monitor Wi n t e r 2008 In this issue: Housing Market Update Affordable Housing Update Special Focus: Tracking Subsidized Housing In the Spotlight
Volume II Edition I Why This is a Once in a Lifetime Opportunity for Investors
 www.arizonaforcanadians.com Volume II Edition I Why This is a Once in a Lifetime Opportunity for Investors In This Edition How to make great investment returns in a soft market U.S. Financing for Canadians
Agricultural FINANCE Monitor
 Agricultural FINANCE Monitor agricultural credit conditions in the Eighth Federal Reserve District 2014 First Quarter The eighth quarterly survey of agricultural credit conditions was conducted by the
Luxury Residences Report 2nd Half 2016
 Luxury Residences Report 2nd Half 2016 YEAR XIII No. 2 March 2017 1 Luxury Residences Report 2 nd Half 2016 Introduction Introduction and methodology 2 Luxury Residences Report 2 nd Half 2016 Introduction
REAL ESTATE SENTIMENT INDEX 2 nd Quarter 2018
 About Real Estate Sentiment Index (RESI) The Real Estate Sentiment Index (RESI) is jointly developed by the Real Estate Developers Association of Singapore (REDAS) and the Department of Real Estate (DRE),
PROPERTY BAROMETER Residential Property Affordability Review The recently improving Housing Affordability trend stalled in the 1 st quarter of 2017
 21 June 2017 MARKET ANALYTICS AND SCENARIO FORECASTING UNIT JOHN LOOS: HOUSEHOLD AND PROPERTY SECTOR STRATEGIST FNB HOME LOANS 087-328 0151 john.loos@fnb.co.za LIZE ERASMUS: STATISTICIAN 087-335 6664 lize.erasmus@@fnb.co.za
Office Market Continues to Improve
 Research & Forecast Report LAS VEGAS OFFICE Q3 2016 Office Market Continues to Improve > > Southern Nevada s office market is improving at a steady rate > > Net absorption has been positive in twelve of
HOME Survey. Housing Opportunities and Market Experience. June National Association of REALTORS Research Group
 HOME Survey Housing Opportunities and Market Experience June 2018 National Association of REALTORS Research Group Introduction The Housing Opportunities and Market Experience (HOME) report was created
3 November rd QUARTER FNB SEGMENT HOUSE PRICE REVIEW. Affordability of housing
 3 November 2011 3 rd QUARTER FNB SEGMENT HOUSE PRICE REVIEW JOHN LOOS: HOUSEHOLD AND PROPERTY SECTOR STRATEGIST 011-6490125 John.loos@fnb.co.za EWALD KELLERMAN: PROPERTY MARKET ANALYST 011-6320021 ekellerman@fnb.co.za
FY General Revenue Forecast Presentation
 FY 2015-2019 General Revenue Forecast Presentation Steven A. Solomon Director of Finance February 18, 2014 Overview Current Economic Outlook National State Local FY 2014 2nd Quarter Revenue Update Five
POLAND BELGIUM LUXEMBOURG FRANCE PUSHING THE BOUNDARIES
 BELGIUM POLAND FRANCE LUXEMBOURG PUSHING THE BOUNDARIES ANNUAL REPORT 2017 MARKET ANALYSIS: BELGIUM I. OFFICE MARKET IN BELGIUM A. BRUSSELS 2017 was an interesting and pivotal year for the Brussels office
February 2016 Loudoun County Market Trends Report Contracts and sales activity jump double-digits; Inventories down 15.5 percent
 FOR IMMEDIATE RELEASE Contact: Christine Windle 703-777-2468, cwindle@dullesarea.com Sponsored by: Access National Bank Tom Ciolkosz, (703) 871-1045, tciolkosz@accessnationalbank.com Patty Foster, 703-871-1014,
Housing Price Forecasts. Illinois and Chicago PMSA, August 2016
 Housing Price Forecasts Illinois and Chicago PMSA, August 2016 Presented To Illinois Association of Realtors From R E A L Regional Economics Applications Laboratory, Institute of Government and Public
NOVEMBER 2018 Harrisonburg & Rockingham County Real Estate Market Report
 NOVEMBER 218 Real Estate Market Report An analysis of real estate activity through October 31, 218 provided courtesy of Scott P. Rogers, Funkhouser Real Estate Group Custom-Built Highland Park Home with
Key Findings on the Affordability of Rental Housing from New York City s Housing and Vacancy Survey 2008
 Furman Center for real estate & urban policy New York University school of law n wagner school of public service 110 West 3rd Street, Suite 209, New York, NY 10012 n Tel: (212) 998-6713 n www.furmancenter.org
Residential Commentary Sydney Apartment Market
 Residential Commentary Sydney Apartment Market April 2017 Executive Summary Sydney Apartment Market: Key Indicators 14,200 units are currently under construction in Inner Sydney with completion expected
Housing Price Forecasts. Illinois and Chicago PMSA, January 2018
 Housing Price Forecasts Illinois and Chicago PMSA, January 2018 Presented To Illinois Realtors From R E A L Regional Economics Applications Laboratory, Institute of Government and Public Affairs University
Minneapolis St. Paul Residential Real Estate Index
 University of St. Thomas Minneapolis St. Paul Residential Real Estate Index Welcome to the latest edition of the UST Minneapolis St. Paul Residential Real Estate Index. The University of St Thomas Residential
Residential September 2010
 Residential September 2010 Karl L. Guntermann Fred E. Taylor Professor of Real Estate Adam Nowak Research Associate For the first time since March, house prices turned down slightly in August (-2 percent)
Hamilton Heights Manhattan. Morningside Heights Harlem
 Sutton Area TriBeCa Upper East Side Upper West Side Washington Heights West Village The Corcoran Report Battery Park City Beekman Carnegie Hill Central Park South Chelsea Flatiron Clinton East Harlem East
Housing Price Forecasts. Illinois and Chicago PMSA, March 2017
 Housing Price Forecasts Illinois and Chicago PMSA, March 2017 Presented To Illinois Realtors From R E A L Regional Economics Applications Laboratory, Institute of Government and Public Affairs University
FRBSF Economic Letter
 FRBSF Economic Letter 2017-14 May 15, 2017 Research from the Federal Reserve Bank of San Francisco Constructing the Home Purchase Sentiment Index James A. Wilcox Consumer attitudes about buying and selling
Housing Price Forecasts. Illinois and Chicago PMSA, September 2016
 Housing Price Forecasts Illinois and Chicago PMSA, September 2016 Presented To Illinois Realtors From R E A L Regional Economics Applications Laboratory, Institute of Government and Public Affairs University
Mueller. Real Estate Market Cycle Monitor Second Quarter 2018 Analysis
 Mueller Real Estate Market Cycle Monitor Second Quarter 2018 Analysis Real Estate Market Cycle analysis of 5 property types in 54 Metropolitan Statistical Areas (MSAs). Graphic Clarification! Point 11
CAAR Market Report 2010 First Quarter Published by the Charlottesville Area Association of REALTORS
 CAAR Market Report 2010 First Quarter Published by the Charlottesville Area Association of REALTORS Where Are We Now? In the first quarter of 2010, the Charlottesville real estate market continued the
1Q18 TOWN OF PALM BEACH & BARRIER ISLANDS The Corcoran Report
 1Q18 TOWN OF PALM BEACH & BARRIER ISLANDS The Corcoran Report 353 El Brillo Way web# 5339190 on corcoran.com Town of Palm Beach $6.425M $4.075M 46 +31% -1% +8% $1.018M 125-15% +18% $540K +46% 1Q18 Corcoran