A Comparative Analysis of Land Values Within and Adjacent to the Niagara Escarpment Plan Area Dufferin County, Ontario
|
|
|
- Tracy Nicholson
- 5 years ago
- Views:
Transcription
1 A Comparative Analysis of Land Values Within and Adjacent to the Niagara Escarpment Plan Area Dufferin County, Ontario July 2003 Prepared by: Alan Ernest, M.A. 381 Carlisle Road Carlisle, Ontario L0R 1H1 (905) For: Niagara Escarpment Foundation and the Coalition on the Niagara Escarpment P.O. Box 389 Acton, Ontario L7J 2M6 (519)
2 Background The impact of provincial land use controls on real estate values along the Niagara Escarpment has long been a matter of interest and concern. With the first proposals to create special planning controls along the Niagara Escarpment, some landowners claimed that the imposition of such controls would devalue their properties, leading to what some called expropriation without compensation. These concerns were based on the premise that the more restrictive controls on land use and lot creation along the Niagara Escarpment would depress the market for lands in the area, thereby reducing sale prices. In 1980, the Province of Ontario commissioned three studies aimed at determining whether the land use controls instituted under the Niagara Escarpment Planning and Development Act and related regulations had had an adverse affect on property values for lands subject to these controls. These studies, which were undertaken by three professional real estate appraisers, each examined a different part of the escarpment. The study areas were: the Township of Mono in Dufferin County; the Township of Nottawasaga in Simcoe County (now part of the Township of Clearview); and, the Township of Keppel in Grey County (now part of the Township of Georgian Bluffs). These studies are listed in the addenda of this report. The basic design of the studies was to look at property transactions located within the portion of the Niagara Escarpment Planning Area that was subject to development control. This data was compared with sales of similar properties outside the Niagara Escarpment Planning Area; located either in the same municipality or nearby municipalities with similar characteristics. Separate comparisons were undertaken for three different kinds of properties: agricultural properties, estate residential properties and recreational (cottage or chalet) properties. The time period examined was from February 24, 1974 (the date that the Planning area boundaries were defined) to February 29, The Mono Township study also looked at data from 1972 and All three studies acknowledged that real estate values tended to be somewhat higher within the Niagara Escarpment Planning Area, and took this factor into consideration in their analysis and conclusions. While the methodologies employed in the three studies varied somewhat, the results and conclusions of the three studies were fairly consistent. The Keppel and Nottawasaga studies concluded that Niagara Escarpment land use controls had no negative impact on real estate values for agricultural, estate residential or recreational properties. The Mono Township studyalso found no evidence that property values had declined as a result of Niagara escarpment land use controls. A drop in the number of sales during 1974 & 1975 was noted for the area under development control, although not a drop in average 2
3 sale prices, and attributed part of this reduction in sales volume to a short-term impact of Niagara Escarpment land use controls. It also concluded that prices for vacant estate residential properties within the Niagara Escarpment Planning Area probably increased less than they would without development controls. On the other hand, this Mono Township study also found that prices for estate residential properties with residences and agricultural properties rose faster within the area under development control than outside the planning area during the study period. There are two aspects of the methodologies of the three 1980 studies that might call into question the conclusions reached in the studies. First, the studies examined both improved and unimproved properties. While efforts were made to adjust for the quality of the improvements, such adjustments were subjective and it can be argued that these approximations introduced a variable into the analysis that may have reduced the reliability of the results. Second, the parts of the study area outside the Niagara Escarpment Planning Area, were all, to varying degrees, less aesthetically appealing than the portions of the study areas within the Niagara Escarpment Planning Area. This variable may also have reduced the reliability of the results of these studies. Despite the fact that all three of the 1980 studies concluded that there had been little if any impact on land values as a result of Niagara Escarpment land use controls, not all agreed with these conclusions. Concerns about Niagara Escarpment land use controls negatively impacting real estate values continued to be voiced throughout the hearings on the Proposed Niagara Escarpment Plan and are still heard today, some 18 years after the approval of the Niagara Escarpment Plan (NEP). Purpose The purpose of this study is to determine if inclusion within the Niagara Escarpment Plan Area* (NEPA) influences real estate values. More specifically, this study will seek to ascertain whether lands within the NEPA have sold, on average, at higher, equal, or lower prices when compared to similar properties located nearby, but outside the NEPA. Finally, if differences in average sale prices are observed, are such differences statistically significant or could they be attributed to chance factors? *It is important to distinguish between the Niagara Escarpment Planning Area and the Niagara Escarpment Plan Area (NEPA). The Planning Area was established in 1974, essentially as a study area, within which controls to protect the escarpment landscape could be developed. The Plan Area is a much smaller area in which the Niagara Escarpment Plan (approved in 1985) has effect. The Plan Area generally coincides with the area under Niagara Escarpment Development Control, where Niagara Escarpment Development Permits are required for changes in land use. 3
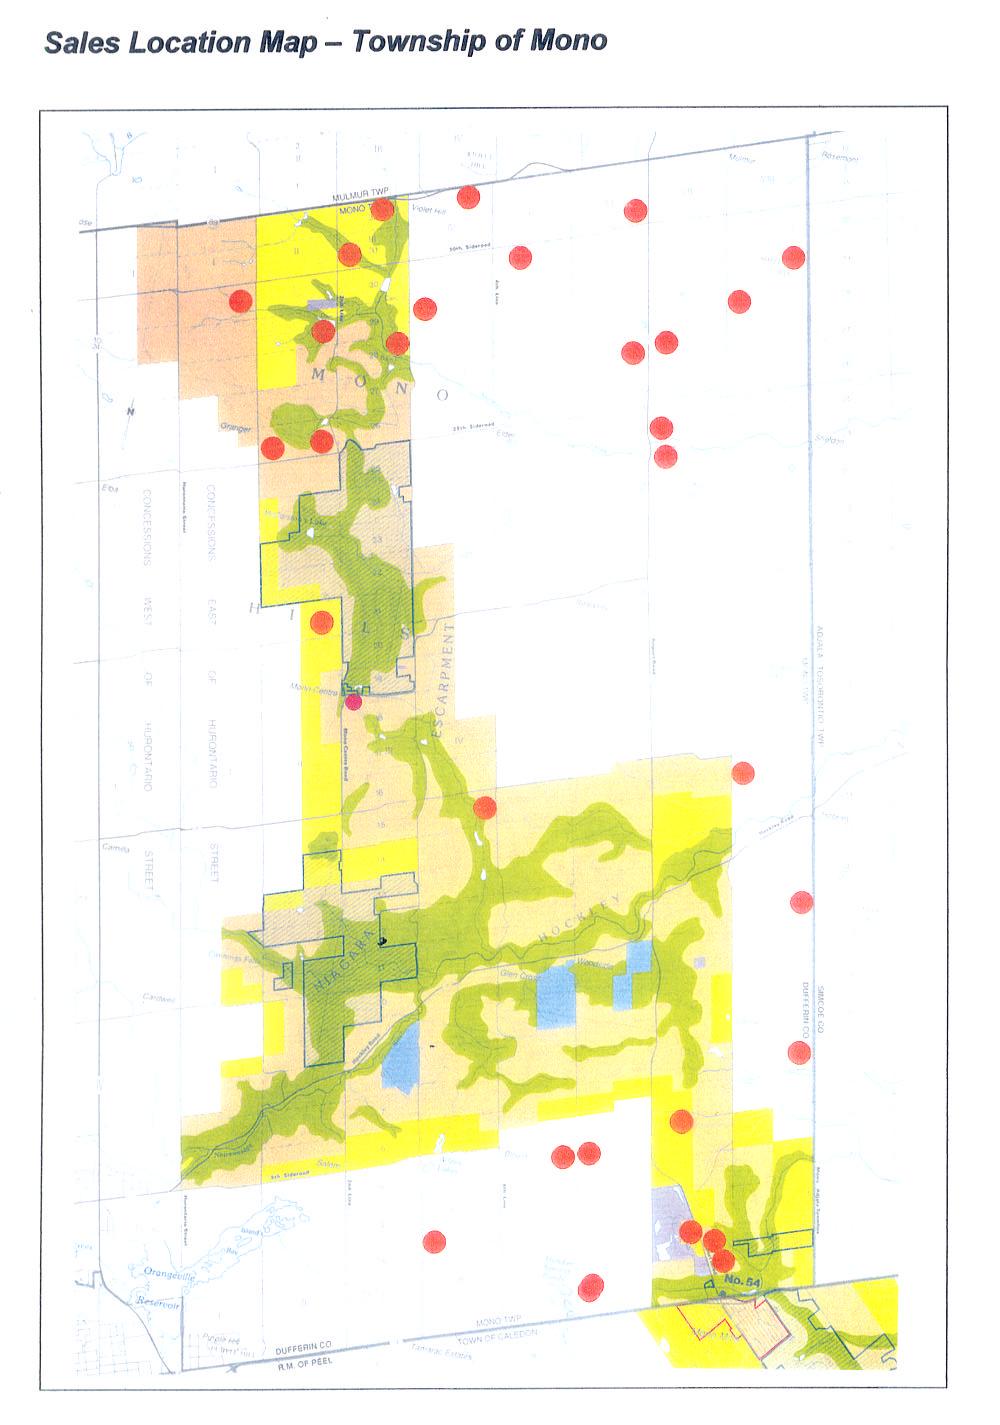
4 Methodology Like the 1980 studies, this study employed appraisal techniques to undertake a comparative analysis of property sales within, and outside but nearby, the NEPA. Ensuring that the sales examined within and outside the NEPA were truly comparable was integral to achieving the study s purpose. In addition, it was important to ensure that a large enough sample of sales was examined to ensure statistically valid results. The methodology is largely based on the Direct Comparison Approach as defined under the Canadian Uniform Standards of Appraisal Practice. The Direct Comparison Approach is normally used to estimate the value of a single property. It involves the comparison of a subject property with similar properties that recently sold, or listed for sale. The comparable sales are adjusted for time and other relevant factors to provide an indication of the value of the subject lands. The approach examines the action of buyers and sellers in the market place. This study will apply the techniques used in the direct comparison approach to analyse what, if any, difference in land values exists between areas within the NEPA and adjacent lands outside the NEPA. Study Areas In order to provide a valid basis for comparison it was necessary to identify study areas where lands within the NEPA and adjacent areas outside the NEPA have similar landscape characteristics, physical constraints, access, proximity to urban centers and aesthetic appeal. Along most of the escarpment, lands within the NEPA tend to have a higher average aesthetic appeal than nearby land outside the NEPA, so selection of study locations was critical. Two potential study areas were identified: 1) The first proposed Study Area is within the Townships Mono and Mulmur, in Dufferin County, where sales within the NEPA will be contrasted with sales in the portions of these townships east of the NEPA and a small part of Mono Township south of the NEPA. The portions of the study area located outside the NEPA are located where the western end of the Oak Ridges Moraine meets the Niagara Escarpment - for those lands east of the NEPA; or, within the Orangeville Moraine - for those lands south of the NEPA. The landscape in these areas is characterized by rolling hills with frequent vistas and broad river valleys and is very similar to the portions of these townships within the NEPA. There are no actual exposed escarpment outcroppings outside of public lands in Mono and Mulmur Townships. The following map shows the location of this study area. 4
5
6 2) The area south and east of Owen Sound in Grey County, including portions of the geographic townships of Holland, Sydenham, St. Vincent and Euphrasia. The lands outside the NEPA within this study area include drumlin fields, rolling landscapes with broad valleys and former beach ridges of glacial Lakes Algonquin and Nipissing from which there are views of Georgian Bay. There are relatively few cliff faces within this part of the NEPA and most are publicly owned. Boundaries for the proposed study areas were established based on my personal knowledge of the landscape gained through almost 20 years involvement in land use planning and real estate appraisals along the Niagara Escarpment. The boundaries of the study areas were set prior to reviewing or analysing any data on property sales. As a result of the need for a sufficiently large sample, it was not possible to proceed with the analysis of sales within the proposed study area located south and east of Owen Sound. Only 26 qualifying vacant land sales were identified within this area between January 1, 1999 and June 1, Of these, only 7 were located within the NEPA. Property Types Only vacant land sales were examined. Properties that were marketed or classed as vacant, but which actually contained modest improvements such as garages, workshops, cabins or any other site improvements of more than nominal value were also excluded from the analysis. The decision to analyse only vacant properties was made to avoid the need to make subjective adjustments to account for differences in the value of improvements. Given the large number of sales of improved properties and the impracticality of trying to conduct a detailed review of the improvements on each sale, such adjustments would be rough estimates at best. Having to adjust for the value of improvements would reduce the reliability of the data and potentially introduce biases. Study Period The study period was set as January 1, 1999 to June 1, Excellent data was available for this time period. Ultimately the study period was extended to include 1998 sales, in order to provide a larger sample. 6
7 Data Sources Using Real Estate Board and registry office sources along with my own files, compiled through dozens of appraisal reports completed along the Niagara Escarpment in the past 5 years, information on almost all sales of vacant land within the two study areas was collected. This information included real estate listings for all of the property sales utilized in the study. As part of my data review, I examined the comments contained within each of the listings to see if these might provide indicators that could help explain potential differences in land values within and outside the NEPA.. Qualifying Characteristics Fundamental to the concept of value is Highest and Best Use. This may be defined as: That use of a property that would most likely produce the greatest net return over a given period. The term net return is not limited to monetary advantage but may be in the form of amenities. For any comparison between properties or sets of properties to be valid, it is essential that the properties have similar Highest and Best Uses. Accordingly, I eliminated properties that by virtue of their zoning or designations were part of minor urban centres or otherwise eligible for subdivision or intensive development. Properties zoned for intensive recreational use or aggregate extraction were also excluded from the analysis. Within the NEPA, only properties designated Escarpment Natural Area, Escarpment Protection Area or Escarpment Rural Area were included in the analysis. Similarly, only properties located within Agricultural, Rural or Conservation Management zones of the Municipal Zoning By-Laws were included in the data set of properties outside the NEPA. I also decided to exclude properties that lacked year-round open road frontage or that were comprised almost entirely of wetland or steep slopes, since such properties might not be developable, or, if developed, would have higher development costs which would be reflected in their sale prices (in the end no sales of such properties were found). One sale, involving a property that was located in a depression that was part of a former gravel pit, was also excluded, due to clearly inferior site characteristics. 7
8 Location I analysed sale prices throughout the study area to determine if adjustments for location within the study areas was required. This analysis showed that within the NEPA property values throughout the northern half of Mono Township and all of Mulmur Township were fairly consistent for similar sized properties. The same was true for property values outside the NEPA located in the northern half of Mono Township and all of Mulmur Township. However, within the southern half of Mono Township, an area known as the Hockley Valley, property values both within and outside the NEPA were significantly higher than in the rest of the study area. This fact came as no surprise, given the high aesthetic appeal of this part of the study area and its closer proximity to the Greater Toronto Area. The number of sales located in the southern half of Mulmur Township was not evenly distributed between areas within and outside the NEPA. For this reason, I chose to divide the study area into two sections and analyse sales within the southern half of Mono Township separately, rather than try and adjust for location. This avoided the possibility that errors in adjusting for location might influence study results. Sample Size To ensure that the sample size was statistically valid, a goal of a total of 100 sales, split reasonably evenly between the areas within and outside the NEPA. A minimum of twelve sales (at least six within the NEPA and six outside) was set for each property size range analysed, so that no single sale would have an unduly large influence on the results within any size range. Size Ranges Once the data had been collected, it was necessary to divide it into subsets so that properties of similar size could be compared to one another. The size ranges established were as follows: 5 to acres 15 to acres Over 50 acres In both North Mono/Mulmur and South Mono there were insufficient numbers of sales under 5 acres in size to conduct analyses of sales in that size range. In South Mono there were also insufficient sales of properties between 15 and acres and over 50 acres. 8
9 s Following standard appraisal practice, it was necessary to adjust for significant differences between the sales considered in the analysis. The study methodology eliminated the need to make adjustments for factors such as improvements, zoning or access. The division of the study area into two sections, as discussed above, eliminated the need to adjust sales for location. The selection of a study area where the lands outside the NEPA have similar aesthetic appeal to those within the NEPA, was critical to the methodology. This choice eliminated the need to make subjective adjustments for the relative aesthetic appeal of each of the property sales analysed. I conducted roadside inspections and reviewed topographic mapping of each of the sales, to try and determine if there was any significant difference between the average aesthetic appeal and site utility of the sales inside the NEPA compared to those outside. My subjective conclusion was that there was no significant difference between the average level of aesthetic appeal or site utility of the sales located inside the NEPA and those located outside the NEPA. Hence, adjustments for aesthetic appeal and site utility were not required. s were required for both the time of the each sale and the size of each property. These adjustments are detailed below. Time Because the sales analysed occurred over a 65 month study period, during which vacant land property values increased significantly, it was necessary to adjust historic sales upwards for time to reflect current (June 1, 2003) land values. Appropriate adjustments for time were established through analysis of the vacant land sales data, including properties that sold twice during the study period, and through consultations with real estate professional active in the local market. The following upward adjustments for time were indicated: January 1, 2000 to June 1, 2003: 12% per annum or 1% per month January 1, 1999 to Dec. 31, 1999: 9% per annum or.75% per month January 1, 1998 to Dec. 31, 1998: 6% per annum or.5% per month These time adjustments are approximations and may lead to some distortion of the true current values indicated by historic sales. However, because the distribution of sales over time was fairly similar within and outside the NEPA, inaccuracies in the time 9
10 adjustments will have a similar affect on both data sets and should not significantly limit the validity of the comparison of sales within and outside the NEPA. Time adjustments were made to each sale on a percentage basis as outlined above to arrive at a time adjusted sale price. These adjustments are shown on the sales charts contained within the Results section of this report. Property Size To adjust for property size variations within each of the size ranges, I analysed sale prices for all properties within the size range to determine the appropriate adjustments for size differences within the size range. A benchmark size was established for each size range and per acre adjustments were made to each sale based on the variation in size from the benchmark. The benchmarks and per acre adjustments for each size range were as follows: North Mono/Mulmur Size Range Benchmark Size per acre per acre above Benchmark below Benchmark 5 to acres 10 acres -$3,000 +$5, to acres 30 acres -$2,000 +$2, acres and over 50 acres -$1,500 Not applicable South Mono Size Range Benchmark Size per acre per acre above Benchmark below Benchmark 5 to acres 10 acres -$4,000 +$6,000 s for size were made to the time adjusted sale price of each sale to arrive at a final adjusted sale price. Results A total of 105 property sales met the criteria for inclusion within the study and fit within a size range that had sufficient sales to provide meaningful results. 44 of these sales were within the NEPA and 61 were outside it. While there were clusters of sales, both inside and outside the NEPA, on the whole, sales were reasonably well distributed across the study area. 10
11 As discussed in the Methodology section under Size Ranges, there were insufficient numbers of sales under 5 acres in size to conduct analyses of sales in that size range. In South Mono there were also insufficient sales of properties between 15 and acres and over 50 acres to conduct analysis for those size ranges. Analysis was performed for one size range in South Mono and for three size ranges in North Mono/Mulmur. Charts with details on the sales analysed and adjustments for time and size are included on the following pages. Maps showing the spatial distribution of the sales follow the charts. The real estate listings for each of the sales utilized in the study were examined for any comments that might indicate positive or negative attitudes towards properties located within or outside the NEPA. 10 listings (including one for a property just outside the NEPA) comment positively on a property s proximity to the Bruce Trail (which is entirely inside the NEPA within the study area). Similarly, 9 listings (including one for a property just outside the NEPA) note that the properties were close to public parkland within the Niagara Escarpment Parks and Open Space System. 17 listings mention that the property was within the NEPA, or that Niagara Escarpment Commission development permits were either in place or available. Most of these comments are simply factual information, but two are notable in that they had appeared to have a positive outlook on Niagara Escarpment land use controls. They read: Located within NEC jurisdiction for added protection. and Protected by the Niagara Escarpment. Listings of lands outside the NEPA mentioned being near the Dufferin County Forest, or parks or conservation areas outside the Niagara Escarpment Parks and Open Space System five times. Twice listings for properties mentioned that the properties were outside the NEPA, presumably viewing the absence of the extra layer of land use controls as a positive. 11
12 North Mono/Mulmur Sales - 5 to Acres, Outside NEPA Sale # Lot Concession Township Sale Date Acres Time Time Adjusted Size Final Adjusted EHS Mulmur 15/06/ $71, % $107,565 $0 $107, EHS Mulmur 29/03/ $59, % $87,202 $0 $87, EHS Mulmur 31/05/ $70, % $102,410 $0 $102, EHS Mulmur 24/03/ $74, % $110,260 $0 $110, EHS Mulmur 16/06/ $56, % $81,704 $13,500 $95, EHS Mulmur 20/03/ $68, % $94,044 $11,500 $105, EHS Mono 16/06/ $64, % $87,398 $19,000 $106, EHS Mulmur 01/12/ $53, % $68,900 $23,500 $92, EHS Mulmur 23/04/ $55, % $68,915 $24,500 $93, EHS Mulmur 11/05/ $49, % $61,727 $24,500 $86, EHS Mulmur 24/08/ $68, % $82,416 $24,000 $106, & 5 8 EHS Mulmur 31/05/ $99, % $122,760 $15,000 $137, EHS Mulmur 30/11/ $55, % $64,900 $24,500 $89, EHS Mulmur 17/10/ $53, % $63,282 $25,000 $88, EHS Mulmur 28/12/ $55, % $64,405 $25,000 $89, EHS Mulmur 07/12/ $69, % $82,272 $25,000 $107, EHS Mulmur 04/07/ $70, % $86,030 $15,000 $101, EHS Mulmur 31/10/ $73, % $86,870 -$12,000 $74, EHS Mulmur 22/05/ $64, % $71,808 $7,500 $79, EHS Mulmur 15/03/ $69, % $78,315 $23,000 $101, EHS Mulmur 07/03/ $84, % $95,172 -$14,100 $81, EHS Mono 31/05/ $89, % $99,680 $6,500 $106, EHS Mulmur 02/12/ $110, % $116,600 $2,500 $119,100 Averages 7.68 $68,670 $86,288 $98,610
13 North Mono/Mulmur Sales - 5 to Acres, Inside NEPA Sale # Lot Concession Township Sale Date Acres Time Time Adjusted Size Final Adjusted EHS Mulmur 29/05/ $100, % $154,770 -$2,100 $152, EHS Mulmur 26/02/ $120, % $175,560 $0 $175, EHS Mulmur 30/11/ $90, % $127,620 -$12,000 $115, EHS Mono 14/03/ $114, % $159,030 -$13,200 $145, EHS Mono 20/10/ $47, % $61,711 $0 $61, EHS Mulmur 30/08/ $68, % $90,440 $25,000 $115, EHS Mono 27/08/ $55, % $66,605 $0 $66, WHS Mulmur 15/07/ $88, % $97,240 -$5,700 $91, WHS Mulmur 30/04/ $97, % $97,970 -$12,000 $85,970 Averages $86,611 $114,550 $112,327
14 South Mono Sales - 5 to Acres, Outside NEPA Sale # Lot Concession Township Sale Date Acres Time Time Adjusted Size Final Adjusted EHS Mono 31/05/ $84, % $122,892 $0 $122, EHS Mono 15/04/ $140, % $207,340 $0 $207, EHS Mono 29/06/ $95, % $128,345 $0 $128, EHS Mono 26/01/ $164, % $210,248 -$6,400 $203, EHS Mono 29/08/ $104, % $114,010 $0 $114, EHS Mono 08/10/ $160, % $172,320 -$14,000 $158, EHS Mono 17/12/ $100, % $141,300 $0 $141,300 Averages $121,071 $156,636 $153,722 South Mono Sales - 5 to Acres, Inside NEPA Sale # Lot Concession Township Sale Date Acres Time Time Adjusted Size Final Adjusted EHS Mono 18/12/ $115, % $172,730 $0 $172, & 2 7 EHS Mono 22/10/ $120, % $172,310 $0 $172, EHS Mono 20/04/ $127, % $174,879 $0 $174, EHS Mono 08/01/ $100, % $129,444 -$1,200 $128, EHS Mono 01/05/ $158, % $178,540 $12,000 $190, EHS Mono 02/08/ $156, % $171,600 -$13,200 $158,400 Averages $129,542 $166,584 $166,184
15 North Mono/Mulmur Sales -15 to Acres, Outside NEPA Sale # Lot Concession Township Sale Date Acres Time Time Adjusted Size Final Adjusted EHS Mulmur 01/12/ $71, % $106,855 $12,500 $119, EHS Mulmur 27/10/ $72, % $108,792 -$6,000 $102, EHS Mulmur 22/10/ $75, % $113,400 -$6,000 $107, EHS Mono 02/09/ $79, % $120,080 $17,000 $137, EHS Mulmur 30/09/ $115, % $174,225 -$14,200 $160, EHS Mulmur 24/06/ $136, % $198,152 $1,500 $199, EHS Mulmur 28/05/ $99, % $144,837 -$36,000 $108, EHS Mulmur 16/05/ $125, % $170,625 $35,500 $206, EHS Mulmur 21/09/ $77, % $102,533 $13,750 $116, EHS Mulmur 15/12/ $110, % $142,450 $24,000 $166, EHS Mulmur 28/07/ $76, % $101,916 -$24,000 $77, EHS Mulmur 07/04/ $117, % $161,915 -$28,000 $133, EHS Mono 07/12/ $127, % $149,606 -$20,000 $129, EHS Mulmur 09/03/ $90, % $114,030 $25,000 $139, EHS Mulmur 25/07/ $115, % $141,141 $17,500 $158, EHS Mulmur 31/08/ $125, % $151,250 $7,500 $158, EHS Mulmur 09/05/ $89, % $96,743 $35,000 $131, EHS Mulmur 09/04/ $164, % $166,788 $17,500 $184, EHS Mulmur 20/11/ $170, % $180,710 $14,500 $195, EHS Mulmur 15/05/ $175, % $217,475 -$32,800 $184,675 Averages $110,425 $143,176 $145,889
16 North Mono/Mulmur Sales -15 to Acres, Inside NEPA Sale # Lot Concession Township Sale Date Acres Time Time Adjusted Size Final Adjusted EHS Mono 31/07/ $106, % $161,650 -$2,000 $159, EHS Mono 26/02/ $124, % $192,324 -$36,000 $156, EHS Mono 22/03/ $129, % $192,252 -$23,000 $169, EHS Mulmur 05/11/ $85, % $121,040 $12,500 $133, EHS Mulmur 30/09/ $98, % $140,434 -$36,800 $103, WHS Mulmur 04/07/ $82, % $111,293 $29,250 $140, EHS Mulmur 12/07/ $145, % $195,170 -$14,000 $181, WHS Mulmur 30/10/ $100, % $131,000 $29,250 $160, WHS Mulmur 30/11/ $135, % $175,500 -$17,000 $158, EHS Mulmur 15/03/ $155, % $196,075 -$16,000 $180, EHS Mono 24/05/ $130, % $145,860 $12,500 $158, EHS Mono 16/09/ $159, % $172,515 $29,500 $202, EHS Mono 01/04/ $185, % $210,900 -$18,800 $192, EHS Mono 01/09/ $180, % $196,200 -$400 $195,800 Averages $129,600 $167,301 $163,658
17 North Mono/Mulmur Sales Acres, Outside NEPA Sale # Lot Concession Township Sale Date Acres Time Time Adjusted Size Final Adjusted EHS Mulmur 28/02/ $155, % $241,413 -$73,500 $167, EHS Mulmur 28/02/ $116, % $172,260 $0 $172, EHS Mulmur 29/10/ $105, % $149,625 $0 $149, EHS Mulmur 30/11/ $139, % $197,102 -$15,600 $181, EHS Mulmur 31/03/ $125, % $200,160 -$60,000 $140, EHS Mulmur 01/03/ $155, % $231,289 -$73,500 $157, EHS Mulmur 15/03/ $130, % $163,150 -$18,150 $145, EHS Mono 24/09/ $145, % $174,290 -$25,350 $148, EHS Mono 14/05/ $250, % $311,250 -$75,000 $236, EHS Mono 02/01/ $184, % $193,200 -$32,400 $160, EHS Mono 20/12/ $170, % $179,010 -$63,000 $116,010 Averages $152,318 $210,159 $161,477
18 North Mono/Mulmur Sales Acres, Inside NEPA Sale # Lot Concession Township Sale Date Acres Time Time Adjusted Size Final Adjusted EHS Mulmur 29/05/ $145, % $222,575 -$600 $221, EHS Mono 05/09/ $330, % $499,620 -$145,500 $354, EHS Mulmur 14/07/ $120, % $175,080 $0 $175, EHS Mulmur 31/03/ $125, % $184,750 -$60,000 $124, EHS Mulmur 28/05/ $174, % $254,388 $0 $254, EHS Mulmur 28/04/ $187, % $257,063 -$1,650 $255, WHS Mulmur 02/01/ $115, % $148,350 $0 $148, WHS Mulmur 30/11/ $150, % $195,000 $0 $195, WHS Mulmur 02/01/ $135, % $174,150 $0 $174, EHS Mulmur 06/03/ $235, % $326,180 -$71,550 $254, EHS Mulmur 14/06/ $265, % $327,275 -$8,850 $318, WHS Mulmur 15/08/ $150, % $182,250 $0 $182, WHS Mulmur 15/08/ $150, % $182,250 $0 $182, EHS Mulmur 15/03/ $185, % $234,025 $0 $234, EHS Mulmur 01/11/ $115, % $123,050 -$1,500 $121,550 Averages $172,100 $232,400 $213,090

19
20
21 Analysis North Mono/Mulmur - 5 to acres Sales 1 to 23 are 5 to acre parcels located outside the NEPA in the north half of Mono Township or in Mulmur Township. This is the largest group of sales within any category. The average (mean) adjusted sale price of these sales is $98,610, while the median of the adjusted sale prices is $101,030. The range in adjusted sale prices is $74,870 to $137,760. The distribution of adjusted sale prices around the mean values is normal; with 13 sales having adjusted prices within 10% of the mean value, 7 sales between 10% and 20% different from the mean, and 3 sales more than 20% different from the mean. This data set displayed no unusual characteristics that might call its reliability into question. Sales 24 to 32 are 5 to acre parcels located inside the NEPA in the north half of Mono Township or in Mulmur Township. The average (mean) adjusted sale price is $112,327, while the averaged median of the adjusted sale prices is $103,490. The range in adjusted sale prices is from a low of $61,711 to a high of $175,560. The distribution of adjusted sale prices around the mean values is fairly balanced, but with a wider range and fewer sales at values close to the mean than would normally be expected. Only 2 sales are within 10% of the mean and another 2 fall between 10 and 20% from the mean. This is likely due largely to the relatively small number of sales within this group. Since the distribution of values around the mean is balanced, the wide range of sale values has not skewed the mean value, which is considered reliable. The sales within the NEPA had a mean adjusted sale price that was 13.9% higher than those outside the NEPA. This difference is considered significant. South Mono - 5 to acres Sales 33 to 39 are 5 to acre parcels located outside the NEPA in the south half of Mono Township. There are seven sales in this category. The average (mean) adjusted sale price of these sales is $153,722, while the median of the adjusted sale prices is $141,300. The range in adjusted sale prices is $114,010 to $207,340. The range is relatively wide; with 2 sales having adjusted prices within 10% of the mean value, 1 sale between 10% and 20% different from the mean, and 4 sales more than 20% different from the mean. Notwithstanding this wide range, the distribution of adjusted sale prices around the mean values is balanced and the mean is not distorted by sales at either extreme end of the range. 21
22 Sales 40 to 45 are 5 to acre parcels located inside the NEPA in the south half of Mono Township. There are six sales within this category. The average (mean) adjusted sale price is $166,184, while the averaged median of the adjusted sale prices is $172, 520. The range in adjusted sale prices is from $128,244 to a high of $190,540. The adjusted sale prices of all but one of the sales are within 15% of the mean and median values. Sale 43 had the lowest adjusted sale price by more than $30,000. This sale significantly lowered the mean adjusted sale price. The location of Sale 43, immediately south of a licensed gravel pit, is the primary reason for this lower price. None of the other sales inside or outside the NEPA had this particular locational disadvantage. I considered excluding this sale from the analysis, but in the end chose to retain it and explain the impact its inclusion has on the results. Had Sale 43 been excluded, the mean adjusted sale price would have been $173,772 and the median $172,730. Since the distribution of values around the mean is balanced, the wide range of sale values has not skewed the mean value, which is considered reliable. Even with the inclusion of Sale 43 the mean adjusted sale price within the NEPA is still 8.1% higher than that of the sales outside the NEPA. With Sale 43 excluded, the mean adjusted sale price for properties within the NEPA is 13.0% higher than for properties outside the NEPA. Both these results appear to be significant, although this cannot be stated with certainty due to the relatively low number of sales in this category. North Mono/Mulmur - 15 to acres Sales 46 to 65 are 15 to acre parcels located outside the NEPA in the north half of Mono Township or in Mulmur Township. This is the second largest group of sales (20) within any category. The average (mean) adjusted sale price of these sales is $145,889, while the averaged median of the adjusted sale prices is $138,065. The range of the adjusted sale prices is $77,916 to $206,125. The distribution of adjusted sale prices around the mean values is wide but balanced. 7 sales have adjusted prices within 10% of the mean value; 3 are between 10% and 20% different from the mean; and, 10 sales are more than 20% different from the mean. Sales 66 to 79 are 15 to acre parcels located inside the NEPA in the north half of Mono Township or in Mulmur Township. There are 14 sales within this group. The average (mean) adjusted sale price for this group is $163,658, while the averaged median of the adjusted sale prices is $159,950. The range in adjusted sale prices is from $103,634 to $202,015. The distribution of adjusted sale prices around the mean values is normal; with 6 sales within 10% of the mean, 7 between 10 and 20% from the mean, and only one more than 20% different from the mean. 22
23 Fairly large samples are available for properties both within and outside the NEPA in this category. For this reason, the mean adjusted sale values are considered quite reliable. The sales within the NEPA had a mean adjusted sale price that was 12.2% higher than those outside the NEPA. This difference is considered significant. North Mono/Mulmur Over 50 Acres Sales 80 to 90 are properties larger than 50 acres located outside the NEPA in the north half of Mono Township or in Mulmur Township. The average (mean) adjusted sale price of these sales is $161,477, while the median of the adjusted sale prices is $157,789. The range of the adjusted sale prices is $ to $236,250. The distribution of adjusted sale prices around the mean values is normal; with 6 sales within 10% of the mean, 3 sales between 10 and 20% from the mean, and 2 sales at adjusted values more than 20% different from the mean. Sales 91 to 105 are 15 to properties larger than 50 acres located inside the NEPA in the north half of Mono Township or in Mulmur Township. There are 15 sales within this group, making it the largest group inside the NEPA of any size range. The average (mean) adjusted sale price for this group is $213,090, while the median of the adjusted sale prices is $195,000. The range in adjusted sale prices is from $121, 550 to $354,120. The distribution of adjusted sale prices around the mean values is wide but fairly balanced. 5 sales have adjusted prices within 10% of the mean value; 6 are between 10% and 20% different from the mean; and, 4 sales are more than 20% different from the mean. Sale 92 has an exceptionally high adjusted sale price that is over 66% above the mean. This was the only sale larger than 100 acres, either within or outside the NEPA. It required large adjustments for both size and time that reduce the reliability of its adjusted sale price. If Sale 92 is excluded the mean adjusted sale price for this group is $203,016. Fairly large samples are available for properties within and outside the NEPA in this size category. For this reason, the mean adjusted sale values are considered quite reliable, although the mean value for the sales within NEPA may have been inflated somewhat by Sale 92. The sales within the NEPA had a mean adjusted sale price that was 32.0% higher than those outside the NEPA. With sale 92 excluded, the mean value of the sales within NEPA is 25.7% higher than that of those outside the NEPA. This difference is clearly significant. 23
24 Statistical Significance In each of the four size/location categories the average adjusted sale price for lands inside the NEPA was higher than that for lands outside the NEPA. These results are summarized below. The bracketed values exclude Sale 43 (South Mono, 5 to acres) and Sale 92 (North Mono/Mulmur, 50+ acres). North Mono/Mulmur Size Range Mean Adjusted Sale Mean Adjusted Sale % Difference $ Difference (acres) Price Outside NEPA Price In NEPA $98,610 $112, % $13, $145,889 $163, % $17, $161,477 $213,090 ($203,016) 32% (25.7%) $51,613 ($41,539) South Mono Size Range Mean Adjusted Sale Mean Adjusted Sale % Difference $ Difference (acres) Price Outside NEPA Price In NEPA $153,722 $166,184 ($173,772) 8.1% (13.0%) $12,462 ($20,050) These results show consistently higher average sale prices for properties within the NEPA compared to similar properties outside the NEPA. The next step was to try and determine whether these differences were statistically significant, or whether they could have occurred by chance. I performed a Chi Square analysis to test the null hypothesis that there is no significant difference between the mean values outside the NEPA (treated as the expected values) and the mean values within the NEPA (treated as the actual values). The result of this analysis showed that, with over 99% certainty, the higher values for lands within the NEPA could not be attributed to chance. This result did not change when Sales 43 and 92 were excluded. Why are average sale prices within the NEPA portions of the study area higher? Could this result from too small a sample or from errors in adjustments made for time or size? The sample size is large enough that it can confidently be assumed to represent land values as a whole. The consistency of the results also supports the view that sample size is adequate. Neither the time nor the size adjustments made skew the results. The average original sale prices and the average time adjusted sale prices both show the same consistent pattern of higher average values within the NEPA. Are there other factors within the study design that could account for the difference in average land values? Key variables such as zoning and access were controlled for through the qualify criteria established for inclusion in the analysis. The selection of the 24
25 study area sought to ensure that parts of the study area within the NEPA and those outside it had similar landscape characteristics and aesthetic appeal. A subjective review of the individual sales included in the study did not reveal any overall bias towards higher aesthetic appeal for sales within or outside the NEPA area and I am confident that differences in aesthetic appeal could not have been sufficient to account for the higher land values within the NEPA. Conclusions As described in the Results and Analysis sections of this report, this study has found that the portion of the study area located within the NEPA have significantly higher average land values than sales in the portion of the study area outside the NEPA. The only significant characteristic that I can identify which differentiates the two portions of the study area is the inclusion of one portion within the NEPA. Therefore, I conclude that the Niagara Escarpment Plan itself has had a positive impact on land values within the NEPA. Clues as to why the Niagara Escarpment Plan would enhance land values within the NEPA are contained within the comments contained in the real estate listings for the property sales analysed. Over one third of the listings within the NEPA commented positively on the proximity of the property to the Bruce Trail or public land within the Niagara Escarpment Parks and Open Space System. By comparison, less than 8% of the listings for lands outside the NEPA had positive comments regarding nearby public land outside the Niagara Escarpment Parks and Open Space System. It is not surprising that the tens of thousands of acres acquired to create and enlarge 117 parks and open space areas along the escarpment and to secure a route for the Bruce Trail would tend to increase land values within the NEPA. The Parks and Open Space System is a significant public amenity that protects and maintains some of the most significant natural areas and most impressive landscape features along the escarpment. There is a far smaller proportion of public parks and open space areas in the portion of the study area outside the NEPA. A second factor to consider from the real estate listings comments is the perception of Niagara Escarpment Plan land use controls. Two of the listings for properties within the NEPA put these controls forward as a positive factor that protects the landscape. Conversely, two comments from listings of properties outside the NEPA made a point of mentioning that the properties were outside the NEPA, implying that the extra layer of land use controls within the NEPA is a negative factor. The reality is probably reflected in both kinds of comments. Some will see the land use controls of the Niagara 25
26 Escarpment Plan as an effective and positive way of maintaining the attractive open landscape character around a property they are considering purchasing. Others will resent or seek to avoid the additional and potentially more stringent controls on land use within the NEPA (it is worth noting that most municipalities have introduced stronger policies to limit land severances and protect natural areas and rural landscapes in recent years). On balance, it is likely that Niagara Escarpment land use controls are not a significant factor influencing land values for most properties. I speculate that one other factor that may have a positive influence on land values within the NEPA is the fact that the Niagara Escarpment is internationally recognized as a unique and highly significant natural environment and an area of exceptional beauty. This recognition may well have given lands within the NEPA a certain cache that may have been amplified as quality homes, and other developments that fit with the natural environment, are built within the NEPA. It is not possible to extend the findings from this study area to the entire NEPA. My personal experience, having reviewed or prepared over 170 appraisals of properties along the Niagara Escarpment over the past 18 years, suggests that there is strong anecdotal evidence that properties within the NEPA sell at equivalent or higher prices when compared to similar nearby properties located outside the NEPA. Quantifying this and verifying this anecdotal evidence for the entire Escarpment, or for a full sample of study areas along the length of the escarpment, would be a major undertaking, but one that is worthy of future research. This study has clearly shown that for the section of the Niagara Escarpment within Dufferin County is that the Niagara Escarpment Plan has had a significant positive effect on average property values within the NEPA. 26
GENERAL ASSESSMENT DEFINITIONS
 21st Century Appraisals, Inc. GENERAL ASSESSMENT DEFINITIONS Ad Valorem tax. A tax levied in proportion to the value of the thing(s) being taxed. Exclusive of exemptions, use-value assessment laws, and
REAL ESTATE MARKET OVERVIEW 1 st Half of 2015
 REAL ESTATE MARKET OVERVIEW 1 st Half of 2015 With Comparisons to the 2 nd Half of 2014 September 4, 2015 Prepared for: First Bank of Wyoming Prepared by: Ken Markert, AICP MMI Planning 2319 Davidson Ave.
RESIDUAL ANALYSIS PRINCIPLES AND PROCEEDURES
 RESIDUAL ANALYSIS PRINCIPLES AND PROCEEDURES OVERVIEW 1. Residual analysis or extractions, are a form of land valuation study. 2. This analysis relies on the improved sales (typically the largest group
Chapter 35. The Appraiser's Sales Comparison Approach INTRODUCTION
 Chapter 35 The Appraiser's Sales Comparison Approach INTRODUCTION The most commonly used appraisal technique is the sales comparison approach. The fundamental concept underlying this approach is that market
Economic Impact of Commercial Multi-Unit Residential Property Transactions in Toronto, Calgary and Vancouver,
 Economic Impact of Commercial Multi-Unit Residential Property Transactions in Toronto, Calgary and Vancouver, 2006-2008 SEPTEMBER 2009 Economic Impact of Commercial Multi-Unit Residential Property Transactions
The purpose of the appraisal was to determine the value of this six that is located in the Town of St. Mary s.
 The purpose of the appraisal was to determine the value of this six that is located in the Town of St. Mary s. The subject property was originally acquired by Michael and Bonnie Etta Mattiussi in August
Following is an example of an income and expense benchmark worksheet:
 After analyzing income and expense information and establishing typical rents and expenses, apply benchmarks and base standards to the reappraisal area. Following is an example of an income and expense
Re-sales Analyses - Lansink and MPAC
 Appendix G Re-sales Analyses - Lansink and MPAC Introduction Lansink Appraisal and Consulting released case studies on the impact of proximity to industrial wind turbines (IWTs) on sale prices for properties
The Impact of Using. Market-Value to Replacement-Cost. Ratios on Housing Insurance in Toledo Neighborhoods
 The Impact of Using Market-Value to Replacement-Cost Ratios on Housing Insurance in Toledo Neighborhoods February 12, 1999 Urban Affairs Center The University of Toledo Toledo, OH 43606-3390 Prepared by
A Historical Perspective on Illinois Farmland Sales
 A Historical Perspective on Illinois Farmland Sales Erik D. Hanson and Bruce J. Sherrick Department of Agricultural and Consumer Economics University of Illinois May 3, 2013 farmdoc daily (3):84 Recommended
ASSESSMENT REVIEW BOARD. The City of Edmonton JASPER AVENUE Assessment and Taxation Branch
 ASSESSMENT REVIEW BOARD Churchill Building 10019 103 Avenue Edmonton AB T5J 0G9 Phone: (780) 496-5026 NOTICE OF DECISION NO. 0098 101/11 CVG The City of Edmonton 1200-10665 JASPER AVENUE Assessment and
BUILD-OUT ANALYSIS GRANTHAM, NEW HAMPSHIRE
 BUILD-OUT ANALYSIS GRANTHAM, NEW HAMPSHIRE A Determination of the Maximum Amount of Future Residential Development Possible Under Current Land Use Regulations Prepared for the Town of Grantham by Upper
Volume Title: Well Worth Saving: How the New Deal Safeguarded Home Ownership
 This PDF is a selection from a published volume from the National Bureau of Economic Research Volume Title: Well Worth Saving: How the New Deal Safeguarded Home Ownership Volume Author/Editor: Price V.
MARKET VALUE BASIS OF VALUATION
 4.2 INTERNATIONAL VALUATION STANDARDS 1 MARKET VALUE BASIS OF VALUATION This Standard should be read in the context of the background material and implementation guidance contained in General Valuation
2011 ASSESSMENT RATIO REPORT
 2011 Ratio Report SECTION I OVERVIEW 2011 ASSESSMENT RATIO REPORT The Department of Assessments and Taxation appraises real property for the purposes of property taxation. Properties are valued using
Equity from the Assessor s Perspective
 Institute of Municipal Assessors 55th Annual Conference Equity from the Assessor s Perspective Andy Anstett Legislation & Policy Support Services MPAC June 7th, 2011 Key Aspects of Equity Test Defining
ARLA Members Survey of the Private Rented Sector
 Prepared for The Association of Residential Letting Agents ARLA Members Survey of the Private Rented Sector Second Quarter 2014 Prepared by: O M Carey Jones 5 Henshaw Lane Yeadon Leeds LS19 7RW June, 2014
Sales Ratio: Alternative Calculation Methods
 For Discussion: Summary of proposals to amend State Board of Equalization sales ratio calculations June 3, 2010 One of the primary purposes of the sales ratio study is to measure how well assessors track
Residential August 2009
 Residential August 2009 Karl L. Guntermann Fred E. Taylor Professor of Real Estate Adam Nowak Research Associate Summary The latest data for May 2009 reveals that house prices declined by 33 percent in
Agreements for the Construction of Real Estate
 HK(IFRIC)-Int 15 Revised August 2010September 2018 Effective for annual periods beginning on or after 1 January 2009* HK(IFRIC) Interpretation 15 Agreements for the Construction of Real Estate * HK(IFRIC)-Int
6. Review of Property Value Impacts at Rapid Transit Stations and Lines
 6. Review of Property Value Impacts at Rapid Transit Stations and Lines 6.0 Review of Property Value Impacts at Rapid Transit Station April 3, 2001 RICHMOND/AIRPORT VANCOUVER RAPID TRANSIT PROJECT Technical
Trends in Affordable Home Ownership in Calgary
 Trends in Affordable Home Ownership in Calgary 2006 July www.calgary.ca Call 3-1-1 PUBLISHING INFORMATION TITLE: AUTHOR: STATUS: TRENDS IN AFFORDABLE HOME OWNERSHIP CORPORATE ECONOMICS FINAL PRINTING DATE:
Residential New Construction Attitude and Awareness Baseline Study
 Residential New Construction Attitude and Awareness Baseline Study Real Estate Appraiser Survey Report on Findings Prepared for the New Jersey Residential New Construction Working Group January 2001 Roper
Residential September 2010
 Residential September 2010 Karl L. Guntermann Fred E. Taylor Professor of Real Estate Adam Nowak Research Associate For the first time since March, house prices turned down slightly in August (-2 percent)
Hennepin County Economic Analysis Executive Summary
 Hennepin County Economic Analysis Executive Summary Embrace Open Space commissioned an economic study of home values in Hennepin County to quantify the financial impact of proximity to open spaces on the
Understanding the rentrestructuring. housing association target rents
 Understanding the rentrestructuring formula for housing association target rents Rent Briefing paper 4 Wendy Solomou, Peter Wright and Christine Whitehead Date: July 2005 Understanding the rentrestructuring
Chapter 13. The Market Approach to Value
 Chapter 13 The Market Approach to Value 11/22/2005 FIN4777 - Special Topics in Real Estate - Professor Rui Yao 1 Introduction Definition: An approach to estimating market value of a subject property by
Edmonton Composite Assessment Review Board
 Edmonton Composite Assessment Review Board Citation: CVG v The City of Edmonton, 2013 ECARB 01878 Assessment Roll Number: 10002533 Municipal Address: 10904 102 A venue NW Assessment Year: 2013 Assessment
MARKHAM. Comprehensive Zoning By-law Project. Markham Zoning By-law Consultant Team
 City of MARKHAM Task 4B: Review & Assessment of Minor Variances Comprehensive Zoning By-law Project Markham Zoning By-law Consultant Team Gladki Planning Associates, R. E. Millward and Associates, Woodfield
Data Verification. Professional Excellence Bulletin [PP-14-E] February 1995
![Data Verification. Professional Excellence Bulletin [PP-14-E] February 1995](/thumbs/90/101597168.jpg "Data Verification. Professional Excellence Bulletin [PP-14-E] February 1995") Professional Excellence Bulletin [PP-14-E] February 1995 Although obviously a cornerstone of appraisal practice, data verification has not been considered a major problem to real estate appraisers in the
Professional Excellence Bulletin [PP-14-E] February 1995 Although obviously a cornerstone of appraisal practice, data verification has not been considered a major problem to real estate appraisers in the
A Mini-Guide. to Monitoring Property Values. Introduction For many British Columbians, November 2000
 A Mini-Guide to Monitoring Property Values November 2000 Introduction For many British Columbians, homeownership is the most significant investment they and their families will make. Homeowners are concerned
ARLA Survey of Residential Investment Landlords
 Prepared for The Association of Residential Letting Agents & the ARLA Group of Buy to Let Mortgage Lenders ARLA Survey of Residential Investment Landlords March 2010 Prepared by O M Carey Jones 5 Henshaw
Coachella Valley Median Detached Home Price Mar Mar 2018
 Median Price $450,000 Coachella Valley Median Detached Home Price Mar 2002 - Mar 2018 $392,000 $400,000 $366,285 $350,000 $300,000 $250,000 $200,000 $150,000 Media Detached Price 4% Growth Curve Summary
MARKHAM. City of. Comprehensive Zoning By-law Project. Task 4b. Review and Assessment of Minor Variances
 Appendix E City of MARKHAM ra ft Comprehensive Zoning By-law Project Task 4b. Review and Assessment of Minor Variances D January 22, 2014 Markham Zoning By-law Consultant Team Gladki Planning Associates,
Residential May Karl L. Guntermann Fred E. Taylor Professor of Real Estate. Adam Nowak Research Associate
 Residential May 2008 Karl L. Guntermann Fred E. Taylor Professor of Real Estate Adam Nowak Research Associate The use of repeat sales is the most reliable way to estimate price changes in the housing market
1. There must be a useful number of qualified transactions to infer from. 2. The circumstances surrounded each transaction should be known.
 Direct Comparison Approach The Direct Comparison Approach is based on the premise of the "Principle of Substitution" which implies that a rational investor or purchaser will pay no more for a particular
The Impact of Market Rate Vacancy Increases One Year Report
 The Impact of Market Rate Vacancy Increases One Year Report January 1, 1999- December 31, 1999 Santa Monica Rent Control Board TABLE OF CONTENTS Summary 2 Market Rent Increases 1/1/99-12/31/99 4 Rates
Sri Lanka Accounting Standard LKAS 40. Investment Property
 Sri Lanka Accounting Standard LKAS 40 Investment Property LKAS 40 CONTENTS SRI LANKA ACCOUNTING STANDARD LKAS 40 INVESTMENT PROPERTY paragraphs OBJECTIVE 1 SCOPE 2 DEFINITIONS 5 CLASSIFICATION OF PROPERTY
COMPARISON OF THE LONG-TERM COST OF SHELTER ALLOWANCES AND NON-PROFIT HOUSING
 COMPARISON OF THE LONG-TERM COST OF SHELTER ALLOWANCES AND NON-PROFIT HOUSING Prepared for The Fair Rental Policy Organization of Ontario By Clayton Research Associates Limited October, 1993 EXECUTIVE
REPORT. Research. Determining a Fair Rental Arrangement. Introduction. Types of Rental Arrangements. Kenneth W.. Paxton and Michael E.
 REPORT Research Number 110 - Summer 2001 Determining a Fair Rental Arrangement Kenneth W.. Paxton and Michael E. Salassi Introduction Most of the crop agriculture in Louisiana is produced on rented land.
RENTAL MARKET REPORT. Manitoba Highlights* Highlights. Housing market intelligence you can count on
 H o u s i n g M a r k e t I n f o r m a t i o n RENTAL MARKET REPORT Highlights* C a n a d a M o r t g a g e a n d H o u s i n g C o r p o r a t i o n Date Released: Spring 2012 Figure 1 Winnipeg CMA Brandon
CHAPTER 3. HOUSING AND ECONOMIC DEVELOPMENT
 CHAPTER 3. HOUSING AND ECONOMIC DEVELOPMENT This chapter analyzes the housing and economic development trends within the community. Analysis of state equalized value trends is useful in estimating investment
D DAVID PUBLISHING. Mass Valuation and the Implementation Necessity of GIS (Geographic Information System) in Albania
 in Albania") Journal of Civil Engineering and Architecture 9 (2015) 1506-1512 doi: 10.17265/1934-7359/2015.12.012 D DAVID PUBLISHING Mass Valuation and the Implementation Necessity of GIS (Geographic Elfrida Shehu
Journal of Civil Engineering and Architecture 9 (2015) 1506-1512 doi: 10.17265/1934-7359/2015.12.012 D DAVID PUBLISHING Mass Valuation and the Implementation Necessity of GIS (Geographic Elfrida Shehu
Agenda Re~oort PUBLIC HEARING: PROPOSED ADJUSTMENTS TO INCLUSIONARY IN-LIEU FEE RATES
 Agenda Re~oort August 27, 2018 TO: Honorable Mayor and City Council THROUGH: Finance Committee FROM: SUBJECT: William K. Huang, Director of Housing and Career Services PUBLIC HEARING: PROPOSED ADJUSTMENTS
5. PROPERTY VALUES. In this section, we focus on the economic impact that AMDimpaired
 5. PROPERTY VALUES In this section, we focus on the economic impact that AMDimpaired streams have on residential property prices. AMD lends itself particularly well to property value analysis because its
IREDELL COUNTY 2015 APPRAISAL MANUAL
 STATISTICS AND THE APPRAISAL PROCESS INTRODUCTION Statistics offer a way for the appraiser to qualify many of the heretofore qualitative decisions which he has been forced to use in assigning values. In
The Accuracy of Automated Valuation Models
 The Accuracy of Automated Valuation Models European Valuation Conference Belgrade 20 th -22 nd April 2017 Professor George Matysiak Agenda AVMs Examples of valuation accuracy More transparency Study work
The Canadian Real Estate Association News Release
 The Canadian Real Estate Association News Release Canadian home sales edge up in September Ottawa, ON, October 14, 2016 According to statistics 1 released today by The Canadian Real Estate Association
PLANNING REPORT. Prepared for: John Spaleta 159 Delatre Street Woodstock Ontario N4S 6C2
 PLANNING REPORT County Official Plan Amendment and Zoning By-law Amendment to Permit a Seasonal Dwelling on an Existing Lot of Record with Access onto a Seasonally Maintained Road Parts of Lot 29, Concession
METHODOLOGY GUIDE VALUING LANDS IN TRANSITION IN ONTARIO. Valuation Date: January 1, 2016
 METHODOLOGY GUIDE VALUING LANDS IN TRANSITION IN ONTARIO Valuation Date: January 1, 2016 August 2017 August 22, 2017 The Municipal Property Assessment Corporation (MPAC) is responsible for accurately assessing
2014 Plan of Conservation and Development
 The Town of Hebron Section 1 2014 Plan of Conservation and Development Community Profile Introduction (Final: 8/29/13) The Community Profile section of the Plan of Conservation and Development is intended
April 12, The Honorable Martin O Malley And The General Assembly of Maryland
 April 12, 2011 The Honorable Martin O Malley And The General Assembly of Maryland As required by Section 2-202 of the Tax-Property Article of the Annotated Code of Maryland, I am pleased to submit the
Discussion Paper 2: Lot Sizes and Housing Affordability. Township of Lake of Bays Official Plan Review
 Discussion Paper 2: Lot Sizes and Housing Affordability Township of Lake of Bays Official Plan Review 1 Context The Township of Lake of Bays has strong policies in the Official Plan to avoid the inefficient
Filling the Gaps: Stable, Available, Affordable. Affordable and other housing markets in Ekurhuleni: September, 2012 DRAFT FOR REVIEW
 Affordable Land and Housing Data Centre Understanding the dynamics that shape the affordable land and housing market in South Africa. Filling the Gaps: Affordable and other housing markets in Ekurhuleni:
How to Read a Real Estate Appraisal Report
 How to Read a Real Estate Appraisal Report Much of the private, corporate and public wealth of the world consists of real estate. The magnitude of this fundamental resource creates a need for informed
Geographic Variations in Resale Housing Values Within a Metropolitan Area: An Example from Suburban Phoenix, Arizona
 INTRODUCTION Geographic Variations in Resale Housing Values Within a Metropolitan Area: An Example from Suburban Phoenix, Arizona Diane Whalley and William J. Lowell-Britt The average cost of single family
Assessment-To-Sales Ratio Study for Division III Equalization Funding: 1999 Project Summary. State of Delaware Office of the Budget
 Assessment-To-Sales Ratio Study for Division III Equalization Funding: 1999 Project Summary prepared for the State of Delaware Office of the Budget by Edward C. Ratledge Center for Applied Demography and
A Model to Calculate the Supply of Affordable Housing in Polk County
 Resilient Neighborhoods Technical Reports and White Papers Resilient Neighborhoods Initiative 5-2014 A Model to Calculate the Supply of Affordable Housing in Polk County Jiangping Zhou Iowa State University,
RATE STUDY IMPACT FEES PARKS
 RATE STUDY FOR IMPACT FEES FOR PARKS CITY OF KENMORE, WASHINGTON May 15, 2001 TABLE OF CONTENTS Executive Summary................................................... 1 1. Statutory Basis and Methodology
Washington Department of Revenue Property Tax Division. Valid Sales Study Kitsap County 2015 Sales for 2016 Ratio Year.
 P. O. Box 47471 Olympia, WA 98504-7471. Washington Department of Revenue Property Tax Division Valid Sales Study Kitsap County 2015 Sales for 2016 Ratio Year Sales from May 1, 2014 through April 30, 2015
Examples of Quantitative Support Methods from Real World Appraisals
 Examples of Quantitative Support Methods from Real World Appraisals Jeffrey A. Johnson, MAI Integra Realty Resources Minneapolis / St. Paul Tony Lesicka, MAI Central Bank 1 Overview of Presentation EXAMPLES
This version includes amendments resulting from IFRSs issued up to 31 December 2009.
 International Accounting Standard 40 Investment Property This version includes amendments resulting from IFRSs issued up to 31 December 2009. IAS 40 Investment Property was issued by the International
Filling the Gaps: Active, Accessible, Diverse. Affordable and other housing markets in Johannesburg: September, 2012 DRAFT FOR REVIEW
 Affordable Land and Housing Data Centre Understanding the dynamics that shape the affordable land and housing market in South Africa. Filling the Gaps: Affordable and other housing markets in Johannesburg:
Economic Impacts of MLS Home Sales and Purchases in Canada and the Provinces
 Economic Impacts of MLS Home Sales and Purchases in Canada and the Provinces 2006 2008 FINAL REPORT April 24, 2009 Economic Impacts of MLS Home Sales and Purchases in Canada and the Provinces 2006-2008
EN Official Journal of the European Union L 320/323
 29.11.2008 EN Official Journal of the European Union L 320/323 INTERNATIONAL ACCOUNTING STANDARD 40 Investment property OBJECTIVE 1 The objective of this standard is to prescribe the accounting treatment
Ontario Rental Market Study:
 Ontario Rental Market Study: Renovation Investment and the Role of Vacancy Decontrol October 2017 Prepared for the Federation of Rental-housing Providers of Ontario by URBANATION Inc. Page 1 of 11 TABLE
3rd Meeting of the Housing Task Force
 3rd Meeting of the Housing Task Force September 26, 2018 World Bank, 1818 H St. NW, Washington, DC MC 10-100 Linking Housing Comparisons Across Countries and Regions 1 Linking Housing Comparisons Across
LIMITED-SCOPE PERFORMANCE AUDIT REPORT
 LIMITED-SCOPE PERFORMANCE AUDIT REPORT Agricultural Land Valuation: Evaluating the Potential Impact of Changing How Agricultural Land is Valued in the State AUDIT ABSTRACT State law requires the value
RESEARCH BRIEF. Oct. 31, 2012 Volume 2, Issue 3
 RESEARCH BRIEF Oct. 31, 2012 Volume 2, Issue 3 PDR programs affect landowners conversion decision in Maryland PDR programs pay farmers to give up their right to convert their farmland to residential and
Existing Land Use. Typical densities for single-family detached residential development in Cumberland County: 1
 Existing Land Use A description of existing land use in Cumberland County is fundamental to understanding the character of the County and its development related issues. Economic factors, development trends,
The Market Watch Monthly Housing Report. Coachella Valley Median Detached Home Price Dec Dec 2016
 The Market Watch Monthly Housing Report Median Price $450,000 Coachella Valley Median Detached Home Price Dec 2002 - Dec 2016 $400,000 $350,000 $300,000 $339,930 $340,000 $250,000 $200,000 $150,000 CV
Performance of the Private Rental Market in Northern Ireland
 Summary Research Report July - December Performance of the Private Rental Market in Northern Ireland Research Report July - December 1 Northern Ireland Rental Index: Issue No. 8 Disclaimer This report
EXPLANATION OF MARKET MODELING IN THE CURRENT KANSAS CAMA SYSTEM
 EXPLANATION OF MARKET MODELING IN THE CURRENT KANSAS CAMA SYSTEM I have been asked on numerous occasions to provide a lay man s explanation of the market modeling system of CAMA. I do not claim to be an
CHAPTER 2 VACANT AND REDEVELOPABLE LAND INVENTORY
 CHAPTER 2 VACANT AND REDEVELOPABLE LAND INVENTORY CHAPTER 2: VACANT AND REDEVELOPABLE LAND INVENTORY INTRODUCTION One of the initial tasks of the Regional Land Use Study was to evaluate whether there is
ECONOMIC CURRENTS. Vol. 4, Issue 3. THE Introduction SOUTH FLORIDA ECONOMIC QUARTERLY
 ECONOMIC CURRENTS THE Introduction SOUTH FLORIDA ECONOMIC QUARTERLY Vol. 4, Issue 3 Economic Currents provides an overview of the South Florida regional economy. The report presents current employment,
In December 2003 the Board issued a revised IAS 40 as part of its initial agenda of technical projects.
 IAS Standard 40 Investment Property In April 2001 the International Accounting Standards Board (the Board) adopted IAS 40 Investment Property, which had originally been issued by the International Accounting
Cadastral Template 2003
 PCGIAP-Working Group 3 "Cadastre" FIG-Commission 7 "Cadastre and Land Management" Cadastral Template 2003 The establishment of a cadastral template is one of the objectives of Working Group 3 "Cadastre"
Current affordability and income
 Current affordability and income 21.1 Introduction...1 21.2 The relationship between intermediate and private rented markets...2 21.3 Renting privately...3 Table 1: Lower quartile rent, required household
In December 2003 the IASB issued a revised IAS 40 as part of its initial agenda of technical projects.
 International Accounting Standard 40 Investment Property In April 2001 the International Accounting Standards Board (IASB) adopted IAS 40 Investment Property, which had originally been issued by the International
This article is relevant to the Diploma in International Financial Reporting and ACCA Qualification Papers F7 and P2
 REVENUE RECOGNITION This article is relevant to the Diploma in International Financial Reporting and ACCA Qualification Papers F7 and P2 For almost all entities other than financial institutions, revenue
The Honorable Larry Hogan And The General Assembly of Maryland
 2015 Ratio Report The Honorable Larry Hogan And The General Assembly of Maryland As required by Section 2-202 of the Tax-Property Article of the Annotated Code of Maryland, I am pleased to submit the Department
Housing as an Investment Greater Toronto Area
 Housing as an Investment Greater Toronto Area Completed by: Will Dunning Inc. For: Trinity Diversified North America Limited February 2009 Housing as an Investment Greater Toronto Area Overview We are
STAFF REPORT. Permit Number: Porter. Kitsap County Board of Commissioners; Kitsap County Planning Commission
 STAFF REPORT Permit Number: 15 00461 Porter DATE: November 9, 2015 TO: FROM: Kitsap County Board of Commissioners; Kitsap County Planning Commission Katrina Knutson, AICP, Senior Planner, DCD and Jeff
Viability and the Planning System: The Relationship between Economic Viability Testing, Land Values and Affordable Housing in London
 Viability and the Planning System: The Relationship between Economic Viability Testing, Land Values and Affordable Housing in London Executive Summary & Key Findings A changed planning environment in which
A. Land Use Relationships
 Chapter 9 Land Use Plan A. Land Use Relationships Development patterns in Colleyville have evolved from basic agricultural and residential land uses, predominate during the early stages of Colleyville
Status of HUD-Insured (or Held) Multifamily Rental Housing in Final Report. Executive Summary. Contract: HC-5964 Task Order #7
 Multifamily Rental Housing in Final Report. Executive Summary. Contract: HC-5964 Task Order #7") Status of HUD-Insured (or Held) Multifamily Rental Housing in 1995 Final Report Executive Summary Cambridge, MA Lexington, MA Hadley, MA Bethesda, MD Washington, DC Chicago, IL Cairo, Egypt Johannesburg,
Status of HUD-Insured (or Held) Multifamily Rental Housing in 1995 Final Report Executive Summary Cambridge, MA Lexington, MA Hadley, MA Bethesda, MD Washington, DC Chicago, IL Cairo, Egypt Johannesburg,
CANADA - WITHDRAWAL OF TARIFF CONCESSIONS. Report of the Panel on Lead and Zinc adopted on 17 May 1978 (L/ S/42)
") 28 April 1978 I. INTRODUCTION CANADA - WITHDRAWAL OF TARIFF CONCESSIONS Report of the Panel on Lead and Zinc adopted on 17 May 1978 (L/4636-25S/42) 1. The Panel was established by the Council on 12 November
28 April 1978 I. INTRODUCTION CANADA - WITHDRAWAL OF TARIFF CONCESSIONS Report of the Panel on Lead and Zinc adopted on 17 May 1978 (L/4636-25S/42) 1. The Panel was established by the Council on 12 November
BUSI 330 Suggested Answers to Review and Discussion Questions: Lesson 1
 BUSI 330 Suggested Answers to Review and Discussion Questions: Lesson 1 1. The three characteristics necessary to gain professional recognition are: Integrity, Competence, and Provide Quality Work. Students
Do Farmland Ownership Patterns Explain Variation in Farmland Rental Rates? 1
 Do Farmland Ownership Patterns Explain Variation in Farmland Rental Rates? 1 James Bryan, B. James Deaton, Alfons Weersink, Karl Meilke University of Guelph Final Project Report 2011 1. This project has
Economy. Denmark Market Report Q Weak economic growth. Annual real GDP growth
 Denmark Market Report Q 1 Economy Weak economic growth In 13, the economic growth in Denmark ended with a modest growth of. % after a weak fourth quarter with a decrease in the activity. So Denmark is
EN Official Journal of the European Union L 320/373
 29.11.2008 EN Official Journal of the European Union L 320/373 INTERNATIONAL FINANCIAL REPORTING STANDARD 3 Business combinations OBJECTIVE 1 The objective of this IFRS is to specify the financial reporting
Notice for Suspension of Small Area Fair Market Rent (Small Area FMR) Designations: Solicitation of Comment - Docket No.
 Designations: Solicitation of Comment - Docket No.") January 11, 2018 VIA ELECTRONIC SUBMISSION Regulations Division Office of General Counsel U.S. Department of Housing and Urban Development Room 10276 451 Seventh Street SW Washington, DC 20410-0500 Re:
January 11, 2018 VIA ELECTRONIC SUBMISSION Regulations Division Office of General Counsel U.S. Department of Housing and Urban Development Room 10276 451 Seventh Street SW Washington, DC 20410-0500 Re:
The Canadian Real Estate Association News Release
 The Canadian Real Estate Association News Release Canadian home sales edge down from December to January Ottawa, ON, February 15, 2017 According to statistics 1 released today by The Canadian Real Estate
Assessment Quality: Sales Ratio Analysis Update for Residential Properties in Indiana
 Center for Business and Economic Research About the Authors Dagney Faulk, PhD, is director of research and a research professor at Ball State CBER. Her research focuses on state and local tax policy and
Table of Contents. Appendix...22
 Table Contents 1. Background 3 1.1 Purpose.3 1.2 Data Sources 3 1.3 Data Aggregation...4 1.4 Principles Methodology.. 5 2. Existing Population, Dwelling Units and Employment 6 2.1 Population.6 2.1.1 Distribution
CALGARY ASSESSMENT REVIEW BOARD DECISION WITH REASONS
 CALGARY ASSESSMENT REVIEW BOARD DECISION WITH REASONS In the matter of the complaint against the property assessment as provided by the Municipal Government Act, Chapter M-26, Section 460, Revised Statutes
Application of the Residual Approach to Value
 August 1993 Application of the Residual Approach to Value The method most appropriate for the valuation of vacant sites with development schemes in place is the Residual or Development Approach. The method
Impact Of Financing Terms On Nominal Land Values: Implications For Land Value Surveys
 Economic Staff Paper Series Economics 11-1983 Impact Of Financing Terms On Nominal Land Values: Implications For Land Value Surveys R.W. Jolly Iowa State University Follow this and additional works at:
An Investigation into the Potential Relationship between Property Values and High Voltage Overhead Transmission Lines in Ireland
 An Investigation into the Potential Relationship between Property Values and High Voltage Overhead Transmission Lines in An independent report prepared for EirGrid Plc The Oval, 160 Shelbourne Road Ballsbridge,
Economic Impacts of MLS Home Sales and Purchases In The province of Québec and The Greater Montréal Area
 Home Sales and Purchases In The province of Québec and The Greater Montréal Area Home Sales and Purchases In The Province of Québec and The Greater Montréal Area Prepared for: The Greater Montréal Real