DRAFT. Port of Seattle Real Estate Strategic Plan. October, 2016
|
|
|
- Karin Stafford
- 5 years ago
- Views:
Transcription
1 Port of Seattle Real Estate Strategic Plan October, 216
2 Table of Contents Acknowledgments Real Estate Strategy: Executive Summary 1 Port Industry Economic Sectors Cruise 4 Fishing 5 Air Cargo 6 Manufacturing 7 Potential Innovative Uses - Alternative Energy 8 Economic Impact 9 SECTION 1: Real Estate Development Portfolio North Bay: Industrial Market 11 Termianl 91 Uplands & Piers: Existing Conditions 12 Piers 9/91: Alternative 1 Improve Cruise Experience 13 Piers 9/91: Alternative 2 Expand Fishing Use 14 T91 Uplands: Findings & Develpment Strategy 15 South Bay: Industrial Market 16 Terminal 16: Existing Conditions & Development Strategy 17 Pier 2 & CEM Property: Existing Conditions 18 Pier 2 & CEM Property Development Strategy 19 SeaTac: Industrial Market 2 North SeaTac Portfolio: Development Strategy Overview 21 L-Shaped Site & 13-Acre Site Existing Conditions & Development Strategy Acre Site: Existing Conditions & Development Strategy 23 S. 2th Street: Existing Conditions & Development Strategy 24 Real Estate Development Portfolio: Financial & Economic Impact Analysis 25 SECTION 2: Real Estate Acquistion Program Real Estate Acquisiton Program: Methodology 27 Real Estate Acquisiton Program: Summay 28 Real Estate Acquisiton Program: Strategy & Fiancial Analysis 29 Real Estate Portfolio Strategy: Financial & Econonmic Impact Analysis 3 PORT COMMISSIONERS John Creighton, President Tom Albro, Vice President Fred Felleman, Commissioner-at-Large Stephanie Bowman, Secretary Courtney Gregoire, Assistant Secretary PORT LEADERSHIP Dave McFadden, Managing Director, Economic Development Jeffrey Utterback, Director, Real Estate PORT REAL ESTATE TEAM (PRET) Al Royal, Economic Development Stephanie Jones Stebbins (environmental) Eric Hansen (T91 and Seaport Alliance) Melinda Miller (non-airport assets) Mike McLaughlin (cruise) ADVISORY COMMITTEE MEMBERS Paul Inghram, Puget Sound Regional Council Tom Pozarycki, Washington Federal Kevin Wallace, Councilmember, City of Bellevue Wilma Warshak Washington Real Estate Advisors Ben Wolters, City of Kent Brian Surratt, City of Seattle John Teutsch, Teutsch Partners Fred Jarrett, King County Paige Shevlin, King County Suzanne Dale Estey Economic Development Council of Seattle & King County CONSULTANT TEAM Heartland Cushman & Wakefield New Harbor Consultants


3 Real Estate Strategy: Executive Summary As illustrated below, the methodology used to formulate the Real Estate Strategy has two distinct but interrelated components strategies associated with the Port s existing portfolio of redevelopable real estate assets and strategies associated with acquiring and repositioning port supportive industrial assets within King County. REAL ESTATE DEVELOPMENT PORTFOLIO The Port of Seattle owns approximately 4, acres of real estate in King County. Of the total holdings, nine assets totaling 123 acres (check) or 3.% of the assets have the potential for redevelopment and are included in the Development Portfolio component of the strategy. Section 1 of this report, outlines the recommended approach to developing each of these assets over the next 5 years. PORT SUPPORTIVE REAL ESTATE According to the US Census, King County is the 12th fastest growing large county in the country. The Puget Sound Regional Council projects that over the next 3 years, King County will add 3, residents and 6, new jobs. Fostering diverse economic growth requires a land base that can accommodate a wide range of uses, including industrial lands where employers manufacture and store goods within an ever evolving global supply chain. Of the roughly 48, urbanized land in King County, only 21, or 4.3% is zoned for industrial uses. As the Port successfully brings its existing portfolio of developable property into productive use, the port will proactively seek out opportunities to acquire and reposition port supportive industrial assets that would not otherwise further diverse economic growth within King County. The acquisition program is outlined in Section 2 of this report. T91 UPLANDS T9/91 S O U N D P U G E T CEM PROPERTY PIER 2 SEATTLE L A K E W A S H I N G T O N TERMINAL 16 OPPORTUNITY ASSET PROFILES ALTERNATIVE ANALYSIS EXISTING CONDITIONS PERFORMANCE CURRENT ECONOMIC IMPACT BY ASSET DIRECT INDIRECT Portfolio Analysis EMPLOYMENT OUTPUTS WAGES, ETC. SUB-MARKET ANALYSIS ALT. USE SCENARIOS FINANCIAL ANALYSIS ECONOMIC IMPACT ANALYSIS FOR ALT. SCENARIOS Inventory of Port Supportive Real Estate KING COUNTY KING COUNTY PROPERTIES WITHIN PORT DISTRICT ADJACENT USES B A S I C C R I T E R I A ACRES CONSTRAINTS INFRASTRUCTURE COMP PLAN & ZONING CURRENT USES ASSESSED VALUES TRANSPORTATION/ ACCESS WORKFORCE 13-ACRE SITE 55-ACRE SITE L-SHAPED SITE ASSET ACTION PLANS PORTFOLIO STRATEGY NOMINATED AREAS POTENTIAL PORT SUPPORTIVE REAL ESTATE R E F I N E O U T P U T POTENTIAL LAND ACQUISITION OPPORTUNITIES COMMERCIAL LISTINGS 2TH ST SEATAC Contribution to Century Agenda Objectives 1


4 Real Estate Strategy: Executive Summary Real Estate Developmento Portfolio GUIDING PRINCIPLES Take a Balanced Portfolio Approach - Maximize potential of every underdeveloped asset through direct divisional operations or market based development. - Measure financial and job output at the portfolio level, recognizing that each asset will contribute differently to overall performance. - Invest in key infrastructure to unlock the potential of existing, underutilized assets. Focus on Middle Class Jobs The economic ecosystem of King County will be significantly enhanced through the industrial development and long term stewardship of Port real estate. Invest in Key Outcomes Capital investments necessary to make productive use of the existing portfolio will be tied to specific measurable outcomes. Anticipate Change Changing economic and market cycles will require the Port be nimble and adaptable when implementing the Real Estate Strategic Plan. Real Estate Strategic Plan Objective The primary of objective of this plan is to utilize real estate to: 1. SUPPORT CENTURY AGENDA GOALS Jobs - Add 1, jobs over 1 years Operational excellence & Sustainable Growth - Grow as an international logistics hub/tourist destination/business gateway. - Support small business growth and workforce development - Support job creation in key port business clusters 2. SUPPORT DIVISIONAL INITIATIVES Maritime, cargo, aviation, cruise Property Acquistion Program GUIDING PRINCIPLES Plan for Success By implementing the Real Estate Strategic Plan, the Port s existing portfolio of redevelopable real estate will be committed by 221. Engage Strategically The Port is uniquely positioned to work with public and private parties to ensure long-term availably of port supportive real estate. Continually Reinvest Reinvest Net Operating Income from existing development assets into the next generation portfolio to reduce the long-term reliance on other sources of funding. ACTIONS Fully develop the portfolio over the next 5 to 7 years by offering both ground lease and build-to-suit opportunities. Mitigate real and perceived development risk and accelerate private investment by completing due diligence studies, securing entitlements and investing in necessary infrastructure. Ensure long-term support for air cargo and maritime industries through direct ownership and management of key facilities. Maximize private investment through proactive engagement with local, national and international companies and the real estate community. Century Agenda Results Implementation of the Real Estate Strategic Plan has the potential to significantly further the goals of the Century Agenda: $34 Million/Year NOI Stabilized Year 15 NOI Associated with Development Portfolio & Acquisition Program 14, Jobs Direct & Indirect Jobs Associated with Development Portfolio & Acquisition ACTIONS Continue to educate public and private stakeholders and potential partners about the Port s real estate development goals and activities. Prioritize potential acquisition targets and systematically engage with agencies and property owners to identify opportunities where the Port s objectives can be achieved. Invest strategically to eliminate obstacles to development and add value to properties that would not otherwise be put to productive use by market forces alone. 2
5 Port Industry Economic Sectors 3


6 Port Industry Economic Sectors: Cruise BACKGROUND T91 is main Seattle cruise ship terminal, since 19xx ACTIVITY VIEWS Consists of two berths, served by terminal on the pier POSITIVES Eleven homeported cruise ships create significant Seattle-area spending, including about 3,4 total jobs in 213 Alaska remains a very popular destination for US cruise passengers Seattle cruise passenger and vessel growth high, since 2;reaching 1. million people and 2 vessel calls in 216 Cruise demand is seasonal, concentrated during May-Sept Cruise co-exists with fishing activities, mainly May and Nov/Dec CHALLENGES Road access heavily congested on peak days (Fri-Sat-Sun) Distance from downtown and airport Future demand growth could exceed T91 berthing capacity; both berths occupied 5% of days in July 216 Alaska cruise market faces challenges related to infrastructure, capacity of certain bays, environmental and local taxes/fees OUTLOOK Most likely medium-term demand outlook is 2%/year passenger growth, with no increase in number of ships Cruise passengers 1,2, 1,, 8, 6, 4, 2, p Cruise vessels Cruise passengers Cruise vessels T91 - Aerial view, cruise terminal with two cruise vessels OPTIONS Status quo: Continue to rely on T91 for cruise, as is Enhancements: Road access, terminal flow and parking structure on T91 New location: Complement or replace T91 with new POS location No. calls Days w 2 vsls RECOMMENDATION Enhancements: Conduct analyses of cruise demand, improvement needs, costs and possible alternatives; then implement top priority/ justified changes 1 5 Apr May Jun Jul Aug Sep Oct Pier 66 - Aerial view, cruise terminal with one cruise vessel CRUISE SNAPSHOT PORT ACTIVITY Seattle is a major cruise ship homeport 11 vessels based at POS and about 2 calls per year PORT FACILITIES T91-2 x 1,2 berths with 35 water depth P66 1 x 1,6 berth with 38 water depth ECONOMIC IMPACT $176 million total personal income (213) DEMAND OUTLOOK Gradual increase in no. passengers and vessel size OPTIONS Continue current ops at T91 Shift ops to another POS location 4
 and Fishermen s Terminal, on Salmon Bay")


7 Port Industry Economic Sectors: Fishing BACKGROUND Fish landings have increased in value, while stable in lbs, ACTIVITY VIEWS Port operates major fishing facilities at three locations: WA State Commercial Seafood Landings Pounds and Value - P9 is dedicated to fishing fleet, P91 is shared with cruise vessels 4 - Maritime Industrial Center (MIC) and Fishermen s Terminal, on Salmon Bay 35 POSITIVES Fishing vessels based at Port facilities create significant Seattle-area economic impact, including 16,1 total jobs in Seattle s fishing fleet lands relatively high-value species, from sustainable fisheries Port offers multiple facilities to support the fleet Fishing closely linked to allied industries (e.g., processing equipm t) Vessels are away fishing during A and B seasons, so only need berths during May and Nov/Dec; complements cruise season Lbs Mil. $ Mil. CHALLENGES Regulations incentivize replacing older, smaller vessels with larger ones, raising demand for more modern, deeper water berths Heightened vessel sophistication, with onboard processing and freezing, requires berths with adequate shoreside access P9 (and P91) - Aerial view, deepwater fishing pier OUTLOOK Wild-caught fish landings (lbs.) expected to be stable Number of vessels expected to be stable or decline, though average size/draft will gradually increase OPTIONS Status quo: Continue at P9/91 and Salmon Bay, as is Expansion on Salmon Bay: Acquire frontage between MIC and FT Conversion of P91: Dedicate P91 entirely to fishing/allied activities RECOMMENDATION Expansion on Salmon Bay: Sufficient water depth (2 ) for additional midsize vessels, at convenient location. Retain P9 dedicated to fishing and P91 shared usage. F/V Blue North, 191 freezer-longliner, delivered 216 FISHING SNAPSHOT PORT ACTIVITY Seattle is a major base for the Alaska fishing fleet 8,25 direct jobs related to POS facilities in 213 PORT FACILITIES P9/91 2 x 1,2 berths (3-35 ) on P9, shared access to P91 ECONOMIC IMPACT $1.3 billion in total personal income (213) DEMAND OUTLOOK Catch is controlled, stable; demand for newer, larger vessels OPTIONS Continue current ops at P9/91 (and on Salmon Bay) Add capacity at one of the current POS locations MIC and Fishermen s Terminal, on Salmon Bay MIC Midsize and larger vessels Fishermen s Terminal Small to midsize vessels 5

 On-airport vacancy rate currently zero Port owns several undeveloped properties near Sea-Tac that would be")

8 Port Industry Economic Sectors: Air Cargo BACKGROUND Sea-Tac Airport is one of the top US air cargo hubs Export-oriented gateway for fish, fruit and electronics Three types of air cargo carriers serve Sea-Tac: - All-freight airlines (e.g., China Airlines, Cargolux) - Passenger airlines (belly freight, e.g., Alaska, Delta) - Express companies (e.g., FedEx) Freight forwarders and express truckers seek space near Sea-Tac POSITIVES Demand for near-airport space is strong, rents are high Sea-Tac s int l air cargo has grown by 7.6%/year, over Seattle air cargo operations provide about 85 direct jobs (213) On-airport vacancy rate currently zero Port owns several undeveloped properties near Sea-Tac that would be wellpositioned for air cargo facilities Sea-Tac Air Cargo (metric tons) 4, 35, 3, 25, 2, 15, 1, 5, Seattle s air cargo volumes have increased significantly, ACTIVITY VIEWS Sea-Tac has seen strong recent growth in international air cargo CHALLENGES Limited number of forwarders and truckers operating in Seattle, so timing of demand is not easy to predict Greenfield sites would have to be developed OUTLOOK Favorable for air cargo volume, especially on international lanes Positive for near-airport forwarding and trucking facilities OPTIONS Status quo: Entertain unsolicited requests for air cargo activities on Port-owned property Proactive: Develop multi-user air freight/airport trucking facility RECOMMENDATION Consider several sites near Sea-Tac (e.g., L-Shaped and a portion of current employee parking) to develop as multi-user facility for air freight forwarding, airport trucking, and/or air mail operations AIR CARGO SNAPSHOT Boeing foresees robust future growth of world air cargo traffic Seattle is linked to Asia and Europe via freighters and belly space PORT ACTIVITY Active and expanding air cargo operations at Sea-Tac PORT FACILITIES On-airport facilities are used for cargo handling operations Properties near Sea-Tac not currently used for air cargo Several parcels north and south of Sea-Tac are well-positioned ECONOMIC IMPACT Air cargo generates $1 million of total personal income (213) DEMAND OUTLOOK Positive, for air cargo-related forwarding and trucking facilities OPTIONS Continue to respond to specific requests as they arise Pro-actively work to develop multi-user air forwarding facility 6
 accounts for a sizeable share of these jobs 14, POSITIVES Several (non-aerospace)")
: About 14, jobs - Food & beverage manufacturing: About 13, jobs - Fabricated metal products: About 11, jobs 12, 1, 8, 6, 4, 31332 Fabricated")

9 Port Industry Economic Sectors: Manufacturing BACKGROUND US manufacturing employment is still 2 million below 25 level Seattle MSA manufacturing employment recovered, after 29-1 dip, to a steady level of about 17, jobs 16, Seattle MSA Employment by Selected Mfg SubCtgys, ACTIVITY VIEWS Aerospace (Boeing) accounts for a sizeable share of these jobs 14, POSITIVES Several (non-aerospace) subsectors have recovered employment levels from the 28-9 recession. Major subsectors are: - High-tech (computers, electronics): About 14, jobs - Food & beverage manufacturing: About 13, jobs - Fabricated metal products: About 11, jobs 12, 1, 8, 6, 4, Fabricated Metal Product Mfg Computer & Electronic Prd Mfg Transportation Equip (Not Aerospace) Food Mfg - Transportation equipment (non-aerospace): About 4, jobs 2, CHALLENGES High wage levels in Seattle area pose challenge for any manufacturing industry that is not high value-added, or whose products can be manufactured in lower-cost countries/regions Local shipbuilding business and jobs have been flat to declining OUTLOOK Favorable for high-tech, food/beverage, metal fab/machine shops Little/no requirement for additional shipbuilding/repair facilities Limited need for waterfront land in manufacturing road and airport access more important OPTIONS Status quo: Entertain unsolicited requests for manufacturing activities on Port-owned property Proactive: Develop multi-user/start-up industrial facility RECOMMENDATION Low availability of modern, affordable, flexible space for start-up or small/midsize manufacturing facilities suggests Port could take a positive role in developing space for such a use Various non-waterfront properties could be suitable High-tech, food and fabricated metal are top Seattle non-aerospace manufacturing industries Ship and boat building employment has been flat in Washington, Seattle is a major hub for high-tech companies One of Seattle s many craft breweries MANUFACTURING SNAPSHOT PORT ACTIVITY Industrial occupiers of Port property include Marel, the Icelandic fish processing equipment and systems maker, and others PORT FACILITIES P9/91 Includes fish processing-related industrial enterprises; potential for cruise ship victualing facility MIC and FT Fishing-related small-scale industrial activities ECONOMIC IMPACT Modest at present, based on Port-owned properties DEMAND OUTLOOK Tech, food/beverage, fabrication positive; shipbuilding flat OPTIONS Continue to respond to industrial requests as they arise Pro-actively work to develop shared/flexible industrial space Vigor Industrial shipyard, Harbor Island 7
 -")


10 Port Industry Economic Sectors: Potential Innovative Uses - Alternative Energy BACKGROUND Innovative uses can provide future demand for Port properties, in addition to more traditional activities Alternative energy technologies illustrate such potential new uses - For Port property as manufacturing or, more likely, staging sites Three concepts are reviewed: - Offshore floating wind (OFW) - Marine hydrokinetic power (MHK, or wave energy) - Land-based wind ACTIVITY VIEWS POSITIVES Outlook for alternative energy solutions is generally positive, in light of climate change concerns and public policy trends Port role in attracting these activities would be well regarded Seattle offers water access, critical to staging for marine systems CHALLENGES High wage levels in Seattle, as per Manufacturing sector Marine concepts (OFW and MHK) still in early development stage Uses are generally intermittent, project-based, rather than steady Port properties may not be ideal OUTLOOK Port well-positioned for MHK, medium for OFW; not for land wind MHK growth still unknown; OFW moving ahead on East Coast Land-based wind capacity has plateaued recently in Washington State OPTIONS Status quo: Entertain unsolicited requests for new energy technology businesses on Port-owned property Encouraging: Promoting consideration of possible Port role Proactive: Develop an alternative energy site on spec RECOMMENDATION Encouraging. Port to foster discussion, consideration of pros/cons and possible locations Wind conditions offshore Washington are favorable Rendering of offshore floating wind structure being built INNOVATIVE USES SNAPSHOT PORT ACTIVITY No current Port involvement in wind and wave energy systems PORT FACILITIES T91 Uplands: Possible manufacturing/staging site Pier 2: Water access, but difficult land access for large structures ECONOMIC IMPACT Nil at present, based on Port-owned properties Potential modest, due to project-like activity patterns, unless major future boom in demand DEMAND OUTLOOK To be followed closely OPTIONS Status quo, Encouraging or Proactive Wave energy design concept 8
11 Page Left Blank Intentionally 9
12 SECTION 1 Real Estate Development Portfolio 1


 and building count (-13%).")


13 North Bay: Industrial Market 1. NORTH BAY MARKET NARRATIVE Terminal 91 is located within the North Bay sub market spanning neighborhoods of Interbay, Magnolia, and Ballard. The industrial inventory in this submarket is characterized by the historical marine uses and related support industries. Much of the inventory is approaching functional obsolescence and the inventory has shown consistent decline over the past decade in both total square footage (-18.5%) and building count (-13%). Escalating land values and zoning that will accommodate higher rent producing uses are the underlying forces. Not surprisingly, vacancy rates have continued to decline (presently 1.8%) while rent growth has been robust (3.87% 1 yr CAGR). The private sector faces significant obstacles to developing new, modern industrial/flex product in this submarket; namely access, the aforementioned escalating land values/market rents and the associated financing challenges when competitive alternatives in the region are factored. The Port is uniquely capable of overcoming these challenges and realizing pent up economic opportunity with development of the Maker District. 3. NORTH BAY MARKET CHARTS 4. NORTH BAY MARKET ACTIVITY MAP 16,, 14,, 12,, 1,, 8,, 6,, 4,, 2,, 18.% 16.% 14.% 12.% 1.% 8.% 6.% 4.% 2.%.% Inventory SF - North Bay Total Vacancy - North Bay vs. Puget Sound YTD 2. NORTH BAY MARKET SNAPSHOT DEFINITION OF SUBMARKET Inventory Building Count Types of Tenants Average Rent 1.9 MM SF 712 Aging buildings with functional obsolescence Marine, manufacturing, food processesing/storage, service industrial, flex $1.2/SF NNN $2.5 $2. $1.5 $1. Overall Avg. Rental Rate (NNN) - North Bay Comparable Land Sales (IG1/IG2) $35-$7/SF.5 Long Term Trends Declining industrial inventory Escalating rents YTD 11


14 ALAS AS KAN WY WY W ELLI LIOT OTT AVE W 12 Terminal 91 Uplands & Piers: Existing Conditions UPLANDS ASSET PROFILE Total Acreage: 89 Usable Acreage: 77 Current Bldg. Sq ft: 687,41 SF Zoning: IG1 U/45 - Most industrial activities and limited office uses are permitted. Site Conditions - Largely flat terrain with most areas either paved or occupied by buildings. Constraints - Road access - Poor soil conditions Current Uses - Warehouse - Cold Storage - Food Processing - Office - Industrial - Long piers limit functionality for marine cargo uses. Current Uses MAGNOLIA BRIDGE ACCESS AMERICAN SEAFOOD CITY ICE MAREL SCALE IN FEET Warehouse - Cold Storage - Office - Cruise Terminal and Cruise Ships - Fishing Vessels - Industrial Manufacturing 2,432 PIER 9 PIER 91 CRUISE TERMINAL 1,961 = Undevelopable Aerial GoogleEarth PIERS ASSET PROFILE DRAFT Total Acreage: 45 Buildable Acreage: 42 Current Bldg. Sq ft: 349,459 Zoning: IG1 U/45 - Most industrial activities and limited office are permitted. - Located in the MIC Overlay Constraints - Road Access - Clearance and clear spans under the Magnolia bridge to the Uplands
 are adequate for near term.")
15 Piers 9/91: Alternative 1 - Improve Cruise Experience Better access and new parking garage Cruise is growing and the present facilities are approaching capacity from an access perspective PROS Current cruise terminal setup works, with one building able to serve two cruise ship simultaneously. Cruise ship berths (1,25 x 2 at P91, plus one berth at P66) are adequate for near term. Multi-story garage on T91 would improve passenger flow, generate revenue, eliminate shuttle from parking lot and free up space in Uplands for other use. Demand for cruise-oriented parking is seasonal and counter cyclical to the fishing industry. CONS Road access to T91 from Elliott Avenue West is not intuitive and constrained during peak times. - On peak days there is heavy passenger traffic with 14, people getting off/on two vessels at T91. - Traffic back-ups at from Elliott Avenue West onto Galer Street and on the Magnolia Bridge are frequent during peak times. - Expedia s relocation to its new campus in 219 will add more traffic, overlapping on Fridays. Two cruise berths at Pier 91 may not be sufficient for growing cruise demand. Demand for cruise-oriented parking is seasonal. Access by cruise passengers to Downtown shopping and cultural activities is not ideal from T91. Long-term commitment to cruise use may limit additional capacity for fishing use. ACTIONS Conduct cruise market outlook study to assess future needs, compare with other potential sites for cruise facility expansion and quantify feasibility. Work with SDOT to analyze road access options, cost and feasibility. Subject to outcome of first two actions, select optimal site (access) for a multi-story parking garage (size) on P91 or the shortfill area. Study the addition of light rail, shuttle bus and/or water taxi to Downtown for cruise passenger tourism. Reconfigure the cruise terminal to two levels, arrival and departure, plus bus, to smooth flow on and off. Consider relocating Marel to Uplands, if needed to support better access for cruise passengers. Prepare business case for repairing the berths on the east side of Pier 9. CONTRIBUTION TO CENTURY AGENDA Long term support for both fishing and tourism sectors 13
16 Piers 9/91: Alternative 2 - Expand Fishing Use Reposition Pier 91 exclusively for fishing and other maritime uses Shift main cruise terminal to more ideal location, closer to Downtown and with easier access. PROS Provide deep-draft facility, for large fishing vessels, ship repair or future offshore wind/wave energy equipment staging. Potential to provide additional jobs and possible tie-in to Uplands (e.g., for manufacturing/ assembly of wave machines) Provide cruise with a better-located and less-constrained site (land access, berths) more suitable to growing demand. Avoid need to invest heavily in road access to Pier 91 via West Galer Street and the Magnolia Bridge. CONS Reduced pier utilization, due to uncertain demand in these other uses, vs certainty of cruise use - Fishing use is seasonal (dovetails well with cruise); large trawler fleet is stable; growth of freezer-longliner fleet could be accommodated in Salmon Bay (Fishermen s Terminal/MIC) area. - Ship repair demand for this facility likely very low, given current surplus capacity elsewhere in Puget Sound. - Offshore wind or wave energy machines would represent a long-term possibility, but irregular need for water access. High cost of relocating cruise terminal and loss of return on 29 investment in P91. ACTIONS Evaluate cruise relocation alternatives. Study future needs of Seattle-based large fishing vessels and assess options, including Salmon Bay and Lake Union. Consider business case for repairing berths on the eastside of Pier 9. CONTRIBUTION TO CENTURY AGENDA Long term support for both fishing and tourism sectors 14

17 T91 Uplands: Findings & Development Strategy ACTIONS FINDINGS OPPORTUNITIES Rare opportunity to develop 45 acres of usable land in a central location with proximity to the BINMIC. Potential rail access towards the north end of the property. CHALLENGES T-91 uplands are not accessible through the north gate today based on NAC Agreement. Access from Uplands to Piers, for marine use, limited by bridge clearance. DEVELOPMENT CONCEPT THE MAKER DISTRICT Through build-to-suit leases and long term ground leases, the Port will redevelop the uplands with flexible, one and two story industrial buildings that can accommodate a wide range of users that are increasingly being displaced from other close-in locations. 1. Process a Planned Action Ordinance (PAO) with the City. The PAO will enable the Port to address the major impacts of the development strategy through a single regulatory process, which will reduce the critical path for permitting and constructing buildings to support new users on the property. Timeline: Commence Q1 217; Target Completion Q Work with stakeholders allow for the opening of the North Gates. Development of the uplands will require the opening these gates to passenger and truck traffic. Though the traffic impacts of the development will be analyzed through the SEPA process as part of the PAO, the Port should proactively engage with the Neighborhood Advisory Committee (NAC) to discuss the project, process and mutual objectives. Timeline: In conjunction with Action Relocate cruise parking to Pier 91 or short fill area. Over the long-term, the area currently dedicated to parking for cruise passengers will be more valuable as the last development phases of the Maker District. Timeline: Commence planning for relocation in Allocate resources to pursue the Armory site as a future expansion of the Maker District. The Port is uniquely capable of effectively engaging with the Army National Guard to find a replacement property that better suites their long-term operational objectives while positioning the Armory site as a future expansion of the Maker District. Timeline: Commence engagement with the Army National Guard in Work with City to facilitate development of Workforce housing on Tsubota Site The Tsubota site by itself has limited value for port supportive uses, however, by working with the City of Seattle it could be repositioned to accommodate housing affordable to the types of moderate income families and individuals working in and around the BINMIC. Timeline: Commence discussions in Q1 217 T9/91 TOTALS CAPITALIZED VALUE (6%) Pre Development Soft Costs ($2,174,585) ($4,779,621) ($7,46,288) ($4,177,436) ($2,418,762) ($1,392,479) Infrastructure Hard Costs ($53,755,56) ($13,656,6) ($15,34,5) ($14,877,) ($1,653,) ($8,265,) Development ($2,416,11) ($5,856,322) ($6,976,53) ($5,257,748) ($2,325,51) NOI $4,788,498 $2,156,22 $4,313,73 $4,53,318 $5,15,35 $5,33,386 $6,13,852 $6,589,63 $6,749,65 Net Cash Flow ($53,557,757) ($4,779,621) ($21,62,348) ($19,4,62) $136,267 ($17,323,212) $2,596,589 ($1,67,362) $4,738,373 ($4,1,447) $6,749,65 $112,493,423 NPV* $3,37,225 * Assumes reversion in 227 and discount rate of 8% CONTRIBUTION TO CENTURY AGENDA Direct support for maritime industrial sector Accommodates companies at risk of being displaced ECONOMIC IMPACT Direct Jobs 589 Indirect Jobs 692 Tax Revenue $5,631,212 FINANCIAL IMPACT Total Investment ($94,346,255) Stabilization Year 226 Annual Stabilization NOI $6,75, 1 Year IRR 9% 15

, inventory levels have been reduced over the past decade")
 with occupiers paying premium rents to secure space.")


18 South Bay: Industrial Market 1. SOUTH BAY MARKET NARRATIVE The South Bay submarket encompasses Sodo, Harbor Island, Georgetown, the Duwamish corridor south through Boeing Field and east through the Rainier Valley. Similarly to North Bay (although less dramatically), inventory levels have been reduced over the past decade as reflected in square footage (-3%) and building count (-3%). The market is incredibly tight (1.6%) with occupiers paying premium rents to secure space. Building uses here are more diverse than in North Bay because access is better and therefor distribution is a part of the mix furthered by proximity to the container terminals. Land values continue to escalate and a significant portion of inventory here also reflects a high component of functional obsolescence. Prologis has plans to test a two story distribution project at the former CF site as a solution to these forces in providing enhanced functionality to logistics companies. Terminal 16 will likely receive significant market interest for redevelopment from logistics providers of time sensitive deliveries as well as location sensitive manufacturers. Marine uses to include ship building and product movements, cold storage, transloading of construction materials, agricultural products, recycling, and light manufacturing are all part of the economic engine in this submarket. 2. SOUTH BAY MARKET SNAPSHOT DEFINITION OF SUBMARKET 3. SOUTH BAY MARKET CHARTS 4. SOUTH BAY MARKET ACTIVITY MAP 52,5, 52,, 51,5, 51,, 5,5, 5,, 49,5, 49,, % 14.% 12.% 1.% 8.% 6.% 4.% 2.%.% 27 Inventory SF - South Bay Total Vacancy - South Bay vs. Puget Sound YT Inventory 5.5 MM SF Building Count Types of Tenants Average Rent Comparable Land Sales Long Term Trends 1,334 Aging buildings with functional obsolescence Distribtuion/logistics, service retail, manufacturing, construction & auto.83/sf NNN $4-$75/SF Growth in service retail and automotive retail, craft manufacturing and time sensitive distribution/logistics Overall Avg. Rental Rate (NNN) - North Bay YTD 16


")
 Development ($48,461) ($36,346) ($12,115) NOI $16,74,865 $1,693,44 $2,14,655 $2,354,467")
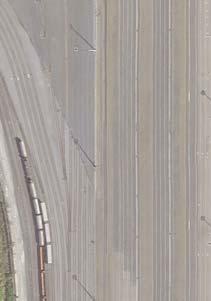
19 SR 99 DRAFT Terminal 16: Existing Conditions & Development Strategy Aerial GoogleEarth WEST SEATTLE BRIDGE D U W A M I S H R I V E R SEAPORT ALLIANCE ASH GR OVE 1,176 LOGISTICS PARCEL Demolish Existing Buillding 425, - 5, SF E MARGINAL WY S TRUCK SPACE S NEVADA ST 6, SF Redevelop After Lease Expire 544 INCUBATOR OPPORTUNITY S IDAHO ST ACCESS SCALE IN FEET 3 6 TERMINAL 16 ASSET PROFILE Total Acreage: 31.2 Usable Acreage: 17.4 Current Bldg. Sq ft: 598,3 Zoning: IG-1 Current Use - Office - Warehouse - Storage - Industrial Site Strengths - Excellent Location SITE STRATEGY Ground lease for HBU & 6kSF Incubator Redevelopment POS redevelopment as logistics facility- New 5k SF industrial building & 6kSF Incubator Redevelopment ACTIONS LOGISTICS PARCEL 1. Retain an engineering firm to evaluate the costs and benefits of retaining the existing building foundation and prepare a cost estimate to demolish the foundation. The PAO will enable the Port to address the major impacts of the development strategy through a single regulatory process, which will reduce the critical path for permitting and constructing buildings to support new users on the property. Timeline: Commence & Complete Q Commission and assemble due diligence materials to support broad marketing of the property for ground lease and development as a major logistics facility. ALTA Survey Updated Phase I & II Environmental Reports Massing diagrams to illustrate development capacity under current zoning. Timeline: Commence Q1 217; Complete Q Apply for a Boundary Line Adjustment (BLA) or short subdivision to create a new legal lot around the existing logistics parcel to be ground lease. Timeline: Commence Q1 217; Complete Q Prepare an Offering Memorandum (OM) to present the development opportunity to the market. Timeline: Commence Q1 217; Complete Q Commence transaction process with the intent of allowing a developer to commence construction in 219 when WSDOT vacates the building. Timeline: Commence Q3 217; Target ground lease commencement 219 INCUBATOR BUILDING 6. Secure cost estimates for the renovation of the incubator building. Timeline: Commence & Complete Q1 217; Target ground lease commencement Develop a business plan for the management of the incubator as a place to help small, locally owned business locate while growing their business. Timeline: Commence Q2 217 T16 TOTALS CAPITALIZED VALUE (6%) Pre Development Soft Costs ($293,161) ($125,) ($126,121) ($42,4) Infrastructure Hard Costs ($2,,) ($2,,) Development ($48,461) ($36,346) ($12,115) NOI $16,74,865 $1,693,44 $2,14,655 $2,354,467 $2,371,148 $2,388,25 $2,617,464 $2,635,44 1 Year Net Cash Flow $13,31,243 ($125,) ($2,126,121) $1,291,54 $1,894,54 $2,354,467 $2,371,148 $2,388,25 $2,617,464 $2,635,44 $43,924,6 NPV* $25,969,314 * Assumes reversion in 227 and discount rate of 8% CONTRIBUTION TO CENTURY AGENDA Major new component of the regional supply chain Opportunity leverage institutional capital to support Century Agenda ECONOMIC IMPACT Direct Jobs 392 Indirect Jobs 615 Tax Revenue $4,949,792 FINANCIAL IMPACT Total Investment ($2,773,622) Stabilization Year 222 Annual Stabilization NOI $2,35, 1 Year IRR 85% 17


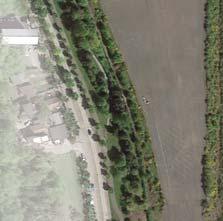

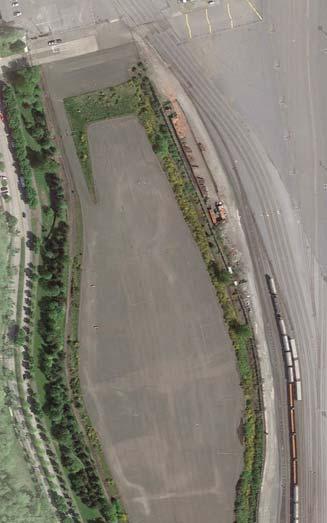
20 DRAFT Pier 2 & CEM Property: Existing Conditions POTENTIAL ACQUISITION CE AC SS L IA N NT TIO TE ISI PO CQU A P2 CE AC E AV 39 R I DA ST Constraints - Presence of the landfill cap - Existing truck access to site is limited - Site configuration is irregular CEM PROPERTY FINDINGS Aerial GoogleEarth CEM TERMINAL 5 SW O SW FL Current Use: Vacant 1,76 OR Zoning: IG-2/U ST TERMINAL 5 RB Total Acreage: 25 Usable Acreage: ~12 SCALE IN FEET 2 CEM PROPERTY ASSET PROFILE 665 HA P AC OTE QU NT ISI IAL TIO N R I DA HARBOR AVE S W SS O SW FL S ACCES P2 PROS Known site challenges have been identified and studied with geotechnical related costs estimated. Potential alternative truck access on the east of the property via Spokane Street. CONS EExisting isting landfill landfill cap adds de development elopment costs PIER 2 ASSET PROFILE Total Acreage: 5.5* Zoning: IG-1 & IG-2 Current Use - Boat and vehicle storage - Public beach 18 Hold for future water dependent industrial use (e.g., barge shipping of alternative energy equipment) No direct water or rail access POTENTIAL HBU Bank branch Work lofts Light industrial/flex office Solar panel covered parking/mini storage Solar farm for T5 Aerial GoogleEarth Current Bldg. Sq ft: 81 Ground lease for redevelopment as HBU (e.g. Dry stack boat storage). Costs associated with potential future truck access ACCESS SCALE IN FEET 2 4 POTENTIAL ACCESS Usable Acreage: 4.8* SITE STRATEGY

21 Pier 2 & CEM Property: Development Strategies Pier 2 Alternative 1 - Pier 2 Alternative 2 - Dry Stack Boat Storage and HBU Alternative Energy Project Site Underutilized waterfront parcel ideally suited for maritime supportive uses. PROS The site has immediate water access. North facing waterfront area of parcel is relatively protected from adverse weather. Existing rail spur extends to the shoreline. A dry stack boat storage project is ready to go on the eastern portion of Pier 2. Two parts of the property may be developed independently. CONS Difficult access to the site through a park for industrial tenants Proposed dry stack boat storage project precludes potential water related use on the CEM property. Riprap shoreline and beach and overhead pedestrian bridge must remain undisturbed. Shoreline regulations require a setback from the water s edge for non-marine related uses. Soil conditions may result in additional development costs. FINDINGS Underutilized waterfront parcel could be used for possible future marine energy equipment activities. PROS The site has immediate water access. - Potentially suitable for barge use (18 water depth at pier end, 6 to 12 alongside). Possible use: Receive or ship by barge large alternative energy equipment, such as wind turbine blades or towers, or wave energy converters; stage assemblies; conduct light manufacturing. Infrequent movement of energy project equipment could co-exist well with rail lines connecting the pier to the CEM site. CONS Future demand for such activity is uncertain. Difficult road access to the site for oversize equipment. Interface and timing challenges related to rail access. May require pier improvement/replacement, and/or dredging. Pier 2 property is split into two parcels. - Possibly too small to handle large wind/wave equipment. Preferable sites may be available elsewhere e.g., repurpose T5, former Fisher Flour Mill, or sites along Duwamish Waterway. CEM Property ACTIONS 1. Complete solar farm feasibility study with the University of Washington. Determine how a solar array may be integrated into various market based development and how the power would be used (e.g. grid or T5). 2. Commission and assemble due diligence materials to support broad marketing of the property for ground lease and development. ALTA Survey Updated Phase I & II Environmental Reports Engineering study to illustrate the types of building foundations that would be required to address the site s existing soil conditions. Long-term environmental management plan Timeline: Commence Q1 217; Complete Q Prepare an Offering Memorandum (OM) to present the development opportunity to the market. Timeline: Commence Q1 217; Complete Q Commence transaction process with the intent of allowing a developer to commence construction in 218. Timeline: Commence Q3 217; Target ground lease commencement in Q3/4 218 ACTIONS 1. Commission and assemble due diligence materials to support broad marketing of the property for ground lease and development for a water dependent use. ALTA Survey Updated Phase I & II Environmental Timeline: Commence Q1 217; Complete Q Prepare an Offering Memorandum (OM) to present the development opportunity to the market. Timeline: Commence Q1 217; Complete Q Commence transaction process with the intent of allowing a developer to commence construction in 218. Timeline: Commence Q3 217; Target ground lease commencement in Q3/4 218 CONTRIBUTION TO CENTURY AGENDA Accommodates water dependent business Generates NOI from unused assets ECONOMIC IMPACT PIER 2 CEM PROPERTY Direct Jobs Indirect Jobs Tax Revenue $728,41 $2,258,414 FINANCIAL IMPACT PIER 2 CEM PROPERTY Total Investment ($3,) ($325,) Stabilization Year Annual Stabilization NOI $42, $79, 1 Year IRR 14% 241% PIER 2 TOTALS CAPITALIZED VALUE (6%) Pre Development ($5,) ($5,) Soft Costs Infrastructure ($25,) ($25,) Hard Costs Development NOI $3,972,672 $418,176 $418,176 $418,176 $418,176 $418,176 $47,448 $47,448 $47,448 $47,448 1 Year Net Cash Flow $3,672,672 ($3,) $418,176 $418,176 $418,176 $418,176 $418,176 $47,448 $47,448 $47,448 $47,448 $7,84,8 NPV* $5,612,94 * Assumes reversion in 227 and discount rate of 8% CEM TOTALS CAPITALIZED VALUE (6%) Pre Development ($75,) ($75,) Soft Costs Infrastructure ($25,) ($25,) Hard Costs Development NOI $6,566,67 $784,8 $784,8 $784,8 $784,8 $784,8 $882,9 $882,9 $882,9 1 Year Net Cash Flow $6,241,67 ($325,) $784,8 $784,8 $784,8 $784,8 $784,8 $882,9 $882,9 $882,9 $14,71,5 NPV* $1,36,983 * Assumes reversion in 227 and discount rate of 8% 19


 and will likely vie for others as additional land is")


22 SeaTac: Industrial Market 1. SEATAC MARKET NARRATIVE The SeaTac market as defined for the purpose of the included statistics here includes Burien, SeaTac, Normandy Park south of the Airport and S 2th Street east to include portions of Tukwila, Renton, and Kent. This geography is not part of a historically recognized submarket for the region but, is defined in this way to illustrate occupancy, rents, and absorption for this area with shared access and adjacencies that will attract users looking for similar locational benefits. Industrial uses in this area include air cargo, food manufacturing/processing/ distribution, transportation/logistics, and more generally light manufacturing and assembly. Industrial facility rents in this area reflect a discount to the North and South Bay markets while still commanding a premium to the south end of the Kent valley and the big box distribution now sprawling south to Frederickson and beyond. NERA land recently made available for development has attracted some high profile occupiers (FAA, K2, & Greencore) and will likely vie for others as additional land is entitled and made available with the required infrastructure enhancements. 2. SEATAC MARKET SNAPSHOT DEFINITION OF SUBMARKET 3. SEATAC MARKET CHARTS 4. SEATAC MARKET ACTIVITY MAP 72,, 71,5, 71,, 7,5, 7,, 69,5, 69,, 68,5, 68,, 26 2.% 18.% 16.% 14.% 12.% 1.% 8.% 6.% 4.% 2.%. 27 Inventory SF - SeaTac Total Vacancy - SeaTac vs. Puget Sound YTD Inventory 71.5 MM SF Building Count 1,32 Overall Avg. Rental Rate (NNN) - North Bay Types of Tenants Air cargo, time sensitive distribution, food products, manufacturing.6.5 Average Rent.53/SF NNN.4 Comparable Land Sales $12-$2/SF.3.2 Long Term Trends New, previously unavailable supply of land will be developed and absorbed this cycle and next YTD 2


23 DRAFT North SeaTac Portfolio: Development Strategy Overview OVERVIEW S 13366TTTH H STT Air Cargo Facility ORIA AL DR S P The North SeaTac Portfolio is made up of 3 major properties that were all acquired in partnership with the FAA as part of the airport expansion. Each of the properties has moderate to significant development constraints including steep slopes, wetlands and underdeveloped access. Despite these challenges, the portfolio s relatively central location within the region and proximity and access to the airport make them desirable and developable assets. Current Employee Parking DES MOIN NES MEM Replacement Parking Wetlands & Wetlands Buffer 5 5 -A 55 AC CR RE S SII T TE E As a result of the continuing growth of the Puget Sound and Washington State, there is a high demand and long-term need for air cargo facilities (see Page 6) and very limited space for on-airport expansion. The development strategy illustrated to the left, seeks to both accommodate long-term growth of air cargo users and optimize the value of the assets in the North SeaTac portfolio by creating a multi phase, build-to-suit opportunity on the L-Shaped property which is closest to airport operations. Future expansion space is created by relocating some of the NEPL capacity to a future parking garage on the 16th Ave Site which is not as well located for air cargo uses. Both the 13-Acre and 55-Acre sites are well positioned for to accommodate manufactures that will benefit from the centralized location as well as access to the airport and regional truck corridors. ERA POTENTIAL FOOD INNOVATION CENTER POTENTIAL ACQUISITION PROLOGIS PARK S T 4TH ST ST S 11444T 4TH SSTT 24TH 24 TH AVE VE S BOEING FACILITY A AC CR RE SIT TE E 8.6 AC 1 6 TH 16 TH AV A V E SI S I TE TE 4 AC NORTH EMPLOYEE PARKING LOT (NEPL) RPZ POTENTIAL ACQUISITION S TTH SSTT AIR CARGO FACILITY TANK S T 6TH ST ST P RETAIN NEPL LO C 12 AC RPZ RPZ RE ATE N EPL P RELLOCA REL RE OC O CA C ATE E NE NE NEP EP PL 17.6 AC L SH LSHAPED AP A PED ED SIITE S TE R AT E NEP S 1155T TH SSTT street vacation AIR CARGO FACILITY supportive uses expansion EL OC Asset specific actions strategies are addressed on the following pages and the financial performance of the portfolio development strategy is summarized below. S 11552N ND ST ST L 9 AC POTENTIAL ACQUISITION NORTH SEATAC PORFOLIO TOTALS PreDevelopment Soft Costs ($39,445,427) Infrastructure Hard Costs Development NOI 1 Year Net Cash Flow NPV* SR SEATAC AIRPORT SCALE IN FEET CAPITALIZED VALUE (6%) ($15,594,48) ($8,149,364) ($15,71,583) ($5,928,112) ($1,867,8) ($4,6,312) ($6,958,455) ($2,335,673) ($4,622,782) $45,463,711 $64,395 $2,71,186 $3,447,668 $8,58,115 $9,928,451 $1,242,947 $1,471,948 ($6,868,283) ($15,594,48) ($8,149,364) ($21,599,78) ($12,991,397) ($41,235,426) $8,58,115 $9,928,451 $1,242,947 $1,471,948 $24,352, $174,532,465 * Assumes reversion in 227 and discount rate of 8% S 154T 154TH 15 4TH ST 4T ST ECONOMIC IMPACT CONTRIBUTION TO CENTURY AGENDA Accommodates long-term growth of air cargo Generates NOI from unused assets Direct Jobs Indirect Jobs Tax Revenue $3,344,494 FINANCIAL IMPACT Total Investment Stabilization Year Annual Stabilization NOI 1 Year IRR ($16,331,994) 223 $8,6, 13% 21

 WETLAND 12 AC RPZ RELO RE ELOCA LOCA")


24 DRAFT 947 L-SHAPED SITE ASSET PROFILE Total Acreage: 26.2 S 146TH ST P Zoning: Aviation Commercial (AVC) WETLAND 12 AC RPZ RELO RE ELOCA LOCA LO CATE TE NEP NE PLL 42 Current Use: Raw Land SITE STRATEGY 17.6 AC S1 RETAIN NEPL PL TANK AIR CARGO FACILITY ND POTENTIAL ACQUISITION 244TH 24TH TH A TH AV AVE VE S L-Shaped Site & 13-Acre Site: Existing Conditions & Development Strategy Develop 289,2 SF class-a air cargo facility Create opportunity to expand the facility in the future by an additional 1, SF by relocating employee parking. AIR CARGO FACILITY supportive uses S 152ND ST expansion 1,263 S 15TH ST street vacation S 14444TH ST 13-ACRE SITE ASSET PROFILE Total Acreage: S 154TH ST Zoning: Aviation Commercial (AVC) Constraints: Steep slopes are located on the site SITE STRATEGY ACCESS Ground lease the 13 acre for approximately 15, SF aviation supportive use. Utilize the 16th Ave South property as a relocation site for employee parking. A I R P O R T O P ER E R AT AT TII O N S A RE REA L-SHAPED SITE ACTIONS 1. Prepare a more detailed feasibility study including. Ability to vacate a portion of S. 15th Street. Construction costs for phase 1 buildings. Updated Phase I & II Environmental Report Specific tenant interest and required base building specifications. Timeline: Commence Q1 217; Complete Q2 217 Timeline: Commence Q As Phase 1 gains momentum, begin process of relocated NEPL parking to 16th Ave Site Commission and assemble due diligence materials to support broad marketing of the property for ground lease and development. ALTA Survey 2. Prepare and disseminate a marketing package to solicit interest in build-to-suit opportunities. SCALE IN FEET 13-ACRE SITE ACTIONS Construction costs for utility and road upgrades. Timeline: Commence Q2 217; Complete Q4 217 S 146TH ST 2. Prepare an Offering Memorandum (OM) to present the development opportunity to the market. Timeline: Commence Q3 217; Complete Q Commence transaction process with the intent of allowing a developer to begin construction in 219/2. Timeline: Commence Q1 218; Target ground lease commencement in late 219/early Prepare conceptual designs and cost estimates for the potential NEPL parking garage on the 16th Ave Site 22 Aerial GoogleEarth Aerial GoogleEarth SCALE IN FEET SR POTENTIAL ACQUISITION 16TH AVE S 9 AC

25 55-Acre Site: Existing Conditions & Development Strategy ACTIONS 1. Work with regional stakeholders to further explore the viability of a Food Innovation Center on the property. Timeline: Commence Q1 217; Complete Q Consider strategic property acquisitions 55-ACRE SITE ASSET PROFILE Total Acreage: 55.7 Usable Acreage: 31 Zoning: Aviation Commercial (AVC) Constraints - Wetlands and associated buffers - Steep slopes are present on the site Current Uses - City Park Ground Lease on a portion of the site SITE STRATEGY Ground lease for aviation 34, SF supportive use. Opportunity for development of a Food Innovation Center 3. Commission and assemble due diligence materials to support broad marketing of the property for ground lease and development. ALTA Survey Updated Phase I & II Environmental Reports Timeline: Commence Q1 217; Complete Q Prepare an Offering Memorandum (OM) to present the development opportunity to the market. Timeline: Commence Q3 217; Complete Q Commence transaction process with the intent of allowing a developer to begin construction in 219/2. Timeline: Commence Q1 218; Target ground lease commencement in late 219/early Prepare conceptual designs and cost estimates for the potential NEPL parking garage on the 16th Ave Site. 23


 to support broad marketing of the")


 ($4,) 222 $271,488 $271,488 223 $542,975")

26 DRAFT S. 2th Street: Existing Conditions & Development Strategy RE SR 59 RPZ FUTU S 2 2TTH TH SSTT RPZ WSDOT POTENTIAL ACQUISITION ACTIONS S. 2TH STREET ASSET PROFILE Mid Term Work with internal and external stakeholders to explore opportunities associated with: Total Acreage: Usable Acreage: ,584 ACCESS STEEP SLOPES 26 ACCESS Current Bldg. Sq ft: Acquisition of surplus WSDOT property Constraints - Wetlands Long-term opportunities to relocate AOA operations as needs change - Steep slopes Wetland mitigation - Potential access issues Open space Long Term When the SR 59 Extension is within 1 year of completion, the Port should assemble due diligence materials and prepare an Offering Memorandum (OM) to support broad marketing of the property for ground lease and development SITE STRATEGY 24 STEEP SLOPES Ground lease for Port supportive HBU when SR59 extension is under construction or complete. 24 Aerial GoogleEarth 812 SCALE IN FEET 3 SOUTH CORRECTIONAL MISDEMEANANT JAIL 6 ECONOMIC IMPACT 2TH STREET TOTALS Pre Development Soft Costs Infrastructure Hard Costs Development NOI 1 Year Net Cash Flow NPV* ($15,) ($25,) $2,443,388 $2,43,388 $4,913, * Assumes reversion in 227 and discount rate of 8% 221 ($15,) ($25,) ($4,) 222 $271,488 $271, $542,975 $542, $542,975 $542, $542,975 $542, $542,975 $542,975 CAPITALIZED VALUE (6%) CONTRIBUTION TO CENTURY AGENDA Offers long-term support for airport related users $9,49,584 Leverages regional transportation investments Direct Jobs Indirect Jobs Tax Revenue FINANCIAL IMPACT Total Investment Stabilization Year Annual Stabilization NOI 1 Year IRR ($4,) 222 $27, 12%
27 Real Estate Development Portfolio: Financial & Economic Impact Analysis PREDEVELOPMENT INFRASTRUCTURE DEVELOPMENT During the predevelopment period, the Port will be conducting studies, preparing plans, securing regulatory approvals. Whether the Port is going to offer a property to the market for a ground lease or develop it directly through a build-to-suit lease, the investments made during the predevelopment period increase the value of the Port s assets by decreasing uncertainty and the overall development timeline. For the purposes of the financial model, feasibility/due diligence costs were estimated based on the characteristics of each asset. Soft costs for infrastructure and build-to-suit investments were estimated to be 35% of construction (hard) costs. In order to optimize value, some of the assets in the Real Estate Development Portfolio require infrastructure improvements or upgrades. In cases where the Port will be directly developing all or a portion of the property, the infrastructure investment is born by the the Port. The financial model includes infrastructure costs that are paid by the Port at T91 and L-Shaped. In the context of the Port Real Estate Development Strategy, the term development is reserved for the last stage of the process where buildings are being constructed after the predevelopment period and infrastructure investments. For assets where the Port is the logical developer/owner, the model assumes a build-to-suit structure whereby the port secures a user for all or part of a building before starting construction. In a ground lease scenario, the lessee takes the role of the developer and incurs the cost and risk associated with constructing buildings that meet market demand and Port objectives. 1 YEAR NET CASH FLOW TOTALS CAPITALIZED VALUE (6%) T9/91 ($38,272,5) ($9,922,5) ($28,35,) T91 Uplands ($53,557,757) ($4,779,621) ($21,62,348) ($19,4,62) $136,267 ($17,323,212) $2,596,589 ($1,67,362) $4,738,373 ($4,1,447) $6,749,65 $112,493,423 CEM $6,241,67 ($325,) $784,8 $784,8 $784,8 $784,8 $784,8 $882,9 $882,9 $882,9 $14,71,5 Pier 2 $3,672,672 ($3,) $418,176 $418,176 $418,176 $418,176 $418,176 $47,448 $47,448 $47,448 $47,448 $7,84,8 T16 $13,31,243 ($125,) ($2,126,121) $1,291,54 $1,894,54 $2,354,467 $2,371,148 $2,388,25 $2,617,464 $2,635,44 $43,924,6 13-Acre $818,563 ($15,) ($25,) $174,8 $348,161 $348,161 $348,161 $5,82,68 2th Street $2,43,388 ($4,) $271,488 $542,975 $542,975 $542,975 $542,975 $9,49, Acre ($1,751,16) ($6,534,) ($378,149) $64,395 $729,64 $729,64 $729,64 $729,64 $82,197 $82,197 $13,669,945 L-Shaped ($59,935,741) ($9,6,48) ($7,771,215) ($22,23,473) ($13,57,46) ($41,714,49) $7,154,971 $8,851,226 $9,74,59 $9,33,59 $155,59,84 NERA 2 & 3 $5,984,198 ($1,) $556,231 $66,231 $656,231 $656,231 $656,231 $738,26 $738,26 $738,26 $738,26 $12,34,339 DMCBP North $6,32,114 ($1,) ($1,) $7,13 $75,13 $75,13 $75,13 $75,13 $843,866 $843,866 $843,866 $14,64,435 DMCBP West $3,471,113 ($1,) ($1,) $394,312 $444,312 $444,312 $444,312 $444,312 $499,851 $499,851 $499,851 $8,33,85 TOTALS TOTAL Pre Development Soft Costs ($7,56,673) ($5,29,621) ($23,3,768) ($8,425,485) ($14,141,976) ($15,851,583) ($2,418,762) ($1,392,479) Infrastructure Hard Costs ($62,733,672) ($35,) ($14,16,6) ($17,34,5) ($1,867,8) ($15,127,) ($4,6,312) ($1,653,) ($8,265,) Development ($11,25,26) ($5,856,322) ($2,696,18) ($35,446,645) ($4,622,782) ($5,257,748) ($2,325,51) NOI $131,547,228 $1,74,47 $5,29,123 $9,664,44 $12,38,63 $14,141,875 $19,462,828 $22,425,43 $23,426,965 $23,834,484 1 Year Net Cash Flow ($111,952,143) ($5,379,621) ($36,332,42) ($26,377,185) ($27,41,353) ($54,117,166) ($32,959,981) $12,552,8 $21,32,565 $12,836,455 $23,834,484 $397,241,42 NPV* $71,971,488 * Assumes reversion in 227 and discount rate of 8% IRR 15% CONTRIBUTION TO CENTURY AGENDA ECONOMIC IMPACT Direct Jobs 2,294 Indirect Jobs 3,63 Tax Revenue $23,144,29 The strategy for the development portfolio includes spending approximately $244 million over a 1 year period which creates a stabilized annual NOI of approximately $24M. After stabilization, the capitalized value of the development portfolio will be approximately $4M. The development portfolio is projected to generate a $72M NPV at an 8% discount rate and a 15% IRR. 25
28 SECTION 2 Real Estate Acquisition Program 26


 it can be patient, (2) it is motivated to create jobs, and (3) it can leverage interjurisdictional experience")

29 Real Estate Acquisition Program: Methodology There are approximately 26, acres of industrial acres in the Port District. Of that total, the port controls roughly 15 percent or 3,78 acres. The majority of the port s portfolio is consumed by air-side and marine-side uses. Near-term the port is actively optimizing its existing real estate portfolio, as described in Section 1 of the Real Estate Strategic Plan, to accommodate new jobs and drive economic growth. In parallel the port also intends to expand its real estate footprint by acquiring and reactivating port supportive land that is otherwise underutilized. Port supportive land can generally be characterized as industrially oriented land that is located in close proximity to corridors connecting real estate to the seaport and airport. The port is pursuing this effort because in large part port supportive land is scarce. Seattle is a global gateway region and securing and enhancing this functionality is important for maintaining this status. The port is well positioned to acquire and reactivate challenged properties because (1) it can be patient, (2) it is motivated to create jobs, and (3) it can leverage interjurisdictional experience and relationships to help clear development hurdles that would otherwise impede the private sector. APPROACH In order to accomplish this objective the Port is taking a three pronged approach for identifying potential non-port properties. PORT ADJACENT: Identify land that is adjacent to port owned real estate that may enhance underutilized port land or may optimize the functionality of existing port assets. SITE NOMINATION: A solicitation letter was sent to each city in the Port District and the county to request sites for nomination. The request asked for (1) properties or areas that are not currently zoned for industrial use, but that the nominating jurisdiction may be interested in converting to industrial over the near or long-term or (2) properties or areas that may be suitable for industrial uses but remain undeveloped or underutilized because of an infrastructure deficiency such as road access, or utility capacity or because of real or perceived environmental contamination. SITE SEARCH TOOL: A site search tool was created using King County Assessor data. This tool ranks industrially zoned properties for based on their potential revitalization through a weighing process using a number of factors such as proximity to rail, the airport, and highways, location relative to known contamination, and location relative to streams and wetlands. KING COUNTY SUPPORTIVE REAL ESTATE SITE SELECTION PROCESS King County Industrial Properties NOT PORT OWNED 8,5 22, PARCELS ACRES BASELINE PORT ADJACENT SITE NOMINATION SITE SEARCH TOOL 27


30 Real Estate Acquisition Program: Summary 21 SITES IDENTIFIED SITES BY METHOD 5 NOMINATED SITE 12 SITE 4 PORT SEARCH ADJACENT TOOL SITES S BY AREA 5 KENT VALLEY AIRPORT 6 1 SEAPORT Salmon Bay/ Interbay Seaport Harbor Island/ Duwamish Seattle Waterfront ACRES BY METHOD ACRES BY AREA ASSESSED VALUE BY METHOD ASSESSED VALUE BY AREA Airport $122.5M $99.2M $66M $212.6M $24.9M $5.1M $1M $2M $2M $1M $3M $3M There are several port adjacent properties that are underutilized and in some cases available in the near term that may add value to existing properties. The majority of the properties identified have known or perceived constraints that has hindered private investment. These constraints include: - Contamination - Wetlands and/or shoreline restrictions - Public facilities that need to be relocated Almost all of the potential target properties p are located in a designated Manufacturing Industrial Center which tend to support long-term industrial uses by limiting other commercial development. The Nominated properties are opportunities to engage with local government partners and explore options for resolving site challenges that have otherwise inhibited redevelopment. Kent Valley 28
31 Real Estate Acquisition Program: Strategy & Financial Analysis ACQUISITION VALUE ADD INVESTMENTS GROUND LEASING The process of acquiring a target property can vary based on the unique circumstance of the property and the seller. In all cases the Port will require a feasibility period to allow for necessary study of the property. In some cases, the Port may pursue site control through a purchase option agreement so that long-lead-time activities such as environmental remediation and rezoning can be completed before closing and entering the chain of tile. The average size and value of properties within each submarket were used to model the financial aspects of the Acquisition Program in the 2 year cash flow summarized below. The Program anticipates that the Port will be making investments that improve the viability of developing the property by the private sector. During the feasibility period, the Port will estimate both the cost of overcoming obstacles to redevelopment and the resulting market value of the property. The purchase price of the property should reflect the conditions affecting the property to allow the Port to recoup its investment over the long term through ground lease to a user or developer. Though the size of the value add investments will vary significantly, the financial model assumes those investments equal 25% of the acquisition price. Long term ground leases are one of the lowest risk real estate investments because the lessee s improvements serve as security for the lease. While some developers will not build on a ground lease, the Port has demonstrated an ability attract qualified developers and structure transactions that meet the needs of developers and their capital partners, and generate a positive Net Operating Income (NOI) for the Port. For the purposes of forecasting the future cash flow of the Acquisition Program, the model assumes that the Port is able to secure ground leases with developers or users that generate rent equal to 6% of the acquisition price plus the value add investments. NEAR TERM ACTIONS Outreach Continue to educate public and private stakeholders and potential partners about the Port s real estate development goals and activities. Site Identification & Underwriting Prioritize potential acquisition targets and systematically engage with agencies and property owners to identify opportunities where the Port s objectives can be achieved. CONTRIBUTION TO CENTURY AGENDA As illustrated in the cash flow summary, the Acquisition Program has the potential to make a major contribution to the Century Agenda goals: $9 Million/Year NOI Stabilized Year 2 NOI 6,663 Jobs ECONOMIC IMPACT Direct Jobs 1,971 Indirect Jobs 4,692 TOTAL TOTALS Acquisition ($111,621,411) ($5,998,212) ($2,271,735) ($19,29,96) ($9,64,98) ($15,993,54) ($2,271,735) ($2,271,735) Value Add ($27,95,353) ($749,777) ($3,283,743) ($4,935,212) ($3,61,868) ($3,199,754) ($4,533,99) ($5,67,934) ($2,533,967) Revenue $8,354,818 $374,888 $1,641,872 $2,842,494 $3,442,85 $4,442,371 $5,756,216 $7,181,572 1 Year Net Cash Flow $79,73,471 ($5,998,212) ($21,21,512) ($22,493,73) ($14,165,34) ($17,953,5) ($2,628,995) ($21,362,28) ($625,562) $3,222,249 $7,181,572 NPV* $1,92,846 * Assumes reversion in 227 and discount rate of 4% 29
32 Real Estate Portfolio Strategy: Financial & Economic Impact Analysis 3 PORT REAL ESTATE DEVELOPMENT ASSETS TOTALS % T9/91 1 Year Net Cash Flow ($38,272,5) ($9,922,5) ($28,35,) NPV ($26,587,867) T91 Uplands 1 Year Net Cash Flow ($53,557,757) ($4,779,621) ($21,62,348) ($19,4,62) $136,267 ($17,323,212) $2,596,589 ($1,67,362) $4,738,373 ($4,1,447) $6,749,65 $112,493,423 NPV $3,37,225 CEM 1 Year Net Cash Flow $6,241,67 ($325,) $784,8 $784,8 $784,8 $784,8 $784,8 $882,9 $882,9 $882,9 $14,71,5 NPV $1,36,983 Pier 2 1 Year Net Cash Flow $3,672,672 ($3,) $418,176 $418,176 $418,176 $418,176 $418,176 $47,448 $47,448 $47,448 $47,448 $7,84,8 NPV $5,612,94 T16 1 Year Net Cash Flow $13,31,243 ($125,) ($2,126,121) $1,291,54 $1,894,54 $2,354,467 $2,371,148 $2,388,25 $2,617,464 $2,635,44 $43,924,6 NPV $25,969, Acre 1 Year Net Cash Flow $818,563 ($15,) ($25,) $174,8 $348,161 $348,161 $348,161 $5,82,68 NPV $2,854,148 2th Street 1 Year Net Cash Flow $2,43,388 ($4,) $271,488 $542,975 $542,975 $542,975 $542,975 $9,49,584 NPV $4,913,36 55-Acre 1 Year Net Cash Flow ($1,751,16) ($6,534,) ($378,149) $64,395 $729,64 $729,64 $729,64 $729,64 $82,197 $82,197 $13,669,945 NPV $2,97,141 L-Shaped 1 Year Net Cash Flow ($59,935,741) ($9,6,48) ($7,771,215) ($22,23,473) ($13,57,46) ($41,714,49) $7,154,971 $8,851,226 $9,74,59 $9,33,59 $155,59,84 NPV $18,528,134 NERA 2 & 3 1 Year Net Cash Flow $5,984,198 ($1,) $556,231 $66,231 $656,231 $656,231 $656,231 $738,26 $738,26 $738,26 $738,26 $12,34,339 NPV $9,26,57 DMCBP North 1 Year Net Cash Flow $6,32,114 ($1,) ($1,) $7,13 $75,13 $75,13 $75,13 $75,13 $843,866 $843,866 $843,866 $14,64,435 NPV $9,65,59 DMCBP West 1 Year Net Cash Flow $3,471,113 ($1,) ($1,) $394,312 $444,312 $444,312 $444,312 $444,312 $499,851 $499,851 $499,851 $8,33,85 NPV $5,627,499 TOTALS Year Net Cash Flow Pre Development Soft Costs ($7,56,673) ($5,29,621) ($23,3,768) ($8,425,485) ($14,141,976) ($15,851,583) ($2,418,762) ($1,392,479) Infrastructure Hard Costs ($62,733,672) ($35,) ($14,16,6) ($17,34,5) ($1,867,8) ($15,127,) ($4,6,312) ($1,653,) ($8,265,) Development ($11,25,26) ($5,856,322) ($2,696,18) ($35,446,645) ($4,622,782) ($5,257,748) ($2,325,51) NOI $131,547,228 $1,74,47 $5,29,123 $9,664,44 $12,38,63 $14,141,875 $19,462,828 $22,425,43 $23,426,965 $23,834,484 1 Year Net Cash Flow ($111,952,143) ($5,379,621) ($36,332,42) ($26,377,185) ($27,41,353) ($54,117,166) ($32,959,981) $12,552,8 $21,32,565 $12,836,455 $23,834,484 $397,241,42 NPV $71,971,488 IRR 15%
33 Real Estate Portfolio Strategy: Financial & Economic Impact Analysis PORT REAL ESTATE ACQUISITIONS BY SUBMARKET SEATTLE CAPITALIZED VALUE TOTALS % Acquisition ($6,815,25) ($2,271,735) ($2,271,735) ($2,271,735) Value Add ($15,23,81) ($2,533,967) ($2,533,967) ($2,533,967) ($5,67,934) ($2,533,967) Revenue $4,919,66 $1,266,983 $1,266,983 $1,266,983 $1,266,983 $2,533,967 $3,959,323 $3,959,323 $3,959,323 $3,959,323 $4,117,696 $4,454,239 $4,454,239 $4,454,239 Net Cash Flow $39,137,91 ($2,271,735) ($2,533,967) ($2,533,967) $1,266,983 ($19,4,752) ($21,538,718) ($3,8,95) $3,959,323 $3,959,323 $3,959,323 $3,959,323 $4,117,696 $4,454,239 $4,454,239 $4,454,239 $74,237,311 NPV -$22,481 SEATAC Acquisition ($28,814,94) ($19,29,96) ($9,64,98) Value Add ($7,23,735) ($2,41,245) ($3,61,868) ($1,2,623) Revenue $22,933,766 $1,2,623 $1,8,934 $1,8,934 $1,8,934 $1,8,934 $1,951,12 $2,26,5 $2,26,5 $2,26,5 $2,26,5 $2,194,888 $2,279,37 Net Cash Flow $24,93,537 ($19,29,96) ($12,6,225) ($3,61,868) $1,8,934 $1,8,934 $1,8,934 $1,8,934 $1,951,12 $2,26,5 $2,26,5 $2,26,5 $2,26,5 $2,194,888 $2,279,37 $37,988,446 NPV $1,781,71 KENT VALLEY Acquisition ($5,998,212) ($5,998,212) Value Add ($1,499,553) ($749,777) ($749,777) Revenue $5,881,59 $374,888 $374,888 $374,888 $374,888 $374,888 $421,749 $421,749 $421,749 $421,749 $421,749 $474,468 $474,468 $474,468 $474,468 Net Cash Flow $6,291,93 ($5,998,212) ($749,777) ($749,777) $374,888 $374,888 $374,888 $374,888 $374,888 $421,749 $421,749 $421,749 $421,749 $421,749 $474,468 $474,468 $474,468 $474,468 $7,97,799 NPV $592,231 OTHER Acquisition ($15,993,54) ($15,993,54) Value Add ($3,998,264) ($1,999,132) ($1,999,132) Revenue $1,62,387 $999,566 $999,566 $999,566 $999,566 $999,566 $1,124,512 $1,124,512 $1,124,512 $1,124,512 $1,124,512 Net Cash Flow $9,37,93 ($15,993,54) ($1,999,132) ($1,999,132) $999,566 $999,566 $999,566 $999,566 $999,566 $1,124,512 $1,124,512 $1,124,512 $1,124,512 $1,124,512 $18,741,86 NPV -$1,614,89 TOTAL Acquisition ($111,621,411) ($5,998,212) ($2,271,735) ($19,29,96) ($9,64,98) ($15,993,54) ($2,271,735) ($2,271,735) Value Add ($27,95,353) ($749,777) ($3,283,743) ($4,935,212) ($3,61,868) ($3,199,754) ($4,533,99) ($5,67,934) ($2,533,967) Revenue $8,354,818 $374,888 $1,641,872 $2,842,494 $3,442,85 $4,442,371 $5,756,216 $7,181,572 $7,331,65 $7,46,689 $7,531,635 $7,742,726 $8,79,269 $8,248,16 $8,332,525 1 Year Net Cash Flow $79,73,471 ($5,998,212) ($21,21,512) ($22,493,73) ($14,165,34) ($17,953,5) ($2,628,995) ($21,362,28) ($625,562) $3,222,249 $7,181,572 $7,331,65 $7,46,689 $7,531,635 $7,742,726 $8,79,269 $8,248,16 $8,332,525 $138,875,416 NPV $1,92,846 IRR 4% 31
34 Real Estate Portfolio Strategy: Financial & Economic Impact Analysis OTHER PORT RE ACTIVITES TOTALS FT - 4k Light Industrial (1) building construction ($1,,) ($8,) ($4,5,) ($4,7,) Total development cost / per SF building lease $4,113,349 $545, $558,625 $572,591 $586,95 $61,578 $616,617 $632,33 $12 + 5k $25 FT - 4k Light Industrial (2) building construction ($1,,) ($8,) ($4,5,) ($4,7,) Total development cost / per SF building lease $1,676,216 $545, $558,625 $572,591 $12 + 5k $25 P66 Façade Redevelopment infrastructure ($12,,) ($3,45,) ($8,45,) ($1,) Current ROM cost Maritime acquisition ($18,,) ($18,,) Property acquisition and Current NOI current NOI $7,541,722 $675, $691,875 $79,172 $726,91 $745,74 $763,71 $782,793 $82,363 $822,422 $822,422 Current NOI Maritime - 7k Light Industrial building construction ($14,,) ($4,) ($2,1,) ($1,95,) ($55,) 7k $2 per SF current NOI $6,339,841 $84, $861, $882,525 $94,588 $927,23 $95,383 $974,142 $12 per SF Maritime Property + Options acquisition ($38,,) ($38,,) $38m CBD site Development of SODO property $8,72,283 $2,1, $2,152,5 $2,26,313 $2,261,47 ground lease 4 $12. per SF gross 1 Year Net Cash Flow ($12,,) ($22,65,) ($15,5,) ($15,75,) ($38,55,) ($8,) ($4,5,) ($4,7,) NOI $28,391,411 $675, $691,875 $79,172 $2,111,91 $2,164,699 $2,218,816 $4,374,287 $5,28,644 $5,154,36 $5,262,658 32
: - About 13, direct jobs related to the Port and its user and tenant activities - Translating to about 216, total jobs in the area - Total")


35 Real Estate Portfolio Strategy: Financial & Economic Impact Analysis BACKGROUND Port of Seattle generates major economic benefits for the region. The most recent impact study found (for 213 activities): - About 13, direct jobs related to the Port and its user and tenant activities - Translating to about 216, total jobs in the area - Total personal income of $9.6B, business revenue of $19.8B and state/local tax revenue of $894M MEASURES OF IMPACT Jobs: Year-round jobs, full or part-time. Wages: Includes wages, salaries & proprietors income. Excludes benefits. Also termed personal income. Sales: Revenue or output of production and sales in each sector. For wholesale and retail, means the margin added to goods sold. Taxes: State and local government revenues, from all types of taxes. LEVELS OF IMPACT Direct: Economic activities directly related to Port tenants or users. The first round of spending, employment, wages and taxes. Indirect: Successive rounds of interindustry purchases by firms, of goods and services, and related employment supporting direct economic activities. This is the ripple effect through the economy. Induced: Household purchases based on employment earnings from direct and indirect economic activities. Those needs supplied by the local economy contribute to the regional economic impact KEY CONCEPTS Area: This analysis generally uses the State of Washington as the relevant region, reflecting prior studies using state-based multipliers. Leakages: Place of residence and savings rates, two elements that can complicate economic impact studies, are not a concern here as port-related jobs are heavily based in the Seattle metro area and the US household savings rate has remained constant in recent years. Basic industries: Service and manufacturing activities (those studied in this analysis) represent basic industries giving rise direct, indirect and induced economic impacts. 3, 25, 2, 15, 1, 5, Seattle MSA Employment by Selected Major Categories, Construction 3 Manufacturing 42 Retail Trade 6 Professional & Business Srvcs 7 Leisure and Hospitality Seattle s economy is well diversified, leading to favorable economic multipliers Activity (selected current/potential uses) Jobs multiplier Fishing - Deepsea 1.96 Cruise terminal (including Sea-Tac passengers) 2.5 Air cargo 1.79 Warehousing 2.62 Manufacturing Machine shop 2.3 Manufacturing High-tech startup incubator 3.75 Office Services (high-end) 3.96 Office Services (average) 1.39 Retail 1.48 Restaurants 1.44 Indirect and induced spending creates a multiplier effect on jobs and income DATA SOURCES: ACTIVITY VIEWS Sea-Tac s operations produce major direct economic impacts Cruise ships attract many passengers to Seattle PORT ACTIVITY Sea-Tac, cargo handling, cruise, fishing, marinas and retail activities PORT FACILITIES Wide range of Port facilities, both waterfront and inland Additional undeveloped properties can be put to productive use ECONOMIC IMPACT Port of Seattle properties and their economic activities generate substantial direct, indirect and induced benefits for the region IMPACT OUTLOOK Stable to increasing, for fishing, cruise and air cargo facilities Martin Associates: The 213 Economic Impact of the Port of Seattle, Oct 214, for impacts related to fishing, cruise and air cargo operations. Tax Foundation: Facts & Figures: How Does Your State Compare?, 216, for estimates of state and local tax impacts as a percent of total earnings. US Commerce Department, Bureau of Economic Analysis and Bureau of Labor Statistics, for wage and employment data in various economic sectors. Washington State Office of Financial Management: The 27 Washington Input-Output Study, Aug 212 (Rev Oct 215), for economic multipliers in a broad range of sectors. The Port s fishing terminals support a major local industry 33
Real Estate Strategic Plan: Port Commission Final Presentation
 Item No. 7a_supp Date of Meeting October 25 th, 2016 Real Estate Strategic Plan: Port Commission Final Presentation October 25 th, 2016 1 Overview I. Real Estate Plan Objectives II. Real Estate Development
Chapter 5: Testing the Vision. Where is residential growth most likely to occur in the District? Chapter 5: Testing the Vision
 Chapter 5: Testing the Vision The East Anchorage Vision, and the subsequent strategies and actions set forth by the Plan are not merely conceptual. They are based on critical analyses that considered how
Transit-Oriented Development Specialized Real Estate Services
 COLLIERS INTERNATIONAL Transit-Oriented Development Specialized Real Estate Services Accelerating success. Colliers International transit-oriented development GROUP P. 1 2 transit-oriented development
>> Asking Rents Increase As Space Remains Limited
 Research & Forecast Report MID-COUNTIES INDUSTRIAL Accelerating success. >> Asking Rents Increase As Space Remains Limited Key Takeaways > Average asking rents increased $0.02 Per Square Foot (P) Triple
City of Tacoma Zoning Reference Guide
 City of Tacoma Zoning Reference Guide Planning and Development Services 747 Market Street, Room 345 Tacoma, WA 98402 (253) 591-5577 This document should not be used as a substitute for codes and regulations.
2014 Plan of Conservation and Development. Development Plan & Policies
 The Town of Hebron Section 3 2014 Plan of Conservation and Development Development Plan & Policies C. Residential Districts I. Residential Land Analysis This section of the plan uses the land use and vacant
Quayside Site Plan NOVEMBER 29, 2018
 Quayside Site Plan DRAFT M E D I A P R E V I E W I N A D V A N C E O F D E C E M B E R 8 TH P U B L I C R O U N D T A B L E NOVEMBER 29, 2018 Sidewalk Labs: Who We Are Sidewalk Labs We aim to combine world-class
HOUSING ELEMENT GOALS, OBJECTIVES, & POLICIES
 HOUSING ELEMENT GOALS, OBJECTIVES, & POLICIES GOAL H-1: ENSURE THE PROVISION OF SAFE, AFFORDABLE, AND ADEQUATE HOUSING FOR ALL CURRENT AND FUTURE RESIDENTS OF WALTON COUNTY. Objective H-1.1: Develop a
Generic Environmental Impact Statement. Build-Out Analysis. City of Buffalo, New York. Prepared by:
 Generic Environmental Impact Statement Build-Out Analysis City of Buffalo, New York 2015 Prepared by: TABLE OF CONTENTS 1.0 INTRODUCTION 1 2.0 METHODOLOGY 2 3.0 EXISTING LAND USE 3 4.0 EXISTING ZONING
THE ADVISORY. READY FOR CHANGING TIDES? How Real Estate Companies Can Prepare for a New Cap Rate Era. Eric Willett, Senior Associate
 READY FOR CHANGING TIDES? How Real Estate Companies Can Prepare for a New Cap Rate Era Eric Willett, Senior Associate 2 Ready for Changing Tides? How Real Estate Companies Can Prepare for a New Cap Rate
FOR SALE. GULF TO BAY RETAIL CENTER 1454 Gulf to Bay Blvd Clearwater, FL Clearwater CBD Submarket
 FOR SALE GULF TO BAY RETAIL CENTER 1454 Gulf to Bay Blvd Clearwater, FL 33755 Clearwater CBD Submarket Michael L. Johns, MBA Principal Designated Broker Single-Tenant Net Lease Advisor Investment Properties
Industrial Real Estate Portfolio
 Industrial Real Estate Portfolio Portfolio Coverage Page 7 6565 Echo Avenue, Reno, NV Property Summary Address: Size (SF): Office Finish: HVAC Space: Year Built: 2003 Site Area: 6565 Echo Avenue Reno,
REAL ESTATE AND THE ECONOMIC OUTLOOK THROUGH 2013:
 1 1 REAL ESTATE AND THE ECONOMIC OUTLOOK THROUGH 2013: Coping With A Different Kind Of Housing Recovery A Presentation To The Commercial Real Estate Education Summit Monrovia, California July 13, 2012
DRAFT FOR DISCUSSION PURPOSES ONLY. Port Credit Local Area Plan Built Form Guidelines and Standards DRAFT For Discussion Purposes
 Port Credit Local Area Plan Built Form Guidelines and Standards DRAFT For Discussion Purposes 1 Local Area Plan - Project Alignment Overview Directions Report, October 2008 (General Summary Of Selected
United States Post Office and Multi-Family Residential; and, Single- Family Residence with an Apartment
 Planning Commission File No.: AME2013 0009 January 9, 2014 Page 2 of 9 Existing Land Use: United States Post Office and Multi-Family Residential; and, Single- Family Residence with an Apartment Surrounding
Building For Sale 401 Rainier Ave N Renton WA Offering Memorandum
 Building For Sale 401 Rainier Ave N Renton WA 98055 Offering Memorandum Please contact: Rich Cannon 206.436.2345 rich@cannoncommercial.com 520 Pike St, Suite 1505 Seattle WA 98101 www.cannoncommercial.com
Real Estate Market Analysis
 One of the challenges facing the West Berkeley shuttle is to consider whether to expand the service beyond the current operations serving major employers, to a system that provides access to a more diverse
QUEEN ANNE 2648 & th Avenue W, Seattle, WA 98119
 QUEEN ANNE 2648 & 2650 14th Avenue W, Seattle, WA 98119 A MULTI-FAMILY INVESTMENT OPPORTUNITY + Adjacent 5 unit properties + Situated on 12,000 SF of LR1 + 4 Townhouse-st yle Units + Large Decks, territorial
Provide a diversity of housing types, responsive to household size, income and age needs.
 8 The City of San Mateo is a highly desirable place to live. Housing costs are comparably high. For these reasons, there is a strong and growing need for affordable housing. This chapter addresses the
San Francisco Bay Area to Napa County Housing and Economic Outlook
 San Francisco Bay Area to 019 Napa County Housing and Economic Outlook Bay Area Economic Forecast Summary Presented by Pacific Union International, Inc. and John Burns Real Estate Consulting, LLC On Nov.
Advance Auto Parts Building For Sale
 Advance Auto Parts Building For Sale 14307 1st Avenue South Burien WA 98168 Sale Price: $1,650,000 6.93% cap rate Exclusively Offered By: Rich Cannon 206.436.2345 rich@cannoncommercial.com Executive Summary
$7,700,000. Airport Business Center FOR SALE PROPERTY NE 80th Ave, 7820 NE Holman Ave, 6130 NE 78th Ct Portland, OR 97218
 $7,700,000 PROPERTY THOMAS MCDOWELL 503.225.8473 TomM@norris-stevens.com RAYMOND DUCHEK 503.225.8492 RaymondD@norris-stevens.com ±48,756 Rentable Square Feet 3 Building Complex Class B with Amenities Convenient
CHAPTER 2 VACANT AND REDEVELOPABLE LAND INVENTORY
 CHAPTER 2 VACANT AND REDEVELOPABLE LAND INVENTORY CHAPTER 2: VACANT AND REDEVELOPABLE LAND INVENTORY INTRODUCTION One of the initial tasks of the Regional Land Use Study was to evaluate whether there is
Hathaway Building th Ave S Seattle, WA Bruce Kahn, CCIM, CPM
 EXCELLENT South Seattle Location - Across the street from the Furniture Mart - Tenant to vacate April 2014 Super re-development opportunity - easily convert to 40,000 SF Office with Ample Free Parking-
L. LAND USE. Page L-1
 L. LAND USE 1. Purpose This section discusses current and likely future land use patterns in Orland. An understanding of land use trends is very important in determining Orland's ability to absorb future
Detroit Inclusionary Housing Plan & Market Study Preliminary Inclusionary Housing Feasibility Study Executive Summary August, 2016
 Detroit Inclusionary Housing Plan & Market Study Preliminary Inclusionary Housing Feasibility Study Executive Summary August, 2016 Inclusionary Housing Plan & Market Study Objectives 1 Evaluate the citywide
STAFF REPORT. Permit Number: Unlimited. Kitsap County Board of Commissioners; Kitsap County Planning Commission
 STAFF REPORT Permit Number: 15 00550 Unlimited DATE: March 2, 2016 TO: FROM: Kitsap County Board of Commissioners; Kitsap County Planning Commission Katrina Knutson, AICP, Senior Planner, DCD and Jeff
Subject. Date: 2016/10/25. Originator s file: CD.06.AFF. Chair and Members of Planning and Development Committee
 Date: 2016/10/25 Originator s file: To: Chair and Members of Planning and Development Committee CD.06.AFF From: Edward R. Sajecki, Commissioner of Planning and Building Meeting date: 2016/11/14 Subject
INDUSTRIAL LAND FOR SALE
 INDUSTRIAL LAND FOR SALE INDUSTRIAL LAND & DEVELOPMENT OPPORTUNITIES 260 ACRE INDUSTRIAL BUSINESS PARK LOTS RANGING FROM 5 45 ACRES Property Features Nexus at DIA provides a compelling opportunity for
JOB DESCRIPTION MANAGEMENT EXCLUSION
 1. Position No. Various 2. Descriptive Working Title SENIOR DEVELOPMENT MANAGER JOB DESCRIPTION MANAGEMENT EXCLUSION 3. Present Classification Excluded Mgmt 4. Branch DEVELOPMENT AND ASSET 5. Department
Salem HNA and EOA Advisory Committee Meeting #6
 Salem HNA and EOA Advisory Committee Meeting #6 Residential Land Policies Employment Land Policies Policy Discussions with the Committee Outcome of today s meeting Direction from this Committee on proposed
>> Vacancy Falls To Lowest Rate Ever
 Research & Forecast Report San Gabriel VALLEY INDUSTRIAL Accelerating success. >> Vacancy Falls To Lowest Rate Ever Key Takeaways Market Indicators Relative to prior period Forecast Construction Rental
OTHELLO STATION DEVELOPMENT SITE
 \ OTHELLO STATION DEVELOPMENT SITE OFFERING Paragon Real Estate Advisors is please to exclusively offer for sale the Othello Station Development Site. This property presents an investor with the opportunity
EAST LAKE Harvard Avenue East Seattle, WA PROPERTY HIGHLIGHTS A MULTI-FAMILY DEVELOPMENT OPPORTUNITY 32 SEDU + 2 RETAIL DEVELOPMENT SITE
 EAST LAKE 3120 Harvard Avenue East Seattle, WA 98102 A MULTI-FAMILY DEVELOPMENT OPPORTUNITY PROPERTY HIGHLIGHTS 32 SEDU + 2 RETAIL DEVELOPMENT SITE FULLY PERMITTED PRIME EASTLAKE LOCATION CONTACT INFORMATION:
The Art of Economic Development
 City Government 101 Economic Development February 4, 2016 The Art of Economic Development ED is a complex process will address some basic concepts especially relevant to Des Moines Many definitions of
EXECUTIVE SUMMARY. Executive Summary Donald L Tucker Civic Center District Economic Development Study
 EXECUTIVE SUMMARY The overall Tallahassee/Leon County economy was not as negatively impacted by the Great Recession as was the State of Florida as a whole, because its economy is largely driven by State
Soaring Demand Drives US Industrial Market to New Heights
 Soaring Demand Drives US Industrial Market to New Heights Capitas (DIFC) Limited I June Issue: 2017 THIS ISSUE COVERS: The Amazon Factor a seismic shift in the way people shop Industrial real estate hitting
INDUSTRIAL REAL ESTATE TRENDS
 INDUSTRIAL REAL ESTATE TRENDS Presented to: 2015 CCIM Commercial Real Estate Outlook Conference Presented by: CBRE, INC. Michael Silver, SIOR First Vice President Industrial Brokerage Services January
Barbara County Housing Element. Table 5.1 Proposed Draft Housing Element Goals, Policies and Programs
 Table 5.1 Proposed Draft Housing Element Goals, Policies and Programs Goal 1: Enhance the Diversity, Quantity, and Quality of the Housing Supply Policy 1.1: Promote new housing opportunities adjacent to
San Francisco Bay Area to Marin, San Francisco, and San Mateo Counties Housing and Economic Outlook
 San Francisco Bay Area to 019 Marin, San Francisco, and San Mateo Counties Housing and Economic Outlook Bay Area Economic Forecast Summary Presented by Pacific Union International, Inc. and John Burns
Sixth + Westlake Westlake Avenue. Free Standing Single Tenant. WESTLAKE ave. Colliers International 601 Union Street, Suite 5300
 6th street 1953 Avenue Seattle, WA 98101 Free Standing Single Tenant NNN Ground Lease WESTLAKE ave NEW AMAZON Paul Sleeth Executive Vice President +1 206 223 1266 paul.sleeth@colliers.com Billy Sleeth
HOUSING ELEMENT I. GOALS, OBJECTIVES AND POLICIES
 HOUSING ELEMENT I. GOALS, OBJECTIVES AND POLICIES GOAL 1: IN ORDER TO ACHIEVE A BALANCED HOUSING SUPPLY (AND A BALANCED POPULATION AND ECONOMIC BASE), EVERY EFFORT SHOULD BE MADE TO PROVIDE A BROAD RANGE
INDUSTRIAL QUICK STATS SUMMARY & OUTLOOK MARKET TRENDS VACANCY & NET ABSORPTION ECONOMIC STATS. Current Quarter. Direct Vacancy 2.
 ORANGE COUNTY INDUSTRIAL SECOND QUARTER 218 QUICK STATS Direct Vacancy 2.2% Overall Vacancy 2.5% Lease Rate NNN $.95 Gross Absorption Under Construction MARKET TRENDS Current Quarter 2,956,71 SF 1,367,18
Transfers of Property Q Sound Transit did not transfer any properties subject to RCW (1)(b) during the first quarter of 2018.
(b) during the first quarter of 2018.") Sound Transit s Office of Land Use Planning & Development Transit Oriented Development Quarterly Status Report Q1 2018 Background RCW 81.112.350 requires Sound Transit to provide quarterly reports of any
Sound Transit s Office of Land Use Planning & Development Transit Oriented Development Quarterly Status Report Q1 2018 Background RCW 81.112.350 requires Sound Transit to provide quarterly reports of any
Developing and Managing Industrial Land and Space. Hafiz Sayuti General Counsel
 Developing and Managing Industrial Land and Space Hafiz Sayuti General Counsel 6 November 2015 Outline 1. Mission and Role 2. Key Development Initiatives Developing innovative, next generation facilities
PEACHTREE INDUSTRIAL BOULEVARD small area study
 PEACHTREE INDUSTRIAL BOULEVARD small area study EXECUTIVE SUMMARY: MARKET RESEARCH FINDINGS DUNWOODY CITY COUNCIL RETREAT JUNE 4, 2018 STUDY SCOPE AND GOALS Bleakly Advisory Group (BAG) was retained to
E-commerce. E-commerce in the Bay Area. United States Year End How consumer demand for expedited deliveries is driving real estate
 1 E-commerce in the Bay Area United States Year End 2016 How consumer demand for expedited deliveries is driving real estate 2 Last-mile delivery and a new era for industrial Introduction real estate Adjusting
Monthly Market Snapshot
 SEPTEMBER 2018 Vacancy continues to fall. Nearing the end of the third quarter, the vacancy rate dropped 10 basis points to 6.4%, compared to this time last month at 6.5%. Occupancy of the 1.1 million
>> Negative Net Absorption Despite Completions
 Research & Forecast Report MID-COUNTIES INDUSTRIAL Accelerating success. >> Negative Net Absorption Despite Completions Key Takeaways > This quarter, 542,000 square feet of industrial space finished construction,
Strong Absorption Drives Down Vacancy to Start 2017
 Research & Forecast Report GREATER PHOENIX INDUSTRIAL 2017 Strong Absorption Drives Down to Start 2017 Key Takeaways >> Industrial vacancy in Greater Phoenix dipped below 10 percent in the first quarter,
Detroit Neighborhood Housing Markets
 Detroit Neighborhood Housing Markets Market Study 2016 In 2016, Capital Impact s Detroit Program worked with local and national experts to determine the residential market demand across income levels for
San Diego County Vol. XX, Issue I Rental Trends Executive Summary March 2007
 Real Estate Research and Consulting for over 25 years Vol. XX, Issue I Rental Trends Executive Summary Editor: Robert D. Martinez- Director of Research s institutional grade rental complexes experienced
>> Vacancy Drops As Rents Continue To Rise
 Research & Forecast Report South Bay OFFICE Q3 2017 Accelerating success. >> Drops As Rents Continue To Rise Key Takeaways > Leasing activity fell year-over-year by 17.8%, the third consecutive quarter
Planning Justification Report
 Planning Justification Report Kellogg s Lands City of London E&E McLaughlin Ltd. June 14, 2017 Zelinka Priamo Ltd. Page i TABLE OF CONTENTS Page No. 1.0 2.0 2.1 2.2 3.0 4.0 5.0 5.1 5.2 5.3 5.4 5.5 5.6
SODO INDUSTRIAL BUILDING
 SODO INDUSTRIAL BUILDING 3628 E Marginal Way S Seattle, WA 98134 For more information contact: PROPERTY HIGHLIGHTS Well maintained warehouse & office space in the heart of Sodo Industrial District 1,734
Reuse and Redevelopment of Business Sites and Facilities
 Reuse and Redevelopment of Business Sites and Facilities A presentation by Lee Smith, President Elesco Limited To the Northwest Economic Development Course Central Washington University Ellensburg, Washington
Houston Summer Retail. Office. July 2016 Commercial Markets. Independent Valuations for a Variable World Page 1. Summary Q1 Statistics
 July 2016 Commercial Markets In This Issue Commercial Markets Retail Office Industrial Multifamily Housing Trends Single Family Housing Lot Supply & New Home Data % 10% 8% 6% 4% 2% 0% Retail 2007 Q1 2008
RESEARCH & FORECAST REPORT
 Q3 2012 OFFICE LAS VEGAS NEVADA RESEARCH & FORECAST REPORT Office Forges Ahead Southern Nevada s office market continued to post positive net absorption in the third quarter of 2012, despite weak employment
UNIVERSITY DISTRICT LAND
 UNIVERSITY DISTRICT LAND 4002-4006 Pasadena Place NE Seattle, WA 98105 A MULTI-FAMILY DEVELOPMENT OPPORTUNITY PROPERTY HIGHLIGHTS 96 MICRO UNIT DEVELOPMENT SITE SOLID CASHFLOW IN PLACE DEVELOPER TERMS
BUILDING VALUE THROUGH DEVELOPMENT
 BUILDING VALUE THROUGH DEVELOPMENT DELIVERING LONG-TERM RETURNS GWL Realty Advisors is a leading real estate investment advisor providing comprehensive asset management, property management, development
LITTLE MOUNTAIN ADJACENT AREA REZONING POLICY
 LITTLE MOUNTAIN ADJACENT AREA REZONING POLICY JANUARY 2013 CONTENTS 1.0 INTENT & PRINCIPLES...1 2.0 APPLICATION...2 3.0 HOUSING TYPES, HEIGHT & DENSITY POLICIES...3 3.1 LOW TO MID-RISE APARTMENT POLICIES...4
OTHELLO DEVELOPMENT SITE
 OFFERING Paragon Real Estate Advisors is pleased to exclusively offer for sale the Othello Development Site. This property presents an investor with the opportunity to acquire a property that is primed
When the Plan is not Enough
 When the Plan is not Enough Christine Maguire, AICP, EDFP Redevelopment Manager Planning & Community Development 1 Rail~Volution 2012 When the Plan is Not Enough: Garland, TX 16 October 2012 About the
COMMUNICATION URBAN DESIGN REVIEW BOARD CITY OF DES MOINES, IOWA NOVEMBER 1, 2016, 2016 MEETING
 COMMUNICATION URBAN DESIGN REVIEW BOARD CITY OF DES MOINES, IOWA NOVEMBER 1, 2016, 2016 MEETING Subject: Recommendation Prepared by: PRELIMINARY DESIGN AND FINANCIAL REVIEW 401 SE 6 TH STREET- CONNOLLY
COLLIERS INTERNATIONAL 2019 LANDLORD SENTIMENT SURVEY
 COLLIERS INTERNATIONAL 2019 LANDLORD SENTIMENT SURVEY Colliers International 2019 Landlord Sentiment Survey 1 SURVEY OVERVIEW Colliers International s survey of landlords was conducted and completed between
Planning Rationale in Support of an Application for Plan of Subdivision and Zoning By-Law Amendment
 Planning Rationale in Support of an Application for Plan of Subdivision and Zoning By-Law Amendment The Kilmorie Development 21 Withrow Avenue City of Ottawa Prepared by: Holzman Consultants Inc. Land
2015 Downtown Parking Study
 2015 Downtown Parking Study City of Linden Genesee County, Michigan November 2015 Prepared by: City of Linden Downtown Development Authority 132 E. Broad Street Linden, MI 48451 www.lindenmi.us Table of
Cycle Monitor Real Estate Market Cycles Third Quarter 2017 Analysis
 Cycle Monitor Real Estate Market Cycles Third Quarter 2017 Analysis Real Estate Physical Market Cycle Analysis of Five Property Types in 54 Metropolitan Statistical Areas (MSAs). Income-producing real
Land Capacity Analysis
 Land Capacity Analysis City of Minneapolis Land Capacity Analysis June 2010 Submitted to: City of Minneapolis Community Planning & Economic Development Community Attributes tells data-rich stories about
ECONOMIC CURRENTS. Vol. 5 Issue 2 SOUTH FLORIDA ECONOMIC QUARTERLY. Key Findings, 2 nd Quarter, 2015
 ECONOMIC CURRENTS THE Introduction SOUTH FLORIDA ECONOMIC QUARTERLY Economic Currents provides an overview of the South Florida regional economy. The report presents current employment, economic and real
Existing Conditions: Economic Market Assessment
 Existing Conditions: Economic Market Assessment Introduction The US 24/40 Corridor Study examined existing conditions as they related to economic and commercial market assessments, existing land use, and
A Master Planned Community. Des moines, Washington,USA. Offering Summary
 A Master Planned Community Des moines, Washington,USA Offering Summary A Master Planned Community Des moines, Washington,USA Offering Summary SSI PACIFIC PLACE, LLC, DEVELOPER SUNWAY SERVICES, INC. 1612
Mueller. Real Estate Market Cycle Monitor Third Quarter 2018 Analysis
 Mueller Real Estate Market Cycle Monitor Third Quarter 2018 Analysis Real Estate Physical Market Cycle Analysis - 5 Property Types - 54 Metropolitan Statistical Areas (MSAs). It appears mid-term elections
AFFORDABLE HOUSING DISCUSSION PAPER POTENTIAL PROPERTIES REPORT VILLAGE OF RYE BROOK, NEW YORK
 AFFORDABLE HOUSING DISCUSSION PAPER POTENTIAL PROPERTIES REPORT VILLAGE OF RYE BROOK, NEW YORK PREPARED FOR: THE VILLAGE OF RYE BROOK VILLAGE BOARD PREPARED BY: MARILYN TIMPONE-MOHAMED, FREDERICK P. CLARK
The Onawa and CHAT Report
 The Onawa and CHAT Report Black Hills Energy A Community Housing Assessment Team Study Amy Haase, AICP March 10, 2014 Population Change Onawa, 1960-2010 3,500 3,000 3,176 3,154 3,283 2,936 3,091 2,998
MAKING THE MOST EFFECTIVE AND SUSTAINABLE USE OF LAND
 165 SOC146 To deliver places that are more sustainable, development will make the most effective and sustainable use of land, focusing on: Housing density Reusing previously developed land Bringing empty
Terrance Ware Manager, Transit-Oriented Development City & County of Honolulu
 Strategies for Implementing Transit-Oriented Development Terrance Ware Manager, Transit-Oriented Development City & County of Honolulu Mixed-use Neighborhood Transit Center Walking distance One mile grid
COLUMBIA COUNTY EVENTS CENTER PLANNING COMMITTEE REPORT (FINAL)
") COLUMBIA COUNTY EVENTS CENTER PLANNING COMMITTEE REPORT (FINAL) OCTOBER 9, 2012 1 INTRODUCTION The purpose of this report is to provide both elected officials and citizens with the information necessary
COLUMBIA COUNTY EVENTS CENTER PLANNING COMMITTEE REPORT (FINAL) OCTOBER 9, 2012 1 INTRODUCTION The purpose of this report is to provide both elected officials and citizens with the information necessary
>> Rents Rise To Highest Point Ever
 Research & Forecast Report SAN FERNANDO VALLEY & VENTURA COUNTY INDUSTRIAL Accelerating success. >> Rents Rise To Highest Point Ever Key Takeaways > Asking rental rates rose $.2 P NNN to $.69 P NNN. Rents
San Francisco Bay Area to Santa Clara & San Benito Counties Housing and Economic Outlook
 San Francisco Bay Area to 019 Santa Clara & San Benito Counties Housing and Economic Outlook Bay Area Economic Forecast Summary Presented by Pacific Union International, Inc. and John Burns Real Estate
Re: Fairwinds Amenity Contribution Analysis
 March 14 th, 2013 Jeremy Holm Manager, Current Planning Regional District of Nanaimo 6300 Hammond Bay Road Nanaimo, B.C. V9T 6N2 Re: Fairwinds Amenity Contribution Analysis The Regional District of Nanaimo
Enlightened Urbanism: A Model for Development of Vacant Buildings Downtown
 Enlightened Urbanism: A Model for Development of Vacant Buildings Downtown Amanda Phelps What is needed is not a new utopia... but rather a blueprint for a better reality. 1 O.M. Ungers San Antonio is
CARA CURREY Engineered, Approved SFR Lots. Auburn, WA
 CARA CURREY 206.334.0571 carac@windermere.com 55 Engineered, Approved SFR Lots Auburn, WA Mountain View Meadows Auburn, WA 55 Engineered SFR Lots TODD PETTIT 206.940.0212 tpettit@windermere.com Click Links
RITE AID RELOCATION STORE MCFARLAND, CALIFORNIA (BAKERSFIELD MSA)
") RITE AID RELOCATION STORE MCFARLAND, CALIFORNIA (BAKERSFIELD MSA) OFFERING MEMORANDUM $4,662,800 5.00% CAP RATE» New 20-Year NNN Lease with Corporate Guarantee» Guaranteed by Rite Aid Corporation» Fixed
RITE AID RELOCATION STORE MCFARLAND, CALIFORNIA (BAKERSFIELD MSA) OFFERING MEMORANDUM $4,662,800 5.00% CAP RATE» New 20-Year NNN Lease with Corporate Guarantee» Guaranteed by Rite Aid Corporation» Fixed
INDUSTRIAL QUICK STATS SUMMARY & OUTLOOK MARKET TRENDS VACANCY & NET ABSORPTION ECONOMIC STATS
 ORANGE COUNTY INDUSTRIAL FOURTH QUARTER 217 QUICK STATS Direct Vacancy 2.3% Overall Vacancy 2.7% Lease Rate NNN $.91 Gross Absorption Under Construction MARKET TRENDS Current Quarter 4,283,991 SF 963,138
SE corner of Locust Street and Loop 288, Denton, Texas
 1400 DALLAS DRIVE, DENTON, TX. 76205 Telephone (940) 484-9000; Fax (940) 380-9000 SE corner of Locust Street and Loop 288, Denton, Texas Map of location What type of retail is best suited for this location?
Planning Justification Report for 324 York Street
 Planning Justification Report for 324 York Street June 1 2018 This Planning Justification Report demonstrates how the continued use of the subject lands as a commercial surface area parking lot accords
SEATTLE AREA MULTIFAMILY DEVELOPMENT OPPORTUNITY 39.9 ACRES OF PRIME LAND SEATAC/TUKWILA SOUTH: HEART OF THE MARKET
 SITE SEATTLE AREA MULTIFAMILY DEVELOPMENT OPPORTUNITY 39.9 ACRES OF PRIME LAND SEATAC/TUKWILA SOUTH: HEART OF THE MARKET A NATIONAL PARTNERS INVESTMENT OPPORTUNITY EXECUTIVE SUMMARY THE OPPORTUNITY, Inc.
Sound Transit s Office of Land Use Planning & Development Transit Oriented Development Quarterly Status Report Q2 2018
 Sound Transit s Office of Land Use Planning & Development Transit Oriented Development Quarterly Status Report Q2 2018 Background RCW 81.112.350 requires Sound Transit to provide quarterly reports of any
Market Research. Market Indicators
 colliers international LAS VEGAS, NV Market Research OFFICE Third Quarter 2009 Market Indicators Net Absorption Construction Rental Rate Q3-09 Q4-2009 Projected Clark County Economic Data Jul-09 Jul-08
OWNER/USER OPPORTUNITY OR MULTI-TENANT INVESTMENT. Esquire Court South 259th Street, Kent, WA 98030
 OWNER/USER OPPORTUNITY OR MULTI-TENANT INVESTMENT Esquire Court 8407 South 259th Street, Kent, WA 98030 ESQUIRE COURT Table of Contents 01 02 03 The Opportunity The Opportunity Property Detail Property
Key Findings: Market Analysis
 Key Findings: Market Analysis Prepared by: WTL+a Washington, DC On behalf of: HDR, Inc. & Why a Market Study? Evaluate factors affecting demand for new development Analyze market drivers for new investment
Columbia County Events Center. Planning Committee Report October 9, 2012
 Columbia County Events Center Planning Committee Report October 9, 2012 INTRODUCTION INTRODUCTION The purpose of this report is to provide both elected officials and citizens with the information necessary
PORTLAND PLAN. Household and Employment Forecasts and Development Capacity
 PORTLAND PLAN Household and Employment Forecasts and Development Capacity Managing Change In recent decades, the Portland Metropolitan region and the City of Portland experienced a steady increase in population.
7. IMPLEMENTATION STRATEGIES
 7. IMPLEMENTATION STRATEGIES A. GENERAL APPROACH FOR IMPLEMENTATION Implementing the plan will engage many players, including the Municipality of Anchorage (MOA), the Government Hill Community Council,
Denver Comprehensive Housing Plan. Housing Advisory Committee Denver, CO August 3, 2017
 Denver Comprehensive Housing Plan Housing Advisory Committee Denver, CO August 3, 2017 Overview 1. Review of Comprehensive Housing Plan process 2. Overview of legislative and regulatory priorities 3. Overview
PROPOSED METRO JOINT DEVELOPMENT PROGRAM: POLICIES AND PROCESS July 2015 ATTACHMENT B
 PROPOSED METRO JOINT DEVELOPMENT PROGRAM: POLICIES AND PROCESS ATTACHMENT B TABLE OF CONTENTS I. INTRODUCTION / PURPOSE............................ 3 II. OBJECTIVES / GOALS..................................
Land Use Planning Analysis. Phase 2 Drayton Valley Annexation Proposal
 Land Use Planning Analysis Phase 2 Drayton Valley Annexation Proposal Prepared for Town of Drayton Valley Prepared by Mackenzie Associates Consulting Group Limited March, 2011 TABLE OF CONTENTS 1.0 INTRODUCTION...
The FURLANI A P A R T M E N T S
 The FURLANI A P A R T M E N T S SEATTLE CBD WEST SEATTLE BEACON HILL RAINIER VALLEY WHITE CENTER BURIEN NORMANDY PARK SEATTLE TACOMA INTERNATIONAL AIRPORT OFFERING Paragon Real Estate Advisors is pleased
DOWNTOWN SPECIFIC PLAN
 DOWNTOWN SPECIFIC PLAN AGENDA OVERVIEW Goals & Objectives Opportunity Sites Market Analysis Next Steps GOALS & OBJECTIVES Create a Specific Plan that paves the way for at least 10,000 places to live in