Tennessee Housing Market at a Glance
|
|
|
- Diana Gregory
- 5 years ago
- Views:
Transcription
1 2012 Tennessee Housing Market at a Glance Leading Tennessee Home
2 Tennessee Housing Market at a Glance 2012 Hulya Arik, Ph.D. THDA Research Coordinator Special thanks to: Shara D. Taylor THDA Research and Planning, for GIS mapping Charmaine McNeilly THDA Public Affairs, for layout and design
3 Tennessee Housing Trends There were both positive and not so positive developments in the Tennessee housing market in While the declining median home prices in some areas increased the housing affordability for those who wanted to purchase a home, it also depressed the housing markets and decreased the number of available options for those struggling homeowners who wanted to sell their homes. In August 2012, the unemployment rate in Tennessee declined to 8.5 percent from 9.2 percent in August 2011; even though the annual decline in the unemployment rate was an improvement from its high level of 10.5 percent in 2009, it was significantly higher than the 6.7 percent unemployment rate in 2008 when the housing problems in Tennessee started. Still high unemployment rates in the state continued to limit the affordable housing opportunities for many Tennesseans. Total building permits in Tennessee slightly increased in the second quarter of 2012 compared to the first quarter of Compared to the same quarter last year single family building permits are 22 precent higher. Statewide, the median prices of single family homes increased slightly from However, with the help of favorable borrowing conditions, home buying became more affordable for a family earning the median income. Even with lower home prices in some areas and favorable borrowing conditions, single wage earner households working mostly in service sector jobs were not able to buy or rent a median-priced home without being cost burdened in While the number of cost burdened owner households in the state declined, the renter households who are paying more than 30 percent of their income increased. In recent years, homeownership rates declined slightly in the state. The declining homeownership rates created additional demand for rental housing, which pushed the rents higher and created affordability problems for renter households in some areas. According to First American Core Logic, 16.2 percent of Tennessee mortgage holders were underwater, which means their homes were worth less than the balance of their mortgage, at the end of the first quarter of When the seven percent of borrowers who are near underwaterare also included, the percent of Tennessee mortgage holders who may be at a greater risk for foreclosure reaches 19 percent of outstanding mortgages at the end of the first quarter of
4 The total number of properties with foreclosure filings in the state declined in the second quarter of 2012 both from the previous quarter and the previous year. There were wide variations in the foreclosure trends by county. For example, Shelby County foreclosure filings declined by seven percent from the first quarter of 2012; however, compared to the same quarter last year, the number of foreclosure filings substantially increased, by 51 percent. Rutherford County had considerable increases in the number of foreclosure filings from the previous quarter and the previous year. Tennessee Housing Development Agency (THDA) continued helping Tennesseans with many housing programs. For example, in 2011, THDA started the Keep My Tennessee Home Program (Tennessee s Hardest Hit Fund Program) to help homeowners who lost their jobs and are struggling to pay their mortgages. Additionally, new choices were created to provide homeownership opportunities for veterans through lower interest rates. Those THDA-related activities helping low- and moderate-income Tennesseans created additional jobs, incomes and business revenue in the local economies. The total economic impact of THDA-related activities in 2011 was estimated at $728.6 million. 2
5 Home Prices Home Prices (Existing) vs. Median Income In 2011, median existing home prices in Tennessee increased by one percent compared to In the same period, the median family income of Tennesseans declined by 1.3 percent from Although the higher median home prices and lower median family incomes slightly lowered housing affordability in Tennessee, the median priced home was still affordable to a median income earning family in The lower borrowing cost for home purchases also helped homebuyers. The median price of existing homes in the U.S. declined by four percent compared to the previous year. The lower cost of median priced homes combined with a negligible decline in median family income improved the housing affordability in the nation compared to
6 Median Home Prices versus Median Family Income, US $250,000 Median Home Prices and MFI $200,000 Median Home Median $150,000 Prices Family (existing) Income $100, $128,400 $45,300 $50, $133,300 $47, $139,000 $50, $0$147,800 $52, $156, $54, $169,500 $56,500 Median Home Prices (existing) Median Family Income 2004 $185,200 $57,500 Source: U.S. median (existing) home prices National Association of Realtors. Median Family Income U.S. Department of Housing and Urban Development (HUD) Median Home Prices versus Median Family Income, TN $160, $221,900 $59,600 $140, $217,900 $59, $198,100 $61,500 $120, $172,500 $64,000 $100, $172,900 $64,400 $80, $166,100 $64, dian $60,000 Home prices for US is existing home sales from ional $40,000 Association of Realtors (NAR) $20,000 nnessee Median Home Prices and MFI $ Median Home Median Median Home Prices (existing) Median Family Income Source: Tennessee median (existing) home prices THDA tabulations of data obtained from the Property Assessment Division, Comptroller s Office. Median Family Income U.S. Department of Housing and Urban Development (HUD) 4
7 Home Prices 2011 Single-Family Median Home Prices (New and Existing) in Tennessee Counties The median prices of all homes (new and existing) increased from $149,900 in 2010 to $150,925 in 2011, a one percent increase. In 43 counties, median home sale prices declined from Van Buren County experienced the largest home price depreciation, with 41 percent, followed by Hancock and Cocke Counties, with 30 percent and 21 percent depreciation, respectively. Median prices for all homes in Lewis, McMinn, and Sullivan Counties did not change. The most significant increase in median prices was in Pickett County where the median prices of all homes increased from $106,100 in 2010 to $136,950 in At $335,000, Williamson County had the highest median price. Lake County, at $45,000, had the lowest median price in the state. The median sales price in Williamson County was more than seven times higher than the median sales price in Lake County. 5

 wood $350,000 $88,750 $90,500 $95,000 $80,000 s $300,000 $88,875 $66,000 $80,000 $80,000 ren $250,000 $81,250 $87,500 $82,500 $80,000 kett")


8 Lowest Median Home Price Counties ( ) $80,000 $60,000 $66,000 $74,100 $62,750 ston $70,000 $80,000 $80,000 $78,750 $62,750 y $60,000 $61,200 $72,000 $51,619 $64,500 ne $50,000 $60,250 $64,250 $56,000 $65,000 cock $40,000 $65,000 $64,700 $92,950 $65,500 $30,000 deman $75,500 $74,500 $75,000 $67,300 $20,000 ndy $10,000 $73,000 $70,000 $75,000 $67,500 oll $0 $73,000 $76,200 $71,500 $70,000 derdale $78,500 $73,000 $75,000 $70,000 Buren $70,000 $89,000 $122,500 $72,000 son $66,500 $79,000 $80,950 $75,000 Lake Decatur Clay Houston Perry Wayne Hancock Hardeman Grundy Carroll Highest Median Home Price Counties ( ) wood $350,000 $88,750 $90,500 $95,000 $80,000 s $300,000 $88,875 $66,000 $80,000 $80,000 ren $250,000 $81,250 $87,500 $82,500 $80,000 kett $200,000 $74,750 $77,000 $61,000 $80,500 on $150,000 $87,550 $80,000 $80,000 $81,000 kley $100,000 $79,000 $78,000 $75,000 $82,950 $50,000 $80,000 $88,000 $92,250 $85,000 ry $0 $80,000 $84,000 $76,000 $85,000 gan $75,571 $87,400 $99,000 $85,900 derson $95,687 $100,000 $93,000 $86,500 oln $98,125 $96,500 $93,000 $88,500 h $95,000 $91,000 $88,500 $89, Median Home Price 2010 Median Home Price 2011 Median Home Price ton $95,000 $106,000 $92,700 $89,250 Williamson Wilson Fayette Sumner Source: THDA tabulations of home sales based on data obtained from the Property Assessment Division, Comptroller s Office, State of Tennessee. To find median home sales volume and prices for other counties, MSAs and previous years, go to: Loudon Davidson Blount Shelby Hamilton 6


9 Home Sales 2011 Single-Family Home Sales in Tennessee Counties In 2011, single-family home sales in Tennessee declined by eight percent compared to Including both new and existing homes, 45,470 homes were sold in In 70 counties, home sales declined from the previous year. The county with the largest year-over-year decline in home sales was Rutherford County, in which the home sales declined from 2,987 in 2010 to 1,980 in 2011, a 34 percent annual decline. With 12 sales, Hancock County had the fewest homes sold in Davidson County had the most homes sold in the state with 5,017 single family homes sold during Counties Buren with the 41Fewest Single 17 Family 21 Homes 17 Sold (2009 Van Buren ) ston Houston gs Meigs 50 y Perry 40 e Lake 30 dsoe Bledsoe 20 usdale Trousdale Clay 0 ndy Grundy deman ore uatchie Counties with the Most Single Family Homes Sold ( ) gan 8, Williamson s Hamilton 6,000 on Rutherford nger 4, Sumner wood 2, Wilson man Washingto tur n kett art ress Home Sales Home Sales Home Sales Hancock Davidson Van Buren Shelby Houston Knox Meigs Montgomery Perry Williamson Source: THDA tabulations of home sales based on data obtained from the Property Assessment Division, Comptroller s Office, State of Tennessee. To find median home sales volume and prices for other counties, MSAs and previous years, go to: 7 Lake Hamilton Bledsoe Rutherford Trousdale Sumner Clay Wilson Grundy Washington
10 Home Prices House Price Index (HPI) Tennessee vs. U.S. The House Price Index (HPI) is a measure of single-family home prices. The index can show price trends for various geographic levels and captures roughly 85 percent of all U.S. sales (limited to homes with repeated sales whose mortgages have been purchased or securitized by Fannie Mae or Freddie Mac since January 1975). In Tennessee, home prices increased by 3.6 percent in the second quarter of 2012 compared to the second quarter of The U.S. home prices increased by three percent in the second quarter compared to the same quarter in the previous year. The home prices in Tennessee were declining since the second quarter of 2008 and slightly increased for the first time in the first quarter of This is the first substantial annual price appreciation in both Tennessee and the United States since 2008 after a slight annual increase in the first quarter of House prices in the second quarter of 2012 appreciated by 1.8 percent both in the U.S. and in Tennessee from the first quarter of Annual Percentage Change in House Price Index United States vs. Tennessee _Q _Q _Q _Q _Q _Q _Q _Q _Q U.S. 95_Q _Q2-10 TN _Q _Q _Q _Q _Q _Q1 2003_Q1 2004_Q1 2005_Q1 Source: Federal Housing Finance Agency s seasonally adjusted, purchase-only House Price Index (HPI) 2006_Q1 2007_Q _Q1 2009_Q1 2010_Q Q Q1
11 Home Prices House Price Index (HPI) Tennessee Compared to Highest and Lowest Performing States and to Neighbors In the second quarter of 2012, Arizona had the highest home price appreciation in the nation. This is a substantial improvement in the state, considering that in the second quarter of 2011, the home prices depreciated by 15 percent compared to the previous year. Annual home price appreciation of 3.55 percent in Tennessee was also quite substantial considering that in the second quarter of 2011, home prices declined by six percent from the previous year. The HPI shows that home prices started to improve in most parts of the nation, including Tennessee. The seasonally adjusted purchase-only HPI increased in 43 states in the second quarter of Home prices in Tennessee appreciated compared to both the same quarter last year and the previous quarter in Tennessee ranked as 17 th in the nation among the states with its annual price appreciation in the second quarter of Among the neighboring states, Arkansas had the highest annual price appreciation with 7.2 percent in the second quarter of Annual price appreciation in Mississippi and North Carolina was negligible. For the second quarter of 2012, home prices in Mississippi declined by 1.6 percent compared to the prior quarter. 9
12 Annual and Quarterly Percentage Changes in Home Prices State National Rank* Annual Percentage Change (2011 Q Q2) Quarterly Percentage Change (2012 Q Q2) States with the highest annual price increase Arizona Idaho Florida Tennessee and its neighbors Arkansas Alabama Missouri Tennessee Kentucky Virginia Mississippi North Carolina States with the highest annual price decrease Massachusetts Delaware Connecticut U.S. Average * Based on annual price change Source: Federal Housing Finance Agency (FHFA) s seasonally adjusted, purchase only House Price Index (HPI) 10
13 Home Prices House Price Index (HPI) - Metropolitan Statistical Area In the second quarter of 2012, home prices appreciated in some Tennessee metro areas while they depreciated in some others. With 4.37 percent annual price appreciation, Johnson City had the highest price increase among Tennessee metros, followed by Cleveland with 3.02 percent. The Johnson City MSA ranked as 6 th in the nation among 304 MSAs. The MSA with the highest price appreciation, Phoenix-Mesa-Glendale, AZ, had a 5.98 percent home price increase in the same period. The home prices in the Chattanooga MSA increased by one percent annually, while it declined by two percent from the previous quarter (the first quarter of 2012). The Nashville MSA had slight price appreciation from the previous quarter and the same quarter last year. Annual and Quarterly Percentage Changes in Home Prices for Tennessee MSAs MSAs National Rank a Change Annual Percentage (2011 Q Q2) Quarterly Percentage Change (2012 Q Q2) Chattanooga Clarksville* Cleveland* 3.02 Jackson* 1.05 Johnson City Kingsport-Bristol Knoxville Memphis Morristown* 1.41 Nashville/Davidson, Murfreesboro & Franklin *Federal Housing Finance Agency (FHFA) publishes rankings and quarterly, annual, and five-year rates of changes for the MSAs and Metropolitan Divisions that have at least 15,000 transactions over the prior 10 years (304 MSA and Metro Divisions satisfied that criteria for the second quarter 2012). For the remaining areas, MSAs and Divisions, one-year rates of change are provided. Estimates use all-transaction HPI, which includes both purchase and refinance mortgages. a Rankings based on annual percentage change, for all MSAs containing at least 15,000 transactions over the last 10 years. Source: Federal Housing Finance Agency (FHFA) all-transactions House Price Index (HPI) 11

14 Foreclosure Activity State Foreclosure & Delinquency Rate* National Comparison (2012 Q2) The combined foreclosure and delinquency rate is the percentage of all loans that are 90 days or more delinquent and the loans in the foreclosure inventory at the end of a given quarter. Nationwide, 7.31 percent of all outstanding mortgages were seriously delinquent. Tennessee s foreclosure and delinquency rate of 5.71 percent was approximately two percentage points lower than the national average and 11.8 percentage points lower than Florida (the state with the highest percentage of seriously delinquent mortgages). Foreclosures & Delinquency Rates* of Selected States Q New York1. Florida 9.53 Mississippi 2. New Jersey ted States Nevada Georgia Kentucky 4. Illinois Arkansas 5. New York North 12. Carolin Mississippi Tennessee 5.71 United States 7.31 Alabama Georgia Missouri Virginia 20. Kentucky Montana 28. Arkansas South North Dakota Carolina 2.5 Alaska 30. Tennessee Wyoming Alabama North Dakota Missouri Key 43. Virginia 47. Montana 48. South Dakota 49. Alaska 50. Wyoming 51. North Dakota 1.72 Source: MBA Quarterly Delinquency Survey * The foreclosure and delinquency rate includes loans that are 90 days or more delinquent and the foreclosure inventory at the end of the quarter High Foreclosure & Delinquency States Tennessee's Neighbors Low Foreclosure & Delinquency States United States Tennessee
15 Foreclosure Activity State Foreclosure & Delinquency Rate* National Comparison (2012 Q2) Tennessee s foreclosure rates in the second quarter of 2012 slightly declined compared to the previous quarter. Year-over-year changes in 2012 were not large either; compared to the same quarter last year, the foreclosure rate in Tennessee declined from 6.25 percent to 5.71 percent. Compared to the same quarter last year, the nationwide foreclosure rate declined to 7.31 percent from 7.85 percent. Florida had the highest foreclosure rate in the nation, with 17.5 percent. Among the neighboring states, Mississippi s and Georgia s foreclosure rates were the highest. 13
16 Foreclosure & Delinquency Rates* of Selected States Second Quarter of 2012 First Quarter of 2012 Second Quarter of 2011 Total Loans Percent of Loans Seriously Delinquent Total Loans Percent of Loans Seriously Delinquent Total Loans Percent of Loans Seriously Delinquent States with the highest percent of loans seriously delinquent Florida 3,112, (1) 3,146, (1) 3,278, (1) New Jersey 1,227, (2) 1,232, (3) 1,252, (3) Nevada 467, (3) 471, (2) 502, (2) Illinois 1,643, (4) 1,648, (4) 1,700, (4) New York 1,926, (5) 1,965, (5) 1,999, (5) Tennessee and its neighbors Mississippi 250, (12) 251, (12) 255, (13) Georgia 1,558, (14) 1,570, (13) 1,612, (14) Kentucky 422, (20) 426, (18) 436, (21) Arkansas 309, (28) 310, (30) 315, (36) North Carolina 1,386, (29) 1,389, (28) 1,405, (27) Tennessee 849, (30) 852, (29) 866, (24) Alabama 590, (34) 594, (34) 601, (33) Missouri 814, (38) 821, (37) 847, (38) Virginia 1,387, (43) 1,392, (44) 1,421, (45) States with the lowest percent of loans seriously delinquent Montana 134, (47) 135, (46) 137, (46) South Dakota 79, (48) 79, (48) 80, (48) Alaska 94, (49) 95, (49) 95, (50) Wyoming 78, (50) 78, (50) 80, (49) North Dakota 57, (51) 58, (51) 59, (51) United States 42,506, ,843, ,884, Note: Numbers in the parentheses present the states rankings based on delinquency. Original order of states with the highest and the lowest percent of seriously delinquent is determined based on their rates in the second quarter of * The foreclosure & delinquency rate includes loans that are 90 days or more delinquent and the foreclosure inventory at the end of the quarter. Source: MBA Quarterly Delinquency Surveys, various quarters 14
17 Foreclosure Activity Properties with Foreclosure Filings The number of properties with foreclosure filings in Tennessee declined from 7,757 in the first quarter of 2012 to 7,376 in the second quarter of 2012, a five percent decrease compared to both the previous quarter and the same quarter last year (Q2 2011). Tennessee had one foreclosure filing for every 360 housing units. Lewis County, with one filing for every 210 housing units, had the highest foreclosure rate in the state. The total number of properties with foreclosure filings in Lewis County increased from three in the first quarter to 26 in the second quarter of The county with the highest number of properties with foreclosure filings in the state was Shelby, with 1,594 properties. In Shelby County, the total volume of foreclosure filings decreased by seven percent from the previous quarter and increased by 51 percent from the same quarter last year (Q2 2011). 15
18 Total Number of Properties with Foreclosure Filings-Tennessee Counties - Q County Name Second Quarter of 2012 Q1_2012 Q2_2011 Percent Changes Total # of Properties with Foreclosure Filings 1/every X Housing Unit (Rate) Ranking among all counties* Total # of Properties with Foreclosure Filings Total # of Properties with Foreclosure Filings Quarterly Change (from Q1_2012) Annual Change (from Q2_2011) Shelby 1, ,707 1,056-7% 51% Davidson % -13% Knox % -26% Rutherford % 23% Hamilton % -24% Sumner % 2% Montgomery % 0% Sevier % -42% Maury % -8% Williamson % -37% Wilson % 8% Sullivan % -44% Madison % -21% Bradley % 13% Blount % 26% Tennessee 7, ,757 7,788-5% -5% * County ranking is based on the rate of foreclosure filings, a rank of one means the county had the highest ratio of foreclosure to housing units. Source: RealtyTrac Note: RealtyTrac s report incorporates documents filed in two phases of foreclosure: Auction - Notice of Trustee Sale (NTS); and Real Estate Owned, or REO properties (that have been foreclosed on and repurchased by a bank). Foreclosure filings include both pre-foreclosure properties and foreclosed properties. To get updates of foreclosure trends and foreclosure filings in other counties in Tennessee, go to: 16
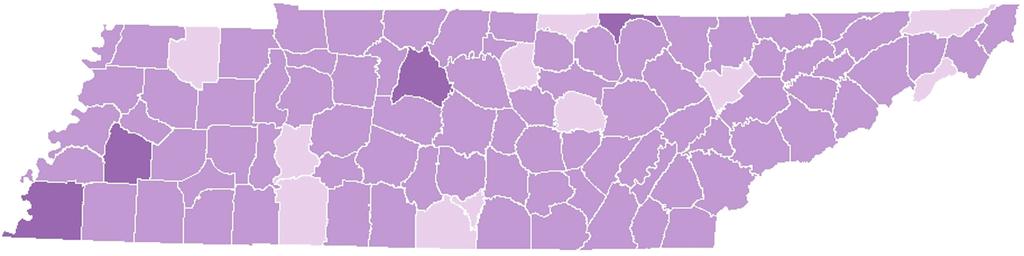
19 Affordability Housing Opportunity Index The National Association of Home Builders (NAHB) developed the housing opportunity index (HOI), a measure of the share of homes sold in an area in a certain time that would have been affordable to a family earning the area median income, based on standard mortgage underwriting criteria. 1 We calculated a housing opportunity index for Tennessee counties in 2010 and similar to the NAHB/Wells Fargo HOI. The index ranges from zero percent to 100 percent. The higher the index is, the more homes sold in the area are affordable to a family earning the median income. In 2011, the index values ranged from 34 percent in Williamson County to 100 percent in Hancock, Houston, Lake, and Smith Counties. On average, in 2011, 78 percent of homes sold in Tennessee would have been affordable to a family earning the median income. Only 34 percent of homes sold in Williamson County were affordable to a family earning $66,200, the median family income in Williamson County in Housing affordability in Davidson, Hamilton, and Knox Counties were close to the state average with 77 percent, 75 percent, and 78 percent, respectively. In 2011, both at the county level and the state level, there were slight improvements in housing affordability compared to The housing affordability declined slightly from 2010 in Davidson County, while it improved in Hamilton and Knox Counties. The most significant improvement in housing affordability compared to 2010 was in Meigs County with a 16 percentage point increase in the housing opportunity index. The most significant deterioration in housing affordability was in Pickett County where the housing opportunity index declined from 80 percent in 2010 to 48 percent in The maps on the following page show the housing opportunity index in Tennessee counties and the change in affordability from 2010 to More information about NAHB/Wells Fargo Housing Opportunity Index (HOI) and historical HOI for metropolitan areas can be found at 2 We used the sales price and volume data we receive from the Property Assessment Division, Comptroller s Office for the prices of homes purchased during the year. We assumed 10 percent downpayment and average fixed interest rate for a 30-year mortgage as reported by Federal Housing Finance Agency at We added insurance and property tax payments to find monthly principal, interest, tax and insurance (PITI) payments. We compared the monthly PITI for each homes purchased to the monthly area median family income (we assumed that a family paying 28 percent of its income for PITI will not be cost burdened). Median family income is from U.S. Department of Housing and Urban Development (HUD). 3 The county level housing opportunity index values for 2010 and 2011 can be found in Appendix A located online at: 17


20 Housing Opportunity Index Source: Tennessee home prices THDA tabulations of data obtained from the Property Assessment Division, Comptroller s Office. Median Family Income U.S. Department of Housing and Urban Development (HUD) 18
21 Affordability Housing Cost Burden Households that spend more than 30 percent of their income on housing are considered to be cost burdened. In Tennessee, 30 percent of all households (renters and homeowners) are cost burdened ( , ACS). In the nation, 36 percent of all households are cost burdened. Statewide, more renter households are cost burdened than the homeowners, with 43.8 percent compared to 24.5 percent. Similarly, in a majority of the counties, more renters are cost burdened than the homeowners. Only in Morgan, Hancock, Meigs, Cannon, and Pickett Counties the percent of cost burdened homeowners is higher than the percent of renters. Among the counties, the cost burden for all households varies from 19.3 percent in Clay County to 39.5 percent in Shelby County. Stewart County has the highest renter cost burden rate with 52.6 percent, followed by Madison and Haywood Counties, 52.4 and 52.2 percent, respectively. Pickett County, with 15 percent, has the lowest renter cost burden rate in the state. The county with the highest rate of homeowners who are cost burdened is Pickett County, 32.5 percent. Weakley County has the lowest percent of owner households who are cost burdened, 15.9 percent. The maps on the following page show the housing cost burden for renters, homeowners and all households. 1 1 The percentages of renter and homeowner households that are cost burdened by county can be found in Appendix B located online at: 19


22 All Households (Homeowners and Renters) Renter-Occupied Households Owner-Occupied Households 20
23 Workforce Housing Affordability 2011 Housing Affordability for Home Buyers and Renters with Selected Occupations in Tennessee and Metropolitan Statistical Areas (MSAs) As the housing opportunity index on the earlier pages showed, in 2011, buying a home became more affordable for a family earning the median income of the area compared to However, housing affordability was still a problem for single wage earners working at various occupations. Registered nurses, police officers and educators were generally able to purchase or rent a median-priced home without being cost burdened in most MSAs and in the state as a whole. Educators in Nashville and police officers and educators in Morristown could not afford to buy at the median price, but they could afford to rent. Homeownership was out of reach for many single wage earners when the average hourly wage rate for all occupations is considered. Wait staff, cashiers, and retail sales persons could not afford to buy or rent a median-priced home in any MSA. Metropolitan Statistical Areas (MSAs) Median Home Price 2011 Median Hourly Wage by Occupation 2011 Wage Needed to Buy 2-BDRM Aptmnt Monthly Rent Wage Needed to Rent Education** Registered Nurse Police Wait Person Cashier Retail Salesperson All Occupations Chattanooga $155,000 $ $13.81 $21.42 $26.11 $17.60 $8.53 $8.61 $9.66 $14.31 Clarksville $154,000 $ $12.75 $19.74 $26.97 $17.90 $8.71 $8.67 $9.07 $13.90 Cleveland $132,000 $ $11.94 $19.41 $24.68 $16.88 $8.64 $8.65 $9.59 $13.41 Jackson $114,000 $ $13.46 $18.93 $23.83 $18.41 $8.53 $8.70 $9.66 $14.02 Johnson City $142,000 $ $11.33 $16.64 $26.95 $16.78 $8.44 $8.68 $9.48 $13.39 Kingsport- Bristol $124,900 $ $11.31 $18.95 $23.48 $17.83 $8.55 $8.66 $9.49 $14.12 Knoxville $157,000 $ $13.63 $19.98 $26.02 $18.65 $8.64 $8.77 $9.50 $14.70 Memphis $161,150 $ $14.58 $21.22 $29.35 $23.92 $8.50 $8.76 $10.18 $15.07 Morristown $130,000 $ $10.69 $17.48 $25.24 $14.76 $8.65 $8.60 $9.58 $13.20 Nashville/ Davidson- Murfreesboro- Franklin $190,000 $ $15.83 $19.52 $28.88 $21.55 $8.69 $9.01 $10.22 $15.63 TENNESSEE* $150,925 $ $13.46 $20.16 $29.16 $20.00 $9.00 $9.13 $11.62 $14.56 *Tennessee represents the whole state, not the balance of the state. ** Education represents education, training and library occupations. Source: Median Home Price is THDA calculations based on data from the Property Assessment Division, Comptroller s Office, State of Tennessee, 2-bedroom Apartment Rent is Fair Market Rent (FMR) by room size from US Department of Housing and Urban Development (HUD). Median Hourly Wages are from Bureau of Labor Statistics (BLS) Occupational Employment Statistics. can afford to buy and rent can afford to only rent cannot afford to buy or rent 21

 had relatively lower homeownership rates compared to smaller cities and the state average.")
24 Homeownership Tennessee Homeownership Rates Source: American Community Survey (ACS) , U.S. Census Tennessee s homeownership rate of 69.6 percent was higher than the national homeownership rate of 66.6 percent. Last year, using American Community Survey estimates, the homeownership rate in Tennessee was 69.7 percent. Homeownership rates in Tennessee ranged from 57.6 percent in Davidson County to 85.1 percent in Wayne County. Sixteen counties in the state had 80 percent or higher homeownership rates. Four large urban counties (Davidson, Hamilton, Knox, and Shelby) had relatively lower homeownership rates compared to smaller cities and the state average. 1 1 Percentages of Tennessee households that are owner occupied by county can be found in Appendix Clocated online at: 22
25 Vacancy Rates Homeowner and Rental Vacancy Rates Tennessee s overall vacancy rates have returned to 2000 levels, with 11.3 percent of the state s housing units standing vacant. This is a reduction of the vacancy rate from years past. The rental vacancy rates declined slightly in the past year, reversing a three year trend of increases. The rental rate moved from 12.8 percent in 2009 to 12.5 percent in The homeowner vacancy rate increased slightly from 2.5 percent last year to 2.6 percent this year. Vacancy Rates - Tennessee Rental Vacancy Rate Homeowner Vacancy Rate Percent of Units Vacant
26 Both rental and homeowner vacancy rates in the Memphis MSA were substantially higher than the vacancy rates of metro areas across the nation, while the vacancy rates in the Nashville MSA closely followed the average nationwide metro area vacancy rates. Percent of Units Vacant Rental Vacancy Rates: Memphis and Nashville MSAs Homeowner Vacancy Rates: Memphis and Nashville MSAs Inside Metro 2 Areas - U.S. 1.5 Memphis MSA 1 Nashville 0.5 MSA 0 Percent of Units Vacant Inside Metro Areas - U.S Memphis MSA Nashville MSA
27 THDA Program Summary Programs Administered during the Year In calendar year 2011, THDA administered the following programs to provide safe, sound and affordable housing solutions to Tennesseans. Program Families/Housing Units CY11 Dollars Mortgage Products: Great Start, Great Advantage, Great Rate, New Start, Great Save and Preserve 2,161 mortgages $226.4 million Homebuyer's Education 1,939 families $457,074 Keep My Tennessee Home (Tennessee's Hardest Hit Fund Program) 752 families $5.3 million Foreclosure Prevention Counseling 1,983 families $915,120 Multi-Family Bond Authority 282 apartments $14.6 million Low-Income Housing Tax Credit (LIHTC)* 1,866 apartments $185.3 million HOME 331 homes and apartments $15.7 million Section 8 Housing Choice Vouchers 6,746 households $33.3 million Section 8 Project Based Assistance 35,393 households $154.8 million Community Investment Tax Credit (CITC)** 946 families $29.8 million Emergency Shelter Grant Program -- $1.5 million Housing Trust Fund - RAMPS 265 wheelchair ramps $210,490 Housing Trust Fund - Rural Housing Repair 148 households $637,585 Housing Trust Fund - Emergency Repair 315 elderly households $1.8 million Neighborhood Stabilization Program 144 homes $8.4 million Homelessness Prevention and Rapid Re-housing 1,621 individuals -- * The dollars listed under LIHTC represent the total value of Tax Credits over ten years. ** CITC totals represent the amount of below market loans made that are eligible for CITC. Programs listed in italics are linked to two Recovery laws: Housing and Economic Recovery Act (HERA) and American Recovery and Reinvestment Act (ARRA) 25
28 THDA Program Summary Economic Impact, 2011 In addition to benefiting individuals and families, these THDA programs create jobs, income, and spending in the local economy. Construction of new homes and rehabilitation of existing ones through THDA-related activities increase employment both in the construction industry and other industries linked to construction. For every dollar spent in the economy through THDA activities, business revenue and personal income increase by more than one dollar of initial direct spending. The total economic impact described below is the sum of direct THDA spending, indirect business to business transactions in Tennessee s economy and additional employee spending. The total contribution of THDA-related activities to Tennessee s economy was estimated at $728.6 million in Of this total, $388 million was directly injected into the economy by THDA-related activities Every $100 of THDA-related activities generated an additional $88 in business revenues THDA-related activities generated $257.3 million in wages and salaries in Every $100 of personal income produced an additional $85 of wages and salaries in the local economy THDA-related activities created 6,540 jobs in Every 100 jobs created by THDA-related activities, primarily in the construction sector, generated 72 additional jobs throughout the local economy THDA-related activities accounted for $40 million in state and local taxes in
29 Appendix A Total Home Sales and Affordability by County Total Number of Homes Sold Housing Opportunity Index Total Number of Homes Sold Housing Opportunity Index Anderson % % Bedford % % Benton % % Bledsoe % % Blount % % Bradley % % Campbell % % Cannon % % Carroll % % Carter % % Cheatham % % Chester % % Claiborne % % Clay % % Cocke % % Coffee % % Crockett % % Cumberland % % Davidson 5, % 5, % Decatur % % DeKalb % % Dickson % % Dyer % % Fayette % % Fentress % % Franklin % % 27
30 Total Number of Homes Sold Housing Opportunity Index Total Number of Homes Sold Housing Opportunity Index Gibson % % Giles % % Grainger % % Greene % % Grundy % % Hamblen % % Hamilton 3, % 2, % Hancock % % Hardeman % % Hardin % % Hawkins % % Haywood % % Henderson % % Henry % % Hickman % % Houston % % Humphreys % % Jackson % % Jefferson % % Johnson % % Knox 4, % 4, % Lake % % Lauderdale % % Lawrence % % Lewis % % Lincoln % % 28
31 Total Number of Homes Sold Housing Opportunity Index Total Number of Homes Sold Housing Opportunity Index Loudon % % Macon % % Madison % % Marion % % Marshall % % Maury % % McMinn % % McNairy % % Meigs % % Monroe % % Montgomery 2, % 3, % Moore % % Morgan % % Obion % % Overton % % Perry % % Pickett % % Polk % % Putnam % % Rhea % % Roane % % Robertson % % Rutherford 2, % 1, % Scott % % Sequatchie % % Sevier % % 29
32 Total Number of Homes Sold Housing Opportunity Index Total Number of Homes Sold Housing Opportunity Index Shelby 5, % 4, % Smith % % Stewart % % Sullivan 1, % % Sumner 1, % 1, % Tipton % % Trousdale % % Unicoi % % Union % % Van Buren % % Warren % % Washington 1, % % Wayne % % Weakley % % White % % Williamson 2, % 2, % Wilson 1, % 1, % Tennessee 49, % 45, % 30
33 Appendix B Percentage of Tennessee Households that are Cost-Burdened, by County County Owner Cost Burden Renter Cost Burden Total Cost Burden Anderson 19.5% 37.36% 24.52% Bedford 24.9% 43.95% 30.92% Benton 20.7% 33.65% 22.87% Bledsoe 23.6% 39.42% 27.27% Blount 21.6% 38.48% 25.64% Bradley 23.7% 44.40% 30.43% Campbell 21.7% 39.93% 26.80% Cannon 28.6% 23.72% 27.46% Carroll 22.3% 39.57% 26.21% Carter 20.5% 37.89% 25.16% Cheatham 24.1% 46.37% 28.40% Chester 20.4% 31.78% 23.32% Claiborne 20.2% 42.20% 25.22% Clay 19.0% 20.15% 19.25% Cocke 24.6% 30.91% 26.29% Coffee 24.2% 41.35% 28.95% Crockett 25.0% 30.43% 26.69% Cumberland 22.7% 39.17% 26.15% Davidson 30.0% 47.44% 37.37% Decatur 22.5% 43.18% 27.06% DeKalb 23.3% 28.36% 24.68% Dickson 23.2% 40.29% 27.66% Dyer 25.3% 44.87% 32.15% Fayette 26.0% 33.32% 27.23% Fentress 25.3% 35.97% 27.75% Franklin 20.9% 33.50% 23.79% Gibson 21.1% 43.81% 27.45% Giles 20.5% 50.66% 28.10% Grainger 20.6% 41.06% 24.16% 31
34 County Owner Cost Burden Renter Cost Burden Total Cost Burden Greene 20.3% 34.58% 23.96% Grundy 27.0% 33.46% 28.28% Hamblen 21.4% 39.57% 26.62% Hamilton 23.7% 42.93% 30.34% Hancock 27.4% 25.82% 26.96% Hardeman 29.4% 43.47% 33.19% Hardin 22.2% 36.06% 25.35% Hawkins 21.1% 37.64% 25.02% Haywood 31.8% 52.26% 38.90% Henderson 23.0% 41.60% 27.13% Henry 20.4% 34.57% 23.59% Hickman 20.3% 33.85% 23.26% Houston 20.2% 36.23% 24.44% Humphreys 22.0% 24.47% 22.59% Jackson 23.9% 42.42% 28.31% Jefferson 22.2% 40.37% 26.76% Johnson 23.5% 30.67% 25.23% Knox 22.3% 44.62% 29.59% Lake 20.8% 48.98% 31.61% Lauderdale 27.1% 40.36% 31.53% Lawrence 23.9% 42.11% 27.94% Lewis 23.4% 29.74% 24.73% Lincoln 19.8% 36.25% 23.74% Loudon 22.4% 30.71% 24.22% Macon 27.2% 42.14% 30.85% Madison 26.9% 52.44% 35.33% Marion 23.0% 35.44% 25.87% Marshall 26.7% 38.87% 29.81% Maury 24.4% 40.94% 28.93% 32
35 County Owner Cost Burden Renter Cost Burden Total Cost Burden McMinn 21.8% 37.74% 25.78% McNairy 23.0% 31.31% 24.93% Meigs 26.6% 23.36% 25.80% Monroe 22.4% 38.99% 26.63% Montgomery 22.7% 42.06% 29.47% Moore 18.0% 37.10% 21.74% Morgan 25.2% 23.81% 24.92% Obion 20.4% 34.92% 24.77% Overton 21.5% 35.71% 24.28% Perry 19.1% 29.82% 21.65% Pickett 32.5% 15.03% 28.33% Polk 23.4% 32.95% 25.21% Putnam 23.4% 44.68% 31.04% Rhea 26.6% 42.33% 30.61% Roane 20.9% 42.19% 25.78% Robertson 25.4% 38.29% 28.29% Rutherford 23.2% 44.87% 29.93% Scott 24.8% 37.00% 27.99% Sequatchie 23.6% 34.93% 26.11% Sevier 21.7% 38.75% 27.06% Shelby 31.7% 52.14% 39.54% Smith 16.2% 39.50% 21.62% Stewart 20.5% 52.64% 26.62% Sullivan 18.2% 37.58% 22.92% Sumner 25.3% 42.60% 29.69% Tipton 24.2% 42.19% 28.87% Trousdale 25.7% 29.62% 26.51% Unicoi 19.0% 28.93% 21.83% 33
36 County Owner Cost Burden Renter Cost Burden Total Cost Burden Union 25.3% 45.85% 29.31% Van Buren 24.3% 48.19% 28.05% Warren 24.4% 31.79% 26.37% Washington 22.3% 40.29% 28.06% Wayne 17.7% 31.01% 19.72% Weakley 15.9% 47.59% 26.65% White 19.1% 32.25% 22.16% Williamson 23.6% 40.55% 26.49% Wilson 23.9% 43.33% 27.36% 34
37 Appendix C Percentage of Tennessee Households that are Owner-Occupied, by County County Homeownership Rate (ACS, ) Homeownership Rate (ACS, ) Anderson 71.60% 71.76% Bedford 67.40% 68.58% Benton 81.20% 83.18% Bledsoe 77.40% 76.75% Blount 76.80% 76.10% Bradley 67.60% 67.65% Campbell 72.90% 71.98% Cannon 75.80% 76.23% Carroll 77.20% 77.26% Carter 72.60% 73.30% Cheatham 79.70% 80.88% Chester 74.70% 74.24% Claiborne 78.40% 77.25% Clay 77.60% 77.93% Cocke 73.90% 72.99% Coffee 72.10% 72.26% Crockett 70.70% 68.50% Cumberland 79.80% 79.10% Davidson 59.00% 57.64% Decatur 73.30% 78.07% DeKalb 75.40% 72.30% Dickson 74.90% 74.07% Dyer 64.80% 64.97% Fayette 81.00% 83.30% Fentress 76.60% 77.06% Franklin 77.00% 77.31% Gibson 70.40% 71.99% Giles 75.60% 74.70% 35
38 County Homeownership Rate (ACS, ) Homeownership Rate (ACS, ) Grainger 83.10% 82.49% Greene 73.90% 74.24% Grundy 80.20% 80.68% Hamblen 70.60% 71.32% Hamilton 67.00% 65.55% Hancock 70.00% 71.54% Hardeman 74.10% 73.19% Hardin 76.50% 77.22% Hawkins 76.30% 76.10% Haywood 64.90% 65.31% Henderson 76.20% 77.60% Henry 77.20% 77.30% Hickman 77.40% 77.99% Houston 74.90% 73.56% Humphreys 77.00% 75.55% Jackson 75.30% 76.31% Jefferson 76.40% 74.82% Johnson 77.20% 76.40% Knox 67.20% 67.25% Lake 58.50% 61.65% Lauderdale 66.40% 66.50% Lawrence 77.80% 77.87% Lewis 75.40% 78.55% Lincoln 77.50% 76.21% Loudon 79.10% 77.92% Macon 74.00% 75.25% Madison 80.80% 76.85% Marion 75.30% 75.41% 36
39 County Homeownership Rate (ACS, ) Homeownership Rate (ACS, ) Marshall 66.80% 67.08% Maury 75.50% 77.01% McMinn 74.20% 74.66% McNairy 72.80% 72.66% Meigs 76.80% 75.58% Monroe 76.30% 74.54% Montgomery 64.90% 65.07% Moore 84.60% 80.43% Morgan 82.80% 81.83% Obion 69.10% 69.67% Overton 79.60% 80.43% Perry 78.80% 76.37% Pickett 72.10% 76.13% Polk 75.80% 80.72% Putnam 64.50% 64.09% Rhea 74.20% 74.50% Roane 77.40% 76.94% Robertson 76.10% 77.50% Rutherford 69.20% 69.02% Scott 69.60% 74.03% Sequatchie 80.10% 77.81% Sevier 70.50% 68.68% Shelby 61.70% 61.69% Smith 79.30% 76.60% Stewart 80.10% 80.98% Sullivan 75.00% 75.76% Sumner 74.80% 74.72% Tipton 75.10% 74.19% 37
40 County Homeownership Rate (ACS, ) Homeownership Rate (ACS, ) Trousdale 81.00% 79.60% Unicoi 74.20% 71.84% Union 79.50% 80.43% Van Buren 80.10% 84.16% Warren 72.30% 73.02% Washington 68.60% 67.89% Wayne 81.60% 85.13% Weakley 67.70% 66.13% White 77.20% 76.58% Williamson 83.20% 82.86% Wilson 81.70% 82.01% Tennessee 69.70% 69.60% 38
41 Notes THDA is a political subdivision of the State of Tennessee. THDA is the state s housing finance agency, responsible for selling tax exempt mortgage revenue bonds to offer affordable mortgage funds to homebuyers of low and moderate incomes through local lenders, and to administer various housing programs targeted to households of very low-, low- and moderate-incomes. THDA, established in 1973, is entirely self-supporting, providing affordable fixed rate mortgages to over 100,000 households without using state tax dollars. THDA issues between $250 and $300 million in mortgage revenue bonds annually for its first-time homebuyer program. More information about THDA is available on-line at 39

42 Additional county-by-county data is available on our website at Special thanks to our Platinum and Gold Summit Sponsors: Tennessee Housing Development Agency 404 James Robertson Parkway, Suite 1200 Nashville, TN
Tennessee Housing Market at a Glance
 2014 Tennessee Housing Market at a Glance Tennessee Housing Development Agency Leading Tennessee Home Tennessee Housing Market at a Glance 2014 Hulya Arik, Ph.D. THDA Economist Mapping: Shara D. Taylor
U.S. DEPARTMENT OF HUD 04/11/2017 STATE: TENNESSEE ADJUSTED HOME INCOME LIMITS
 Chattanooga, TN-GA MSA Clarksville, TN-KY MSA Cleveland, TN MSA 30% LIMITS 12500 14300 16100 17850 19300 20750 22150 23600 VERY LOW INCOME 20850 23800 26800 29750 32150 34550 36900 39300 60% LIMITS 25020
Tennessee Housing Market at a Glance
 2009 Tennessee Housing Market at a Glance Leading Tennessee Home Tennessee Housing Market at a Glance 2009 Hulya Arik, Ph.D. THDA Research Coordinator Bettie Teasley THDA Assistant Director of Research
Tennessee Housing Market at a Glance
 2010 Tennessee Housing Market at a Glance Leading Tennessee Home Tennessee Housing Trends Tennessee s and the nation s housing markets are still in fl ux with shifting patterns of sales prices, sales volume,
Tennessee Housing Market at a Glance
 2011 Tennessee Housing Market at a Glance Leading Tennessee Home Tennessee Housing Market at a Glance 2011 Hulya Arik, Ph.D. THDA Research Coordinator Bettie Teasley Sulmers THDA Assistant Director of
Do you get Extra Help from Medicare?
 1971335 Y0114_18_31544_X_001 2018 LIS Premium Chart AGP 09 17 Do you get Extra Help from Medicare? Here s what your monthly payment will be for 2018 If you get Extra Help from Medicare to pay your Medicare
Tennessee Housing Development Agency 404 James Robertson Parkway, Suite 1114 Nashville, Tennessee /
 Janice L. Myrick Tennessee Housing Development Agency 404 James Robertson Parkway, Suite 1114 Nashville, Tennessee 37243-0900 615/741-2400 Writer s Phone Number: Executive Director 615-741-2400 Writer
House of Representatives
 House of Representatives Counties Represented Representative Before 2018 1 Sullivan John Crawford R 2 Sullivan Bud Hulsey R 3 Carter, Johnson and part of Timothy Hill R Sullivan 4 Unicoi & Carter John
Housing Indicators in Tennessee
 Housing Indicators in l l l By Joe Speer, Megan Morgeson, Bettie Teasley and Ceagus Clark Introduction Looking at general housing-related indicators across the state of, substantial variation emerges but
Economic Impact of THDA Activities in Calendar Year 2012 on the Tennessee Economy
 404 James Robertson Pkwy, Ste 1200, Nashville, TN 37243-0900; (615) 815-2200 Economic Impact of THDA Activities in Calendar Year 2012 on the Tennessee Economy Prepared by Hulya Arik, Ph.D. Tennessee Housing
TENNESSEE HOUSING MARKET
 1st Quarter 212 TENNESSEE HOUSING MARKET David A. Penn, Director Business and Economic Research Center Jennings A. Jones College of Business Middle Tennessee State University This quarterly series is supported
Report on Nevada s Housing Market
 October Report on Nevada s Housing Market This series of reports on Nevada s Housing Market is presented by the Lied Institute for Real Estate Studies at the University of Nevada, Las Vegas. These reports
Report on Nevada s Housing Market
 May Report on Nevada s Housing Market This series of reports on Nevada s Housing Market is presented by the Lied Institute for Real Estate Studies at the University of Nevada, Las Vegas. These reports
Report on Nevada s Housing Market
 June Report on Nevada s Housing Market This series of reports on Nevada s Housing Market is presented by the Lied Institute for Real Estate Studies at the University of Nevada, Las Vegas. These reports
Report on Nevada s Housing Market
 October Report on Nevada s Housing Market This series of reports on Nevada s Housing Market is presented by the Lied Institute for Real Estate Studies at the University of Nevada, Las Vegas. These reports
Report on Nevada s Housing Market
 July Report on Nevada s Housing Market This series of reports on Nevada s Housing Market is presented by the Lied Institute for Real Estate Studies at the University of Nevada, Las Vegas. These reports
Report on Nevada s Housing Market
 December 214 Report on Nevada s Housing Market This series of reports on Nevada s Housing Market is co-presented by the Lied Institute for Real Estate Studies at the University of Nevada, Las Vegas and
AIA Middle Tennessee Corporate Partners Program
 Vision Statement Enhancing the Built Environment Through Leadership Bedford Benton Cannon Cheatham Clay Davidson Decatur Dekalb Dickson Giles Henry Hickman Houston Humphreys Jackson Lawrence Lewis Marshall
Report on Nevada s Housing Market
 July Report on Nevada s Housing Market This series of reports on Nevada s Housing Market is presented by the Lied Institute for Real Estate Studies at the University of Nevada, Las Vegas. These reports
Report on Nevada s Housing Market
 August 216 Report on Nevada s Housing Market This series of reports on Nevada s Housing Market is presented by the Lied Institute for Real Estate Studies at the University of Nevada, Las Vegas. These reports
Report on Nevada s Housing Market
 March Report on Nevada s Housing Market This series of reports on Nevada s Housing Market is co presented by the Lied Institute for Real Estate Studies at the University of Nevada, Las Vegas and the State
Report on Nevada s Housing Market
 February Report on Nevada s Housing Market This series of reports on Nevada s Housing Market is co presented by the Lied Institute for Real Estate Studies at the University of Nevada, Las Vegas and the
CTAS e-li. Published on e-li ( January 19, 2019 Legal Framework for Purchasing
 Published on e-li (http://ctas-eli.ctas.tennessee.edu) January 19, 2019 Legal Framework for Purchasing Dear Reader: The following document was created from the CTAS electronic library known as e-li. This
ECONOMIC CURRENTS. Vol. 3, Issue 1. THE SOUTH FLORIDA ECONOMIC QUARTERLY Introduction
 ECONOMIC CURRENTS THE SOUTH FLORIDA ECONOMIC QUARTERLY Introduction Economic Currents provides an overview of the South Florida regional economy. The report contains current employment, economic and real
Report on Nevada s Housing Market
 June Report on Nevada s Housing Market This series of reports on Nevada s Housing Market is co presented by the Lied Institute for Real Estate Studies at the University of Nevada, Las Vegas and the State
Report on Nevada s Housing Market
 August Report on Nevada s Housing Market This series of reports on Nevada s Housing Market is presented by the Lied Institute for Real Estate Studies at the University of Nevada, Las Vegas. These reports
Housing Price Forecasts. Illinois and Chicago PMSA, October 2014
 Housing Price Forecasts Illinois and Chicago PMSA, October 2014 Presented To Illinois Association of Realtors From R E A L Regional Economics Applications Laboratory, Institute of Government and Public
Report on Nevada s Housing Market
 September Report on Nevada s Housing Market This series of reports on Nevada s Housing Market is co-presented by the Lied Institute for Real Estate Studies at the University of Nevada, Las Vegas and the
Tennessee Housing Development Agency
 Tennessee Housing Development Agency Report on Incentives for the Development of Affordable Housing Executive Summary Pursuant to House Joint Resolution 505, the Tennessee Housing Development Agency was
Report on Nevada s Housing Market
 March Report on Nevada s Housing Market This series of reports on Nevada s Housing Market is co-presented by the Lied Institute for Real Estate Studies at the University of Nevada, Las Vegas and the State
Report on Nevada s Housing Market
 June 214 Report on Nevada s Housing Market This series of reports on Nevada s Housing Market is co-presented by the Lied Institute for Real Estate Studies at the University of Nevada, Las Vegas and the
ECONOMIC CURRENTS. Vol. 3, Issue 3 SOUTH FLORIDA ECONOMIC QUARTERLY. Introduction
 ECONOMIC CURRENTS THE Introduction SOUTH FLORIDA ECONOMIC QUARTERLY Economic Currents provides an overview of the South Florida regional economy. The report presents current employment, economic and real
The Knox County HOUSING MARKET
 T E C H REPORT SERIES The Knox HOUSING MARKET Date: August 2007 For more information: MPC Contact Person: Bryan Berry 215-2500 MPC Website and e-mail www.knoxmpc.org contact@knoxmpc.org INTRODUCTION In
MULTIFAMILY TAX SUBSIDY PROJECT INCOME LIMITS
 MULTIFAMILY TAX SUBSIDY PROJECT INCOME LIMITS This chart is provided as a guide only for the following programs: Low Income Housing Tax Credit (LIHTC) Hula Mae Multi-Family Bonds (HMMF) Rental Housing
Report on Nevada s Housing Market
 May Report on Nevada s Housing Market This series of reports on Nevada s Housing Market is co presented by the Lied Institute for Real Estate Studies at the University of Nevada, Las Vegas and the State
Report on Nevada s Housing Market
 February Report on Nevada s Housing Market This series of reports on Nevada s Housing Market is co presented by the Lied Institute for Real Estate Studies at the University of Nevada, Las Vegas and the
I. The Affordability Problem in Boston II. What is Affordable? III.Housing Costs IV.Housing Production V. What Can Public Policy Do? I.
 October 23, 2017 I. The Affordability Problem in Boston II. What is Affordable? III.Housing Costs IV.Housing Production V. What Can Public Policy Do? I. What is it Already Doing? II. Case Studies 2 West
ECONOMIC CURRENTS. Vol. 4, Issue 3. THE Introduction SOUTH FLORIDA ECONOMIC QUARTERLY
 ECONOMIC CURRENTS THE Introduction SOUTH FLORIDA ECONOMIC QUARTERLY Vol. 4, Issue 3 Economic Currents provides an overview of the South Florida regional economy. The report presents current employment,
Housing Price Forecasts. Illinois and Chicago PMSA, August 2016
 Housing Price Forecasts Illinois and Chicago PMSA, August 2016 Presented To Illinois Association of Realtors From R E A L Regional Economics Applications Laboratory, Institute of Government and Public
Metropolitan Development and Housing Agency. Reviewed and Approved
 Action Plan Grantee: Grant: Metropolitan Development and Housing Agency B-09-CN-TN-0024 LOCCS Authorized Amount: Grant Award Amount: $ 30,469,999.99 $ 30,469,999.99 Status: Reviewed and Approved Estimated
Rural Housing Challenges in Tennessee: Socio-economic Drivers, Problems and Opportunities
 Rural Housing Challenges in Tennessee: Socio-economic Drivers, Problems and Opportunities Presented at: 19 th Annual Rural Development Conference April 28, 2014 Hulya Arik, PhD Economist Tennessee Housing
for Arizona th Annual Statewide Conference on Ending Homelessness October 30, 2013
 for Arizona 2013 20 th Annual Statewide Conference on Ending Homelessness October 30, 2013 For a Strong Economy For Education For Health For Public Safety STRONG ECONOMY At all income levels, people living
Growth Opportunities Trends in: Affordable Multifamily Housing & Rural Business Markets
 Growth Opportunities Trends in: Affordable Multifamily Housing & Rural Business Markets Pathway Lending Mission: To provide lending solutions and educational services that result in the creation, development,
By several measures, homebuilding made a comeback in 2012 (Figure 6). After falling another 8.6 percent in 2011, single-family
. After falling another 8.6 percent in 2011, single-family") 2 Housing Markets With sales picking up, low inventories of both new and existing homes helped to firm prices and spur new single-family construction in 212. Multifamily markets posted another strong year,
2 Housing Markets With sales picking up, low inventories of both new and existing homes helped to firm prices and spur new single-family construction in 212. Multifamily markets posted another strong year,
STATE OF AFFORDABLE HOUSING
 STATE OF AFFORDABLE HOUSING IN NORTH DAKOTA 2010 REPORT Sponsored by: EXECUTIVE SUMMARY North Dakota is showing positive growth in a variety of economic factors the lowest unemployment rate in the country,
Economic Highlights. Payroll Employment Growth by State 1. Durable Goods 2. The Conference Board Consumer Confidence Index 3
 August 26, 2009 Economic Highlights Southeastern Employment Payroll Employment Growth by State 1 Manufacturing Durable Goods 2 Consumer Spending The Conference Board Consumer Confidence Index 3 Real Estate
Housing Price Forecasts. Illinois and Chicago PMSA, April 2018
 Housing Price Forecasts Illinois and Chicago PMSA, April 2018 Presented To Illinois Realtors From R E A L Regional Economics Applications Laboratory, Institute of Government and Public Affairs University
2012 Indiana Tax Credit Rental Housing Survey
 2012 Indiana Tax Credit Rental Housing Survey 155 East Columbus Street Suite 220 Pickerington, OH 43147 Bowen National Research conducted a statewide survey of nearly 450 Tax Credit rental housing properties
HOUSINGSPOTLIGHT. The Shrinking Supply of Affordable Housing
 HOUSINGSPOTLIGHT National Low Income Housing Coalition Volume 2, Issue 1 February 2012 The Shrinking Supply of Affordable Housing One way to measure the affordable housing problem in the U.S. is to compare
Swimming Against the Tide: Forging Affordable Housing Opportunities from the Foreclosure Crisis
 Swimming Against the Tide: Forging Affordable Housing Opportunities from the Foreclosure Crisis Prepared for: Rethink. Recover. Rebuild. Reinventing Older Communities Philadelphia, PA May 14, 2010 George
Housing Price Forecasts. Illinois and Chicago PMSA, May 2018
 Housing Price Forecasts Illinois and Chicago PMSA, May 2018 Presented To Illinois Realtors From R E A L Regional Economics Applications Laboratory, Institute of Government and Public Affairs University
RESIDENTIAL MARKET ANALYSIS
 RESIDENTIAL MARKET ANALYSIS EVAN ABRAMOWITZ RMLS Student Fellow Master of Real Estate Development Graduate Student September existing-home sales declined modestly, but inventory continued to tighten and
The supply of single-family homes for sale remains
 Oh Give Me a (Single-Family Rental) Home Harold D. Hunt and Clare Losey December, 18 Publication 2218 The supply of single-family homes for sale remains tight in many markets across the United States.
ECONOMIC CURRENTS. Vol. 5 Issue 2 SOUTH FLORIDA ECONOMIC QUARTERLY. Key Findings, 2 nd Quarter, 2015
 ECONOMIC CURRENTS THE Introduction SOUTH FLORIDA ECONOMIC QUARTERLY Economic Currents provides an overview of the South Florida regional economy. The report presents current employment, economic and real
Housing Price Forecasts. Illinois and Chicago PMSA, January 2019
 Housing Price Forecasts Illinois and Chicago PMSA, January 2019 Presented To Illinois Realtors From R E A L Regional Economics Applications Laboratory, Institute of Government and Public Affairs University
Housing Price Forecasts. Illinois and Chicago PMSA, August 2017
 Housing Price Forecasts Illinois and Chicago PMSA, August 2017 Presented To Illinois Realtors From R E A L Regional Economics Applications Laboratory, Institute of Government and Public Affairs University
Housing and Mortgage Market Update
 Housing and Mortgage Market Update Views from the Top Frank E. Nothaft Vice President and Chief Economist January 8, 2015 Summary: Housing & Mortgage Market Outlook for 2015 Interest rates expected to
While the United States experienced its larg
 Jamie Davenport The Effect of Demand and Supply factors on the Affordability of Housing Jamie Davenport 44 I. Introduction While the United States experienced its larg est period of economic growth in
Housing Price Forecasts Illinois Metropolitan Statistical Areas
 Housing Price s Illinois Metropolitan Statistical Areas R E A L Regional Economics Applications Laboratory, Institute of Government and Public Affairs, University of Illinois Dr. Geoffrey J.D. Hewings,
500 Q Q Q Q Q Q Q Q Q Q Q Q1-2015
 A QUARTERLY UPDATE ON THE ROLE OF FORECLOSURES IN THE REGION PROVIDED BY THE METROPOLITAN INDIANAPOLIS BOARD OF REALTORS Number of Available for Sale 2,250 2,000 1,750 1,500 1,250 1,000 750 500 Q1-2004
Multifamily Challenges and Opportunities in Middle Appalachia
 Multifamily Challenges and Opportunities in Middle Appalachia Multifamily Economics and Market Research Appalachia has long been known as coal country, but recently the region has diversified a bit --
The FortuneBuilders Market Insider. Monthly Newsletter December 2014
 The FortuneBuilders Market Insider Monthly Newsletter December 2014 This month, we look at the job market and check in on unemployment rates. Mortgage delinquencies and non-current loans are declining.
CHAPTER 2: HOUSING. 2.1 Introduction. 2.2 Existing Housing Characteristics
 CHAPTER 2: HOUSING 2.1 Introduction Housing Characteristics are related to the social and economic conditions of a community s residents and are an important element of a comprehensive plan. Information
Housing Price Forecasts. Illinois and Chicago PMSA, December 2015
 Housing Price Forecasts Illinois and Chicago PMSA, December 2015 Presented To Illinois Association of Realtors From R E A L Regional Economics Applications Laboratory, Institute of Government and Public
Housing Price Forecasts. Illinois and Chicago PMSA, March 2018
 Housing Price Forecasts Illinois and Chicago PMSA, March 2018 Presented To Illinois Realtors From R E A L Regional Economics Applications Laboratory, Institute of Government and Public Affairs University
State of the Nation s Housing 2008: A Preview
 State of the Nation s Housing 28: A Preview Eric S. Belsky Remodeling Futures Conference April 15, 28 www.jchs.harvard.edu The Housing Market Has Suffered Steep Declines Percent Change Median Existing
Business Creation Index
 Business Creation Index December 2016 National Association of REALTORS Research Department Introduction The new Business Creation Index (BCI) was created to monitor local economic conditions from the perspective
Housing Price Forecasts. Illinois and Chicago PMSA, July 2016
 Housing Price Forecasts Illinois and Chicago PMSA, July 2016 Presented To Illinois Association of Realtors From R E A L Regional Economics Applications Laboratory, Institute of Government and Public Affairs
Housing Price Forecasts. Illinois and Chicago PMSA, January 2018
 Housing Price Forecasts Illinois and Chicago PMSA, January 2018 Presented To Illinois Realtors From R E A L Regional Economics Applications Laboratory, Institute of Government and Public Affairs University
Metro Atlanta Rental Housing Affordability: How Hot is Too Hot for Low-Income Workers?
 Metro Atlanta Rental Housing Affordability: How Hot is Too Hot for Low-Income Workers? July 2018 Atlanta Regional Commission For more information, contact: cdegiulio@atlantaregional.org Metro Atlanta s
Housing Price Forecasts. Illinois and Chicago PMSA, March 2019
 Housing Price Forecasts Illinois and Chicago PMSA, March 2019 Presented To Illinois Realtors From R E A L Regional Economics Applications Laboratory, Institute of Government and Public Affairs University
Research Report #6-07 LEGISLATIVE REVENUE OFFICE.
 HOUSING AFFORDABILITY IN OREGON Research Report #6-07 LEGISLATIVE REVENUE OFFICE http://www.leg.state.or.us/comm/lro/home.htm STATE OF OREGON LEGISLATIVE REVENUE OFFICE H-197 State Capitol Building Salem,
5 RENTAL AFFORDABILITY
 5 RENTAL AFFORDABILITY While affordability has improved somewhat, the share of renter households with cost burdens remains well above levels in 21. Although picking up since 211, renter incomes still lag
TRENDS. ...a glance. Arizona s Housing Market. ... shaping Arizona s future.
 2008 Arizona s Housing Market...a glance. TRENDS... shaping Arizona s future. 2008 GOVERNOR S HOUSING FORUM September 9-11, 2008 High Country Conference Center Flagstaff, AZ JANET NAPOLITANO GOVERNOR FRED
CONTENTS. Executive Summary 1. Southern Nevada Economic Situation 2 Household Sector 5 Tourism & Hospitality Industry
 CONTENTS Executive Summary 1 Southern Nevada Economic Situation 2 Household Sector 5 Tourism & Hospitality Industry Residential Trends 7 Existing Home Sales 11 Property Management Market 12 Foreclosure
Quarterly Housing Market Update
 Quarterly Housing Market Update An Overview New Hampshire s current housing market performance, as well as its overall economy, is slowly improving, with positives such as increasing employment and rising
TUCSON and SOUTHERN ARIZONA
 TUCSON and SOUTHERN ARIZONA End of Year Housing Report (52) 818-454 Stephen@TeamWoodall.com 217 End of Year Housing Report SALES & INVENTORY Housing market trends For the overall real estate market in
Phoenix, Central and Northern Arizona
 Phoenix, Central and Northern Arizona End of Year Housing Report 1-8-354-5664 LongRealty.com 217 End of Year Housing Report SALES & INVENTORY Housing market trends For the overall real estate market in
VERMONT S RENTAL HOUSING AFFORDABILITY GAP CONTINUES TO GROW The Average Vermont Renter Can t Afford a Modest 2-Bedroom Apartment
 vermont affordable housing coalition FOR IMMEDIATE RELEASE: June 13, 2016 CONTACT: Erhard Mahnke, 802.233.2902, erhardm@vtaffordablehousing.org Renée Sarao, 802.660.9484, renee.vahc@gmail.com VERMONT S
Report on Nevada s Housing Market
 July Report on Nevada s Housing Market This series of reports on Nevada s Housing Market is co-presented by the Lied Institute for Real Estate Studies at the University of Nevada, Las Vegas and the State
Congressional District Report for the 115th Congress
 Congressional District Report for the 115th Congress New York District 22 Honorable Claudia Tenney (R) Congressional Districts of New York August 2018 Report National Association of REALTORS Q1/1980 Q3/1981
500 Q Q Q Q Q Q Q Q Q Q Q1-2014
 A QUARTERLY UPDATE ON THE ROLE OF FORECLOSURES IN THE REGION PROVIDED BY THE METROPOLITAN INDIANAPOLIS BOARD OF REALTORS Number of Available for Sale 2,250 2,000 1,750 1,500 1,250 1,000 750 500 Q3-2014
Housing and Economy Market Trends
 Housing and Economy Market Trends Mainstreet Organization Prices of single-family, detached homes in suburban Chicago increased 12.1 percent in May 2014 compared with the same period a year ago. Overall,
RESIDENTIAL MARKET ANALYSIS
 RESIDENTIAL MARKET ANALYSIS EVAN ABRAMOWITZ Joseph Bernard Investment Real Estate Oregon Association of Realtors Student Fellow Masters of Real Estate Development Graduate Student National housing market
500 Q Q Q Q Q Q Q Q Q Q Q Q1-2015
 A QUARTERLY UPDATE ON THE ROLE OF FORECLOSURES IN THE REGION PROVIDED BY THE METROPOLITAN INDIANAPOLIS BOARD OF REALTORS Number of Available for Sale 2,250 2,000 1,750 1,500 1,250 1,000 750 500 Q2-2015
CONTENTS. Executive Summary. Southern Nevada Economic Situation 1 Household Sector 4 Tourism & Hospitality Industry
 CONTENTS Executive Summary Southern Nevada Economic Situation 1 Household Sector 4 Tourism & Hospitality Industry Residential Trends 6 Existing Home Sales 10 Property Management Market 11 Foreclosure Situation
CHAPTER 7 HOUSING. Housing May
 CHAPTER 7 HOUSING Housing has been identified as an important or very important topic to be discussed within the master plan by 74% of the survey respondents in Shelburne and 65% of the respondents in
2018 Illinois and Western Indiana Health Alliance Group Medicare
 2018 Illinois and Western Indiana Health Alliance Group Medicare Jo Daviess Stephenson Winnebago Boone McHenry Lake Hancock Adams Henderson Noble DeKalb Porter Will Bureau Lake Marshall Rock Island La
THDA s Low Income Housing Tax Credit Program Report
 THDA s Low Income Housing Tax Credit Program Report 1987-2013 QAP Priorities, Market & Financial Influences Outcomes of the LIHTC program closely mirror the QAP priorities (set asides, caps and points):
The state of the nation s Housing 2011
 The state of the nation s Housing 2011 Fact Sheet PURPOSE The State of the Nation s Housing report has been released annually by Harvard University s Joint Center for Housing Studies since 1988. Now in
200 Q Q Q Q Q Q Q Q Q Q Q Q Q Q Q Update Table of Contents
 A QUARTERLY UPDATE ON THE ROLE OF FORECLOSURES IN THE REGION PROVIDED BY THE MIBOR REALTOR ASSOCIATION Number of Available for Sale 2,200 1,950 1,700 1,450 1,200 950 700 450 200 Q3-2017 Update Table of
Shadow inventory in Texas
 With the national and local real estate markets turning positive, questions remain about the shadow inventory that was supposed to be holding down the market. Concerns over shadow inventory re-entering
HOUSING GRANT APPLICATION HOME PROGRAM FOR FISCAL YEAR 2017 Program Description and Application Package Tennessee Housing Development Agency
 HOUSING GRANT APPLICATION HOME PROGRAM FOR FISCAL YEAR 2017 Program Description and Application Package Tennessee Housing Development Agency The Tennessee Housing Development Agency (THDA) administers
Arizona Department of Housing Five-Year Strategic Plan
 Arizona Department of Housing Five-Year Strategic Plan Agency Mission Providing housing and community revitalization to benefit the people of Arizona. Agency Description The Arizona Department of Housing
State of the Nation s Housing 2011: A Preview
 State of the Nation s Housing 2011: A Preview Christopher Herbert Remodeling Futures Conference April 5, 2011 www.jchs.harvard.edu No Signs of a Recovery Yet % Change % Change Description: 2008 2009 2010
Housing Affordability in Lexington, Kentucky
 University of Kentucky UKnowledge CBER Research Report Center for Business and Economic Research 6-29-2009 Housing Affordability in Lexington, Kentucky Christopher Jepsen University of Kentucky, chris.jepsen@uky.edu
OUT OF REACH IOWA 2018 THE HIGH COST OF HOUSING
 2018 THE HIGH COST OF HOUSING EXECUTIVE SUMMARY This publication is the second edition of Out of Reach Iowa, a report that documents the gap between wages and rent in the state of Iowa. This report builds
Housing Price Forecasts. Illinois and Chicago PMSA, September 2016
 Housing Price Forecasts Illinois and Chicago PMSA, September 2016 Presented To Illinois Realtors From R E A L Regional Economics Applications Laboratory, Institute of Government and Public Affairs University
250 Q Q Q Q Q Q Q Q Q Q Q Q Q Q Update Table of Contents
 A QUARTERLY UPDATE ON THE ROLE OF FORECLOSURES IN THE REGION PROVIDED BY THE MIBOR REALTOR ASSOCIATION Number of Available for Sale 2,250 2,000 1,750 1,500 1,250 1,000 750 500 250 Q4-2016 Update Table
St. Louis Area Local Market Report, Second Quarter 2016
 St. Louis Area Local Market Report, Second Quarter 2016 Today's Market $180,000 Median Price (Red Line) and One-year Price Growth 20% $160,000 15% $140,000 $120,000 $100,000 $80,000 $60,000 $40,000 10%