Town of Burlington Plan of Conservation & Development
|
|
|
- Cecil Sutton
- 5 years ago
- Views:
Transcription


1 Town of Burlington Plan of Conservation & Development
2 ACKNOWLEDGEMENTS Plan of Conservation & Development Burlington Residents: We are pleased to submit to you the Plan of Conservation and Development. This newest Plan is presented in a format that is easy to follow and includes a series of goals, policies and recommendations intended to address such important community issues as housing, public facilities, transportation, economic development and the environment. The Plan is the result of numerous public meetings by the Burlington POCD Oversight Committee, discussions with municipal employees and many residents over the past year, as well as hours of research, review and discussion by the Commission, Oversight Committee, its staff and its consultant. The Plan of Conservation and Development brings together in a thoughtful, comprehensive manner the various elements that contribute to the quality of life of the Town. We would like to acknowledge the following individuals and groups for their contribution of time and commitment to the development of this Plan. The residents of Burlington The POCD Oversight Committee: Neil Beup, Chairman Dick Alden James Millerick Mike Vollono Pam Weaver Roger Powell Sarah McCusker AECOM, Planning Consultants Haylin Alpert, AICP Victor Minerva, AICP Burlington Town Officials: Kathleen K. Zabel - First Selectman James A. Chard Kristen Grindal-Keller Richard A. Miller Theodore C. Shafer Town of Burlington Department Heads T OWN OF BURLINGTON
3 EXECUTIVE SUMMARY PLAN OF CONSERVATION & DEVELOPMENT The purpose of the Plan of Conservation and Development (Plan) is to document ideas, concerns and goals espoused by the citizens and local leaders that will guide the community in its efforts to continually improve the quality of life and to provide direction on how to achieve change. Chapter 126, Section 8-23 of the Connecticut General Statutes requires that a planning and zoning commission shall, at least once every ten years, prepare or amend and shall adopt a plan of conservation and development for the municipality. The Connecticut General Statutes require that the preparation of the POCD shall consider the following: The need for affordable housing; The need for protection of existing and potential public surface and ground drinking water supplies; The use of cluster development and other development patterns to the extent consistent with soil types, terrain and infrastructure capacity of the municipality; The State and Regional Plans of Conservation and Development; Physical, social, economic and governmental conditions and trends; Energy efficient patterns of development, renewable energy and energy conservation; The needs of the municipality including: human resources, education, health, housing, recreation, social services, public utilities, public protection, transportation and circulation, and cultural and interpersonal communications. In order fulfill the requirements of a POCD and develop a document that will guide the town towards it goals and objectives, particular steps were taken. First, data on issues such as housing, demographics and land use was collected, trends were identified and then public outreach was conducted. The public, town leaders, department heads and civic groups helped shape the goals and future needs of Burlington. The data collection, analysis and discussion produced a set of principles which can be used to organize regulatory and policy strategies that Burlington can implement to further the following objectives: Preserve Critical Environmental Areas Preserve Open Space and Natural Beauty Protect and Manage Residential Neighborhoods Create A Range of Housing Opportunities and Choices Maintain Distinctive Centers with a Strong Sense of Place Provide a Variety of Transportation Choices Address Community Facility Needs Address Infrastructure Needs Promote Sustainable Initiatives T OWN OF BURLINGTON
4 As a community, Burlington prides itself on its rural character, vast open space, recreational opportunities, quality municipal services and opportunities for development in the Town Center. The Town has experienced some growth since the last Plan of Conservation and Development in More recently growth has significantly slowed. In order to protect and further these important elements that collectively create a high quality of life, specific goals and action items have been identified by the collaborative POCD development process. The most significant recommendation calls for the creation of a Development Services Specialist. An individual, who has particular expertise in municipal economic development, land use planning and design, as well marketing skills, has the potential to significantly benefit the community. This person will be the leader of the planning process and economic development activities with the skills to take advantage of programs and funding opportunities. A Development Specialist, working with all the town boards and committees, would increase communication between the Boards and assist the Boards in implementing the Town s POCD. The development review process would be streamlined, input from appropriate Town Departments would be coordinated, and citizens could be more intimately involved in the planning and development process. In addition to a general history of the town, basic demographic and economic indicator data, there are six primary areas for which data has been collected and analyzed. Recommendations have also been developed to meet community goals and needs for following topical areas: Open Space and Natural Resources, Historical and Cultural Resources, Community Character, Housing, Economic Development, Town Center Development. While each of the topical areas is distinct, there are themes such as sustainability and increased public outreach and education on a variety of topics that run throughout the plan. The biggest priorities for Open Space and Natural Resources protection include accurately identifying the location of key resources so they can be appropriately protected as development continues. The location of land and water based resources when geographically identified can better protected through targeted activities such as mapping their location, and disseminating information to the public on steps they can take, such as controlling stormwater runoff to help protect resources. Some other examples of recommendations include: developing a septic system management program managing the use of impervious surfaces managing uses in floodway & floodplains. Additional natural resource protection is achieved through open space protection. Key to Burlington s open space protection efforts is developing an open space plan the clearly lays out the goals for open space protection as well as defined criteria that will allow the community to achieve their open space protection goals. In many ways, historic, recreational and cultural resources are the foundation of a community; they are the roots of a community s character. These features, along with important buildings, unique sites and events, contribute to the quality of life, while also contributing to the civic pride and uniqueness of the community. Much like open space and natural resources, essential to historical and cultural resource protection is the identification and mapping of these resources. Once resources have been accurately inventoried then programs that help protect the resources, increase public awareness and provide information about the importance of the resources in Burlington s history can be pursued. Community character is the distinguishing physical and social characteristics of a community; these qualities often are intangible, but they help give the community its identity. Certain characteristics or features of communities that contribute to their character include elements such as development patterns, quality design, historic resources, scenic resources, and attractive gateways. Burlington s strong community character has developed both organically through time and has also been supported by community leaders and local government decisions and regulations. Community Character can be
5 further supported in Burlington by considering the adoption of building design standards, protecting historic resources, improving signage standards and access to community resources, protecting scenic views and organizing and promoting community events. Residents are the backbone of a community and housing is one of the most important life style considerations for people. Housing growth was significant in the early part of this decade but has slowed recently. Still housing represents a significant portion of the tax base in Burlington. The type and housing style in Burlington is typical of rural Connecticut communities, primarily single-family homes. In order to provide more housing options that may appeal to those who prefer or need housing other than single-family homes Burlington can consider a housing policy that encourages alternative housing styles. Housing that appeals to younger residents and empty nesters is way one to diversity the housing stock. Irrelevant of the style and design of the future housing stock, any housing that is constructed should be designed and constructed using sustainable principles and minimize its impact on the natural environment. The economic health of most communities largely depends upon their ability to attract, grow, and retain business and industry. Significant opportunity for economic development exists in Burlington, particularly in the Town Center. The success of the numerous economic development opportunities likely rests with the creation of a Development Services Specialist position, mentioned previously. The key economic development opportunities include developing a business retention program and providing tax incentives to those companies who the community would benefit the most from. To support business Burlington should recognize businesses that utilize green site development and building construction principles. Burlington may also consider creating business incubator space, where startup business could utilize office space on a temporary basis. The greatest opportunity for development is in the Town Center. The success of the Town Center lies with the creation of a clear plan for the design and development of the Town Center. With a clear plan, developed with stakeholder involvement, the plan can be put into action. An important first step in the Town Center plan process is clearly defining the Town Center geographically. Additionally, the plan should address issues such as building design, the appropriate mix of uses and housing development within the center. Development of the Town Center and the success of other issues discussed in the Plan such as natural resource protection, improving community character will be based on local efforts. However, coordination with State agencies such as the DOT who is responsible for maintaining many of the roads in Burlington is also essential. Similarly, coordination with the Central Connecticut regional planning agency is important for regional coordination but also because of the resources and knowledge that is available from the Regional Planning Agency.
6 TABLE OF CONTENTS PLAN OF CONSERVATION AND DEVELOPMENT Introduction 1 Conditions, Issues and Trends 5 Conservation Themes Open Space & Natural Resources 25 Historic & Cultural Resources 47 Community Character 57 Development Themes Housing 65 Economic Development 78 Town Center Development 90 Community Facilities 97 Transportation 111 Consistency with State & Regional Plans 126 Implementation Plan 132 T OWN OF BURLINGTON

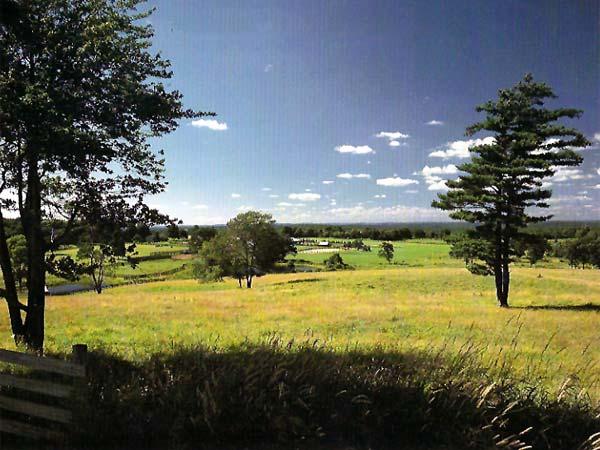
7 INTRODUCTION Plan of Conservation & Developmen The Community Burlington is a picturesque rural New England community situated on varying terrain that borders a series of ridges and mountains that run from New Haven harbor to Vermont. Burlington is located in the western end of Hartford County and is located approximately 20 miles west of the City of Hartford. Bordering the Town of Burlington is the City of Bristol to the south, Avon and Farmington to the east, New Hartford and Canton to the North and Harwinton to the west. The primary transportation routes through the Town include State Route 4 running east west ultimately connecting with Interstate 84. Route 8 runs north south and can be accessed just west of the Burlington border in Harwinton. Burlington is a member of the Central Connecticut Regional Planning Agency, one of 7 member towns. The region consists of urban rural and small towns. Burlington is one of the most rural towns in the region elements that weave a varied pattern. Burlington is characterized by its small town feel, traditional downtown, commercial centers, adjacent major thoroughfares, and protected open space. Burlington is 30 square miles, decidedly rural yet it is only a short distance to major employment centers and posses a great opportunity for the development of its Town center, posses and abundance of natural resources, including a section of the Farmington River and recreational opportunities. Hartford County PURPOSE The purpose of the Plan of Conservation and Development (Plan) is to document ideas concerns and goals espoused by the citizens and local leaders that will guide the community in its efforts to continually improve the quality of life and to provide direction on how to achieve public and private change. Chapter 126, Section 8-23 of the Connecticut General Statutes requires that a planning and zoning commission shall, at least once every ten years, prepare or amend and shall adopt a plan of conservation and development for the municipality. The last Plan of Conservation and Development was adopted by the Burlington Planning and Zoning Commission in Like the 1998 Plan, the Plan of Conservation and Development must conform to the requirements of a Plan articulated by the Connecticut General Statutes. Figure 2 summarizes the particular considerations that must be included in the Plan. 1

8 Connecticut Plans of Conservation and Development Must: be a statement of policies, goals and standards for the physical and economic development of the town; show the commission s recommendation for the most desirable land use within the municipality for residential, recreational, commercial, industrial and other purposes; show the commission s recommendation for the most desirable density of population; promote the coordinated development and the general welfare and prosperity of its people; promote housing choice and economic diversity in housing and encourage the development of housing which will meet the housing needs identified in the regional housing plan and the State s Plan of Conservation and Development; provide for a system of principal thoroughfares, parkways, bridges, streets, sidewalks, multipurpose trails and other public way; be designed to promote the coordinated development of the municipality and identify areas where it is wise to have compact, transit accessible, pedestrian-oriented mixed use development patterns and land reuse; Take into account the State s Plan of Conservation and Development and note any inconsistencies with said State Plan. Burlington s Plan of Conservation and Development serves as an advisory document that expresses a vision that the community aspires to while providing guidance for municipal decision making. Planning provides the opportunity to review past activities, understand the implications of current trends and policies, suggest strategies for the future and identify priorities and assign responsibility to implement recommended strategies. The plan is crafted to provide evidence and support for physical and policy oriented goals that will improve the quality of life for residents. The process of updating the POCD enables public participation in shaping the future of the Town and provides an opportunity to prioritize goals and implementation strategies and to set the course to achieve Burlington s goals. The adoption and subsequent implementation of a municipal Plan of Conservation and Development is a continuous process of documenting a community s land use characteristics and establishing a consistent and coordinated land use philosophy and regulatory framework for managing the Town s future physical, economic and social environment. This plan specifies policy goals and provides strategies and land use recommendations designed to protect and improve the quality of life of existing and future residents. It is primarily an advisory document and, to a significant degree, must be implemented through organized and involved citizenry, municipal employees and the creation or refinement of policies, regulations and organizational approaches. 2
9 Updating Burlington s POCD What is Legally Required? The Connecticut General Statutes require that the preparation of the POCD shall consider the following: The need for affordable housing; The need for protection of existing and potential public surface and ground drinking water supplies; The use of cluster development and other development patterns to the extent consistent with soil types, terrain and infrastructure capacity of the municipality; The State and Regional Plans of Conservation and Development; Physical, social, economic and governmental conditions and trends; Energy efficient patterns of development, renewable energy and energy conservation; The needs of the municipality including: human resources, education, health, housing, recreation, social services, public utilities, public protection, transportation and circulation, and cultural and interpersonal communications. The Future The town now stands at the beginning of the 21st Century at a critical juncture in its long history. Burlington s land area is nearing build out ; the town is fast approaching having no unconstrained land on which to expand. Many parcels are already being redeveloped. Burlington has a rich and varied resource base that contributes to its high quality of life, but it also has shortcomings, especially in the area of a declining downtown, access to open space and a lack of focus along its major corridors. Concentrating appropriate mixed use development in the Town Center area can help reinforce its role as the focal point for the Town. The guiding principles for community growth in the next decade are: Robust neighborhoods served by nearby commercial districts; Preservation and access to the natural environment; Economic vitality; Context sensitive mixed use development in the Town Center; Safe and efficient transportation options that serve the community. How This Plan Is Organized Over the past decade or so, there has been considerable discussion around the country about how to best manage the growth of communities in order to produce the best results. It is recognized that strict separation of uses is still important in single-family residential areas. But there is growing interest in allowing or encouraging mixed uses and encouraging development patterns that will create or reinforce a sense of place. 3
10 This discussion has produced a set of principles which can be used to organize land use strategies at the municipal level as well as regional and larger levels. For Burlington, those principles have been distilled to the following basic themes: Preserve Critical Environmental Areas Preserve Open Space and Natural Beauty Protect and Manage Residential Neighborhoods Create A Range of Housing Opportunities and Choices Maintain Distinctive Centers with a Strong Sense of Place Provide a Variety of Transportation Choices Address Community Facility Needs Address Infrastructure Needs Promote Sustainable Initiatives The plan is developed and organized around three major themes: Conditions and Trends Conservation Themes Development Themes Conditions and Trends The process of developing this plan included using Federal, State and local data to determine the existing conditions in Burlington. Identification of current trends and issues established the baseline of what has been successful over the past ten years, what trends and issues require attention and what trends and issues need additional analysis. Once the issues and trends are identified, efforts to bring change can be prioritized and an implementation schedule developed. Community Character Community character is what defines a town. The community character element of the plan identifies and assesses the natural and built elements of the town that cumulatively create the community s character. This element identifies community character elements that require conservation planning, such as natural resources, important neighborhoods and historic resources, to make sure that these areas and features are properly protected, preserved and managed in the future. Similarly, community elements that create character can improve a community s sense of place such as improved building and site design and improved recreational access are identified and strategies are provided. Development Development can have a profound impact on a community. It is important that the community understand where housing and commercial development is likely to occur, for example. Residential and commercial development also has impacts on infrastructure and services. These issues are addressed in this section. Once a community understands how existing polices and recent trends can impact the future of the community, only then can a community prepare new development objectives that respect history and cultivate Burlington s vision for the future. 4
11 CONDITIONS, TRENDS & ISSUES Plan of Conservation & Developmen OVERVIEW This booklet examines and outlines significant demographic, economic, and development trends from both a historical and contemporary perspective. These conditions and trends have a direct relationship with the current economic climate of the community and indicate how the community is changing. The implications of demographic conditions and trends, as well as the land use polices and the patterns of development, affect housing needs, community facilities, and the services that residents require. Understanding the characteristics of population growth is an integral element to formulating land use policies. These observations provide a basis for the policies and plans that the Town of Burlington should consider in order to meet the community s future needs. BURLINGTON IN THE PAST The original inhabitants of what is presently Burlington were members of the Tunxis Tribe of Algonquin Native Americans. In 1640, John Hayes, the Governor of Connecticut, purchased the land from the Tunxis. Burlington was previously part of the Town of Farmington which was incorporated in 1645, and the area was known as West Woods. In 1721, the area was divided into large areas that spanned the width of the Town. The first know settlers arrived in the early 1700 s. In 1774 a group of settlers petitioned the general Assembly to be incorporated as an independent ecclesiastical society. With the request granted, the area known as the West Woods of Farmington became the Parish of West Britain. The Parishes of West Britain and New Cambridge split from the Town of Farmington to become individual parishes. Then, in 1785 the two joined together to form Bristol. In 1806 West Britain separated and became Burlington. Original Burlington residents were mostly involved in farming, but over time several industries sprouted up taking advantage of the available water power from Burlington s numerous brooks and streams. In the 1800 s, the prospect of wealth and cheaper land grew to be too much to resist and Burlington s population was greatly affected by Westward migration. Contributing to this decline was the fact that surrounding towns were becoming greatly industrialized, drawing people from Burlington. After the Civil War, Burlington became an attraction for European immigrants due to burgeoning industry and the need for labor in the area. Post World War II, Burlington saw a population boom, as many people sought a serene rural setting to raise families. In the 1980s and 1990s Burlington s population continued to grow substantially. (adapted from: Clifford Thomas Alderman- Burlington is bordered by Bristol to the South, to the east by Farmington and Avon, to the north by Canton and New Hartford and to the west by Harwinton. The Town boundaries encompass roughly thirty square miles. The Town is located in the western end of Hartford County and is a member of the Central Connecticut Regional Planning Agency. Burlington is located about 20 miles to the west of Hartford and roughly 120 miles north east of New York City. 5
12 CHANGES IN POPULATION Understanding the characteristics of changes in population and the composition of the local population is essential to the planning process. Demographic trends impact housing needs, community facilities and services among other primary elements of the Plan of Conservation and Development. As shown in Table 1: Burlington Population, Burlington s population steadily trended upwards from the 1930s to After 1960, population increased much more rapidly than in previous decades, 46% from and 39% from 1970 to Steady gains in population are evident in the most recent Table 1: Burlington Population Year Population , , , , , , , , , , ,117 As shown in Table 2: Population Change by Block Group, below, Source: U.S. Census, CT State Data Center the population growth of the Town has steadily and strongly trended upward in all but one of its Block Groups. Burlington has shown gains while some communities in the central Connecticut have lost population, which is seen through the Town s greater share of the region s population. census in the year In terms of percent of population increase, Burlington was noted as having the fastest growing population According to the U.S. Census, Burlington experienced similar gains in population for each decade from 1960 to 2000, increasing population by 1,000 persons or more. Growth after 2000 is projected to come to a relative halt when compared to previous decades. These projections are not unique to Burlington, as increases in other communities and in the State as a whole, are projected to be minimal, one percent or less, according to the CT State Data Center. Other population projections are available from the Connecticut State Office of Policy and Management (OPM) but were last prepared in 1995 and underestimated growth for The most recent projections are available from the CT State Data Center and are provided in Table 1. Table 2: Population Change by Block Group ,020 1, , ,849 1,178 1,188 3,016 Change Source: U.S. Census Figure 1: Census Block Group Locations: 1990 and 2000 Source: U. S. Census 6
13 Population growth patterns in Burlington are similar to that of other Towns in the Farmington Valley from the 1960s through the 1980s. As shown in Table 4: Population Percent Changes, while most communities experienced extremely limited increases and even lost population in the 1990s, Avon, Farmington, and Burlington maintained double digit percentage growth. While the projections for future growth are not consistent, published projections indicate some continued growth in population in Burlington. Many communities across the county and State are expected to see decreases in population. Unique characteristics in Burlington have fueled population growth in spite of minimal increase or even decreases in neighboring communities. Community services, the quality of the school system, and housing costs are some of the more frequently cited reasons why individuals move to a community. Table 3: Population Change: Year Population Percent Change Share of Region s Population ,846-1% ,790 51% 2% ,070 46% 2% ,660 39% 3% ,026 24% 3% ,190 17% 4% Source: U.S. Census Table 4: Population Percent Changes, Burlington, Neighbors and the State Avon 58% 34% 24% 14% Burlington 46% 39% 24% 17% Canton 44% 11% 8% 7% Farmington 33% 14% 26% 15% Harwinton 29% 13% 7% 1% Bristol 22% 3% 6% -1% New 31% 23% 18% 6% Hartford Plymouth 15% 4% 10% -2% Connecticut 20% 3% 6% 4% Source: U.S. Census Table 5: Population Projections for Towns within Region by Percent Change Avon Burlington Canton Farmington Harwinton Bristol New Hartford Plymouth Source: U.S. Census 7
14 COMPONENTS OF POPULATION CHANGE Historic changes in population and population projections are key pieces of information used to plan for the next decade, however it is the changes in the composition of the population that have the most significant affect on community needs. An analysis of population by age group is essential for projecting municipal services, municipal facilities, housing needs, and economic development to some degree. A comparison of age stratification within Burlington in 1990 and 2000 shows how the composition of the population changed. The general trend across Hartford County, the State, and even the United States shows that the population is aging. While the 2000 U.S. Census information is nearly 10 years old, the Connecticut State Data Center has completed preliminary projections suggesting likely changes in population composition from 2000 into the next decade. Figure 2: Burlington Age Distribution, 1990& Figure 2: Burlington Age Distribution, 1990 & , shows that between the 1990 and 65 and Ov er 2000 Census in Years Burlington there was an increase in the number Years of people aged Years The biggest shift was in the number of residents Years aged 50-59, doubling Years 2000 over the ten year Years period. Rising home 1990 prices as well as 5-9 Years movement away from rapidly expanding 0-4 Years suburban communities nearby likely influenced ,000 1,500 2,000 this shift. Increases in the number of people Population over age 65 also occurred, which evidences an aging population. Almost ¼ of the Town s population was in the years old bracket in The sharp drop in the older population clusters that are of or approaching retirement age might be related to housing affordability, housing choice and specific services preferred by this age group. Additionally, senior housing in the town was not available at the time of Census 2000 fieldwork. Age Cohort During the same time period the number of residents aged increased roughly 20 percent, while the number of children under age 10 stayed about the same. The most significant change in age composition was the loss of residents between the ages of 20 to 29. The decline in population of young adults, who typically are of college age or new to the work force, may also have some relation to housing affordability, but also to housing choice. While there may be a shortage of housing opportunities that are affordable to young professionals; clearly, college age and young professionals are leaving the community for opportunities elsewhere. This trend is typical in suburban communities where housing that is affordable for this age group is in short supply. Moreover, even in communities where housing is relatively affordable, across the region, State, and across the Country, young adults are migrating to areas that offer housing that more closely meets their lifestyle choices. Figure 3: Age Distribution 2000, shows more clearly the composition of the Burlington population. The majority of the population is between the ages of 30 and 60, while there is a sharp drop in residents aged These individuals represent the next generation workforce and are an important component to the health and vitality of a community. 8
15 Age cohort projections provided by the CT State Data Center provides valuable information on how the composition of the population may change over the next two decades. In 2000, over 60% of the Town s population was in the working age cohort, Also in 2000, the percent of the Figure 3: Age Distribution population over age 64 was 7%. Age Group over Male Female This age composition is similar to the region and the State. The UConn State Data Center projects that the share of residents over 64 will increase significantly over the next decade. The ramification of this projection is that there will be increased demand for the housing desired by that segment of the population. Low maintenance homes, special need living facilities and in some cases tax relief are some examples of the lifestyle needs that may have to be met for this segment of the population Residents The percentage of working age citizens, 20 to 64, as a function of the total population is decreasing and that trend is projected to continue. While the percentage of citizens under 20 significantly decreased up until 1990, this trend has leveled off and the percentage of the population under 20 is projected to remain approximately the same, as indicated by Figure 4. Dependant population characterizes those residents under the age of 19 and those over age 65. Figure 5: Burlington & CT Median Age, shows the percent of the population in surrounding towns that are considered dependent. The percentage of a Town s dependant population has a direct correlation to the type of services its residents require. While residents over age 65 and those under 19 have significantly different needs, they need and utilize the greatest share of a towns services. These dependant populations are primarily not wage earners and therefore contribute less proportionally to Burlington s revenue. A community must achieve a balance between the services it provides and the revenues it generates. Relative to other neighboring towns, Burlington has a higher percentage of its population under the age of Population 5,000 4,500 4,000 3,500 3,000 2,500 2,000 1,500 1, Figure 4: Projected Age Composition Year 0 to to to to and Over 9
16 Figure 5: Burlington & CT Median Age 19, likely correlated to the quality of the educational system in Burlington. However, the high percentage of residents under 19 is offset in part by the low percentage of residents over 65. A community with a balance among its age cohorts represents a strong work force, varied civic participants and a balanced consumer group to ensure economic vitality. Median Age Connecticut Burlington The median age in Burlington is 2000 was 38 years of age, up slightly from the 1990 U.S. Census. Additional data provided by the UConn State Data Center indicates that the median age of the Burlington population is projected to continue to increase until 2015 before beginning a slow decline. As the median age is projected to decline after 2015, it is notable that the median age will remain three years higher than the median age in 2000 as reported by the U.S. Census. 35% 30% 25% 20% 15% 10% 5% % Pop Under 19 % Pop over 65 Dependent Populations Projections supplied by the UConn 0% State Data Center indicate that most Avon Bristol Burlington Canton Farmington Harwinton New communities will reach the highest Hartford median age around 2010 and then Towns the median age will begin to decrease. While Burlington s median age is comparable to adjacent towns, it is markedly higher than the region as a whole. 10
17 Table: 9: Approximate Medain Age of Household Population in Towns in Region Avon Burlington Canton Farmington Harwinton Bristol New Hartford Plymouth Source: US Census 11
18 HOUSEHOLD & HOUSING UNIT CHARACTERISTICS Safe, habitable and affordable housing is a basic human need. Therefore, housing that meets the needs of Burlington s residents is essential to the core strength of the community. The current and future quality of life, economic strength, and social characteristics are strongly tied to the quality and balance of housing types that exist in the community. The Housing Types As Defined by the US Census 1 unit-detached: A singlefamily structure, which may be attached to a garage or shed, and with open space on all four sides. 1 unit-attached: A singlefamily unit with one or more walls extending from roof to the ground separating it from adjoining structures. Row houses and townhouses are counted in this category. Each unit has its own heating element. 2-4 family dwellings: These are structures containing between 2 and 4 housing units sharing attics, cellars, furnaces, and/or boilers. Multi-family and Other: This category includes all other housing units including multi-family units with five or more units in the structure as well as mobile homes, boats, RVs, vans, and campers. Source: U.S. Census diverse in terms of housing type than the greater Hartford region and the State. Cities are included in the regional and state calculations, where housing other than challenge for any community is to maintain a balance of housing choices. Households and neighborhoods are often the backbone to a strong community. Providing a mix of housing types is important to any community that wants to be responsive to the present and future needs of its residents. The number of households and changing characteristics are key pieces of information that must be Table 6: Change in Number of Households, 1990 to 2005 Year Number of Households Percent Change by Year ,307? , % 2005* 3, % Source: U. S. Census *Dept. of Public Health estimate considered as housing policy is developed. Table 6: Change in Number of Households, 1990 to 2005, tracks changes in the number of households in Burlington. Change in the number of households does not necessarily correspond to population changes. Nationwide changes in household composition, such as decreased average household size, and a tendency for individuals to remain single longer then people have historically, impacts the total number of households in a community. Nearly 95% of the housing stock consists of single-family housing units. Relative to other communities in the region, shown in Table 7: Housing Inventory for Burlington & Adjoining Towns, the housing stock is similar in its diversity other rural towns in the region but certainly less Table 7: Housing Units in Burlington December 2005 Estimate Single Family Duplex Triplex or Quadplex Larger than quadplex Mobile Home single-family detached is typically found in higher concentrations. Balanced housing opportunities allows families with changing housing needs the ability to find homes within the community rather than be forced to relocate to another municipality. Currently, Burlington has over 3,000 housing units. The Connecticut Housing Inventory estimates that the Town had 3,192 units at the end of 2005, five years earlier the U.S. Census counted 2,901 units. Total 3, , % 1.20% 1.30% 1.70% 1.10% 100% Source: Connecticut Housing Inventory CT. Department of Economic & Community Development 12
19 Table 8: Distribution of Housing Units by Block Group compares the number of housing units in each Block Group with the population of each Block Group. Not surprisingly, because Burlington s housing stock is primary single-family residences, the share of total housing units is closely correlated with the Town share of the population within each Block Group. Table 8: Distribution of Housing Units By Block Group Block Group Housing Units Percent of Town Housing Total Population Percent of Town Population One % % Two % 1, % Three % 1, % Four % 1, % Nine 1, % 3, % Total 2, % 8, % Source: U.S. Census 2000 The Census also shows the presence of alternative housing options in Burlington. However, as the Connecticut Housing Inventory indicates as well, the range is very limited with a total of 108 units classified as two and multifamily housing units, and 33 as mobile homes. In terms of percentages, two family units constitute either 1.2%, per 2005 Connecticut Housing Survey data. The three/four family units are 1.3%, five and greater is 1.7% and the mobile home category is 1.1% of the housing stock. Housing affordability for all income levels is an essential factor for a balanced community. Emphasizing one housing option at the expense of another is a shortsighted approach because no specific type of housing works for an individual at every point in their life. 13
20 Table 9: Housing Inventory for Burlington & Adjoining Towns December 2005 Estimate Town and Georgraphic Area Categories of Housing & 4 5 Plus Mobile Other Unit Units Units Units Homes Total Units Avon 23.5 Sq. Miles 5, , % 2.30% 6.90% 8.10% % Bristol 26.8 Sq. Miles 15,303 2,799 3,171 5, , % 2.30% 6.90% 8.10% 0.00% 0.10% Burlington 30.4 Sq. Miles 3, , % 1.20% 1.30% 1.70% 1.00% 0.00% Canton 25 Sq. Miles 3, , % 5.70% 4.90% 9.80% 0.00% 0.00% Farmington 28.8 Sq. Miles 7, , , % 4.70% 8.40% 13.30% 0.10% 0.00% Harwinton 31.1 Sq. Miles 2, , % 1.40% 0.90% 0.60% 1.00% 0.00% New Hartford 38.1 Sq. Miles 2, , % 2.40% 3.30% 5.10% 0.00% 0.80% Plymouth 22.3 Sq. Miles 3, , % 7.90% 7.30% 8.00% 1.50% 0.00% Sources: Connecticut Housing Inventory CT. Department of Economic & Community Development & Connecticut Sate Register and Manual, 2007 In terms of residential mix, Burlington has one of the highest percentage of single family dwellings of these eight towns at 94.8 %. In terms of the percent of owner occupied housing, Burlington has the highest percentage of the eight towns, at 94.9%. Harwinton is second, at a close 93.1%. The other six towns have lower owner occupied percentages, from a high of 86.4% for New Hartford to a low of 61.9% for Bristol. 14
21 Table 10: Housing Units & Characteristics in Burlington & Adjoining Towns Totals Percentages Town Number Owner Renter Population of Units Occupied Occupied Occupied Vacant Avon 6,480 15, % 14.10% 95.60% 4.40% Bristol 26,125 60, % 38.10% 95.30% 4.70% Burlington 3,027 8, % 5.10% 97.90% 2.10% Canton 3,616 8, % 19.40% 97.20% 2.80% Farmington 9,854 23, % 24.70% 96.40% 3.60% Harwinton 2,022 5, % 6.90% 96.80% 3.20% New Hartford 2,368 6, % 13.60% 94.10% 5.90% Plymouth 4,646 11, % 21.50% 95.80% 4.20% Source: 2000 U.S. Census Burlington s housing stock has grown considerably in the last forty years and continues to grow. From 1960 to 2000, the Town s housing stock more than doubled, from 816 to 2,901 units, an increase of 255.5%. Since 2000, 362 housing permits have been issued in Burlington. Table 11: Housing Construction Authorizations, shows housing permits issued in Burlington from 2000 to 2005, the period immediately after the 2000 Census. The vast majority of homes constructed were single family dwellings. Of the 362 permits during this six year period, 338 were for single family dwellings, and 24 for multifamily dwellings (The Evergreens at Thompson s Way). For the period from 2000 to 2003, 64, 80, 64, and 65 permits were issued per year. In 2004, 54 were issued and 35 permits were issued in Year Table 11: Housing Construction Authorizations in Burlington 2000 to 2005 Three & Five or Total One Two Net Four More Demolitions units Unit Units Gain Units Units State Rank of Net Gain Total N. A. Source: Annual Construction Reports Connecticut Department of Economic & Community Development Using the 2000 Census as a base, over a six year period, the number of housing units increased by 12.2%. If the number of new housing permits stays continue to average 35 per year, the growth in housing from 2000 to will total 502 (362 plus 140 for four years at 35 units for years 2006, 2007, 2008 & ). The projected 502new units equates to an increase of 17.3%. 15
22 Table 12: Total Annual Housing Permits, puts total permit activity into a little broader perspective by providing a summary of construction authorizations in Burlington and its seven adjoining towns. The same six year period is covered, year 2000 to Burlington s total is in the middle, with Bristol, Farmington, Avon and Canton ahead of Burlington, and three towns behind; Harwinton, Plymouth and New Hartford. Table 12: Total Annual Housing Permits for Burlington & Adjoining Towns Year Total Avon Bristol Burlington Canton Farmington Harwinton New Hartford Plymouth Source: Total Permits by Town CT. Dept. of Economic & Community Dev. 16
23 LAND USE While Burlington is roughly 30 square miles, nearly 40% of the land area is owned by the State of Connecticut or one of three water companies. This fact undoubtedly contributes to Burlington s rural character. Yet, given the community s proximity to Hartford it is striking that the population is not higher. The population density was calculated in 2005 by the Central Connecticut Regional Planning Agency to be 292 people per square mile in Burlington. While this is significantly lower than Plymouth at 563 people per square mile, it is even more striking that Burlington s neighbor to the south Bristol which has a density of 2,297 people per square mile. This further evidences Burlington rural character. Since this plan is primarily a physical plan, the patterns of settlement are essential to understanding the community s growth, and trends are important for preparing a blueprint for future growth. Locational characteristics such as soil type, groundwater and topography have a profound influence on the type and intensity of development. As the community grows, competition among land uses grows. Competition results because many types of land uses require similar physical characteristics. Land areas exhibiting prime characteristics become scarcer as the community grows. The area of Burlington is approximately 19,496 acres, with 18,917 acres of land area and 579 acres of surface water area. In 1995, more than 75% of Burlington was considered open space or undeveloped land. Nearly half (46%) of Burlington was categorized as open space by the 1997 Plan, which utilized a wide definition for open space, including public parks, water utility land, agricultural land, and cemeteries. Nearly one third (31%) of Burlington was vacant and underdeveloped. The remainder was a combination of residential (20%), institutional (1.1%), roads (1.5%) and business (0.6%) uses, of which little could be described as intense and urban. Table 13 provides a detailed snapshot of Burlington s land use in Open space was the dominant category - comprising dedicated, managed, cemetery and agriculture lands. Residential use was overwhelmingly single family (3,860 acres %) and the portion providing two or more family was quite small (31 acres %). With the exception of land devoted to roads (284 acres %), the other uses included less than 150 acres and constituted less than 1% of the land area in Burlington. Parcels considered vacant must meet a two part test. First, the parcels must have no buildings and must not be used for a particular economic or social purpose. While water utility lands have no buildings, these lands have a definitive economic and social purpose - the provision of water supply, and therefore these lands are not considered vacant by this definition. Underdeveloped lands are lands that are currently used, but could be developed further. An example is of a single family residence on a fifty acre parcel in a one acre residence zone. It is very unlikely that the residence needs all of the fifty acres in the parcel and therefore much of the parcel can be considered surplus land. Using this example, one acre is allocated to comply with zoning and the remaining forty-nine +/- can be considered as surplus and underdeveloped. 17
24 Table 13 : Detailed Distribution of Land Uses in Burlington 1995 Land Use Total Acres Percent Residential - Single Family 3, % Residential - Multifamily % Agriculture % Dedicated Open Space 2, % Managed Open Space 6, % Cemetery % Public Facilities % Private Institutional Facilities % Commercial Recreation % Retail % Restaurant % Office % Heavy Commercial % Industrial % Automotive % Utility Facilities % Roads % Vacant / Underdeveloped 6, % Total 19, % Source: Memorandum #7 - Land Use Burlington 1997 Plan of Conservation & Development The following table provides a detailed snapshot of Burlington s land use in While the categories are similar to 1995, there are differences in category organization and approach between the 1995 and 2007 analysis. Foremost, the focus of the 2007 analysis is on land area and not surface water area. Efforts have been made to deduct the surface water areas from the land area estimations, and there is a separate category for the area of surface waterbodies. This was not the case with the 1995 analysis. 18
25 Table 14 : Detailed Distribution of Land Uses in Burlington 2007 Land Use Acreage Percent Waterbodies % Residential - Single Family 4, % Residential - Two Family % Residential - 3 to 5 Family % Residential - 6 or More Family % Agriculture % State Land 1, % Water Utility Land 5, % Public Parks & Open Lands % Cemetery % Public Institutional % Private Institutional % Commercial Recreation % Retail Sales & Services % Restaurants % Offices, Banks & Prof. Services % Heavy Commercial % Industrial % Automotive Sales & Service % Roads % Railroad % Utility Transmission % Vacant Land 5, % Total 19, % Source: Burlington Assessor Office & Compiled by Central Connecticut Regional Planning Agency 19

26 20
27 The 1995 analysis includes the surface area of waterbodies in the land category totals.. In general, the area of surface waterbodies is not buildable and therefore inflates the land area that can possibly be used for development. The 1995 area totals include the acreage of reservoirs and other waterbodies in the acreage calculations while these two numbers are separate in the 2007 estimation. The 1995 land use analysis has water utility land listed as managed open space and notes 6,331 acres. In contrast, the 2007 land use analysis lists 5,936 acres of land area and then there is a separate entry of 579 acres for waterbody area (not necessarily all within the boundaries of the water utility properties). From these numbers, it appears that the water utility land area has declined significantly (by 396 acres) from 6,331 to 5,936 acres. In fact, overall water utility acreage totals have not changed. Memorandum #7 for Land Use in 1995 lists 6,266 acres for the total land holdings for the three water utilities in Burlington and the number is essentially the same in 2007: 6,266.0 acres (Vision Appraisal & Town of Burlington Assessor Office). The following table provides the specific numbers. Table 15: Water Utility Land Holdings in Burlington Water Utility 1995 Acres 2007 Acres New Britain Water Department 3,160 3, Metropolitan District Commission 2,431 2, Bristol Water Department Total 6,266 6, Sources: Memorandum #7 - Land Use, October 18, 1995 & Vision Appraisal / Town of Burlington Assessor Office July 2007 Another difference relates to the categories. The multifamily residential category has been expanded in 2007 to show the number of units in a number of residential categories. Open space has a more precise definition in 2007 than in The open space category is limited to land that is dedicated, such as state forests and municipal preserves. The 1995 category is broader, including dedicated lands, the managed acres of the water utilities, agriculture lands and cemeteries. In 2007, cemeteries are part of the institutional category while agriculture and water utility lands are separate categories. 21
28 However one defines open land and open space, this land typically has no structures or development. Depending on which lands are included, open land accounts for 41% to 69% of Burlington s actual land area and contributes to the Town s rural character. The water utility lands are the largest single land use with 5,936 acres, and account for 30.45% of Burlington s land area. The other significant contributor to open space is the State of Connecticut with 1,357 acres (6.96%) in this category. In total, the State owns 2, acres. Public parks and open land preserves account for the third largest open space acreage, 689 acres (3.53%). The fourth category is the second largest land use class: vacant and underdeveloped land. These lands account for 5,383 acres and constitute more than a quarter of the land in the Town (27.61%). Unlike the other three, the open land provided by vacant and underdeveloped parcels can disappear overnight. Single family residential is third largest category of land use, accounting for 23.1% of the Town s acreage. Of the 4,528 acres, 4,496 acres are single family residential. With the exception of certain existing lots in the R-15 District, the effective minimum lot is one acre in size. In comparison, the other remaining land use categories have a small amount of acreage, with each having less than 2.5% of the land area of Burlington. The layout and distribution of the various land uses are shown graphically in the accompanying Land Use Map. Perhaps the smallest category, the conventional business use, constitutes a very small number of acres in Burlington: 78 out of 19,496 acres (0.39%). (Based upon acreage, the case can be made that water supply is the largest business enterprise in Burlington). Of the nearly 800 acres that are zoned for the three business zones in Burlington, acres are used for business purposes. The largest amount of land is in the Central Business District with acres, followed by acres in the Industrial District and 1.97 acres in the Neighborhood Business District. More land is used for residential purposes in the areas zoned for business ( acres) than for business. The largest contrast is in the Industrial District where acres are listed or classified as Industrial. Of this estimated acreage, acres are vacant, and are in industrial use. In addition, there are businesses in areas zoned residential. Land Use Changes Land use is not static, as land use changes over time. The following table provides a quantitative overview of the changes in land use that have occurred in Burlington in the twelve year period from 1995 to The 1995 and 2007 land use analyses have been placed side by side in the table to aide in understanding the type and scope of changes. However, there are major differences in the method of estimation and categorization for 1995 and 2007 that impact the numbers and outcome. For this comparison, the 1995 analysis, detailed uses have been reorganized into related and broader groupings to better compare to the 2007 analysis. As previously noted, waterbody area is one key factor and difference. The 1995 land totals include waterbodies while the 2007 numbers have waterbodies areas factored out. The largest changes have occurred in residential and vacant lands. The predominant development has been in the residential sector. The Assessor s Office records show that at least 674 buildings were added to the Town s inventory from 1995 to The vast majority of this construction has been residential, and new roads have been constructed for these dwellings. Housing permit data confirms this trend, with 672 permits for housing issued within this same period. 22
29 Table 15: Burlington Land Use By Type & Acreage Years 1995 & 2007 Use Category Year 1995 Year 2007 Acres Percent Acres Percent Acres Change Percent Change Agriculture % % % Commercial % % % Industrial % % % Institutional % % % Open Space 2, % 2, % % Residential 3, % 4, % % Railroad N.A. N.A % N.A. N.A. Roads % % 0 0 Vacant Land 6, % 5, % % Water N.A. N.A % N.A. N.A. Water Utility Land 6, % 5, % % Total 19,495 19,496 Sources: 1995 data from Memorandum #7 Land Use Plan of Conservation & Development 2007 from Town of Burlington Assessor Office & compiled by CCRPA. There is a symbiotic relationship between development and vacant land. Parcels can be redeveloped and the reuse of existing land does not require vacant land to be consumed. However, the usual pattern is for development to utilize vacant land. While this is true for all development, it is especially true for residential development. As residential development advances, the supply of vacant land goes down. Overtime, the supply of easier to develop land is reduced and development moves to the more complicated tracts of land. During the twelve year period, the most dramatic changes have occurred in residential and vacant lands. The estimated increase in residential acreage is 634 acres, for a 16.4% increase since The estimated decrease in vacant and underdeveloped land is 744 acres, or 12.1% since ,383 acres of vacant land that can be developed in Burlington still remain. These 5,383 acres constitute 27.61% of Burlington s total land area, excluding waterbodies. With a difference of 553 acres, the amount of vacant and underdeveloped land is still comparable to the amount of land managed by the water utilities, and the contribution to the rural character that open, unused land gives. The potential for development of these 5,383 acres is a major question. 23
30 PLAN OF CONSERVATION AND DEVELOPMENT Conservation Themes T OWN OF BURLINGTON 24
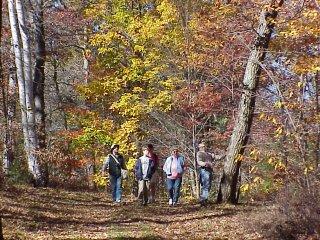
31 Open Space & Natural Resources Plan of Conservation & Development Introduction Based on discussion from the focus groups, the prominence of the Burlington Land Trust, and the significant number of visitors to the trail system, it is clear that Burlington residents value the open space and natural resources. The outstanding beauty, recreational opportunities, rural character and the ecological integrity of their community are shaped by these resources. For these reasons Burlington strives to improve the protection of these valued resources. Protecting open space is more than preserving scenic beauty and creating recreational opportunities. The protection of natural lands provides flood storage capacity, wildlife habitat and corridors, helps maintain natural diversity, and helps filter pollutants from the air and water, among other things. Burlington also plays an important role in the health of the Farmington River Watershed. Enhancing the quality of the environment in order to provide long term use of the resources for recreation, scenic beauty and continued ecological benefit will guide Burlington s open space and natural resource protection efforts. The views of open land, forested landscape, river corridors and scenic ridgelines lead to a public perception that large areas of the Town are open space, without consideration of the ownership or protection status of the open space. Open space planning done in an efficient and well coordinated process can ensure the integrity of natural resources and secures protected open space permanently. New development of greenfields, not controlled by the State of Connecticut or by one of the three water companies that own land in Burlington, reduces the potential for open space protection and may eliminate the possibility of developing connections between existing open space. This fact, again, underscores the importance of comprehensive open space planning and the identification of key natural resources. There are tools and techniques that will enable the town to continue commercial and residential development while maintaining its Key Natural Resource & Open Space Issues Natural Resources: Land Protect steep slopes Geographic identification of key resources to be protected Use of resource location info in land use decisions Support farmland preservation & active farms Water Manage stormwater quality Protect public drinking water supplies Improve septic system management Manage use of impervious surfaces Mange uses in floodway & floodplains Protect wetlands, vernal pools & watercourses Open Space Define Open Space Complete an Open Space Inventory Market OS protection opportunities & resources Develop a committee to work on OS issues Develop a community OS Plan 25
32 rural character without sacrificing important open spaces. It is important that impacts to natural lands permitted by current development patterns be identified and addressed by public education campaigns and changes in land use and zoning polices to allow Burlington to achieve its protection goals. Protection of natural resources and the environment continues to be an important issue to residents. The quality of ground and surface water supplies, wetlands, prime agricultural soils, wildlife habitats, and unfragmented forest land are necessary for the health of Burlington s ecosystem as well as its role in the greater region. It is in Burlington s long-term interest to work toward preserving and protecting their natural resources. Burlington is fortunate to have varied topography, a mix of woodlands and river corridors and upland areas provide opportunities for passive recreation. The Farmington River flows north to South through Burlington at the northeast edge of the Town. The river corridor, the nearby Nepaug Reservoir and numerous brooks such as Clear Brook, Whigville Brook provide rich natural habitat and natural beauty. This low lying river corridor is dramatically contrasted by Johnny Cake Mountain and scenic vistas like Perry s Lookout, and areas rich in plant species considered rare or endangered such as the Nassahegan Forrest. Public input gathered by the POCD focus group meetings further indicated an interest in maintaining and expanding open space protection. The financial resources available to the Town to preserve open space are limited yet the well organized and active Burlington Land Trust serves as the steward for multiple parcels and seeks to acquire additional parcels of open space. Therefore, it is important to develop a clear and accurate assessment of current open space conditions, define goals and polices related to open space and natural resource protection, and put forward strategies to accomplish policy recommendations. It is not the intent of this document to recommend specific parcels for open space protection but to provide strategies for coordinated open space acquisition and guidelines that foster responsible development strategies that effectively maintain the diversity and health of natural resources as well as the natural beauty in Burlington. Natural Resources To minimize the human impact on natural resources and allow them to perform their natural function is the ultimate goal. Finding a balance that satisfies community needs with resource protection is a complex and continuing challenge. Natural resource preservation and conservation are two equally important values that must be adhered to for a complete resource protection strategy. Protect Land Based Natural Resources Burlington is fortunate to still have significant forest land, ridgelines, and other undeveloped natural lands. While some of these areas are protected, many acres of valuable natural resources are vulnerable. There are a number of strategies and tools that can be pursued by the Planning and Zoning Commission and other entitles that will further protect natural resources. These issues are addressed below. Steep Slopes One of the most fundamental issues to consider for new development is the ground upon which the proposed development will be built. A major concern is the practice of blasting hillsides and steep slopes in order to accommodate development in inappropriate locations. In addition, concerns about drainage, erosion, and sedimentation issues are inherent to development on steep slopes. Currently, Burlington s current regulations prevent development on slopes greater than 15%. Generally, slopes over 15% represent a significant development constraint. Development of these areas poses additional hazards including increased erosion, surface runoff, and unstable slopes. Given these characteristics, development is better 26
33 suited elsewhere. Burlington is effectively limiting theses potential hazards by preventing development of steep slopes. However, to further ensure that these slopes are protected accurate information must be provided detailing where slopes begin and end. In order to properly protect slopes all site plans should provide 2 foot contour lines that identify topographical changes across parcels of land. Actions to protect steep slopes: Continue to enforce regulations prohibiting development of steep slopes Require development applications to submit 2 foot contour survey to ensure steep slope protection Adopt Buildable Land Provisions Buildable land regulations, typically applicable only to residential development, regulate the number of housing units allowed based on the natural carrying capacity and character of the land. This is accomplished by excluding certain areas that are essentially unbuildable when considering the amount of buildable land on a piece of property. Unbuildable land refers to lands within the road right-of way, wetland, steep land, or lands with other constraints. In Burlington this form of regulatory policy is called a reduction factor, constrained lands are subtracted from the gross acreage of a parcel To ensure the natural carrying capacity of land is not exceeded, Planning and Zoning Commissions adopt a buildable land regulation to ensure that each building parcel has sufficient buildable land. The provisions require excluding constrained land from contributing to the amount of buildable land need to meet a minimum lot size requirement. Floodplains and floodways, streams, wetlands, and rights-of-way will be excluded from consideration of the buildable land area of any parcel. Burlington s existing regulations effectively direct development to the most appropriate location on a particular development site. The key to the success of buildable land regulations is the geographic identification of the resources. The collection of this information is commonly referred to as a natural resource inventory. The inventory serves as a database of information of the location of specific resources, both land based and water based. The Farmington River Watershed Association completed a Natural Resource Inventory for the Burlington Open Space Committee in The inventory should be regularly updated to assist Boards and Commissions making development decisions. The inventory is not parcel specific. Therefore the identification of specific resources on individual parcels can be made to be one of the first steps of the development application process. Standards can be built into the zoning regulations the require mapping of resources as a component of any development application. Actions to direct development to the most appropriate locations: Continue to apply buildable land provisions Require identification of steep slopes, wetlands, and vernal pools on all development applications and consider requiring the identification of rock walls, rock outcropping and trees over a certain caliper; elements that contribute to the rural character of Burlington. 27
34 Protect Important Habitat Resources There are several areas in Burlington that are important habitat for rare, endangered, and threatened species. These areas include forested areas, floodways, intact wetland ecosystems, and migratory corridors. The State DEP has identified several areas within the Town containing lands with these qualities as indicated in the State s Natural Diversity Data Base (NDDB). The map and the DEP official explanation of the map is located here: As part of the land use application process, reviewing agencies such as the Planning and Zoning Commission should compare proposed development with NDDB identified on DEP maps and consult with DEP to discuss potential impacts to the habitat areas and have DEP review and comment on the development. The Commission should then adopt a practice of considering the DEP s comments when reviewing applications on lands in the NDDB and include the comments as conditional requirements of approval. The presence of the species does not preclude development of the site; rather it helps direct development to the appropriate location within the site to minimize impact on a species. NDDB maps generally identify the location of species of concern; they do not specifically identification location of species or the type of species, to help protect the species. Specific information is controlled by DEP and is disseminated at their discretion. To protect Burlington resources the Town should consider completing a Town wide biological study to identify wildlife corridors, breeding grounds and other important species habitat. The Farmington River Watershed Association has undertaken a similar project in seven Towns neighboring the Farmington River Watershed. There are three primary objectives of study: 1. Collect and map comprehensive data on the biological resources within the seven town area; 2. Identify and map priority conservation areas for incorporation within each town s Plan of Conservation and Development to help guide municipal planning and decision making regarding land use; and, 3. Promote awareness of the regions unique ecological communities, the importance of biodiversity, threats to biodiversity, and the role that various municipal commissions can take towards the conservation of biodiversity. The FRWA has the infrastructure set up to complete a similar town-wide biodiversity study in the Town of Burlington. Actions to protect Important Habitat: Review all development applications to disclose any activity within areas designated by the State Department of Environmental Protection on their Natural Diversity Database. Allow P&Z to require a biological study to accompany development proposals on lands identified as a Natural Diversity Database Areas when appropriate. Explore funding opportunities to complete a town wide biological study to identify wildlife corridors, breeding grounds and habitats of State and Federal Endangered, Threatened, and Special Concern species and locally significant species. If a town wide biological study is completed this information should be used in the review of development applications. 28

. A copy of this list can be placed in the Land Use office and a link can be maintained on the Town s web site.")
35 Use Native Species in Landscaping A simple measure for protecting native species habitat, used in several Towns in Connecticut, requires commercial landscaping to consit only of native plants listed on the Connecticut Native Tree and Shrub List. This list provides not only a complete list of those plants which are native and compatible with our region, but also provides information on the availability and location of suppliers of these plants. ( ). A copy of this list can be placed in the Land Use office and a link can be maintained on the Town s web site. The Commission should encourage applicants to only make use of the species identified on the Connecticut Native Tree and Shrub list. Actions to increase the use of native landscaping: Consider revising zoning regulations to require that commercial, subdivision of land and gravel operation land reclamation landscaping install species listed on the Connecticut Native Tree and shrub list Encourage the use locally grown and purchased landscaping materials Forest and Agricultural Lands Agriculture plays a prominent role in the history of the community. While there may not be as many acres actively farmed as there once were, farmland is still a key resource in Burlington. Farmland, undoubtedly, contributes to Burlington s character and creates some of the most scenic landscape in Burlington. It is also 29

36 an important part local economy and represents economic development opportunities. Farmland conservation is a goal across Connecticut and a number of resources exist to help communities support agriculture and help individual farmers. For example, American Farmland Trust (AFT), with the assistance of the Connecticut Department of Agriculture as well as Connecticut Farmland Trust, has developed a guide to assist landowners, land trusts and communities identify options available to help protect and conserve farmland. The guide, Conservation Options for Connecticut Landowners: A Guide for Landowners, Land Trusts & Municipalities, is available from the CT Department of Agriculture's Farmland Preservation Program. Conservation Options for Connecticut Farmland describes farmland protection tools and programs available in Connecticut and answers some frequently asked questions about agricultural conservation easements, which are deed restrictions that protect land from development. The guide also identifies state and federal incentive-based programs for conserving wetlands, wildlife habitat, soil and water and other natural resources on farmland. Burlington can play an important role in increasing the visibility and improving the viability of local farms. Towns are establishing festivals to showcase local farm products, providing space for farmers' markets, working with schools to bring local foods into their cafeterias and developing local farm product guides. Such steps illustrate support for local farms, educate community members and support the economic viability of farms. Forest land, like farmland, is an important part of Burlington. Based on calculations from CCRPA, 57% of Burlington is forested, this is evident as one travels through Burlington. However, a considerable portion of forest land could ultimately be developed. Forestland protection is important on a variety of levels, the recreation opportunities it provides, its inherent ecological value, and its contribution to character to the community for example. Forestland protection is discussed in conjunction with open space issues later in this chapter. However one particular program that directly impacts farmland is Connecticut Public Act 490. This long standing program helps protect forestland, allowing forestland (minimum of 25 acres) to be taxed a lower rate than the rate arrived at by using the typical highest and best use formula. This program takes some of the pressures off landowners by reducing the tax on the property. Currently, based on CCRPA data, there area 145 parcels in Burlington totaling 5,650 acres in the program. Actions to protect of Farmland and Forests: Ensure farm owners are aware of conservation programs and tools provided by the State of Connecticut and Farm Advocacy Group Utilize resources provided by the Connecticut Farmland Trust and the information seminars on protection strategies they provided to farmers. For more information: Support unified marketing efforts of local farmers Consider acquiring farmland development rights as a partner with the CT Department of Agriculture: Farmland Preservation T OWN OF Program B URLINGTON P LAN OF C ONSERVATION AND D EVELOP MENT Consider requiring a buffer between residential uses and agricultural uses Continue to support the Public Act 490 Program 30
37 Protect Water Based Resources Protect Water Resources and Water Quality Water resources provide drinkable water, contribute to biological diversity, and add to the overall quality of life. Both surface and groundwater are fragile resources, which once contaminated can be lost forever as a source of potable water. Therefore, the best strategy is to protect all water resources from contamination to the maximum amount practical. Burlington plays major role in the health of the Farmington River watershed. The State of Connecticut has adopted water quality standards to protect ground water resources. As a means to achieve certain water quality standards, storm water discharge standards are set and certain criteria must be met by municipalities to help maintain water quality standards. Since 1990, water quality has been regulated, in part through the National Pollutant Discharge Elimination System (NPDES) program. Phase I of the NPDES involved permits issued by the CT DEP to large municipal stormwater systems and for construction activities equal to or in excess of five acres of land. Since 2003 Phase II of the NPDES has required regulation of even small discharges from municipal storm water systems and permits for construction activities that disturb as little as one acre of land. There are six program elements of the NPDES Phase II program. The Commission, along with the IWWC, the Health Department, and the Planning and Zoning Commission, should continue participation in all of these program elements. The following table identifies the various program elements and provides examples of Best Management Practices that should be encouraged and promoted through a coordinated effort of all appropriate Town agencies. Table 1: Best Management Practices Program Element Public Information and Outreach Public Participation and Involvement Illicit Discharge Detection and Elimination Construction Run-off Controls Post-construction Runoff Controls Pollution Prevention Description Programs to help make the public aware and concerned about the impact of their behavior on pollution and water quality. Joining forces with other groups to work toward the same goal with complementary programs. Examples of Best Management Practices Develop an outreach program Prepare information materials Implement the outreach program Community meetings Clean-up days School programs and field trips Preparing pro-active and reactive Develop detection program approaches to finding and eliminating Develop avoidance program untreated discharges. Develop response plan Implement programs Programs to control erosion and Update erosion and sedimentation regulations sedimentation (E&S) for sites Review all development plans disturbing one or more acres. Require use of prevention / management techniques P LAN OF C ONSERVATION Regularly AND D EVELOPMENT inspect construction sites Reducing the amount of run-off occurring as a result of development. Preventing pollution by municipal organizations. Require infiltration Minimize impervious surfaces Buffer sensitive resources Minimize street sanding Clean up street sweepings Contain possible pollution sources 31
38 Actions to protect Water Resources and Water Quality Consider offering development incentives for developers who incorporate best management techniques into their development proposals Organize outreach and education concerning best management practices Protect Aquifers, Reservoirs and Groundwater Areas of high groundwater may be appropriate for the development of future public water supplies. Areas where groundwater can yield large volumes of water for public consumption are referred to as aquifers. Aquifer Protection mapping by the State was completed in early and Aquifer Protection Areas (APA) are now being established at the local level. Burlington has two aquifer protection areas. The Aquifer Protection Area Program responsibilities are shared by the State DEP, the municipalities and the water companies. DEP is responsible for overall program administration, establishing state land use regulations and standards, approving aquifer protection area maps and local regulations, and developing guidance materials. In addition to program administration, DEP: assists municipal aquifer protection agencies with implementation provides training for the local officials and aquifer protection agency members directly regulate major facilities, state facilities and public service companies (utilities) located within the aquifer protection areas educates the public about ground water protection. Municipalities in the program play the most critical role. They are responsible for appointing an aquifer protection agency, inventorying land uses within the aquifer protection area, designating the aquifer protection area boundary, and adopting and implementing local land use regulations. The agency regulates land use activities within the aquifer protection area by: registering existing regulated activities issuing permits for new regulated activities overseeing regulated facilities educating their citizens on ground water protection. 32
 mapping has been completed for all the well fields, providing a general estimate of the critical areas.")
39 Water companies are required to map critical recharge areas of the aquifer which provide water to the well fields. The preliminary (Level B) mapping has been completed for all the well fields, providing a general estimate of the critical areas. This preliminary mapping is refined by the water companies using extensive, site-specific data and ground-water modeling to determine the final (Level A) mapping area. The final mapping defines the regulatory boundaries for the land use regulations. In addition to mapping, the water companies: assist towns with their protection programs and oversight of the aquifer protection area conduct well field monitoring to warn of contamination plan for land acquisition and protection around well fields. Burlington should work towards becoming fully regulated by in the next year. Additionally, the Planning and Zoning Commission should ensure that regulations addressing sedimentation and erosion control are consistent with the practices Actions to protect Aquifers, Reservoirs and Groundwater: Protect Burlington s Stratified Drift Aquifer bedrock-till formation aquifers as its is the primary drinking water source within the Town of Burlington Initiate process of adopting Aquifer Protection Area land use regulations. Update Aquifer protection regulations and mapping as level A mapping is concluded by the State of Connecticut Continue to protect existing and potential water supply aquifers and water supply watershed lands from land uses and development methods that pose a risk to maintaining high water quality. Provide incentives for the use of storm water management techniques that limit impervious surface and on-site water retention/infiltration Update local zoning and wetlands regulations in order to reduce runoff and sedimentation. Severely limit development other than temporary or passive recreation in 100 year flood plan Develop public outreach materials to educate the community about the existence and purpose of an aquifer protection area and the role that they play recommended by the 2002 Connecticut Guidelines for Erosion and Sedimentation Control. Develop a Septic Management Program Most of Burlington s sewage disposal is provided by private septic systems, except for two small areas where a public sewage system is in place. Septic system failure can lead to contamination of stormwater runoff, which can contaminate drinking water supplies. A Septic Management Programs can encourage or require residents to monitor and regularly maintain septic systems. The Health Department, should consider evaluating the threat of septic systems on drinking water resources, and if warranted, develop a Septic Management Program which would require the periodic inspection and maintenance (pumping) of septic systems. Numerous Connecticut towns have already implemented these programs with much success. Manage Impervious Coverage Impervious coverage refers to areas of land which are paved or developed and which do not allow water to percolate through the soils and into 33
40 ground water resources. There are no restrictions on impervious coverage in Burlington. The Town s Zoning Regulations address lot coverage, but this only applies to roofed buildings, and does not include driveways, patios, pools and other types of land development that prevent infiltration or increase stormwater runoff. As the Commission revises the Zoning Regulations, it should encourage site designs that minimize impervious surfaces, promote infiltration and reduce runoff. The Zoning Regulations should also include impervious coverage performance objectives including the use of roof leaders, rain gardens, a minimum amount of landscaped and/or natural areas, and the use of porous paving materials to allow clean water from building roofs to infiltrate the ground. The coverage requirements should include stronger standards in environmentally sensitive areas (aquifer protection zones proximite to waterways) and more relaxed standards in areas where the town would like to see development, such as the Town Center. Site designs that minimize surfaces, promote infiltration, and reduce runoff should be encouraged. Figure 1: Pervious walking trail under construction increased impervious Actions to mange impervious surface: Provide incentive within the zoning code for the use of pervious materials for parking areas and walkways on commercial and industrial development. Encourage the use of Low Impact Development techniques through zoning and subdivision regulations Provide informational seminars for land use boards on the application and benefits of Low Impact Development Techniques, sustainable stormwater management techniques Protect Wetlands and Watercourses Wetlands, which in Connecticut are defined as poorly drained, alluvial, and floodplain areas, are the links between water and land. Wetlands are essential to the adequate supply and quality of surface and underground water, the stability and control of flooding and erosion, the recharging and purification of groundwater, and are vital for the existence of many forms of life. Burlington has an Inland Wetlands Commission and Watercourses (IWWC) which regulates activities within wetlands, and adjacent uplands within 500 feet of wetlands. This regulation has created a policy of no net loss of wetlands. The Town is doing an effective job of protecting wetlands. The primary watercourses in Burlington include: Burlington Brook The watershed that Burlington Brook drains is the second largest watershed in the Town. This watershed includes a number of subwatersheds of local streams, most prominent of which is Bunnell Brook. The watershed is part of the Farmington River regional watershed, which is part of the Connecticut River major basin. The Burlington Brook watershed extends into a small part of Harwinton. The entire watershed is 9.25 square miles, with 9.22 square miles in Burlington. Coppermine Brook A major section of the Town is covered by the Coppermine Brook watershed, which is also the largest watershed in the town. Of the total 18.6 square mile watershed area, Burlington occupies 10.5 square miles. The rest of the watershed is in Bristol. It is part of the Pequabuck River Watershed, which is part of the Farmington River major basin. Coppermine Brook drains into the Pequabuck River near Forestville in Bristol. The majority of the watershed is protected land. The Session Woods Wildlife Reserve and part of the Nassahegan State Forest are in this watershed, along with some 34
41 water company properties. Part of the watershed is developed with low density residential uses. Surface water quality is classified as AA, which means that the brook has uniformly excellent character, and is suitable for all water uses, including potential drinking water supply. Farmington River The Farmington River is the largest tributary of the Connecticut River Basin. The Farmington River covers a drainage area of 609 square miles of which 213 square miles comes from the main stem itself. About 4.1 square miles of land in Burlington drains into the Farmington River. The land uses in this watershed are mixed.there is a lake community, some low density housing, some water company land, and some forest land in the watershed. The lake community is served with public sewer from the neighboring Town of Farmington. Nepaug River A third of the northern section of the town is covered by the watershed associated with the Nepaug River, which extends into four other towns in the area. Of the total 31.9 square miles of this watershed area, Burlington occupies 4.4 square miles. It is part of the Farmington River regional basin, which is part of the Connecticut River major basin. The Nepaug River drains into the Farmington River near the Burlington/Avon border. It is of note that more than two thirds of the drainage area is water supply watershed land of the Metropolitan District (MDC) and, therefore, is protected from development. Nepaug reservoir is one of the most prominent features of this watershed. Land uses are predominantly rural residential and forestland. Surface water quality is classified as AA. Poland River The Poland River is a tributary of the Pequabuck River; and a sub-watershed of the Pequabuck s drainage area. Both watersheds are subwatersheds of the Farmington River regional basin, part of the Connecticut River major basin. The Poland River watershed drains an area of 10.2 square miles, much of which is in the towns of Harwinton and Burlington, with lesser land areas within Bristol and Plymouth. The watershed encompasses 2.2 square miles in Burlington (7.2% of the Town s total land area), half of which is owned by the Bristol Water Department. The Poland River s confluence with the Pequabuck River is close to the intersection of Routes 72 and 6, in Plymouth. Forested land and rural residential areas typify the majority of land uses in the watershed. In 2006, a Watershed Management Plan was prepared by the Central Connecticut Regional Planning Agency (CCRPA) in coordination with the Pequabuck River Watershed Association (PRWA), the Farmington River Watershed Association (FRWA), and the Connecticut DEP. The goal of this plan is to develop an affordable and effective watershed management plan that can be implemented by the watershed towns. This plan describes various areas of concern facing the watershed, and includes a plan of action to address these concerns. Protect Vernal Pools Vernal pools are seasonal pools of water, found in depressions in the soil with no above ground outlet. Many species of salamanders, frogs, invertebrates and insects require vernal pools for breeding and reproduction. Vernal pools support fauna specifically adapted to breed in the seasonal and cyclical nature of these unique water resources. While it is decidedly likely that there are vernal pools in Burlington, there is limited data on their location. Vernal pools are not protected under any State or Federal program, although some species, such as the state-listed Jefferson salamander, which is a species of special concern, is dependent upon vernal pools for habitat conditions. As discussed in the section on habitat protection, requiring applicants to confer with the DEP when impacts to sensitive habitat areas are proposed and prior to submission of an application to the Commission, can provide some protection for these valuable natural resources. The Commission should endorse a policy of no net loss of vernal pools. While the existence of vernal pools should not necessarily preclude development on a site, focusing the development on an area of the site where it least impacts the vernal pool may serve as a solution to two competing interests. Identifying the location of vernal pools town wide may also help identify important open space parcels to be preserved. Manage Floodplains and Floodways 35
42 Floodplains and floodways are typically low-lying lands adjacent to rivers and subject to periodic flooding. These areas should be managed to prevent water from entering the roadways from adjacent streams and brooks. The Town s Zoning Regulations currently prohibit some development in the floodway or the floodplains but allow for some land uses, which can impact the Town s ability to participate in the National Flood Insurance Program (NFPI). The permitted uses should be further analyzed by the Planning and Zoning Commission, as it carefully considers how best to manage development in these flood-prone areas. Areas within the floodplain should be excluded from the buildable land area and the Flood Plain Regulations amended to limit additional development in areas subject to flooding. Under FEMAs programs, activities that will restrict or increase floodwater flows are specifically prohibited in floodway and flood hazard areas. As with the protection of wetlands, flood hazard areas and floodways are vital elements in stormwater management. Therefore, policies affecting land use activities in these areas are critical to assuring the maintenance of floodplains and floodways for stormwater discharge and protection of public health. These areas are often important pieces to an overall open space network. Action to Protect Water Based Resources: Continue to strengthen and coordinate municipal regulation of flood hazard areas to protect life and property, and natural function of flood management systems. Maintain flood hazard controls that ensure compliance with National Flood Insurance program and Community Rating System. Provide zoning based incentives for on-site stormwater retention and use of grey water for landscaping. Establish a practice of creating a deed restricted no disturbance area to buffer wetlands, watercourses, and sensitive habitat areas as part of any development approval. Sustainability Issues There are development practices that can be encouraged and/or required of developers that make a development more sustainable and decrease the impact on the natural environment when compared to more traditional development techniques. Low Impact Development (LID) strategies use careful site design and decentralized stormwater management to reduce the environmental footprint of new growth. Conventional development strategies treat stormwater as a secondary component of site design, usually managed with pipe-and-pond systems that collect rainwater and discharge it off site. In contrast, Low Impact Development embraces hydrology as an integrating framework for site design, not a secondary consideration. 36


43 Low-impact development techniques can be encouraged, incentivized, or required through zoning ordinance development regulations. Some important low impact development techniques that are cost effective and can be implemented in almost any development from large commercial developments to single-family homes include the following: Vegetated swales filter strips and infiltration trenches are an important Low Impact Development technique used to convey stormwater runoff. These open, shallow channels slow runoff, filter it, and promote infil tration into the ground; as a result, runoff volumes are smaller, peak discharge rates are lower, and runoff is cleaner. This approach contrasts with conventional stormwater strategies that rely on gutters and pipes that increase the velocity of runoff and do nothing for water quality Bioretention areas function as soil and plant-based filtration devices that remove pollutants through a variety of physical, biological, and chemical treatment processes. Studies have found that properly designed and constructed bioretention cells are able to achieve excellent removal of heavy metals. Impervious surface water runoff should be directed directly to permeable landscapes or bioretention areas also know as rain gardens whenever possible. The use of this technique further minimizes the need for traditional inefficient and expensive stormwater structures and minimizes impact on down stream water quality. Permeable pavers offer an alternative to traditional concrete and asphalt surfaces. Most of the 'paving over' in developed areas is due to common roads and parking lots, which play a major role in transporting increased stormwater runoff and contaminant loads to receiving waters. Alternative paving materials can be used to locally infiltrate rainwater and reduce the runoff leaving a site. Use of these materials can also eliminate problems with standing water, provide for groundwater recharge, control erosion of streambeds and riverbanks, facilitate pollutant removal, and provide for a more aesthetically pleasing site. The effective imperviousness of any given project is reduced while land use is maximized. Alternative pavers can even eliminate the requirement for underground storm sewer pipes and conventional stormwater retention / detention systems. The drainage of paved areas and traffic surfaces by means of permeable systems is an important building block within an overall Low Impact Development scheme that seeks to achieve a stormwater management system that closely mimics natural conditions. A way to encourage the use of these materials is to develop a relatively low maximum impervious surface 37
44 limitation on development sites but then offer lot coverage bonuses if permeable surfaces are used on parking and walkway surfaces Open Space 38

45 Open Space in a community, when appropriately coordinated, plays a role in creating community character, shaping development patterns, protecting natural resources and providing recreational opportunities. The perception by most is that Burlington is primarily open space and that is not by accident. Watershed lands of the three water supply utilities, nature preserves owned by the State of Connecticut and land owned by the Nature Conservancy and Burlington Land Trust comprise over 40% of the total acres in Burlington. Other open areas consist of privately owned, vacant and underutilized lands. Together these lands evoke feelings that Burlington is rural and is heavily forested, and it is, however much of this land is not protected from development. Defining Open Space It is noteworthy that there is no set standard for how much open space each community should have and how much it needs. Every community is different in terms of its features, development patterns and local feelings on how much is appropriate. Residents participating in the public outreach process were concerned that land development was changing the character of the community, resulting in a feeling of less openness, and creating pressing need to develop a protection strategy. However, there were also participants who felt there was a sufficient amount of open space in Burlington and the Towns resources should be directed towards other issues. These contrasting perspectives are likely in part related to how individuals define open space. Open space can have number of characteristics including level of protection, access, ownership and intended use. In order to better enable Burlington to have more efficient discussions on open space, effort should be made to develop open space definitions. Once agreed upon definitions are established, more detailed discussions about the role of open space can occur. Open space can be characterized one of two ways. Dedicated or protected open space is land that is protected in perpetuity, with outright ownership by an entity that seeks to preserve it (i.e. Burlington Land Trust) or through deed restrictions, conservation easements or similar instruments where development rights are separated from other land use rights. When these rights are separated they are typically held in favor of a conservation group like the Burlington Land Trust or a State agency or even the local government or a combination of groups. Perceived open space is land that appears to be open or serves as recreational open space, but is unprotected from future development. Managed open space includes: vacant State land (non-dep); Town-owned land; public utility land; privately held outdoor recreation facilities; fallow farms, private woodlands and undeveloped land enrolled in the Public Act 490 (PA 490) tax relief program. One of the best examples in Burlington where it is essential to use appropriate terms in describing open space is water company controlled land in Burlington. There are different classes of land determined primarily by their proximity to an aquifer or public drinking water supply. Class III lands are currently protected by not necessarily in perpetuity. Therefore, it is inappropriate to assume these lands will always be undeveloped. There are other important considerations that should be made as Burlington progresses with open space planning. These include: Access 39
46 Like the natural features that define them, the desired level of access to open space can help determine its appropriate ownership and use. The nature of access may be as varied as the types of land conserved. If land is to be used for active or passive recreation, it must be accessible to the public, have sufficient parking, and be owned by an entity that invites public use. Open space that lacks access to the public at large due to its remote location or natural barriers is inappropriate for recreational purposes. Natural Features Open space comes in many forms, ranging from flat to steep and wet to dry land and everything in between. These natural characteristics help determine the appropriate level of protection, ownership, access, and intended use. For example, steep or wet land is unsuitable for active recreational use and may in fact be so undevelopable that it is self-preserving. This type of open space might function as a wildlife corridor or habitat, a visual buffer between incompatible land uses, or as passive open space for hiking, fishing, or bird watching. With the exception of open space used for passive recreation, it may need no more protection than a conservation easement left in private ownership. On the other hand, dry, flat land is not always appropriate for active recreation. Open Space Inventory Using the characteristics described above, among others, Burlington should undertake an open space inventory that looks at virtually all undeveloped, underdeveloped and protected parcels within Burlington. The inventory would indentify size, ownership, likelihood of access, potential uses, proximity to permanently protected open space parcels and key natural features that define the parcel. An open space inventory provides the foundation to begin effective open space planning and make informed decisions about issues such as increasing habitat, building greenway connections and satisfying recreational needs. An open space map should also be developed to supplement the inventory. The map should be developed to include an underlying database containing information relative to the properties including, ownership data, use, acreage, and links to studies that may have been conducted, such as soils or biodiversity studies. The map can be an influential tool in assisting in the visualization of open space goals by describing the location of open space resources within the community and the physical relationship of open space land to one another. The Conservation Commission has initiated this effort and should continue the endeavor. Actions to protect and acquire Open Space: Open Space Planning Conduct an open space inventory Using the Open Space Inventory as a baseline, Develop an Open Space Plan that outlines long tem objectives, criteria for lands to be acquired, strategies to be used, and funding sources Establish a committee that would be responsible for managing the open space planning proces s The Open Space plan should take into consideration the seven elements of open space defined by Connecticut General Statutes Section b Inventory easements in favor of Town of Burlington and identify easements that may serve as key pieces of land to connect open space parcels Utilize criteria defined in Open Space plan to identify and prioritize protection of lands that embody spirit of defined criteria. Explore suggested open space funding opportunities and ensure these groundwork is completed so that these instruments can be utilized 40
47 Open Space Plans Open space has many environmental, recreational and financial benefits as well as less tangible quality of life benefits. Burlington as a community accepts the value of open space, the community should then organize a plan to help maximize these benefits. Open space planning not only coordinates land protection efforts, but also allows communities to better direct future development patterns by clearly prioritizing areas to be left undeveloped. These proactive public determinations in turn provide guidance and predictability for the development community. When municipalities lack definitive plans that use incentives to direct development to where it is most appropriate and tools to discourage growth where it costs town residents in terms of increased government services and less quantifiable public values such as rural character and wildlife habitat are jeopardized. The open space planning process is often one of the first endeavors undertaken following the completion of a town's comprehensive plan.. The need for an open space plan is clear, as it will provide much needed direction and responsibilities to community that values open space but does not have a unified approach towards acquiring it and protecting it. Criteria for Open Space Acquisition Once open spaces are inventoried, acquisition of properties must be prioritized to make the most of limited resources that are available. Prioritization can be challenging because many of the variables can be subjective. Some prioritizing factors include: the likelihood of development of the land (i.e. is the land self-preserving by virtue of significant natural constraints) and if developable, the level of threat of imminent development; the unique value of the recreational, natural, historic, or scenic resource it would protect (e.g. a critical link in a greenway/trail/wildlife corridor, a critical addition to an existing open space the current use of the land (e.g. actively farmed, a fallow field, a private recreation facility, public utility land, a wooded buffer between incompatible uses, etc.); presence of a Natural Diversity Database (NDDB) site or other fragile/rare natural resource, the potential for damage from nearby development; the fair distribution of open spaces throughout town; the amount of money available locally for acquisition ; and the type of grant funds available (e.g. agricultural preservation, open space, trails). Like the process of identifying appropriate open space, prioritization has many exceptions to the rules. Clearly, self- open space such as a floodplain is not in imminent danger of development and therefore is not generally a high- preserving priority for acquisition, but if it will be needed for a future trail corridor and access is in danger of being blocked by future development, it should be considered for acquisition. Working Towards a Plan 41
48 Setting clear goals, up front, will help set the direction for open space plan work to proceed and can help determine the format of the plan itself by dividing it into topics or themes based on the goals. Goals should be determined based on local citizen input and the realties that may be identified in an open space inventory. For example one of Burlington s greatest opportunities is to create a greenway system and connect open space. This approach corresponds with State of Connecticut efforts towards Greenway Planning. The Connecticut Greenways Council, a part of the Connecticut Department of Environmental Protection is focused on developing greenway networks throughout the State. The greenways approach, which Burlington has rightly embraced, allows greenspace networks to function at a regional level, allowing for greater connection while providing local recreational opportunities, maintaining community character and embracing natural ecological process. Connecting open space with greenways is the most effective way for Burlington to establish an open space system. The total amount of open space is important, but how it is configured and used is likely to be more important in the long term. Efforts to connect tracts of open space can capitalize on linking key open spaces with other areas of town such as the Town Center, schools and other key community facilities. Burlington has been and should continue to pursue a trail system that would link with existing rail lines on the southern and northern border of Burlington. An open space plan not only identifies goals, address practical realties in achieving those goals, develops strategic programming to help achieve goals, but it also assigns clear responsibilities and roles for individuals, community groups and town agencies that ensure efforts remain in conformance with the plan. Plan Components There is no single approach to developing an open space plan. However, defining the process before initiating the plan is essential, this may include identifying leadership roles for ensuring progress, public outreach programs to be utilized, identifying resources that will help fund and inform the process. Relationships should be forged with state agencies and nonprofit organizations such as CT DEP, the Trust for Public Land and the Farmington River Watershed Association. The general components of a plan include: An introduction, this may include: 1. Identification of committee members, contributors, and acknowledgement of professional services used and consultant roles in plan development. 2. Reference to Comprehensive Plan and other town documents that direct the open space planning effort. 3. The local definition of open space: what types of features are considered by the plan? Conservation and passive recreation areas only? Ball fields and downtown parks? Scenic Areas? Farmland? Cemeteries? 4. Benefits of open space to the town- economic implications, social values, environmental functions. Why should the citizens of Town Burlington care? 5. What is the guiding open space vision for the town? List the goals and objectives that come from this vision. Methods The methods section of an open space plan should address: 1. What implementation strategies or town goals identified in the comprehensive plan informed or directed open space plan development, and how were these utilized in plan development? 2. How was public input solicited and utilized in determining open space plan goals and objectives? 3. What professional studies or inventory efforts were completed as a result of the effort? 4. What process was used to distill the various recommendations and findings into a list of actions? 42
49 Inventory and Analysis The inventory and analysis section of an open space plan should include: 1. A description of existing open space resources in town, the functions they serve, and an analysis of unmet management or maintenance needs. 2. A description of ecologically significant resource occurrences in town including an assessment of whether adequate protections are in place locally. 3. An inventory and analysis of other types of features as determined important to the open space vision of your community. These can include: Historical/Cultural resources Scenic resources Parks and active recreational resources Public access to water Farmland Trails While the quantity of open space is important, the quality (i.e. location, configuration and utility) may be more important. Determining a parcels value is not an exact science but is guided by specific principals and considerations that are outlined during the development of an open space plan. Some typical considerations in evaluating open space include: proximity to existing open space; the desirability for active or passive recreation; the presence of an unprotected recreational resource; a location along a wildlife/greenway/trail corridor; the presence of a special wildlife habitat (Natural Diversity database (NDDB) site) or other fragile/rare natural resource; the presence of an historic/scenic resource or scenic views of these resources. Recommendations Recommendations for an open space plan should restate the guiding open space vision for the town as included in the introduction and it should breakdown open space plan recommendations by individual goal as identified in the introduction. Under each goal, the recommendations should include identified public priorities, and a description of what needs to be conserved and how. Addressing the "what and how" will require a close examination of existing tools available locally (town committee roles and responsibilities, land trust roles and responsibilities, and current land use ordinance protections). What resources are currently not adequately protected in your local ordinance? What mechanisms are available that could result in more open space conservation? Approaches to consider may include: 1. Creating a local dedicated fund for open space acquisition 43
50 2. Revising local subdivision ordinances to encourage open space protection of priority open spaces or local focus areas 3. Increasing local protections for wetlands, streams, and rare feature occurrences 4. Encouraging voluntary protections by promoting current use tax programs or offering conservation lease options 5. Implementing a local open space impact fee 6. Appointing the local conservation commission/ or similar group to help manage the process 7. Establishing a local trails committee Implementation Strategy (Action Plan) As is the case with any successful plan, implementation depends on actions being clearly defined and responsibility for those actions being clearly assigned to the most appropriate party. Implementation strategies defined in the plan should also be prioritized and a time frame should be assigned for accomplishing the specific tasks. For each action recommended by the plan, the reader should be able to answer the question: " who is doing what, and by when? " Inventory of Potential Open Space Funding Sources Fee Simple Acquisition/ Outright Land Purchase by the Town. Gift of Land either directly to the local land trust, This option provides potential tax benefits to the grantor. Life Estates, where the Town purchases land with the provision that the owner can continue living on the land until his or her death, after which the Town acquires all rights. This approach is usually less expensive to purchase since it allows continual use of the property by owners and may spread the costs over a period of several years. Purchase and Leaseback, where the Town acquires the property and leases the land back to the owner or another party for a certain type of use or development subject to restrictions. Transfer of land from one government entity to another. Mandatory Dedications of Open Space as part of subdivision approval. Burlington currently requires that a portion of new subdivisions be set aside as open space. Open Space Preservation & Acquisition Methods Fees in Lieu of Open Space Dedication or Impact Fees, Instead of requiring the dedication of open space within particular subdivisions, fees in lieu of land dedication can be required as part of subdivision approval. Fees in Lieu of open space dedication should become part of a special Open Space Acquisition and Protection Account that Burlington can use to purchase priority open space land in other areas of Town. This approach is useful in instances where the land being subdivided has a minimal amount of natural features worth protecting or when the land to be dedicated would not meet the Town s long-term open space objective of a network of interconnected open space areas. Payment of fees in lieu of providing open space should be allowed only as the less preferable alternative to the provision of open space in developments. Condemnation. Condemnation is the legal right of government to take private land for public purpose with just compensation provided to the owner. This approach is only recommended in extreme circumstances. 44
51 Conservation Easements, Under a Conservation Easement, the property owner retains private ownership but conveys the right to enforce the easement s restrictions to a qualified conservation recipient such as the Town or an approved non-profit entity such as the Land Trust. Purchase of Development Rights, The purchase of development rights allows a landowner to retain ownership of the property, but the owner receives a payment for the development rights to that property. The property remains on the tax role but at a lower rate because of the restricted use. As ownership changes, restriction on the land remains with the parcel. To further encourage the dedication of open space, some communities have adopted open space flexibility provisions that offer developers flexibility in lot area, lot width, yard setbacks, lot coverage, or other requirements in return for the dedication of additional open space.* * For example, Colchester adopted regulations where, for each one percent of the parcel preserved as open space above the minimum requirement (15%), the Commission may: increase density by 0.5 percent, increase the maximum lot coverage, reduce the minimum lot size requirement by 1.0 percent, and/or reduce the minimum lot frontage or setbacks. Open Space fund, a separate fund can be created explicitly for the acquisition of open space, This fund can be supported by annual contributions through the Town budget, by a one time infusion of money, through fees from the fee in lie of open space program. Regulatory Strategies for Open Space protection Require special studies as part of development applications when proposed development are within defined State of Connecticut Natural Diversity Database Area Revise zoning and subdivision regulations to allow P&Z Commission to select open space set-aside when land is subdivided. Land chosen will be based on characteristics outlined in open space plan (e.g. home to special species, unique geological features, and soil conditions) As part of subdivision process, require that a trail system be designed within open space to be deeded, and require connections to existing system when possible. Consider requiring conservation style development Modify zoning regulations to require open space set aside (or fee-in-lieu-of) when any subdivision of land is approved Allow for off-site dedication of open space as part of development of proposed land if it contributes to the overall open space plan 45
52 Open Space Acquisition & Management Explore grant opportunities to conduct a wildlife corridor study to determine wildlife movement through town and use results to help prioritize property acquisition Pursue establishment of a working relationship with a land trust and/ or other resource protection agency active in the area or support the creation of a local land trust. Formalize relationship with land trust or other agencies with similar goals to allow pooling of resources Develop working knowledge of various land protection tools and generate literature that may be disseminated to local land owners to educate them about preservation techniques available and potential tax benefits Identify who or which Town department has stewardship responsibilities over deeded open space Develop a GIS database that is a repository for information linked to parcels of land. Inventorying information concerning known wetland areas, steep slopes, special species habitat areas, and watercourses, ensures land use decision and land protection efforts are formed by accurate analysis Make appropriate passive and active recreation areas accessible and available for public use with adequate signage, parking areas, trail maps, and appropriate facilities for their designated use Initiate a public outreach campaign articulating Burlington s greenways plan and educate land owners about the value of conservation easements, and the important role they play in a achieving a greenway Develop and market materials and maps to the public that show the location of the open space, access points for active recreation and interpretive description of the land 46

53 HISTORIC, RECREATIONAL & CULTURAL RESOURCES Plan of Conservation & Development Introduction This chapter highlights Burlington s historic, recreational and cultural resources, describes current protection efforts, and recommends techniques and tools that will help preserve, enhance and support these valued resources. In many ways, historic, recreational and cultural resources are the foundation of a community; they are the roots of a community s character. These features, along with important buildings, unique sites and events, contribute to the quality of life in a variety of ways. The elements also serve as a reminder, of and a link to, the social, economic and architectural past of Burlington while contributing to the civic pride and uniqueness of the community. The recognition and preservation of the historic, recreational and cultural resources in Burlington maintains an important link to the past and helps protect its heritage. The preservation of these historic areas, spaces and structures help maintain important design features that tell the story of Burlington s past and in many ways have become the heart of the community and can be an economic asset. Historic Overview Burlington s historical heritage provides an identity and source of pride for its residents. The original inhabitants of what is Burlington today were members of the Tunxis Tribe of the Algonquin Native Americans. In 1640, John Haynes, the Governor of Connecticut, purchased the land from the Tunxis, who then moved to upstate New York once relations tensed in The land area was known as West Woods and was part of the Town of Farmington, which was incorporated in Key Historic & Cultural Issues A thorough inventory of Historic resources Increase awareness of the Historical Society, Land Trust, and Friend of Session Woods. Increase resources available to the Historical Society Need for School & Community programs that highlight local history Recognition for historic preservation efforts Improve access to historic sites Pursuit of alternative funding sources for historical and cultural programs In 1721, West Woods was divided into large areas, or tiers, but development was sporadic. Then in 1774, a group of settlers grew tired of traveling for worship and petitioned the General Assembly to be incorporated as an independent ecclesiastical society. The request was granted, and the area known as the West Woods of Farmington, was now the Parish of West Britain. In 1785 West Britain and New Cambridge joined together to form Bristol, but in 1806 West Britain separated and became Burlington. 47

54 Growth continued slowly for the area due to inhospitable terrain for development. Original Burlington residents were mostly involved in farming, but over time several small industries could be found taking advantage of the water power from Burlington s numerous brooks and streams. In the 1800s, the prospect of wealth and cheaper land grew to be too much to resist, and Burlington s population was greatly affected by westward migration. Surrounding towns were becoming greatly industrialized, attracting young men and women for work, further contributing to the declining population. In 1851, with the introduction of passenger trains, Burlington became more accessible, and a more attractive place to live. After the Civil War, Burlington became an attraction for European immigrants due to burgeoning industry and the need for labor in the area. Post World War II, Burlington saw a population boom, as many people sought a serene rural setting to raise families. This increase in population brought about many changes that were needed to support the growing population. The 1980s and 1990s marked Burlington s fastest growing time period in terms of population. According to 1996 Census data, Burlington was the fastest growing town in Connecticut. Businesses and services began sprouting up around Town to be able to support the growing population. Into the 21 st century, population growth has slowed since its boom at the end of the 20 th century, but the Town still continues to grow at a steady pace. (Source: Clifford Thomas Alderman - Identification of Historic Resources Various dictionaries define historic as anything having importance in or influence on history. The National Trust for Historic Preservation takes a broader approach, asking not whether a building is historic but whether it is worth saving because of its architectural character. Many buildings in Burlington fit this broader definition, because their destruction and/or replacement with contemporary structures would ultimately alter the character of the Town. Essential to any historic preservation effort is the identification of historic resources. Public outreach centered on historic preservation issues included holding focus groups to identify historic resources, discuss and evaluate the effectiveness of current protection efforts, and consideration of opportunities for promotion and capitalization of existing resources. While outreach is an effective way to identify the historic resources of a community, a formal historic resources inventory is an important step towards a complete historic preservation program. The inventory lays the groundwork for additional protection efforts by identifying a building s particular historical or architectural significance. The inventory thoroughly evaluates all structures and sites that have potential to be listed on the National, State or Local Register of Historic Places. The inventory can also be a catalyst for marketing historic resources and also allows examination of the possibility of establishing a historic district. Finally, an inventory can also help increase public awareness and appreciation of historic structures. A formal inventory sponsored by the Town or Historical Society and completed by a firm that specializes in historic resource inventories is a logical and important step to improve historic preservation. 48
55 If a building is architecturally or historically significant on the national, state or local level, there is a strong likelihood that it will be approved for and ultimately listed on the National Register. The listing of a structure on the National Register has multiple benefits that can help preserve a historic structure. First, a listing on the National Register is an honor that in itself creates public awareness and appreciation for the building. Second, buildings on the Register are afforded protection from adverse impacts from federally funded or regulated projects. Lastly, if a building is on the Register, owners of the structure can receive significant tax advantages for rehabilitating the structure. Burlington has the following four sites identified on the National Register of Historic Places, which can be viewed on Map 1. They are as follows:. 1. Elton Tavern: Located on the George Washington Turnpike, it was listed on the National Register in Hart s Corner Historic District: Located at Monce and Stafford Roads, the district includes 8 buildings. This area was listed on the National Register in John Wiard House: Located on Route 4, it was listed on the National Register in Barton (Treadwell) House: Located on the George Washington Turnpike by the town green was listed on the National Register in

56 50
57 While there are a few historic resources that are formally recognized, many are not. Other historic resources, with no official historic status, likely exist. There are a great number of historic barns, four historic one-room schoolhouses and two historic churches still in existence in Burlington, and viewed by the public as important assets. The historic structure of Hogan s Cider Mill is still standing, and currently serves as a golf school and country store. There are many other notable features in Burlington, such as old foundations from various mills and factories, as well as from historic dams and raceways. There are still remaining foundations from a New Deal WPA program called Camp Nepaug off Stone Road. In the town green there is a large oak tree that has grown from a seedling, given to Burlington from the original Constitutional Oak Tree in Currently, there is no formal procedure to prevent these unregistered historic resources from being lost forever. Even if these important resources do not meet the criteria for a listing on the National or State Register that does not mean that the resources are any less significant. In such cases, protection of these resources will have to take place at the local level. The recommendations portion of this chapter offers a number of strategies to provide education and protection of Burlington s important historic resources. Resources that may not be eligible for nomination on the National or State Register could be part of a local register. Communities can establish a cultural heritage board for example that defines their own criteria for listing important historical resources on a local register. Actions to Identify Historic Resources: Complete and maintain a historic resources inventory Seek funding from the State of Connecticut and other private organizations focused on historic preservation such as Historic New England Consider creating a local registry of historic places Consider establishing a cultural heritage board that can evaluate the merits of individual structures and sites for inclusion on a local registry of historic places based generally on the following criteria: a. It is associated with events that have made a significant contribution to the broad patterns of Burlington s history and cultural heritage; b. It is associated with the lives of persons important in our past; c. It embodies the distinctive characteristics of a type, period, region, or method of construction, or represents the work of an important creative individual, or possesses high artistic values; or d. It has yielded, or may be likely to yield, information important in prehistory or history. 51
58 Increase Local Historic Preservation Efforts Burlington has an active local Historical Society which provides information and education concerning the history of the community, including important people places and events. The Society also manages the Burlington Historical Center, where important historical documents, interpretive displays and the Society s offices are located. The Center building itself is a historic structure, the Elton Tavern. The Historical Society, while active in the community, has no authority over historic structures and has extremely limited financial resources. The Historic Society should seek approval from the Board of Selectman to develop and maintain a local listing for historic structures. Education and awareness are essential preservation techniques. They are efforts that are complementary to regulatory measures. One of the most powerful and useful programs in Connecticut for historic preservation, the Certified Local Government Program (CLGP) allows local government to partner with the National Park Service and the Connecticut Historical Commission to provide the municipality with technical assistance and grants for historic preservation. It ensures the creation of local historic district legislation and historic district commissions that participate in local planning and decision making. Local Historic Districts are one of the most effective regulatory means to protect and preserve historic structures. The establishment of a district allows for regulatory control of new development and redevelopment of structures within the district and ensures all construction activity including aesthetic elements are compatible and consistent with the historical character of the district. A Local Historic District is not to be confused with National Register Districts. A Local district is established and administered by a local Historic District Commission, similar in many respects to a Planning and Zoning Commission, whom is responsible for making formal decisions on proposed activities within the district. Under Connecticut State Statutes any interested group of residents may request the town government to appoint a local historic district study committee to investigate the possibility for a district and prepare a report. The report should include an analysis of the historic and architectural significant properties in the proposed district and the significance of the district as a whole. Once the study committee has completed its report it is submitted to the town Planning and Zoning Commission and the State Historic Preservation Office for review and comment. A public hearing is also scheduled to give interested citizens an opportunity to comment. A Local Historic District (LHD) cannot be established without a referendum among its property owners. Two thirds of the all the property owners within the proposed district must support the designation. Once a Local Historic District is established, the study committee ceases to exist and a new Commission is established to regulate the Local Historic District. The primary function of the LHD Commission is to review any physical alterations to the exterior of a structure, construction of a new structure or demolition of an existing structure that is visible from a public way. Typical work which requires review would be replacement of windows or doors, siding, the erection of additions, decks, garages, fences or outbuildings. When a property owner does propose an alteration, which requires review, the owner submits an application to the Historic District Commission and a hearing is scheduled. The Commission, when reviewing the project, will consider the impact of the proposed change and the appropriateness of the alteration to the character of the district. When the hearing is complete the Commission will render its decision. If the change is found to be appropriate, the Commission will issue a Certificate of Appropriateness. Historic Overlay Zoning is another tool that Burlington uses to protect historic areas and structures. In 1977 Connecticut General Statute 8-2 was amended to allow zoning commissions to consider historic factors when rendering a zoning 52

59 decision. The overlay zoning used in Burlington should be reviewed and revisions to the language that may strengthen historic preservation goals should be considered. It may be more beneficial for Burlington to use zoning regulations for historic preservation than establishing a local historic district/property. A zoning change (overlay) does not require the two-thirds approval of property owners in order to establish it or approval of an ordinance by the municipal legislative body. Another benefit is that the Planning and Zoning Commission can regulate the use of a building, whereas a Local Historic District Commission cannot. The Planning and Zoning Commission can implement a similar control over individual projects through a special permit that a LHD Commission can exercise through a "Certificate of Appropriateness". Using a historic overlay zone may be a good alternative to establishing a local historic district when certain required criteria cannot be met, such as obtaining the required two-thirds property owner vote. Some of the special permit criteria that may be included as part of the Historic Overlay Zoning include completing a study of the historic value of the structure, explanation of how the structure will be incorporated into the proposed project, explanation as to why the structure can not be retained provided by an engineer/ architect specializing in historic structures, and evidence that efforts to relocate the structure were fully explored. Yet another way to protect historic resources is to establish Village Districts. It is an aggressive tool to help municipalities protect and preserve their community character and historic development patterns. The law allows towns to designate village districts as a way of protecting sections of towns that have distinctive character, landscape and historic structures. Within these areas, the town zoning commission may adopt regulations governing such matters as the design and placement of buildings and maintenance of public views. These regulations also "encourage conversion and preservation of existing buildings and sites in a manner that maintains the historic, natural and community character of the district." They provide "that proposed buildings or modifications to existing buildings be harmoniously related their surroundings, to the terrain and to the use, scale and architecture of existing buildings in the vicinity that have a functional or visual relationship to the proposed building or modification." Village districts are discussed further in the Downtown Revitalization Development Scenario. Another alternative to an owner of an historic property that can ensure that the property will be protected in the future is the gift of a preservation easement. A preservation easement is a legal agreement that grants a limited right to a qualified nonprofit organization to protect the property from changes which are not in keeping with its historic, architectural or natural character. The easement allows the owner of an historic property to retain title and use of the property and, at the same time, to ensure its long-term preservation. The owner does not give up title, use or control of the property or the right to sel,l donate or will the property. Easements are usually given in perpetuity, and filed in the land records. The easement runs with the property and is binding on both the owner who grants it as well as on all subsequent owners during its term. The owner retains the major interest in the property and can sell it or will it to whomever he or she wishes. Figure 2: The Old Center School House 53
60 Tax Incentives for Historic Preservation A preservation easement may perform three functions: 1. Limit the kinds of alterations and additions that may be made to the property's historic structures; 2. Require proper maintenance of the structures to preserve their historic character and structural integrity; 3. Control the owner's right to develop the property by prohibiting subdivision of the land or development of open space. The benefits of a preservation easement include knowing that your historic property will be protected for generations to come. Another benefit is that a federal income tax deduction is available to a qualified donor of an easement in the amount equal to the reduction in value of the property resulting from the granting of the easement. In addition, such reductions in market value should reduce estate taxes and local property taxes. A preservation easement can be donated to the qualifying nonprofit organization to preserve a historic structure or historically important land area Other tax incentives or tax credits may be obtained by property owners through the following Connecticut legislation: o o o CT Historic Homes Rehabilitation Tax Credit CT Historic Structures Rehabilitation Tax Credit Program Expanded CT Historic Structures Rehabilitation Tax Credit Program Public Act established a Historic Homes Rehabilitation Tax Credit for the rehabilitation of owner-occupied historic residential buildings containing 1 to 4 units. The General Assembly also established Public Act the Historic Homes Rehabilitation Tax Credit, in This Act allows for tax credit for the rehabilitation of owner-occupied historic residential buildings containing 1to 4 units, and encourages new homeownership and assists existing homeowners to maintain or renovate their property. Public Act Section 82 establishes a tax credit for the conversion of historic commercial and industrial buildings to residential use, including rental or condominium units. Partial tax credits are available for buildings converted to mixed residential and commercial uses. In 2007, a new law was passed by the State, making mixed-use projects also eligible for rehabilitation tax credits. It also allows a higher credit for affordable housing projects in historic buildings, 30 percent instead of 25 percent. Demolition Delay Ordinance One regulatory tool that Burlington can benefit from is a demolition delay ordinance. This ordinance requires as much as a 90-day waiting period before historic buildings can be demolished. While not preventing demolition, the waiting period allows the opportunity to seek alternatives such as purchasing the property, relocating the structure(s), or at a minimum, salvaging architectural components. This tool has been successful in protecting some historic resources. Working collaboratively with other governmental and non-profit organizations to publicize each Demolition Delay Permit may allow for additional assistance in the preservation of threatened historic properties 54
61 Actions to Protect Historic Resources Evaluate the potential benefits of a local historic district & historic overlay zoning Consider Village District Zoning as a tool to help guide Town Center development Assess the potential benefits of joining the Certified Local Government Program Organize and disseminate information on tax credits available to historic property owners Consider implementing a demolition delay ordinance Improve Public Awareness and Education As part of the local registry mentioned earlier, placards should be made available for placement on all structures listed on the National, State and suggested local historic registry. The sale of placards by the Historical Society could be an effective fundraising technique and public awareness venture. An active citizenry and especially property owners who are emotionally invested in maintaining a historic resource are the most effective approach for protecting and preserving historic resources. Regulatory approaches can only go so far in protecting resources, most regulatory tools and listings on various registers can not prevent property owners from neglecting or demolishing a historic structure. Education and stewardship should be encouraged and supported by the Town Council and the Historical Society. Offering seminars on preservation techniques and opportunities and recognizing property owners who improve their historic structures may be an effective way to increase awareness and stimulate support for preservation of historic resources. The Historical Society should develop literature detailing the communities historical resources, conduct walking interpretative tours of important sites and effectively publicize events and programs so that a broader population is exposed to the efforts of the Society and the resources that exist in Burlington. 55
62 Actions to Improve Public Awareness and Education Provide the Burlington Historical Society with resources to support: educational programs provide technical assistance and information about the types of financial assistance available to historic property owners Develop marketing materials and brochures that promote historic sites in Town that may include burial grounds, stone walls, structure foundations and important trees Strengthen volunteer programs that promote the protection, preservation and enhancement of historic structures Restart dialogue with administrators of water Company land to allow access by the public to lands where historic elements, such as clock towers, are located Encourage rehabilitation programs and grants to assist home/ business owners with historic buildings upgrade and maintain their properties with the best standards of historic restoration and rehabilitation Develop a website, or use the Town website, to promote community events, as well as historical, cultural, and recreational resources. Promote historic/cultural programs in the local schools. Specific action items to increase education include the following: o o o o o o Offer seminars on preservation techniques, opportunities and publicly recognizing property owners who improve their historic structures. Publicize events and programs for historic preservation in collaboration with the Burlington Library, the Historical Society, and the Board of Selectman. Place plaques at structures and sites on the National, State and local Registry of Historic Places Create a GIS map and inventory of Historic Places Develop an interpretative map of historic sites and structures to be given out at the library, Town Hall and Historical Society building Sponsor awards given to property owners who improve historic structures. 56
63 COMMUNITY CHARACTER Plan of Conservation & Development Introduction Community character is the distinguishing physical and social quality of a community; these qualities often are intangible, but they help give the community its identity. This character is shaped by natural, cultural, societal, and economic forces over many years. While community character is subjective and may mean something different to each resident of Burlington, ultimately it about the sense of place and how one feels when they are in Burlington. Certain characteristics or features of communities that contribute to their character include: Development patterns, Good design, Historic resources, Scenic resources, Attractive gateways Undeveloped land and Community events. The goal to improve community character is accomplished by enhancing the elements that create the sense of place. In order to sustain and strengthen its sense of place, Burlington should strive to address the key issues identified in the box to the right. Key Community Character Issues Design review standards Protect historic resources Promote reuse of underutilized buildings and sites Improve signage Protect scenic views and ridgelines Organize and promote community events Implement Design Review Good design plays an instrumental role in helping to establish and further community character. Every time a building is constructed it affects the community in a positive or negative way. Burlington is fortunate to have some examples of well designed buildings, primarily in the Town Center, which help set the tone for future buildings. However, more can be achieved. The community would benefit from design review, ensuring that any new building, or rehabilitation of an existing building, exemplifies thoughtful design. Since good design enhances community character, Burlington should explore methods to promote or require quality design in as many areas of the community as possible. The goal of design review is to strengthen the unique character of the community and ensure that new buildings fit within the existing framework. In general, design review has the potential to T OWN OF BURLINGTON 57
64 encourage buildings that have the appropriate human scale, and that minimize the impact of stark, branded architecture that does not reflect the unique character and conditions of Burlington. While the intent of some design standards are oriented towards reinforcing a particular style that is not necessarily the appropriate goal for all communities. Burlington may be better served by developing a design review process that is not prescriptive, requiring buildings to look a certain way or be of a certain style. Instead, building design standards can provide a set of options to ensure that buildings contain functional elements such as a set amount of glazing, articulation or other elements that improve the pedestrian experience. There are a number of ways to encourage or require good design. The community must decide which methods best meet their needs and are appropriate given the dynamics of the community. A design review board is one example. Typically, the Planning and Zoning Commission authorizes the board, an advisory body only, to review proposed developments. The evaluation by the design review board is based on a set of design standards. Another way to require specific design elements is to implement Village District Zoning. The regulatory approach is discussed in more detail in the Town Center Development Scenario chapter. Simply, the district is a type of zoning where, due to the unique character of an area, zoning review can consider aesthetic issues such as the design of buildings and the site. Both of these methods require the development of design recommendations or standards. Given the profound impact that building and site design can have on the character to the community, Burlington will benefit from the development of design standards, particularly as the Town Center continues to develop. Additionally, quality design can give the community something to rally around and can create recognition from outside the community. Recognition by a community organization of good design and the extra effort by property owners can increase public awareness and community pride. Actions to encourage quality building design: Determine areas of the community beyond the Town Center where design review is appropriate Evaluate the cost/benefits of implementing Village District Zoning Evaluate the costs/benefits of establishing a design review board Initiate a process to develop a building design manual that provides visual representations of existing design guidelines Recognize owners who construct/rehab buildings with quality design Protect Historic Resources Historic resources play an instrumental role in the fabric of community character. They represent the history of the community and help make Burlington unique. The protection and promotion of historic resources are key ingredients of the character of Burlington as well as a source of community pride. Strategies to protect and promote historic resources are listed in great specificity in the Historic Resources chapter. 58
65 Reuse of Significant Sites Well recognized sites are an important site for the Town of Burlington for a number of reasons. In the context of community character, many are positioned to be excellent gateways into the community. The former Johnnycake Airport is one example. From the west, the airport is the first site visitors and residents encounter. Older buildings and sites are not often recognized as historic, but many have significantly contributed to the community. While these underutilized sites influence the character of the community, though not always in a positive way, they represent a real opportunity for adaptive reuse. These building have great potential for reuse or redevelopment and for increasing the vitality of the areas surrounding the buildings/site. A focused planning study to determine practical uses for the site is an effective way to begin to transform the site and its buildings. Sites such as the airport are well located relative to nodes of activity and have untapped potential to help meet some of the housing and other needs anticipated in Burlington. For building/ site reuse to be successful and genuinely add to the character of the community, flexibility in permitted uses is essential. Some of the buildings may provide a unique and attractive environment for small-scale business uses, business incubator space, offices, boutiques, art studio/ gallery space or antique markets. These buildings also represent an opportunity to address many of Burlington s housing needs. Some buildings may be suitable for combinations of affordable, luxury, active-adult and/or elderly housing for both rent and sale. Actions to encourage building/ site reuse: Identify location of underutilized/ abandoned buildings/sites and asses their potential for reuse/ redevelopment Initiate conservation with owners of industrial buildings to discuss reuse potential Consider an Adaptive Reuse Overlay Zone to afford flexibility in redevelopment/ uses Consider incentives to foster more interest in redevelopment of distressed or underutilized properties. Town Center Development Improve Signage Signs play a significant part of overall community character and play an equally important role for the business community. Reaching an appropriate balance between signs that exhibit quality design, reflect the character of the community, and fulfill the needs of businesses is important. Burlington should consider ways to improve two different types of signage: well-designed business signs that guide customers to businesses, and wayfinding signage to guide visitors and residents to different areas of community and community attractions. 59

66 Commercial Signs Signs deliver a message beyond the graphics physically on the sign; sign design conveys a message about what type of community Burlington is. Businesses rely on signs to advertise their location and services they provide. However, welldesigned and attractive signs convey a strong positive impression about the quality and characteristics of the community. Quality signs suggest a certain feeling and low quality unattractive signs have the opposite affect. Without limiting creativity, sign guidelines for business owners can assist business owners in the design of their sign. Like design guidelines for buildings, sign guidelines do not need to be prescriptive of a certain style but rather may suggest design objectives and certain features, such as raised lettering and acceptable materials. Providing business owners with design guidelines may help to support the overall community character objectives without limiting creativity. A sense of place and feeling of cohesiveness are qualities that are key to the strength of downtown Burlington. Burlington should consider developing sign regulations specific to the Town Center that help to further a theme and evoke a sense of place. The area where the regulations would apply would need to be geographically defined but could correspond with the Town Center Area defined in the Town Center Chapter. The benefits of downtown specific sign guidelines should: o o o o o o Encourage creative and innovative approaches to signage within an established framework, Promote economic vitality in the downtown, Enhance the visual environment in the Town discouraging signs which contribute to the visual clutter of the streetscape, Ensure that commercial signs are designed for the purpose of identifying a business in an attractive and functional manner, and Ensure signs on the façade of buildings reinforce the existing character and are integrated into the architectural design of the building. Consider a design standard and regulatory scheme for temporary advertising signage in the downtown district. Wayfinding Signage Business owners and residents indicated that guiding customers and residents to business areas, recreational areas and other community facilities is essentail. Clear and uniform signage to direct visitors and customers to business areas and other community features could be improved in Burlington. Wayfinding signage is a systematic series of signs that organizes information to enable visitors to comfortably and successfully access a place. The signs are typically placed at key points of interest and primary intersections. Wayfinding uses consistent images, scripts and overall designs to create a comfortable environment where information is easily readable. Wayfinding signage has the 60
67 added benefit of adding to the visual interest in parts of town, while highlighting the character of the community and strengthening the sense of place at the same time. The signage typically reflects some elements of the community, such as a historical theme or representative image of the community. With unified signage one will know they are in Burlington, and wayfinding will help the public find parking and other points of interest. Actions to improve signage: Develop historic markers for historic assets Develop design standards for commercial signs Ensure consistency between sign regulations specific to the Town Center and design guidelines. Create a unified wayfinding signage program for community facilities and areas of interests Protect Scenic Views & Ridgelines Ridgelines, panoramic views and other scenic resources (stone walls, fences, barns, wetlands, and river corridors) are important cultural assets in Burlington. These natural and manmade features contribute significantly to the character of the community and can strengthen the sense of open space in Burlington. However, there is no comprehensive inventory of scenic resources that exist in Burlington. To protect these resources, the first step must be to inventory them. Burlington should engage in a comprehensive program to identify the location of these important cultural resources. Once the number and location of these resources are identified, additional steps can be taken to protect them. A key element for identifying scenic views is specifically identifying what elements make them scenic (tree line, meandering river corridor, unique stone wall, etc) It can be much more effective to protect particular elements that cumulatively create a scenic view rather then just generally protecting a view. Actions to protect scenic views and ridgelines: Identify and inventory Burlington s scenic views, including ridgelines and other scenic resources Draft zoning text to prevent degradation of scenic views and ridgelines Utilize deed restrictions to prevent disturbance and clearing of ridgelines, hilltops, and scenic views. Protect tree canopies from unreasonable destruction during utility pruning Consider amending land use regulations to include protection of scenic roads, and other scenic resources Preserve or relocate scenic resources such as stone walls, barns, fences, and other scenic resources that are visible from public streets Consider zoning or subdivision text amendments that preserve scenic streetscapes where new development is proposed 61

68 Organize Community Events/ Increase Cultural Awareness Community events can be an effective way to bring residents together and a by-product is that they are then engaged in community building activities, fostering pride in the community. Pride in the community is an often intangible but essential component of strong community character. Community events allow community groups and organizations to showcase their unique activities or mission and provide exposure to what is happening in Burlington. Burlington already helps organize wellrecognized events such as the Carol Sing and Tavern Day. Events such as carnivals, art exhibits and other less formal events are strong opportunities for residents to come together and participate in events together. Increased marketing and promotion of community events will increase awareness of the community s array of cultural resources. Actions to organize community events and increase awareness: Organize volunteer groups to develop, improve and coordinate community events Work with existing community event organizers to improve community involvement and publicity Organize events for community groups to exhibit their mission and activities Streamline the permitting process for groups wishing to organize community events Inventory significant cultural resources and develop a map for public use which include recreational trails Utilize the Town website, to promote community events, as well as historical, cultural, and recreational resources. Cross link the website to existing websites at Land Trust, Historical Society, and Friends of Sessions Woods. Promote historic/cultural programs and the resources at the Farmington River Watershed Association. Tools to Protect and Promote Historic and Cultural Resources The following is a list of grants that are available from the State of Connecticut Commission on Culture and Tourism which can financially supplement some the cultural resource promotion strategies described in this chapter. Survey & Planning Grants Survey & Planning Grants may be used for a wide range of historic preservation planning projects including surveys, nominations to the National and State Registers of Historic Places, pre-development studies, heritage tourism and other planning documents. Grants generally range from $1,000 to $20,
69 Basic Operational Support Grants These grants are made to enhance and strengthen local historic preservation leadership by providing operating funds to local historic preservation groups. BOS grants allow historic preservation non-profit groups to survey historic resources provide public education and plan for historic preservation in their communities. The award range is $5,000 to $75,000 Historic Restoration Fund Grants Historic Restoration Fund (HRF) Grants may be used for the restoration, rehabilitation or purchase of historic buildings, structures, and objects as well as the investigation of archaeological sites. Properties must be listed on the State Register of Historic Places and owned by non-profit organizations or municipalities. Culture & Tourism Partnership Grants Partnership Grants encourage innovative partnerships between cultural and tourism entities. Partnership Grants support projects that engage partners outside the applicant's discipline or traditional program area. Successful projects combine history, arts, heritage, humanities, film and/or tourism activities. The program can encourage partnerships, expand the scope of current programming, jump-start creative programs or attract new audiences/participants/visitors. 63
70 PLAN OF CONSERVATION AND DEVELOPMENT Development Themes T OWN OF BURLINGTON 64

71 HOUSING Plan of Conservation & Development Introduction Residents are the backbone of a community and housing is one of the most important life style considerations for people. The type, condition, layout and cost of housing contribute to the quality of life within a community. These housing characteristics impact where individuals decide to live. Therefore, housing opportunity ultimately controls who the residents of a community are. Section 8-23 of the Connecticut General Statutes establishes the requirements for the housing portion of a POCD: Such plan shall make provision for the development of housing opportunities, including opportunities for multi-family dwellings, consistent with soil types, terrain, and infrastructure capacity, for all residents and the planning region in which the municipality is located. Such plan shall also promote housing choice and economic diversity in housing, including housing for both low and moderate-income households. Key Housing Issues in Burlington: Burlington lacks a complete supply of housing for a spectrum of ages and income levels Housing choice with different density levels and layouts is in short supply Housing is affordable relative to other communities, and the median income of the area. Housing can be developed using sustainable principles minimizing impacts on the natural environment. This section of the Burlington Plan of Conservation and Development (POCD) examines the existing housing conditions in Burlington, focusing attention to the types of housing available and identification of housing types that are not available, affordability of housing, and future housing needs and opportunities. Assessing the status of Burlington s current housing stock will offer insight into the Town s future housing needs and help devise actions to address long-term housing needs. 65
72 Housing Inventory Characteristics Burlington has a range of housing choices. The mix or distribution of housing type is a significant determinant of housing opportunity within a community. Varied housing needs of citizens require different housing choices. No one housing type is appropriate for all people, similarly housing needs for an individual or family changes over time. In 2005 the Connecticut Economic Table 1: Housing Tenure Types (2005) Percent of Housing Units Single Family Duplex Triplex and Quadplex 5 or more Units Mobile Homes Other Burlington 94.80% 1.20% 6.90% 1.70% 1.00% 0.00% Avon 82.20% 2.30% 6.90% 8.10% 0.00% 0.10% Bristol 82.60% 2.30% 1.30% 8.10% 0.00% 0.10% Canton 79.50% 5.70% 4.90% 9.80% 0.00% 0.00% Farmington 73.50% 4.70% 8.40% 13.30% 0.10% 0.00% Harwinton 96.10% 1.40% 0.90% 0.60% 1.00% 0.00% New Hartford 88.40% 2.40% 3.30% 5.10% 0.00% 0.80% Plymouth 75.30% 7.90% 7.30% 8.00% 1.50% 0.00% Region 55.00% State 59.00% Source: CERC 2005 Resource Council (CERC) identified 3,192 housing units in Burlington. This data also indicates that in Burlington, 95% of the housing units are one-family detached style units. Only 5% of the units are multi-family units, including three group homes for the blind. As shown in Table 1: Housing Tenure Types, of the eight communities surrounding Burlington, only one, Harwinton, has a higher percentage of single-family detached housing. While the other 7 communities have greater percentages of multi-family housing, they all fall much lower then the state and regional averages. Together the ownership and housing type figures indicate a lack of housing diversity in Burlington. According to the 2000 US Census the housing occupancy rate is very high, at 97.9%, and is the highest among the towns immediately surrounding Burlington. According to this data only 5% of all occupied housing units are rented units, and 95% are owner occupied as shown in Table 2. Burlington s housing stock does not provide a balanced Table 2: Own, Rent, Occupancy and Vacancy Rates (2000) Percent of Housing Units Renter Owner Occupied Occupied Occupied Vacant Burlington 94.90% 5.10% 97.90% 2.10% Avon 85.90% 14.10% 95.60% 4.40% Bristol 61.90% 38.10% 95.30% 4.70% Canton 80.60% 19.40% 97.20% 2.80% Farmington 75.30% 24.70% 96.40% 3.60% Harwinton 93.10% 6.90% 96.80% 3.20% New Hartford 86.40% 13.60% 94.10% 5.90% Plymouth 78.50% 21.50% 95.80% 4.20% Source: 2000 US Census mixed of rental and owner occupied units. Other Towns surrounding Burlington, most notably Bristol and Farmington, have higher rates of renter occupied units, suggesting greater housing diversity. Housing diversity in terms of housing style is limited in Burlington, but not uncharacteristic given the rural nature of the community. Single-family 66
73 homes dominate, yet that does not mean that demand for alternative housing styles does not exist. Multi-family housing can bring some diversity to the housing stock and will be better suited to meet the needs of some existing residents and or those individuals looking to move to Burlington. Housing units, such as apartments and condominiums may play an important role in the development of the Town Center. Housing Growth and Age Burlington s housing stock has grown dramatically in the last forty years and continues to grow. The Town s housing stock has increased by 255.5% from ; with 816 units in 1960 and 2,901 units in Year Table 3: Housing Construction Authorizations in Burlington 2000 to 2005 Total One Two Demolitions Net Units Unit Units Gain Three & Four Units Five & More Units Net Gain State Rank Total N.A. Source: Annual Construction Reports - Connecticut Department of Economic & Community Development Table 4: Total Annual Housing Permits for Burlington & Adjoining Towns Year Total Burlington Avon Bristol Canton Farmington Harwinton New Hartford Plymouth Source: Total Permits by Town CT. Dept. of Economic & Community Dev. 67
74 The Connecticut Department of Economic and Community Development (DECD) reported that between 2000 and 2007 there were a total of 362 housing construction authorizations in Burlington. As shown in Table 3, Housing Construction Authorizations in Burlington , the vast majority of housing growth continues to be for single family dwellings, totaling 338 (93%) of all housing permits issued since With the issuance of permits for the construction of 35 new units, Burlington ranked 98 out of Connecticut s 169 towns in terms of total new units in It is worth noting that the number of new housing permits cannot simply be added to the Census records to obtain the exact number of housing units. Each year existing housing units are demolished. However, Burlington has averaged approximately only 1 permit per year since 2000 to demolish existing housing units. This data indicates a steadily growing residential population. Table 5: Burlington Age of Housing Units Burlington s rate of housing growth is not the highest in the immediate area. Compared to the seven surrounding towns, Burlington s total number of annual housing permits for the years 2000 to 2005 falls in the middle, as shown in Table 4: Total Annual Housing Permits for Burlington & Adjoining Towns. However, these unit numbers are cumulative; when placed within the context of the existing housing base, Burlington is in the top three towns in the region with a 12.5% increase. Only the Towns of Canton and New Hartford have a greater percentage increase, at 15.9% and 12.7% respectively. One indicator of housing condition in a community is the age of the existing housing stock. Burlington s housing stock is relatively new. More than 40% (1,260) of the housing stock dates from the two last decades of the 20 th Century, as shown in Table 5: Burlington Age of Housing Units. The median year of construction is In contrast, Hartford County and the State of Connecticut have an older housing stock, with the median construction year of Less than 20% (539 units) of the housing stock is more than fifty years old based on 2000 data Time Number Percent Period Built 1999 to % March to % to % to % to % to % to % & % Earlier Total 2, % Source: 2000 US Census Affordability of Housing Affordability is a function of cost and income. The Federal Government defines affordable as housing costs that do not exceed 30% of a family s income. Now more than ever, the affordably of housing is a primary concern. Section 8-23g of the Connecticut General statutes requires that a municipality shall consider the need for affordable housing in the preparation of a plan of conservation and development. Housing affordability is a complex issue, influenced by a number of factors. While most factors that influence the cost of housing are outside the control of a local municipality, municipalities regulatory practices and land use policies do have some influence. In addition, while a community is limited in their ability to control the cost of housing they can be actively involved in creating affordable housing units. 68
75 The quantity and characteristics of housing demand occur on a larger than local level and are rooted in the area s economic conditions including income levels, job growth, employment sectors and job security. The region that Burlington is a part of is increasingly more connected as people work and purchase good and services in areas outside their own municipality. As regional connections grow, the housing market is less responsive to the control of local municipalities. The cost of housing is most significantly based on the following: the demand for housing relative to the supply available at the same point in time the location of housing as a function of time and distance relative to the source of demand the availability and cost of buildable land labor and materials cost, the age the quality and supply of the existing inventory costs such as mortgage interest rates, utilities and taxes Local land use polices such as minimum lot size requirements, open space set aside requirements, and infrastructure standards do play a limited role in the ultimate cost of housing, but have less influence than regional demand factors. Direct efforts to encourage the construction of affordable housing are the most effective way to provide for affordable housing. Public and non-profit collaborations among local, state and federal and non-profit organization have established a variety of housing programs to reduce housing costs. Most of these programs employ a form of a financial subsidy to defray the cost if the units are being produced, renovated or occupied. These programs do work and do provide affordable units, but they do not address underlying economic factors that affect housing cost. However, according to the Home Connecticut Program, a campaign run by the Partnership for Strong Communities, the gap between what families make and the median sales price of a home continues to be significant in most of Connecticut s towns and cities. Data provided by Home Connecticut shows that the median house price in Connecticut rose by 69.7% from 2000 to 2007 while personal income rose by 33.7% over that same period of time. This continued disparity is largely the result of the enormous increases in median sales prices from 2000 to 2005 and the effects continue to be felt by many households seeking a safe and affordable place to live. As a result, even a dramatic decline in home sales prices in 2008 will be unlikely to make housing more affordable for many Connecticut households, especially if obtaining a mortgage becomes more difficult due to tightening credit standards. According to Home Connecticut, Connecticut residents will also find Table 6: Total Rooms in Housing Units (2000) little relief in the rental market. The Room housing wage the hourly wage required to afford a two-bedroom Total Number apartment at fair market rent in Connecticut remained high at Percent 1% 7% 13% 20% 25% 18% 17% $21.11 in 2007, making it difficult for renters. In addition, the Source: 2000 US Census median sales price for a single family home in Connecticut continued to remain high throughout the year with a statewide increase of 1.45% over Median household income also remained high in Connecticut in 2007, posting a statewide gain of 6.4% over the previous year. 69
76 Housing Affordability and Size Size is another factor related to the housing character and the community affordability. Size can be measured by room and bedroom totals. Burlington homes are slightly larger than those in Hartford County and the State of Connecticut. Burlington s median room number was 6.9, larger the Hartford County median of 5.6 and the State median of 5.5 in year As shown in Table 6: Total Rooms in Housing Units (2000), dwellings with six to eight rooms account for the vast majority ( 63%) of housing units. The small percentage of 3 and 4 room housing units indicates a lack of housing opportunities for singles, empty-nesters and low-income families. Table 7: Number of Bedrooms Per Dwelling Bedroom Total Number , Percent 3% 10% 58% 25% 4% Source: 2000 US Census Bedrooms are the second parameter of housing size. In Burlington (58%) of the housing units have three bedroom and (25%) are four bedroom dwellings as shown in Table 7. Once again, the small percentage of 1 and 2 bedroom units indicates limited housing opportunities for singles, empty-nesters and low-income families. Housing Affordability in Burlington A study completed in 2007 by the Home Connecticut Program analyzed the affordability of homes in Connecticut based on the median sales price of single family homes and the median income of residents in the state s 169 towns. The goal of the project was to determine whether, in a given town, a home at median sales price for that town was affordable to a household earning the town s statistical median income. Table 8: Median Value Comparison of Owner Occupied Housing by Town, County & State Levels (2000) Geographic Area Value in Dollars Town of $198,400 Burlington City of Bristol $123,700 Town of Avon $241,400 Town of Canton $175,900 Town of Farmington $184,800 Town of Harwinton $163,300 Town of New $176,000 Hartford Town of Plymouth $122,500 Hartford County $142,500 Litchfield County $155,900 State of Connecticut $160,600 Source: 2000 US Census Burlington ranked 159 th in terms of affordability out of Connecticut s 169 towns. Simply, Burlington was more affordable than 158 of Connecticut s towns and less affordable than 10 towns. Median income in Burlington in 2006 was $95,701 while the median home sales price was $307,000 according to Home Connecticut statistics. The qualifying income to afford a home of that value, with a 10% down payment is $ 93,270 a positive gap of about $2,431. Given these statistics Burlington is relatively affordable., implementation of housing policy changes to ensure the stock of affordable housing based on changing income levels may be appropriate. The demand for housing drives market prices within a regional housing context and management in this market is largely out of the control of the local municipality. The Census Bureau and the Warren Group have comparable median sales price for year 2000 single-family homes: 70
77 $198,400 and $215,000 respectively. According to the Warren Group, from 2000 to 2008, the median price of a single family dwelling increased 51% to $323,750 as shown in Table 9: Number and Sale Prices in Burlington. According to these real estate market statistics, single-family sales in Burlington over the past 20 years averaged 135 units per year. Both the number of homes sold and median sales price in Burlington have generally have increased over the past 20 years, as shown in Table 9. The comparable statistics for condominium sales are not as compelling due to the very small sample; however condominium sales have had major fluctuations over the past Table 9: Median Sales Price of Single Family Homes and Condos and Number of Sales Year Months Single Family Median Sales Price Single Family Number of Sales Condo Median Sales Price Condo Number of Sales 2008 Jan - Mar 323, , Jan - Dec 350, , Jan - Dec 326, , Jan - Dec 311, , Jan - Dec 305, , Jan - Dec 270, , Jan - Dec 254, Jan - Dec 219, , Jan - Dec 215, , Jan - Dec 206, , Jan - Dec 173, Jan - Dec 180, , Jan - Dec 177, Jan - Dec 173, , Jan - Dec 166, , Jan - Dec 168, , Jan - Dec 181, Jan - Dec 170, Jan - Dec 200, Jan - Dec 232, Jan - Dec 184, Source: The Warren Group two decades. While sales prices increased dramatically, from $68,250 to $308,000 (351%) from , they have seen drastic decreases in the past two years (-68%). 71
.")
78 Actions to Increase Housing Opportunity: Encourage alternative housing options for mature families ( empty-nesters ) and senior citizens who no longer desire single-family housing, but who wish to remain in the Town, (e.g., in-law apartments, congregate housing, life-care facilities). Allow for second story housing above retail into foster the success of a village-style, pedestrian friendly Town Center. Develop an infill strategy for residential development in areas best suited for increased density Evaluate minimum floor area requirements and consider whether they should be reduced or eliminated. Reevaluate the regulation of accessory apartments to provide more specific guidelines. Develop an inclusionary zoning policy that requires a certain percentage of housing developments include units that will be price restricted to 80%, 60% and 40% of area median income. Apply for Connecticut s Incentive Housing Zones grant. Develop policy and coordinate with organizations that provide housing of special needs individuals. Encourage housing options such as group homes, emergency shelters, transitional housing and require that government-funded or subsidized housing developments be held to the same design standards as privately developed housing. Subdivision Design Open Space Conservation (OSC) subdivisions are a means of protecting significant amounts of open space that can also help preserve Burlington s rural community character and conserve the Town s natural resources. By reformulating the approach to conventional subdivision design, OSC strategically concentrate home construction on the development site in order to protect sensitive and valuable open space, habitat, and other environmental resources. Using this tool, developers can design subdivisions that maximize open space protection without reducing the number of homes to be built. This is achieved by locating the structures on half (or less) of the property with the remainder permanently protected through conservation easements. It is important to note there is no reduction in the total number of homes, they are carefully situated to protect land and water resources, in direct contrast to the simple cookie cutter subdivision layout. Locating homes to protect open space addresses a need A great resource that explains conservation subdivisions and provides detailed guidance on developing conservation subdivision regulations available on-line: The Conservation Subdivision Design Project: Booklet for Developing a Local Bylaw is available from MAPC. that people have expressed in attitudinal surveys. Real estate market researchers have found that people want to live in small towns providing a 72

79 sense of community, as opposed to cookie-cutter developments offering nothing more than house lots and streets. OSC subdivisions are designed to function as a municipal land use management tool that will enable the conservation and protection of a site s important features, including natural resources, historical and archaeological resources, scenic vistas, and community character, among other things. OSC subdivisions enable a property to be developed for single family detached housing at the same gross density as is permitted under existing zoning. Under this approach to managing residential development, each new subdivision application is viewed as an opportunity to create a significant amount of protected open space. OSC subdivisions enable the preservation of at least five (5) times as much open space as conventional subdivisions, at no cost to the Town. The amount of land that can be preserved through the application of OSC subdivisions can be an important part of an overall subdivision plan. discharged into a community leaching field(s). One potential limitation of conservation subdivision is the need for wastewater treatment that results from clustering homes. Individual septic tanks will not work in most cases community sewerage system is one possible solution, where sewage from individual homes is piped to a community septic tank(s) and Under this development scenario, a portion of the protected open space is set-aside to accommodate an engineered community septic system that includes septic tanks and leaching fields that have been designed and engineered to meet the needs of the OSC subdivision and reviewed and approved by the Connecticut Department of Environmental Protection s Water Management Division. Action to improve subdivision design: Consider requiring land to be subdivided and/or clustered to be designed in the conservation subdivision manner. Access information on alternative wastewater treatment techniques from CT DEP Consider requiring basing residential density of greenfield development upon limitations and opportunities afforded by topographic, soil, and watershed protection characteristics in some of the residential zones 73
80 ADVANTAGES OF CONSERVATION SUBDIVISIONS Compared with conventional layouts, conservation subdivisions offer the following advantages: Economic advantages For the municipality: Open space enhances the municipality s quality of life, one of its chief assets in attracting quality businesses and in encouraging economic growth. Municipal service provision is cheaper when homes are not widely scattered. Open space dedications may provide public parkland, reducing public land acquisition costs For the developer: Site plan review is smoother when development plans conform to local planning objectives. Development costs are reduced as utility lines, streets, driveways and sidewalks are shorter. Conservation subdivisions have marketing and sales advantages, as buyers prefer lots close to or facing protected open space. Homes in conservation subdivisions tend to appreciate faster than counterparts in conventional developments. Where zoning permits, a variety of housing types, ranging from single family detached to attached units, may be more easily accommodated. Environmental Advantages For water quality: Common open space can be designated as buffers to protect wetlands, streams and ponds. Water quality is enhanced when impervious surfaces such as streets, driveways and pipes are minimized. Where appropriate, stormwater and sewage treatment facilities can be located within the open space. For wildlife: Common open space, if properly sited and managed can provide wildlife habitat with the three basic requirements of shelter, food and water. When linked to other existing open areas, the common open spaces can serve as wildlife corridors and unfragmented wildlife preserves. Common open space can be used to protect unique or fragile habitat as identified by local, regional or state natural resource surveys. Social and Recreational Advantages Common open space provides attractive areas for neighbors to meet informally and socialize. Common open space may be designated for recreational uses such as biking, walking or ball playing all of which promote social interaction. Smaller yards to tend can provide residents with more leisure time. Adapted from UCONN Cooperative Extension, NEMO Fact Sheet # 9 74
81 Special Needs Housing Housing for the elderly and special needs citizens is a critical concern for most communities. As the population of the Town ages, as indicated by demographic data, it is important that the community provide alternative living arrangements from standard single- family detached and multi-family living situations. This gives the elderly population an often desired opportunity to remain in the community that they have spent a major portion of their life. The community has some responsibility to help these long term residents from being driven from the community because of escalating housing costs. The housing type needed by the elderly varies significantly as do the supporting services they may require. The Town has limited age related and special needs housing options. There are no nursing or convalescent homes in Burlington; these can be found in the neighboring towns of Avon, Bristol, Farmington and Plymouth. There are two older resident complexes in Burlington. One is the Town sponsored elderly, income restricted housing complex, known as The Evergreens on Thompson s Way. The other is a private, eleven unit active adult housing development on Johnnycake Mountain Road. There also are three group homes for people with disabilities, all operated by the Connecticut Institute for the Blind. Although these are not all found in Burlington, various types of elderly housing facilities include: Age restricted communities (Retirement Communities) are housing developments with either detached or attached units that must meet specific criteria defined by local zoning regulations. If the age restricted project meets certain requirements of the U.S. Code and Code of Federal Regulations, the age restriction may be reduced to 55 years or older. Burlington zoning criteria establish parameters that allow the devolvement to allow residents age 55 or older. These communities are designed for individuals who are in reasonably good health and can live completely independently. These communities can be rented or owned. The type of services and amenities they provide vary, but most include some recreational and leisure activities to help attract a particular segment of the market. There are two age restricted developments in Burlington currently. The first development is on Forshaw Avenue and has 14 units and the second is of off Bradley Street, with 23 units. Assisted living facilities are managed residential communities that provide support services to the residents of the community. In these developments, residents typically live in an apartment style unit and pay monthly fees for services. Assisted living facilities, governed by Connecticut Statutes must provide services that include laundry, transportation and housekeeping services, meals, recreational activities and maintenance. Assistance with daily activities, nursing services, assistance with routine domestic tasks and medication supervision are to be provided as needed. Also required is a resident services coordinator as well as emergency call services in each unit, 24 hour security and on-call nursing services. This type of facility is intended to assist residents while maintaining a maximum level of independence. Government Assisted Independent Living Facility provides independent living opportunities for senior citizens whose physical mobility and health enable them to live independently with no or minimal assistance and younger persons with disabilities. This is a rental housing complex with age and income restrictions and residents can receive some form of government assistance. 75
82 Congregate Living Facilities provides residents with private living arrangements, moderate support services and common areas for dining, socialization and other activities. This type of facility is meant for individuals who are basically self-sufficient but need a few services to help them to live independently. Nursing Homes can be long or short term care facilities with nursing supervision. Typically these facilities provide residents with nursing care, meals, recreational activities, help with daily living tasks, and protective supervision. Residents often have mental impairments that prevent them from living independently. The levels vary from chronic to convalescent facilities to rest homes with nursing supervision. Continuing Care Retirement Community (CCRC) can be described as life-care communities, providing living accommodations from the stage of total independence to long-term health and nursing services as their needs change. A CCRC uses a contractual agreement to assure lifetime living accommodations and requires the payment of an entrance fee and monthly fees. Residential Care Homes are similar to nursing homes but are suited for residents who are no longer able to live independently but do not require the level of medical care offered in a nursing home, rest home or convalescent environments. These Homes generally provide a communal living environment. Connecticut State law requires that Residential Care Homes provide three meals a day, housekeeping and laundry services, recreational activities, and 24 hour supervision. Other Care Facilities Group Homes provide an environment that fosters the maximization of individual outcomes in areas of education, vocation, employability, independent living skills, health, mental health, community connections and permanent connections. These homes typically provide care to adolescents and have a working relationship with the Connecticut Department of Child Services. Sustainability and Efficiency Opportunity Sustainability and efficiency are important over arching themes woven throughout this Plan. Housing design and construction methods certainly exist that will improve the relative efficiently of the housing design and its impact on the environment when compared to traditional design and construction methods. Housing design from a locational perspective can exhibit improved sustainability by considering important natural features that can be avoided, such as those discussed in the conservation subdivision section above as well as in the natural resource section. The construction materials used to build homes represent significant opportunity to achieve high energy efficiency levels and employ sustainable construction materials. 76
83 Actions to improve the sustainability of housing development: Provide information of the Town Website concerning sustainable home construction and encourage developers to build energy efficient housing units. Create a point system focusing on energy efficiency, housing variety, and open space preservation that developments would have to meet; alternatively allow developments to achieve LEED for Homes certification in-lieu of this requirement. Develop guidelines that promote infill residential development in a manner consistent with the scale and character of surrounding neighborhoods Promote historic preservation and housing stock variety by preserving and adapting historic buildings for residential uses.. 77
84 Economic Development Plan of Conservation & Developmen Introduction The economic health of most communities largely depends upon their ability to attract, grow, and retain business and industry. Among the factors that typically influence the location of business and industry are housing and transportation costs, the availability of a suitable labor force, land prices, taxes and local quality of life (e.g., the quality of a community s schools and the availability of cultural and recreational resources). Economics in the Regional Context Burlington s location is fairly isolated, the right location for those seeking a rural lifestyle or for enterprises requiring a pristine environment. At the same time, the isolated location and vital environmental role place constraints on the pursuit of business development. While some within the community view the lack of infrastructure (extensive sewer and public water service) as a positive characteristic, other view this fact as a signification limitation to economic development. Regardless of one s perspective, the limited public sewer and water impacts economic development opportunities. Burlington is linked to Hartford and Litchfield Counties and located midway between the two important economic centers of Greater New York and Greater Boston. The primary connection is to Hartford County, where the majority of the Town s residents are employed. Burlington is part of the Hartford Labor Market, the largest of Connecticut s ten labor markets. This market is comprised of 52 towns and cities that extend from Thomaston on the western edge to Ashford on the eastern edge, to Haddam on southern most point, and to the Massachusetts border on the north. Burlington is adjacent to the labor market areas of Waterbury and Torrington. Key Economic Development Issues Develop business retention program Provide tax incentives Identify appropriate business mix Encourage Green buildings and site development Develop Business Incubator Space/ Home Business Regulations Concentrate Business development around unique Burlington opportunities Transportation linkages play an important part in fostering a regional economy and the associated regional workforce. The principal means of access to and from Burlington are State highways. The primary access-roadway is Route 4, and access is also provided by Routes 69, 179, 6, 72 and 44. Route 8, in neighboring Harwinton, provides access west to New York State, and north to western Massachusetts. Route 8 is also crucial in providing connections to the Connecticut coast via I-95 (Connecticut Turnpike) and Route 15 (Merritt Parkway) and to eastern/west points via Interstate 84. Numbers Employed 78
85 According to 2007 data from the Connecticut Department of Labor, Burlington has a labor force of 5,328 people in the overall pool of 555,100 for the Hartford Labor Market (neither number seasonally adjusted). Overall, Burlington constitutes slightly less than 1% of the Hartford Labor Market. Burlington s labor force has had a positive trend, experiencing a lower average rate of unemployment than has the Hartford Labor Market, the State of Connecticut and the nation. The time period covered is ten years, from 1997 to Resident Employment As shown in Figure 2, according to the 2000 US Census the vast majority of Burlington s labor force works in the private, for-profit sector, (71.7%), which is comparable to the State employment rates, as are all the other sectors. Census data on the 5,328 people who work within Burlington, but are not necessarily residents, indicates that over 38% are employed either in management (687, 15.1%), Sales & Related (555, 12.2%) and Office and Administrative Support at (504, 11.1%). Management shows the greatest contrast with the State average, representing 15.1% of Burlington s occupations and 10.2% for the State. Data on the resident labor force the approximately 4,500 Burlington residents age 16 and older who are employed in their town of residence or elsewhere - indicates that the two highest industry categories are manufacturing (716, 15.8%) and health care & social assistance (713, 15.7%) respectively. Approximately 519 of Burlington s residents work in Burlington, a rate of 11.7% of all resident employees. The remaining 88.3% of Burlington s working population commute outside of Town. Burlington residents commute to all eight counties in Connecticut and beyond: Hartford County has the largest portion of Burlington s commuter population at 81.7%. Together, Hartford, Litchfield and New Haven Counties constitute 94.1% of the work destinations for those living in Burlington. Figure 1: Burlington Commuter Residents County of Employment County Percent Hartford County 81.70% Litchfield County 7.50% New Haven County 4.90% Total 94.10% Source: 2000 U.S Census People travel to work in Burlington as well. Knowing where people come from provides an understanding of the geographic pull and scope of employment opportunities in Burlington s economy. A total of 847 people commute into Burlington to work. At 53.6%, Hartford County is the largest place of origin for those coming to work in Burlington. The second largest group comes from Litchfield County (28.5%). New Haven County is third largest at 5.2%. People also come from Tolland, Middlesex, Windham, New London and Fairfield but the total number is low (55). An analysis shows that most of the commutation to and from Burlington to work occurs within a close distance. Of the 27 towns within 10 mile radius of Burlington s border, 24 are either a destination or an origin for people who live or work in Burlington. The employment base provides employment to less than a third of the 4,454 people in Burlington who are 16 years of age and older who can seek employment. 79
86 Burlington s employment base and the draw of the Town s economy is relatively small. The overall employment base is approximately 1,366, which combines the 519 who live and work in Burlington and the 847 who travel to Burlington for their employment 9.0% 5.0% 0.8% 6.6% 6.8% 71.8% Private (For Profit) Private (Non-Profit) Self-Employed State Government Local Government Federal Government Figure 2: Burlington Employment by Sector 7.3% 4.4% 1.6% 6.5% 8.1% 72.0% Private (For Profit) Private (Non-Profit) Self-Employed State Government Local Government Federal Government Figure 3: Connecticut Employment by Sector 80
87 Business retention and development is vital to the strength of Burlington s economy for a number of reasons. Burlington s tax base is dominated by residential properties. The retention and expansion of the commercial tax base is essential to achieving a more balanced tax base. However, practical limitations such as location and availability of infrastructure must be acknowledged as business development plans are drafted. Non- traditional businesses, unique opportunities and the growth of the Town Center may be key to Burlington s economic development success. Local businesses provide goods and services to the local community and frequently provide the support to community groups and local causes. Local businesses rely on the continued support form the community if they are to continue to provide service to local residents. Similarly, support for local businesses will ensure the stability and growth of these businesses and potentially create additional local employment opportunities for Burlington residents. If Burlington is to maintain its economic and spatial integrity, it must promote well-balanced development that buffers the Town s residents and tax base from the unpredictability of economic cycles. Burlington s economic development goal is to establish a business and service mix that meets the needs of the community and maintains a sustainable revenue stream for the community. In order to achieve this goal Burlington should focus on the following economic development issues. Evaluate the Need for a Development Services Specialist Within the chapter on Town Center Development it is recommended that Burlington consider hiring an individual who can dedicate their time and resources to Town Center development issues. The intent of this section is to point out that a need for planning, economic development; focused marketing services are warranted throughout the community in addition to the Town Center. Hiring an individual who has particular expertise in municipal economic development, land use planning and design, as well marketing skills, has the potential to significantly benefit the community. This person will be the leader of the planning process and economic development activities with the skills to take advantage of programs and funding opportunities. To be clear, only one position is being recommended. The Town Center Development section identifies a need for a leader to guide Town Center development, if such a position is developed, the skills required should be carefully identified so that the chosen individual can serve both roles and coordinate the overlap that exists between both functions. In addition to the functions listed under the Town Center leadership position, a development services staff person can provide great benefit to the community. While reviewing development applications for consistency with the zoning regulations and the Plan of Conservation of Development, this individual can serve a multitude of other important functions that improve the planning process and increase communication between the development/ business community, other Town Departments, State agencies and the public. A Development Specialist, working with all the town boards and committees, would increase communication between the Boards and assist the Boards in implementing the Town s POCD, the forthcoming open space plan and Town Center Plans. The development services specialist would meet with developers and guide them through the permitting process, and woul seek out potential businesses to move to town. The development review process would be streamlined, input from appropriate Town Departments would be coordinated, and citizens could be more intimately involved in the planning and development process. Perhaps most importantly, a development services staff person could dedicate time to proactively looking into planning and economic development issues such as pursuing grant applications, revising/improving regulatory language, and establish relationship with other municipal planners to increase the exchange of professional knowledge and solutions to issues that exist in many Connecticut communities. Equally important from an economic development perspective is the ability for the Town to market its strengths in general and particular sites to prospective businesses. A strategic marketing program based on the specific objective of a business retention program, discussed below, would be an additional key responsibility of a development services specialist. T OWN OF BURLINGTON 81
88 Development Services Specialist Consider the benefits a Development Services Specialist could provide to the planning, economic development and marketing endeavors Develop a Business Retention Program Towns can make efficient and effective use of their resources by focusing on retaining existing businesses rather than focusing exclusively on attracting new businesses. Often the best chance of creating new jobs for a community comes from existing businesses. Processional business development firms report that approximately 80% of any jobs created result from the growth of existing businesses. Existing business are also great indicators of the business climate of the community and have valuable insight into the hurdles of doing business in the community. As this plan is being written, the Burlington Economic Development Commission (EDC) continues to work diligently to develop and implement ideas that directly support local business and create an environment that attracts appropriate businesses to the community. The general goals of a business retention program should focus on: Removing local and statewide obstacles that prevent existing firms from remaining in operation, Reducing the cost of doing business, Improving business competitiveness, Increasing markets for business and Enhancing business infrastructure. Outreach from the Town, such as the business survey and genuine interest in finding solutions to problems that affect business in Burlington, is an important tool to show the business community that the Town has their interests in mind. Strong businesses, working relationships between the business community and Town leaders, and a Town known for finding solutions to business community problems is one of the best marketing tools for attracting new businesses. Business retention in the Town Center is a high priority; however, other businesses throughout the community play a role in the overall local economy and should be equally supported. The success of a business retention program lies in its implementation. If a business retention program is crafted by local individuals, such as the EDC, or by an independent consultant, thought must be given to whom or how the program would be implemented and carried out. The Development Services Specialist, described above would be a logical representative to serve that role 82
89 Actions to Develop a Business Retention Program: Formally adopt a business retention program with identifiable and achievable actions Complete a business survey that identifies current business owners most significant impediments to business expansion Prioritize solutions to business and industry issues Appoint specific individual as the point of contact within Town government for business community Strengthen communication between business owners, the EDC and Town leaders to cooperatively address issues facing business owners Support the establishment of a venue for business owners to exchange ideas and provide each other with solutions to business issues. Tax Incentive Opportunities Attracting businesses is an extremely competitive environment, particularly in Connecticut, given communities reliance on property tax to fund operating budgets. Attracting new businesses that are needed to create a balanced business mix, and attracting businesses that complement the community characteristics such as available workforce, infrastructure, and that operate under green principals is important. Incentive polices are often needed to attract these businesses Burlington should develop an incentive policy to support the types of business the community seeks to recruit. Incentives should be focused and directly help Burlington target the types of business that would complement the community. Incentive should not be offered to companies that would locate in Burlington anyway. Tax incentives can also be used to assist existing businesses. Tax abatement, for example, can be offered to businesses willing to reinvest or renovate their existing facility in Burlington. Also, any incentive program should include a pay back provision to ensure that tax incentives are properly used. A key element to tax incentive use, however, is using them judiciously. These incentives should be offered to businesses that fit into the community and are likely to be committed to the community on a long-term basis. Incentives should not be offered to businesses that choose a location based on the best tax deal they can obtain. In order to ensure tax credits are used efficiently, particular goals and criteria should be developed. First, goals that define generally how the tax credits should be used, such as identifying the types of businesses to be attracted, should be established. Goals may be tied to the results of the appropriate business mix study described on the following page. Secondly, criteria that could be used to evaluate whether or not a particular business qualifies for a tax credit should be formalized. Some examples of such criteria include: Is the proposed establishment locally or regionally owned (not including locally owned national franchises) or is at least one third of the building square footage reserved for locally or regionally owned businesses? Is there a significant capital investment in the project resulting in new growth tax value to the Town Are there off-site mitigation or public improvements provided by the project that add significant cost to the total project investment? 83
90 What is the local investment and circulation of dollars in the local/regional economy? Is the proposal a potential catalyst for future economic development? Will local contractors be used for construction and repair? Burlington has spent considerable time developing potential changes to commercial zoning districts and the permitted uses and actives within the proposed zoning districts. The purpose of developing these potential zones (described on the following pages) was to first acknowledge that changes in demographic and appropriateness of certain land uses have changed in parts of Burlington, and second to suggest revisions to commercial zoning districts so that permitted uses are appropriate given the location and character of surrounding uses. The use of tax incentives is one method that may be used to attract the types of businesses best suited for the revised commercial zoning districts. Actions to provide tax incentives: Create an incentive program targeting desired types of new businesses and assisting existing businesses Establish well defined criteria to evaluate the appropriateness of grant tax incentives to particular business Develop a spectrum of tax incentives that complement varied business needs Dovetail tax incentives with identified community needs and objectives of revised zoning commercial zoning districts Identify Appropriate Business Mix A proactive approach to attracting new business and targeting specific business types must be based on local characteristics. The identification process is typically achieved by completing a targeted industry study This type of analysis is typically undertaken by communities that wish to learn more about the local economy and add focus to local economic development efforts. Specifically, these analyses provide the community with information about the local industry groups (or clusters) that are the foundation of the local economy. Local industry groups that are thriving and growing faster than would be seen typically, based on job creation and other measures, are identified as competitively advantaged. Once the study is completed, more focused economic development efforts that build upon existing industries, by attracting companies that would complement them and aid in the development of similar new companies within an economic region, could be pursued. 84
91 Using the results of the study, Burlington should ensure that areas indentified in the study are zoned not only to encourage desired types of business, but to minimize the likelihood that the land is used to serve another purpose. Burlington has several suitable locations for business development, including the underutilized former airport site and parcels within the Town Center. Part of the appropriate business mix may consist of identifying non-traditional business development opportunities. More traditional businesses such as retail outlets, warehousing, and services industries require certain population thresholds and particular demographic characteristics. However, there are other industries that may not be as reliant on these characteristics. Niche industries, recreation for example, should be fully evaluated. Burlington is rife with recreational opportunities. An entire business segment developed around recreation and Burlington s character should be considered. Those types of business would not be as heavily reliant on the demographics within Burlington, as they could draw from surrounding communities as people come to Burlington to participate in recreational activities. The support of the Town, and particularly the government officials, would be essential to an effort such as this. The town would have to be an active participant, furthering the idea that Burlington is ripe with recreational opportunities and will need to actively market Burlington as a Town that welcomes visitors to enjoy all recreational opportunities that Burlington offers. Actions to identify appropriate business mix: Conduct a targeted industry study Refine zoning regulations and map to encourage businesses that are indentified in the study Explore opportunities to develop niche industries Revise Commercial Zoning to Match Community Character and Community Needs Existing commercial and industrial zoning districts should be reviewed to assess the boundaries and permitted uses of the districts for consistency with contemporary conditions. Industrial activities today vary significantly from historical industrial activity. Likewise, the characteristics of particular parts of Burlington have changed over time. The Burlington Economic Development Commission has been working diligently to assess existing commercial districts and suggest revisions to commercial zoning districts so that permitted uses are appropriate given the location and character of surrounding uses. In general, the goal of the Commission, as it relates to this particular task, is to create new zoning districts as appropriate, consider revisions to the definitions and purpose of the Central Business Zone, and to create industrial zoning districts while potentially eliminating the existing Neighborhood Business Zone. 85
92 The following list is a combination of proposed and existing zoning districts and the intent of the zoning district as formulated by the Economic Development Commission. Lake Garda Business Zone Intent: To allow measured, appropriate commercial and mixed-use development with particular sensitivities to neighbors, traffic and property values. The Lake Garda area includes an elementary school, fire house, restaurant, as well as certain utilities. Development should not include 'big box' national retail stores nor businesses of a similar nature. River Neighborhood Business District Intent: To encourage commercial development consistent with the recreational nature of the Farmington River and associated trail. Such development could include specialty retail aimed at outdoor activities or the antique industry, as well as restaurant-type development aimed at users of the river and trail. Whigville Neighborhood Business District Intent: To allow development on properties currently zoned Neighborhood Business within the Whigville section of Burlington that would be agricultural in nature including retail of nursery products and produce. Development should be consistent with the historic, rural character of the Whigville area, with particular sensitivities to neighbors and traffic limitations. Central Business Zone Intent: To encourage mixed-use and commercial development consistent with the character and historic feel of Burlington Town Center. Aspects should include specialty retail, service-based development, pedestrian linkages throughout the CBZ, appropriate lighting and be cohesive in nature. CBZ is considered to be from Hank's Garage to Joni's daycare including commercial properties on Covey Rd. Underutilized Sites (i.e Former Airport ) Intent: To reserve for future commercial uses including office space, mixed-use development, or hospitality type uses. For other properties zoned industrial that are not within the areas described above, including those along the Bristol/ Burlington Town line, the definition of what is considered industrial should be reviewed and adapted to reflect the modern characteristics of industrial businesses. However, these areas should remain industrially zoned and permissive of industrial activity. Encourage Green Buildings and Site Development Development that is environmentally and socially responsible is seen as high priority among community members. Contemporary methods to building construction, site preparation and design and land use planning allow for green development without significant additional cost. In fact, some energy saving and site preparation methods can save on both up front and long terms cost for businesses 86
93 A primary component of green development is where a building is located. Siting considerations include access to multiple modes of transportation, proximity to existing nodes of development, and access to existing infrastructure. In addition to siting considerations, low impact development and energy efficient design can be considered. Zoning regulations can be revised to provide incentives for the use of low impact site design and energy efficient building design. The approach to sustainable/ green business development in Burlington includes: encouraging development in existing nodes of activity, encouraging low impact development and energy efficient building design, encouraging existing businesses to operate in an environmentally friendly manner, and minimizing short and long-term environmental impact s caused by new development. Support development in existing nodes of activity Traditional commercial centers of the Town, such as the Town Center, are focal points of interaction and business activity. New businesses that locate in these existing nodes can take advantage of an existing potential customer base, increase the variety of goods and services offered, and potentially add to the vitality of the area and further sustainable development patterns. More importantly, some of these areas have limited infrastructure in place (water in the town center) and are logical locations if infrastructure (sidewalks, water and sewer service) were to be expanded. There is the potential of significant monetary savings in using existing infrastructure, when compared to providing new infrastructure and infill development that supports efficient development patterns. Environmentally friendly business operation Businesses that have adopted environmentally responsible business practices are realizing its benefits. In addition to long term cost savings, for many companies being green is good for public relations. Consumers are increasingly deciding in favor of environmentally-friendly companies and products when making partnering and purchasing decisions. Developing recognition programs for businesses that have incorporated low impact site development strategies and green building design, or improved their environmental friendliness of their business practices, shows that responsible decisions are recognized, and that the community appreciates their business decisions. Also, recognizing businesses for their decisions, and providing a forum for these businesses to explain the benefits they have realized, is a way to encourage other business to do the same. Actions to encourage environmentally responsible businesses: Create programs to encourage existing businesses to improve environmental responsibility Formally recognize businesses that utilize green/ low impact development techniques Develop an inventory of low impact land use techniques that could be included within the zoning regulations Develop an inventory of green building techniques and sustainable business practices and make information available to the business community 87
94 Develop Incubator Space/Support Home-Based Business Regulations While small business assistance programs have existed for quite some time, business incubators represent an effort to provide an encouraging environment as well as shared services to start-up companies. Understanding that small businesses are a significant factor in job creation, economic diversity and tax base expansion, economic programs that would support and nurture entrepreneurs and their start-up companies and can play a vital role in Burlington s economic development plans. Most incubator space makes use of an existing building (few are newly built) which has been renovated to accommodate multiple tenants as well as varying types of industry. In general, the incubator provides shared services such as telephone services, access to a fax machine and copier, the use of a conference room or library, and the on-site management consulting/business assistance of the incubator manager. Additionally, the incubator manager can serve as a liaison to contacts within the local community to assist tenants with networking for financing or technology. These tenants are often offered below-market rent and flexible lease arrangements, including the opportunity to expand within the incubator. The Town can play an active role in developing and managing the incubator space or could serve a supporting role, providing assistance to a private investor who would develop and manage the space. Furthermore there is a strong opportunity to couple office incubator space with the Community Center Concept discussed in the Community Facilities chapter. Typically, when communities consider expansion of existing businesses or development of new businesses, they think in terms of the traditional business those that operate from a store front or in a commercial location. An often-overlooked idea is to help the local entrepreneurs who want to start or expand their home-based business. A person considering a home-based business needs to gather a variety of information about starting a business. He or she will need valid information about the product/service chosen, about marketing opportunities, the economic environment, existing trends, and about the competition. The Community can assist with many of these important considerations. Local government officials and community leaders can help home-based businesses start or expand in a number of ways. Communities that express support for new business formation through public resolution and policy statements can encourage people to begin new businesses. Of particular importance to prospective home-based businesses are local zoning regulations that govern their operation. Zoning regulations can either help or hinder home-based business start-ups. Zoning codes that allow home-based businesses in residential areas mean there is one less barrier for potential entrepreneurs to overcome in starting a business. The character and quality of life in residential neighborhoods should not be compromised in exchange for home-based business operations. Burlington should consider reviewing their home based business regulations to ensure that the types of home-based businesses are permitted are still appropriate, and the operational standards in place to protect the health, safety and welfare of residential communities are effective. 88
95 Actions Steps to Develop Incubator Space and Support Homes Based Businesses: Consider the role the town will play in the development of incubator space Evaluate the type of technology, building layout, and business requirements to meet start-up business needs Consider the opportunity of aligning office and business service incubator space with the development of Community Center Concept discussed in Community Facilities chapter Develop a campaign to market incubator space Review and maintain clear regulations on what type of home-based businesses are permitted, under what circumstances and the process for receiving town approval to conduct the business Encourage the Chamber of Commerce to support home based business and the role they play in the overall economy of Burlington 89
96 TOWN CENTER DEVELOPMENT Plan of Conservation & Development Introduction One of the greatest opportunities that exist in Burlington may also be its greatest challenge. Burlington has a unique opportunity, given that the Town Center, the focal point of the community, is not fully developed, and therefore available land exists to create a traditional New England village town center. There is a significant opportunity to enhance economic development and community character by creating a town center that is built using sustainable practices and low impact development techniques. The challenge is to create consensus among the community, handle the limitations created by a lack of infrastructure, and getting the varied properties owners to work cooperatively to achieve a unified vision. The enhancement of Burlington s Town Center has received much attention in the last decade. The Center was the subject of the Planning & Zoning Commission s 1997 Plan of Conservation & Development. The Economic Development Commission has actively sought to facilitate the development of the Center by sponsoring studies, surveys and plans. The two Commissions have also worked together to further the development with the adoption by the Planning & Zoning Commission of a development moratorium for the Town center in 2003, as requested by the Economic Development Commission, to develop regulations to foster the creation of a village setting. Furthermore, the Town has sought expertise from outside organizations for ways to enhance Town center development. The outside expertise has come from varied sources, including both public and private sector planning firms and organization. Key Town Center Development Issues Defining the Town center Leadership Providing Housing and a Mix of Uses Design Standards/ Village Development Patterns Pedestrian Orientation Land Use Regulation/ Design Control Alternatives The results of these studies and the excitement they generated should not be lost. The community should capitalize on the strongest components of each to formulate a unified vision. The framework for a traditional village center that functions as the physical and social focal point of the community exists. The effort that is required now is to bring various land owners together, achieve buy-in from community, and provide real solutions to practical limitations. The appearance of the Town / Village Town center is one of the ways a community presents itself to the world and should be the pride of the community. A thriving town center can be an economic engine and also can strengthen less tangible but equally important community characteristics. T OWN OF BURLINGTON 90
97 Continuing efforts to support the development of the town center is sustained by the following factors: 1. The results of the public outreach completed as part of the Plan of Conservation and Development identified overwhelming interest and support from the community towards revitalizing the town center. 2. The development of the Town center represent real economic development opportunity and a chance to exhibit the character and identity of the community with a true focal point 3. The community has already invested significant time and financial resources in diagnosing issues affecting town center, developing design solutions and implementing streetscape improvements. Defining the Town Center As the discussion of town center development continues, defining exactly where its physical boundaries are is paramount. Before more formal plans for the Town Center can take place property owners, residents and town officials must be clear on the area they are discussing. The exact size and shape of the defined town center must be collaboratively decided upon by the citizens and the local government, but grounded in practical considerations based on the size of the community and principals of village development. The map below, developed by CCRPA, was utilized for surveying the Town center. The dimensions defined by Burlington residents as appropriate for village development is considerably smaller than the area indicated on the map on the following page. Information garnered from the public during the outreach process was generally consistent and most saw a village town center developing around Library Lane, Burlington Commons, the town green, the Tavern and other properties adjacent to George Washington Turnpike. The more focused area is identified by the red line on the town center map on the following page. It is intended to be an approximation of the area appropriate for pedestrian-oriented Town Center development. 91

98 92
99 Leadership Successful town center development depends on more than well thought out goals and strategies to. Any development effort is built around people. Individuals, organized groups, government officials and the development community must share the following responsibilities: o o o o o o o o Committed leadership Broad based participation A shared vision of the future Realistic goals and plan of action Effective communication Management of implementation Recognition of efforts Use of outside resources Creating partnerships working towards the same objectives is essential for the Town Center. One of the most important but also difficult aspects of any development effort is to create the organizational framework that brings together various interest groups and individuals. Each group comes to the table with its own agenda and sphere of interest. Without coordination, these efforts may not be supportive of each other, and in some cases may be at odds. Arguably the most important element of implementing Town Center plans is organization. Having an individual or small team that serves as a primary contact person and a guide for the process, bridging similar but disparate interest is paramount. Burlington should identify an individual to spearhead Town Center development efforts; this individual may also fulfill more general planning and economic development responsibilities. The individual does not have to be a municipal employee, but that is one option. The key is to ensure this individual has the time and ability to dedicate to Burlington Town Center issues and to provide outreach and communication with the community at large. That step would be a clear indication that Burlington is committed to bringing various groups together to create umbrella organization and further the redevelopment of Burlington Town Center. The appointment of a Town Center manager has been instrumental in guiding changes in other town centers across Connecticut. This individual should have strong organizational skills, be a consensus builder, show a commitment to fund-raising and be able to delegate responsibilities. Motivational skills are an important attribute, and the program leader must have genuine excitement and commitment to the project. A Town Center manger can lead the following efforts: Implementing business recruitment and retention efforts Coordinating communication programs and efforts Coordinating special events promoting Town Center Mediating difficult issues diving the Town, residents and business owners Supervising maintenance and beautification projects Coordinating town center marketing and promotion efforts 93
100 Housing/ Mix of Uses An economically healthy, vibrant Town Center has a high-quality, pedestrian friendly environment as well as a diverse mix of uses and activities. With those elements, a sense of place can develop organically. The key to establishing these features in Town Center Burlington is people. People must live, work and visit the Town Center for it to be successful. A local residential population is necessary for a dynamic, economically-strong Town Center. A substantial residential base near and in the Town Center has a positive effect on the retail climate and quality of life. A densely inhabited Town Center creates an exciting place to live, and promotes a positive pedestrian atmosphere. In turn, Center residents enjoy the convenient availability of community services, retail goods, cultural activities, and nearby employment. Transfer of Development Rights A great opportunity exists to create high quality well designed housing in the Center that appeals to a spectrum of citizens at all income levels. The highest demand for Town Center housing comes from young singles, couples without children, empty nesters and retirees, and a range of nontraditional families. The need for well-appointed market rate housing is equal to the need for work-force housing and equal to the need for affordable housing and establishing a true mix of town center residents. To get a mixed use development Town Center that includes a residential component, Burlington will need to attract visionary developers who see opportunity, but who also expect a reasonable return on their investment. The Town must first determine the number of housing units necessary to achieve a critical mass to support the desired retail and service establishment town center. The density allowed in the Center may have to be considerably higher than what the community is accustomed to achieve the village feel. Zoning incentives such as density bonuses or transfer of development rights, as well as waivers or reductions of certain zoning requirements, should be considered as a means to achieve desired densities that support a vibrant town center. Additionally, regulations that support a mix of uses within each development should be considered. TDR regulation is a zoning strategy designed to direct development from one site to another in order to preserve a publicly valued resource. While most TDR programs pertain to the preservation of farmland or natural resources, the method can be used to preserve open space and redirect development to more appropriate locations The basic TDR premise is that the excess development rights that would otherwise encourage the destruction or redevelopment of the resource at the sending site constitute a marketable commodity that can be sold to a receiving site that places a value on additional development density. Within this regulatory framework the public benefits derived by the preservation of the resource work in concert with private goals of greater return on investment generated by increased development opportunity at the receiving site. Some specific incentives/requirements that could be used to foster appropriate Town Center development include: Ensuring the housing that is part of any proposal appeals to a variety of income levels. Allowing Increased floor area ratio for providing work-force housing that serves a range of income levels Allowing increased density in exchange for preserving green space elsewhere in the community Expedited planning review for providing a range of uses and including specific architectural elements 94
101 Land Use/ Site Design Regulation in the Town Center Since overall configuration and design is so important to creating a pedestrian- friendly area, Burlington should consider reviewing and evaluating regulatory options the will foster appropriate village development in the Center. Currently, Burlington utilizes the Central Business Overlay Zone to guide development within the Town Center. The purpose of the overlay is to enhance the character, landscape and architectural quality within the Center. The overlay district requires consideration of planning and design issues such as the placement of buildings in relation to other buildings, maintenance of public views, streetscape materials, and more pedestrian infrastructure. Supporting the overlay district are design guidelines that provide building placement, building articulation and façade design direction. The guidelines provide structure for those proposing development but are not regulatory or prescriptive, unlike zoning requirements. An advisory evaluates whether or not an application embraces the objectives of the design guidelines and makes recommendations to the Planning and Zoning Commission Village District Zoning could allow Burlington to accomplish many of the design and physical improvements associated with town centers, strengthen the cohesiveness of the Center and therefore support the sense of place. Unlike the existing design guidelines, a Village district is regulatory and not advisory. The Village Districts Act, passed by the Connecticut General Assembly in 1998, is an aggressive tool to help municipalities protect and preserve their community character and historic development patterns. The law allows towns to designate village districts as a way of protecting sections of towns that have distinctive character, landscape and historic structures. Within these areas, the town zoning commission may adopt regulations governing such matters as the design and placement of buildings and maintenance of public views. Under a village district zoning designation specific regulations are drafted that require: o o o o Proposed building and building modifications are harmonious with their surroundings and to the use scale, and architecture of nearby related buildings; Spaces and structures visible from the road are designed to enhance the visual amenities in the area around the proposed building or modification The characteristics of residential or community property are evaluated for compatibility with the local architecture motif, and the maintenance of views, historic structures, and landscaping; and The disruption to historic and other significant structures are minimized. Individual development proposals must be designed to be compatible with other uses in the immediate neighborhood. They must meet various objectives, which include: o o o o Reinforcing existing building and streetscape patterns; Complementing existing patters of landscape design; Supporting a uniform architectural theme through such features as exterior signs, lighting, and accessory structures; and Reinforcing the scale, proportions, and architectural features of existing buildings. Village District Zoning could provide Burlington the statutory framework needed to strive for the development patterns, designs and organization of public and private space respecting existing character and the history of the Town Center. The 95
102 requirements for Village District Zoning can be much more rigorous that an overlay district. Both regulatory alternatives will reinforce the importance of how the Town center develops and Burlington s commitment to create a vibrant Center. Ultimately the success of the Town Center will be based on the fulfillment of the following elements: A mix of complementary land uses Adjacent residential neighborhoods Visually interesting buildings and streetscapes Architecturally significant buildings Appropriate intensity of development Recognition of the historical significance of the area/ green Safe Pedestrian environment Sense of cohesiveness/ arrival into the Town Center Parking management The existing regulations should continue to be applied, as they have fostered the type of development the Town seeks within the Center. Opportunities to Guide Development in the Town Center: Accurately define the geographic boundaries of the Town Center so they are consistent with development objectives Considering creating a Town staff position that would spearhead Town Center Planning, Economic Development, and Business Community Relationship Issues Ensure developments within the Town Center have a mix of uses that support traditional village development Review overlay zone design guidelines for opportunities to further articulate the type of designs the will appropriate for Burlington Town Center 96

103 COMMUNITY FACILITIES Plan of Conservation & Developmen Introduction Burlington has a wide array of publicly owned community facilities that contribute significantly to the community s character and quality of life. The services provided by the Town as well as the municipal infrastructure are one of the primary functions of town government. The availability of services, condition of buildings and quality of service and capacity for change affect Burlington s land use patterns, density of development and quality of life in the community in general. The Plan of Conservation and Development and this chapter of the POCD specifically provide an opportunity to review the entire array of municipal community facilities that are provided, identify needs and opportunities and establish priorities. Community facilities in Burlington include general government buildings, the educational system, public safety services, social services, recreational space and programs, public works, and utilities. As a community, Burlington owns a number of buildings and recreational lands including three parks and the Town Hall. Key Community Facilities Issues Need to expand senior center and its programs Continue to maintain school facilities in a state of good repair Need to provide additional recreational facilities Need to expand Library Continue to pursue community center concept in center of Burlington Need to address Fire Department & Emergency Medical staffing needs Community facilities must be adequate to meet the needs of the community, maintained and managed to extend their utility, provide the most efficient service possible and designed to adapt to changing needs. Community facilities must be continually evaluated to ensure they set an example of what Burlington strives to be, and are efficiently run and maintained to provide the highest level of services in a sustainable manner. The overall goal of community facilities is to ensure that they meet or exceed the needs of the community to provide the community with facilities and services that meet the needs of the community but in the most efficient and sustainable way while being prepared to meet changing needs. General Government The Town of Burlington, which was incorporated in May of 1806, is governed by a Board of Selectmen which operates under a Town Meeting form of government, and is assisted in carrying out its budgetary and planning functions by an elected Board of Finance, an elected Planning and Zoning Commission an elected Zoning Board of Appeals and an elected Board of Assessment Appeals. In addition, the town has established the following appointed commissions and boards to oversee, 97

104 or advise the Board of Selectmen: a Conservation Commission, an Ethics Commission, a Board of Assessment Appeals, a Zoning Board of Appeals, an Economic Development Commission, an Inland Wetlands Commission, a Library Board a Commission on Senior Citizens Services, a Parks and Recreation Commission, a Building Code Board of Appeals, and a Water Pollution Control Authority. Regional School District #10 and the Bristol-Burlington Health District which operate under their own elected governing boards, also serve the citizens of the Town of Burlington. Finally, the Town is served by the following sub-state regional governments: Bristol Resource Recovery Facility Operating and Tunxis Recycling Operating Committees Capital Workforce Partners Workforce Investment Board Central Connecticut Regional Planning Agency King s Mark Resource Conservation and Development District Northcentral Soil and Water Conservation District Northwestern Connecticut Tourism District Upper Connecticut River Water Utility Coordinating Committee. Each of these agencies has its own elected, or appointed, governing board, and resources for funding projects, programs, events, and activities which have an impact upon the citizens of the Town of Burlington. In addition to the local government organizations that serve the citizens of Burlington, other organizations, such as the Burlington Historical Society, the Chamber of Commerce, and others, contributes to the general welfare of the Burlington community. Community services such as public safety, health, and recreation are basic but important indicators of the quality of life of a community. The map (Figure 1) on the following page indicates the locations of the Town s current principal public facilities. The Burlington Town Hall located at 200 Spielman Highway houses many governmental functions and services, including: 98

105 99
106 Engineering Comptroller Finance Judge of Probate First Selectman Parks and Recreation Police Public Works Department Social Services/Senior Center Tax Collector Town Clerk Town Historian Assessor Building Department Public Works The Town s Public Works Department is responsible for maintaining all town roads, which includes street sweeping and snow removal, and all other municipal facilities. Public Works vehicles which include 10 large trucks and five pick-ups are housed in the Town Garage. The Department also utilizes a pavement management system to help in managing road repair. The Director of Public Works indicated obtaining funds to maintain roads is the biggest issue for the department. The department is in need of a new excavator or a rubber tire back-hoe, and a new pavement management system to replace the current one. Social Services The First Selectman s office provides a number of social services to the residents of the town. They administer the Burlington Food Bank program which includes a Food Pantry where residents can donate non-perishable food items which are collected in the auditorium. The Food Pantry also accepts monetary donations from residents and local clubs. The First Selectman s office also administers a Fuel Assistance program in association with the Bristol Community Organization along with funds from the Food Bank. The office received a grant from the Main Street Foundation which contributes to the Fuel Assistance program, and allows children with no insurance to receive dental care. The New Start Program allows the town to assist residents in need with electric bills. The Burlington Lion s Club uses some of their funds to help needy residents with eye exams and eyeglasses. The First Selectman s office also helps with public assistance on an individual level. Any resident may call and the office will use all resources available to make sure that the resident s needs are met. Finally, the Senior Citizens Center, which consists of two converted classrooms, is located within Town Hall. Programs provided for seniors include health and foot clinics, a monthly book club at the Burlington Public Library, and limited social 100
107 and exercise programs. Transportation is also provided to seniors aged 60 and over or persons with special needs by a dial-a-ride demand responsive program. The Director of the Senior Citizens Center has indicated that they are unable to attract, provide for, or serve the needs of a younger Senior Citizen population because of the nature of the facility, which can only accommodate 35 persons, and has limited staff. The Center currently has a small grant to upgrade an appliance and add a dishwasher with hot water to the kitchen area. However, there are no additional monies allocated to meet the long term needs of the growing Senior Citizen population or expand existing programs. In the past grants have been pursued from the State of Connecticut to offset the cost of the Dial-A-Ride Program and to perform the current upgrades to the facility. While future grants will be pursued, there is limited staff to lead grant applications and monitor grants. The Senior Center should be expanded to not only meet the needs of the current elderly population but also to expand programs that are of interest to the diverse Senior Citizen population. Strategies to address Senior Center space and program needs: Actions to Address Senior Center space needs o Develop space and equipment needs capitol plan for 10 year horizon o Increase fundraising and grant solicitation campaign to secure funds for space and equipment needs o Continue to push for a Community Center that will incorporate dedicated space for senior programs. Actions to Address Senior Center program needs o Evaluate senior program needs to determine the type and amount of space and staff needs to provide these service and programs o Continually evaluate the type of services desired by the senior population o Continue fundraising efforts to increase programming capabilities o Develop documentation that evidences need for additional staff o Develop Capitol Plan to asses and articulate additional space and staffing needs over the next 10 years 101

108 Public Schools Burlington is part of Regional School District #10, which includes the towns of Burlington and Harwinton. The school district was established in 1961 and currently operates four schools including: Lewis S. Mills High School, 26 Lyon Road, Burlington Har-Bur Middle School, 26 Lyon Road, Burlington Harwinton Consolidated School, 115 Litchfield Road, Harwinton Lake Guarda School, 64 Monce Road, Burlington There are no private schools in Burlington, but students from the town have been enrolled in private schools in neighboring towns. Students from middle school who are not attending high school in Burlington need to notify the school district. Regional School District #10 enrollment over the past five years by school are shown on Table 1. Table 1 Enrollment by School for the Past 5 School Years Year Total HCS LGS HB LSM Source: Regional School District #10 Although the total enrollments have been increasing every year and are projected to continue to increase slightly (see Table 2) until before they drop, Regional School District #10 has indicated that the current facilities will be able to meet future needs. 102

109 Table 2- Region 10 Enrollment Projected by Grade to 2017 Year Pre-K K Total The District operates various special needs programs including programs such as guidance groups/developmental guidance, homework club, nicotine cessation, and wellness. Some of these programs are mandated by the State, others are additional offerings by the district. Similarly, programs to address peer matters such as obesity, identity issues, and mental health issues are also offered by the District to its students. The District also conducts student outreach programs which include programs for dealing with substance use, nutrition policy, DARE, and United Way s Kids in the Middle, among various other activities. In addition to school related programs, District school facilities - such as the gym, auditorium, and playgrounds - are available to both Burlington and Harwinton residents and organizations. A list of recreational facilities available in the schools is included in the parks and recreation section of this report. The Regional School District has indicated that the two biggest concerns over the next ten years are replacing the roof at Harwington Consolidated School ($10,000 from the budget was allocated for this purpose), and the removal of modal classrooms at Lake Garda School. Strategies to complete school improvements and monitor needs: Ensure scheduled renovations are completed Continually update school enrollment projections 103


110 Parks and Recreation Parks and open space integrally affect the daily life of a community. The Town s Parks and Recreation Commission monitor the current use and future need for such facilities. The Parks and Recreation Commission s Master Plan for Recreational Facilities, which was developed in 2000, included the completion of The Harold L. Malerbo Recreation Complex. The commission is in the eighth year of a 10 year Master Plan assembled by an out-side Consultant in The Park and Recreation Commission and Department are currently gathering data from user groups for recommendations for short and long term future community needs. Thus far the data indicates an overwhelming need for a Community Center, land acquisition, a lacrosse field and 90 ft. Baseball field. The National Parks and Recreation Association (NPRA) has developed recreation standards based on the size of a community and a ratio of facilities to population which roughly requires 10 acres of such facilities per 1,000 population. These standards establish a minimum baseline for recreation opportunities and must be modified to reflect the specific needs of each individual community. For example, if there are no organizations or individuals expressing a need for badminton courts, then the standard for badminton courts may be modified to reflect the popularity of the activity, or lack thereof, in the community. Survey instruments can be used to ascertain the recreational needs of a community. The following table illustrates the more popular activities from the NPRA standards with recommended service areas. These standards relate only to public facilities and do not take into account the presence of private facilities that may be accessible to the entire population of community. Another factor to consider is the availability of facilities accessible in neighboring communities. In terms of the Town of Burlington, the NPRA standards would require at least one baseball field and basketball court. In addition, one softball field, one volleyball court, and two or more tennis courts would suit the town s population. Because the town has a population of less then 10,000, hockey rinks, soccer fields, football fields, and swimming pools are not required 104
, as well as facility usage for Regional School District #10")
111 by NPRA standards. The Town does provide some of the facilities that are not required, which provides an extra benefit for the residents. In actuality, the Parks and Recreation is responsible for monitoring department sponsored programs at the following facilities (Table 4), as well as facility usage for Regional School District #10 for non-school activities, i.e. Lion's Club Basketball Program, Little League and American Legion Programs. Beside town owned parks and open spaces, there are several other active and passive recreational opportunities in the town. State parks, such as Session Woods Wildlife Reserve and Nassahegan State Forest, provide great opportunities for both active and passive recreation. Session Woods has a 3 mile long hiking trail, a boardwalk and lookout tower. Schools in the town also provide various recreational facilities as listed below: Source: Region 10 Public Schools Neighborhood parks, which offer playing fields and/or playscapes, including boundless playscapes, may need to be considered if residential development patterns disperse through town. An opportunity to develop playgrounds and other recreational spaces exists with each residential subdivision that is proposed. 105

112 The programs offered to residents by the Town s Parks and Recreation Department change 3 times a year, and include things such as various toddler and youth programs, like gymnastics, sign language, golf, ceramics, and little league. Parks and Recreation also offers many programs for adults such as fitness classes, book clubs, bingo, and other clinics and lectures for educational purposes. They also offer many programs having to do with seasonal celebrations, such as egg hunts for Easter, and carol singing for Christmas. Programs and activities are created to appeal to every age group to keep the community active. To provide these services, the Department is currently staffed by 2 full-time and 1 part-time, yearround employees, and 19 full-time summer employees. Additionally, the Department has approximately 25 third party contractors under their direction. The Department Director has indicated that an additional ½ time person would be very helpful during their busiest season. Action Steps to Meet Recreational Space & Program Needs: Complete analysis of user groups to identify future short and long term community needs Explore State and Private funding sources for facility rehabilitation and facility construction Inventory potential lands/ existing buildings available for construction of indoor recreation and outdoor recreational space Library There is one library in Burlington on Route 4 near the Town Center. The library, which was first established in 1896, was renovated in One of the goals of the Burlington Public Library is to preserve and make available for public use the papers, photographs, and related archival material that document the history of the Town, before and after its establishment in When the library was renovated in 1994, a room dedicated to the town s local history, the Burlington Room, was created. This room contains books pertaining to Burlington s history, family genealogies, photographs, clippings, diaries, maps, and other print materials. The library also has copies of the many compilations of town history assembled by town historian Leonard Alderman. The Library occupies a 8,920 square foot building with a seating capacity of 68, of which 43 are for adults and 25 for children. It holds a total of 50,023 volumes. In November of 2006, the Burlington Public Library Association (The Friends) conducted a survey of town residents which provided them with customer commentary about current and future services. The survey indicated a desire for library expansion to allow for more books, children s programs, faster internet connections, and other improvements. Last year the library installed high speed internet connection and has recently added a wireless network. The library is governed by the Burlington Public Library Board of Directors and funded entirely by the Town. The Burlington Public Library Association (The Friends) provides supplemental funding through fundraising, which has been very helpful in adding library materials such as books and computers. 106
113 In 2005, in response to felt community needs, the Library Board of Directors asked the town to fund a building expansion of 16,000 20,000 sq. feet before 2010 to keep library services abreast of the development occurring at the center of town, and also to accommodate town s increasing population. The additional space would serve a number of important purposes including an area for technological services as well as additional space to hold a variety of programs and guest speakers. Community Center Concept In addition to the potential expansion of the library, which is discussed above, in December 2004, the concept of a community center was brought to the Library Board of Directors, as well as the Planning and Zoning Commission. The prospective location for the community center would be on vacant land adjacent to the library. To date, the planning time line for the community center is as follows: December 2004: Representative from Planning and Zoning Commission (PZC) meets with Library Board of Directors and outlines the Community Center Concept January 2005: Library Board of Directors endorses possible future expansion using additional library acreage and sharing future Community Center with other Town agencies. The time line is five years. A letter to PZC is approved at February 2005 meeting. November 2005: Library Board Directors and the Burlington Library Association have an informal joint planning session at Sessions Woods to discuss future goals, expansion, and community involvement. January 2006: Formal Strategic Planning Session with Library Board of Directors and Burlington Library Association. A Survey Committee was formed, consisting of three Library Directors who are also Burlington Library Association members or officers. May 2006: The Burlington Library Association mails Library Survey along with the Annual May Newsletter. The Library Association has provided the results of the survey the Towns Planning Committee. March 2007: The Director of Burlington Park and Recreation Department provides formal response with Parks and Recreation future (and current) needs for the Community Center use including expanded Senior Citizens use. May : There continues to be widespread community support for a community center. In particular residents echoed a need for a community center along with other community facilities such as a recreation space, a senior center and a gazebo or performance areas concentrated in the Town center. An opportunity to link the community center concept with economic development opportunities was developed more recently. The community center could serve a number of important community functions and also support other less tangible characteristics of the community, such as a focal point or central gather space. Still, space within a community center can be underutilized. One way to capitalize on underutilized space is to dovetail some community center space with business incubator space as discussed in the Economic Development chapter. Additional office space could be included in the community center that could be leased/rented for short terms and or on a daily basis to developing business that are not large enough to rent space on a long term basis. Action Steps to Meet Need for Additional Community Space: Increase fundraising and grant solicitation campaign to secure funds for space and equipment needs Follow up on plan to develop a Community Center to house an expanded library as well as other town department services such as Parks and Recreation and the Senior Center 107
114 Fire and Emergency Medical Services Founded in 1947, the Burlington Volunteer Fire Department is chartered by the State of Connecticut to provide fire protection and emergency services to the Town. According to the fire department, a total of 70 Volunteers - 16 active EMS and 54 fire fighters - currently serve the town. The BVFD ambulance is staffed 24 hours a day by an EMT-Paramedic. Their average response time is under 10 minutes on medical emergencies in Burlington. In addition, the dispatch center provides emergency phone instructions before the ambulance arrives. Additional services that the department provides are fire prevention programs, hazardous materials investigations, carbon monoxide metering, and, most recently, support to the Farmington Valley Regional Fire Task Force. The following table notes the names and addresses of the four fire station locations in Burlington. Table 6: Fire Department Stations Name Burlington Volunteer Fire Department HQ, Station #1 Burlington Volunteer Fire Department Station #2 Burlington Volunteer Fire Department Station #3 Burlington Volunteer Fire Department Station #3 Location 719 George Washington Turnpike 354 Jerome Avenue 120 Chippens Hill Road West 85 Monce Road The Board of Fire Commissioners, which was formed in October of 2006, coordinates the administrative functions among the four stations and helps allocate municipal financial support. Day-to-day operations are handled by the Chief of the fire department. The department is currently experiencing deficiencies in daytime volunteer availability. It relies on mutual aid from neighboring towns for large scale incidents. Current equipment includes: One Ambulance One Heavy Rescue One Light Rescue One Traffic Control Vehicle Four Engines One Rescue Boat One Brush Truck Two Water Tanker s Specialized equipment includes: Automated External Defibrillators Hydraulic Rescue/Extrication Devices Water Rescue Cold Water Submersion Suits Thermal Imaging Cameras 108
115 2 ATVs The Community Facilities map shows the locations of the four fire stations with their one- and two mile buffer areas. Most of the town is within a two-mile buffer of a station. The map also shows the locations of fire hydrants and other water resources. Action Steps to Meet Fire and Emergency Services Staffing Issues: Evaluate need to hire full-time personal to address staffing gaps and maintain response time and ISO rating Organize campaign to recruit additional volunteers Police Protection The Town contracts with the Connecticut State Police Troop L for police services. The current contract is valid until through and is renewed on a three -year term. There are three resident troopers, one resident state trooper, two full-time constables and eight part-time constables. Current police staffing provides adequate police protection service. Police facilities are located in the Town Hall building. Burlington s crime rate is much lower than that of Hartford County, or the State of Connecticut. According to the Connecticut uniform crime reports, most of the crimes in the town are theft and burglary related. In 2004, the crime rate was total crimes per 100,000 people; where Hartford County s rate was 3,834.2 per 100,000 people. Burlington s crime rate is far below the State s rate of 2,973.9 in 2004.In terms of stolen property; Burlington reported $98,004 stolen in comparison to a total of $27,648,705 stolen from the Hartford County. Overall, Burlington has a much lower rate of stolen property. In 2004, the highest number of reported crimes in Burlington were burglary and larceny with 23 and 22 reported respectively. There were no extremely violent crimes reported, such as murder, rape or robbery. Burlington is a very safe environment in which to live with such low crime numbers. According to the FBI, violent crime 1 is composed of four offenses: murder and non-negligent manslaughter, forcible rape, robbery, and aggravated assault. In 2004, according to the FBI s definition, only 1 violent crime was reported in Burlington, which was aggravated assault, resulting in a rate of 11.9 violent crimes per 100,000, compared with the County s number of reported violent crimes at: 3017 which include murder, rape, robbery and aggravated assault. The state s violent crime rate was per 100,000 people. In terms of stolen property, Burlington reported $98,004 stolen, and $3, which is close to 0%, of that was recovered. The county reported a total of $27,648,705 stolen, and $9,944,027, or 36% was recovered. Overall, Burlington has a much lower rate of stolen property, but the recovery of that stolen property is not as good as the county s record of retrieval. 1 According to the Uniform Crime Reporting (UCR) Program s definition, violent crimes involve force or threat of force
116 In 2004, the highest numbers of reported crimes were burglary and larceny with 23 and 22 reported respectively. There were no extremely violent crimes reported, such as murder, rape or robbery. In all, there were a total of 50 crimes reported in 2004 for the Town of Burlington, resulting in a crime rate if per 100,000 people. Compared at the state and county levels, Burlington has a very low crime rate, with the state being and the county at crimes per 100,000 people. Burlington is a very safe environment to live with such low numbers of crimes being reported. Utilities Sanitary Sewer System Town of Burlington does not operate a public sewer system. Most of the town is dependent on individual septic systems. The following two neighborhoods adjacent to the neighboring towns are connected to public sewer systems: (1) the Lake Garda community, in the Lake Garda Area Sewer District, is connected to the Town of Farmington sewer system; and (2) the northeast corner of Burlington, in the Riverside Area Sewer System, is connected to the Canton sewer system. Sewer lines in Lake Garda community were extended to cover more area in the fall of 2006 as individual septic systems were failing in the area. Sewer service for the Lake Garda community is crucial to public and environmental safety, as well as to preserving the viability of the dense residential nature of those areas. The map entitled Community Facilities shows current sewer service area boundaries. Expansion of the system to address public safety inadvertently opens other areas up to development of a somewhat denser nature, which may or may not be desirable. Water System Burlington is mostly dependent on well water. The northwest section of the town is connected with the public water system because of ground water contamination back in the late1980s. Torrington public water has 12 inch distribution lines to provide water in this section of the town. Recently, a 12 inch water main was extended to provide service to the Burlington Commons Shopping Center. That extension provides the option to extend water service to nearby areas. Small pockets of areas in the northeast and southern sections of the town, as shown on Figure 1, are served by the Canton and Bristol Water Departments, respectively. Electricity/Telephone/Cable The town is currently served with basic electric and telephone. There are no gas lines in the town and new wireless communications are still expanding throughout the town. The town currently has two cell phone towers and service area is sporadic. The town is connected to high speed internet service through the telephone and cable service providers. The level of service depends on the locations in the town. Access to high quality communications infrastructure is an important economic development consideration. Solid Waste Disposal The Town of Burlington provides quarterly bulk waste pick-up service to its residents for selected items. Bulk waste items are collected at the curbside. The town also has bulk waste drop-off area behind the town hall for Burlington residents, where they can drop certain bulk items and chemicals for a fee. The town of Burlington is served by the Bristol Resource Recovery Facility Operating Committee for regular household trash service. Recycling is done bi-weekly and is a curbside service. 110
117 TRANSPORTATION Plan of Conservation & Developmen Introduction One of the main components of maintaining a high quality of life in Burlington is a safe, efficient, and effective transportation system. This system also plays an important factor in the growth and development of the community. The Plan of Conservation and Development and this chapter of the POCD specifically provide an opportunity to review the existing transportation system, identify needs and opportunities, and establish priorities. Burlington s existing transportation system is primarily comprised of a network of town roads and state highways, which combine to provide for intra-town and inter- town travel needs. A detailed description of the Town s existing transportation system is provided below. Existing Road Network Classification - A portion of the Town is considered part of the Hartford Urbanized Area which affects the classification of roads inside and outside this area for federal funding purposes. Roadways are classified by federal and state transportation agencies according to their function. This functional hierarchy has implications for federal funding for improvements. For example, only roads classified as arterials and collectors (which are located within the urbanized area) are eligible for funding under the STP-Urban program. Outside the urbanized area, the rural area, classifications are slightly different and the eligible funding programs are different. Figure 1 below details the road network, highlighting the functional State classification of all the roadways. The map indicates that local roads comprise the largest percentage of roadways in the Town followed by major rural and urban collector roads, minor arterials, and other arterials. What is interesting about the classification is that Town subdivision regulations identify a number of roads (see Table 1) as collectors, while the State s classification for the same roadways identify them as local roads. The State s lower classification for these roadways has major funding implications, as the Town cannot tap into federal road rehabilitation funding for local roads. ConnDOT s Public Mileage Report indicates that 87% of the Town s roads are maintained by the town, while 13% are maintained by the State of Connecticut. Key Transportation Issues Safety concerns, particularly along portions of Route 4, Inconsistencies with Town and ConnDOT roadway classification system Lack of alternative modes of transportation including any public transit for Town residents Lack of connections between Town Center and outlying areas of Town. Need for long term transportation plan Need to enact Scenic Road designations for select roadways in Town Lack of roadway design standards that is tied in with subdivision regulations T OWN OF BURLINGTON 111
118 Table 1: Town Classification Collector Roads Jerome Avenue Johnnycake Mountain Road Lyons Road Main Street Nepaug Road Prospect Street Belden Road Case Road Clear Brook Road East Chippens Hill Road Ford Road Reservoir Hill Road Rock Road Scoville Road South Main Street Stone Road Barnes Hill Road Bradley Road Sand Hill Bank Road Covey Road Foote Road Hotchkiss Road In terms of average daily traffic, Table 2 (which is shown below) indicates that the highest level of traffic occurs at the following locations: o Route 4 from Route 69 (Milford Street) to GWT o Route 4 from Route 179 (Canton Road) to Farmington Town Line o Route 4 from Lyon Road to Route 69 (Milford Street) o Route 179 from Route 4 (Spielman Highway )to Belden Road #1 In general the table shows that there is a high level of traffic along Routes 4 and Route 179, which is to be expected given that they serve to connect Burlington to Route 8, which is one of Connecticut s primary north-south routes, and Route 44, which provides service into Hartford. In addition, while ConnDOT predicts traffic to increase along each State Route by 2025, none of the roadways are projected to be at congested levels. 112

119 Figure 1: Road Classification 113
120 Table 2: Average Daily Traffic (ADT) State Routes, 2005 From To ADT Bristol Town Line South Main Street 4,900 Route 69 South Main Street Reservoir Road 4,000 Reservoir Road Scoville Road 4,400 Scoville Road Route 4 (Spielman Hwy) 6,400 Route 4 Harwinton Town Line Johnnycake Mtn. Road 10,600 Johnnycake Mtn. Road Lyon Road 11,700 Lyon Road Route 69 (Milford Street) 12,600 Route 69 (Milford Street) GWT 13,000 GWT Belden Road 10,300 Belden Road Punch Brook Road 9,600 Punch Brook Road Rt. 179 (Canton Road) 10,400 Rt. 179 (Canton Road) Farmington Town Line 12,700 Route 489 Belden Road #1 Route 4 (Spielman Hwy) 500 Route 179 Canton Town Line Route 4 (Spielman Hwy) 10,000 Source: ConnDOT 114
121 Traffic Accidents The safety of the public upon the roadways of the Town is an important part of the operation of the transportation network. Analysis of accident experience can shed light on consideration of modified roadway design, signage or needs for driver education. Table 3 provides accident data on State Routes within Burlington between 2003 and 2005 indicating the number of injuries and fatalities by road segment. The table indicates the highest number of injuries and fatalities occurred along Route 4 from Route 179 to the Farmington Town Line. Table 3: Injuries and Fatalities on State Routes, Roadway From To Injuries Fatalities Total Rt. 69 GWT Covey Road Belden Road Rt. 4 Mountain Spring Vineyard Road Road Rt. 179 Farmington Town Line Rt. 69 Entire length Source: ConnDOT The analysis of crash characteristics can assist in the identification of accident causes and the development of strategies to reduce incidents. Table 4 examines some crash details of certain segments of Route 4. These particular road segments were chosen based on accident rates for the period The S curve section of Route 4 has historically been the site of the greatest rate of accidents, however ConnDOT did not report incidents for the calendar years within the S curves. The introduction of NovaChip pavement treatment has been characterized by ConnDOT as responsible for marked decreases in the rate of crashes on that segment. However, the geometry and slope of the roadway is such that a high incident potential still exists at the site. Modification of the S curves as a state project has recently been postponed based partly on the experience of the NovaChip and partly on right-of-way acquisition difficulties. 115
122 Table 4: Crash Specifications, Route 4, (Percentage Majority of All Crashes for Segment) Collision Type Segment Contributing Factor Weather Farmington Town Line Clear to Rt. 179 (~2 miles) (72%) Vineyard Rd to Mountain Spring Rd. (~.5 miles) Belden Rd. to Covey Rd. (~.41 miles) GWT to Rt. 69 (~.32 miles) Site At Punch Brook/Barnes Hill Roads Source: ConnDOT, 2007 Fixed Object (37%) Rear End (30%) Fixed Object (77%) Fixed object (30%) Angle (25%) Rear End (55%) Turn-Ints (50%) Driver Following Too Close (26%) Driving Too Fast for Conditions (21%) Driving Too Fast for Conditions (46%) Driver failed to grant right of way (25%) Driver Following Too Close (52%) Driver failed to grant right of way (87%) Clear (100%) Clear (95%) Clear (74%) Clear (75%) Road Conditions Total Crashes Dry (70%) 43 Dry (77%) 13 Dry (75%) 20 Dry (64%) 42 Dry (50%) 8 116
123 Strategies to improve safety: Encourage the Connecticut Department of Transportation to complete safety improvements on state highways to eliminate unsafe areas and accident location concentrations. o Petition the Department of Transportation to investigate high accident rates and solutions for: Route 4 between intersection with Route 179 and Farmington town line. Route 4 at intersection of Punch Brook Road. Route 4 at intersection of George Washington Turnpike. o Work with DOT to provide solutions to the perennially dangerous S curves on RT 4 between Belden Road and Mountain Spring Road. o Encourage the use of highly reflective striping on Route 4 s curves as a short term solution o Develop solutions to the dangerous situation created by a passing zone and an informal parking area at the intersection of Route 4 and RT 179. Petition ConnDOT to change the classification of Jerome Avenue, as well as other local roads with high traffic volumes to urban collectors, which would make the roads eligible for federal funding of safety improvements. Work with Conn DOT to institute traffic calming measures on Route 4 where the roadway passes through the Town Center. Close off portion of GW Turnpike between Savarese Lane and Route 4 to improve safety and make the Town Green area more pedestrian friendly. Potential Transportation System Issues Based on the above traffic volume and accident data, as well as their own observations, town staff identified the following potential transportation system issues: George Washington Turnpike carries a substantial volume of traffic for a road of its size and consideration should be give to improving the section near Case Road. As volume has increased on Jerome Avenue, which acts like a north-south collector for local roads branching off, consideration should be made for appealing to ConnDOT to change the classification of Jerome Avenue to an urban collector, which would make the road eligible for federal funding of improvements. The Town should look to limit the use of cul-de-sacs in future developments. There are approximately 60 streets in Town that end in a cul-de-sac. While this type of road design is appealing to homeowners since it affords privacy, it limits circulation by forcing traffic into one route to access sites beyond the neighborhood, which leads to increased vehicle miles driven and an uneven distribution of traffic on collectors and arterials. As Burlington is a rural town with a bucolic setting, the Town may wish to apply to ConnDOT to have certain roads designated as Scenic Roads, which would then allow for the those roads to receive the benefits and protection provided by ConnDOT. Criteria for scenic road designation can be found here: 117
124 Strategies to maintain the current transportation system: Promote policies that maintain the existing system rather than call for the expansion of roadways Continue to improve and maintain the Town s road to ensure the efficient and effective movement of both people and goods. Work with the State and Regional agencies to identify and prioritize highway projects that highlight preservation activity. Condition of Local Bridges As shown on Table 5, Connecticut DOT bridge rating reports indicate that within Burlington three bridges have a poor condition rating, Belden Rd #2 (Hatchery), Reservoir Hill Road, and Vineyard Road, which is currently in the process of being replaced. Journey-to-Work Table 5: State-Owned Bridges Over 20 Feet in Length Bridges with State Rating of Poor (0-4) Rating Road Name Water Body/ Roadway 3 Belden Rd #2 (Hatchery) Burlington Brook 4 Reservoir Hill Road Whigville Brook 4 Vineyard Road* Burlington Brook Bridges with State Rating of Fair (5-6) Rating Road Name Water Body or Roadway 6 Route 179 (Canton Rd.) Burlington Brook 6 Foote Road Burlington Brook 6 South Main Street Copper Mine Brook Bridges with State Rating of Good (7-9) Rating Road Name Water Body or Roadway 7 Route 4 (Spielman Hwy.) So. Branch Bunnell Brook 7 Barnes Hill Road Burlington Brook Source: Connecticut Department of Transportation *Current project, est. completion 2011 Journey-to-work data summarized by the Central Regional Council of Governments (and shown in Figure 2 below), indicates that the large majority of work trips made by Burlington residents are to neighboring Bristol, within the Town itself, to Hartford, and to Farmington. 118
125 Br iar Clf Covey Rd ")69 Punch Broo k Rd Norwo od Rd Skip Ln Monce Rd Journey-to-Work Outbound Top Ten Destinations West Hartford 142 Cricket Ln Hea ther L n Cranb erry Ln Claire Hill Rd Burlington Rd State Hwy 17 9 Bur lin gton Ave Arch St Hartford 435 No Thru Access Collinsville Rd County Line Rd Davis Rd Par tridge L n Smith Ln ")4 Yor ks hire Way Duane L n Nep aug Rd Myr a Ln Lyons Rd Spielman Hwy School House Hl Upson Rd Hotchkiss Rd Clear Brook Rd Foote Rd Village Ln W Woods Rd Vin eya rd Rd Belden Rd Ali ce Dr Holly berry L n Nor th Rdg Hunt ers Xing Fawn Hil Rd Wit he Pas s Fore st Dr Deerfield Trc Doe Mead ow Dr Skunk Rock Rd Daniel Trc e Bar nes Hil l Rd De er Run For d Rd ")4 Riverside Rd Canto n Rd Avon 218 Farmington 515 Ch arolais' Way Middlecroft Rd Rock Rd ") 69 Savare se Ln George Wash ington Tp ke Laurel Crst Mo untain Bria r Blueberr y Ln Rya ns Way Ta in e Moun tain Rd Ven tr es Way Donna Dr Fieldview Dr Polly Da n Rd Merr itt Wo ods Joh nny Cake M ountain Rd Warren Glen Rd Old Fie ld Rd South Rd Gilbert Ln Sawmill Rd Fox Glenn Rd West Chippins Hill Rd Gre er Rd Hull Rd W Chippens Hill Rd E Chippen s Hill Rd Milfor d St Sco vil e Rd E Chippins Hill Rd Cornwall Rd 519 Nassahe gan Dr Wade Rd Hart St Miller Rd Bittersweet Ln Reservoir Rd Bradley Rd Bristol 581 Road Clos ed Stony Hill Rd Int ervale Rd Ston e Rd Cob blestone Rd Main St Pine Hil Rd Oak St Wotton Ln Case Rd Wildcat Rd Pr osp ect St S Main St Cedar Ridge Stage coach Rd Jerom e Ave Mary Rd Ce dar Sprin g Rd Chatha m Ln Angelas' Way Sunset Rdg Wood Creek Rd Copper mine Rd Nelson Dr Wo odhave n Dr Newington 130 Alpine Dr Alto Rd New Britain 254 Alpine Rd Westside Blvd Venice Dr Bu rlwoo d Dr Colony Rd Cir cle Dr Silver Dr E Shore Blvd Sher man Dr Plainville 143 Southington 178 Source: U.S Census, 2000 Figure 2: Journey-to-Work - Outbound 119
126 As shown in the table presented below, the vast majority of workers, nearly 87%, drive alone while less than two percent walk, bicycle or use public transportation. Table 6: Means of Transportation to Work for Workers 16 Years and Over Burlington State Drove alone 3,857 (86.6%) 80.0% Carpooled 352 (7.9%) 9.4% Public transportation 23 (0.5%) 4.0% Motorcycle 0 (0.0%) 0.0% Bicycle 0 (0.0%) 0.2% Walked 28 (.6%) 2.7% Other means 0 (0.0%) 0.5% Worked at home 194 (4.4%) 3.1% Source: 2000 US Census Commute times are dependent on location of employment centers. Most travelers have moderate commute times. The median travel time to work (for workers 16 years and over) is 23:31. For the State of Connecticut, the median time is slightly less at 20:44. 1 Table 7 shows work commute time in more detail. In general, work trips are trending toward longer commutes in terms of time. Telecommuting is increasingly popular and accessible as an alternative to commuting to work by car. Table 7: Travel Time to Work for Workers 16 Years and Over Less than 10 minutes 190 (4.27%) 362 (9.14%) 10 to 19 minutes 962 (21.6%) 994 (25.01%) 20 to 29 minutes 1,302 (29.23%) 1,053 (26.59%) 30 to 44 minutes 1,246 (27.98%) 1,027 (25.93%) 45 to 59 minutes 353 (7.93%) 304 (7.68%) 60 to 89 minutes 129 (2.90%) 81 (2.05%) 90 or more minutes 78(1.75%) 0 (0.00%) Worked at home 194 (4.36%) 139 (3.51%) Source: 2000 US Census US Census. 120
127 Transit Services While there is no public transportation in Burlington, demand-responsive transportation exists for a segment of the population. The Town offers a dial-a-ride service to elderly/disabled populations. Approximately 1,800 2 persons utilize the service annually for transportation in the Greater Hartford area for medical needs and also weekly shopping trips to Avon and Bristol. Pedestrian/Bicycle Network Pedestrian access is limited by the fact that most roads in the Town do not have sidewalks. Bicycle access is limited by the fact that, outside of the Farmington River Trail (which is discussed below), there are no dedicated bicycle lanes in Burlington. Some roads, however, have adequate width and low enough speed and traffic volume to accommodate vehicles and bicycles, and the Statewide Bicycle Map has in fact identified a recommended north-south bicycle route through the Town which runs on Covey Road, GW Turnpike, and Jerome Avenue. Multi-Use Trail Networks There are two main multi-use trails in the Town; the Tunxis Trail (Figure 3) and the Burlington Farmington River Trail (Figure 4), which is a section of the Farmington River Trail, a 10.5-mile trail that begins at Meadow Road in Farmington and ends in Canton. The Burlington section is 3 miles in length and begins at the Farmington town line where it meets Farmington s section of the trail. From this point the trail runs north following the Farmington River its entire path until its terminus at the Canton town line. Here the trail crosses the Farmington River and connects with Canton s portion of the trail. Parking is available at a designated lot located off of Route 4 in Burlington, close to the intersection of Route 179 and Route 4. 2 Town of Burlington 121
128 Figure 3: Tunxis Trail 122


129 Figure 3: Farmington River Trail Strategies to improve current transportation network and transit alternatives: Encourage alternative modes of transportation such as public transit, bicycling, and walking; encourage walkways, bikeways and trail construction in appropriate areas; encourage completion of the rails-to-trails" project along the Farmington River; and require the provision of sidewalks in the Burlington Center area. o Seek alternative funding for completion of the rails-to-trails to the Farmington town line. o Continue utilizing the sidewalk fund to finance new sidewalks in the Center. o Require new developments in the Center to provide sidewalks by amending zoning regulations. o Develop a plan to link parcels in the Center with walkways. Encourage the development of transportation services (transit, dial-a-ride, etc.) which serve Burlington. o Encourage dial-a-ride service provider to participate in the Locally Coordinated Human Services Plan to enhance coordination of trips with surrounding communities and attract federal funding. o Explore feasibility of rural public transportation connections with existing fixed routes in Bristol and Farmington. o Explore the feasibility of establishing a commuter bus route. 123
130 Central Regional Planning Agency s Transportation Initiatives The CCRPA is responsible for regional transportation planning activities and for the programming of area transportation projects that will receive federal transportation monies. A review of CCRPA s Long Range Transportation Plan and the 2008 List of Obligated Transportation Projects revealed one transportation project, which is listed below, that will affect Burlington during the next ten years. o Rt. 4: Belden Rd to Mountain Springs- Reconfigure the horizontal and vertical curves by realigning this section of Route 4 to improve safety. This project is scheduled to cost $1.8 million. Transportation Goals & Recommendations The following identifies a comprehensive program of roadway improvements recommended to mitigate traffic congestion, improve traffic circulation, improve vehicular and pedestrian safety, calm traffic flows in commercial districts and residential neighborhoods and encourage multi-modal travel. The goals, and recommendations were developed based on an analysis of the data presented above, a review of the previous POCD, and issues identified during the focus group sessions. 124
131 Strategies to improve circulation and protect rural character Encourage completion of unimproved roads to link outlying areas to the Town Center and to improve overall circulation, and ensure that proper provision is made for future road connections to adjacent undeveloped properties. o To improve circulation and emergency access: Extend Johnnycake Mountain Road southerly to connect with Scoville Road or open up Sawmill Rd Extend George Washington turnpike to divert traffic off of Case Road. Connect Miller Road with Cornwall Road to provide better circulation. Connect Covey Road with Library Lane for internal circulation for an extended Center. Determine a cohesive overall circulation pattern for Burlington's eventual growth and construct road improvements, and road connections, as needed for the eventual development of the community; where road connections may be required to adequately provide for future circulation needs, place high priority on preserving the valued qualities of existing neighborhoods by constructing roadway improvements which are designed to preserve the character of the areas through which they pass. o Develop a plan to link existing cul-de-sacs with walkways where appropriate. o New subdivision plans should contain road layouts that illustrate future connectivity to other neighborhoods and collector roads. o Review requirements for establishing temporary cul-de-sacs to help ensure connecting roads are constructed Review the Town s road standards and requirements, and implement a Transportation Plan road hierarchy, and, review the subdivision regulations and town road specifications to ensure that standards for lighting, guiderails, walkways and other improvements are compatible with Burlington's rural character. o Decrease the design speed standard for collectors from 45 MPH to 35 MPH. o Enact Scenic Road designations for Route 179 to Canton town line. o Enact Scenic Road designation for Route 69 from the Sawmill southerly to the Bristol city line. o Consider providing a range of road width standards that reflect the character of the area. 125
132 CONSISTENCY WITH STATE & REGIONAL PLANS Plan of Conservation & Development Section 8-23 of the Connecticut General Statutes requires that each municipal plan of conservation and development take into account the state plan of conservation and development and note any inconsistencies it may have with said state plan. In addition, the State plan serves as a document of reference for certain types of municipal projects for which state funding is sought; such projects must be reviewed by OPM to determine the extent of their conformance to the State plan. In general, a municipal project which is in (greater) conformance with the State plan is more likely to receive state funds than one that is less so. As such, it is in the city s best interest that, to the maximum extent possible, this Plan of Conservation and Development be consistent with the State plan. In accordance with CGS 8-23 the future land use plan was compared to the State s Plan of Conservation and Development Policies Plan Locational Guide Map for and the Central Connecticut Regional Future Land Use Pattern adopted by the Central Connecticut Regional Planning Agency. While the land use categories used in three plans have some variation, the land use objectives were found to be generally consistent. All three Plans identify natural resource, open space and historic areas for conservation, focus on concentrating development where existing infrastructure exists, supporting mixed use in the Town center and identify appropriate development density based on environmental conditions and community character. Any inconsistencies are attributable to difference in definitions rather than quantifiable differences about how Burlington should grow in addition to the fact that the State and Regional Plans makes recommendations for relative intensities and environmental factors, while this plan suggests specific land use types. T OWN OF BURLINGTON 126

133 127
134 Consistency with Growth Principles of the State Plan of Conservation and Development In accordance with Section 8-23 of the Connecticut General Statutes, the Plan of Conservation and Development has been evaluated for consistency with statewide growth management principles. Principle 1 Redevelop and revitalize regional centers and areas of mixed-land uses with existing or planned physical infrastructure. Although the State Plan does not contain any areas designated as a regional center, the Regional Plan of Conservation and Development designates the Town Center Area of Burlington as a Rural Community Center. In accordance with this designation and the State goal, this Plan recommends a number of strategies to redevelop, revitalize, and further mixed-use development within the Town center. (Which has some existing physical infrastructure and is a suitable location for infrastructural expansion) In particular, the Plan supports the development of a pedestrian-oriented mixed use infill development in the Town Center. Some examples of specific regulatory/policy recommendations include: Building upon existing Town Center Development Plans Revising zoning regulations to require a greater mix of uses within buildings, including housing units. Overall, the concept of focusing growth in a mixed use town center were adequate infrastructure could be developed is a key element of the Plan. Principle 2 Expand housing opportunities and design choices to accommodate a variety of household types and needs. The Town of Burlington currently has limited diversity in its housing stock. However, the Plan recommends a number of strategies to expand housing opportunities and types to accommodate a variety of household types and needs. In particular, the Plan recommends that Burlington: Implement policies that diversify the variety of housing types available in Burlington that address the needs of changing demographics, including an again population and decreasing household size. Implement a variety of strategies to promote workforce housing Principle 3 Concentrate development around transportation nodes and along major transportation corridors to support the viability of transportation options and land reuse. The Plan of Conservation and Development recommends New England village mixed-use development within the Town Center which fronts State Route 4 a major transportation corridor and in the future, may support bus service. Development of the Town Center will help support the overall community structure and create a focal point. The Plan also recommends continuing efforts to establish bikeways and bike lanes throughout town, linking important community facilities where possible. 128
135 Principle 4 Conserve and restore the natural environment, cultural and historical resources, and traditional rural lands. The Plan of Conservation and Development contains specific chapters which identify strategies to: protect natural resources preserve open space, and protect historic resources, and scenic views These strategies will help conserve and restore the natural environment, cultural and historical resources. Principle 5 - Protect environmental assets critical to public health and safety. The Plan of Conservation and Development also contains recommendations to protect environmental assets critical to public health and safety. This includes goals, policies and objectives to protect water quality (both surface and ground), preserve floodplain areas, aquifer recharge area, preserve sensitive hillsides, and implement low-impact development policies and other similar strategies. Principle 6 Integrate planning across all levels of government to address issues on a local, regional, and statewide basis. The Plan of Conservation and Development is part of the process of integrating planning with other levels of government and with other agencies. The Plan recommends coordinating efforts with State agencies, Regional organizations and adjacent communities to: Connect existing trail systems and work with the State to improve access to State owned lands Collaborate with Regional and State transportation officials to improve safety conditions on Route 4 where necessary and develop alternatives to help slow traffic through the town center. Pursue the CT Home program and technical assistance provided by the State in developing the CT Home program 129

136 Future Land Use Map 130
2014 Plan of Conservation and Development
 The Town of Hebron Section 1 2014 Plan of Conservation and Development Community Profile Introduction (Final: 8/29/13) The Community Profile section of the Plan of Conservation and Development is intended
Place Type Descriptions Vision 2037 Comprehensive Plan
 Place Type Descriptions Vision 2037 Comprehensive Plan The Vision 2037 Comprehensive Plan establishes a range of place types for Oxford, ranging from low intensity (limited development) Rural and Natural
Housing Characteristics
 CHAPTER 7 HOUSING The housing component of the comprehensive plan is intended to provide an analysis of housing conditions and need. This component contains a discussion of McCall s 1990 housing inventory
Table of Contents. Appendix...22
 Table Contents 1. Background 3 1.1 Purpose.3 1.2 Data Sources 3 1.3 Data Aggregation...4 1.4 Principles Methodology.. 5 2. Existing Population, Dwelling Units and Employment 6 2.1 Population.6 2.1.1 Distribution
2016 Census Bulletin Changing Composition of the Housing Stock
 Metro Vancouver s Role Every five years, the Census of Canada provides benchmark data that is instrumental in analyzing and evaluating local government planning policies and services. Representing member
2014 Plan of Conservation and Development. Development Plan & Policies
 The Town of Hebron Section 3 2014 Plan of Conservation and Development Development Plan & Policies C. Residential Districts I. Residential Land Analysis This section of the plan uses the land use and vacant
HOUSING & RESIDENTIAL AREAS
 CHAPTER 10: HOUSING & RESIDENTIAL AREAS OVERVIEW With almost 90% of Ridgefield zoned for residential uses, the patterns and form of residential development can greatly affect Ridgefield s character. This
Residential Neighborhoods and Housing
 Residential Neighborhoods and Housing 3 GOAL - To protect Greenwich as a predominantly residential community and provide for a variety of housing options The migration of businesses and jobs from New York
CHAPTER 8: HOUSING. Of these units, 2011 Census statistics indicate that 77% are owned and 23% are rental units.
 CHAPTER 8: HOUSING Port Moody has traditionally been a family oriented community. Based on the 2011 Census, 64% of all census families include children. Overall the number of dwelling units in Port Moody
Land Use. Land Use Categories. Chart 5.1. Nepeuskun Existing Land Use Inventory. Overview
 Land Use State Comprehensive Planning Requirements for this Chapter A compilation of objectives, policies, goals, maps and programs to guide the future development and redevelopment of public and private
City of Lonsdale Section Table of Contents
 City of Lonsdale City of Lonsdale Section Table of Contents Page Introduction Demographic Data Overview Population Estimates and Trends Population Projections Population by Age Household Estimates and
A. Land Use Relationships
 Chapter 9 Land Use Plan A. Land Use Relationships Development patterns in Colleyville have evolved from basic agricultural and residential land uses, predominate during the early stages of Colleyville
Town of Yucca Valley GENERAL PLAN 1
 Town of Yucca Valley GENERAL PLAN 1 This page intentionally left blank. 3 HOUSING ELEMENT The Housing Element is intended to guide residential development and preservation consistent with the overall values
Myth Busting: The Truth About Multifamily Renters
 Myth Busting: The Truth About Multifamily Renters Multifamily Economics and Market Research With more and more Millennials entering the workforce and forming households, as well as foreclosed homeowners
Existing Land Use. Typical densities for single-family detached residential development in Cumberland County: 1
 Existing Land Use A description of existing land use in Cumberland County is fundamental to understanding the character of the County and its development related issues. Economic factors, development trends,
Downtown Development Focus Area: I. Existing Conditions
 Downtown Development Focus Area: I. Existing Conditions The Downtown Development Focus Area is situated along Route 1, south of the train tracks, except for the existing Unilever property. It extends west
Appendix A: Guide to Zoning Categories Prince George's County, Maryland
 Appendix A: Guide to Zoning Categories Prince George's County, Maryland RESIDENTIAL ZONES 1 Updated November 2010 R-O-S: Reserved Open Space - Provides for permanent maintenance of certain areas of land
Missing Middle Housing Types Showcasing examples in Springfield, Oregon
 Missing Middle Housing Types Showcasing examples in Springfield, Oregon MissingMiddleHousing.com is powered by Opticos Design Illustration 2015 Opticos Design, Inc. Missing Middle Housing Study Prepared
CHAPTER 7 HOUSING. Housing May
 CHAPTER 7 HOUSING Housing has been identified as an important or very important topic to be discussed within the master plan by 74% of the survey respondents in Shelburne and 65% of the respondents in
Generic Environmental Impact Statement. Build-Out Analysis. City of Buffalo, New York. Prepared by:
 Generic Environmental Impact Statement Build-Out Analysis City of Buffalo, New York 2015 Prepared by: TABLE OF CONTENTS 1.0 INTRODUCTION 1 2.0 METHODOLOGY 2 3.0 EXISTING LAND USE 3 4.0 EXISTING ZONING
Chapter 1: Community & Planning Context
 Chapter 1: Community & Planning Context Yesterday, Today & Tomorrow Comprehensive Plan 2040 2 INTRODUCTION The City of Lauderdale is a small town with a long history. Nestled between Saint Paul and Minneapolis,
Town of Prescott Valley 2013 Land Use Assumptions
 Town of Prescott Valley 2013 Land Use Assumptions Raftelis Financial Consultants, Inc. November 22, 2013 Table of Contents Purpose of this Report... 1 The Town of Prescott Valley... 2 Summary of Land Use
SJC Comprehensive Plan Update Housing Needs Assessment Briefing. County Council: October 16, 2017 Planning Commission: October 20, 2017
 SJC Comprehensive Plan Update 2036 Housing Needs Assessment Briefing County Council: October 16, 2017 Planning Commission: October 20, 2017 Overview GMA Housing Element Background Demographics Employment
b. providing adequate sites for new residential development
 DIVISION 2.200 SECTION 2.201 INTRODUCTION A. Purpose The purpose of the Housing Element is to establish the goal, objectives, and policies to guide housing development within Polk County over the next
Bylaw No , being "Official Community Plan Bylaw, 2016" Schedule "A" DRAFT
 Bylaw No. 2600-2016, being "Official Community Plan Bylaw, 2016" Schedule "A" Urban Structure + Growth Plan Urban Structure Land use and growth management are among the most powerful policy tools at the
Route 6 Corridor Study Bristol Planning Commission Meeting #1. May 25, 2016 FITZGERALD & HALLIDAY, INC. Innovative Planning, Better Communities
 Route 6 Corridor Study Bristol Planning Commission Meeting #1 May 25, 2016 FITZGERALD & HALLIDAY, INC. Innovative Planning, Better Communities Today s Agenda 1. Introductions 2. Study overview Scope Schedule
Chapter 5: Testing the Vision. Where is residential growth most likely to occur in the District? Chapter 5: Testing the Vision
 Chapter 5: Testing the Vision The East Anchorage Vision, and the subsequent strategies and actions set forth by the Plan are not merely conceptual. They are based on critical analyses that considered how
TASK 2 INITIAL REVIEW AND ANALYSIS U.S. 301/GALL BOULEVARD CORRIDOR FORM-BASED CODE
 TASK 2 INITIAL REVIEW AND ANALYSIS U.S. 301/GALL BOULEVARD CORRIDOR FORM-BASED CODE INTRODUCTION Using the framework established by the U.S. 301/Gall Boulevard Corridor Regulating Plan (Regulating Plan),
MEMORANDUM Planning Commission Travis Parker, Planning Director DATE: April 4, 2018 Lakewood Zoning Amendments Housing and Mixed Use
 MEMORANDUM TO: FROM: Travis Parker, Planning Director DATE: April 4, 2018 SUBJECT: Lakewood Zoning Amendments Housing and Mixed Use In August 2017, the Lakewood Development Dialogue process began with
Chapter 4: Housing and Neighborhoods
 Chapter 4: Housing and Neighborhoods Introduction Medina is a growing community that provides a variety of housing types and neighborhood styles while protecting and enhancing the City s open spaces and
CHAPTER 3. HOUSING AND ECONOMIC DEVELOPMENT
 CHAPTER 3. HOUSING AND ECONOMIC DEVELOPMENT This chapter analyzes the housing and economic development trends within the community. Analysis of state equalized value trends is useful in estimating investment
The URD II Plan, for example, drafted in 1991 recognized both the need and opportunity for affordable housing development stating on page 49:
 PROPOSAL TO MISSOULA REDEVELOPMENT AGENCY FOR AFFORDABLE HOUSING PROGRAM The lack of inventory and inaccessibility to affordable housing in Missoula are longrecognized and well-documented problems. Too
WRT. October 16, Arthur Collins President Collins Enterprises, LLC 2001 West Main Street, Suite 175 Stamford, CT 06902
 Planning & Design October 16, 2010 Arthur Collins President Collins Enterprises, LLC 2001 West Main Street, Suite 175 Stamford, CT 06902 Re: Review of The Landmark at Talbot Park Philadelphia Dallas Lake
REAL ESTATE MARKET OVERVIEW 1 st Half of 2015
 REAL ESTATE MARKET OVERVIEW 1 st Half of 2015 With Comparisons to the 2 nd Half of 2014 September 4, 2015 Prepared for: First Bank of Wyoming Prepared by: Ken Markert, AICP MMI Planning 2319 Davidson Ave.
HOUSING ELEMENT GOALS, OBJECTIVES, & POLICIES
 HOUSING ELEMENT GOALS, OBJECTIVES, & POLICIES GOAL H-1: ENSURE THE PROVISION OF SAFE, AFFORDABLE, AND ADEQUATE HOUSING FOR ALL CURRENT AND FUTURE RESIDENTS OF WALTON COUNTY. Objective H-1.1: Develop a
WELLSVILLE AFFORDABLE HOUSING PLAN
 WELLSVILLE AFFORDABLE HOUSING PLAN 2014 DRAFT 2.2 Wellsville: Affordable Housing Plan 2014 Page 2 DRAFT 2.2 Wellsville: Affordable Housing Plan 2014 Table of Contents Summary of Affordable Housing Conditions...
P o p u l a t i o n, L a n d U s e, a n d Z o n i n g
 P o p u l a t i o n, L a n d U s e, a n d Z o n i n g The Town of Upper Marlboro is located only 15 miles southeast of the District of Columbia, in the central portion of Prince George s County in the
REGIONAL. Rental Housing in San Joaquin County
 Lodi 12 EBERHARDT SCHOOL OF BUSINESS Business Forecasting Center in partnership with San Joaquin Council of Governments 99 26 5 205 Tracy 4 Lathrop Stockton 120 Manteca Ripon Escalon REGIONAL analyst april
Developing a Comprehensive Plan. New York State Department of State Office of Coastal, Local Government & Community Sustainability
 Developing a Comprehensive Plan New York State Department of State Office of Coastal, Local Government & Community Sustainability What is a Comprehensive Plan? Expression of a goals and recommended actions
housing element of the general plan Approved and Adopted April 2011
 1 public hearing draft housing element of the general plan Approved and Adopted April 2011 ABSTRACT This report contains text that amends the Housing Element of the 1993 General Plan Refinement. It also
Housing Needs in Burlington s Downtown & Waterfront Areas
 Housing Needs in s Downtown & Waterfront Areas Researched and written by Vermont Housing Finance Agency for the City of Planning & Zoning Department 10/31/2011 Contents Introduction... 2 Executive Summary...
Chapter 10: Implementation
 Chapter 10: Introduction Once the Comprehensive Plan has been adopted by the City of Oakdale, the City can begin to implement the goals and strategies to make this vision a reality. This chapter will set
DRAFT DOWNTOWN DANBURY TRANSIT-ORIENTED DEVELOPMENT STUDY CITY OF DANBURY, CT MAY 2018 APPENDIX A REAL ESTATE MARKET ANALYSIS
 DRAFT DOWNTOWN DANBURY TRANSIT-ORIENTED DEVELOPMENT STUDY CITY OF DANBURY, CT MAY 2018 APPENDIX A REAL ESTATE MARKET ANALYSIS M E M O R A N D U M TO: FROM: RE: Goody Clancy Associates W-ZHA Economic Framework
HOUSING ELEMENT TABLE OF CONTENTS INTRODUCTION...HO- 1 BAINBRIDGE ISLAND SNAPSHOT: PEOPLE AND HOUSING.. HO-1
 HOUSING ELEMENT TABLE OF CONTENTS PAGE INTRODUCTION...HO- 1 BAINBRIDGE ISLAND SNAPSHOT: PEOPLE AND HOUSING.. HO-1 GMA GOAL AND REQUIREMENTS FOR HOUSING. HO-1 HOUSING NEEDS..HO-2 HOUSING ELEMENT VISION...HO-3
Palmerton Area Comprehensive Plan
 DRAFT Palmerton Area Comprehensive Plan Bowmanstown Borough, Lower Towamensing Township, Palmerton Borough and Towamensing Township Carbon County, Pennsylvania Draft - With Minor Revisions - March 2008
Pierce County Comprehensive Plan Review
 2015-2016 Pierce County Comprehensive Plan Review March 16, 2016 Introduction Planning and Management Policies Some of the policies governing both the planning and management of growth and change within
Document under Separate Cover Refer to LPS State of Housing
 Document under Separate Cover Refer to LPS5-17 216 State of Housing Contents Housing in Halton 1 Overview The Housing Continuum Halton s Housing Model 3 216 Income & Housing Costs 216 Indicator of Housing
Bridgeland-Riverside Area Redevelopment Plan (ARP)
") Bridgeland-Riverside Area Redevelopment Plan (ARP) The current Bridgeland-Riverside Area Redevelopment Plan (ARP) was approved in 1980. Since then, a lot of changes have taken place in the city and the
Bridgeland-Riverside Area Redevelopment Plan (ARP) The current Bridgeland-Riverside Area Redevelopment Plan (ARP) was approved in 1980. Since then, a lot of changes have taken place in the city and the
Comprehensive Plan /24/01
 IV The is a central component of the Comprehensive Plan. It is an extension of the general goals and policies of the community, as well as a reflection of previous development decisions and the physical
CHAPTER 2: PEOPLE AND THEIR HOMES
 2 CHAPTER 2: PEOPLE AND THEIR HOMES 1kf guts prep.indd 14 3/2/06 1:13:07 PM DANE COUNTY IS DIVERSE The 426,000 people who live in Dane County 6 are in a word diverse. There are people of all ages and families
Comprehensive Plan Amendment #PLN , Reserve at Cannon Branch (Coles Magisterial District)
") COUNTY OF PRINCE WILLIAM 5 County Complex Court, Prince William, Virginia 22192-9201 PLANNING (703) 792-7615 FAX (703) 792-4758 OFFICE Internet www.pwcgov.org Christopher M. Price, AICP Director of Planning
COUNTY OF PRINCE WILLIAM 5 County Complex Court, Prince William, Virginia 22192-9201 PLANNING (703) 792-7615 FAX (703) 792-4758 OFFICE Internet www.pwcgov.org Christopher M. Price, AICP Director of Planning
Housing Market Update
 Housing Market Update March 2017 New Hampshire s Housing Market and Challenges Market Overview Dean J. Christon Executive Director, New Hampshire Housing Finance Authority New Hampshire s current housing
H o u s i n g N e e d i n E a s t K i n g C o u n t y
 1999 2000 2001 2002 2003 2004 2005 2006 2007 2008 2009 2010 Number of Affordable Units H o u s i n g N e e d i n E a s t K i n g C o u n t y HOUSING AFFORDABILITY Cities planning under the state s Growth
Housing, Retail and Arts
 Summary of Findings & Conclusions West Oakland Specific Plan Market Opportunity Report: Housing, Retail and Arts Prepared for City of Oakland Under subcontract to JRDV Architects DECEMBER 2011 Summary
CHAPTER 4: MODERATE INCOME HOUSING ELEMENT
 The Utah Municipal Code, -9a-()(a)(iii) requires that all cities adopt a Plan for Moderate Income Housing as part of their General Plan. Section -9a-() of the Utah Municipal Code, outlines that this Plan
Community & Infrastructure Services Committee
 REPORT TO: DATE OF MEETING: September 12, 2016 Community & Infrastructure Services Committee SUBMITTED BY: Alain Pinard, Director of Planning, 519-741-2200 ext. 7319 PREPARED BY: Natalie Goss, Senior Planner,
Comparative Housing Market Analysis: Minnetonka and Surrounding Communities
 Comparative Housing Market Analysis: Minnetonka and Surrounding Communities Prepared by Mark Huonder, Eric King, Katie Knoblauch, and Xiaoxu Tang Students in HSG 5464: Understanding Housing Assessment
DRAFT Plan Incentives. Part A: Basic Discount
 DRAFT 2030 Plan Incentives July 26, 2006 Part A: Basic Discount In order for a development to be eligible for any 2030 Land Resource Management Plan Discounts it must be located in the Urban Corridor and
APPENDIX C CHARACTERISTICS OF THE ENERGIZE PHOENIX CORRIDOR
 APPENDIX C CHARACTERISTICS OF THE ENERGIZE PHOENIX CORRIDOR BACKGROUND ON RESIDENTIAL AND COMMERCIAL BUILDINGS IN THE EP CORRIDOR The 10-mile EP corridor (Figure G1) is a highly diverse, mixed-use L-shaped
INCENTIVE POLICY FOR AFFORDABLE HOUSING
 INCENTIVE POLICY FOR AFFORDABLE HOUSING PREPARED BY: CITY OF FLAGSTAFF S HOUSING SECTION COMMUNITY DEVELOPMENT DIVISION OCTOBER 2009 2 1 1 W e s t A s p e n A v e. t e l e p h o n e : 9 2 8. 7 7 9. 7 6
THAT Council receives for information the Report from the Planner II dated April 25, 2016 with respect to the annual Housing Report update.
 Report to Council Date: April 25, 2016 File: 1200-40 To: From: Subject: City Manager Laura Bentley, Planner II, Policy & Planning Annual Housing Report Update Recommendation: THAT Council receives for
DOWNTOWN SPECIFIC PLAN
 DOWNTOWN SPECIFIC PLAN AGENDA OVERVIEW Goals & Objectives Opportunity Sites Market Analysis Next Steps GOALS & OBJECTIVES Create a Specific Plan that paves the way for at least 10,000 places to live in
POPULATION FORECASTS
 POPULATION FORECASTS Between 2015 and 2045, the total population is projected to increase by 373,125 residents to reach 2.2 million. Some areas will see major increases, while other areas will see very
CITY OF CLAREMONT MASTER PLAN 2017 CHAPTER 6: HOUSING
 CITY OF CLAREMONT MASTER PLAN CHAPTER 6: HOUSING Prepared by the Claremont Planning Board and the Claremont Planning and Development Department Vision Claremont Master Plan Chapter 6: Housing Quality housing
resilient grand haven Charter Township
 resilient grand haven Charter Township Grand Haven Charter Township 2016 Master Plan executive summary This plan was prepared by the Land Information Access Association (LIAA) as part of the Resilient
Summary of Findings. Community Conversation held November 5, 2018
 Summary of Findings Housing and the Future of Lebanon: What types of homes do we need in Lebanon to have a thriving community for all who live or work here? Community Conversation held November 5, 2018
HOUSING ELEMENT Inventory Analysis
 HOUSING ELEMENT Inventory Analysis 2.100 INVENTORY Age of Housing Stock Table 2.25 shows when Plantation's housing stock was constructed. The latest available data with this kind of breakdown is 2010.
Town of Washington, New Hampshire Master Plan 2015
 OVERVIEW OF CURRENT SITUATION: Currently the town consists of one zoning district. The Land Use Ordinance allows a single family or duplex home on a four- acre lot or on a previously approved non- conforming
June 12, 2014 Housing Data: Statistics and Trends
 June 12, 214 Housing Data: Statistics and Trends This presentation was provided to the Mayor s Housing Commission on June 12, 214 and provided to Council on June 23, 214 along with a report summarizing
Existing Conditions: Economic Market Assessment
 Existing Conditions: Economic Market Assessment Introduction The US 24/40 Corridor Study examined existing conditions as they related to economic and commercial market assessments, existing land use, and
Chapter 12 Changes Since This is just a brief and cursory comparison. More analysis will be done at a later date.
 Chapter 12 Changes Since 1986 This approach to Fiscal Analysis was first done in 1986 for the City of Anoka. It was the first of its kind and was recognized by the National Science Foundation (NSF). Geographic
CITY OF PORTSMOUTH. CITY COUNCIL POLICY No HOUSING POLICY
 CITY OF PORTSMOUTH CITY COUNCIL POLICY No. 2016-03 HOUSING POLICY WHEREAS, the goals of the City of Portsmouth, as expressed in its 2025 Master Plan, include encouraging walkable mixed-use development,
Planning Department Oconee County, Georgia
 Planning Department Oconee County, Georgia STAFF REPORT REZONE CASE #: 6985 DATE: October 31, 2016 STAFF REPORT BY: Andrew C. Stern, Planner APPLICANT NAME: Williams & Associates, Land Planners PC PROPERTY
Addressing the Impact of Housing for Virginia s Economy
 Addressing the Impact of Housing for Virginia s Economy A REPORT FOR VIRGINIA S HOUSING POLICY ADVISORY COUNCIL NOVEMBER 2017 Appendix Report 2: Housing the Commonwealth's Future Workforce 2014-2024 Jeannette
The Texas 2005 Profile of Home Buyers and Sellers. Prepared by: NATIONAL ASSOCIATION OF REALTORS Research Division
 The Texas 2005 Profile of Home Buyers and Sellers Prepared by: NATIONAL ASSOCIATION OF REALTORS Research Division February, 2006 The 2005 NATIONAL ASSOCIATION OF REALTORS Profile of Home Buyers and Sellers
Residential. Infill / Intensification Development Review
 Residential Infill / Intensification Development Review How Best to Manage The Compatible Integration of New Housing Within Established Residential Neighbourhoods Identification of Issues Privacy/overlook/height
Town of Bethlehem 20/20 Advisory Committee. Committee Meeting March 14, 2008 Elsmere Fire House, Poplar Drive 7:45 9:30 a.m.
 Town of Bethlehem 20/20 Advisory Committee Committee Meeting March 14, 2008 Elsmere Fire House, Poplar Drive 7:45 9:30 a.m. Agenda 1. Co-Chair Report Terri Egan and Ken Ringler 2. Town of Bethlehem Comp
Eleven Tindall Road Middletown, New Jersey 07748
 MASTER PLAN REVISION TO THE HOUSING PLAN ELEMENT AND FAIR SHARE PLAN AMENDMENT MANALAPAN TOWNSHIP MONMOUTH COUNTY, NEW JERSEY NOVEMBER 24, 2008 REVISED APRIL 9, 2010 PREPARED FOR: MANALAPAN TOWNSHIP PLANNING
Downtown Housing Policy
 Downtown Housing Policy Background The Downtown Development Authority (DDA) has requested that city staff and other interested Commissions and Boards assist it in developing a Housing Policy to apply within
Trends in Housing Occupancy
 This bulletin is one in a series of background bulletins to the Official Plan Review. It provides an analysis of changes in household composition and housing occupancy between 1996 and 2006. A copy of
Gold Beach Buildable Lands Analysis
 Gold Beach Buildable Lands Analysis Final Report Submitted to: City of Gold Beach Prepared by: Community Planning Workshop Community Service Center 1209 University of Oregon Eugene, OR 97403-1209 http://darkwing.uoregon.edu/~cpw
BUILD-OUT ANALYSIS GRANTHAM, NEW HAMPSHIRE
 BUILD-OUT ANALYSIS GRANTHAM, NEW HAMPSHIRE A Determination of the Maximum Amount of Future Residential Development Possible Under Current Land Use Regulations Prepared for the Town of Grantham by Upper
CITY OF PORT HURON, MICHIGAN EXECUTIVE SUMMARY OF THE TARGET MARKET ANALYSIS STUDY CONDUCTED BY ZIMMERMAN/VOLK ASSOCIATES, INC.
 CITY OF PORT HURON, MICHIGAN EXECUTIVE SUMMARY OF THE TARGET MARKET ANALYSIS STUDY CONDUCTED BY ZIMMERMAN/VOLK ASSOCIATES, INC. 2007 EXECUTIVE SUMMARY TARGET MARKET ANALYSIS PURPOSE: The purpose of this
VISION 2030: Terrebonne s Plan for Its Future 3 1
 VISION 2030: Terrebonne s Plan for Its Future 3 1 CHAPTER 3 POPULATION AND LAND USE TRENDS POPULATION TRENDS INTRODUCTION The single most important determinant of land use and land use trends over time
Annual (2013) Review of the Surrey Official Community Plan
 Review of the Surrey Official Community Plan") CORPORATE REPORT NO: R118 COUNCIL DATE: JUNE 23, 2014 REGULAR COUNCIL TO: Mayor & Council DATE: June 23, 2014 FROM: General Manager, Planning and Development FILE: 6440-01 SUBJECT: Annual (2013) Review
CORPORATE REPORT NO: R118 COUNCIL DATE: JUNE 23, 2014 REGULAR COUNCIL TO: Mayor & Council DATE: June 23, 2014 FROM: General Manager, Planning and Development FILE: 6440-01 SUBJECT: Annual (2013) Review
Community Revitalization Efforts 2016 Thresholds and Scoring Criteria
 s 2016 Thresholds and Scoring Criteria Definitions: a deliberate, concerted, and locally approved plan or documented interconnected series of local approvals and events intended to improve and enhance
4 LAND USE 4.1 OBJECTIVES
 4 LAND USE The Land Use Element of the Specific Plan establishes objectives, policies, and standards for the distribution, location and extent of land uses to be permitted in the Central Larkspur Specific
Housing Indicators in Tennessee
 Housing Indicators in l l l By Joe Speer, Megan Morgeson, Bettie Teasley and Ceagus Clark Introduction Looking at general housing-related indicators across the state of, substantial variation emerges but
Connecticut First Nine Months Housing Report 2014
 Connecticut First Nine Months Housing Report 2014 First Nine Months of 2014 Highlight Positive Outlook for Multi-family Home Construction Millennial buyers are finally increasing their rate of household
November An updated analysis of the overall housing needs of the City of Aberdeen. Prepared by: Community Partners Research, Inc.
 City of Aberdeen HOUSING STUDY UPDATE November 2010 An updated analysis of the overall housing needs of the City of Aberdeen Prepared by: Community Partners Research, Inc. nd 10865 32 Street North Lake
PLANNING FOR OUR FUTURE
 PLANNING FOR OUR FUTURE ELLSWORTH TOWNSHIP LAND USE AND POLICY PLAN The purpose of this Plan is to serve as a guide for the Township Trustees, Zoning Commission, Board of Zoning Appeals, developers, employers,
Open Space. Introduction. Vision. Defining Open Space. Midway City 2017 General Plan
 Open Space Midway City 2017 General Plan Introduction The importance of preserving open space to meet the goals and objectives of the General Plan cannot be overstated. Indeed, references to preserving
HOUSING ELEMENT GOALS, OBJECTIVES, AND POLICIES
 HOUSING ELEMENT GOALS, OBJECTIVES, AND POLICIES GOAL 1: To promote the preservation and development of high-quality, balanced, and diverse housing options for persons of all income levels throughout the
3. FISCAL IMPACT ANALYSIS FISCAL IMPACT ANALYSIS 29
 3. FISCAL IMPACT ANALYSIS FISCAL IMPACT ANALYSIS 29 The purpose of fiscal impact analysis is to estimate the impact of a development or a land use change on the budgets of governmental units serving the
CHAPTER 2 VACANT AND REDEVELOPABLE LAND INVENTORY
 CHAPTER 2 VACANT AND REDEVELOPABLE LAND INVENTORY CHAPTER 2: VACANT AND REDEVELOPABLE LAND INVENTORY INTRODUCTION One of the initial tasks of the Regional Land Use Study was to evaluate whether there is
TOWN OF BROOKLINE, NEW HAMPSHIRE
 TOWN OF BROOKLINE, NEW HAMPSHIRE BUILDOUT ANALYSIS DECEMBER, 2003 Prepared by the Nashua Regional Planning Commission TABLE OF CONTENTS Introduction... 1 I. Methodology... 1 A. PARCEL REVIEW... 1 B. DEVELOPMENT
TOWN OF MIDDLEBOROUGH COMMUNITY PRESERVATION PLAN
 TOWN OF MIDDLEBOROUGH COMMUNITY PRESERVATION PLAN Vision The residents of Middleborough desire a community which is family-oriented and which retains its small town character while preserving an abundance
Market Segmentation: The Omaha Condominium Market
 Market Segmentation: The Omaha Condominium Market Roger P. Sindt Steven Shultz University of Nebraska at Omaha Introduction A highly visible and growing niche in the homeownership market is the condominium
DRAFT Housing Technical Bulletin
 DRAFT Housing Technical Bulletin This guidance is intended to clarify how the Housing Goal and Objectives of the Regional Policy Plan (RPP) are to be applied and interpreted in Cape Cod Commission Development
VISION 2030: Terrebonne s Plan for Its Future 5 1
 VISION 2030: Terrebonne s Plan for Its Future 5 1 INTRODUCTION CHAPTER 5 HOUSING ELEMENT The need for affordable housing in Terrebonne Parish is growing. Housing development on usable land in the southern