The Economic Development and Fiscal Vitality chapter includes many policies and programs to implement these objectives.
|
|
|
- Norman Parrish
- 5 years ago
- Views:
Transcription
1 4 A complete understanding of economic trends and projections serves as a foundation for the General Plan Update. This chapter begins with a summary of the local policies and plans related to Novato s economy. This chapter then discusses local employment and resident labor force trends, summarizes projections for the housing market and analyzes characteristics of the office, industrial and retail market in Novato. The chapter concludes with a supportable, square-feet analysis that examines the leakage of sales to neighboring communities and identifies the potential for Novato to recapture leaked sales and support additional retail space. A. Regulatory Framework 1. Novato General Plan The existing General Plan includes an Economic Development and Fiscal Vitality chapter that addresses Novato s economy. The chapter establishes the following seven objectives: 1. Foster economic development; 2. Maximize the capacity for employment-generating uses in areas designated for non-retail business; 3. Encourage businesses, particularly targeted businesses that provide a variety of employment opportunities; 4. Retain and attract businesses; 5. Revitalize the Downtown area; 6. Encourage sustainable local economic activity; and 7. Focus future City policymaking on the relationship between workplace uses and Novato s fiscal condition. The Economic Development and Fiscal Vitality chapter includes many policies and programs to implement these objectives. 2. City of Novato Strategic Plan Novato s economy is addressed in the Sustainable Community section of the Community Strategic Plan. As it relates to the local economy, the Community Strategic Plan includes the following vision statements: 1. A community with a stable economy and a strong, diverse tax base; 2. A community with a vibrant, lively and dynamic Downtown; 3. A community that provides residents with a full spectrum of jobs and housing so that those living here may be locally employed, and those working here are able to afford local housing; and 4. A community that is a tourist destination. The Community Strategic Plan includes a number of objectives to help realize this vision. 4-1
2 3. Downtown Novato Specific Plan The Downtown Novato Specific Plan includes a Mission Statement and a series of goals that relate to the City s economy in a number of ways. The Mission Statement states that Downtown should be Novato s thriving multi-faceted economic hub; should serve as a social, cultural, historical and cultural center; and should attract people for commerce and community affairs from Novato and the surrounding region. Economy-related goals include encouraging more Downtown promotions, extending business hours, initiating a local marketing campaign and drawing in more businesses, among others. 4. Economic Development Strategy Novato prepared the Economic Development Strategy in 2005 to focus City efforts on key ways to support and expand the local economy. The Economic Development Strategy focuses on three goals: 1. Improve organizational effectiveness and efficiency; 2. Broaden the City s economic base, enhance revenues and balance expenditures with revenues; and 3. Revitalize the Downtown. The Economic Development Strategy recommends 17 specific strategies to achieve these goals. Suggested strategies include streamlining the permit approval process, preparing a plan for the Redwood Boulevard corridor and selling certain City-owned sites in the Hamilton area, among many others. B. Local Employment This section discusses employers located in Novato and Marin County. Employment patterns of Novato residents are discussed in Section C below. 1. Major Employers Novato s largest employers include BioMarin Pharmaceuticals (850 employees), the Novato Unified School District (771 employees) and the Fireman s Fund Insurance Company (750 employees). The city s top 14 employers comprise a mix of industries, ranging from medical and professional services to public agencies and large retailers (see Table 4-1). The Buck Institute for Research on Aging, with approximately 272 employees, also represents a major Novato employer. An independent 501(c)(3) nonprofit organization, the Institute has a $38 million annual operating budget, and recently completed a new stem cell research center, partially funded by the California Institute for Regenerative Medicine. 2. Employment by Sector Novato benefits from a gradually expanding economy, with rising employment and growing industry diversification. Novato generates approximately 20% of Marin County s economic value, and saw jobs gains over the past decade and in a broad array of sectors. Health care, private education and professional/scientific services lead the way. Specifically, Sutter Health significantly expanded its presence in Novato and purchased two, 100,000 square foot buildings adjacent to Novato s hospital in order to accommodate its needs to expand medical office space. Biotechnology is also thriving in Novato. BioMarin has spawned startups with former executives launching Raptor Pharmaceuticals and most recently Ultragenyx; MarinBiologic also launched in Novato. In 2012, the Buck Institute 4-2
3 completed a 60,000 square foot expansion project on its 488 acre Novato campus. Expansion in these sectors reflects job growth in well-paying, high skilled jobs offsetting losses in retail and finance/insurance industries. 1 According to the Association of Bay Area Governments, Novato is home to about 24,200 employed residents and the city provides approximately 20,900 jobs. Jobs are concentrated in Health, Educational and Recreational Services (31 percent) and Financial and Professional Services (30 percent). Retail jobs comprised about 12 percent of all jobs in Novato. Overall, the Marin County job concentrations in the various sectors were similar to those found in Novato (see Table 4-2). TABLE 4-1 MAJOR EMPLOYERS, NOVATO, 2013 a Number of Company/Organization Employees Industry Type BioMarin Pharmaceuticals b 850 Pharmaceuticals Novato Unified School District 771 School District Fireman s Fund 750 Insurance Novato Community Hospital 289 Hospital Buck Institute for Research on Aging 272 Medical Research Frank Howard Allen, Realtors b 248 Real Estate W. Bradley Electric 230 Electrical Contractors Brayton Purcell LLP 209 Legal Services Bank of Marin b 197 Banking City of Novato 187 Government Cagwin & Dorward b 182 Landscape Contracting Costco Wholesale c 120 Retail Safeway c 120 Food Sales Target c 100 Retail a This list represents the largest businesses and organizations based in Novato, employing at least 100 people. In 2013, over 3,100 businesses were registered as businesses within the City of Novato. b Novato-based employers with multiple locations in Marin County. On October 29, 2013, Frank Howard Allen was acquired by Coldwell Banker Residential Brokerage. c Number of employees working at Novato locations estimated using building size and data from the U.S. Energy Information Administration, Commercial Buildings Energy Consumption Survey, Sources: North Bay Business Journal Book of Lists, 2013; Novato Unified School District, 2013; Buck Institute for Aging, 2013; City of Novato, City of Novato Economic Report 2011; Marin Economic Forum. 4-3
4 TABLE 4-2 JOBS BY SECTOR IN NOVATO AND MARIN COUNTY, 2010 Number of Employees Percent of Total Novato Agriculture and Natural Resources 71 <1% Manufacturing, Wholesale and Transportation 1,363 7% Retail 2,510 12% Financial and Professional Services 6,268 30% Health, Educational, and Recreational Services 6,418 31% Other Jobs 4,263 20% Total 20, % Marin County Agriculture and Natural Resources 749 1% Manufacturing, Wholesale and Transportation 5,845 5% Retail 14,242 13% Financial and Professional Services 28,071 25% Health, Educational, and Recreational Services 37,595 34% Other Jobs 24,231 22% Total 110, % Source: Association of Bay Area Governments, Projections Preferred Scenario v20, May 24,
5 TABLE 4-3 JOB PROJECTIONS IN NOVATO AND MARIN COUNTY, 2010 TO 2035 Novato Total Change % Change Agriculture and Natural Resources (5) (7%) Manufacturing, Wholesale and Transportation 1,363 1,389 1,416 1,246 1, (419) (31%) Retail 2,510 2,523 2,537 2,538 2,540 2, % Financial and Professional Services 6,268 6,572 6,891 7,187 7,497 7,855 1,587 25% Health, Educational, and Recreational Services 6,418 6,690 6,973 7,111 7,251 7,432 1,014 16% Other Jobs 4,263 4,532 4,818 4,883 4,949 5, % Total 20,893 21,779 22,709 23,037 23,402 23,873 2,980 14% Marin County Agriculture and Natural Resources (56) (7%) Manufacturing, Wholesale and Transportation 5,845 5,896 5,948 5,304 4,731 4,143 (1,702) (29%) Retail 14,242 14,334 14,448 14,459 14,471 14, % Financial and Professional Services 28,071 29,950 31,971 33,398 34,893 36,658 8,587 31% Health, Educational and Recreational Services 37,595 39,318 41,124 42,005 42,906 44,069 6,474 17% Other Jobs 24,231 24,957 25,725 25,911 26,100 26,311 2,080 9% Total 110, , , , , ,377 15,643 14% Source: Association of Bay Area Governments, Projections Preferred Scenario v20, May 24,
6 3. Employment Projections Table 4-3 provides ABAG employment projections for Novato and Marin County. ABAG anticipates Novato will add 2,980 jobs through 2035, a 14 percent gain. The data show particular expansion among Financial and Professional Services and Health, Education and Recreational Services sectors. ABAG expects these categories to grow by 25 percent and 16 percent, respectively, over 25 years, the largest gains among all industries. The Retail category is expected to grow by just 1 percent, while the Agriculture and Natural Resources and Manufacturing, Wholesale and Transportation categories are projected to decline. Similar to Novato, Marin County jobs are concentrated in Health and Educational and Financial and Professional Services. Between 2010 and 2035, the largest job increases in the county are also projected to occur in these sectors. The total number of jobs in the county is expected to increase by 14 percent. 4. Jobs/Housing Ratio A healthy jobs/housing ratio increases opportunities for residents to work locally, decreasing congestion and commute time, and improving workers productivity and quality of life. Moreover, a strong and diversified local job base supports fiscal health, helping local governments endure fluctuations in different segments of the regional and national economies. For example, the municipal finances of bedroom communities with a limited amount of local employment were hit particularly hard by the downturn in the housing market and the corresponding decline in property tax revenue. Economists and land use planners often use the region as a benchmark for a healthy jobs/housing ratio, based on the notion that Bay Area employers generally draw their workforce from within the region. 2 ABAG estimates that the region had approximately 1.30 jobs per household in 2010, and projects this ratio to grow to 1.36 jobs per household by As shown in Table 4-4, Novato s jobs/housing ratio is lower than the regional figure, indicating a deficit of employment opportunities for residents. ABAG estimates the City had 1.03 jobs per household in 2010, and expects jobs to grow to 1.12 jobs per household in The jobs/housing ratio is slightly higher for Marin County. 2 Due largely to high home prices in the region, workers have increasingly been forced to super-commute from homes outside the Bay Area to local jobs. However, these workers still represent a relatively small share of total jobs in the Bay Area. 4-6
7 TABLE 4-4 POPULATION, HOUSEHOLD, AND JOB PROJECTIONS, 2010 TO 2035 Novato Total Change % Change Population 51,904 52,526 53,163 53,963 54,699 55,669 3,765 7% Households 20,279 20,472 20,679 20,878 21,070 21, % Jobs 20,893 21,779 22,709 23,036 23,402 23,873 2,980 14% Jobs/Housing Ratio Marin County Population 252, , , , , ,593 26,184 10% Households 103, , , , , ,543 7,333 7% Jobs 110, , , , , ,377 15,643 14% Jobs/Housing Ratio Bay Area Population 7,150,739 7,461,933 7,786,673 8,133,885 8,496,622 8,888,709 1,737,970 24% Households 2,608,023 2,720,444 2,837,710 2,952,969 3,072,910 3,188, ,319 22% Jobs 3,385,300 3,669,996 3,987,140 4,089,203 4,196,576 4,346, ,411 28% Jobs/Housing Ratio Sources: Association of Bay Area Governments, Projections Preferred Scenario v20, May 24, 2013; City of Novato Community Development Department,
8 TABLE 4-5 CIVILIAN RESIDENTS AGED 16 YEARS AND OLDER BY OCCUPATION, NOVATO, MARIN COUNTY AND BAY AREA, 2011 Occupation a Management, Business, Science, and Arts Occupations Number Novato Marin County Bay Area % of Total Number % of Total Number % of Total 10,931 43% 64,076 51% 1,556,464 45% Service Occupations 4,614 18% 18,586 15% 564,886 16% Sales and Office Occupations Natural Resources, Construction, and Maintenance Occupations Production, Transportation and Material Moving Occupations Total Employed Residents 6,511 25% 28,321 23% 804,540 23% 2,212 9% 8,202 7% 256,415 7% 1,354 5% 5,596 4% 284,323 8% 25, % 124, % 3,466, % a The U.S. Census defines the Labor Force as all employed persons, both civilian and in the armed unemployed persons who had been looking for work within the past four weeks, and were available to start a job, as well as those who were on temporary layoff from a job. Sources: U.S. Census Bureau, American Community Survey. C. Resident Labor Force Trends This section describes the types of jobs held by Novato residents and discusses the commute-to-work patterns of Novato residents and workers. 1. Occupations and Labor Force Participation Table 4-5 provides data on the occupations of Novato s residents (contrasting with jobs located in Novato, discussed in Section B) as well as unemployment rates. According to the American Community Survey, management, business, science and arts occupations are the most common occupations for Novato residents. Approximately 43 percent of employed residents held these jobs, compared to 51 percent in the county, and 45 percent for the Bay Area. At the same time, Novato residents held slightly more service, sales and office and construction jobs compared to the other geographies. In August 2013, an estimated 6.0 percent of Novato residents in the labor force were unemployed. This figure is higher than the county s 5.0 percent and the Bay Area s unemployed rate of 6.6 percent. 4-8
9 2. Commute-to-Work Patterns A key issue facing many suburban Bay Area communities is the pattern of out-commuting by residents to other locations for work, and the simultaneous in-commuting of workers to local jobs. These in- and out-commute patterns negatively affect the local quality of life through traffic congestion, time spent traveling and air quality and greenhouse gas emissions. Many cities and regions address this issue by seeking to establish a local job base that parallels residents skills and occupations. As shown in Table 4-6, Novato showed a generally equal balance between the number of employed residents (26,325) and local jobs (24,655) in Moreover, over 35 percent of Novato s employed residents worked in the city, a generally favorable ratio compared to many Bay Area suburbs. For example, 44 percent of San Rafael s employed residents, 24 percent of Sunnyvale s employed residents, and 35 percent of Walnut Creek s employed residents worked in their respective cities. Another 20 percent of Novato s employed residents worked in San Rafael, nearly 12 percent in San Francisco, and nearly 5 percent in large cities located in Sonoma County. Table 4-6 also shows that in 2008 over 37 percent of Novato jobs were held by residents, again a positive indicator of a good jobs/housing balance. In comparison, 28 percent of San Rafael jobs, 20 percent of Sunnyvale jobs, and 18 percent of Walnut Creek jobs were held by local residents. D. Residential Real Estate Chapter 3, Population and Housing, summarizes housing stock characteristics, sales prices, rental trends and housing affordability in Novato. This section discusses the outlook for the housing market in Novato, focusing on the demand for different housing types resulting from projected economic trends. After a prolonged economic recession and weak residential real estate market, Novato housing prices and sales volume began to recover in Underlying strengths in the Novato market suggest that the City can expect a continued recovery over the near-term to medium-term. Factors that support long-term demand for housing include a high quality of life, solidly-performing school district, relative proximity to various employment centers along the Highway 101 corridor and an expanding local job base. The planned SMART rail line may further bolster the city s appeal. As the market continues to rebound, Novato will likely see more production of higher-density product types, including townhomes and condominiums. These product types began to gain market acceptance in the last housing cycle, as shown by building permit trends. This trend will be particularly pronounced around Novato s Downtown and, potentially, the proposed SMART stations. 4-9
10 TABLE 4-6 NOVATO COMMUTE PATTERNS, 2008 Novato Residents to Place of Work a Number Percent Novato Workers from Place of Residence a Number Percent Novato 9, % Novato 9, % Unincorporated Areas and Small Cities in California b 5, % San Rafael 5, % Unincorporated Areas and Small Cities in California b Other Large Cities in California c 5, % 2, % San Francisco 3, % San Rafael 2, % Other Large Cities in California c 2, % Petaluma 1, % Petaluma % Rohnert Park 1, % Oakland % Santa Rosa % Santa Rosa % San Francisco % Rohnert Park % Vallejo % Out of State % Out of State % Total 26, % Total 24, % Novato Residents Out-Commuting 17, % Novato Workers In-Commuting 15, % a Workers 16 years and over; includes those who worked at home. b Unincorporated and Small Cities in California include Census Designated Places (CDPs) and cities with populations of less than 50,000. c Other Large Cities in California include CDPs and cities with population of 50,000 or more.. Source: US Census, American Community Survey , Census Transportation Planning Package (CTPP). 4-10
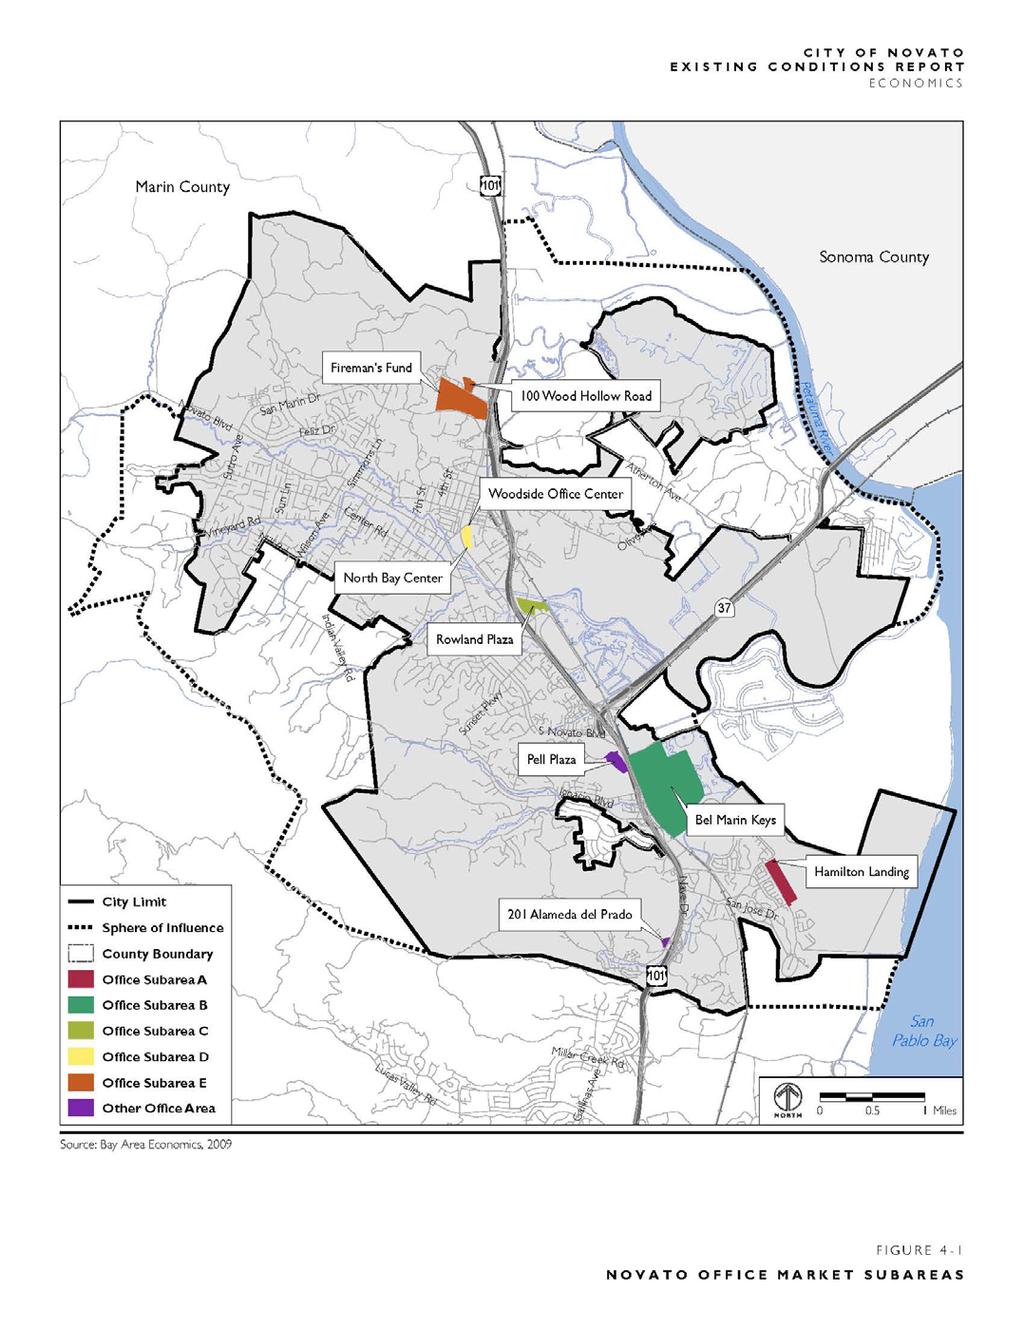
11 E. Office and Industrial Real Estate Market This section describes the office and industrial real estate market in Novato. Included in this section are an overview of the market, a description of five key subareas within the city and a discussion of the future outlook for the market. Included in the market outlook is an analysis of supportable office and industrial space in Novato by Market Overview Interviews with local brokers indicate that Novato has historically served as an attractive option for southern Marin County employers looking to expand to larger floorplates while maintaining a presence in the county. As an example of this process, a start-up firm may begin in a 5,000-square-foot space in Sausalito, expand to 30,000 square feet in San Rafael and then relocate to a 45,000-square-foot facility in Novato over its lifespan. Novato has successfully maintained this role as an expansion zone for Marin County employers due to its availability of land, access to affordable workforce housing and lower office lease rates. The City of Novato Economic Development Department reports that Novato contains approximately 3.4 million square feet of office space, with a vacancy rate of 18 percent as of October This rate represents a drop from a high of 21 percent one year prior, and remains in line with countywide trends, which show vacancies slowly decreasing over the last 12 months from 14 to 13 percent. The average asking lease rate in Novato during this time period was approximately $2.00/square-foot/month on a triple-net basis (NNN). 3 In comparison, Marin office submarkets closer to San Francisco are showing an increase in vacancies from 10 percent to 12 percent over the last twelve months but they have higher lease rates than Novato. The Southern Marin submarket, defined by NAIBT Commercial as Sausalito, Tiburon, and Mill Valley, has a vacancy rate of 12 percent and an average asking rate of $3.16/square-foot per month. Central Marin, encompassing Corte Madera, Greenbrae, and Larkspur, has a 7 percent vacancy rate and an average asking rate of $3.58/square-foot. Compared to Novato s office market, local brokers report that the City s industrial market remains more stable, thanks to the limited amount of industrial space in Novato. There is approximately 1.1 million square feet of industrial space with a vacancy rate of 4 percent and 1.5 million square feet of flex and specialty space with a vacancy rate of 7 percent. Lease rates average approximately $1.30/square foot for industrial space and $1.20/square foot for flex space. 2. Novato Subareas and Comparables The Novato office market is organized around five main subareas, shown in Figure 4-1: Hamilton Landing, Bel Marin Keys, Rowland Plaza, Central Novato and Northern Novato. a. Hamilton Landing With approximately 460,000 square feet of predominately Class B space, Hamilton Landing contains some of Novato s prime office properties. Lease rates are among the highest in the city, ranging from $2.35 to $2.50/square-foot, and the current vacancy rate is 34 percent. Major tenants in the area include Smith & Hawken, Take-Two Interactive, ImageMovers Digital and a division of Disney. 3 All commercial lease rates expressed as monthly, triple-net. Under a triple-net lease, the lessee pays taxes, insurance and maintenance fees in addition to rent.
12 b. Bel Marin Keys Bel Marin Keys primarily includes Class B and C office space, as well as industrial and office/industrial flex properties. In October 2013, vacancies were around 7 percent and lease rates averaged approximately $1.25/square-foot. Tenants include a mix of small professional office users, services and semi-industrial uses. Bel Marin Keys also contains the majority of Novato s industrial property inventory. BioMarin Pharmaceuticals, one of Novato s largest employers with 365 jobs, occupies approximately 300,000 square feet of office, manufacturing, and lab space in the area. c. Rowland Plaza Rowland Plaza, just north of the Vintage Oaks shopping center, has four primary Class B office buildings: 75 Rowland Way, with 80,000 square feet; 88 Rowland Way, with 58,000 square feet; 100 Rowland Way, with 53,000 square feet; and 101 Rowland Way, with 62,000 square feet. As October 2013, the vacancy rate was 25 percent, and lease rates were $2.25 to $2.40/square foot. In addition to this space, Sutter Medical also owns and currently occupies the Golden Gate Plaza buildings further north along Rowland Way. d. Central Novato Central Novato s main office properties include the Woodside Office Center and the North Bay Center, which collectively contain 134,000 square feet of space. The Woodside Office Center contains 89,000 square feet. There is a current vacancy rate of 24 percent and asking rate of $2.35/square foot. The North Bay Center has 45,000 square feet and a vacancy rate of 20 percent. The lease rate is $2.10/square-foot. Downtown Novato also contains a small amount of aging Class B and C office space mixed in with retail uses, generally ranging from 3,000 to 10,000 square feet, with a few larger buildings. There is a 6 percent vacancy rate for Downtown commercial space with lease rates ranging from $1.30 to $1.90/square-foot. e. Northern Novato The Northern Novato submarket is dominated by the Fireman s Fund campus, containing 714,000 square feet of Class A office space. With a lease extending to 2018, Fireman s Fund effectively acts as the lessor, subleasing space in smaller increments with asking rates ranging from $1.75 to $2.25/square foot. The current vacancy rate is 38 percent. Also in Northern Novato, 100 Wood Hollow Road contains 125,000 square feet of Class B office space, with a current vacancy rate of 38 percent and lease rate of $2.35/square foot. The Buck Center for Aging campus includes 249,000 square feet in four buildings, and capacity to build an additional 106,000 square feet in two buildings. In addition to these main subareas, Pell Plaza and 150 and 201 Alameda del Prado represent stand-alone properties that fall just outside of Novato s submarkets. Pell Plaza, a 165,000-square-foot office facility on the western side of the Highway 37/Highway 101 intersection, currently has approximately 62,000 square feet available with asking rates of $2.25/square-foot. 150 and 201 Alameda del Prado are fully-leased properties that contain 65,000 square feet of office space and 30,000 square feet of industrial space. 4-12
13
14 3. Outlook for Office and Industrial Markets a. Office The current economic climate will continue to depress office absorption and lease rates in Novato in the short term (i.e. up to three years). In particular, the city s large floorplate buildings, which historically served as an attractor for Marin County companies looking to expand, now prove more difficult to lease. In the medium- and long-term (i.e. five or more years), however, Novato will continue to serve as the Marin County destination for more mature companies looking for larger facilities. The City s current office stock could satisfy much of this demand. As another subcomponent of the local market, brokers report that more activity exists among smaller tenants seeking 1,000 to 3,000 square feet of space. While space in large buildings contributes to the City s high vacancy rates and depresses rents throughout Novato, there appears to be demand for more divisible Class A facilities with greater access to amenities in Downtown Novato and more options for smaller professional users. Proposed projects such as 999 Grant Avenue (20,000 square feet) speak to this demand segment. In the short-term, brokers state that these properties, if properly designed for flexibility and divisibility, can be successfully leased up at low rates (i.e. up to $1.75/square-foot), bringing in some tenants who would normally seek Class B space. As the commercial credit market begins to loosen, office condominiums could also satisfy the needs of smaller users. As another positive demand factor, the planned SMART stations in Novato will also increase the city s attractiveness as a location for new office space, in both large and small formats. Various studies show that well-designed facilities within walking distance to stations can expect a premium on lease rates. 4 In addition, shuttle systems can be established for major employment centers that are farther from the stations, such as the Fireman s Fund campus and Hamilton Landing. b. Industrial The outlook for industrial property in Novato appears mixed. As the current inventory shows relative stability and low vacancy rates, one commercial broker reported that Novato could support a measured addition of new industrial space. However, another broker stated that new industrial development would have a difficult time supporting local land values, and that any new flex-space facility would require a more office-heavy design in order to be financially feasible. Echoing this sentiment, another broker reported that Sonoma County has absorbed much of the North Bay s demand for industrial properties, due to higher land values in Marin. These comments suggest that a measured amount of new industrial facilities could occur in Novato in the medium- to long-term, targeting higher value R&D uses, rather than more logistics-oriented firms. In the short-term, however, Novato can expect little to no new development of industrial space, given the economic climate. c. Supportable Office and Industrial Space Table 4-7 shows estimates for supportable office and industrial space in Novato by 2035, based on employment projections generated by ABAG. Appendix A, Tables A-1 through A-3, contain the detailed methodology and notes behind this analysis. 4 Parsons Brinckerhoff, 2001, The Effect of Rail Transit on Property Values: A Summary of Studies. 4-14
15 ABAG employment projections suggest that Novato will add approximately 1,700 office-based jobs and will lose approximately 175 industrial-based jobs by 2035, based on assumptions regarding the share of new jobs in office and industrial space within each industry. These jobs translate into demand for approximately 481,000 square feet of office space and no additional square feet of industrial space. The City of Novato Economic Development Department estimates ongoing vacancies of 656,000 square feet of office space and 140,000 square feet of industrial and flex space in Novato. In addition, the City of Novato reports that no new office space is currently in the development pipeline. Subtracting vacancies and pipeline projects from gross demand suggests that there is no additional supportable demand for office or industrial space in the City through Despite employment growth projections in most job categories, existing office and industrial space vacancies, will be available to absorb the increased demand. Altogether, the inventory of existing office and industrial space accounts for 165 percent of the total projected new demand for office and industrial space through
16 TABLE 4-7 ESTIMATED SUPPORTABLE OFFICE AND INDUSTRIAL SPACE, NOVATO, Total Change Gross Supportable (SF) c Less Vacancy d Less Planned and Proposed e Net Supportable (SF) Total Jobs a 20,893 23,873 +2,980 Office Jobs b 8,332 10,021 +1, ,365 (656,000) 0 0 Industrial Jobs b 1,798 1,623 (175) (0) (140,000) 0 0 Total a Association of Bay Area Governments Sustainability Communities Strategy, Preferred Scenario, v20, May 24, b Based on BAE estimates of the percent of employees in different job sectors who work in office and industrial space. c Assumes an employee density of: 285 SF per office employee 400 SF per industrial employee d Based on vacancies reported by the City of Novato Economic Development Department, October Industrial space includes flex and specialty space. e As reported by the City of Novato. Sources: SCAG Employee Density Summary Report, 2001; BAE, 2008; Association of Bay Area Governments, Projections, 2013; City of Novato,
17 F. Retail Market This section describes the retail market in Novato, focusing on neighborhood shopping centers, Downtown Novato and the Vintage Oaks shopping center. This section includes an analysis of taxable sales in Novato and provides an estimate of the amount of additional square feet of retail that Novato can support by Market Overview Novato s retail inventory totaled 2.2 million square feet of space in 196 buildings, according to a Sperry Van Ness Report. An estimated 103,000 square feet is vacant for a city wide retail vacancy rate of 4.6 percent. The city has seen little new commercial construction over the last three years, adding Circle/Umpqua Bank (20,000 square feet) and Peet s Coffee (8, 015 square feet), both in Of space leased in 2010, the average annual triple net rental rates have hovered in the $21 to $22 per square foot range. a. Neighborhood Shopping Centers Novato s local-serving retail space is primarily oriented around fourteen neighborhood shopping centers distributed throughout the City. The location of these centers is shown in Figure 4-2. These centers total 850,000 square feet and have an average vacancy rate of 8.8 percent. Vacancies, however, are concentrated in three centers: The Square Shopping Center: 32,600 square feet Pacheco Plaza: 16,000 square feet San Marin Plaza: 7,200 square feet Of the 14 centers surveyed, 12 were built prior to The two new centers are the Village at Novato, which opened in 2006 and is anchored by Trader Joe s, and Hamilton Marketplace which opened in 2008 and is anchored by Safeway. Other grocery stores include a second Safeway, Lucky Supermarket, Paradise Foods, Whole Foods, and Grocery Outlet. b. Regional Shopping Centers i. Vintage Oaks Vintage Oaks is Novato s only regional shopping center, located just north of the Redwood Highway and Highway 37 intersection. The 620,000 square foot center hosts a mix of tenants that includes Costco, Target, Macy s Furniture, Ross and nearly 50 other retailers and restaurants. Vacancy here is very low at 0.5 percent (2,900 square feet of available space). As shown in Table 4-8, local shopping centers range in size from 20,000 to 134,000 square feet, and are anchored by a variety of grocery and drug stores. Interviews with local retail brokers indicate that Novato s strongest centers, such as Novato Fair Shopping Center and Hamilton Marketplace, perform well, with low vacancy rates. The Village at Novato is expected to perform well, once it is fully tenanted, due to the presence of strong anchors and supporting stores such as Trader Joe s, Starbucks and Pharmaca. Even less successful centers, such as the Nave Center and the Downtown Novato Shopping Center, feature relatively low vacancies. However, some of Novato s neighborhood centers do show opportunities for improvement. The Square Shopping Center, for example, has a 42 percent vacancy rate and relatively low lease rates. 4-17
18
19 TABLE 4-8 NOVATO SHOPPING CENTERS Name and Address LOCAL SHOPPING CENTERS Downtown Novato Shopping Center Grant Ave. Nave Shopping Center 1535 South Novato Blvd. Novato Fair Shopping Center 928 Diablo Ave. Pacheco Plaza a 366 Ignacio Blvd. San Marin Plaza a San Marin Dr. Novato Square Shopping Center c 2045 Novato Blvd. Ignacio Center Entrada Dr. The Village at Novato 7514 Redwood Blvd. Hamilton Marketplace 5720 Nave Dr. Rowland Plaza 44 Rowland Way Redwood Redwood Blvd. Tresch-Triangle Shopping Center 1559 S Novato Blvd Redwood 7049 Redwood Blvd. Del Prado Square Alameda Del Prado Total SF a Available SF Vacancy Rate Annual Lease Rate ($/SF) Year Built 105,781 5, % $ Lucky's, CVS, Noah's Bagels, Crabtree & Evelyn, U.S. Bank, Creekside Bakery 121,692 1, % $ Grocery Outlet, Post Office, Pini Hardware, Bike Shop, Acupuncture Clinic, California Grill, Cleaners 133,862 5, % $ Safeway, Rite Aid, Dollar Tree, Pet Food Express, Anytime Fitness, Radio Shack 71,670 16, % N/A 1967 Paradise Foods, Woodlands Pet Food, Boca Pizzeria, Video Place, Taki s Restaurant 70,257 7, % $ Harvest Market, Starbucks, Tuesday Morning, Mary s Pizza Shack, China Village, and Urban Escape Fitness. 78,272 32, % $ CVS, Oasis Natural Foods, Planet Beach Tanning, Salon, JJ s Pizza 32,839 1, % $ Dollar Tree, Hardware Store, Bike Hut, Red Boy Pizza, Techs to Go, Valley Floral 20,043 1, % N/A 2006 Trader Joe's Starbucks, Pharmaca 89,525 3, % N/A , % N/A 1989 CineMark Century Theaters 24, % N/A , % N/A 1963 Safeway, Jamba Juice, Peet's Coffee, Wells Fargo, Pet Food Express, Toast Café, Pasta Moto, Beauty Island Salon Back in Motion Spinal Decompression, Good & Fresh Buffet, Picket Fence Quilts Discount Vitamins, Genesis Dollar Store, Marin Treks, Beauty Center Salon 21, % N/A 1988 Marin Tile Company, North Bay Artworks, Pacific Mortgage 20, % N/A 1981 Farmers Insurance, Postal Annex, Round Table Pizza REGIONAL SHOPPING CENTER Vintage Oaks at Novato Vintage Way 620,379 2, % N/A Early 1990 s Costco, Target, Macy's Furniture Store., Old Navy, Sephora, Hop Monk, Francesca s Marshalls, Anne Taylor Loft, Sports Authority, Bath & Body Works, Panera Bread 4-19
20 c. Downtown Novato s retail inventory also includes Downtown, which has a mix of local-serving stores and eateries along Grant Avenue. In general, Grant Avenue remains a modest retail node for Novato, with the easternmost blocks of the avenue beginning to fulfill the area s potential as a specialty goods, entertainment and dining destination. Although the street has benefited from streetscape improvements, major vacancies such as 1107 Grant Avenue (the former Pini Hardware site), and assorted smaller vacancies that emerged with the economic downturn, detract from the vibrancy of Grant Avenue, especially west of Redwood Boulevard. 2. Outlook for Retail Market Novato is well served by neighborhood shopping centers, with a range of price points and locations targeting various segments of the community. Although some older centers could benefit from renovations and re-tenanting, the city s centers generally enjoy relatively low vacancies. Whole Foods on DeLong Avenue represents a key supplement to the City s local-serving retail supply. In addition, Paradise Food at Pacheco Plaza has established another important retail node for southeastern Novato. Meanwhile, Grant Avenue continues to suffer from low lease rates and high vacancies, with only the eastern part of the corridor showing signs of improvement. Viable future businesses for the Grant Avenue corridor include specialty goods, entertainment and dining to serve residents on the weekends and evenings and local employees during the workday. The Retail Supportable Square Foot Analysis in Section H below presents additional estimates of the amount and type of new retail space that Novato could support in upcoming years. G. Retail Sales Analysis This section provides a detailed review of taxable retail sales trends in Novato. 1. Distribution of Taxable Sales Table 4-9 shows taxable sales trends for Novato, Marin County and the State of California, with all figures adjusted to 2011 dollars. Both Marin and California data are included as benchmarks to evaluate the performance of Novato outlets. According to the California State Board of Equalization s Taxable Sales in California During 2011, 5 taxable sales in the City of Novato totaled 675.6, with million (or 87 percent of the total) in taxable retail sales. 6 By Comparison, Marin County had a total of 4.0 billion in taxable sales in 2011, with 77 percent (or $3.1 billion) in retail sales. The data indicate that the city receives a major portion of its taxable sales from two store categories: General Merchandise Stores and Gasoline Stations. Together, these two categories make up almost 42 percent of total taxable retail sales occurring in Novato. In 2011, General Merchandise stores alone made up almost 26 percent of all taxable retail sales is the most recent calendar year for which taxable retail sales by store type is available for both the City of Novato and Marin County. 6 Total taxable sales figures are composed of both taxable sales at other outlets, including manufacturing and wholesale sales. Retail sales figures do not include sales of nontaxable items, such as resale items, food for home consumption and prescription medications. 4-20
21 In comparison, the County receives only 9 percent of taxable retail sales in this category. The presence of Costco and Target in Novato account for this difference. With a limited number of competing locations in the trade area, these stores draw shoppers from southern Sonoma County and throughout Marin County. Gasoline stations stores make up another 16 percent of the City s total taxable retail sales, higher than the 12 percent share reported for the County. Other important taxable sales categories for Novato include Food Services and Drinking Place, Motor Vehicle & Parts Dealers, and Other Retail Stores. Other Retail includes a broad range of retailers with varying store formats, including sporting goods, office supply and book stores, and florists, among others. 2. Taxable Sales Trends Table 4-9 also shows taxable retail sales trends between 2000 and In absolute terms, Novato fared well compared to the County but performed significantly below State standards. Over this eleven-year period, Novato experienced an inflation-adjusted decrease in taxable retail sales of 11 percent. In comparison, taxable retail sales in the County declined by 18 percent, and declined statewide by 4 percent. Novato s largest gains appeared in the Gasoline Stations (145 percent), 7 Clothing & Clothing Accessory (32%) and Food & Beverage (20 percent) categories. The City lost sales in Building Material and Garden Equipment (-39 percent), Other Retail stores (-34 percent), General Merchandise (-31 percent), and Motor Vehicle & Parts Dealers (-27 percent), similar to countywide and statewide trends. The City lost sales tax revenue in Home Furnishings & Appliances (-14 percent), while the County experienced a slight decline in this category and the State increased sales by 34 percent. Other notable differences were much stronger gains statewide in Clothing & Clothing Accessories (78 percent) and Food Service & Drinking Places (19 percent). Examining these trends on a per capita basis accounts for population growth, allowing measurement of sales on an equal basis. As shown in Table 4-9, Novato experienced a decline of 18 percent in per capita taxable sales between 2000 and The county saw a slightly greater decline of 20 percent, while California as a whole experienced a 14 percent decrease. 7 The large increase in taxable sales from Service Stations is due to rising gas prices over this period. 4-21
22 TABLE 4-9 TAXABLE RETAIL SALES TRENDS IN NOVATO, MARIN AND CALIFORNIA, 2000 TO 2011, IN $1,000 S CITY OF NOVATO Novato Marin County California Retail Sales Category % Total % Change % Total % Change % Total % Change Total Taxable Sales a Clothing & Clothing Accessory $28,574 $37, % 31.8% $177,892 $280, % 57.5% $16,639,557 $29,600, % 77.9% General Merchandise $217,985 $150, % -30.8% $615,006 $273, % -55.6% $59,356,910 $48,219, % -18.8% Food & Beverage $40,816 $48, % 20.0% $243,490 $266, % 9.6% $23,798,006 $23,606, % -0.8% Food Services & Drinking Places $70,823 $72, % 2.5% $472,774 $445, % -5.8% $45,929,042 $54,755, % 19.2% Home Furnishings and Appliance $14,896 $12, % -13.5% $242,539 $240, % -0.8% $17,605,149 $23,578, % 33.9% Building Material and Garden Equipment $27,810 $17, % -38.5% $364,948 $254, % -30.4% $29,126,576 $26,064, % -10.5% Motor Vehicle & Parts Dealers b $99,213 $72, % -26.5% $722,507 $523, % -27.5% $73,472,538 $53,303, % -27.5% Gasoline Stations $38,390 $94, % 145.0% $236,992 $371, % 56.8% $32,650,288 $55,210, % 69.1% All Other Retail Stores $120,134 $79, % -33.6% $755,346 $468, % -37.9% $73,223,985 $41,180, % -43.8% Retail Stores Total $658,640 $586, % -10.9% $3,831,493 $3,134, % -18.2% $371,802,052 $355,518, % -4.4% Per Capita Taxable Sales c Clothing & Clothing Accessory $600 $ % -6.1% $719 $1, % -3.8% $491 $ % 61.0% General Merchandise $4,577 $2, % -15.9% $2,487 $1, % -18.3% $1,752 $1, % -26.5% Food & Beverage $857 $ % -16.5% $985 $1, % -9.6% $703 $ % -10.2% Food Services & Drinking Places $1,487 $1, % -3.7% $1,912 $1, % -5.5% $1,356 $1, % 7.9% Home Furnishings and Appliance $313 $ % -14.3% $981 $ % -9.0% $520 $ % 21.2% Building Material and Garden Equipment $584 $ % -1.9% $1,476 $1, % 0.7% $860 $ % -19.0% Motor Vehicle & Parts Dealers $2,083 $1, % 9.9% $2,922 $2, % -8.9% $2,169 $1, % -34.3% Gasoline Stations $806 $1, % 67.5% $958 $1, % 34.5% $964 $1, % 53.0% All Other Retail Stores $2,522 $1, % -21.1% $3,055 $1, % -16.5% $2,162 $1, % -49.1% Retail Stores Total $13,828 $11, % -5.8% $15,494 $12, % -7.7% $10,976 $9, % -13.5% a All sales dollars are $1,000 s. All figures for Novato and Marin County are inflated to 2011 dollars using the San Francisco-Oakland-San Jose Consumer Price Index (CPI) for all Urban Consumers; figures for California are inflated using the CPI calculated by the CA Department of Finance. b Includes health & personal care stores; sporting goods, hobby, book & music stores; florists; office supplies & stationery stores; gift, novelty and souvenir stores; used merchandise; other miscellaneous store retailers; and non-store retailers (electronic and mail-order retailers, kiosks and street vendors, vending machine operators, sales through infomercials, door-to-door sales and home delivery). c Population based on CA Department of Finance estimates. Sources: CA State Board of Equalization, 2013; Consumer Price Index, 2013; CA Department of Finance, 2013; City of Novato Community Development Department,
23 3. Comparison to Other Communities Table 4-10 summarizes Novato s per capita taxable sales compared to nearby cities for and the Bay Area for This analysis excludes Auto Dealers/Auto Supply stores and Service Stations, which are both atypical retail outlets, to examine retail activity on a more fine-grained level. For the purposes of this analysis, the Bay Area serves as a benchmark of potential taxable sales per capita, assuming the region is a relatively closed retail system, with limited sales leaking of being injected. The similarity between Novato and Bay Area household incomes also makes the region an effective comparison measure for this analysis. The data suggest that while Novato is performing at or above regional sales benchmarks in several categories, the City is lacking sales in others. As a key strength, General Merchandise outlets in Novato experience more than two times the Bay Area taxable sales per capita figure. In fact, due to the presence of Target and Costco, Novato outperforms all comparison cities with the exception of Corte Madera. Corte Madera s strong sales in this category can be attributed to the Nordstrom s and Macy s at the Village at Corte Madera. Novato food stores also outpace the Bay Area benchmark, due largely to the City s slightly higher household incomes. Notable under-performing categories in Novato include Home Furnishings & Appliances and Building Materials & Garden Equipment. Local taxable sales in these stores are less than half the regional benchmarks, and significantly lower than sales in Corte Madera, San Rafael and Santa Rosa, all cities with regional shopping centers. The lack of Novato stores in these categories, and the relative proximity of shopping options in San Rafael (e.g. Home Depot) and Corte Madera (e.g. Crate & Barrel, Z Gallerie, West Elm) account for the City s heavy sales leakage. Novato s major Home Furnishings/Appliances outlets include Macy s Furniture Store, CTW Designs (interior design wholesaler and retailer), and Soundvision (home entertainment system designer). Primary taxable sales generators in the Building Materials category include Novato Builders Supply and Pini Hardware. Clothing & Clothing Accessory stores in Novato also perform below the Bay area standard, achieving only $725 per capita in taxable sales, compared to $987 for the region. Again, multiple offerings in San Rafael s Northgate Mall and the Village and Town Center in Corte Madera are responsible for drawing apparel sales from Novato. Novato s strongest apparel retailers include Marshall s, Ross and Old Navy. Novato outlets in the Food Services and Drinking Places category generate $1,397 per capita in taxable sales, relative to a $1,781 for the Bay Area. All other comparison cities except Santa Rosa show higher per capita sales in this category. Once more, these trends point to retail leakage as residents spend their dining dollars in other communities. The city s main sales generators in this category include the Wildfox Restaurant, Moylan s Brewery, Chevy s and Boca. 4-23
24 TABLE 4-10 PER CAPITA TAXABLE RETAIL SALES IN NOVATO, COMPARABLE CITIES AND BAY AREA, 2011 Novato Petaluma Corte Madera San Rafael Santa Rosa Bay Area Clothing & Clothing Accessory $725 $1,051 $13,607 $670 $978 $987 General Merchandise $2,905 $579 $4,372 $1,002 $2,125 $1,300 Food & Beverage Stores $942 $1,102 $1,593 $1,302 $997 $689 Food Services and Drinking Places $1,397 $1,561 $4,223 $1,862 $1,370 $1,781 Home Furnishings and Appliances $248 $277 $3,853 $1,855 $987 $807 Building Material and Garden Equipment $329 $493 $748 $3,179 $935 $768 All Other Retail Stores $1,534 $1,417 $8,717 $2,492 $1,545 $1,277 Total a $8,080 $6,480 $37,111 $12,362 $8,936 $7,610 a Auto Dealers and Auto Supplies and Service Stations Groups excluded from per capita sales totals to more accurately compare intercity retail sales performance. Sources: California State Board of Equalization, 2013; California Department of Finance, 2013; City of Novato Community Development Department,
25 4. City of Novato 2013 Retail Market Analysis In 2013, the City completed a retail sales tax leakage study which estimated the amount of sales tax leakage for the city. The study estimated a retail leakage of $169.4 million in sales, with the largest leakage in Home Furnishings & Appliance Stores ($36.6 million) followed by Building Materials & Garden Equipment ($35.1 million). Other significant sales tax leakages occurred in Motor Vehicles & Part Dealers (($34.6 million), Food Services & Drinking Places ($20.9 million) and Clothing & Clothing Accessory Stores ($19.9 million). 5. Summary of Findings The analysis indicates that while Novato is experiencing a decrease in total taxable sales, sales are declining at a greater rate on a per capita basis. While Novato s pattern is more positive than Marin County as a whole, the City falls well below statewide trends, which show smaller decreases in sales on an absolute and per capita basis. The reasons for this pattern are not fully evident. As one factor, statewide household incomes have grown by 26 percent since 2000, a higher rate than Marin County s 19 percent income growth and Novato s 18 percent income growth. Additionally, Marin County and Novato may be leaking sales due to growing levels of online shopping. The Public Policy Initiative of California reports that broadband connectivity is correlated to income. Marin County and Novato both have higher incomes than California as a whole, which point to the possibility of more online purchases. As of 2011, 93 percent of California households with household income of $80,000 or more, had home access to a broadband connection, compared to only 58 percent of California households with household income under $40, These sales trends may also be related to the fact that the Bay Area economy was at a peak in 2000 due to the dot-com boom, which boosted the region more than California as a whole, and therefore inflated taxable sales in this year. As a final potential factor, the high cost of housing in Marin may require households to dedicate a greater share of household income for rent and mortgage payments, leaving less disposable income for retail goods. Comparisons of per capita sales with Marin County and other neighboring communities suggest that Novato is in fact leaking sales in key categories including Home Furnishings and Appliances, Building Materials, Food Services and Drinking Places, and Clothing & Clothing Accessory stores. This leakage is the result of attractive shopping options located in nearby communities and the absence of these options in Novato. H. Retail Supportable Square Feet Analysis This section examines the potential for Novato to recapture some of its leaking sales and support additional retail space in the city. Due to the large supply of neighborhood shopping centers in Novato, and the apparent leakage in comparison goods, this analysis focuses exclusively on community- and regional-oriented retail. 1. Methodology The supportable square feet analysis includes three primary steps, outlined below:
ECONOMIC CURRENTS. Vol. 4, Issue 3. THE Introduction SOUTH FLORIDA ECONOMIC QUARTERLY
 ECONOMIC CURRENTS THE Introduction SOUTH FLORIDA ECONOMIC QUARTERLY Vol. 4, Issue 3 Economic Currents provides an overview of the South Florida regional economy. The report presents current employment,
ECONOMIC CURRENTS. Vol. 5 Issue 2 SOUTH FLORIDA ECONOMIC QUARTERLY. Key Findings, 2 nd Quarter, 2015
 ECONOMIC CURRENTS THE Introduction SOUTH FLORIDA ECONOMIC QUARTERLY Economic Currents provides an overview of the South Florida regional economy. The report presents current employment, economic and real
4.11 POPULATION, HOUSING, AND URBAN DECAY
 4.11 This section discusses the existing population, housing conditions and urban decay in the project area as well as the associated impacts that could result from implementation of the East Washington
FOURTH QUARTER 2013 MARIN COUNTY OFFICE SPACE
 FOURTH QUARTER 2013 MARIN COUNTY OFFICE SPACE MARIN OFFICE SANTA ROSA OFFICE 1101 Fifth Avenue, Suite 230 San, CA 94901 2455 Bennett Valley Road, C200, Santa Rosa, CA 95404 Tel: 415.526.7676 Fax 415.526.7679
Key Findings: Market Analysis
 Key Findings: Market Analysis Prepared by: WTL+a Washington, DC On behalf of: HDR, Inc. & Why a Market Study? Evaluate factors affecting demand for new development Analyze market drivers for new investment
Real Estate Market Analysis
 One of the challenges facing the West Berkeley shuttle is to consider whether to expand the service beyond the current operations serving major employers, to a system that provides access to a more diverse
FOR SALE. San Marin Business Park Areas D1, E1 & E2 Novato, California. Unique Marin County Office Development Opportunity. Exclusive Listing Agents:
 FOR SALE San Marin Business Park Areas D1, & E2 Novato, California Unique Marin County Office Development Opportunity Exclusive Listing Agents: Haden Ongaro hongaro@ngkf.com 415.526.7649 CA RE License
ECONOMIC CURRENTS. Vol. 3, Issue 1. THE SOUTH FLORIDA ECONOMIC QUARTERLY Introduction
 ECONOMIC CURRENTS THE SOUTH FLORIDA ECONOMIC QUARTERLY Introduction Economic Currents provides an overview of the South Florida regional economy. The report contains current employment, economic and real
Single Tenant/NNN Leased Investment 1287, 1295 & 1345 Santa Rosa Avenue, Santa Rosa, CA Sonoma County
 FEATURES Single Tenant Leased Investment - lease in place since 2007 True NNN investment / Zero Management 4 legal parcels comprising 1.76± ac. Anchored by Empire Nissan of Santa Rosa Strong rental history
Commercial Real Estate Economic Impacts on Marin County, CA The Case of BioMarin s Expansion
 The Importance of Commercial Real Estate Economic Impacts on Marin County, CA July 2012 Executive Summary Lower tenant costs make commercial real estate easier to occupy. Policy makers should view vacant
2004 Survey of Downtown Evanston. Summary of Findings. Housing Trends Office Uses Retail, Restaurants, and Services Entertainment Uses
 City of Evanston, Planning Division 2100 Ridge Avenue, Third Floor (847) 866-2928 2004 Survey of Downtown Evanston Summary of Findings Housing Trends Office Uses Retail, Restaurants, and Services Entertainment
ECONOMIC CURRENTS. Vol. 3, Issue 3 SOUTH FLORIDA ECONOMIC QUARTERLY. Introduction
 ECONOMIC CURRENTS THE Introduction SOUTH FLORIDA ECONOMIC QUARTERLY Economic Currents provides an overview of the South Florida regional economy. The report presents current employment, economic and real
WASHINGTON TOWNSHIP ECONOMIC PROFILE
 WASHINGTON TOWNSHIP ECONOMIC PROFILE SECTION 5.0 INTRODUCTION Understanding the characteristics of a community s economy is important in the comprehensive planning process. The amount of land being used
Las Vegas Valley Executive Summary
 ARROYO MARKET SQUARE Las Vegas Valley Executive Summary Retail Market 4th Quarter 2013 THE DISTRICT AT GREEN VALLEY RANCH January 23, 2014 Re: Commercial Real Estate Survey: 4th Quarter, 2013 Dear Reader,
San Francisco Bay Area to Napa County Housing and Economic Outlook
 San Francisco Bay Area to 019 Napa County Housing and Economic Outlook Bay Area Economic Forecast Summary Presented by Pacific Union International, Inc. and John Burns Real Estate Consulting, LLC On Nov.
San Francisco Bay Area to Marin, San Francisco, and San Mateo Counties Housing and Economic Outlook
 San Francisco Bay Area to 019 Marin, San Francisco, and San Mateo Counties Housing and Economic Outlook Bay Area Economic Forecast Summary Presented by Pacific Union International, Inc. and John Burns
Retail Income Property with Mixed-Use Development Potential for Sale 1250 Mendocino Avenue, Santa Rosa, CA
 FEATURES $2,995,000 0.97 Acre Parcel with an 8,850± sf Income Producing Tenant, plus Multi- Residential Development Potential on Excess Land 8,850± sf Freestanding Retail Building (former grocery store)
INLAND EMPIRE REGIONAL INTELLIGENCE REPORT. School of Business. April 2018
 INLAND EMPIRE REGIONAL INTELLIGENCE REPORT April 2018 Key economic indicators suggest that the Inland Empire s economy will continue to expand throughout the rest of 2018, building upon its recent growth.
INLAND EMPIRE REGIONAL INTELLIGENCE REPORT
 INLAND EMPIRE REGIONAL INTELLIGENCE REPORT June 2016 EMPLOYMENT After a slow start to 2016, the Inland Empire s labor market returned to form, in recent job figures. Seasonally adjusted nonfarm employment
San Francisco Bay Area to Marin, San Francisco, and San Mateo Counties Housing and Economic Outlook
 San Francisco Bay Area to 2020 Marin, San Francisco, and San Mateo Counties Housing and Economic Outlook Economic Forecast Summary 2017 Presented by Pacific Union International, Inc. and John Burns Real
FOR SALE. Parkview Plaza $499,000. Property Information. 521 S Bartlett Rd Streamwood, IL 60107
 Property Information SF 9,050 Built 1978 Acres.78 Zoning C-2 Parking 52 Occupancy 78% Highlights High Visibility at Intersections S Bartlett Rd & Streamwood Blvd Complimentary Neighborhood Tenant Mix Upside
Existing Conditions: Economic Market Assessment
 Existing Conditions: Economic Market Assessment Introduction The US 24/40 Corridor Study examined existing conditions as they related to economic and commercial market assessments, existing land use, and
Summary. Houston. Dallas. The Take Away
 Page Summary The Take Away The first quarter of 2017 was marked by continued optimism through multiple Texas metros as job growth remained positive and any negatives associated with declining oil prices
San Francisco Bay Area to Alameda and Contra Costa Counties Housing and Economic Outlook
 San Francisco Bay Area to 2020 Alameda and Contra Costa Counties Housing and Economic Outlook Economic Forecast Summary 2017 Presented by Pacific Union International, Inc. and John Burns Real Estate Consulting,
>> Greater Los Angeles Retail Continues to Witness Declining Vacancy
 Research & Forecast Report GREATER LOS ANGELES RETAIL Accelerating success. >> Greater Los Angeles Retail Continues to Witness Declining Vacancy Greater Los Angeles Retail Market The Los Angeles Basin
RETAIL MARKET ANALYSIS
 RETAIL MARKET ANALYSIS Portland State University Despite the doom and gloom warnings of a retail apocalypse, the national story for retail is that things are stable. Nationwide vacancy is at 5.2 percent
Has The Office Market Reached A Peak? Vacancy. Rental Rate. Net Absorption. Construction. *Projected $3.65 $3.50 $3.35 $3.20 $3.05 $2.90 $2.
 Research & Forecast Report OAKLAND METROPOLITAN AREA OFFICE Q1 Has The Office Market Reached A Peak? > > Vacancy remained low at 5. > > Net Absorption was positive 8,399 in the first quarter > > Gross
San Francisco Bay Area to Santa Clara & San Benito Counties Housing and Economic Outlook
 San Francisco Bay Area to 019 Santa Clara & San Benito Counties Housing and Economic Outlook Bay Area Economic Forecast Summary Presented by Pacific Union International, Inc. and John Burns Real Estate
For the Reno MSA employment has historically been based largely on construction and the leisure and hospitality industry. The construction industry
 For the Reno MSA employment has historically been based largely on construction and the leisure and hospitality industry. The construction industry has lost almost 15,000 construction jobs since 2006,
Time for Retail to Take Stock
 Q1 2013 RETAIL LAS VEGAS NEVADA RESEARCH & FORECAST REPORT Time for Retail to Take Stock It is heartening to say, after five years of a bad economy, that the first quarter of 2013 s 119,649 square feet
Retail Income Property with Mixed-Use Development Potential for Sale 1250 Mendocino Avenue, Santa Rosa, CA
 FEATURES 0.97 Acre Parcel with an 8,850± sf Income Producing Tenant, plus Multi-Residential Development Potential on Excess Land 8,850± sf Freestanding Retail Building (former grocery store) High Traffic
Economic Indicators City of Oakland
 Economic Indicators City of Oakland PREPARED BY: THE OFFICE OF ECONOMIC AND WORKFORCE DEVELOPMENT CITY OF OAKLAND JULY 2014 CITY OF OAKLAND ECONOMIC INDICATORS 1 Introduction to Quarter 1, January March
Industrial Real Estate Portfolio
 Industrial Real Estate Portfolio Portfolio Coverage Page 7 6565 Echo Avenue, Reno, NV Property Summary Address: Size (SF): Office Finish: HVAC Space: Year Built: 2003 Site Area: 6565 Echo Avenue Reno,
100% LEASED MEDICAL OFFICE BUILDING
 100% LEASED MEDICAL OFFICE BUILDING Affluent San Francisco Bay Area Location Larkspur, California OFFERING MEMORANDUM Table of Contents Disclaimer 1 The Offering / Investment Highlights 2 Investment Overview
>> Greater Los Angeles Retail Starts 2016 On a Positive Note
 Research & Forecast Report GREATER LOS ANGELES RETAIL Accelerating success. >> Greater Los Angeles Retail Starts 2016 On a Positive Note Greater Los Angeles Retail Market The Los Angeles Basin retail market
FOR LEASE PROPERTY PROFILE AVAILABLE. Hesperian Blvd & West A St. DEMOGRAPHICS: BEDFORD PLAZA ASSOCIATES LOCATION
 FOR LEASE PROPERTY PROFILE AVAILABLE LOCATION Hesperian Blvd & West A St. AVAILABLE SPACE ±1,200-2,200 SF (Partial Shell) HIGHLIGHTS 86,311 SF Neighborhood Center Anchored by Mi Pueblo Grocery Busy Intersection
Economic Indicators 2018 MODESTO
 Economic Indicators 2018 MODESTO C A L I F O R N I A Economy and Outlook Modesto is gaining recognition as a land of opportunity within the greater California economy. Modesto offers high quality of life
San Francisco Bay Area to Santa Clara and San Benito Counties Housing and Economic Outlook
 San Francisco Bay Area to 2020 Santa Clara and San Benito Counties Housing and Economic Outlook Economic Forecast Summary 2017 Presented by Pacific Union International, Inc. and John Burns Real Estate
>> Greater Los Angeles Retail Continues to Witness Declining Vacancy
 Research & Forecast Report GREATER LOS ANGELES RETAIL Accelerating success. >> Greater Los Angeles Retail Continues to Witness Declining Vacancy Greater Los Angeles Retail Market The Los Angeles Basin
DRAFT REPORT. Residential Impact Fee Nexus Study. June prepared for: Foster City VWA. Vernazza Wolfe Associates, Inc.
 DRAFT REPORT Residential Impact Fee Nexus Study June 2015 prepared for: Foster City VWA Vernazza Wolfe Associates, Inc. Table of Contents I. EXECUTIVE SUMMARY... 4 Introduction... 4 Background... 4 Report
Shopping Center Occupancy Study of the Greater Hagerstown Area
 Shopping Occupancy Study of the Greater Hagerstown 2015 Prepared By City of Hagerstown Planning & Code Administration Department November 2015 Shopping Occupancy Study of the Greater Hagerstown - 2015
EXECUTIVE SUMMARY. Executive Summary Donald L Tucker Civic Center District Economic Development Study
 EXECUTIVE SUMMARY The overall Tallahassee/Leon County economy was not as negatively impacted by the Great Recession as was the State of Florida as a whole, because its economy is largely driven by State
>> Greater Los Angeles Retail Starts 2017 At A Slow Pace
 Research & Forecast Report GREATER LOS ANGELES RETAIL Q1 2017 Accelerating success. >> Greater Los Angeles Retail Starts 2017 At A Slow Pace Greater Los Angeles Retail Market The Los Angeles Basin retail
Housing, Retail and Arts
 Summary of Findings & Conclusions West Oakland Specific Plan Market Opportunity Report: Housing, Retail and Arts Prepared for City of Oakland Under subcontract to JRDV Architects DECEMBER 2011 Summary
Keegan & Coppin Company, Inc. ONCOR International. 3rd QUARTER 2015 SONOMA COUNTY SUBMARKETS QUARTERLY NEWSLETTER
 Keegan & Coppin Company, Inc. ONCOR International SONOMA COUNTY SUBMARKETS QUARTERLY NEWSLETTER 3rd QUARTER INSIDE THIS ISSUE: Market Highlights Notable Transactions Vacancy Trends Business Parks Petaluma
San Francisco Bay Area to Sonoma County Housing and Economic Outlook
 San Francisco Bay Area to 2020 Sonoma County Housing and Economic Outlook Economic Forecast Summary 2017 Presented by Pacific Union International, Inc. and John Burns Real Estate Consulting, LLC On Nov.
Retail Impact Study Proposed Oak Hills Marketplace City of Yucaipa
 DRAFT Proposed Oak Hills Marketplace City of Yucaipa Prepared for: The City of Yucaipa 34372 Yucaipa Boulevard Yucaipa, California 92399 (818) 597-7300 SRHA JOB #1129 11661 San Vicente Blvd. Suite 306
3660 CASTRO VALLEY BLVD 3660 Castro Valley Blvd Castro Valley, CA 94546
 Presented to: Darlene Modesto 3660 CASTRO VALLEY BLVD 3660 Castro Valley Blvd Castro Valley, CA 94546 Market Positioning and Pricing Analysis Presented by: Louis Kwok N O N - E N D O R S E M E N T A N
Economic Effects of the New Housing Industry in the Sacramento Region
 Economic Effects of the New Housing Industry in the Sacramento Region 2016 RESEARCH REPORT, KEY FINDINGS BACKGROUND This Research Study, conducted by New Economics & Advisory, evaluates the impacts of
TASK 2 INITIAL REVIEW AND ANALYSIS U.S. 301/GALL BOULEVARD CORRIDOR FORM-BASED CODE
 TASK 2 INITIAL REVIEW AND ANALYSIS U.S. 301/GALL BOULEVARD CORRIDOR FORM-BASED CODE INTRODUCTION Using the framework established by the U.S. 301/Gall Boulevard Corridor Regulating Plan (Regulating Plan),
2013 San Diego Economic Outlook. 29 th Annual Economic Roundtable Marney Cox Chief Economist San Diego Association of Governments January 25, 2013
 213 San Diego Economic Outlook 29 th Annual Economic Roundtable Marney Cox Chief Economist San Diego Association of Governments January 25, 213 US The Problem Slow Economic Growth Gross Domestic Product
APARTMENT MARKET SUPPLY AND DEMAND DATA. Prepared March 2012 PAGE 1
 APARTMENT MARKET SUPPLY AND DEMAND DATA Prepared March 2012 PAGE 1 SUMMARY OF MARKET CONDITIONS Inventory According to the 4 th quarter 2011 MFP report on the San Jose metro apartment market, the inventory
HOULIHAN LAWRENCE COMMERCIAL GROUP
 HOULIHAN LAWRENCE COMMERCIAL GROUP TH QUARTER EXECUTIVE SUMMARY FOURTH QUARTER Dear Clients, With behind us and the new year in full swing, we can now reflect, summarize and gain insight from the past
Zoned Office Commercial
 Zoned Office Commercial FOR SALE 1161-1181 Ribaut Road, PROPERTY OVERVIEW Three lots zoned office commercial on Ribaut Road with excellent visibility. These can be purchased as a group or individually
Los Angeles Basin Retail Market Continues To Witness Decreasing Vacancy Rates
 RETAIL GREATER LOS ANGELES BASIN MARKET REPORT Continues To Witness Decreasing Vacancy Rates MARKET INDICATORS - VACANCY 6.0% NET ABSORPTION 1,605,200 CONSTRUCTION 2,111,970 RENTAL RATE $2.03 P NNN UNEMPLOYMENT
research RetailTrends Report compiled by IPD
 research RetailTrends Report Report compiled by IPD Q1 2014: key findings For the year ending March 2014, the centres in the IPD Retail sample recorded an increase of 4.9% in annualised trading density
City of Noblesville Unified Development Ordinance Audit. Real Estate Analysis
 City of Noblesville Unified Development Ordinance Audit Real Estate Analysis December 10 th, 2012 Introduction The Noblesville Real Estate Analysis compares the health of the real estate market against
Provide a diversity of housing types, responsive to household size, income and age needs.
 8 The City of San Mateo is a highly desirable place to live. Housing costs are comparably high. For these reasons, there is a strong and growing need for affordable housing. This chapter addresses the
The Landing GREAT AMERICA
 The Landing at GREAT AMERICA S a n t a C l a r a, C a l i f o r n i a E X E C U T I V E S U M M A R Y Cassidy Turley has been retained as exclusive advisor to market for sale The Landing at Great America
CONTENTS. Executive Summary 1. Southern Nevada Economic Situation 2 Household Sector 5 Tourism & Hospitality Industry
 CONTENTS Executive Summary 1 Southern Nevada Economic Situation 2 Household Sector 5 Tourism & Hospitality Industry Residential Trends 7 Existing Home Sales 11 Property Management Market 12 Foreclosure
Good Year, Poor Quarter
 Q4 2013 RETAIL LAS VEGAS NEVADA RESEARCH & FORECAST REPORT Good Year, Poor Quarter After nine quarters of positive net absorption, Southern Nevada s retail market fell into negative net absorption territory
Stronger Office Market Looking Into Future
 Research & Forecast Report Long Island OFFICE MARKET Q2 2015 Stronger Office Market Looking Into Future Rose Liu Research & Financial Analyst Long Island Takeaways Class A & B Long Island economic and
PLANNING AND IMPLEMENTING TOD: KEY FACTORS FOR SUCCESS. Sujata Srivastava Knowledge Corridor TOD Workshop June 5, 2013
 PLANNING AND IMPLEMENTING TOD: KEY FACTORS FOR SUCCESS Sujata Srivastava Knowledge Corridor TOD Workshop June 5, 2013 6-year old partnership dedicated to improving practice through technical assistance,
>> Greater Los Angeles Retail Ends 2016 With Mixed Results
 Research & Forecast Report GREATER LOS ANGELES RETAIL Q4 2016 Accelerating success. >> Greater Los Angeles Retail Ends 2016 With Mixed Results Greater Los Angeles Retail Market The Los Angeles Basin retail
FOR SALE 1301 S. MCCALL ROAD, ENGLEWOOD, FL AC VACANT LOT WITH 900' SR-776 FRONT FOOTAGE LAND. Ronald Struthers, CCIM FOR MORE INFORMATION
 LAND FOR SALE 3.3 AC VACANT LOT WITH 900' SR-776 FRONT FOOTAGE FOR MORE INFORMATION Coldwell Banker Commercial NRT EXECUTIVE SUMMARY / / 3.3 AC VACANT LOT WITH 900' SR-776 FRONT FOOTAGE Coldwell Banker
3.3 AC VACANT LOT - 900' SR-776 FRONT FOOTAGE
 3.3 AC VACANT LOT - 900' SR-776 FRONT FOOTAGE 1301 S. McCall Road, Englewood, FL 34224 $1,721,000 A Land Investment Opportunity 3.3 AC VACANT LOT WITH 900' SR-776 FRONT FOOTAGE 3.29 ACRES ENGLEWOOD, FL
DOWNTOWN PLAN. This Downtown Plan annual report summarizes business and development ANNUAL MONITORING REPORT 2009
 DOWNTOWN PLAN ANNUAL MONITORING REPORT 2009 This Downtown Plan annual report summarizes business and development trends affecting Downtown San Francisco and covers the 2009 calendar year, as required by
HISTORICAL VACANCY VS RENTS $1.75 2Q10 2Q11 2Q12 2Q13 2Q14
 www.colliers.com/greaterlosangeles RETAIL GREATER LOS ANGELES BASIN MARKET REPORT Vacancy Decreases and Net Absorption Increases From Previous Quarter MARKET INDICATORS - VACANCY 6. NET ABSORPTION 732,000
McAllen,TX Development Land S. 35 th Street, McAllen, TX 78501
 McAllen,TX Development Land S. 35 th Street, McAllen, TX 78501 FOR SALE Rio Grande Valley PROPERTY OVERVIEW This great piece of property sits ideally in the path of McAllen s growth and has excellent proximity
E-commerce. E-commerce in the Bay Area. United States Year End How consumer demand for expedited deliveries is driving real estate
 1 E-commerce in the Bay Area United States Year End 2016 How consumer demand for expedited deliveries is driving real estate 2 Last-mile delivery and a new era for industrial Introduction real estate Adjusting
Los Angeles Basin Retail Market Continues To Witness Decreasing Vacancy Rates
 RETAIL GREATER LOS ANGELES BASIN MARKET REPORT Continues To Witness Decreasing Vacancy Rates MARKET INDICATORS - VACANCY 6. NET ABSORPTION 588,800 CONSTRUCTION 3,312,470 RENTAL RATE $2.04 P NNN UNEMPLOYMENT
2014 Plan of Conservation and Development
 The Town of Hebron Section 1 2014 Plan of Conservation and Development Community Profile Introduction (Final: 8/29/13) The Community Profile section of the Plan of Conservation and Development is intended
October 17, Proposal Due Date: Friday, November 10, 2017 by 4:00 pm
 Request for Proposal (RFP) For Housing Study and Needs Assessment Lamoille County Planning Commission (LCPC) Lamoille Housing Partnership (LHP) Stowe Land Trust (Identified below as The Contracting Partners
RESEARCH & FORECAST REPORT
 Q2 2012 OFFICE LAS VEGAS NEVADA RESEARCH & FORECAST REPORT Recovery Without Job Growth? Despite office employment still trending downwards, Southern Nevada s office market posted positive net absorption
Red Hot Rents & Cooling Vacancy
 Research & Forecast Report NORTH I-680 CORRIDOR OFFICE Q3 2017 Red Hot Rents & Cooling Vacancy > > Office Inventory: 16,926,446 Square Feet > > Vacancy: 12.9 percent > > Net absorption: (380,946) Square
Market Assessment DRAFT. CITY OF SAN LEANDRO Community Development Department
 D o w n t o w n S a n L e a n d r o Tr a n s i t - O r i e n t e d D e v e l o p m e n t S t r a t e g y Market Assessment DRAFT CITY OF SAN LEANDRO Community Development Department April 2006 Executive
100 Hegenberger Road Oakland, CA
 Owner User / Investment Opportunity 100 Hegenberger Road Oakland, CA Oakland Coliseum-Airport Investment Contacts: John Dolby Executive Director +1 510 267 6027 john.dolby@cushwake.com LIC #00670630 Dane
research RetailTrends Report compiled by IPD
 research RetailTrends Report Report compiled by IPD Q4 2013: key findings For the year ending December 2013, the centres in the IPD Retail sample recorded an increase of 5.2% in annualised trading density
Summary Report on the Economic Impact of the State Center Project Baltimore, MD
 Summary Report on the Economic Impact of the State Center Project Baltimore, MD Prepared for: Maryland Department of Transportation Prepared by: BAE Urban Economics March 2011 Summary of Key Findings Phase
MONTGOMERY COUNTY RENTAL HOUSING STUDY. NEIGHBORHOOD ASSESSMENT June 2016
 MONTGOMERY COUNTY RENTAL HOUSING STUDY NEIGHBORHOOD ASSESSMENT June 2016 AGENDA Model Neighborhood Presentation Neighborhood Discussion Timeline Discussion Next Steps 2 WORK COMPLETED Socioeconomic Analysis
Land Use Survey Summer 2014
 Land Use Survey Summer 2014 North Ogden City, Utah Robert Scott, City Planner Travis Lund, Planning Intern Contents General Information... 1 Land Use Groups... 1 Urbanized Land Uses... 1 Residential...
Sonoma County Business Barometer Q4 CY 2007
 EDB Sonoma County Economic Development Board economy Sonoma County Business Barometer Q4 CY 27 Economic Development Board 41 College Avenue Suite D Santa Rosa CA 9541 77.565.717 EDB Sonoma County Economic
San Diego County Vol. XX, Issue I Rental Trends Executive Summary March 2007
 Real Estate Research and Consulting for over 25 years Vol. XX, Issue I Rental Trends Executive Summary Editor: Robert D. Martinez- Director of Research s institutional grade rental complexes experienced
CHAPTER 3. HOUSING AND ECONOMIC DEVELOPMENT
 CHAPTER 3. HOUSING AND ECONOMIC DEVELOPMENT This chapter analyzes the housing and economic development trends within the community. Analysis of state equalized value trends is useful in estimating investment
US Worker Cooperatives: A State of the Sector
 US Worker Cooperatives: A State of the Sector Worker cooperatives have increasingly drawn attention from the media, policy makers and academics in recent years. Individual cooperatives across the country
Economic Indicators Quarter 3 City of Oakland
 Attachment B Economic Indicators Quarter 3 City of Oakland PREPARED BY: THE OFFICE OF ECONOMIC AND WORKFORCE DEVELOPMENT CITY OF OAKLAND DECEMBER 2014 September 16, 2014Sepseseee Introduction to Quarter
2008 Midyear Housing Forecast
 2008 Midyear Housing Forecast June 25, 2008 By Alan N. Nevin Chief Economist California Building Industry Association Executive Summary: Housing Production Falling Short of Earlier Forecasts Due to the
RESEARCH & FORECAST REPORT
 Q3 2012 OFFICE LAS VEGAS NEVADA RESEARCH & FORECAST REPORT Office Forges Ahead Southern Nevada s office market continued to post positive net absorption in the third quarter of 2012, despite weak employment
Market Research. Market Indicators
 colliers international LAS VEGAS, NV Market Research OFFICE Third Quarter 2009 Market Indicators Net Absorption Construction Rental Rate Q3-09 Q4-2009 Projected Clark County Economic Data Jul-09 Jul-08
REAL ESTATE MARKET OVERVIEW 1 st Half of 2015
 REAL ESTATE MARKET OVERVIEW 1 st Half of 2015 With Comparisons to the 2 nd Half of 2014 September 4, 2015 Prepared for: First Bank of Wyoming Prepared by: Ken Markert, AICP MMI Planning 2319 Davidson Ave.
How Does the City Grow?
 This bulletin summarizes information from the City of Toronto s Land Use Information System II, providing an overview of the development projects received by the City Planning Division between January
UKIAH VALLEY GROWTH PROSPECTS
 Economic & Planning Systems Real Estate Economics Regional Economics Public Finance Land Use Policy FINAL REPORT UKIAH VALLEY GROWTH PROSPECTS Prepared for: County of Mendocino Prepared by: Economic &
Final Report. City of Arvada, Colorado. Vauxmont/Cimarron Park ODP
 Final Report City of Arvada, Colorado Vauxmont/Cimarron Park ODP by Brian Lewandowski, MBA Leeds School of Business University of Colorado-Boulder Thomas G. Thibodeau, PhD Global Real Estate Capital Markets
A n E x c e p t i o n a l S o u t h o f M a r k e t R e d e v e l o p m e n t O p p o r t u n i t y o r O w n e r / U s e r B u i l d i n g 3 4 H A R
 O FFERING MEMORANDUM A n E x c e p t i o n a l S o u t h o f M a r k e t R e d e v e l o p m e n t O p p o r t u n i t y o r O w n e r / U s e r B u i l d i n g 3 4 H A R R I E T S T R E E T S A N F R
Economic and Fiscal Impact Analysis of Future Station Transit Oriented Development
 Florida Department of Transportation Central Florida Commuter Rail Transit Project Economic and Fiscal Impact Analysis of Future Station Transit Oriented Development Seminole County Summary Report Revised
Detroit Neighborhood Housing Markets
 Detroit Neighborhood Housing Markets Market Study 2016 In 2016, Capital Impact s Detroit Program worked with local and national experts to determine the residential market demand across income levels for
Economic Dashboard. city of. January June (Q1 and Q2) Office of Economic Development
 Office of Economic Development") city of Economic Dashboard January June (Q1 and Q2) 2015 Office of Economic Development Disclaimer: The City of Berkeley makes no representations about the suitability of the information contained in this
city of Economic Dashboard January June (Q1 and Q2) 2015 Office of Economic Development Disclaimer: The City of Berkeley makes no representations about the suitability of the information contained in this
Downtown Redevelopment Update Analysis for City of Mound, Minnesota. Mary C. Bujold President
 Downtown Redevelopment Update Analysis for the City of Mound, Minnesota Prepared for: Prepared by: City of Mound, Minnesota Maxfield Research, Inc. Mary C. Bujold President September 16, 2013 Presentation
Los Angeles Basin Retail Market Witnessed A Slight Increase In Vacancy Rates
 RETAIL GREATER LOS ANGELES BASIN MARKET REPORT Witnessed A Slight Increase In Vacancy Rates MARKET INDICATORS - VACANCY 6.2% NET ABSORPTION -551,200 CONSTRUCTION 1,946,000 RENTAL RATE $1.96 P NNN UNEMPLOYMENT
Market Research. OFFICE First Quarter 2010
 colliers international LAS VEGAS, NV Market Research OFFICE First Quarter 2010 Market Indicators Net Absorption Construction Rental Rate Q1-10 Q2-2010 Projected Clark County Economic Data Jan-10 Jan-09