2017 Annual Results Presentation
|
|
|
- Dorothy Goodwin
- 6 years ago
- Views:
Transcription


1 2017 Annual Results Presentation 12 February 2018
2 Overview 1 Introduction & Property Portfolio at 31 December Rental Activity 3 Property Transactions 4 Financial Statements & Results Appendices 2

3 1 Introduction & Property Portfolio at 31 December
4 1 Introduction Market The Paris region rental market enjoyed strong growth in 2017, with 2.6 million sq.m. leased during the year Prime rents increased, reflecting: - more sustained corporate demand - a shortage of prime properties in the capital The Paris market is attractive for investors: - Paris is a global city - prime yields stand at around 3% - values are increasing A favourable environment for s positioning A pure player in prime Paris office property Enhancing the portfolio s value through: - development pipeline - asset purchases and sales Higher rents for new leases A resilient and effective business model 2017 RESULTS 12 February
5 Highlights INVESTMENTS Acquisition of 112 Zola (former SMA headquarters building) Price: 165m excluding transfer costs, 166m including transfer costs PORTFOLIO MANAGEMENT IN/OUT sold on 29 September to Primonial REIM Price: 445m excluding transfer costs, 453m including transfer costs Investment yield: 3.7% DEVELOPMENT 112 Zola => 24,000 sq.m. of office space in the heart of the 15 th arrondissement Louvre Saint-Honoré => redevelopment of 16,000 sq.m. of retail space 96 Iéna => 9,000 sq.m. of offices just off Place de l Etoile MARKETING PROGRAMME Leases signed on 21,000 sq.m. 18m of additional rental income Average nominal rent of 733/sq.m. (offices) FINANCING S&P rating upgraded to BBB+/A2 with a stable outlook Two new bank facilities for 6 and 7 years respectively, for a total of 250m Average cost of debt: 1.7% 5
 Statement of Financial Position Portfolio value (excl. transfer costs): 6,229m (up 8.6%) (up 12.6% like-for-like) EPRA NNNAV: 3,729m (up 21.")
6 1 Key Indicators Very strong performance indicators Profit and Loss Account Rental income: 195.8m (down 1.2%) (up 3.6% like-for-like) EPRA earnings: 102.4m (up 1.5%) Attributable net profit: 685.3m (up 35.9%) Statement of Financial Position Portfolio value (excl. transfer costs): 6,229m (up 8.6%) (up 12.6% like-for-like) EPRA NNNAV: 3,729m (up 21.0%) Business indicators Average nominal rent: 629/sq.m./year Average lease maturity: 5.5 years Physical occupancy rate: 96.4% EPRA vacancy rate: 3.1% Debt Average maturity: 4.5 years Average spot cost: 1.7% Loan-to-Value: 24.6% Interest cover: 4.0x 6
, of which 9bn in Q4-8% 6.")

 French investors occupied a dominant position, spending 13bn (70% of market) Q1 Q2 Q3 Q4 Prime yields were stable at")


7 1 Paris Region Investment Market in 2017 PARIS REGION COMMERCIAL PROPERTY INVESTMENT MARKET In billions Total investment declined in 2017 despite a very dynamic Q4: 18.5bn invested over the year (down 8% vs 2016), of which 9bn in Q4-8% 6.7bn invested in 100m-plus transactions in Q4 2017, with over 22 transactions recorded in this segment 42% decline in volumes in 2017 in Paris CBD, due to the lack of properties in this sector (diverting investor attention to La Défense and the Western Crescent) Core assets accounted for 58% of transactions/off-plan sales were numerous, representing 2.9bn (vs 2.5bn in 2016) French investors occupied a dominant position, spending 13bn (70% of market) Q1 Q2 Q3 Q4 Prime yields were stable at around 3% (228bps spread vs OAT rate) PRIME YIELD vs 10-YEAR OAT RATE Cœur Défense Examples of major transactions in 2017 IN/OUT Boulogne Grand Central Saint Lazare RTL HQ Bayard Source: CBRE Yield on prime Paris CBD commercial property 3-month Euribor 10-year OAT TEC +228 bps 1.8bn 10,000/sq.m. Vendor: Lone Star Buyer: Amundi, Crédit Agricole Assurance and Patrimonial 445m 12,750/sq.m. Vendor: Buyer: Primonial 340m 14,400/sq.m. Vendor: Carlyle Buyer: Union Investment 115m 15,625/sq.m. Vendor: Bertelsmann Buyer: LaSalle IM 2017 RESULTS 12 February
 New/Redeveloped Historically strong rental market performance in")
, representing 43% of 2017 rental activity 52% of these very large transactions corresponded to pre-marketing deals Modest decline in completed lettings of small and medium-sized")
8 1 Paris Region Rental Market in 2017 COMPLETED LETTINGS: A RECORD YEAR FEWER IMMEDIATELY AVAILABLE PROPERTIES AND LOWER VACANCY RATE Monthly average from 2007 to 2016Q1 West Central Paris North East Paris Southern Paris La Défense Western Crescent Inner suburbs Outer suburbs Previously owned/renovated Vacancy rate (right-hand axis) New/Redeveloped Historically strong rental market performance in 2017, with leases signed on 2.64 million sq.m. (up 8% vs 2.43 million sq.m. in 2016), 10% above ten-year average of 2.39 million sq.m. A result led by a high volume of very large transactions: 88 transactions in excess of 5,000 sq.m. (vs 65 in 2016), representing 43% of 2017 rental activity 52% of these very large transactions corresponded to pre-marketing deals Modest decline in completed lettings of small and medium-sized units, due to the shortage of properties in this segment and the development of alternative office solutions (co-working) Leases signed on 480,000 sq.m. in Paris CBD, the highest level since 2007 Lowest vacancy rate since 2007: 6.4% in Paris region and 3% in West Central Paris (lowest rate since 2009) Immediately available space continues to decline: 3.4 million sq.m. in Paris region (down 5% vs 2016) New or remodelled properties (435,000 sq.m.) represent just 14% of immediately available space Rental incentives stable overall at 22.3% in Paris region, with a low of 16.5% in Paris itself Higher prime rental values in Paris ( 775/sq.m. vs 750/sq.m. in Q4 2016) The favourable economic outlook and an increasingly narrow offer should drive an increase in prime rental values in 2018 Source: JLL/ CBRE 2017 RESULTS 12 February
9 1 Analysis of Property Portfolio Value Consolidated portfolio value up 8.6% vs 2016: 6,229m excluding transfer costs - 6,619m including transfer costs up 12.6% on a like-for-like basis Consolidated data ( m, excl. TC) , % Average value per sq.m.: 17,499/sq.m. excl. transfer costs , EPRA topped-up NIY: 3.2% (3.6% at 31 December 2016) Topped-up NIY Offices: 3.3% Topped-up NIY Retail: 2.8% Dec Sale of IN/OUT Acquisition of 112 Zola Investments (CAPEX) Fair value adjustments 31 Dec
 21% 19 17 11")
 15% 2% 20 83% Paris CBD Other Paris Western")
10 1 The Benchmark in the Paris Prime Commercial Property Market 6,229m portfolio, 98% in Paris as shown below: Market focus (value) 21% % % 2 Offices Retail Residential Geographic focus (value) 15% 2% 20 83% Paris CBD Other Paris Western Crescent 10
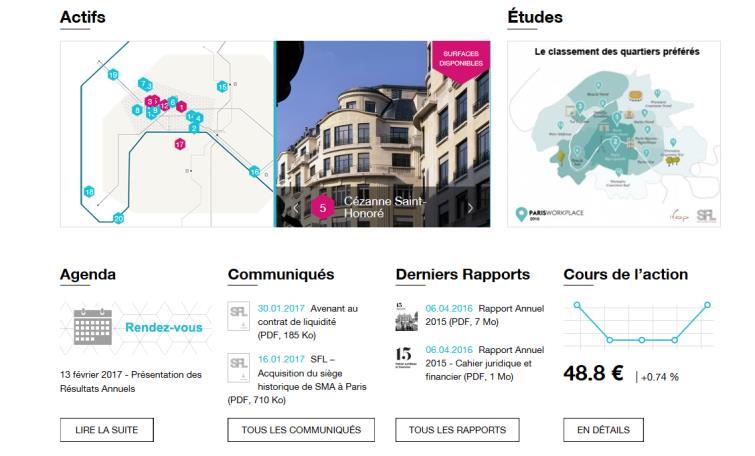
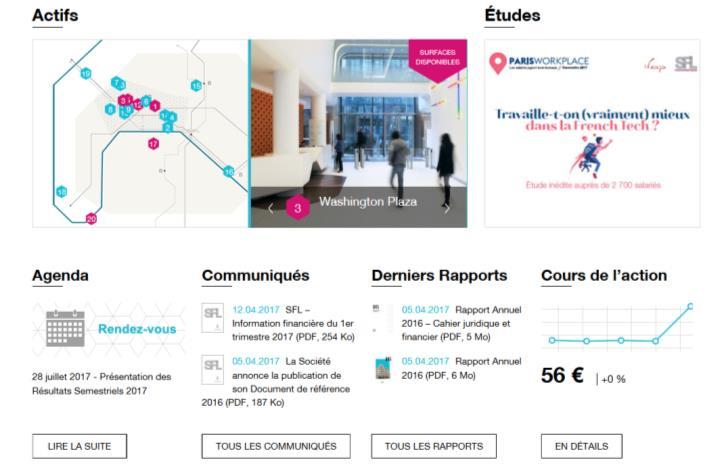
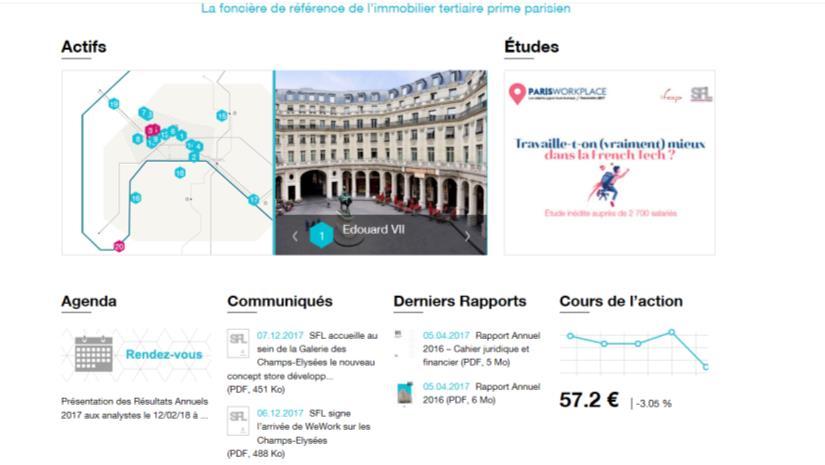
11 1 Property Portfolio: 388,100 sq.m Paris Edouard VII Louvre Saint-Honoré Washington Plaza Total surface area (1) 54,100 sq.m. 47,700 sq.m. 47,000 sq.m #cloud.paris 35,000 sq.m. Cézanne Saint-Honoré 29,000 sq.m. Condorcet 24,900 sq.m. Rives de Seine 22,700 sq.m. 112 Zola 21,000 sq.m * 103 Grenelle 18,900 sq.m Western Crescent 176 Charles de Gaulle Neuilly-sur-Seine Le Vaisseau Issy-les-Moulineaux TOTAL Total surface area (1) 7,400 sq.m. 6,300 sq.m. 13,700 sq.m. 10 Haussmann Saint-Augustin 13,400 sq.m Wagram 9,200 sq.m. 96 Iéna 8,900 sq.m. 90 Champs-Elysées 8,900 sq.m. Galerie Champs-Elysées 8,700 sq.m. 92 Champs-Elysées 7,700 sq.m. 9 Percier 6,700 sq.m. 112 Wagram 6,000 sq.m. 6 Hanovre 4,600 sq.m. TOTAL 374,400 sq.m. Paris CBD Paris Other Western Crescent (1) Including infrastructure and excluding car parks * Planned surface area: 24,000 sq.m. 11


12 A FAIRE 2 Rental Activity
13 2 Rental Income and Reversionary Potential Rental income growth in 2017: 3.6% on a like-for-like basis 210m Reversionary potential (Consolidated data, 100% basis) 200m 198,1 +6, ,8 50m 40m 47m 190m 30m 32m 20m 180m 10m 7m 9m 170m 0m 2016 rental income Δ Like-for-like increase Δ Post-renovation remarketing/ Major renovations Δ Property disposals - acquisitions Δ Lease termination penalties 2017 rental income Properties undergoing renovation Vacant properties Relets 13

14 2 Rental Income Breakdown A diversified portfolio of very high value-added tenants 2017 rental income: 195.8m 19% 2% Breakdown by tenant business at 31 December 2017 Quasi-public organisations Real estate companies 7% 3% Other 11% 31% Finance/ Insurance 9% Manufacturers 79% Offices Retail Other Digital/Media companies 12% 13% Fashion houses 14% Law firms/ Consultancies FINANCE/ INSURANCE LAW FIRMS/ CONSULTANCIES FASHION HOUSES DIGITAL/ MEDIA COMPANIES QUASI-PUBLIC ORGANISATIONS MANUFACTURERS REAL ESTATE COMPANIES OTHER New tenants in the portfolio/leases signed in
15 2 Office Marketing Programmes 17,000 sq.m. Total surface area leased 13m Total nominal rent 733/sq.m. 629/sq.m. Average nominal rent (excl. staff restaurant) Average effective rent 14% Average incentive rate, leases vs West Central Paris average of 16.5% (source: CBRE) 7.5 years Non-cancellable period 3.6% Physical vacancy rate, portfolio at 31 December 2017 vs Paris region average vacancy rate of 6.4% 15


16 2 Marketing Programmes Main leases signed in % occupied* 100% occupied* 100% occupied* 95% occupied* Galerie des Champs-Elysées - Paris 8 92 Champs-Elysées - Paris Grenelle - Paris 7 Washington Plaza - Paris 8 3,400 sq.m. 12 years Signed 17 Nov ,600 sq.m. 1,300 sq.m. 6/9/10 years 6/9/10 years Signed 30 June 2017 Signed 20 Jan sq.m. 6/12 years Signed 22 July sq.m. 3/6/9/12 years Signed 11 Jan ,000 sq.m. 9 years Signed 24 May % occupied* 91% occupied* 100% occupied* 900 sq.m. 6/9/10 years Signed 24 July sq.m. 3/6/9/10 years Signed 4 May Percier - Paris 8 Cézanne Saint-Honoré - Paris Wagram - Paris 17 1,400 sq.m. 6/9/10 years Signed 4 April ,900 sq.m. 6/9/10 years Signed 14 Sept ,600 sq.m. 6/9/10 years Signed 28 Feb sq.m. 9/10 years Signed 12 May 2017 * Physical occupancy rate at 31 December
17 2 Occupancy Rates Physical occupancy rate at 31 December % (1) (97.0% at 31 December 2016) EPRA vacancy rate 3.1% (1) Change in physical occupancy rate EPRA vacancy rate (1) 100% 16 95% 12 90% 85% 8 80% 4 75% 70% déc.-14 juin-15 déc.-15 juin-16 déc.-16 juin-17 déc Dec-14 Jun-15 Dec-15 Jun-16 Dec-16 Jun-17 Dec-17 (1) Surface area attributable to 17
18 2 Lease Renewals Commercial lease expiry dates 25% 20% 20% 19% 20% 15% 13% 15% 13% 15% 10% 8% 9% 8% 9% 9% 6% 11% 8% 5% 4% 5% 4% 3% 1% 0% >2027 Lease expiry Next break option Average office rent at 31 December 2017: 629/sq.m./year (vs 591 at 31 December 2016) Average period (1) to lease expiry: 5.5 years (vs 6.3 at 31 December 2016) Average period to next potential exit date (2) : 3.8 years (vs 4.8 at 31 December 2016) (1) Weighted average remaining life of commercial leases in progress at 31 December 2017 (2) Weighted average period to next potential exit date for commercial leases in progress at 31 December


19 A FAIRE 3 Property Transactions 19

 APD preliminary design in the process of being finalised A major redevelopment project offering considerable scope to create value: - 36 months work (delivery")
20 3 Investment/Development: 112 Zola Paris 15 Acquired on 30 November 2017; 165m excluding transfer costs; 166m including transfer costs Planned surface area: 24,000 sq.m. on a 6,300 sq.m. plot Prime contractor selected (Y. Martineau Architecture/Jouin Manku) Approval obtained Building permit applied for in October 2017 (currently under review) APS preliminary design finalised (November 2017) APD preliminary design in the process of being finalised A major redevelopment project offering considerable scope to create value: - 36 months work (delivery scheduled for 2021) - Budget 3,000/sq.m. - Opportunity to increase available space by around 15% ROI > 5% IRR 7% 20

")

 LMT acquired by Thomson")

21 3 Sale: IN/OUT Boulogne-Billancourt Redevelopment and marketing LMT building Le Matériel Téléphonique (telecoms company) Acquired by Sale and Leaseback contract with Thomson July: 12-year lease signed with the OECD (Inception date: September) LMT acquired by Thomson Boulogne (headquarters) Thomson moves out and redevelopment work launched Asset sold to Primonial REIM 21

 Price excl.")
 Value created 22")
22 3 Sale: IN/OUT Boulogne-Billancourt Value created Key figures Creation of a unique office campus with a dedicated service centre Improved user comfort in an efficient workspace and an exceptional environment Highly respected partners: - DTACC architects - Jouin-Manku design consultancy Exemplary environmental credentials Outstanding HQE rating Surface area: 35,000 sq.m. (including 4,000 sq.m. created / service centre) Price excl. transfer costs: 445m Price incl. transfer costs: 453m Yield incl. transfer costs: 3.7% Ratio: 12,750/sq.m % (AV + capex) LEED Platinum BREEAM-in-Use Excellent IRR: 12% Sale at 29 Sept TOTAL Appraisal value Capex (incl. work for tenants) Value created 22
23 3 Current Redevelopment Projects* Projects launched during the year: 112 Zola: 24,000 sq.m. Cézanne Saint-Honoré: 3,300 sq.m. 96 Iéna: 1,300 sq.m. Other: 5,800 sq.m. Projects delivered during the year: Cézanne Saint Honoré: 7,000 sq.m. o/w (5,000 sq.m. leased) 92 Champs-Elysées: 3,400 sq.m. fully leased Washington Plaza: 2,500 sq.m. o/w (1,700 sq.m. leased) Other: 1,500 sq.m ,400 sq.m. -14,400 sq.m. 45,000 sq.m. Louvre Saint-Honoré 16,000 sq.m ,000 sq.m. Louvre Saint-Honoré 16,000 sq.m. 112 Zola 24,000 sq.m Cézanne St Honoré 5,500 sq.m. Other 3,500 sq.m. Other 5,000 sq.m. 31 Dec Projects launched Projects delivered 31 Dec * Surface area attributable to 23

 Approval")


24 3 Redevelopment Projects: 96 IÉNA Prime contractor: DPA (D. Perrault) Approval obtained Building permit obtained Redevelopment of 9,300 sq.m. (1,000 sq.m. per floor with services) Scheduled delivery:

25 3 Redevelopment Projects: Louvre Saint-Honoré Redevelopment of 16,000 sq.m. of retail space Prime contractor: B-Architecture Redevelopment of retail space: Lower ground/ground/upper ground floors CDAC retail redevelopment permit obtained: 15,000 sq.m. Building permit/modified building permit obtained Marketing in progress Preparatory work/relocation of staff restaurant launched Preparatory work: Feasibility study/units vacated Preparatory/administrative/ marketing phases completed Redevelopment work Delivery 25

")


26 3 s CSR Policies 2017 BREEAM Awards Corporate Investment in Responsible Real Estate Award 4 th /Ifop Paris WorkPlace Survey 2017 EPRA Awards EPRA BPR Gold Award EPRA sbpr Silver Award and Most Improved Report Award 3,000 employees surveyed including 1,000 from French Tech 10 French Tech companies surveyed 100% of in-use properties are certified as meeting BREEAM-in-Use International (BIU) standards The recently delivered redevelopment projects all comply with the following three standards: - BREEAM New Construction - LEED - HQE has earned Green Star ranking in each Global Real Estate Sustainability Benchmark (GRESB) Survey since 2014, committed to sustainable real estate From Baron Haussmann s Paris to the connected city, a century and a half of architecture From s creation in 1879 to the present day 26

27 4 Financial Statements & Results 27
28 Results m Change Rental income % Property expenses, net of recoveries (10.9) (10.5) Net rental income % Service and other revenues Depreciation, amortisation and provision expense, net 0.3 (1.6) Employee benefits expense and other expenses (23.3) (19.2) Operating profit before disposal gains and fair value adjustments % Profit on asset disposals Fair value adjustments on investment property Share of profits/(losses) of associates Finance costs and other financial income and expenses (40.7) (48.1) Income tax (expense)/benefit (42.5) 3.3 Profit for the year Non-controlling interests (111.0) (58.8) Attributable net profit EPRA earnings % 28
29 4 EPRA earnings m Recurring EPRA Change Non recurring Recurring EPRA Non recurring Recurring EPRA Rental income % Property expenses, net of recoveries (10.9) 0 (10.5) 0 Net rental income % Service and other revenues Depreciation, amortisation and provision expense, net (1.6) 0 Employee benefits expense and other expenses (20.4) (3.0) (19.2) 0 Operating profit before disposal gains and fair value adjustments (3.0) % Profit on asset disposals Fair value adjustments on investment property Share of profits/(losses) of associates Finance costs and other financial income and expenses (41.2) 0.5 (46.0) (2.1) -10.3% Income tax (expense)/benefit (9.2) (33.3) (8.3) % EPRA earnings before non-controlling interests Non-controlling interests (14.2) (96.8) (14.4) (44.4) EPRA earnings EPRA earnings per share % 29
30 4 Consolidated Statement of Financial Position m 31 Dec Dec Assets Investment property 6,119 5,605 Other non-current assets Total non-current assets 6,144 5,629 Properties held for sale 0 0 Other current assets Total current assets Total Assets 6,249 5,764 Equity & Liabilities Equity 3,763 3,123 Non-controlling interests Total equity 4,239 3,494 Non-current liabilities 1,904 1,813 Current liabilities Total Equity and Liabilities 6,249 5,764 30
31 4 Consolidated Loan-to-Value m 31 Dec Dec Change Bonds 1,000 1, Bank loans Mortgage loans Total debt 1,647 1, Cash and cash equivalents Net debt 1,631 1, Undrawn lines of credit Maturities of debt at 31 December 2017 ( m) Undrawn lines of credit Mortgage loans Bank loans Bond Property portfolio incl. TC 6,619 6, Loan-to-value 24.6% 31.7% -7.1% Interest cover 4.0x 3.7x +0.3 Average maturity (years) Average spot cost of debt (after hedging) 1.7% 1.9% -0.2pt S&P rating upgraded to BBB+/A2 with a stable outlook Two new bank facilities for 6 and 7 years respectively, for a total of 250m 31
32 4 Net Asset Value m 31 Dec Dec Change Equity 3,763 3,123 Treasury shares and stock options Unrealised capital gains Elimination of financial instruments at fair value (1) 0 Elimination of deferred taxes EPRA NAV 3,889 3,234 EPRA NAV per share Financial instruments at fair value 1 0 Fixed-rate debt at fair value (63) (71) Deferred taxes (99) (81) EPRA NNNAV 3,729 3,082 EPRA NNNAV per share Number of shares (thousands) 46,529 46, % +21.0% Growth in EPRA NNNAV ( m) NNNAV at 31 December ,082 Change in fair value of attributable assets +507 Profit on asset disposals +80 Change in fair value of debt and other financial instruments EPRA earnings +102 Dividends -49 Other -3 NNNAV at 31 December ,
 13.6% 12.9% EPRA Cost Ratio (excl. vacancy costs) 12.2% 11.")
33 4 EPRA Performance Indicators ( m) EPRA Earnings EPRA NAV 3, ,233.9 EPRA NNNAV 3, ,081.8 (%) EPRA Net Initial Yield 2.8% 2.9% EPRA topped-up Net Initial Yield 3.2% 3.6% EPRA Vacancy Rate 3.1% 3.1% EPRA Cost Ratio (incl. vacancy costs) 13.6% 12.9% EPRA Cost Ratio (excl. vacancy costs) 12.2% 11.1% 33
34 4 Dividend per Share ( per share) 2,5 2,30 2,10 2,10 2 1,5 1 1,05 1,05 Dividend recommended for shareholder approval at the Annual Meeting of 20/04/18 0,5 1,05 1, Dividend Other distribution 34
35 4 Key Figures Change Rental income (IFRS) 195.8m 198.1m -1.2% Operating profit before disposal gains and fair value adjustments Profit on asset disposal gains and fair value adjustments to investment property 164.1m 169.7m -3.3% 715.4m 438.0m +63.3% Attributable profit 685.3m 504.1m +35.9% EPRA earnings 102.4m 100.9m +1.5% 31 Dec Dec Change Equity 3,763m 3,123m +20.5% Consolidated portfolio value (excluding TC) 6,229m 5,736m +8.6% EPRA NNNAV 3,729m 3,082m +21.0% EPRA NNNAV per share


36 4 Questions/Answers 36

37 Appendices 37
38 in Brief The benchmark in Paris prime commercial property Founded in 1879: 139 years of sustainable business development Managing a 6.2 billion, 388,100 sq.m. property portfolio 98% of assets in Paris, of which 83% in the CBD 78% offices and 21% retail units 20 very large property complexes A very high value-added tenant portfolio 38
 DIC Holding* 8.")


 6.")
39 Ownership Structure at 31 December 2017 ownership structure (46.5 million shares) DIC Holding* 8.6% Free-float 5.3% Treasury shares 0.7% Colonial ownership structure at 26 January 2018 Grupo Finaccess 18,4% Qatar Holding* 13.6% Qatar Investment Authority 9,6% PREDICA 13,2% Colonial 58,6% Free-float 64.4% Treasury shares 1.0% Aguila LTD (Santo Domingo) 6.6% * Shareholders acting in concert 39


40 Organisation Structure Juan José Brugera Clavero Chairman Nicolas Reynaud Chief Executive Officer Dimitri Boulte Managing Director François Sebillotte Chief Resources Officer Dimitri Boulte Chief Operating Officer Fabienne Boileau Chief Financial Officer Human Resources Legal Internal Audit Information Systems Corporate Services Sales & Marketing Investments Asset Management Technical & Development Accounting Consolidation Budget Control Cash Management & Financing 40
41 Governance Board of Directors Juan José Brugera Clavero Pere Viñolas Serra Angels Arderiu Ibars Ali Bin Jassim Al Thani Anne-Marie de Chalambert Sylvia Desazars de Montgailhard Jean-Jacques Duchamp Chantal du Rivau Carlos Fernandez-Lerga Garralda Carmina Ganyet I Cirera Carlos Krohmer Luis Maluquer Trepat Adnane Mousannif Nuria Oferil Coll Anthony Wyand Chairman of the Board of Directors (Colonial) Vice-Chairman (Colonial) Director (Colonial) Director (QIA) Independent director Independent director Director (Prédica) Director (Prédica) Director (Colonial) Director (Colonial) Director (Colonial) Director (Colonial) Director (QIA) Director (Colonial) Independent director Executive and Strategy Committee Juan José Brugera Clavero (Chairman) Jean-Jacques Duchamp Carmina Ganyet I Cirera Pere Viñolas Serra Audit Committee Carlos Fernandez-Lerga Garralda (Chairman) Anne-Marie de Chalambert Jean-Jacques Duchamp Carmina Ganyet I Cirera Remuneration and Selection Committee Anthony Wyand (Chairman) Anne-Marie de Chalambert Pere Viñolas Serra Committee of Independent Directors Anne-Marie de Chalambert Sylvia Desazars de Montgailhard Anthony Wyand 41
42 Share Performance 2017 Share Performance (1) 2017 Key Figures (1) Number of shares at 31 December 2017 (thousands) 46, SIIC: +11.7% : +11.6% Average daily trading volume (shares) 2, CAC 40: +9.3% EPRA Europe: +9.3% Average daily trading volume (euros) 133k Closing share price on 31 December High for the period (7 June) Low for the period (4 January) Dec-16 Jan-17 Feb-17 Mar-17 Apr-17 May-17 Jun-17 Jul-17 Aug-17 Sep-17 Oct-17 Nov-17 Dec-17 Cours share price CAC 40 SIIC Indice index SIIC EPRA Europe Closing share price on 31 December (1) Baseline 100: 31 December 2016; data up to 31 December 2017 Sources: Euronext/Epra 42
43 Legal Structure SOCIETE FONCIERE LYONNAISE SA 100% LOCAPARIS SAS 66% Washington SCI 100% 100% 100% 100% 100% Paul Cézanne SCI 103 GRENELLE SCI CONDORCET SNC Société Immobilière Victoria - SAS MAUD SAS 50% Parholding SAS 100% 100% 100% Parchamps SCI Pargal SCI Parhaus SCI SA (Société Anonyme) SAS (Société par Actions Simplifiée) SCI (Société Civile Immobilière) SNC (Société en Nom Collectif) 2017 RESULTS 12 February
 by age group (on payroll at 31 December 2017) Employees (1) by years of")
44 Human Resources Number of employees 31 Dec Dec Administrative staff 4 5 Supervisors Managers Total headquarters Building caretakers 2 2 Employees (1) by age group (on payroll at 31 December 2017) Employees (1) by years of service (on payroll at 31 December 2017) 60 and over 50 to to to to 29 More than 15 years 11 to 15 years 6 to 10 years 1 to 5 years Less than 1 year Average age: 44 Average years of service: 10 (1) Excluding building caretakers 44
45 Capex Expenditure ( m) Major redevelopment projects (1) Other capitalised expenditure Total (1) of which: Louvre Saint-Honoré: 9.1m; 112 Zola: 3.0m; 96 Iéna: 1.9m 45
46
2017 Interim Results Presentation
 2017 Interim Results Presentation Overview 1 Introduction & Property Portfolio at 30 June 2017 2 First-Half 2017 Rental Activity 3 Property Transactions 4 First-Half 2017 Financial Statements & Results
2018 Interim Results Presentation
 2018 Interim Results Presentation Overview 1 Introduction & Property Portfolio at 30 June 2018 2 First-Half 2018 Rental Activity 3 Property Transactions 4 First-Half 2018 Financial Statements & Results
2016 Annual Results Presentation
 2016 Annual Results Presentation 13 FEBRUARY 2017 Overview 1 Introduction & Property Portfolio at 31 December 2016 2 2016 Rental Activity 3 Property Transactions 4 Financial Statements & Results Appendices
2018 Annual Results Presentation
 2018 Annual Results Presentation 18/02/2019 Overview 1 Introduction & Property Portfolio at 31 December 2018 2 2018 Rental Activity 3 Property Transactions 4 Financial Statements & Results Appendices 2
2013 ANNUAL RESULTS PRESENTATION
 2013 ANNUAL RESULTS PRESENTATION 2013 Annual Results Overview I. Introduction & Property Portfolio at 31 December 2013 II. Rental Activity III. Property Transactions IV. Financial Statements & Results
INVESTOR DAY. October 17 th 2018
 INVESTOR DAY October 17 th 2018 Introduction & Property SFL Portfolio 2018 INTERIM RESULTS 27 JULY 2018 2 1 PARIS REGION MARKET 2018 (at September 30, 2018) UNPRECEDENTED PERFORMANCE SINCE THE BEGINING
2018 Half-Year Results Ongoing developments to prepare for the future
 Press Release 2018/07/20 2018 Half-Year Results Ongoing developments to prepare for the future The Board of Directors of Société de la Tour Eiffel, which met on 20 July 2018, approved the financial statements
2017 Annual Results Construction of solid and sustainable cash flow continues
 Press Release 2018/03/07 2017 Annual Results Construction of solid and sustainable cash flow continues The Board of Directors of the Société de la Tour Eiffel, meeting on 7 March 2018, approved the annual
The Parisian Spirit 2017 ANNUAL REPORT
 17 T W E N T Y The Parisian Spirit 2017 ANNUAL REPORT Cézanne Saint-Honoré, Paris 8 2017 Annual Report Strategy P. 14 Trends P. 30 1 2 3 4 Paris Scope P. 40 Performance P. 54 Every SFL building has its
2018 Annual Report THE ART OF TRANSFORMATION
 08 Annual Report THE ART OF TRANSFORMATION Contents AVANT-GARDE Trend # Trend # Trend # Trend # P. 0 P. 0 P. 0 8 P. 0 PORTFOLIO Business Centres Office Buildings Projects P. P. 0 P. PERFORMANCE VISION
2016 Annual Results Strong growth in earnings
 Press Release 08/03/2017 2016 Annual Results Strong growth in earnings The Board of Directors of the Société de la Tour Eiffel met on 8 March 2017, chaired by Hubert Rodarie, and approved the financial
Colonial Investor Day PERFORMANCE Mr. Carlos Krohmer Chief Corporate Development Officer. Madrid 17/10/18
 Colonial Investor Day PERFORMANCE Mr. Carlos Krohmer Chief Corporate Development Officer Madrid 17/10/18 Disclaimer By accepting this presentation and/or by attending this presentation, you will be taken
Q RESULTS 15 MAY 2018 TLG IMMOBILIEN AG Q RESULTS
 TLG IMMOBILIEN AG Q 208 RESULTS DISCLAIMER This presentation includes statements, estimates, opinions and projections with respect to anticipated future performance of TLG IMMOBILIEN ("Forward-Looking
2014 half-year results. 23 rd July 2014
 23 rd July 2014 Main achievements first half 2014 Stated 2014 objectives Achievements to date New acquisitions One agreement contracted for a 8,300 m² office building in the southern inner rim of Paris
Analyst Presentation 12 February 2018
 Analyst Presentation 12 February 2018 Disclaimer This presentation is not an offer or an invitation to sell or exchange securities, or a recommendation to subscribe, buy or sell ANF Immobilier securities.
Sirius Real Estate Ltd Half Year Presentation 2013
 Sirius Real Estate Ltd Half Year Presentation 2013 Who are we We are a leading provider of branded mixed-use flexible workspace in Germany 2 Financial Highlights Substantial increase in recurring profit
Dream Global REIT 2018 Fourth Quarter 1
 EPRA Metrics The annual EPRA BPR Awards aim to recognize and commend upon the efforts of property companies that have successfully adopted the EPRA BPR Guidelines. Based on the assessment performed by
INTERIM FINANCIAL STATEMENTS. for the period ended on March,
 INTERIM FINANCIAL STATEMENTS for the period ended on March, 31 2015 INDEX 1. Key aspects 5 2. Consolidated profit & loss account 9 3. Consolidated balance sheet 11 4. EPRA metrics 14 5. Significant events
H RESULTS 10 AUGUST 2018 TLG IMMOBILIEN AG H RESULTS
 TLG IMMOBILIEN AG H1 2018 RESULTS DISCLAIMER This presentation includes statements, estimates, opinions and projections with respect to anticipated future performance of TLG IMMOBILIEN ("Forward-Looking
ICADE REVENUE UP +8.4% IN Q1 2018
 PRESS RELEASE Issy-les-Moulineaux, April 27, 208 ICADE REVENUE UP +8.4% IN Q 208 Commercial Property Investment: o Rental income up by as much as +5,8% to 99.0 million o Financial occupancy rate at 92.4%
2013 annual results. 19 th March 2014
 19 th March 2014 Main achievements 2013 Stated 2013 objectives Achieved Securing rental income Pre-letting Montrouge - 6 years - 1.8m New leases / extensions Total amount: 9.2m Asset disposals ( 200m over
AUDIOCAST PRESENTATION H1/2018
 AUDIOCAST PRESENTATION H1/2018 IRREPLACEABLE AND MULTI-FUNCTIONAL ASSETS IN GROWING CATCHMENTS 2 WE CONTINUE OUR TRANSFORMATION JOURNEY 2011 H1/2018 GOAL 2022 41 # OF SHOPPING # OF SHOPPING 78 30 CENTRES
Q EPRA KEY METRICS
 Q1 EPRA KEY METRICS EPRA KEY METRICS The European Public Real Estate Association (EPRA) is a not-for-profit association based in Brussels that represents the interests of both listed real estate companies
January - September 2011 results
 January - September 2011 results 14 November 2011 Highlights 9M 2011 RESULTS Commercial Property business continues showing a recurrent income giving the company stability and solidity, representing 95%
Results H September 9, 2009
 Results H1 2009 September 9, 2009 1 Strategy for the crisis Fair value: analysis and impacts The group s companies Analysis of H1 2009 accounts Affine on the stock exchange 2 STRATEGY FOR THE CRISIS Simplifying
3EPRA INFORMATION. 3.1 EPRA Earnings p EPRA Vacancy Rate p EPRA NAV and EPRA NNNAV p EPRA Cost Ratios p.83
 3EPRA INFORMATION 3.1 EPRA Earnings p.78 3.2 EPRA NAV and EPRA NNNAV p.79 3.4 EPRA Vacancy Rate p.82 3.5 EPRA Cost Ratios p.83 3.3 EPRA NIY and EPRA topped-up NIY p.80 Lar España Real Estate SOCIMI, S.A.
2018 HALF-YEAR RESULTS
 2018 HALF-YEAR RESULTS WEBCAST 25 JULY 2018 Disclaimer The information contained in this document has not been independently verified. No representation, warranty or undertaking, express or implied, is
AUDIOCAST PRESENTATION Q1/2018
 19.4.2018 AUDIOCAST PRESENTATION Q1/2018 HIGHLIGHTS Q1/2018 EPRA EARNINGS PER SHARE EUR 0.041 -Divestments in 2017 and weaker currencies impacted EPRA EPS -Efficient cost management with administrative
Q BUSINESS ACTIVITY AND REVENUE WEBCAST 25 APRIL 2017
 BUSINESS ACTIVITY AND REVENUE WEBCAST 25 APRIL 2017 DISCLAIMER The information contained in this document has not been independently verified. No representation, warranty or undertaking, express or implied,
2017 FULL YEAR 16 FEBRUARY 2018
 FULL YEAR RESULTS 16 FEBRUARY 2018 : Delivering in line with strategy 1.1 billion invested Asset acquisitions 610m Development capex 414m Land acquisitions 92m 525 million disposals Asset sales 432m Land
ICADE 1 ST QUARTER 2015 ACTIVITY
 PRESS RELEASE Paris, 5 May 2015 ICADE 1 ST QUARTER 2015 ACTIVITY 1. PROPERTY INVESTMENT DIVISION 1.1. Rental business Asset classes Financial occupancy rate 31/03/2015 31/12/2014 Average lease terms (as
2017 Half-year results LEADING DEVELOPER IN FRENCH GATEWAY CITIES
 2017 Half-year results LEADING DEVELOPER IN FRENCH GATEWAY CITIES DISCLAIMER This presentation has been prepared for information purposes only, and is intended to supplement other information published
Q BUSINESS ACTIVITY AND REVENUE WEBCAST 25 APRIL 2018
 BUSINESS ACTIVITY AND REVENUE WEBCAST 25 APRIL 2018 DISCLAIMER The information contained in this document has not been independently verified. No representation, warranty or undertaking, express or implied,
2016 FULL-YEAR RESULTS WEBCAST 21 FEBRUARY 2017
 FULL-YEAR RESULTS WEBCAST 21 FEBRUARY 2017 DISCLAIMER The information contained in this document has not been independently verified. No representation, warranty or undertaking, express or implied, is
NBG PANGAEA REIC September 2016
 NBG PANGAEA REIC September 2016 Disclaimer This presentation has been prepared by NBG PANGAEA Real Estate Investment Company (former MIG Real Estate REIC or the Company) solely for information purposes
Opening of the first coworking centre in the Triomphe building
 Press release Regulated information 09 May 2018 5:40 PM Opening of the first Silversquare @Befimmo coworking centre in the Triomphe building EPRA earnings of 0.98 per share, in line with the outlook Net
ONE YEAR AFTER LAUNCHING ITS STRATEGIC PLAN, ICADE REPORTS SIGNIFICANTLY IMPROVED 2016 FULL-YEAR RESULTS
 PRESS RELEASE Paris, February 13, 2017, 7:30 a.m. ONE YEAR AFTER LAUNCHING ITS STRATEGIC PLAN, ICADE REPORTS SIGNIFICANTLY IMPROVED 2016 FULL-YEAR RESULTS NCCF per share: 4.41, i.e. +8.3% Portfolio value:
Investor Presentation First Half Results
 Investor Presentation 2010 First Half Results 1 Disclaimer This document has been prepared by ANF Immobilier SA ( ANF Immobilier ) solely for the use of presentations made to investors or analysts. ANF
NBG PANGAEA REIC April 2017
 NBG PANGAEA REIC April 2017 Disclaimer This presentation has been prepared by NBG PANGAEA Real Estate Investment Company (former MIG Real Estate REIC or the Company) solely for information purposes and
2018 Q3: TENANTS FIRST Putting the needs of our tenants at the centre of everything we do. 26 October 2018
 2018 Q3: TENANTS FIRST Putting the needs of our tenants at the centre of everything we do 26 October 2018 CONTENT 1 HIGHLIGHTS AND KEY FIGURES 2 NEW NAME 3 MARKET OVERVIEW 4 GENERAL COMPANY OVERVIEW 7
Sponda Financial Results Q4 and FY February 2017
 Sponda Financial Results Q4 and FY 2016 3 February 2017 1. 2. 3. 4. Highlights for the Period Kari Inkinen Portfolio Development Pia Arrhenius Financials Niklas Nylander Business Environment and Business
2015 ANNUAL RESULTS WEBCAST 16 FEBRUARY 2016
 ANNUAL RESULTS WEBCAST 16 FEBRUARY 2016 DISCLAIMER The information contained in this document has not been independently verified. No representation, warranty or undertaking, express or implied, is made
Interim statement by the board of directors on the first quarter of 2018
 Regulated information - under embargo until 03/05/2018, 6 p.m. Antwerp, 3 May 2018 on the first quarter of 2018 Third logistics site in the Netherlands: agreement signed for the purchase of the site and
26 February 2013 FIRST HALF RESULTS PRESENTATION
 26 February 2013 FIRST HALF RESULTS PRESENTATION Investment highlights Proven track record of consistent earnings growth and meeting targets Strategically located and diverse residential portfolio Urban
A PURE PLAYER IN PROPERTY DEVELOPMENT IN FRANCE 2017 ANNUAL RESULTS
 A PURE PLAYER IN PROPERTY DEVELOPMENT IN FRANCE 2017 ANNUAL RESULTS Disclaimer This presentation has been prepared for information purposes only, and is intended to supplement other information published
DREAM GLOBAL ANNOUNCES FOURTH QUARTER RESULTS, 24% ANNUAL NET ASSET VALUE GROWTH AND OVER 6% FOURTH QUARTER COMPARATIVE NOI GROWTH
 DREAM GLOBAL ANNOUNCES FOURTH QUARTER RESULTS, 24% ANNUAL NET ASSET VALUE GROWTH AND OVER 6% FOURTH QUARTER COMPARATIVE NOI GROWTH TORONTO, FEBRUARY 20, 2019 DREAM GLOBAL REIT (TSX:DRG.UN, FRA:DRG) (or
Rental income, EUR million Like-for-like growth in rental income, percent
 Akelius Residential Property AB (publ) interim report January to June summary Apr Jun Apr Jun Jan Jun Jan Jun Jan Dec Rental income, EUR million 115 113 233 229 469 Like-for-like growth in rental income,
M A R C H 22,
 MARCH 22, 2017 1 01 2 ADO THE PURE-PLAY BERLIN RESIDENTIAL SPECIALIST Investment highlights 1 2 3 4 Berlin residential pure play with a 2.3bn quality portfolio Efficient, fully integrated and scalable
Q3 UPDATE. 22 October 2015
 Q3 UPDATE 22 October 2015 MANAGEMENT AGENDA 2015 2016 CONTINUE STRONG OPERATIONAL PERFORMANCE LfL rental growth > 100bps above index 2015: on-track; 2016: under review Occupancy 1% up per year (base: 93.5%
Timbercreek. U.S. Multi-Residential Opportunity Fund #1. Semi-Annual Investor Update
 Timbercreek U.S. Multi-Residential Opportunity Fund #1 Semi-Annual Investor Update FORWARD LOOKING STATEMENT Certain statements in this presentation about Timbercreek U.S. Multi-Residential Opportunity
Rental income, EUR million** Like-for-like growth in rental income, percent Net operating income, EUR million
 Akelius Residential Property AB (publ) interim report January to March summary* Jan Mar Jan Mar Jan Dec Rental income, EUR million** 119 116 469 Like-for-like growth in rental income, percent 3.7 5.4 5.1
Rental income, EUR million Like-for-like growth in rental income, percent
 Akelius Residential Property AB (publ) year-end report January to December summary Oct Dec Oct Dec Jan Dec Jan Dec Rental income, EUR million 129 124 482 469 Like-for-like growth in rental income, percent
Financial Analysis Workshop. Contents are subject to change. For the latest updates visit
 Financial Analysis Workshop Page 1 of 11 Why Attend In today s world, finance professionals are challenged with providing management a detailed analysis of the impact of the organization's financial decisions.
Rental income, EUR million Like-for-like growth in rental income, percent
 Akelius Residential Property AB (publ) interim report January to September summary Jul Sep Jul Sep Jan Sep Jan Sep Jan Dec Rental income, EUR million 120 116 353 345 469 Like-for-like growth in rental
Epra Key Performance Measures. Best Practices-Recommendations
 90 09 Information Epra Key Performance Measures. Best Practices-Recommendations The Reporting & Accounting Committee of (European Public Real Estate Association 1 ) updated in December 2014 a Best Practices
Akiş REIT 2Q18 Performance Presentation August 2018
 Akiş REIT 2Q18 Performance Presentation August 2018 1 Breaking News New Investment Project The project is located in the uprising Aldgate region (London) which is 20-25 min away from central London The
4Q & FY16/17 Financial Results
 4Q & FY16/17 Financial Results 24 April 2017 Important Notice This presentation shall be read in conjunction with Mapletree Industrial Trust s ( MIT ) financial results for Fourth Quarter Financial Year
2012 HALF-YEAR RESULTS 3-DIMENSIONAL REAL ESTATE
 3-DIMENSIONAL REAL ESTATE www.altareacogedim.com CONTENTS 1. Introduction 2. Residential 3. Offices 4. Retail 5. Finance 6. Outlook 2 INTRODUCTION 3 H1 2012 RESULTS Like-for-like SALES 728 m +50% +23%
Japan Real Estate Investment Corporation Performance Review for Fiscal Period Ended September 30, 2016 November 16, 2016
 Japan Real Estate Investment Corporation Performance Review for Fiscal Period Ended September 30, 2016 November 16, 2016 Message from President & CEO I would like to express our sincere appreciation that
1Q Results May
 1/18 First Quarter Results January-March 2018 14 May 2018 1cierre del tercer trimestre del ejercicio 2017, el Grupo Colonial ha obtenido un resultado neto At the close of the first quarter of 2018, the
ALE Property Group. 31 December 2017 Half Year Results. The Breakfast Creek Hotel, Brisbane, QLD
 ALE Property Group 31 December 2017 Half Year Results The Breakfast Creek Hotel, Brisbane, QLD 1 Contents Highlights December 17 Half Year Results Pub Property Portfolio Capital Management FY18 Outlook
Attached for release to the market is a Canberra Update booklet that was provided today as part of an Analyst and Investor tour of Canberra.
 23 June 2010 MIRVAC GROUP CANBERRA Attached for release to the market is a Canberra Update booklet that was provided today as part of an Analyst and Investor tour of Canberra. For further information please
FY17 RESULTS per share (+14% YoY) Dividends of the period 21.6% (+18.0% YoY) EPRA NAV per share increase m Assets revaluation (1)
 Dividends of the period 21.6% (+18.0% YoY) EPRA NAV per share increase m Assets revaluation (1)") FY17 RESULTS Trading Update AT A GLANCE In 2017 MERLIN Properties achieved excellent results in cash flow generation and portfolio value pushing shareholder return to a very high level TOTAL SHAREHOLDER
FY17 RESULTS Trading Update AT A GLANCE In 2017 MERLIN Properties achieved excellent results in cash flow generation and portfolio value pushing shareholder return to a very high level TOTAL SHAREHOLDER
Presentation for REITs Symposium 2016
 Presentation for REITs Symposium 2016 4 June 2016 Important Notice This presentation shall be read in conjunction with OUE Commercial REIT s Financial Results announcement for 1Q 2016 dated 10 May 2016.
Rental income, SEK million 1,016 1,040 3,051 3,095 4,109 Growth in rental income comparable properties, percent
 Akelius Residential Property AB (publ) interim report January to September summary Jul Sep Jul Sep Jan Sep Jan Sep Jan Dec Rental income, SEK million 1,016 1,040 3,051 3,095 4,109 Growth in rental income
ATRIUM Q RESULTS ANALYST AND INVESTOR CALL. 18 May 2016
 ATRIUM Q1 2016 RESULTS ANALYST AND INVESTOR CALL 18 May 2016 KEY EVENTS IN 2016 YTD OPERATIONAL PERFORMANCE Core Markets¹: NRI increased 1.2% to 36.3m; LFL NRI remained stable at 31.4m Russia continues
Investor Presentation. First Quarter 2015
 Investor Presentation First Quarter 2015 1 CAUTIONARY STATEMENTS Today s session and our answers to questions contain statements that constitute forward-looking statements about expected future events
DEVELOPING EAST CAIRO SINCE
 1 DEVELOPING EAST CAIRO SINCE 1959 MNHD at a glance 2 2019 MNHD Corporate History & Structure MNHD is currently positioned as one of the leading real estate developers in Egypt MNHD s history dates back
6M17 RESULTS. +5.7% FFO per share YoY % EPS YoY % EPRA NAV YoY +2.6% +3.4% +5.5% +16.3% All bps Occupancy vs 31/12/16
 6M17 RESULTS Trading Update CONSOLIDATED PERFORMANCE +5.7% FFO per share YoY +37.2% EPS YoY +12.2% EPRA NAV YoY Excellent set of results showing robust generation of cash flow FFO per share of 0.32 (+5.7%
Half-year financial report 2010
 ANF Immobilier Half-year financial report 2010 First half 2010 results: Follow-on strong growth in rents and cash flow Rents up 7.2% on a like-for-like basis EBITDA margin improves by 2.3 points to 80.6%
Market Commentary Perth CBD Office
 Market Commentary Perth CBD Office November 2016 Executive Summary The vacancy rate at 3Q16 is 24.7%, reflecting a quarterly increase of 0.1 percentage points. Two office projects are under construction
ALE Property Group. Annual General Meeting 13 November Breakfast Creek Hotel, Brisbane, QLD 1
 ALE Property Group Annual General Meeting 13 November 2018 Breakfast Creek Hotel, Brisbane, QLD 1 Contents Highlights FY18 Results Properties and Development Updates Capital Management FY19 Outlook Attractive
Second Quarter 2008 Results
 Second Quarter 2008 Results Earnings Release and Supplemental Financial Information Investor Relations Contact: Julia Freitas ri@gafisa.com.br 1 Overview of 2Q08 Results - Wilson Amaral, CEO Financial
Sharp rise in first-half 2002 results Outlook remains favourable
 Sharp rise in first-half 2002 results Outlook remains favourable The premier French commercial real estate company Unibail s sound strategic positioning has been rewarded by an increase in all performance
Interim presentation. 13 July, Anders Nissen, CEO Liia Nõu, CFO
 Interim presentation 13 July, 2018 Anders Nissen, CEO Liia Nõu, CFO Profitable growth 20% R12M Return on equity 2 1 2 3 Profitable acquisitions in new large markets Continued strong development in Brussels
Briefing Melbourne Fringe Office February 2018
 Savills Research Victoria Briefing Melbourne Fringe Office Highlights The St Kilda Road office market recorded positive net absorption for the first-time in three years causing its vacancy rate to fall
May 10, 2016 Halifax, Nova Scotia KILLAM APARTMENT REIT ANNOUNCES 20% INCREASE IN FFO PER UNIT IN Q1 2016
 May 10, 2016 Halifax, Nova Scotia KILLAM APARTMENT REIT ANNOUNCES 20% INCREASE IN FFO PER UNIT IN Q1 2016 Killam Apartment REIT (TSX: KMP.UN) ("Killam") is pleased to report its Q1 2016 results, including
PRIMARIS RETAIL REIT Announces Third Quarter Results
 PRIMARIS RETAIL REIT Announces Third Quarter Results Toronto (Ontario) November 8, 2011 Primaris Retail REIT (TSX:PMZ.UN) is pleased to report positive operating results for the third quarter of 2011.
PRESENTATION RESULTS Q Aldar Q Results
 Q1 2018 RESULTS PRESENTATION DISCLAIMER This disclaimer governs the use of this presentation. You must not rely on the information in the presentations and alternatively we recommend you to seek advice
Strong management team
 Strong management team Stable & transparent REIT framework Solid operational performance Top quality shareholder base High quality property portfolio 1 A strong management team Unprecedented learning curve
Interim results. for the period ended 31 December 2014
 Interim results for the period ended 31 December 2014 Introduction 2 Introduction to Delta International First African (excluding South Africa) focused property fund listed on the JSE Offers investors
THE TRAFFORD CENTRE LIMITED QUARTERLY REPORT. CASHFLOW STATEMENT AND MANAGEMENT COMMENTARY FOR THE PERIOD ENDING 30 June 2018
 THE TRAFFORD CENTRE LIMITED QUARTERLY REPORT CASHFLOW STATEMENT AND MANAGEMENT COMMENTARY FOR THE PERIOD ENDING 30 June 2018 340,000,000 Class A2 6.50 per cent. Secured Notes due 2033 120,000,000 Class
Financial Modeling Workshop Using Excel
 Financial Modeling Workshop Using Excel Page 1 of 11 Why Attend Financial modeling is crucial for taking investment decisions that can have a huge financial impact on companies. By attending this course,
Zug Estates Group. Financial Year Tobias Achermann, CEO Gabriela Theus, CFO. March 11, 2016
 Zug Estates Group Financial Year 2015 Tobias Achermann, CEO Gabriela Theus, CFO March 11, 2016 2015 in a nutshell Gratifying result Operating income before depreciation and revaluation CHF 39.2 Mio. +4.0%
仁恒置地集团 YANLORD LAND GROUP LIMITED. 4Q and FY 2017 Results Presentation
 仁恒置地集团 YANLORD LAND GROUP LIMITED 4Q and FY 2017 Results Presentation Yanlord 4Qand FY 2017Business Review Yanlord 4Q and FY 2017 Business Review Averagesellingprice( ASP )rosesignificantlyin4q2017tormb66,234/sqmfromrmb25,739/sqm
FY 2015 Results TLG IMMOBILIEN AG March FY 2015 Results Presentation
 FY 2015 Results TLG IMMOBILIEN AG March 2016 DISCLAIMER This presentation includes statements, estimates, opinions and projections with respect to anticipated future performance of TLG IMMOBILIEN ("Forward-Looking
3M17 RESULTS. +4.6% FFO per share YoY % NAV per share YoY. +2.6% Rents like-for-like (3) YoY. +3.6% Office release spread
 YoY. +3.6% Office release spread") 3M17 RESULTS Trading Update CONSOLIDATED PERFORMANCE +4.6% FFO per share YoY +14.1% NAV per share YoY Excellent set of results showing value creation across all metrics FFO per share of 0.16 (+4.6% YoY)
3M17 RESULTS Trading Update CONSOLIDATED PERFORMANCE +4.6% FFO per share YoY +14.1% NAV per share YoY Excellent set of results showing value creation across all metrics FFO per share of 0.16 (+4.6% YoY)
Presentation Results. 6th March 2015
 Presentation 6th March 2015 2014 Review Strong underlying profit Increased contribution from commercial portfolio Moderately reduced residential performance despite strong profits from Hong Kong and mainland
Gecina: Mcap: 11.3 billion. COIMA RES: Mcap: 277 million 2017 EPRA EPS growth: 223% 2017 EPRA EPS growth: 10% 2017 EPRA NAV ps growth: 5%
 Gecina: Mcap: 11.3 billion 2017 EPRA EPS growth: 4% 2017 EPRA NAV ps growth: 18% EPRA cost ratio (incl. direct vacancy costs): 21.1% EPRA topped up NIY: 3.63% EPRA vacancy rate: 4.4% LTV: 41.4% 2017 GRESB
Interim statement from the Board of Directors for the first quarter of 2015
 Regulated information - under embargo until 05/05/2015, 8 a.m. Antwerp, 5 May 2015 Interim statement from the Board of Directors Acquisition of a modern logistics site of approximately 52.000 m² in a prime
NEWS RELEASE For immediate release
 NEWS RELEASE For immediate release Laura Clark 904 598 7831 LauraClark@RegencyCenters.com Regency Centers Reports Third Quarter 2018 Results Company Increases 2018 Guidance JACKSONVILLE, FL. (October 25,
2013 Half Year Results
 2013 Half Year Results 31 July 2013 Geopost, Enfield An active and successful period Strong operational performance Lettings up 30% Good momentum in development pipeline Further cost savings achieved Portfolio
Highwoods Reports Second Quarter 2018 Results
 FOR IMMEDIATE RELEASE Ref: 18-14 Contact: Brendan Maiorana Senior Vice President, Finance and Investor Relations 919-431-1529 Highwoods Reports Second Quarter 2018 Results $0.49 Net Income per Share $0.87
This document does not constitute an offer to sell or an invitation or solicitation of an offer to subscribe for or purchase any securities, and
 This document has been prepared by Atrium (the Company ). This document is not to be reproduced nor distributed, in whole or in part, by any person other than the Company. The Company takes no responsibility
THE TRAFFORD CENTRE LIMITED QUARTERLY REPORT. CASHFLOW STATEMENT AND MANAGEMENT COMMENTARY FOR THE PERIOD ENDING 31 December 2017
 THE TRAFFORD CENTRE LIMITED QUARTERLY REPORT CASHFLOW STATEMENT AND MANAGEMENT COMMENTARY FOR THE PERIOD ENDING 31 December 2017 340,000,000 Class A2 6.50 per cent. Secured Notes due 2033 120,000,000 Class
Market update Q3 2017
 Market update Q3 2017 1 Rikshem in brief Total property value SEK 40.3 bn Portfolio comprising c. 600 properties with c. 28,000 apartments. Lettable area c. 2.2 million sqm Annual rental income 2016 was
ANF Immobilier. Analyst Meeting 4/3/2015
 Image 1 ANF Immobilier Analyst Meeting 4/3/2015 2 10 years of ANF Immobilier 04 March 2015 3 Transformation 4 Total Shareholder Return 2005-2015 65 1,09 55 45 0,80 1,86 1,18 1,24 1,36 1,45 1,54 1,69 3,06
Metropolitan Tract Performance Report for the Quarter Ended September 30, 2009
 VII. STANDING COMMITTEES F 4 B. Finance, Audit and Facilities Committee Metropolitan Tract Performance Report for the Quarter Ended September 30, 2009 Attachment Metropolitan Tract performance Report for
Best Practices Recommendations. Q&A November EPRA Best Practices Recommendations Q&A November
 Best Practices Recommendations Q&A November 2016 EPRA Best Practices Recommendations Q&A November 2016 1 Contents 1. Introduction 03 2. General Recommendations 04 3. EPRA Earnings 05 4. EPRA NAV 15 5.