2018 Annual Results Presentation
|
|
|
- Christine Bishop
- 5 years ago
- Views:
Transcription


1 2018 Annual Results Presentation 18/02/2019
2 Overview 1 Introduction & Property Portfolio at 31 December Rental Activity 3 Property Transactions 4 Financial Statements & Results Appendices 2

3 1 Introduction & Property Portfolio at 31 December
 Attributable net profit: Statement of Financial Position 351.6m Portfolio value (excl. transfer costs): 6,570m (up 5.5%) EPRA NNNAV: 4,017m (up 7.7%) representing 86.")
4 1 Key Indicators Performance indicators Profit and Loss Account Rental income: 193.5m (up 5.0% like-for-like) EPRA Earnings: 106.7m (up 4.1%) Attributable net profit: Statement of Financial Position 351.6m Portfolio value (excl. transfer costs): 6,570m (up 5.5%) EPRA NNNAV: 4,017m (up 7.7%) representing 86.3/share Business indicators Average nominal rent: 646/sq.m./year Average lease maturity: 5.0 years Physical occupancy rate: 97.3% EPRA vacancy rate: 1.6% Debt Average maturity: 4.6 years Average spot cost: 1.5% Loan-to-value: 24.1% Interest cover: 5.1x 4

 14.2% 13.")
5 4 EPRA Performance Indicators ( m) EPRA earnings /share EPRA NAV /share EPRA NNNAV /share , , , , (%) EPRA Net Initial Yield 2.8% 2.8% EPRA topped-up Net Initial Yield 3.2% 3.2% EPRA Vacancy Rate 1.6% 3.1% EPRA Cost Ratio (incl. vacancy costs) 14.2% 13.6% EPRA Cost Ratio (excl. vacancy costs) 13.0% 12.2% 5
6 Highlights DEVELOPMENT Louvre Saint-Honoré: New building permit application submitted (16,000 sq.m.) 96 Iéna: Building permit obtained (9,600 sq.m.), modified permit application submitted, property being prepared for redevelopment 112 Zola: Building permit obtained (24,500 sq.m.), property being prepared for redevelopment MARKETING PROGRAMME Leases signed on 21,000 sq.m. 15.1m of additional rental income Average nominal rent of 704/sq.m. (offices) FINANCING Bond issue: 500m, 7 years, 1.50% 300m negotiable European commercial paper (NEU-CP) programme Bond buyback: 300m Average cost of debt: 1.5% OWNERSHIP STRUCTURE Colonial s stake increased to 81.7% 6

 o Including 19bn invested in offices (up 17% vs 2017), representing 83% of the total market A")
, with 10.")


7 1 Paris Region Investment Market in 2018 < 50m Historic performance by Paris region investment market Investment volume by deal size ( bn) m - 100m 300m - 500m > 500m % 100m - 300m 23.1 Record number of transactions and record investment volume in 2018: 366 transactions (vs long-term average of 253), 23.1bn investment volume (up 70% vs long-term average) o Including 19bn invested in offices (up 17% vs 2017), representing 83% of the total market A performance partly due to strong demand for big ticket properties: m-plus transactions in 2018, representing 64% of the total market Market for 50m- 100m properties up 38%. Stable market for properties up to 50m Demand still very strong for Paris properties (46% of the Paris region market), with 10.5bn of investment, including 6.5bn in the CBD Foreign investors accounted for 44% of the market in American and German investors were the most active, accounting for 10% and 9% respectively Prime yields expected to stay at their minimum level of 3% at least until Q Examples of major transactions in 2018 Source: JLL Capital 8 Paris 8 114, Champs-Elysées Paris 8 Passage d Avenir Paris 2 Window La Défense Tour Ariane La Défense 44,000 sq.m. Approx. 3.6% 848.5m/ 19,000 per sq.m. Vendor: Unibail Buyer: Invesco 5,500 sq.m. 2.4% Approx. 600m Vendor: EPI Buyer: BVK 32,000 sq.m. 3.25% 525m/ 16,500 per sq.m. Vendor: Altaréa Buyer: CNP 41,000 sq.m. 3.95% 510m/ 12,600 per sq.m. Vendor: Groupama Buyer: Oxford 63,000 sq.m. Approx. 5.0% 500m/ 8,000 per sq.m. Vendor: Unibail Buyer: GIC 7
, 10% above ten-year average of 2.")

8 1 Paris Region Rental Market in 2018 COMPLETED LETTINGS: A STRONG YEAR FEWER IMMEDIATELY AVAILABLE PROPERTIES AND LOWER VACANCY RATE: A TIGHT MARKET 2008/2017 average Paris Centre West Rest of Paris La Défense Western Crescent Inner Rim Outer Rim Dynamic rental market in 2018 after a record 2017, with leases signed on 2.5 million sq.m. (down 5% vs 2.64 million sq.m. in 2017), 10% above ten-year average of 2.3 million sq.m. After an historic first half, the economic slowdown led to a sharp drop in rental activity in Q3, followed by a tentative recovery in Q4 The number of big ticket leases declined significantly, with 81 leases signed on 5,000 sq.m-plus units (vs 87 in 2017), a 13% fall in volume year-on-year Big ticket leases continue to account for around 40% of total Paris region rental volume Strong demand for small and medium-sized units, with leases signed on 1.5 million sq.m. (up 1% vs 2017), 11% more than the ten-year average Leases signed on over 450,000 sq.m. in Paris CBD, despite shortage of available properties Immediately available units % new/redeveloped The vacancy rate continued to fall rapidly: to 5.1% in the Paris region and to 1.4% in the CBD (vs 6.4% and 2.7% respectively at end-2017) Immediately available units in Paris region fell below symbolic 3 million sq.m. mark, with 2.9 million sq.m. available at end-2018 (down 15% vs 2017) Decline accompanied by an increase in the proportion of new and redeveloped properties, to 20% (vs 15% in 2017), reversing the trend observed in prior years. Rental incentives contracted slightly to 20.7% in the Paris region, with a low of 16% in Paris itself Prime rental values in Paris were higher, at 810/sq.m. vs 780/sq.m. in Q (source: JLL) Despite an increase in the proportion of new and redeveloped properties, the rental pipeline is stable at approximately 1.9 million sq.m. Growing shortage of properties expected to drive up rental values, despite the less favourable economic environment in 2019 Source: CBRE 8
9 1 Analysis of Property Portfolio Value Consolidated portfolio value up 5.5% vs 2017: 6,570m excluding transfer costs - 7,005m including transfer costs Consolidated data ( m, excl. TC) , % Average value per sq.m.: 17,519/sq.m. excl. transfer costs , EPRA topped-up NIY: 3.2% (3.2% at 31 December 2017) Topped-up NIY Offices: 3.3% Topped-up NIY Retail: 2.8% Dec CAPEX Fair value adjustments 31 Dec
 21% 19 17 12 6 1% 11 3 15 14 13 16 5 10 1 18 4 78% 2 Offices Retail Residential 9 7 8 16%")
10 1 The Benchmark in the Paris Prime Commercial Property Market 6,570m portfolio, 98.5% located in Paris, as shown below: Market focus (value) 21% % % 2 Offices Retail Residential % Geographic focus (value) 1% 20 83% Paris CBD Paris Other Western Crescent 10
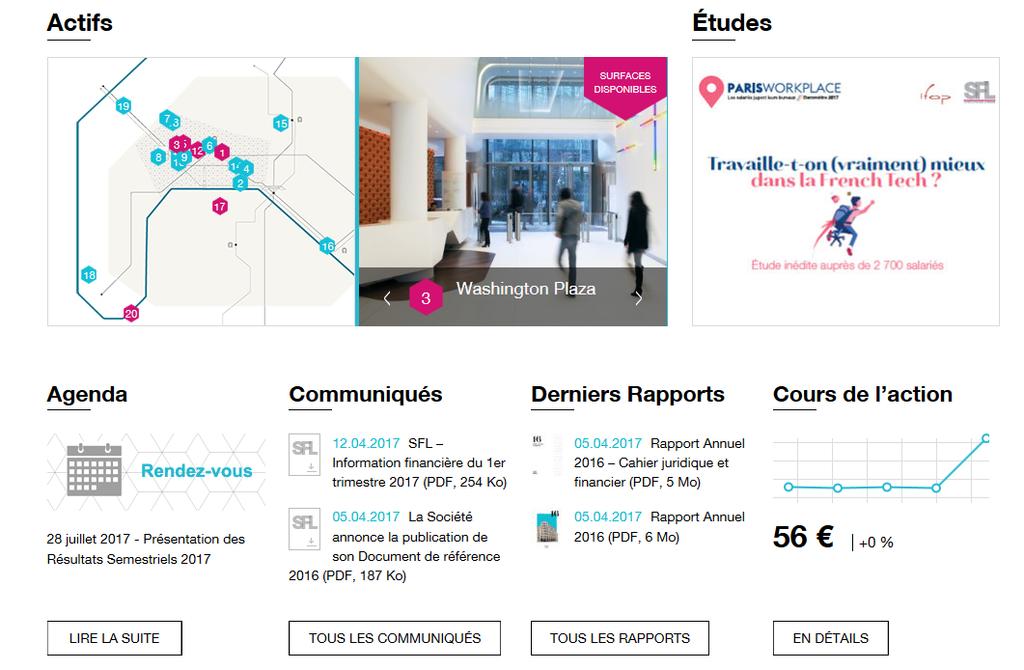
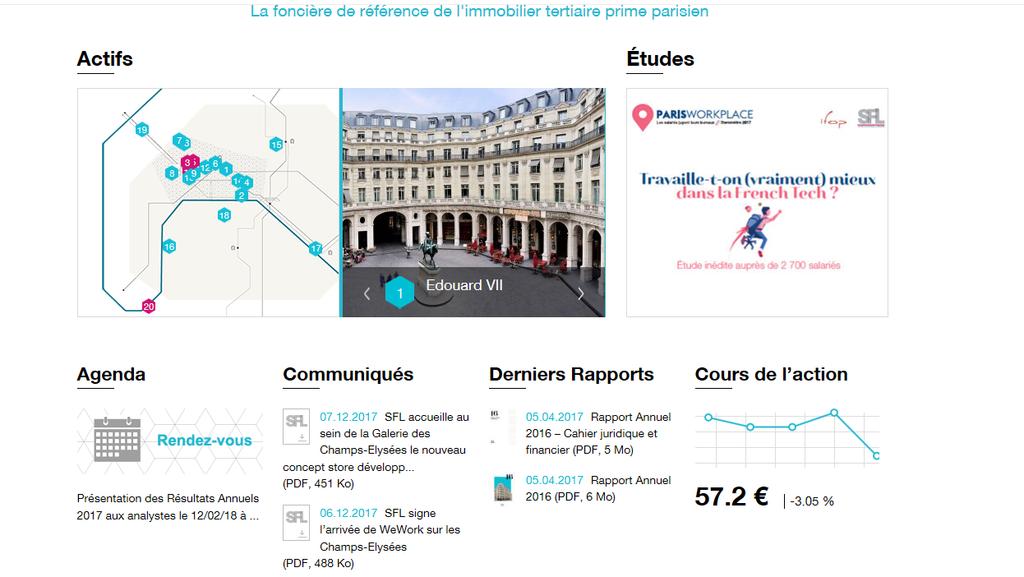
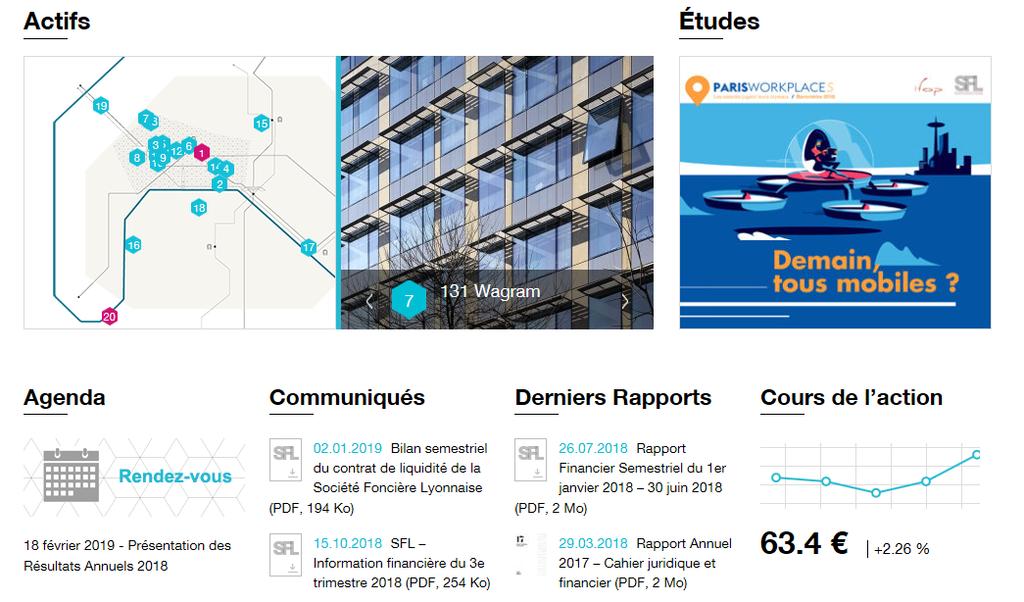
11 1 Property Portfolio: 392,300 sq.m Paris Edouard VII Louvre Saint-Honoré Washington Plaza Total surface area (1) 54,100 sq.m. 47,700 sq.m. 47,000 sq.m Western Crescent 176 Charles de Gaulle Neuilly-sur-Seine Le Vaisseau Issy-les-Moulineaux Total surface area (1) 7,400 sq.m. 6,300 sq.m. 4 #cloud.paris 35,000 sq.m. TOTAL 13,700 sq.m. 5 Cézanne Saint-Honoré 29,000 sq.m. 6 7 Condorcet 24,900 sq.m. 112 Zola 24,500 sq.m. * 8 Rives de Seine 22,700 sq.m Grenelle 18,900 sq.m. Haussmann Saint-Augustin 13,400 sq.m. 96 Iéna 9,600 sq.m. 131 Wagram 9,200 sq.m. 90 Champs-Elysées 8,900 sq.m. * Paris CBD Paris Other Western Crescent 14 Galerie Champs-Elysées 8,700 sq.m Champs-Elysées 7,700 sq.m. 9 Percier 6,700 sq.m. 112 Wagram 6,000 sq.m. 6 Hanovre 4,600 sq.m. TOTAL 378,600 sq.m. (1) Including infrastructure and excluding car parks * Planned surface area 11


12 1 s CSR Policies 5 th /Ifop Paris WorkPlace Survey 2018 EPRA Awards: 2,000 employees surveyed Paris Conference in June topic: mobility has earned Green Star ranking in each Global Real Estate Sustainability Benchmark (GRESB) survey since % of in-use properties are certified as meeting Breeam In-Use International (BIU) standards The recently delivered redevelopment projects all comply with the following three standards: - BREEAM New Construction - LEED - HQE 12


13 A FAIRE 2 Rental Activity
14 2 Rental Income and Reversionary Potential Rental income growth in 2018: 5.0% on a like-for-like basis 210 M Reversionary potential (Consolidated data, 100% basis) 200 M 195, (1.4) (9.7) ,5 60m 50m 56m 190 M 40m 42m 30m 180 M 20m 10m 11m 170 M 0m 3m 2017 rental income Δ Like-for-like increase Δ Post-renovation remarketing/ Major renovations Δ Property disposals/ Acquisitions Δ Lease termination penalties 2018 rental income Properties undergoing renovation Relets Vacant properties 14


15 2 Rental Income Breakdown A diversified portfolio of very high value-added tenants 2018 rental income: 193.5m 20% 2% Breakdown by tenant business at 31 December 2018 Real estate companies 7% Other 12% 32% Finance/ Insurance Manufacturers 10% 78% Digital/ Media companies Offices Retail Other 13% Fashion houses FINANCE/ LAW FIRMS/ DIGITAL/MEDIA FASHION HOUSES INSURANCE CONSULTANCIES MANUFACTURERS REAL ESTATE COMPANIES OTHER COMPANIES 12% 14% Law firms/ Consultancies 2018 RESULTS 18/02/
16 2 Occupancy rate at 31 December 2018 Physical occupancy rate: 97.3% (1) (vs 96.4% at 31 December 2017) EPRA vacancy rate: 1.6% (1) (vs 3.1% at 31 December 2017) Physical occupancy rate 100% EPRA vacancy rate 15% 95% 10% 90% 5% 85% 0% déc-15 juin-16 déc-16 juin-17 déc-17 juin-18 déc-18 (1) Surface area attributable to 16
17 2 Office Marketing Programmes 16,000 sq.m. Total surface area leased during the year 11.9m Total nominal rent 704/sq.m. 610/sq.m. Average nominal rent (excl. staff restaurant) Average effective rent (excl. staff restaurant) 13.4%* 6 years Non-cancellable period * Incentive rate 17


18 2 Marketing Programmes and Occupancy Rates Main leases signed in % occupied* Louvre Saint-Honoré Offices Paris 1 100% occupied* Washington Plaza Paris 8 100% occupied* Cézanne Saint-Honoré Paris 8 Financial institution 2,300 sq.m. Signed on 26 March and 15 May years 1,000 sq.m. Signed on 8 March years 3,300 sq.m. Signed on 26 July years 2,000 sq.m. Signed on 2 July years 1,000 sq.m. Signed on 11 January /9/10 years 1,900 sq.m. Signed on 23 August /9/10 years 1,800 sq.m. Signed on 17 January /9/10 years 100% occupied* 100% occupied* 100% occupied* 100% occupied* 98% occupied* 100% occupied* #Cloud.paris Paris Grenelle Paris 7 92, Champs-Elysées Paris 8 Condorcet Paris 9 Edouard VII Paris 9 Rives de Seine Paris 12 * Physical occupancy rate at 31 December RESULTS 18/02/
19 2 Lease Renewals Commercial lease expiry dates 25% 20% 18% 19% 21% 15% 16% 15% 13% 13% 15% 12% 10% 9% 9% 10% 9% 5% 0% 4% 2% 4% 3% beyond 2028 Lease renewal date Next break option 5% 1% 2% Average office rent at 31 December 2018: 646/sq.m./year (vs 629 at 31 December 2017 Average period (1) to lease expiry: 5.0 years (vs 5.5 at 31 December 2017) Average period to next potential exit date (2) : 3.6 years (vs 3.8 at 31 December 2017 (1) Weighted average remaining term of commercial leases in progress at 31 December 2018 (2) Weighted average period to next potential exit date for commercial leases in progress at 31 December


20 A FAIRE 3 Property Transactions 20


21 3 A Lesson in Value Creation: Washington Plaza Common areas redesigned Offices modernised New user-dedicated services New 250-sq.m. entrance hall, mezzanine and restaurant Planted areas, outside terraces and gardens New architectural identity Interior design Technical upgrades Divisible open floor space New design New offer: fitness centre, flexible meeting rooms, relaxation/well-being area, 42 lounge café User newsletter ( the 42 ) Welcome at Work concierge services USER EXPERIENCE AND WELL-BEING / IMPROVED WORKING ENVIRONMENT Sharply higher rents 100% occupancy rate Years Surface area 6,700 sq.m. 3,000 sq.m. 2,000 sq.m. 5,200 sq.m. 2,000 sq.m. 3,300 sq.m. Rent 633/sq.m. 651/sq.m. 655/sq.m. 670/sq.m. 736/sq.m. 745/sq.m. Occupancy rate 88% 91% 88% 96% 100% 21
22 3 Current Redevelopment Projects* Projects launched during the year 96 Iéna: 6,400 sq.m. Edouard VII: 2,500 sq.m. Louvre Saint-Honoré: 1,600 sq.m. 9 Percier: 800 sq.m. Other: 900 sq.m. Projects delivered during the year Cézanne Saint-Honoré: 1,800 sq.m. Washington Plaza : 500 sq.m. 46,500 sq.m. 112 Zola 24,500 sq.m. 96 Iéna 2,300 sq.m. Louvre Saint-Honoré 17,100 sq.m. +12,200 sq.m. - 2,300 sq.m. 54,600 sq.m. 112 Zola 24,500 sq.m. 96 Iéna 8,700m² Louvre Saint-Honoré 18,700 sq.m. 31 Dec Projects launched Projects delivered 31 Dec * Attributable to Including infrastructure and excluding car parks Other 2,600 sq.m RESULTS 18/02/2019 Other 4,500 sq.m. 22

23 3 Louvre Saint-Honoré Paris 1 A unique location in the capital s historic and cultural centre 23
 Administrative permits have been applied for Work has begun")
24 3 Louvre Saint-Honoré Paris 1 Creation of 16,000 sq.m. of retail space at the foot of the building Architect: B-Architecture Three floors to be redeveloped (lower ground/ground/upper ground) Administrative permits have been applied for Work has begun (relocation of staff restaurant/technical facilities) Studies Redevelopment work New tenants Feasibility studies, site clearance Permit applications submitted/permits obtained, marketing & signature of new leases, units vacated Work phase 24


25 3 96 Iéna Paris 16 IRR > 8% ROI 5% Studies Redevelopment New tenant August 2017 Dec Dec Q Q Building permit applied for Building permit obtained Start of redevelopment work Final tenants moved out Scheduled delivery 25


26 3 96 Iéna Paris 16 Before An iconic modern building Architect: Dominique Perrault After 26

27 3 96 Iéna Paris 16 Before After OFFICES OFFICES 8,900 sq.m. 9,600 sq.m. * Offices and service areas Highly flexible and efficient office floors, roughly 1,000 sq.m. each New dedicated service areas (cafeteria, ERP business centre, lounge, gardens) New central atrium opening onto a patio bathed in natural light Areas open to the public (200-seat auditorium, meeting rooms) New landscaped garden on the central patio Roof top/terrace area with direct views of the Arc de Triomphe Excellent environmental performance (triple certification) 27


28 3 112 Zola Paris 15 IRR 8% ROI > 5% Studies Redevelopment New tenant Jan August 2017 Nov May 2018 Q H Building permit applied for Acquired by SMA moved out Building permit obtained Work started to prepare site, remove asbestos Scheduled delivery 28


29 3 112 Zola Paris 15 The first new generation business centre in Western Paris Architect & Designer: YMA and Jouin-Manku Before After 29
")


30 3 112 Zola Paris 15 Before After A building that is obsolete, but: Ideally located in the 15th arrondissement (5 minutes from Beaugrenelle shopping centre) A large 6,300-sq.m. plot Redevelopment of existing building New architectural identity Walkways connecting to new building Very successful interior design Landscaped areas and terraces Tree-shaded outside space Construction of a new building One of the first BBCA-certified buildings in Paris 21,000 sq.m. + 3,500 sq.m. 24,500 sq.m. 30
31 3 Redevelopment Pipeline PROPERTY PERMIT STUDIES/REDEVELOPMENT 96 Iéna 112 Zola Louvre Saint-Honoré Obtained Obtained Obtained /85m 105/115m 14-16m 40/45m CAPEX 13-15m 7-8m ERV Louvre Saint Honoré 112 Zola 96 Iéna 31

32 4 Financial Statements & Results 32
33 Results m Change Rental income % Property expenses, net of recoveries (10.8) (10.9) Net rental income % Service and other revenues Depreciation, amortisation and provision expense, net (2.9) 0.3 Employee benefits expense and other expenses (21.8) (23.3) Operating profit before disposal gains and fair value adjustments % Profit on asset disposals Fair value adjustments on investment property Finance costs and other financial income and expenses (52.0) (40.7) Income tax expense (14.5) (42.5) Profit for the year Non-controlling interests (33.0) (111.0) Attributable net profit EPRA earnings % 33
34 4 EPRA earnings m Recurring EPRA Change Non recurring Recurring EPRA Non recurring Recurring EPRA Rental income % Property expenses, net of recoveries (10.8) 0 (10.9) 0 Net property rentals % Service and other revenues Depreciation, amortisation and provision expense, net (2.9) Employee benefits expense and other expenses (21.8) 0 (20.4) (3.0) Operating profit before disposal gains and fair value adjustments (3.0) -2.9% Profit on asset disposals Fair value adjustments on investment property Finance costs and other financial income and expenses (30.6) (21.4) (41.2) % Income tax expense (9.2) (5.3) (9.2) (33.3) -0.2% EPRA earnings before non-controlling interests Non-controlling interests (15.7) (17.3) (14.2) (96.8) EPRA earnings EPRA earnings per share % 34
35 4 Consolidated Statement of Financial Position m 31 Dec Dec Assets Investment property 6,458 6,119 Other non-current assets Total non-current assets 6,481 6,144 Properties held for sale 0 0 Other current assets Total current assets Total Assets 6,589 6,249 Equity & Liabilities Equity 4,010 3,763 Non-controlling interests Total equity 4,512 4,239 Non-current liabilities 1,737 1,904 Current liabilities Total Equity and Liabilities 6,589 6,249 35
36 4 Consolidated Loan-to-Value Maturities of debt at 31 December 2018 ( m)* 600 m 31 Dec Dec Change Bonds 1,200 1, Bank loans (394) Mortgage loans (2) NEU CP Total debt 1,714 1, Cash and cash equivalents Net debt 1,688 1, Undrawn lines of credit Property portfolio incl. TC 7,005 6, Loan-to-value 24.1% 24.6% -0.5pt Interest cover 5.1x 4.0x +1.1x Average maturity (years) Average spot cost of debt (after hedging) 1.5% 1.7% -0.2pt Undrawn lines of credit 300 Mortgage loans Bank loans 200 Bonds * After allocating NEU CP issuance to back-up lines of credit New 300m Negotiable European Commercial Paper programme May 2018 bond issue: 500m, 7 years, 1.50% S&P rating: BBB+/A2 with a stable outlook 36
37 4 Net Asset Value m 31 Dec Dec Equity 4,010 3,763 Treasury shares and stock options Unrealised capital gains Elimination of financial instruments at fair value 0 (1) Elimination of deferred taxes EPRA NAV 4,142 3,889 /share Financial instruments at fair value 0 1 Fixed-rate debt at fair value (22) (63) Deferred taxes (103) (99) EPRA NNNAV 4,017 3,729 /share Number of shares (thousands) 46,529 46,529 Change +6.5% +7.7% Growth in EPRA NNNAV ( m) NNNAV at 31 December ,729 Change in fair value of attributable assets +268 Profit on asset disposals 0 Change in fair value of debt and other financial instruments +21 EPRA Earnings +107 Dividends (106) Other (2) NNNAV at 31 December ,017 37
38 4 Dividende per share ( per share) 3 2,65 2,5 2,30 2,10 2 1,5 1 1,05 Dividend recommended for shareholder approval at the Annual Meeting of 05/04/19 0,5 1, Dividend Other distribution 38
39 4 Key Figures Change Rental income 193.5m 195.8m -1.2% up 5% like-for-like Operating profit before disposal gains and fair value adjustments 162.1m 164.1m -1.2% Profit on asset disposals and fair value adjustments on investment property 289.0m 715.4m EPRA earnings 106.7m 102.4m +4.1% Attributable net profit 351.6m 685.3m 31 Dec Dec Change Equity 4,010m 3,763m +6.6% Consolidated portfolio value (excluding TC) 6,570m 6,229m +5.5% EPRA NNNAV 4,017m 3,729m /share % 39


40 4 Questions/Answers RESULTS 18/02/

41 Appendices 41

42 in Brief The benchmark in Paris prime commercial property Founded in 1879: 140 years of sustainable business development Managing a 6.6 billion, 392,300 sq.m. property portfolio 99% of assets in Paris, of which 83% in the CBD 78% offices and 21% retail units 20 very large property complexes A very high value-added tenant portfolio 42


43 Organisational Structure Juan José Brugera Clavero Chairman Nicolas Reynaud Chief Executive Officer Dimitri Boulte Managing Director François Sebillotte Chief Resources Officer Dimitri Boulte Chief Operating Officer Fabienne Boileau Chief Financial Officer Human Resources Legal Internal Audit Information Systems Corporate Services Sales & Marketing Investments Asset Management Technical & Development Accounting Consolidation Budget Control Cash Management & Financing 43
 by age group (on payroll at 31 December 2018) Employees (1) by years of")
44 Human Resources Number of employees 31 Dec Dec Administrative staff 1 4 Supervisors Managers Total headquarters Building caretakers 2 2 Employees (1) by age group (on payroll at 31 December 2018) Employees (1) by years of service (on payroll at 31 December 2018) 60 and over 50 to to to to 29 More than 15 years 11 to 15 years 6 to 10 years 1 to 5 years Less than 1 year Average age: 44 years Average years of service: 11 years (1) Excluding building caretakers 44

 Free float 4,5%")


45 Ownership Structure at 31 December 2018 Predica 13,2% ownership structure (46.5 million shares) Free float 4,5% Treasury shares 0.6% Colonial ownership structure at 28 January 2019 Grupo Finaccess 16% Colonial 81,7% Free float 58% Aguila LTD (Santo Domingo) 6% Qatar Investment Authority 20% 45
46 Governance structure at 15 February 2019 Board of Directors Juan José Brugera Clavero Pere Viñolas Serra Angels Arderiu Ibars Ali Bin Jassim Al Thani Jean-Jacques Duchamp Chantal du Rivau Carlos Fernandez-Lerga Garralda Carmina Ganyet I Cirera Carlos Krohmer Arielle Malard de Rothschild Luis Maluquer Trepat Nuria Oferil Coll Alexandra Rocca Anthony Wyand Chairman of the Board of Directors (Colonial) Vice-Chairman (Colonial) Director (Colonial) Director Director (Prédica) Director (Prédica) Director (Colonial) Director (Colonial) Director (Colonial) Independent director Director (Colonial) Director (Colonial) Independent director Independent director Audit Committee Carlos Fernandez-Lerga Garralda (Chairman) Jean-Jacques Duchamp Carmina Ganyet I Cirera Arielle Malard de Rothschild Remuneration and Selection Committee Anthony Wyand (Chairman) Pere Viñolas Serra Arielle Malard de Rothschild Executive and Strategy Committee Juan José Brugera Clavero (Chairman) Jean-Jacques Duchamps Carmina Ganyet I Cirera Pere Viñolas Serra Committee of Independent Directors Arielle Malard de Rothschild Alexandra Rocca Anthony Wyand 46
47 Share Performance 2018 Share Performance (1) 2018 Key Figures : +11.3% Number of shares at 31 December 2018 (thousands) Average daily trading volume (shares) 46,529 2, Average daily trading volume (euros) 129k 95 CAC 40: -11.0% Closing share price on 31 December EPRA Europe: -11.2% High for the year (9 November) SIIC: -21.5% Low for the year (2 January) déc.-17 janv.-18 févr.-18 mars-18 avr.-18 mai-18 juin-18 juil.-18 août-18 sept.-18 oct.-18 nov.-18 déc.-1 Cours share price CAC 40 SIIC Indice index SIIC EPRA Europe Closing share price on 31 December (1) Baseline 100: 31 December 2017; data up to 31 December 2018 Sources: Euronext/EPRA 47
48 Legal Structure at 31 December 2018 SOCIETE FONCIERE LYONNAISE SA 100% Locaparis SAS 66% Washington SCI 100% 100% 100% 100% 100% Paul Cézanne SCI 103 Grenelle SCI Condorcet SNC Société Immobilière Victoria - SAS Maud SAS 50% Parholding SAS 100% 100% 100% Parchamps SCI Pargal SCI Parhaus SCI SA (Société Anonyme) SAS (Société par Actions Simplifiée) SCI (Société Civile Immobilière) SNC (Société en Nom Collectif) 48
49 CAPEX (1) Expenditure ( m) Major redevelopment projects * Other capitalised expenditure Total (1) Excluding capitalized borrowing costs and other expenses * Of which: 112 Zola: 10.2m; Louvre Saint-Honoré: 6.0m; 96 Iéna: 5.1m 49
50
2018 Interim Results Presentation
 2018 Interim Results Presentation Overview 1 Introduction & Property Portfolio at 30 June 2018 2 First-Half 2018 Rental Activity 3 Property Transactions 4 First-Half 2018 Financial Statements & Results
2017 Interim Results Presentation
 2017 Interim Results Presentation Overview 1 Introduction & Property Portfolio at 30 June 2017 2 First-Half 2017 Rental Activity 3 Property Transactions 4 First-Half 2017 Financial Statements & Results
2016 Annual Results Presentation
 2016 Annual Results Presentation 13 FEBRUARY 2017 Overview 1 Introduction & Property Portfolio at 31 December 2016 2 2016 Rental Activity 3 Property Transactions 4 Financial Statements & Results Appendices
2017 Annual Results Presentation
 2017 Annual Results Presentation 12 February 2018 Overview 1 Introduction & Property Portfolio at 31 December 2017 2 2017 Rental Activity 3 Property Transactions 4 Financial Statements & Results Appendices
2013 ANNUAL RESULTS PRESENTATION
 2013 ANNUAL RESULTS PRESENTATION 2013 Annual Results Overview I. Introduction & Property Portfolio at 31 December 2013 II. Rental Activity III. Property Transactions IV. Financial Statements & Results
INVESTOR DAY. October 17 th 2018
 INVESTOR DAY October 17 th 2018 Introduction & Property SFL Portfolio 2018 INTERIM RESULTS 27 JULY 2018 2 1 PARIS REGION MARKET 2018 (at September 30, 2018) UNPRECEDENTED PERFORMANCE SINCE THE BEGINING
2018 Annual Report THE ART OF TRANSFORMATION
 08 Annual Report THE ART OF TRANSFORMATION Contents AVANT-GARDE Trend # Trend # Trend # Trend # P. 0 P. 0 P. 0 8 P. 0 PORTFOLIO Business Centres Office Buildings Projects P. P. 0 P. PERFORMANCE VISION
2018 Half-Year Results Ongoing developments to prepare for the future
 Press Release 2018/07/20 2018 Half-Year Results Ongoing developments to prepare for the future The Board of Directors of Société de la Tour Eiffel, which met on 20 July 2018, approved the financial statements
2017 Annual Results Construction of solid and sustainable cash flow continues
 Press Release 2018/03/07 2017 Annual Results Construction of solid and sustainable cash flow continues The Board of Directors of the Société de la Tour Eiffel, meeting on 7 March 2018, approved the annual
Results H September 9, 2009
 Results H1 2009 September 9, 2009 1 Strategy for the crisis Fair value: analysis and impacts The group s companies Analysis of H1 2009 accounts Affine on the stock exchange 2 STRATEGY FOR THE CRISIS Simplifying
2016 Annual Results Strong growth in earnings
 Press Release 08/03/2017 2016 Annual Results Strong growth in earnings The Board of Directors of the Société de la Tour Eiffel met on 8 March 2017, chaired by Hubert Rodarie, and approved the financial
Q EPRA KEY METRICS
 Q1 EPRA KEY METRICS EPRA KEY METRICS The European Public Real Estate Association (EPRA) is a not-for-profit association based in Brussels that represents the interests of both listed real estate companies
Dream Global REIT 2018 Fourth Quarter 1
 EPRA Metrics The annual EPRA BPR Awards aim to recognize and commend upon the efforts of property companies that have successfully adopted the EPRA BPR Guidelines. Based on the assessment performed by
2017 FULL YEAR 16 FEBRUARY 2018
 FULL YEAR RESULTS 16 FEBRUARY 2018 : Delivering in line with strategy 1.1 billion invested Asset acquisitions 610m Development capex 414m Land acquisitions 92m 525 million disposals Asset sales 432m Land
2014 half-year results. 23 rd July 2014
 23 rd July 2014 Main achievements first half 2014 Stated 2014 objectives Achievements to date New acquisitions One agreement contracted for a 8,300 m² office building in the southern inner rim of Paris
Colonial Investor Day PERFORMANCE Mr. Carlos Krohmer Chief Corporate Development Officer. Madrid 17/10/18
 Colonial Investor Day PERFORMANCE Mr. Carlos Krohmer Chief Corporate Development Officer Madrid 17/10/18 Disclaimer By accepting this presentation and/or by attending this presentation, you will be taken
Q RESULTS 15 MAY 2018 TLG IMMOBILIEN AG Q RESULTS
 TLG IMMOBILIEN AG Q 208 RESULTS DISCLAIMER This presentation includes statements, estimates, opinions and projections with respect to anticipated future performance of TLG IMMOBILIEN ("Forward-Looking
The Parisian Spirit 2017 ANNUAL REPORT
 17 T W E N T Y The Parisian Spirit 2017 ANNUAL REPORT Cézanne Saint-Honoré, Paris 8 2017 Annual Report Strategy P. 14 Trends P. 30 1 2 3 4 Paris Scope P. 40 Performance P. 54 Every SFL building has its
2017 Half-year results LEADING DEVELOPER IN FRENCH GATEWAY CITIES
 2017 Half-year results LEADING DEVELOPER IN FRENCH GATEWAY CITIES DISCLAIMER This presentation has been prepared for information purposes only, and is intended to supplement other information published
AUDIOCAST PRESENTATION Q1/2018
 19.4.2018 AUDIOCAST PRESENTATION Q1/2018 HIGHLIGHTS Q1/2018 EPRA EARNINGS PER SHARE EUR 0.041 -Divestments in 2017 and weaker currencies impacted EPRA EPS -Efficient cost management with administrative
ICADE REVENUE UP +8.4% IN Q1 2018
 PRESS RELEASE Issy-les-Moulineaux, April 27, 208 ICADE REVENUE UP +8.4% IN Q 208 Commercial Property Investment: o Rental income up by as much as +5,8% to 99.0 million o Financial occupancy rate at 92.4%
H RESULTS 10 AUGUST 2018 TLG IMMOBILIEN AG H RESULTS
 TLG IMMOBILIEN AG H1 2018 RESULTS DISCLAIMER This presentation includes statements, estimates, opinions and projections with respect to anticipated future performance of TLG IMMOBILIEN ("Forward-Looking
Sirius Real Estate Ltd Half Year Presentation 2013
 Sirius Real Estate Ltd Half Year Presentation 2013 Who are we We are a leading provider of branded mixed-use flexible workspace in Germany 2 Financial Highlights Substantial increase in recurring profit
2013 annual results. 19 th March 2014
 19 th March 2014 Main achievements 2013 Stated 2013 objectives Achieved Securing rental income Pre-letting Montrouge - 6 years - 1.8m New leases / extensions Total amount: 9.2m Asset disposals ( 200m over
ICADE 1 ST QUARTER 2015 ACTIVITY
 PRESS RELEASE Paris, 5 May 2015 ICADE 1 ST QUARTER 2015 ACTIVITY 1. PROPERTY INVESTMENT DIVISION 1.1. Rental business Asset classes Financial occupancy rate 31/03/2015 31/12/2014 Average lease terms (as
3EPRA INFORMATION. 3.1 EPRA Earnings p EPRA Vacancy Rate p EPRA NAV and EPRA NNNAV p EPRA Cost Ratios p.83
 3EPRA INFORMATION 3.1 EPRA Earnings p.78 3.2 EPRA NAV and EPRA NNNAV p.79 3.4 EPRA Vacancy Rate p.82 3.5 EPRA Cost Ratios p.83 3.3 EPRA NIY and EPRA topped-up NIY p.80 Lar España Real Estate SOCIMI, S.A.
Opening of the first coworking centre in the Triomphe building
 Press release Regulated information 09 May 2018 5:40 PM Opening of the first Silversquare @Befimmo coworking centre in the Triomphe building EPRA earnings of 0.98 per share, in line with the outlook Net
INTERIM FINANCIAL STATEMENTS. for the period ended on March,
 INTERIM FINANCIAL STATEMENTS for the period ended on March, 31 2015 INDEX 1. Key aspects 5 2. Consolidated profit & loss account 9 3. Consolidated balance sheet 11 4. EPRA metrics 14 5. Significant events
AUDIOCAST PRESENTATION H1/2018
 AUDIOCAST PRESENTATION H1/2018 IRREPLACEABLE AND MULTI-FUNCTIONAL ASSETS IN GROWING CATCHMENTS 2 WE CONTINUE OUR TRANSFORMATION JOURNEY 2011 H1/2018 GOAL 2022 41 # OF SHOPPING # OF SHOPPING 78 30 CENTRES
Analyst Presentation 12 February 2018
 Analyst Presentation 12 February 2018 Disclaimer This presentation is not an offer or an invitation to sell or exchange securities, or a recommendation to subscribe, buy or sell ANF Immobilier securities.
2018 HALF-YEAR RESULTS
 2018 HALF-YEAR RESULTS WEBCAST 25 JULY 2018 Disclaimer The information contained in this document has not been independently verified. No representation, warranty or undertaking, express or implied, is
Interim statement by the board of directors on the first quarter of 2018
 Regulated information - under embargo until 03/05/2018, 6 p.m. Antwerp, 3 May 2018 on the first quarter of 2018 Third logistics site in the Netherlands: agreement signed for the purchase of the site and
Sponda Financial Results Q4 and FY February 2017
 Sponda Financial Results Q4 and FY 2016 3 February 2017 1. 2. 3. 4. Highlights for the Period Kari Inkinen Portfolio Development Pia Arrhenius Financials Niklas Nylander Business Environment and Business
ONE YEAR AFTER LAUNCHING ITS STRATEGIC PLAN, ICADE REPORTS SIGNIFICANTLY IMPROVED 2016 FULL-YEAR RESULTS
 PRESS RELEASE Paris, February 13, 2017, 7:30 a.m. ONE YEAR AFTER LAUNCHING ITS STRATEGIC PLAN, ICADE REPORTS SIGNIFICANTLY IMPROVED 2016 FULL-YEAR RESULTS NCCF per share: 4.41, i.e. +8.3% Portfolio value:
January - September 2011 results
 January - September 2011 results 14 November 2011 Highlights 9M 2011 RESULTS Commercial Property business continues showing a recurrent income giving the company stability and solidity, representing 95%
A PURE PLAYER IN PROPERTY DEVELOPMENT IN FRANCE 2017 ANNUAL RESULTS
 A PURE PLAYER IN PROPERTY DEVELOPMENT IN FRANCE 2017 ANNUAL RESULTS Disclaimer This presentation has been prepared for information purposes only, and is intended to supplement other information published
Interim statement from the Board of Directors for the first quarter of 2015
 Regulated information - under embargo until 05/05/2015, 8 a.m. Antwerp, 5 May 2015 Interim statement from the Board of Directors Acquisition of a modern logistics site of approximately 52.000 m² in a prime
Sharp rise in first-half 2002 results Outlook remains favourable
 Sharp rise in first-half 2002 results Outlook remains favourable The premier French commercial real estate company Unibail s sound strategic positioning has been rewarded by an increase in all performance
DREAM GLOBAL ANNOUNCES FOURTH QUARTER RESULTS, 24% ANNUAL NET ASSET VALUE GROWTH AND OVER 6% FOURTH QUARTER COMPARATIVE NOI GROWTH
 DREAM GLOBAL ANNOUNCES FOURTH QUARTER RESULTS, 24% ANNUAL NET ASSET VALUE GROWTH AND OVER 6% FOURTH QUARTER COMPARATIVE NOI GROWTH TORONTO, FEBRUARY 20, 2019 DREAM GLOBAL REIT (TSX:DRG.UN, FRA:DRG) (or
PRIMARIS RETAIL REIT Announces Third Quarter Results
 PRIMARIS RETAIL REIT Announces Third Quarter Results Toronto (Ontario) November 8, 2011 Primaris Retail REIT (TSX:PMZ.UN) is pleased to report positive operating results for the third quarter of 2011.
2015 ANNUAL RESULTS WEBCAST 16 FEBRUARY 2016
 ANNUAL RESULTS WEBCAST 16 FEBRUARY 2016 DISCLAIMER The information contained in this document has not been independently verified. No representation, warranty or undertaking, express or implied, is made
This document does not constitute an offer to sell or an invitation or solicitation of an offer to subscribe for or purchase any securities, and
 This document has been prepared by Atrium (the Company ). This document is not to be reproduced nor distributed, in whole or in part, by any person other than the Company. The Company takes no responsibility
2016 FULL-YEAR RESULTS WEBCAST 21 FEBRUARY 2017
 FULL-YEAR RESULTS WEBCAST 21 FEBRUARY 2017 DISCLAIMER The information contained in this document has not been independently verified. No representation, warranty or undertaking, express or implied, is
Q3 UPDATE. 22 October 2015
 Q3 UPDATE 22 October 2015 MANAGEMENT AGENDA 2015 2016 CONTINUE STRONG OPERATIONAL PERFORMANCE LfL rental growth > 100bps above index 2015: on-track; 2016: under review Occupancy 1% up per year (base: 93.5%
Q BUSINESS ACTIVITY AND REVENUE WEBCAST 25 APRIL 2018
 BUSINESS ACTIVITY AND REVENUE WEBCAST 25 APRIL 2018 DISCLAIMER The information contained in this document has not been independently verified. No representation, warranty or undertaking, express or implied,
2013 Half Year Results
 2013 Half Year Results 31 July 2013 Geopost, Enfield An active and successful period Strong operational performance Lettings up 30% Good momentum in development pipeline Further cost savings achieved Portfolio
Presentation Results. 6th March 2015
 Presentation 6th March 2015 2014 Review Strong underlying profit Increased contribution from commercial portfolio Moderately reduced residential performance despite strong profits from Hong Kong and mainland
Rental income, EUR million Like-for-like growth in rental income, percent
 Akelius Residential Property AB (publ) interim report January to June summary Apr Jun Apr Jun Jan Jun Jan Jun Jan Dec Rental income, EUR million 115 113 233 229 469 Like-for-like growth in rental income,
Interim presentation. 13 July, Anders Nissen, CEO Liia Nõu, CFO
 Interim presentation 13 July, 2018 Anders Nissen, CEO Liia Nõu, CFO Profitable growth 20% R12M Return on equity 2 1 2 3 Profitable acquisitions in new large markets Continued strong development in Brussels
Rental income, SEK million 1,016 1,040 3,051 3,095 4,109 Growth in rental income comparable properties, percent
 Akelius Residential Property AB (publ) interim report January to September summary Jul Sep Jul Sep Jan Sep Jan Sep Jan Dec Rental income, SEK million 1,016 1,040 3,051 3,095 4,109 Growth in rental income
Epra Key Performance Measures. Best Practices-Recommendations
 90 09 Information Epra Key Performance Measures. Best Practices-Recommendations The Reporting & Accounting Committee of (European Public Real Estate Association 1 ) updated in December 2014 a Best Practices
Rental income, EUR million Like-for-like growth in rental income, percent
 Akelius Residential Property AB (publ) year-end report January to December summary Oct Dec Oct Dec Jan Dec Jan Dec Rental income, EUR million 129 124 482 469 Like-for-like growth in rental income, percent
Q BUSINESS ACTIVITY AND REVENUE WEBCAST 25 APRIL 2017
 BUSINESS ACTIVITY AND REVENUE WEBCAST 25 APRIL 2017 DISCLAIMER The information contained in this document has not been independently verified. No representation, warranty or undertaking, express or implied,
M A R C H 22,
 MARCH 22, 2017 1 01 2 ADO THE PURE-PLAY BERLIN RESIDENTIAL SPECIALIST Investment highlights 1 2 3 4 Berlin residential pure play with a 2.3bn quality portfolio Efficient, fully integrated and scalable
ALE Property Group. ASX CEO Connect, Brisbane 27 March The Breakfast Creek Hotel, Brisbane, QLD 1
 ALE Property Group ASX CEO Connect, Brisbane 27 March 2018 The Breakfast Creek Hotel, Brisbane, QLD 1 Contents About ALE Property Portfolio Capital Management FY19 Outlook and Performance Attractive Investment
HALF-YEAR RESULTS. Presentation of 31 July 2013
 HALF-YEAR RESULTS 2013 Presentation of 31 July 2013 AFFINE KEY TAKEAWAYS EPRA Earnings down due to disposals (-) Rental income down as a consequence of 2012 disposals (-) Negative global result from associates
ALE Property Group. Annual General Meeting 13 November Breakfast Creek Hotel, Brisbane, QLD 1
 ALE Property Group Annual General Meeting 13 November 2018 Breakfast Creek Hotel, Brisbane, QLD 1 Contents Highlights FY18 Results Properties and Development Updates Capital Management FY19 Outlook Attractive
Büromarktüberblick. Market Overview. Big 7 3rd quarter
 Büromarktüberblick Office Market Overview Big 7 3rd quarter Deutschland Gesamtjahr 2017 2016 Erschieneninim Published October April 2017 2017 Will the office lettings market achieve a new record volume?
Rental income, EUR million Like-for-like growth in rental income, percent
 Akelius Residential Property AB (publ) interim report January to September summary Jul Sep Jul Sep Jan Sep Jan Sep Jan Dec Rental income, EUR million 120 116 353 345 469 Like-for-like growth in rental
ALE Property Group. 31 December 2017 Half Year Results. The Breakfast Creek Hotel, Brisbane, QLD
 ALE Property Group 31 December 2017 Half Year Results The Breakfast Creek Hotel, Brisbane, QLD 1 Contents Highlights December 17 Half Year Results Pub Property Portfolio Capital Management FY18 Outlook
Rental income, EUR million** Like-for-like growth in rental income, percent Net operating income, EUR million
 Akelius Residential Property AB (publ) interim report January to March summary* Jan Mar Jan Mar Jan Dec Rental income, EUR million** 119 116 469 Like-for-like growth in rental income, percent 3.7 5.4 5.1
CONSOLIDATED STATEMENT OF INCOME
 CONSOLIDATED STATEMENT OF INCOME (unaudited, data converted from the Euro to the US Dollar (for information concerning this restatement, see Note 11 to these Consolidated Financial Statements)) 1 st quarter
NBG PANGAEA REIC April 2017
 NBG PANGAEA REIC April 2017 Disclaimer This presentation has been prepared by NBG PANGAEA Real Estate Investment Company (former MIG Real Estate REIC or the Company) solely for information purposes and
FY 2015 Results TLG IMMOBILIEN AG March FY 2015 Results Presentation
 FY 2015 Results TLG IMMOBILIEN AG March 2016 DISCLAIMER This presentation includes statements, estimates, opinions and projections with respect to anticipated future performance of TLG IMMOBILIEN ("Forward-Looking
UNITED STATES SECURITIES AND EXCHANGE COMMISSION Washington, D.C FORM 10-Q
 UNITED STATES SECURITIES AND EXCHANGE COMMISSION Washington, D.C. 20549 FORM 10-Q ý QUARTERLY REPORT PURSUANT TO SECTION 13 OR 15(d) OF THE SECURITIES EXCHANGE ACT OF 1934 For the Quarterly Period Ended
仁恒置地集团 YANLORD LAND GROUP LIMITED. 4Q and FY 2017 Results Presentation
 仁恒置地集团 YANLORD LAND GROUP LIMITED 4Q and FY 2017 Results Presentation Yanlord 4Qand FY 2017Business Review Yanlord 4Q and FY 2017 Business Review Averagesellingprice( ASP )rosesignificantlyin4q2017tormb66,234/sqmfromrmb25,739/sqm
Investor Update Q results. Maëlys Castella October 22, 2015
 Investor Update Q3 2015 results Maëlys Castella October 22, 2015 Agenda Highlights Operational review Financial review Conclusion Questions 2 Q3 2015; Another quarter of improved performance Revenue million
NRE: Creating Value for Shareholders. March 13, 2018
 NRE: Creating Value for Shareholders March 13, 2018 Forward Looking Statement This presentation may contain certain forward-looking statements within the meaning of the Private Securities Litigation Reform
1Q Results May
 1/18 First Quarter Results January-March 2018 14 May 2018 1cierre del tercer trimestre del ejercicio 2017, el Grupo Colonial ha obtenido un resultado neto At the close of the first quarter of 2018, the
ATRIUM Q RESULTS ANALYST AND INVESTOR CALL. 18 May 2016
 ATRIUM Q1 2016 RESULTS ANALYST AND INVESTOR CALL 18 May 2016 KEY EVENTS IN 2016 YTD OPERATIONAL PERFORMANCE Core Markets¹: NRI increased 1.2% to 36.3m; LFL NRI remained stable at 31.4m Russia continues
Japan Real Estate Investment Corporation Performance Review for Fiscal Period Ended September 30, 2016 November 16, 2016
 Japan Real Estate Investment Corporation Performance Review for Fiscal Period Ended September 30, 2016 November 16, 2016 Message from President & CEO I would like to express our sincere appreciation that
2018 Q3: TENANTS FIRST Putting the needs of our tenants at the centre of everything we do. 26 October 2018
 2018 Q3: TENANTS FIRST Putting the needs of our tenants at the centre of everything we do 26 October 2018 CONTENT 1 HIGHLIGHTS AND KEY FIGURES 2 NEW NAME 3 MARKET OVERVIEW 4 GENERAL COMPANY OVERVIEW 7
Investor Presentation First Half Results
 Investor Presentation 2010 First Half Results 1 Disclaimer This document has been prepared by ANF Immobilier SA ( ANF Immobilier ) solely for the use of presentations made to investors or analysts. ANF
Corporate Presentation 4 th Quarter 2018 Financial Results
 Corporate Presentation 4 th Quarter 2018 Financial Results 17 January 2019 Important Notice This presentation is for information only and does not constitute an invitation or offer to acquire, purchase
Boustead Projects Limited
 Boustead Projects Limited FY2017 Annual General Meeting 27 July 2017 Construction Trends in FY2017 Public sector dominating total construction demand. (~ 70% in FY2017) During CY2016, the Singapore Government
THE TRAFFORD CENTRE LIMITED QUARTERLY REPORT. CASHFLOW STATEMENT AND MANAGEMENT COMMENTARY FOR THE PERIOD ENDING 31 December 2017
 THE TRAFFORD CENTRE LIMITED QUARTERLY REPORT CASHFLOW STATEMENT AND MANAGEMENT COMMENTARY FOR THE PERIOD ENDING 31 December 2017 340,000,000 Class A2 6.50 per cent. Secured Notes due 2033 120,000,000 Class
NBG PANGAEA REIC September 2016
 NBG PANGAEA REIC September 2016 Disclaimer This presentation has been prepared by NBG PANGAEA Real Estate Investment Company (former MIG Real Estate REIC or the Company) solely for information purposes
Achieved record annual revenues of $110.0 million for 2018, representing an increase of 5.8%
 Clipper Realty Inc. Announces Fourth Quarter and Full-Year 2018 Results Reports Record Annual Revenues, Record Annual Income from Operations and Record Quarterly and Annual Adjusted Funds from Operations
ANNUAL REPORT Swiss Finance & Property Investment AG. Swiss Finance & Property I Page 1
 ANNUAL REPORT 2013 Swiss Finance & Property Investment AG Swiss Finance & Property I Page 1 AGENDA Swiss Finance & Property Investment AG Portfolio Financial Statements Outlook 2014 Key Facts Swiss Finance
Presentation for REITs Symposium 2016
 Presentation for REITs Symposium 2016 4 June 2016 Important Notice This presentation shall be read in conjunction with OUE Commercial REIT s Financial Results announcement for 1Q 2016 dated 10 May 2016.
Housing as an Investment Greater Toronto Area
 Housing as an Investment Greater Toronto Area Completed by: Will Dunning Inc. For: Trinity Diversified North America Limited February 2009 Housing as an Investment Greater Toronto Area Overview We are
Investor Presentation Shaw and Partners - Emerging Leaders Conference
 Investor Presentation Shaw and Partners - Emerging Leaders Conference Your Community Developer 31 May 2017 1 AVJennings at a glance 2 ON AFFORDABLE HOUSING IN URBAN GROWTH CORRIDORS STRONG BALANCE SHEET
Zug Estates Group. Financial Year Tobias Achermann, CEO Gabriela Theus, CFO. March 11, 2016
 Zug Estates Group Financial Year 2015 Tobias Achermann, CEO Gabriela Theus, CFO March 11, 2016 2015 in a nutshell Gratifying result Operating income before depreciation and revaluation CHF 39.2 Mio. +4.0%
INVL BALTIC REAL ESTATE THE FIRST LISTED REIT IN THE BALTIC STATES
 INVL BALTIC REAL ESTATE THE FIRST LISTED REIT IN THE BALTIC STATES 2018 BRIEF OVERVIEW Team Economic environment INVL Baltic Real Estate's management company is INVL Asset Management. The management company
Rental income, SEK million 1,071 1,014 4,122 4,109 Growth in rental income comparable properties, percent
 Akelius Residential Property AB (publ) year-end report January to December summary Oct Dec Oct Dec Jan Dec Jan Dec Rental income, SEK million 1,071 1,014 4,122 4,109 Growth in rental income comparable
Investor Presentation Second Quarter 2006
 Investor Presentation Second Quarter 2006 2006 Highlights (Six months to June 30, 2006) Revenues up 10.2% from accretive acquisitions Net Operating Income up 10.9% NOI margin increases Stabilized portfolio
Strong management team
 Strong management team Stable & transparent REIT framework Solid operational performance Top quality shareholder base High quality property portfolio 1 A strong management team Unprecedented learning curve
NEWS RELEASE For immediate release
 NEWS RELEASE For immediate release Laura Clark 904 598 7831 LauraClark@RegencyCenters.com Regency Centers Reports Third Quarter 2018 Results Company Increases 2018 Guidance JACKSONVILLE, FL. (October 25,
Best Practices Recommendations. Q&A November EPRA Best Practices Recommendations Q&A November
 Best Practices Recommendations Q&A November 2016 EPRA Best Practices Recommendations Q&A November 2016 1 Contents 1. Introduction 03 2. General Recommendations 04 3. EPRA Earnings 05 4. EPRA NAV 15 5.
Interim results. for the period ended 31 December 2014
 Interim results for the period ended 31 December 2014 Introduction 2 Introduction to Delta International First African (excluding South Africa) focused property fund listed on the JSE Offers investors
26 February 2013 FIRST HALF RESULTS PRESENTATION
 26 February 2013 FIRST HALF RESULTS PRESENTATION Investment highlights Proven track record of consistent earnings growth and meeting targets Strategically located and diverse residential portfolio Urban
Metropolitan Tract Performance Report for the Quarter Ended September 30, 2009
 VII. STANDING COMMITTEES F 4 B. Finance, Audit and Facilities Committee Metropolitan Tract Performance Report for the Quarter Ended September 30, 2009 Attachment Metropolitan Tract performance Report for
2012 HALF-YEAR RESULTS 3-DIMENSIONAL REAL ESTATE
 3-DIMENSIONAL REAL ESTATE www.altareacogedim.com CONTENTS 1. Introduction 2. Residential 3. Offices 4. Retail 5. Finance 6. Outlook 2 INTRODUCTION 3 H1 2012 RESULTS Like-for-like SALES 728 m +50% +23%
Half-year financial report 2010
 ANF Immobilier Half-year financial report 2010 First half 2010 results: Follow-on strong growth in rents and cash flow Rents up 7.2% on a like-for-like basis EBITDA margin improves by 2.3 points to 80.6%
CONSOLIDATED STATEMENT OF INCOME
 CONSOLIDATED STATEMENT OF INCOME 1 st quarter (a) 2017 4 th quarter Sales 41,183 42,275 32,841 Excise taxes (5,090) (5,408) (5,319) Revenues from sales 36,093 36,867 27,522 Purchases, net of inventory
Interim announcement of the Board of Directors First quarter 2017 ending on 31 March 2017
 Interim announcement of the Board of Directors First quarter 2017 ending on 31 March 2017 Antwerp, Belgium Interim results for the period from 1 January 2017 until 31 March 2017 Net result increased to
Interim presentation. 24 April, Anders Nissen, CEO Liia Nõu, CFO
 Interim presentation 24 April, 2018 Anders Nissen, CEO Liia Nõu, CFO A stable earnings development 21% Return on equity 2 1 2 3 Profitable acquisitions Positive effects from product development A seasonally
PS Business Parks, Inc. Reports Results for the Quarter Ended September 30, 2018
 News Release PS Business Parks, Inc. 701 Western Avenue Glendale, CA 91201-2349 psbusinessparks.com For Release: Immediately Date: October 23, 2018 Contact: Jeff Hedges (818) 244-8080, Ext. 1649 PS Business
THE TRAFFORD CENTRE LIMITED QUARTERLY REPORT. CASHFLOW STATEMENT AND MANAGEMENT COMMENTARY FOR THE PERIOD ENDING 30 June 2018
 THE TRAFFORD CENTRE LIMITED QUARTERLY REPORT CASHFLOW STATEMENT AND MANAGEMENT COMMENTARY FOR THE PERIOD ENDING 30 June 2018 340,000,000 Class A2 6.50 per cent. Secured Notes due 2033 120,000,000 Class