AUDIOCAST PRESENTATION H1/2018
|
|
|
- James McCarthy
- 5 years ago
- Views:
Transcription


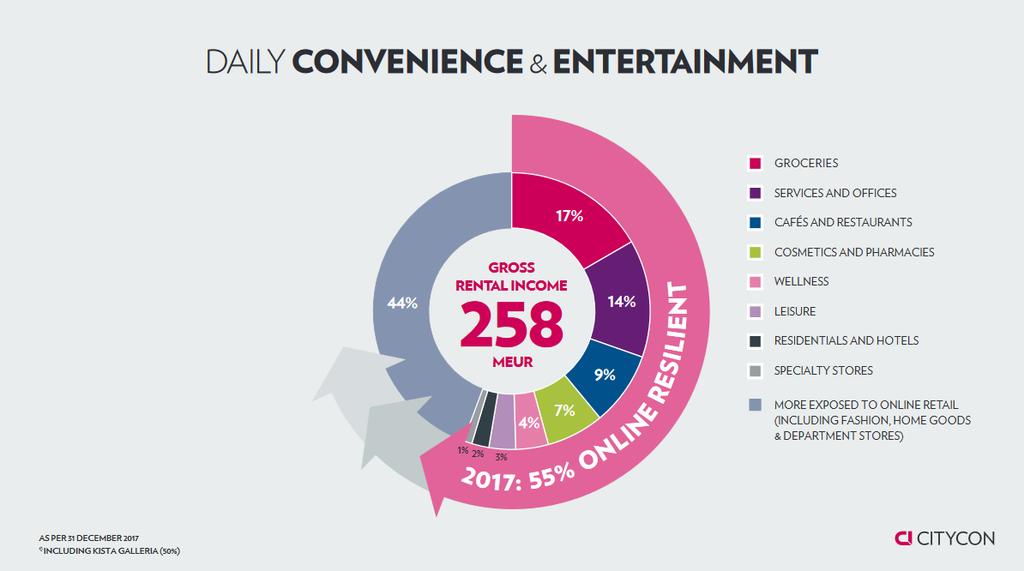
1 AUDIOCAST PRESENTATION H1/2018
2 IRREPLACEABLE AND MULTI-FUNCTIONAL ASSETS IN GROWING CATCHMENTS 2
3 WE CONTINUE OUR TRANSFORMATION JOURNEY 2011 H1/2018 GOAL # OF SHOPPING # OF SHOPPING CENTRES CENTRES 32 AVERAGE SIZE, MEUR 115 AVERAGE SIZE, MEUR Today the TOP 7 assets already account for 50% of the total portfolio
4 WE HAVE DISPOSED MEUR 400 IN 2017 AND H1/2018 ASSET ROTATION TRACK-RECORD MEUR In 2018 we have divested the following assets: Åkermyntan shopping centre in Stockholm Retail property in Kuopio, Finland Heiane shopping centre in Norway Retail property in Bodø, Norway (divested after reporting period) 200 Proceeds of approx. EUR 80M used to partially fund development pipeline H1/2018 Disposals We continue to aim to divest EUR million in the next few years. Proceeds to be used to strengthen balance sheet and to funddevelopment pipeline.
5 WHERE WE WANT TO BE? LARGER ASSETS CONCENTRATED PORTFOLIO HIGH-QUALITY URBAN LOCATIONS EFFICIENT TO MANAGE 5
6
7 ISO OMENA: GREAT CASE STUDY OF AN URBAN MULTI-FUNCTIONAL SHOPPING CENTRE FOOTFALL DOUBLED +96% TENANT SALES +30% SAME STORE SALES +11% H1/2017 H1/2018 H1/2017 H1/2018 H1/2017 H1/2018 7

8 ISO OMENA: GREAT CASE STUDY OF AN URBAN MULTI-FUNCTIONAL SHOPPING CENTRE ~20 million visitors Public service square 1.5 million visitors 62% of all shopping centre visitors visit at least once a week 8 37% of all visitors walk through M.E.E.T. 16% of all visitors eat at M.E.E.T. 96% interaction with shopping centre
, % Pre-leasing, % Completion target 1 Mölndal Galleria")
 Expected stabilised yield (3 rd year after completion).")
9 MORE QUALITY URBAN ASSETS UNDER DEVELOPMENT ONGOING PROJECTS City Area before/ after, sq.m. Expected investment, MEUR Cumulative investment, MEUR Yield on cost 1), % Pre-leasing, % Completion target 1 Mölndal Galleria Gothenburg - /24, (120.0) Q3/ Lippulaiva Helsinki metropolitan area 19,200/44, ) Expected stabilised yield (3 rd year after completion). Calculated on total development costs, also including financing and Citycon internal costs

10 MÖLNDAL GALLERIA S GRAND OPENING IN Q3 Prime asset at the heart of the growing Mölndal area in Gothenburg Occupancy expected to be over 90% at the grand opening on 27 September. 17% Groceries and 19% F&B GLA 24,000sq.m. Total investment approx. MEUR 120 Expected visitors p.a. 5-6M Number of stores 70 Anchor tenants ICA Kvantum, H&M, Clas Ohlson, Nordic Wellness 10
11 OPPORTUNITIES TO FURTHER IMPROVE THE PORTFOLIO PLANNED (UNCOMMITTED) City Area before/after, sq.m. Expected investment, MEUR Target completion Kista Galleria Stockholm 92,600/105, ) 2023 Oasen Bergen 57,000/68, Liljeholmstorget Galleria Stockholm 40,600/64, Trekanten Oslo 23,900/45, Development investments of MEUR p.a. sourced through capital recycling 1) Citycon s share MEUR 40 (50%) 11
 2023 Oasen Bergen 57,000/68,800 100 2022 Liljeholmstorget Galleria Stockholm 40,600/64,500 100 2023 Trekanten")
12 OPPORTUNITIES TO FURTHER IMPROVE THE PORTFOLIO PLANNED (UNCOMMITTED) City Area before/after, sq.m. Expected investment, MEUR Target completion Kista Galleria Stockholm 92,600/105, ) 2023 Oasen Bergen 57,000/68, Liljeholmstorget Galleria Stockholm 40,600/64, Trekanten Oslo 23,900/45, Development investments of MEUR p.a. sourced through capital recycling 1) Citycon s share MEUR 40 (50%) 12

13 H1/2018: OPERATIONAL PERFORMANCE: INCREASED OCCUPANCY, IMPROVED FOOTFALL AND TENANT SALES
 SOLID OPERATIONAL DEVELOPMENT -Pro forma like-for-like NRI grew by 1.1% (incl.")
14 H1/2018 SUMMARY EPRA EARNINGS PER SHARE EUR (H1/2017: EUR 0.089) -Divestments in 2017 and H1/2018 and currencies had a significant impact on EPRA EPS development in H1/ Divestments decreased NRI by EUR 9.2M and FX by EUR 2.9M -Significant decline in administrative expenses (down 10% y/y) SOLID OPERATIONAL DEVELOPMENT -Pro forma like-for-like NRI grew by 1.1% (incl. Iso Omena and Buskerud) in H1/2018 -Occupancy rate improved by 30 bps to 96.3% mostly driven by Finland GOOD OPERATIONAL PERFORMANCE IN ISO OMENA CONTINUED -Strong footfall and tenant sales during H1/2018 CLEAR POLARIZATION BETWEEN BEST AND OTHER ASSETS -Fair values changes EUR -34 million due to pressure in Finland and Norway in secondary cities. Fair values continued to develop positively in Sweden. GUIDANCE 2018 SPECIFIED -EPRA EPS guidance narrowed to EUR
15 PRO FORMA LIKE-FOR-LIKE NRI GREW BY 1.1% NET RENTAL INCOME DEVELOPMENT Q1-Q2/2018 VS Q1-Q2/ % 4.0% 0.0% 0.2% 0.6% 1.1% -0.3% -0.4% -4.7% -5.9% -7.2% -8.9% -12.3% Like-for-like net rental income -0.4% Like-for-like NRI in Finland is based on 45% of total Finnish income and excludes Iso Omena. Pro forma L-F-L NRI includes the impact of Iso Omena and Buskerud for the Q2/2018 comparable period Currencies and divestments had a negative impact of EUR 12.1 million on the total NRI Finland Norway Sweden & Denmark Like-for-like NRI Development (at comparable exchange rates) Total NRI Development (at actual exchange rates) Proforma Like-for-like NRI Development (at comparable rates) Estonia Total Proforma total* 15 *Including comparable periods for Iso Omena and Buskerud 4-6/2018
16 OVERALL SALES +6% AND FOOTFALL +8% LIKE-FOR-LIKE SALES AND FOOTFALL STABLE TENANT SALES DEVELOPMENT Q1-Q2/2018 vs. Q1-Q2/2017, % 1) 22% FOOTFALL DEVELOPMENT Q1-Q2/2018 vs. Q1-Q2/2017, % 1) 25% 6% 8% 1% 1% 0% 1% 1% 0% 0% 0% 1% 1% 0% -2% Finland Norway Sweden & Denmark -7% -10% Estonia Total Like-for-like sales Total sales (including Kista Galleria 50%) Finland Norway Sweden & Denmark -9% -9% Estonia Total Like-for-like footfall Total footfall (including Kista Galleria 50%) 16 1) Sales and footfall figures include estimates. Sales figures exclude VAT.
17 OCCUPANCY IMPROVED OCCUPANCY RATE 1) H1/ Average rent 1) EUR/sq.m % 96.8% 96.3% 96.0% 96.1% 96.3% Average remaining length of the lease portfolio years H1/ Average rent of leases started EUR/sq.m Average rent of leases ended EUR/sq.m Leasing spread of renewals and re-lettings % Q1/2018 H1/ All figures including Kista Galleria 50% Leasing spread was flat during H1/2018 and developed positively in Sweden&Denmark and Norway. Leasing spread in Finland turned negative driven by a small number of non-core centres. 1) With comparable exchange rates the average rent per sq.m. increased by EUR 0.5

 Due to re-positioning of tenants, around 20% of GLA is being")

18 RE-POSITIONING KISTA TOWARDS DAILY CONVENIENCE THREE TARGETS: 1. Strong grocery-offering 2. Improved F&B and services 3. Upgraded look and feel - Estimated completion by summer Total expected investment around EUR 25 million over (Citycon share 50%) Due to re-positioning of tenants, around 20% of GLA is being touched. Occupancy temporarily at a lower level. - Re-positioning to have a clear negative impact on NRI in 2018 / H LEASING UPDATE H1/ New H&M concept Afound 2. Lease agreement signed with Lidl 3. More non-fashion retailers signed Share of online-resilient tenants increasing 18
development of core assets OPERATIONAL EXCELLENCE - Proactive leasing activity to maintain and improve high occupancy rates and to increase urban community appeal -")
19 CONTINUED FOCUS ON PORTFOLIO AND BALANCE SHEET IMPROVEMENT FURTHER CAPITAL RECYCLING - Divest EUR million in the coming few years in Finland and Norway in particular - Proceeds to be used for reducing leverage and for (re)development of core assets OPERATIONAL EXCELLENCE - Proactive leasing activity to maintain and improve high occupancy rates and to increase urban community appeal - Maintain strict cost management LOAN TO VALUE TARGET 40-45% - Strengthen balance sheet with proceeds from divestments 19


20 FINANCIAL OVERVIEW
21 Q2/2018 FINANCIALS MEUR Q2/2018 Q2/2017 Change % Q2/2018 INCL. KISTA 50% Gross rental income* Net rental income Direct operating profit EPRA Earnings N/A EPRA EPS (basic) N/A EPRA NAV per share N/A 21 * Changes due to IFRS15 had a negative impact of EUR 1.2M on the Gross rental income. There was no impact on other items.
 0.081 0.089-8.5 N/A EPRA NAV per share 2.68 2.78-3.4 N/A 22 * Changes due to IFRS15 had a negative impact of EUR 2.5M on the Gross rental income.")
22 1-6/2018 FINANCIALS MEUR H1/2018 H1/2017 Change % H1/2018 INCL. KISTA 50% Gross rental income* Net rental income Direct operating profit EPRA Earnings N/A EPRA EPS (basic) N/A EPRA NAV per share N/A 22 * Changes due to IFRS15 had a negative impact of EUR 2.5M on the Gross rental income. There was no impact on other items.
23 NET RENTAL INCOME IMPACTED BY DIVESTMENTS AND FX NRI DEVELOPMENT MEUR Q1-Q2/2017 Acquisitions (Re)development projects Divestments LFL properties Other (incl. exchange rate differences) CURRENCIES HAD A SIGNIFICANT NEGATIVE IMPACT ON NRI Q1-Q2/2018 Closing rates H1/2018 Q4/2017 SEK NOK Average rates H1/2018 H1/ Foreign currency impact on H1 / 2018: NRI -2.9 MEUR EPRA EPS EUR 23
 -3.7 0.6-4.2 0.5-0.6 Investment properties and Kista Galleria (50%), total -29.3-15.1-37.7-7.8-43.")
24 FAIR VALUE CHANGES FAIR VALUE CHANGES, MEUR Q2/2018 Q2/2017 H1/2018 H1/ Finland Norway Sweden & Denmark Estonia Investment properties, total Kista Galleria (50%) Investment properties and Kista Galleria (50%), total WEIGHTED AVERAGE YIELD REQUIREMENT, % 30 JUN MAR DEC 2017 Investment properties and Kista Galleria (50%), average
25 SLIGHT DECLINE IN EPRA NET ASSET VALUE CHANGE OF NET ASSET VALUE (EPRA NAV) EUR, per share Q4/2017 EPRA Earnings Indirect result Translation reserve Dividends and equity return paid Other Q2/ JUN DEC JUN 2017 EPRA NAV per share, EUR EPRA NNNAV per share, EUR
26 LTV CLOSE TO PREVIOUS YEAR S LEVEL LOAN TO VALUE (LTV) FINANCING KEY FIGURES 30 JUN JUN DEC 2017 Interest bearing debt, fair value MEUR 2, , ,097.2 Available liquidity MEUR % 46.6% 46.7% 46.8% 47.0% Average loan maturity years Interest rate hedging ratio % Weighted average interest rate 1) % Loan to Value (LTV) % Q1/2018 H1/2018 Financial covenant: Equity ratio (> 32.5%) Financial covenant: Interest cover ratio (> 1.8) 1) Including cross-currency swaps and interest rate swaps % %
27 OUTLOOK 2018 SPECIFIED DIRECT OPERATING PROFIT Direct operating profit* MEUR -14 to -1 (previously -15 to +1) E EPRA Earnings* MEUR -14 to -1 (previously -14 to +4) EPRA EARNINGS EPRA EPS (basic) EUR (previously ) *change from previous year E 27 Based on existing property portfolio. Guidance for 2018 includes EUR -4 million impact from weaker currencies.
28 citycon.com CONTACT INFORMATION Eero Sihvonen CFO, Exec. VP THANK YOU. Tel Mikko Pohjala Head of Investor Relations Tel


29 APPENDIX
30 INCOME STATEMENT MEUR H1/2018 H1/2017 % 2017 Gross rental income Service charge income Property operating expenses Other expenses from leasing operations Net rental income Administrative expenses Other operating income and expenses Net fair value gains/losses on investment property Net gains on sale of investment property Operating profit Net financial income and expenses Share of profit/loss of joint ventures Profit before taxes Current taxes Deferred Taxes Profit/loss for the period
31 BALANCE SHEET MEUR 30 JUN JUN DEC 2017 Investment properties 4, , ,183.4 Total non-current assets 4, , ,608.9 Investment properties held for sale Total current assets Total assets 4, , ,678.0 Total shareholders equity 2, , ,209.4 Total liabilities 2, , ,468.6 Total liabilities and shareholders equity 4, , ,

32 MAIN FINANCING TARGETS Loan to Value 40-45% 47.0% Average maturity of loan portfolio > 5 yrs 4.7 Debt portfolio's hedge ratio 70-90% 94.9% Strong investment-grade credit ratings BBB/Baa2 Financing mainly unsecured 95% Substantial liquidity buffer MEUR 566 Stable business model matched by conservative financing targets
33 THE EPRA COST RATIO HAS IMPROVED SINCE 2012 EPRA Cost Ratio 26.2% 22.4%% 19.4% 20.3% 17.6% 18.7% EPRA Cost ratio includes direct vacancy costs 33
34 95% OF DEBT FIXED RATE WITH BALANCED MATURITY PROFILE DEBT BREAKDOWN BY TYPE DEBT MATURITIES Bank loans CP 5% 5% ,083.6 EUR million Bonds 90% DEBT BREAKDOWN BY CURRENCY NOK 29% SEK 17% 2,083.6 EUR million EUR 55% Part of EUR debt has been converted to SEK and NOK using crosscurrency swaps Loans Floating to fixed swaps Undrawn loan facilities Bonds Commercial Paper
AUDIOCAST PRESENTATION Q1/2018
 19.4.2018 AUDIOCAST PRESENTATION Q1/2018 HIGHLIGHTS Q1/2018 EPRA EARNINGS PER SHARE EUR 0.041 -Divestments in 2017 and weaker currencies impacted EPRA EPS -Efficient cost management with administrative
CITYCON CAPITAL MARKETS DAY 16 MAY 2017, ISO OMENA COO, JURN HOEKSEMA
 OPERATIONAL IMPROVEMENT CITYCON CAPITAL MARKETS DAY 16 MAY 2017, ISO OMENA COO, JURN HOEKSEMA LOCAL EMPOWERMENT AND ACCOUNTABILITY No country-based organisations Centralize: What is possible to support
Sponda Financial Results Q4 and FY February 2017
 Sponda Financial Results Q4 and FY 2016 3 February 2017 1. 2. 3. 4. Highlights for the Period Kari Inkinen Portfolio Development Pia Arrhenius Financials Niklas Nylander Business Environment and Business
Interim presentation. 13 July, Anders Nissen, CEO Liia Nõu, CFO
 Interim presentation 13 July, 2018 Anders Nissen, CEO Liia Nõu, CFO Profitable growth 20% R12M Return on equity 2 1 2 3 Profitable acquisitions in new large markets Continued strong development in Brussels
Interim presentation. 24 April, Anders Nissen, CEO Liia Nõu, CFO
 Interim presentation 24 April, 2018 Anders Nissen, CEO Liia Nõu, CFO A stable earnings development 21% Return on equity 2 1 2 3 Profitable acquisitions Positive effects from product development A seasonally
ATRIUM Q RESULTS ANALYST AND INVESTOR CALL. 18 May 2016
 ATRIUM Q1 2016 RESULTS ANALYST AND INVESTOR CALL 18 May 2016 KEY EVENTS IN 2016 YTD OPERATIONAL PERFORMANCE Core Markets¹: NRI increased 1.2% to 36.3m; LFL NRI remained stable at 31.4m Russia continues
H RESULTS 10 AUGUST 2018 TLG IMMOBILIEN AG H RESULTS
 TLG IMMOBILIEN AG H1 2018 RESULTS DISCLAIMER This presentation includes statements, estimates, opinions and projections with respect to anticipated future performance of TLG IMMOBILIEN ("Forward-Looking
Q RESULTS 15 MAY 2018 TLG IMMOBILIEN AG Q RESULTS
 TLG IMMOBILIEN AG Q 208 RESULTS DISCLAIMER This presentation includes statements, estimates, opinions and projections with respect to anticipated future performance of TLG IMMOBILIEN ("Forward-Looking
Strong progress for Property Management
 Strong progress for Property Management Interim report January-June 2016 Stockholm, 18 August 2016 Anders Nissen, CEO Liia Nõu, CFO Forward-looking statements PANDOX EXCELLENCE IN HOTEL OWNERSHIP & OPERATIONS
Rental income, EUR million Like-for-like growth in rental income, percent
 Akelius Residential Property AB (publ) year-end report January to December summary Oct Dec Oct Dec Jan Dec Jan Dec Rental income, EUR million 129 124 482 469 Like-for-like growth in rental income, percent
Rental income, EUR million Like-for-like growth in rental income, percent
 Akelius Residential Property AB (publ) interim report January to June summary Apr Jun Apr Jun Jan Jun Jan Jun Jan Dec Rental income, EUR million 115 113 233 229 469 Like-for-like growth in rental income,
Q3 UPDATE. 22 October 2015
 Q3 UPDATE 22 October 2015 MANAGEMENT AGENDA 2015 2016 CONTINUE STRONG OPERATIONAL PERFORMANCE LfL rental growth > 100bps above index 2015: on-track; 2016: under review Occupancy 1% up per year (base: 93.5%
Interim report presentation
 Interim report presentation 13 July, 2017 Anders Nissen, CEO Liia Nõu, CFO Forward-looking statements This presentation contains forwardlooking statements. Such statements are subject to risks and uncertainties
Rental income, EUR million** Like-for-like growth in rental income, percent Net operating income, EUR million
 Akelius Residential Property AB (publ) interim report January to March summary* Jan Mar Jan Mar Jan Dec Rental income, EUR million** 119 116 469 Like-for-like growth in rental income, percent 3.7 5.4 5.1
Interim report presentation
 Interim report presentation 10 November, 2017 Anders Nissen, CEO Liia Nõu, CFO Forward-looking statements This presentation contains forwardlooking statements. Such statements are subject to risks and
Good underlying growth
 Good underlying growth Interim report January-March 2016 Stockholm, 3 May 2016 Anders Nissen, CEO Liia Nõu, CFO Agenda Introduction Financial review Market and business Q&A Anders Nissen Liia Nõu Anders
Rental income, SEK million 1,016 1,040 3,051 3,095 4,109 Growth in rental income comparable properties, percent
 Akelius Residential Property AB (publ) interim report January to September summary Jul Sep Jul Sep Jan Sep Jan Sep Jan Dec Rental income, SEK million 1,016 1,040 3,051 3,095 4,109 Growth in rental income
Q EPRA KEY METRICS
 Q1 EPRA KEY METRICS EPRA KEY METRICS The European Public Real Estate Association (EPRA) is a not-for-profit association based in Brussels that represents the interests of both listed real estate companies
Rental income, SEK million 1,071 1,014 4,122 4,109 Growth in rental income comparable properties, percent
 Akelius Residential Property AB (publ) year-end report January to December summary Oct Dec Oct Dec Jan Dec Jan Dec Rental income, SEK million 1,071 1,014 4,122 4,109 Growth in rental income comparable
This document does not constitute an offer to sell or an invitation or solicitation of an offer to subscribe for or purchase any securities, and
 This document has been prepared by Atrium (the Company ). This document is not to be reproduced nor distributed, in whole or in part, by any person other than the Company. The Company takes no responsibility
INTERIM REPORT JANUARY MARCH 2016
 INTERIM REPORT JANUARY MARCH 2016 1 Strong start to the year JANUARY MARCH 2016 QUARTER Rental income amounted to MSEK 650 (589) Profit from property management totaled MSEK 340 (265), corresponding to
Rental income, EUR million Like-for-like growth in rental income, percent
 Akelius Residential Property AB (publ) interim report January to September summary Jul Sep Jul Sep Jan Sep Jan Sep Jan Dec Rental income, EUR million 120 116 353 345 469 Like-for-like growth in rental
2018 Half-Year Results Ongoing developments to prepare for the future
 Press Release 2018/07/20 2018 Half-Year Results Ongoing developments to prepare for the future The Board of Directors of Société de la Tour Eiffel, which met on 20 July 2018, approved the financial statements
Dream Global REIT 2018 Fourth Quarter 1
 EPRA Metrics The annual EPRA BPR Awards aim to recognize and commend upon the efforts of property companies that have successfully adopted the EPRA BPR Guidelines. Based on the assessment performed by
DREAM GLOBAL ANNOUNCES FOURTH QUARTER RESULTS, 24% ANNUAL NET ASSET VALUE GROWTH AND OVER 6% FOURTH QUARTER COMPARATIVE NOI GROWTH
 DREAM GLOBAL ANNOUNCES FOURTH QUARTER RESULTS, 24% ANNUAL NET ASSET VALUE GROWTH AND OVER 6% FOURTH QUARTER COMPARATIVE NOI GROWTH TORONTO, FEBRUARY 20, 2019 DREAM GLOBAL REIT (TSX:DRG.UN, FRA:DRG) (or
2017 Annual Results Construction of solid and sustainable cash flow continues
 Press Release 2018/03/07 2017 Annual Results Construction of solid and sustainable cash flow continues The Board of Directors of the Société de la Tour Eiffel, meeting on 7 March 2018, approved the annual
Half-year report January-June 2016
 Half-year report January-June 2016 Summary, January-June 2016» Rental income amounted to SEK 1,070 million (SEK 989 million corresponding period preceding year).» Profit from property management amounted
2014 half-year results. 23 rd July 2014
 23 rd July 2014 Main achievements first half 2014 Stated 2014 objectives Achievements to date New acquisitions One agreement contracted for a 8,300 m² office building in the southern inner rim of Paris
2017 FULL YEAR 16 FEBRUARY 2018
 FULL YEAR RESULTS 16 FEBRUARY 2018 : Delivering in line with strategy 1.1 billion invested Asset acquisitions 610m Development capex 414m Land acquisitions 92m 525 million disposals Asset sales 432m Land
FY 2015 Results TLG IMMOBILIEN AG March FY 2015 Results Presentation
 FY 2015 Results TLG IMMOBILIEN AG March 2016 DISCLAIMER This presentation includes statements, estimates, opinions and projections with respect to anticipated future performance of TLG IMMOBILIEN ("Forward-Looking
FY17 RESULTS per share (+14% YoY) Dividends of the period 21.6% (+18.0% YoY) EPRA NAV per share increase m Assets revaluation (1)
 Dividends of the period 21.6% (+18.0% YoY) EPRA NAV per share increase m Assets revaluation (1)") FY17 RESULTS Trading Update AT A GLANCE In 2017 MERLIN Properties achieved excellent results in cash flow generation and portfolio value pushing shareholder return to a very high level TOTAL SHAREHOLDER
FY17 RESULTS Trading Update AT A GLANCE In 2017 MERLIN Properties achieved excellent results in cash flow generation and portfolio value pushing shareholder return to a very high level TOTAL SHAREHOLDER
2018 Q3: TENANTS FIRST Putting the needs of our tenants at the centre of everything we do. 26 October 2018
 2018 Q3: TENANTS FIRST Putting the needs of our tenants at the centre of everything we do 26 October 2018 CONTENT 1 HIGHLIGHTS AND KEY FIGURES 2 NEW NAME 3 MARKET OVERVIEW 4 GENERAL COMPANY OVERVIEW 7
Year-end report January to December 2016
 Akelius Residential Property AB (publ) Year-end report January to December Growth for comparable properties 4.1 percent rental income 8.0 percent net operating income Change in property value 17 percent
Analyst Presentation 12 February 2018
 Analyst Presentation 12 February 2018 Disclaimer This presentation is not an offer or an invitation to sell or exchange securities, or a recommendation to subscribe, buy or sell ANF Immobilier securities.
2013 Half Year Results
 2013 Half Year Results 31 July 2013 Geopost, Enfield An active and successful period Strong operational performance Lettings up 30% Good momentum in development pipeline Further cost savings achieved Portfolio
Interim Report, H1 2017/18. Amerika Have, residential property Copenhagen, Denmark
 Interim Report, H1 2017/18 Amerika Have, residential property Copenhagen, Denmark Contents 1. The Group s results in H1 2017/18 Financial highlights and key ratios Segment results Projects handed over
Market update Q3 2017
 Market update Q3 2017 1 Rikshem in brief Total property value SEK 40.3 bn Portfolio comprising c. 600 properties with c. 28,000 apartments. Lettable area c. 2.2 million sqm Annual rental income 2016 was
Interim Report, H1 2016/17. Illustration: Amerika Have, residential property Copenhagen, Denmark
 Interim Report, H1 2016/17 Illustration: Amerika Have, residential property Copenhagen, Denmark Contents 1. The Group s results in H1 2016/17 Financial highlights and key ratios Segment results Handed-over
SUNTEC REIT FINANCIAL RESULTS. For the 2 nd Quarter and Half Year ended 30 June 2017
 SUNTEC REIT FINANCIAL RESULTS For the 2 nd Quarter and Half Year ended 30 June 2017 26 July 2017 Agenda 03 2Q 17 Highlights 05 Financial Highlights 18 Office Portfolio Performance 25 Retail Portfolio Performance
Six-month report January June 2018 rikshem.se
 rikshem.se Six-month report January June Six-month report Rental income increased 3 percent to MSEK 1,374 (1,335). Net operating income declined to MSEK 748 (758), mainly as a result of the harsh winter
6M17 RESULTS. +5.7% FFO per share YoY % EPS YoY % EPRA NAV YoY +2.6% +3.4% +5.5% +16.3% All bps Occupancy vs 31/12/16
 6M17 RESULTS Trading Update CONSOLIDATED PERFORMANCE +5.7% FFO per share YoY +37.2% EPS YoY +12.2% EPRA NAV YoY Excellent set of results showing robust generation of cash flow FFO per share of 0.32 (+5.7%
DEMIRE Deutsche Mittelstand Real Estate AG Conference Call 1H 2018 Results
 DEMIRE Deutsche Mittelstand Real Estate AG Conference Call 1H 2018 Results 16 Disclaimer This document is for informational purposes only. This document is not intended to form the basis of any investment
M A R C H 22,
 MARCH 22, 2017 1 01 2 ADO THE PURE-PLAY BERLIN RESIDENTIAL SPECIALIST Investment highlights 1 2 3 4 Berlin residential pure play with a 2.3bn quality portfolio Efficient, fully integrated and scalable
26 February 2013 FIRST HALF RESULTS PRESENTATION
 26 February 2013 FIRST HALF RESULTS PRESENTATION Investment highlights Proven track record of consistent earnings growth and meeting targets Strategically located and diverse residential portfolio Urban
Year-end report Peter Wågström President and CEO Ann-Sofie Danielsson Chief Financial Officer NCC AB 1
 Year-end report 2012 Peter Wågström President and CEO Ann-Sofie Danielsson Chief Financial Officer 2013-01-30 NCC AB 1 Q4 in brief Strong close resulted in successful year All business areas on par with
Telefonplan Stockholm Property AB (publ) REPORT FOR THE PERIOD January 1 December 31, 2015
 REPORT FOR THE PERIOD January 1 December 31, 2015") REPORT FOR THE PERIOD January 1 December 31, 2015 Image: View of Timotejen 19 Corp. Reg. No. 556708-3588 Telefonplan Stockholm Property AB (publ) REPORT FOR THE PERIOD January 1 December 31, 2015 JANUARY
REPORT FOR THE PERIOD January 1 December 31, 2015 Image: View of Timotejen 19 Corp. Reg. No. 556708-3588 Telefonplan Stockholm Property AB (publ) REPORT FOR THE PERIOD January 1 December 31, 2015 JANUARY
Estancia Logistik AB (publ) Quarterly Report. April - June 2015
 Quarterly Report. April - June 2015") Estancia Logistik AB (publ) Quarterly Report April - June 2015 QUARTERLY REPORT Q2 2015 Optimizing Management April - June 2015 Quarter Rental income amounted to MSEK 40 (43). Operating profit totaled
Estancia Logistik AB (publ) Quarterly Report April - June 2015 QUARTERLY REPORT Q2 2015 Optimizing Management April - June 2015 Quarter Rental income amounted to MSEK 40 (43). Operating profit totaled
2016 Annual Results Strong growth in earnings
 Press Release 08/03/2017 2016 Annual Results Strong growth in earnings The Board of Directors of the Société de la Tour Eiffel met on 8 March 2017, chaired by Hubert Rodarie, and approved the financial
Estancia Logistik AB (publ) Quarterly Report. July - September 2015
 Quarterly Report. July - September 2015") Estancia Logistik AB (publ) Quarterly Report July - September 2015 QUARTERLY REPORT Q3 2015 Focus on Vacancies July - September 2015 Quarter Rental income amounted to MSEK 40 (40). Operating profit totaled
Estancia Logistik AB (publ) Quarterly Report July - September 2015 QUARTERLY REPORT Q3 2015 Focus on Vacancies July - September 2015 Quarter Rental income amounted to MSEK 40 (40). Operating profit totaled
Interim Report January March 2018
 Interim Report January March Many units in production with high sales rate 1 JANUARY 31 MARCH Net sales amounted to SEK 1,639 M (2,93) Operating profit was SEK 43 M (53), of which profit from land sales
Annual Report 2016/17. Illustration: Amerika Have, residential units Copenhagen, Denmark
 Annual Report 2016/17 Illustration: Amerika Have, residential units Copenhagen, Denmark Contents 1. Group results for 2016/17 Financial highlights and key ratios Segment results Handed-over projects High
First Sponsor Group Limited Investor Presentation 24 July 2015
 First Sponsor Group Limited Investor Presentation 24 July 2015 The initial public offering of the Company s shares was sponsored by DBS Bank Ltd., who assumes no responsibility for the contents of this
9M 2016 Results TLG IMMOBILIEN AG November M 2016 Results Presentation
 9M 2016 Results TLG IMMOBILIEN AG November 2016 DISCLAIMER This presentation includes statements, estimates, opinions and projections with respect to anticipated future performance of TLG IMMOBILIEN ("Forward-Looking
Interim report January September 2018 rikshem.se
 rikshem.se Interim report January September Interim report Events during the period () Rental income increased MSEK 75 or 3.8 percent to MSEK 2,071 (1,996). Net operating income declined to MSEK 1,183
Zug Estates Group. Financial Year Tobias Achermann, CEO Gabriela Theus, CFO. March 11, 2016
 Zug Estates Group Financial Year 2015 Tobias Achermann, CEO Gabriela Theus, CFO March 11, 2016 2015 in a nutshell Gratifying result Operating income before depreciation and revaluation CHF 39.2 Mio. +4.0%
Best Practices Recommendations. Q&A November EPRA Best Practices Recommendations Q&A November
 Best Practices Recommendations Q&A November 2016 EPRA Best Practices Recommendations Q&A November 2016 1 Contents 1. Introduction 03 2. General Recommendations 04 3. EPRA Earnings 05 4. EPRA NAV 15 5.
JM Group. Sweden. Norway. Finland. Belgium 3 % 19 % 78 % 0 % 12-month period 2) SEK 301 per share
 SEK 301 per share") Interimreport 2017 JM Group Revenue: SEK 16.7 billion Total assets: SEK 13.5 billion No. of building rights: 34,600 No. of employees: 2,538 Market Cap: SEK 21.3 billion 2) 19 % Norway 78 % Sweden 3 % Finland
Interimreport 2017 JM Group Revenue: SEK 16.7 billion Total assets: SEK 13.5 billion No. of building rights: 34,600 No. of employees: 2,538 Market Cap: SEK 21.3 billion 2) 19 % Norway 78 % Sweden 3 % Finland
Interim statement by the board of directors on the first quarter of 2018
 Regulated information - under embargo until 03/05/2018, 6 p.m. Antwerp, 3 May 2018 on the first quarter of 2018 Third logistics site in the Netherlands: agreement signed for the purchase of the site and
ATRIUM COMPANY PRESENTATION
 ATRIUM COMPANY PRESENTATION THE LEADING OWNER & MANAGER OF CENTRAL EASTERN EUROPEAN SHOPPING CENTRES May 2017 / Based on 2016 full-year results ATRIUM LEADING OWNER & MANAGER OF CEE SHOPPING CENTRES Strong
Taubman Centers, Inc. Taubman/Starwood Capital Group Transaction
 Taubman Centers, Inc. Taubman/Starwood Capital Group Transaction June 18, 2014 Forward Looking Language and Use of Non-GAAP Measures For ease of use, references in this presentation to Taubman Centers,
Interim statement from the Board of Directors for the first quarter of 2015
 Regulated information - under embargo until 05/05/2015, 8 a.m. Antwerp, 5 May 2015 Interim statement from the Board of Directors Acquisition of a modern logistics site of approximately 52.000 m² in a prime
Interim results. for the period ended 31 December 2014
 Interim results for the period ended 31 December 2014 Introduction 2 Introduction to Delta International First African (excluding South Africa) focused property fund listed on the JSE Offers investors
Quarterly report
 Quarterly report 3 2017 2017-01-01 to 2017-09-30 Jefast Holding AB (publ), org nr 556721-2526 Third quarter Revenue inline with last year Portfolio value increase of 28.6% to 2,965 m (2,305) 2017 2016
Year-end report January December 2018 rikshem.se
 rikshem.se Year-end report January December Year-end report Events during the year Profit for the year rose to MSEK 2,489 (2,430). Rental income increased MSEK 127 or 4.8 percent during the year to MSEK
Interim Report January June 2018
 Interim Report January June More housing units sold and good sales rate in ongoing production 1 APRIL 3 JUNE amounted to SEK 2,773 M (3,387) Operating profit was SEK 36 M (45), of which profit from land
Annual Report 2015/16. Illustration: BROEN Shopping, shopping centre Esbjerg, Denmark
 Annual Report 2015/16 Illustration: BROEN Shopping, shopping centre Esbjerg, Denmark Contents 1. Financial highlights and key ratios 2. Strategic focus 2018 3. 2015/16 at a glance Segment results Handed-over
Net rental income increased by 25.36% to EUR million
 INTERIM STATEMENT OF THE BOARD OF DIRECTORS THIRD QUARTER 2018-2019 1 (closed on 31.12.2018) Net rental income increased by 25.36% to EUR 69.52 million EPRA Earnings 2 for the third quarter of financial
HALF YEAR RESULTS H Asset rotation and vacancy reduction driving operating performance. Vacancy rate of 16.6% (down 1.8% versus year-end 2017)
") HALF YEAR RESULTS H1 2018 Asset rotation and vacancy reduction driving operating performance Vacancy rate of 16.6% (down 1.8% versus year-end 2017) EPRA NAV of 38.44 per share (up 5% versus year-end 2017)
HALF YEAR RESULTS H1 2018 Asset rotation and vacancy reduction driving operating performance Vacancy rate of 16.6% (down 1.8% versus year-end 2017) EPRA NAV of 38.44 per share (up 5% versus year-end 2017)
Opening of the first coworking centre in the Triomphe building
 Press release Regulated information 09 May 2018 5:40 PM Opening of the first Silversquare @Befimmo coworking centre in the Triomphe building EPRA earnings of 0.98 per share, in line with the outlook Net
Presentation for REITs Symposium 2016
 Presentation for REITs Symposium 2016 4 June 2016 Important Notice This presentation shall be read in conjunction with OUE Commercial REIT s Financial Results announcement for 1Q 2016 dated 10 May 2016.
SITE CENTERS NOVEMBER 2018
 SITE CENTERS NOVEMBER 2018 JOINT VENTURE WITH CHINESE INSTITUTIONAL INVESTORS $607MM JOINT VENTURE ALLOWS SITE CENTERS TO ACCELERATE OPPORTUNISTIC INVESTING AND FURTHER IMPROVE THE BALANCE SHEET Dividend
HIAG Immobilien Half-Year Results 2015 September 1 st, HIAG Immobilien 1
 Half-Year Results 2015 September 1 st, 2015 1 Disclaimer The financial data as well as the other information presented herein constitute selected information. The information in this presentation does
Year-end report January December 2017 rikshem.se
 rikshem.se Year-end report January December The healthy profit after tax resulted from a favorable market, effective management, successful new builds and dedicated employees. Sophia Mattsson-Linnala,
2013 annual results. 19 th March 2014
 19 th March 2014 Main achievements 2013 Stated 2013 objectives Achieved Securing rental income Pre-letting Montrouge - 6 years - 1.8m New leases / extensions Total amount: 9.2m Asset disposals ( 200m over
Investor Presentation First Half Results
 Investor Presentation 2010 First Half Results 1 Disclaimer This document has been prepared by ANF Immobilier SA ( ANF Immobilier ) solely for the use of presentations made to investors or analysts. ANF
conwert company presentation + December 2015
 conwert company presentation + December 2015 conwert is a fully integrated real estate company focusing on residential properties and apartment buildings in Austria and Germany. This focus is complemented
Year-end report January 1 December 31, 2015
 Year-end report January 1 December 31, Peter Wågström President and CEO NCC Ann-Sofie Danielsson Skånegatan, Gothenburg 1 Q4 in brief Orders received SEK 20.4 BN (18.5) Order backlog SEK 56.6 BN (54.8)
AZRIELI GROUP. Conference Call Presentation. Financial Results June 30, 2016
 AZRIELI GROUP Conference Call Presentation Financial Results June 30, 2016 Disclaimer The information included in this presentation is a summary only and does not exhaust all of the information on the
Hansteen Interim Results. Heads of the Valley, Rhymney
 2018 Interim Results Heads of the Valley, Rhymney Investor and Analyst Presentation 22 August 2018 Introduction Urban industrial / logistics specialist Seven regional UK offices High yielding built portfolio
Results H September 9, 2009
 Results H1 2009 September 9, 2009 1 Strategy for the crisis Fair value: analysis and impacts The group s companies Analysis of H1 2009 accounts Affine on the stock exchange 2 STRATEGY FOR THE CRISIS Simplifying
PRESENTATION RESULTS Q Aldar Q Results
 Q1 2018 RESULTS PRESENTATION DISCLAIMER This disclaimer governs the use of this presentation. You must not rely on the information in the presentations and alternatively we recommend you to seek advice
Japan Real Estate Investment Corporation Performance Review for Fiscal Period Ended September 30, 2016 November 16, 2016
 Japan Real Estate Investment Corporation Performance Review for Fiscal Period Ended September 30, 2016 November 16, 2016 Message from President & CEO I would like to express our sincere appreciation that
Board of Directors' Report on the Corporation's State of Affairs
 Board of Directors' Report on the Corporation's State of Affairs Brack Capital Properties NV (hereinafter: "the Company") hereby submits the Board of Directors' report for a period of six months ending
First Sponsor Group Limited Investor Presentation 27 April Dreeftoren, Amsterdam Southeast (artist impression)
") First Sponsor Group Limited Investor Presentation 27 April 2017 Dreeftoren, Amsterdam Southeast (artist impression) Contents Page Section 1 Key Message 2 Section 2 Financial Highlights 6 Section 3 Key
First Sponsor Group Limited Investor Presentation 27 April 2017 Dreeftoren, Amsterdam Southeast (artist impression) Contents Page Section 1 Key Message 2 Section 2 Financial Highlights 6 Section 3 Key
Invincible Investment Corporation Follow on Acquisition and Disposition
 Invincible Investment Corporation Follow on Acquisition and Disposition TSE Code : 8963 July 25, 2017 Deal Summary Portfolio rebalance, acquiring new addition of Hotel MyStays Gotanda Station at a 7.3%
STAG INDUSTRIAL ANNOUNCES SECOND QUARTER 2018 RESULTS
 STAG INDUSTRIAL ANNOUNCES SECOND QUARTER 2018 RESULTS Boston, MA July 31, 2018 - STAG Industrial, Inc. (the Company ) (NYSE:STAG), today announced its financial and operating results for the quarter ended
Financial Results for the 2nd Quarter of FY November 8, 2017 NTT Urban Development Corporation
 Financial Results for the 2nd Quarter of FY 2017 November 8, 2017 NTT Urban Development Corporation Financial Results for the 2nd Quarter of FY 2017 Operating revenue and operating income were 72.7 billion
Sponda Plc s half year financial report January June 2016
 1.1. 30.6.2016 Sponda owns, leases and develops business properties in the Helsinki metropolitan area and the largest cities in Finland. Sponda s operations are organised into three business units: Investment
Sirius Real Estate Ltd Half Year Presentation 2013
 Sirius Real Estate Ltd Half Year Presentation 2013 Who are we We are a leading provider of branded mixed-use flexible workspace in Germany 2 Financial Highlights Substantial increase in recurring profit
Real estate development significant growth driver Company profile and business model High-quality Investment Portfolio
 STRATEGY Over three decades of continual development, CA Immo has become distinctly competitive and secured an excellent market position in Central Europe. By letting, managing and developing high quality
FY2012 RESULTS PRESENTATION
 FY2012 RESULTS PRESENTATION 21 August 2012 INVESTMENT HIGHLIGHTS Proven track record of consistent earnings growth and meeting targets Strategically located and diverse residential portfolio Urban and
SUNTEC REIT FINANCIAL RESULTS. For the 1 st Quarter ended 31 March 2017
 SUNTEC REIT FINANCIAL RESULTS For the 1 st Quarter ended 31 March 2017 26 April 2017 Agenda 03 Q1 17 Highlights 05 Financial Highlights 15 Office Portfolio Performance 22 Retail Portfolio Performance 29
WP Glimcher Reports Second Quarter 2016 Results
 NEWS RELEASE WP Glimcher Reports Second Quarter 2016 Results COLUMBUS, OH August 3, 2016 WP Glimcher Inc. (NYSE: WPG) today reported financial and operating results for the second quarter ended June 30,
FIRST INDUSTRIAL REALTY TRUST REPORTS FIRST QUARTER 2018 RESULTS
 First Industrial Realty Trust, Inc. 311 South Wacker Drive Suite 3900 Chicago, IL 60606 312/344-4300 FAX: 312/922-9851 MEDIA RELEASE FIRST INDUSTRIAL REALTY TRUST REPORTS FIRST QUARTER 2018 RESULTS Occupancy
HALF-YEAR RESULTS. Presentation of 31 July 2013
 HALF-YEAR RESULTS 2013 Presentation of 31 July 2013 AFFINE KEY TAKEAWAYS EPRA Earnings down due to disposals (-) Rental income down as a consequence of 2012 disposals (-) Negative global result from associates
Investor Presentation Second Quarter 2006
 Investor Presentation Second Quarter 2006 2006 Highlights (Six months to June 30, 2006) Revenues up 10.2% from accretive acquisitions Net Operating Income up 10.9% NOI margin increases Stabilized portfolio
3M17 RESULTS. +4.6% FFO per share YoY % NAV per share YoY. +2.6% Rents like-for-like (3) YoY. +3.6% Office release spread
 YoY. +3.6% Office release spread") 3M17 RESULTS Trading Update CONSOLIDATED PERFORMANCE +4.6% FFO per share YoY +14.1% NAV per share YoY Excellent set of results showing value creation across all metrics FFO per share of 0.16 (+4.6% YoY)
3M17 RESULTS Trading Update CONSOLIDATED PERFORMANCE +4.6% FFO per share YoY +14.1% NAV per share YoY Excellent set of results showing value creation across all metrics FFO per share of 0.16 (+4.6% YoY)
Interim announcement of the Board of Directors First quarter 2018 ending on 31 March 2018
 Interim announcement of the Board of Directors First quarter 2018 ending on 31 March 2018 Antwerp, Belgium Interim results for the period from 1 January 2018 until 31 March 2018 Xior confirms its objectives
Corporate Presentation Q SHH Bostad AB
 Corporate Presentation Q3 2018 SHH Bostad AB SHH in brief A residential developer offering affordable housing throughout Sweden 3 SHH in brief Introduction SHH Bostad AB (publ) (SHH), incorporated 2010,
Highwoods Reports Third Quarter 2017 Results
 FOR IMMEDIATE RELEASE Ref: 17-20 Contact: Brendan Maiorana Senior Vice President, Finance and Investor Relations 919-431-1529 Highwoods Reports Third Quarter 2017 Results $0.55 Net Income per Share $0.86