January 2013 News. Page 1 of 34
|
|
|
- Whitney Moore
- 6 years ago
- Views:
Transcription

1 January 2013 News Page 1 of 34
2 January 2013 Newsletter Table of Contents Population Growth... 1 Brisbane Statistical Division... 1 Brisbane City... 2 Sunshine Coast... 2 Consumer Sentiment... 3 QLD Properties for Sale... 4 QLD Properties for Rent... 4 Capital City Auction Clearance Rates... 5 Australian Capital City Home Values... 5 Queensland Dwelling Approvals... 6 Brisbane Dwelling Approvals... 9 Sunshine Coast Dwelling Approvals Brisbane Residential Market Housing Prices Rents Units Prices Rents Vacant Land Prices Brisbane Retail Key Market Indicators (Third Quarter 2012) Brisbane Office Market Market Overview Key Market Indicators (Third Quarter 2012) Brisbane Industrial Market Overview Sunshine Coast Residential Market Housing Prices Median Housing Prices Q Housing - Rentals Rents Units Prices Median Unit Prices Q Unit Rentals Rents Vacant land Prices... 25
3 Median Vacant Land Prices Q Industrial Market Commercial Office Overview Retail Overview References... 31

4 P a g e 1 Residential Market Population Growth Brisbane Statistical Division Brisbane is the fasted growing capital city in Australia. Population and economic growth are well above the Australian average. As published in the Midwood Report s [August quarter 2012], Brisbane s cumulative annual population growth has been estimated at 2.0% or 40,000 people per year bringing the current population to approximately 2.01 million people. Source (Morris 2012; RTA 2012). Brisbane s Statistical Division [SD]comprising Brisbane City, Logan, Ipswich, Redland, Redcliffe, Caboolture, Pine Rivers and Beenleigh areas, accounts for 45 per cent of Queensland s population and has recorded the largest growth of all SD s in Queensland, with an increase of 34,800 people (1.7%) in the year to June However the fastest-growing SD in south-east Queensland [and the third fastest-growing in the state] was again West Moreton which grew by 1.9% [or 1,900 people] in the year to June Source (ABS 2012). Figure 1 - Source (Morris 2012)
5 P a g e 2 Brisbane City The three most populous LGA s in Australia were all located in south-east Queensland, being: 1. Brisbane City: 1.08 million 2. Gold Coast City: 536, Moreton Bay Region: 389,700 Brisbane City LGA experienced the largest population increase in Australia in the year to June 2011, up 14,100 people [1.3%]. In the same period, 94% of the Statistical Local Areas [SLA] within the Local Government Area [LGA] of Brisbane City also experienced increases. The largest population increases were in Wakerly [540], Doolandella-Forest Lake [460] and Chermside [400] Source: (ABS 2012). In terms of the fastest-growth, the three best performing Statistical Local Areas in Brisbane City were: 1. Pallara-Heathwood-Larapinta (10.8%), 2. Wakerley (7.5%) 3. City - Inner (6.6%). In terms of the declining growth over the 12 months to June 2011, the two SLA s that experienced the largest declines were both found in the Brisbane City LGA: 1. Keperra [- 40 people] 2. Bald Hills [-30 people]. Source: (ABS 2012) Sunshine Coast At present the Sunshine Coast is the amalgamation of three Local Authorities: Caloundra City, Maroochy Shire and Noosa Shire [South, Central and North respectively]. The Sunshine Coast recorded an average growth rate of 2.6% in the five years to the 2011 Census. Source: (ABS 2012) In the twelve months to June 2011 the Sunshine Coast experienced the 5 th largest growth in population of all LGA s in Queensland, recording an increase of 1.5% or 4955 people. The current population of the Sunshine Coast is 306,909, being 148,643 male and 158,266 female with a median age 42 years, which is 6 years above the Queensland average of 36 years. Source: (ABS 2012)
6 P a g e 3 Consumer Sentiment The Westpac - Melbourne Institute released the results of their monthly Consumer Sentiment Survey on 12 December 2012, entitled Consumer Sentiment disappoints, where the Consumer Sentiment Index fell -4.1% from in November to in December(Westpac Banking Corporation 2012b). Westpac s Chief Economist, Bill Evans, commented that is was a surprising result after the positive 5.2% increase in November despite rates being held steady by the Reserve Bank and furthermore by the rate cut delivered in the beginning of December. The index has now fallen back to its October level and is now trending -3.2% below levels seen in November Confidence levels of households with a mortgage responded positively to the rate cut, up 4.4%, while other respondents, households who are renting properties [- 9.1%] and those who wholly own their properties [-10.9%], were subdued. The survey found that the major news categories that influenced and had the largest impact on the respondents were based around economic conditions and specifically those featuring: news items on the economy; interest rates; budget and taxation; international economic conditions; inflation; and employment. Reportedly respondents continue to view the news around economic conditions; international conditions; and employment negatively [despite an employment headline fall from 5.4% to 5.2%]. There was however a big lift in the respondents views on interest rates. The interest rate cut boosted confidence around whether now is a good time to purchase a house to its highest level since September However ongoing pessimism around the economy and employment will limit the impact on actual housing market activity. Only one of the five components of the Index increased; where respondents were more confident around the outlook for their finances, this sub-index was up 4.6%. The next Reserve Bank Board meets on February 5, 2013 and the Westpac - Melbourne Institute s expectation is that the Board will decide to cut rates again in the March Quarter. Source: (Westpac Banking Corporation 2012a)

 QLD Properties for Rent Figure 3 - Source: (RPData-Rismark 2012c) RPData is reportedly tracking 90,919 properties currently for rent nationally, a decrease of - 1.")
7 P a g e 4 QLD Properties for Sale Figure 2- Source: (RPData-Rismark 2012b) RPData is reportedly tracking 284,389 properties currently for sale nationally, an increase of 2.1% from the same time last year. Total advertised listings shown for Queensland is 82,814, a decrease of -3.9% from the same time last year. Queensland s volume of new advertised listings for sale has increased slightly by 62 or 0.5% higher than the same time last year. Source (RPData-Rismark 2012b) QLD Properties for Rent Figure 3 - Source: (RPData-Rismark 2012c) RPData is reportedly tracking 90,919 properties currently for rent nationally, a decrease of - 1.4% from the same time last year. In Queensland, the volume of New advertised listings for rent are shown to have experienced a decrease of -1,366 or -11.5% lower than the same time last year, while Total advertised listings for rent have also experienced a decrease of -4,205 or -16.9% lower from the same period last year. Source: (RPData-Rismark 2012c)

8 P a g e 5 Capital City Auction Clearance Rates Figure 4: Source - (RPData-Rismark 2012a) The number of auctions which took place across the capital cities increased from 1,913 to 2,102 over the week ending 18 November The combined auction clearance rate for the capital cities was 52.3%, up from 50.6% the previous week. The capital city of Perth reported the highest clearance rate at 59.1% however Melbourne remains the largest auction market in the country with 881 auctions taking place and recording the second highest clearance rate of 58.0%, followed by Sydney with 602 auctions and a clearance rate of 50.0%. Brisbane reported 118 auctions with a clearance rate of just 33.1%. Source: (RPData-Rismark 2012a) Australian Capital City Home Values Across the eight capital cities the RPData-Rismark Home Value Index for November saw values rise 0.4% in the first two weeks but only to reverse and finish flat for the month. The only capital city to record negative growth was Melbourne, which fell -1.0%. The strongest performing centre for the month was Perth, recording an increase of 1.0%, while both Brisbane s and Adelaide s values increased 0.5% and Sydney s values rose just 0.1%. On a quarterly basis Darwin led with the highest gains of 3.1%, Perth 3.0%, Brisbane 0.8%, Sydney 0.6% and Adelaide at 0.4%. The three centres that recorded negative quarterly growth were Melbourne and Canberra both recording -0.7% and Hobart with -4.5%. Aggregated quarterly over the eight capital cities an increase of 0.4 was realised. On an annual basis Darwin was up 13.1%, followed by Perth 3.4%, Sydney 1.3% and Brisbane 0.4%, while Canberra finished flat. Hobart -7.0% recorded the largest decrease followed by Adelaide -3.5%, Melbourne -2.5%. Overall the eight capital cities recorded and aggregated decrease of -0.1%. Source: (RPData-Rismark 2012d)


9 P a g e 6 Figure 5 Source - (RPData-Rismark 2012d) Figure 6 Source - (RPData-Rismark 2012d) Queensland Dwelling Approvals The Urban Development Institute of Australia (Queensland) December Development & Construction Industry Performance Report indicates that while approvals, new home lending and vacant lot sales figures will finish higher in 2012 than in 2011, the pace of the industry recovery in 2012 was slower than expected due to low confidence levels despite reasonable economic fundamentals. In the October 2012 quarter across Queensland, total private sector dwelling approvals decreased -5.8%, which partially reversed the 12.4% gains realised in July The falls in the core detached dwelling sector, down -8.4%, were seen to have driven the declines. Despite the drop in activity, detached dwelling approvals in the year to date (January 2012 to October 2012) are 19% higher than the corresponding period in (UDIA 2012b)
 to 6,802.")
10 P a g e 7 Approved Dwelling Units: QLD (Moving quarterly totals, Seasonally Adjusted) Figure 7 - Source (UDIA 2012a) After posting a 12.4% increase in the three months to Jul-12, total private sector dwelling approvals fell 5.8% in the Oct-12 quarter (seasonally adjusted) to 6,802. Total dwelling approvals (public & private) decreased 5.7%. Detached private sector approvals fell 8.4% in the Oct-12 quarter while approvals in the volatile units and attached dwelling sector were flat. Quarterly private sector approvals in the core detached dwellings sector are 18% higher than the cyclical low reached in Sep-11, however they remain 27% below longterm averages. Source: (UDIA 2012a)
. Queensland s annual approvals of 27,337 remain -25.0% below long-term averages.")
11 P a g e 8 Total Approved Dwellings: State Comparisons (Annual, Seasonally Adjusted) Figure 8 Source: (UDIA 2012a) For approved dwellings, Queensland remains in the deepest slump of any state despite showing the strongest year-on-year of any State (+2%). Queensland s annual approvals of 27,337 remain -25.0% below long-term averages. Source: (UDIA 2012a)

12 P a g e 9 Brisbane Dwelling Approvals Figure 9- Source: (Morris 2012) The Brisbane Statistical District half yearly dwelling approvals the first half of 2012 show a marked overall decrease of -7.8% in total dwelling approvals to the corresponding period in While approvals for houses increased 6.3%, approvals for units fell sharply -22.7%. Source: (Morris 2012)

13 P a g e 10 Sunshine Coast Dwelling Approvals Figure 10- Source: (Morris 2012) The first half of 2012, The Sunshine Coast Statistical District half yearly dwelling approvals show a strong overall increase of 15.9% in total dwelling approvals as compared to the corresponding period in A significant increase of 43.1% for house approvals was recorded, while approvals for units fell sharply -18.1% over the corresponding periods. Source: (Morris 2012)
14 P a g e 11 Brisbane Residential Market The Brisbane City Council local government areas [BCC-LGAs] comprise: Balmoral, Belmont, Brisbane, Coorparoo, Enoggera, Hamilton, Ithaca, Kedron, Moggill, Sandgate, Sherwood, Stephens, South Brisbane, Taringa, Tingalpa, Toombul, Toowong, Windsor, Wynnum and Yeerongpilly. The BCC Statistical Division [BCC- SD] comprises the five local government councils of Brisbane City, Ipswich City, Logan City, Moreton Bay Regional Council and Redland City. According to RPData-Rismark (2012), the total aggregated sales statistics data recorded for third Quarter 2012 as compared to 2011 shows small decreases in median prices for Houses and slightly larger decreases for Unit segments. Statistically Land in Brisbane s Local Government Areas performed the best with strong increases in median prices while land out in the wider Statistical Division fared notably worse, recording the largest price decreases of all the segments. Sale volumes for all three segments within the inner BCC LGAS and outer lying BCC SD decreased across the board. Housing Prices Area Median Housing Price 3rd Quarter 2012 Median Price Growth % Q vs. Q Annual Sales Volume Change % Q vs. Q BCC-LGAS $495, BCC-SD $460,
15 P a g e 12 BCC LGA s Housing Prices Figure 11: BCC LGAs Housing (Rpdata-Rismark 2012) The third quarter of 2012, the median House sale price, aggregated over the inner twenty BCC LGAs was $495,000, having decreased slightly from $499,500 Q3-2011, recording a fall of - $4,500 or -0.9%. The volume of sales recorded in Q was 3,343, a decrease of -3.8% or 123 lower than the 2011 third quarter sales figures. Source: (Rpdata-Rismark 2012) BCC SD Housing Prices Figure 12: BCC SD Housing (Rpdata-Rismark 2012) The third quarter of 2012, the median House sale price, aggregated over the BCC Statistical Division was $460,000, which has remained static to Q figures. There were 4,455 sales
16 P a g e 13 recorded in Q3-2012, a slight decrease of -0.6% or -27 lower than the 2011 third quarter sales figures. Source: (Rpdata-Rismark 2012) Rents Brisbane City: House Rent ($) Sep-10 Sep-11 Sep-12 New Bonds Rent ($) New Bonds Rent ($) New Bonds 3 Bed Bed Table 1 - Source: (RTA 2012) Recorded median rents in the September Quarter 2012 for three bedroom houses were $400 per week, having increased 2.6% or $10 per week as compared to the corresponding period the previous year. Over the same period, rents for four bedroom houses were $480 per week, having increased 2.1% or $10 per week. Source: (RTA 2012). Units Prices Area Median Unit Price 3rd Quarter 2012 Median Price Growth % Q vs. Q Annual Sales Volume Change % Q vs. Q BCC-LGAS $389, BCC-SD $379,
17 P a g e 14 BCC LGAs Units Prices Figure 13: BCC LGAs Units (Rpdata-Rismark 2012) The third quarter of 2012 combined median Unit sale prices for Building Units and Group Title, aggregated over the inner twenty BCC LGAs was $389,125, having decreased slightly from $396,559 (Q3-2011), recording a median price fall of -$7,433 or -1.9%. There were 2,070 sales recorded in Q3-2012, a decrease of -2.6% or -54 lower than the 2011 third quarter sales figures. Source: (Rpdata-Rismark 2012) BCC SD Units Prices Figure 13: BCC SD Units (Rpdata-Rismark 2012)
18 P a g e 15 The third quarter of 2012 combined median Unit sale prices for Building Units and Group Title, aggregated over the BCC Statistical Division was $379,250, having decreased from $387,000 (Q3-2011), recording a median price fall of -$7,750 or -2.0%. There were 2,247 sales recorded in Q3-2012, a decrease of -2.4% or -53 lower than the 2011 third quarter sales figures. Source: (Rpdata-Rismark 2012) Rents Brisbane City: Unit Sep-10 Sep-11 Sep-12 Rent ($) New Bonds Rent ($) New Bonds Rent ($) New Bonds 1 Bed Bed Bed Table 2 - Source: (RTA 2012) Recorded median rents in the September Quarter 2012 for one bedroom units were $310 per week, having increased 6.9% or $20 per week as compared to the corresponding period the previous year. Over the same period, rents for two bedroom units were $395 per week, having increased 3.9% or $15 per week. Median rents for three bedroom units were $490 per week, having increased 3.2% or $15 per week. Source: (RTA 2012). Vacant Land Prices Area Median Vacant Land Price 3rd Quarter 2012 Median Price Growth % Q vs. Q Annual Sales Volume Change % Q vs. Q BCC-LGAS BCC-SD $325, $213,
19 P a g e 16 BCC LGAs Vacant Land Prices Figure 14 - Source: BCC LGAs - Vacant Land (Rpdata-Rismark 2012) The third quarter of 2012 the median Land sale price, aggregated over the inner twenty BCC LGAs, was $325,000, having increased from $280,000 (Q3-2011), recording a median price rise of $45,000 or 13.8%. There were 227 sales recorded in Q3-2012, a decrease of -37.9% or 86 lower than the 2011 third quarter sales figures. Source: (Rpdata-Rismark 2012) BCC SD Vacant Land Prices Figure 15: BCC SD - Vacant Urban Land (Rpdata-Rismark 2012) The third quarter of 2012 the median Vacant Land sale price, aggregated over the BCC Statistical Division, was $213,000, having decreased from $235,000 (Q3-2011), recording a median price fall of -$22,000 or -10.3%. There were 503 land sales recorded in Q3-2012, a
20 P a g e 17 decrease of -43.7% or -220 lower than the 2011 third quarter sales figures. Source: (Rpdata- Rismark 2012) Brisbane Retail Conditions for Queensland s retail sector are generally correlated to retail turnover, which in recent years due largely to the GFC, has been volatile. In addition, increasing operating costs and a growing online retail market is placing pressure on retailer margins, having an impact rental growth trends. Local commercial agents have reported a reduction in transactions, particularly in the higher price segments, however quality centres with a good tenant profile appear to be drawing stable investor demand. Retail agents have reported a reduction in transactions in what is generally reviewed as a market sector recovering from the GFC and moreover being at the bottom of the property cycle. Demand for retail leasing is reportedly steady with local agents reporting current market rents being stable, however at reduced levels when compared to the peak of the market with incentives generally required to secure a quality tenant.

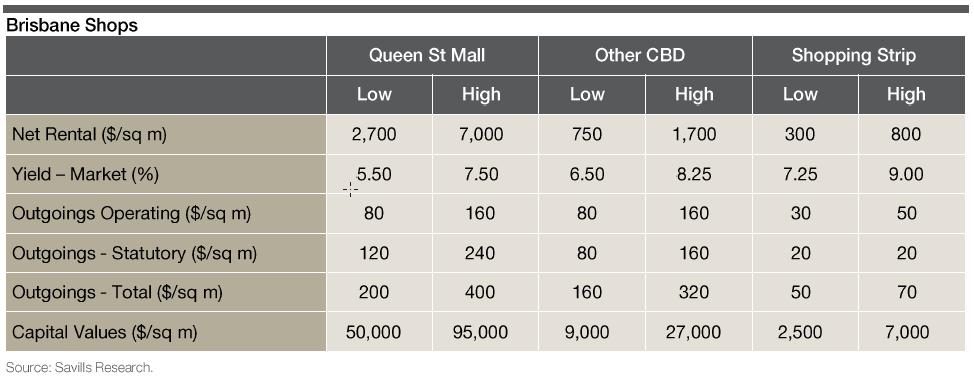
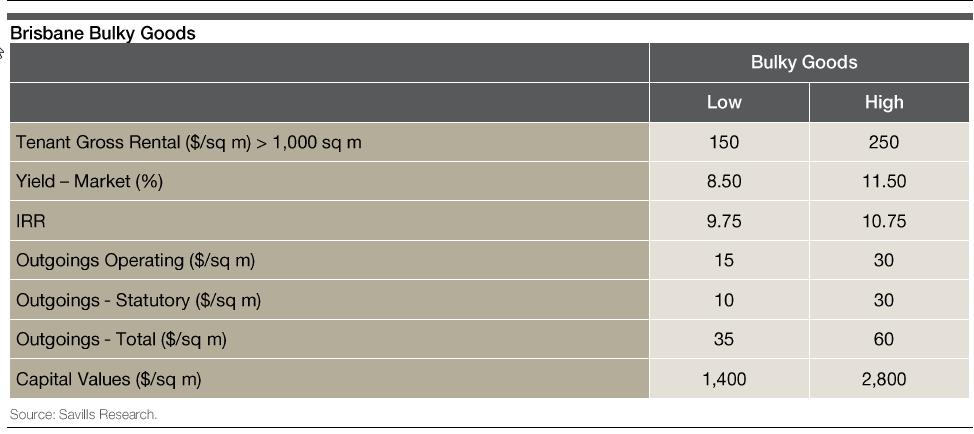
21 Key Market Indicators (Third Quarter 2012) P a g e 18

22 P a g e 19 Brisbane Office Market Market Overview Conditions for Queensland s commercial property sector have weakened in recent years following the GFC and uncertain times. Overall the office market in Brisbane is relatively stable with the outlook for the next two or three years to remain stable as most non-mining and resource related businesses are currently in survival mode rather than expansion due to the current broader economic conditions both in Australia and around the globe. The Brisbane CBD vacancy rate increased to 7.9% as at July 2012, up from 6.2% six months earlier. Despite the strong net absorption of 36,916m² over the period the new supply of 82,737m² outweighed this, resulting in the vacancy increase. Despite lower than expected new supply over the short term, the vacancy is expected to increase over the next 18 months as tenant demand is softer and the State Government contracts. Increased backfill space plus direct and sub-lease vacancy created by both private sector and State Government contraction have impacted short term rental growth prospects. Both prime and secondary effective rents are expected to fall approximately 5% over the year to June The Prime market is expected to recover that ground over the following year, while secondary space is expected to take longer to return to positive rental growth. Whist the overall market is relatively stable there are opportunities to purchase distress sale properties below market parameters. Key Market Indicators (Third Quarter 2012)
23 P a g e 20 Brisbane Industrial Market Overview 2012 In-line with the recent years demand in the $3 to $15 million price bracket remains the most limited as it is generally considered to be above the quantum of many private investors and below a level generally sought by institutions. In some contrast, prime property above $20 million is again attracting more steady demand, albeit limited in number, from institutions and wholesale funds seeking to create and/or maintain balanced geographic and sector portfolios. Prime and secondary industrial properties have a yield deferential that has continued to increase during Prime industrial yields are achieving yields of 7.75% to 8.75% especially with a quality tenant and long-term lease in place. With the current low interest rate environment purchasers still see value in prime industrial properties at this return. Secondary industrial witnessed yields ranging from 9.00% to 12.00% depending on standard of building, calibre of tenant, location and re-let ability characteristics. The demand from these properties comes from investors who are typically seeking properties bought to the market in distressed circumstances, which represent value buying opportunities. Rental rates for prime industrial property throughout 2012 have increased marginally and incentives have reduced as limited speculative development has occurred and supply has been absorbed. Tenants are seeking new buildings that offer state of the art production lines, can incorporate purpose built equipment and enables best practice stacking and storage space solutions. Leading researchers have indicated much of the industrial space that was vacant following the Global Financial Crisis has been absorbed and as at autumn 2012, vacancy was the lowest it had been since Available space has fallen from 250,000 square metres in spring 2011 to

24 P a g e ,000 square metres as at autumn 2012, representing take-up of approximately 70,000 square metres in this time. The majority of space taken-up was secondary accommodation, reflecting the limited speculative development during the past two to three years and resultant new stock currently available for lease, which is estimated to only 4.25% of all available stock. This imbalance of demand and supply for larger tenancies is creating a window of opportunity for developers with the capacity to undertake speculative projects. Whilst vacancy for new supply is low, secondary stock is experiencing relatively high levels of vacancy due to operational inefficiency and general obsolescence.
25 P a g e 22 Sunshine Coast Residential Market The Sunshine Coast is the amalgamation of three Local Authorities: Caloundra City, Maroochy Shire and Noosa Shire [South, Central and North respectively]. In 2009 the residential market declined dramatically, although recovered somewhat towards the end of that year. The market compressed through 2010 with a shrinking of volume and sale prices across the board (Houses, Units and Vacant Land) which has continued through 2011 and into Housing Prices Area Median Housing Price 3rd Quarter 2012 Median Price Growth % Q vs. Q Annual Sales Volume Change % Q vs. Q SC REGION $427, SC SOUTH $425, SC CENTRAL $425, SC NORTH $436, Median Housing Prices Q3 Figure 16: SC Region Housing The median House sale price, aggregated over the three combined Sunshine Coast regions, experienced a slight price decrease from $429,500 in the third Quarter of 2011 to $427,000 in Q3-2012, recording a fall of -$2,500 or -0.6%. There were 1,054 sales recorded in Q3-2012, an
26 P a g e 23 increase of 12.5% or -132 higher than the 2011 third quarter sales figures. Source: (Rpdata- Rismark 2012) Housing Rentals Recorded median rents in the September Quarter 2012 for three bedroom houses was $370 per week, having slightly risen 1.4% or $5 per week as compared to the corresponding period the previous year. Over the same period, rents for four bedroom houses increased from $420 per week to $440 per week, an increase of 4.8%. Bond lodgements increased by 1.4% for 3 bedroom houses but fell -4.5% in 4 bedroom houses in the September Quarter 2012 as compared to the same period in Source: (RTA 2012). Rents Sunshine Coast Regional Council Area: House Rent ($) Sep Qtr 10 Sep Qtr 11 Sep Qtr 12 New Bonds Lodged Rent ($) New Bonds Lodged Rent ($) New Bonds Lodged 3 Bed Bed Table 3 - Source: (RTA 2012) Units Prices Area Median Unit Price 3rd Quarter 2012 Median Price Growth % Q vs. Q Annual Sales Volume Change % Q vs. Q SC REGION $306, SC SOUTH $311, SC CENTRAL $294, SC NORTH $417,
27 P a g e 24 Median Unit Prices Q3 Figure 17: SC Region Units The third quarter of 2012 combined median Unit sale prices for Building Units and Group Title, aggregated over the three combined Sunshine Coast regions, experienced a significant price decrease from $352,500 in the third Quarter of 2011 to $306,875 in Q3-2012, recording a fall of -$45,625 or -14.9%. There were 659 sales recorded in Q3-2012, a small volume increase of 2.9% or 19 higher than the 2011 third quarter sales figures. Source: (Rpdata-Rismark 2012) Unit Rentals Recorded median rents in the September Quarter 2012 for one bedroom units were $245 per week, having increased 1.8% or $5 per week as compared to the corresponding period the previous year. Over the same period, rents for two bedroom units also increased $5 or 1.7% to $300 per week. Finally, median rents for three bedroom units were $380 per week, having increased 5.6% or $20 per week of the corresponding period the previous year. Bond lodgements decreased across the board in the September Quarter 2012, falling -19% (1 Bedroom Units), -15.5% (2 Bedroom Units), -5.2% (3 Bedroom Units) as compared to the same period in Source: (RTA 2012).
28 P a g e 25 Rents Sunshine Coast Regional Council Area: Unit Rent ($) Sep Qtr 10 Sep Qtr 11 Sep Qtr 12 New Bonds Lodged Rent ($) New Bonds Lodged Rent ($) New Bonds Lodged 1 Bed Bed Bed Table 4 - Source: (RTA 2012) Vacant land Prices Area Median Vacant Land Price 3rd Quarter 2012 Median Price Growth % Q vs. Q Annual Sales Volume Change % Q vs. Q SC REGION $256, SC SOUTH $228, SC CENTRAL $262, SC NORTH $285, Median Vacant Land Prices Q3 Figure 18: SC Region - Vacant Land The third quarter of 2012 median Vacant Land sale prices, aggregated over the three combined Sunshine Coast regions, experienced a price increase from $238,000 in the third Quarter of 2011 to $256,750 in Q3-2012, recording a price rise of $18,750 or 7.3%. During the third Quarter of 2012, 146 sales were recorded, a sharp decrease of -25.3% in sales volume from Q Source: (Rpdata-Rismark 2012)
29 P a g e 26 Industrial Market The Sunshine Coast Industrial Market is one which continues to slow being generally oversupplied. Development activity across the Sunshine Coast is stagnating with many of the smaller developers having withdrawn from the market. The Industrial land market has been hit hard by the Global Financial Crisis as developers retreated and owner occupiers and investors became risk adverse. As a result have seen land values decline in 2009 by up to 20% with similar falls in Land values in Caloundra West and Kunda Park were around the $250/sqm - $350/sqm, whilst Coolum rates varied between $180/sqm - $250/sqm for smaller sites with larger sites (1 ha plus) achieving $100/sqm - $220/sqm. Vacancies for strata units have been high in most areas, leading to a decline in rents. Effective rents have fallen with incentives of typically one to two months on a three year lease commonplace in today s market. Prime strata face rents are around $110/sqm in Warana, while Kunda Park and Caloundra were $110/sqm, Coolum around the $80-$100/sqm and Noosaville around $115-$150. The economic downturn has seen sales activity significantly reduced, which has led to a general yield softening of between 100 and 150 basis points. Having said this, yields have stabilised throughout with prime yields ranging from 8.5%-9.5% and secondary yields at 9.5% and above. Indicative 2012 Industrial Sales Location 1, Noosa 'Home', 8 Selkirk Drive, Noosaville 1, 25 Junction Road, Site Area (m²) Gross Lettable Area (m²) Strata 465 Coolum Beach Strata 365 Sale Date Sale Price (exc gst) 09/12 $1,250,000 06/12 $583,003 $/m² Building Net Face Yield $2, % $1,588 VP 547 Maroochydore Road, Kunda park 6,226 2,214 08/12 $3,750,000 $1, % 2/3 Machinery Avenue, Warana Strata /12 $395,000 $1,674 VP 25 Latcham Drive, Caloundra West 5,022 2,648 11/12 $1,960,000 $ %
30 P a g e 27 Commercial Office Overview The Sunshine Coast has suffered from relatively high vacancy rates throughout the Global Financial Crisis and currently holds second position nationally after the Gold Coast. Having said this the vacancy rate has declined from 14.4% in July 2011 to 13.6% to July 2012 and although this appears to be very high, total available space to let is just under 20,000 sqm, which represents around 18 months supply based on 2012 absorption levels. The commercial office leasing market in 2012 while very competitive has been the strongest since The main reason behind this is new supply additions of A-Grade stock, which include Emporio (Maroochydore), Regatta Lake (Birtinya) and Bryant House extension (Maroochydore). Face rents for A-Grade stock are around $250/sqm - $380/sqm, while secondary stock are around $160/sqm - $280/sqm. While rents have fallen marginally, capital values have had some considerable declines generally across the market. Value rates for A-Grade stock would be around $2,500/sqm - $4,500/sqm, while secondary stock are around $1,000/sqm - $2,500/sqm depending on size. Given the aforementioned marginal reduction in rents coupled with significant reductions in capital values, investment yields have increased since the height of the market in 2006/07. A- Grade stock is achieving around 8%-9%, while secondary stock would generally be above 9%. See summary table below: A-Grade Secondary Net Rental Rates $250-$380/sqm $160-$280/sqm Capital Value Rates $2,500-$4,500/sqm $2,500-$1,000/sqm Gross Yields 8%-9% <9% Our overall outlook for this market sector is somewhat mixed with some positivity in the absorption of existing/new supply additions; however small businesses on the Sunshine Coast are generally still doing it tough. This is having downward pressure on both rents & capital values especially on dated and secondary stock. We would expect to see the vacancy rate continue to fall and the general market to stabilise throughout Retail Overview Retail has been the hardest hit property sector during the recent economic downturn, with major investment activity down by 64% in year from the previous financial year. Expected retail development has decreased dramatically in 2012 with just 2,600 sqm expected to complete. This is opposed to an average for the last five years of a reported 26,700 sqm. Some of the most significant include 27,900 sqm bulky goods centre at Sunshine Cove
31 P a g e 28 anchored by Harvey Norman, while a 20,000 sqm expansion is planned at Kawana Shoppingworld. While there has been very little changed little over the past year, increased levels of incentives have seen effective rents fall by between 5% - 10%. Hastings Street rents were around $2,000/sqm - $3,000/sqm, while Coolum ranged from $800/sqm - $1,500/sqm and Bulcock Street Caloundra were at between $350/sqm - $475/sqm. Sub-regional specialty rents for the same period were ranging from $800/sqm - $1,150/sqm net face, while neighbourhood centres achieved from $500/sqm - $650/sqm and bulky goods centres from $200/sqm $270/sqm. Prime Street locations remain in high demand with minimal vacancy, while secondary locations are less sort after with higher vacancies. Reduced consumer spending coupled with a downturn in tourism have seen some stores close throughout the region. Mooloolaba s vacancy rate was reported at 8% up from 6% the previous year, while Hastings Street, Noosa reported a vacancy rate of 6% up from 3%. Yields have generally stabilised with sub-regional yields for 2012 ranging from 7.5% - 8%, while neighbourhood centre yields were reported between 7.5% - 8.5%. Bulky goods were between 8.25% - 9.5% and the prime retail strips ranged from around 6.5% - 7.5%. See recent sales evidence below: No. Location Site Area (m²) Zoning Net Lettable Area (m²) Sale Date Sale Price $/m² Building Yield Nicklin Way, Currimundi Qld 4551 L12 C District Business Centre 250 $1,270,000 08/06/12 $5,080 9% Comments:- Comprises a semi-modern on-ground multi-tenanted retail/commercial building of 250 sqm situated on a 546 sqm District Business Centre zoned allotment with on-site car parking. At the time of sale the property was fully leased to three tenancies at the reported passing net rental of $114,000 per annum, which indicates a passing yield of 9%. The three tenants are Network Pool & Spa, Eagle Boys Pizza & Currimundi Vet; however further rental information is undisclosed Bulcock Street, Caloundra QLD 4551 L63 RP Caloundra Regional Business Centre 276 $1,150,000 11/01/12 $4, % Comments:- Comprises an attached single level retail/commercial chamber of 276 sqm situated on a 944 sqm Caloundra Regional Business Centre zoned allotment. Further features include off Street car parking for 20 cars, rear laneway access and a 20 metre frontage to Bulcock Street. At the date of sale the property was leased to 3 separate tenants being Ray White commercial (120sqm 3+3 years commencing 1/07/2011), Runway Hair & Beauty (63sqm, 3+3 years commencing 1/10/2011) and Curry Guru (93sqm 3+3 years commencing 16/06/2011). The total gross rental is $78,130 pa and we have estimated outgoings to be $15,000, which equates to a net rental of $63,130 pa First Avenue, Maroochydore Qld 4558 L814 CP M Town Centre Frame 431 $1,512,500 14/05/12 $3,509 9% Comments:- Comprises a semi-modern single level brick commercial building of 431sqm with undercroft car parking for 12 cars. At the time of sale the property was leased to Mission Australia on a new 3 year lease at a gross rental of $144,000 per annum with outgoings reported at $7,000. The net rental of $137,000 indicates a yield of 9%. Sale occurred in a more buoyant market.
32 P a g e 29 Our overall outlook for the retail sector would be another challenging year ahead in As with all commercial property the A-Grade stock in prime locations will always attract the A- Grade tenant or premium sale price; however similar to the office market the secondary retail stock is being hardest hit with some dramatic falls in values and rents recorded. As well as soft market conditions caused by the recent GFC, the traditional retail market is also faced with increased completion from internet sales and a high Australian Dollar. Disclaimer: While every care has been taken in preparing this material, Smith and Geyer Property Valuers accepts no responsibility for decisions or actions taken as a result of any data, information, statement or advice, express or implied, contained in this material.
33 P a g e 30 References: ABS 2012, Regional Population Growth, Australia, , Commonwealth of Australia, < ~Main+Features~Queensland?OpenDocument#PARALINK6>. Morris, B 2012, Midwood Queensland Investment Report. RPData-Rismark 2012a, Auction clearance rates b, Number of homes for sale c, Number of properties advertised for rent d, RP Data-Rismark November Hedonic Daily Home Value Index Result, < s/2012_12_03_rpdata_rismark_homevalueindex.pdf>. Rpdata-Rismark 2012, Suburb Statistics Report, < RTA 2012, 2012 Median rents quarterly data, Residential Tenancies Authority, < UDIA 2012a, Development & Construction Industry Performance Report, Urban Development Institute of Australia, < ort/quarterly%20dec%202012%20final.pdf> b, Development & Construction Industry Performance Report, Urban Development Institute of Australia, < ort/quarterly%20sep% pdf>. Westpac Banking Corporation 2012a, Consumer Sentiment disappoints, Melbourne Institute of Applied Economic and Social Research, 12 December 2012 < e/2012/csi/pressreleasecsi pdf> b, Consumer sentiment up only slightly, Melbourne Institute of Applied Economic and Social Research, 10 October 2012, < 2/CSI/PressReleaseCSI pdf>.

34 P a g e 31
Housing market report
 Capital city market report Prepared August Dr Andrew Wilson, Senior Economist Australian Property Monitors Buyer momentum rises through mid-winter housing markets National overview Buyer and seller momentum
Commercial Research BETWEEN THE LINES. Sunshine Coast Industrial Overview. June 2018
 Commercial Research BETWEEN THE LINES Sunshine Coast Industrial Overview June 2018 The Sunshine Coast has witnessed a strong growth in population over the past ten years, fuelled by the release of land
NAB COMMERCIAL PROPERTY SURVEY Q4 2017
 EMBARGOED UNTIL 11.30 AM WEDNESDAY 21 FEBRUARY 2018 NAB COMMERCIAL PROPERTY SURVEY Q4 2017 Date February 2018 NAB Behavioural & Industry Economics KEY FINDINGS The NAB Commercial Property Index (a measure
Housing market report
 Capital city market report Prepared September Dr Andrew Wilson, Senior Economist Australian Property Monitors No sign of winter pause as housing markets gather strength into spring National overview Buyer
Housing market report
 Australian capital cities and Gold Coast residential property market ruary Prepared by Australian Property Monitors The housing market is up and running in with increased buyer activity and seller confidence.
Brisbane CBD Office Market: the 1990s Vs Now
 September 2013 Brisbane CBD Office Market: the 1990s Vs Now Key Points Figure 1: Brisbane CBD Sub-lease Vacancy % of Total Stock 3.0 2.5 2.0 1.5 1.0 1993 2002 2009 2013 Total market vacancy in Q2/2013
Residential Commentary - Perth Apartment Market
 Residential Commentary - Perth Apartment Market March 2016 Executive Summary The Greater Perth apartment market has attracted considerable interest from local and offshore developers. Projects under construction
Market Commentary Perth CBD Office
 Market Commentary Perth CBD Office November 2016 Executive Summary The vacancy rate at 3Q16 is 24.7%, reflecting a quarterly increase of 0.1 percentage points. Two office projects are under construction
Housing market report
 Capital city market report Prepared February Dr Andrew Wilson, Senior Economist Year off to a flying start as economic outlook improves National overview Australian capital city housing markets are providing
Residential Commentary Sydney Apartment Market
 Residential Commentary Sydney Apartment Market April 2017 Executive Summary Sydney Apartment Market: Key Indicators 14,200 units are currently under construction in Inner Sydney with completion expected
Bankwest Future of Business: Focus on Real Estate
 Bankwest Future of Business: Focus on Real Estate 2018 Contents Key insights Industry overview What s driving industry growth? Spotlight on Australia Spotlight on Western Australia What does the future
RESIDENTIAL RESEARCH A REVIEW OF KEY RESIDENTIAL INDICATORS ACROSS MAJOR AUSTRALIAN CITIES
 RESIDENTIAL RESEARCH A REVIEW OF KEY RESIDENTIAL INDICATORS ACROSS MAJOR AUSTRALIAN CITIES Aug-17 Feb-18 Aug-18 Economic growth was recorded at 3.1 growth in March 2018. Unemployment across Australia was
RESIDENTIAL RESEARCH MARKET ACTIVITY REPORT FOR AUSTRALIAN CAPITAL CITIES & REGIONAL CENTRES
 RESIDENTIAL RESEARCH MARKET ACTIVITY REPORT FOR AUSTRALIAN CAPITAL CITIES & REGIONAL CENTRES Feb-17 May-17 Aug-17 Nov-16 Feb-17 May-17 The official cash rate target remained at 1.5 on 1 August 2017. Domestic
Domain.com.au House Price Report December Quarter 2015
 Domain.com.au House Price Report December Quarter 2015 Dr Andrew Wilson Senior Economist for Domain.com.au Key findings Record drop in Sydney median house prices over the December quarter Melbourne and
Perth CBD Office Market
 SPRING 2016 MARKET TRENDS New supply has moderated. There is no new supply forecast until 2018. Demand weakened in the first half of 2016. Vacancy rates continued to rise in the first half of 2016. Face
BRISBANE HOUSING MARKET STUDY
 BRISBANE HOUSING MARKET 2018 STUDY Executive Summary Brisbane s residential market, especially the detached houses segment has risen steadily over the last year due to the rise in population, falling unemployment
Australia Residential MarketView
 Australia Residential MarketView Q3 2013 NATIONAL HOUSE BUILDING APPROVAL 5.3% (SEPT 13 Y-O-Y) NATIONAL NON HOUSE BUILDING APPROVALS 19.7% (SEPT 13 Y-O-Y) QUARTERLY NATIONAL HOUSE CAPITAL VALUES 0.5% (SEPT
RESIDENTIAL RESEARCH MARKET ACTIVITY REPORT FOR AUSTRALIAN CAPITAL CITIES & REGIONAL CENTRES
 RESIDENTIAL RESEARCH MARKET ACTIVITY REPORT FOR AUSTRALIAN CAPITAL CITIES & REGIONAL CENTRES Sep-16 Mar-17 Mar-17 Jun-17 Sep-16 Mar-17 The official cash rate target remained at 1.5 on 6 June 2017. Domestic
Inner Perth Residential Market Report
 Inner Perth Residential Market Report MARCH QUARTER 2014 Inner Perth Residential Market Market Highlights While Western Australia will experience slowed short term growth as the state transitions from
MARKETING TO INSERT IMAGERY
 MARKETING TO INSERT IMAGERY Brisbane Affordable & Liveable Property Guide 2 nd Half 2018 BRISBANE AFFORDABLE & LIVEABLE PROPERTY GUIDE 2 ND HALF 2018 METHODOLOGY This Brisbane Affordability and Liveability
Domain House Price Report March Quarter 2016
 Domain House Price Report March Quarter 2016 Dr Andrew Wilson Chief Economist for Domain Key findings Sydney median house price drops below $1 million House and unit prices are down in Sydney, Brisbane,
RESIDENTIAL MARKET REPORT SEPTEMBER QUARTER 2016
 RESIDENTIAL MARKET REPORT SEPTEMBER QUARTER 2016 EXECUTIVE SUMMARY RESIDENTIAL MARKET - VICTORIA The established house and vacant land markets have remained buoyant through to the September quarter 2016.
ARLA Members Survey of the Private Rented Sector
 Prepared for The Association of Residential Letting Agents ARLA Members Survey of the Private Rented Sector Second Quarter 2014 Prepared by: O M Carey Jones 5 Henshaw Lane Yeadon Leeds LS19 7RW June, 2014
UDIA WA DEVELOPMENT JUNE 2018
 UDIA WA DEVELOPMENT JUNE 218 UDIA (WA) The UDIA provides market research and in-depth analysis of the urban development industry and property market. To download this report and other UDIA research visit
Domain Rental Report September Quarter 2016
 Domain Rental Report September Quarter 2016 Dr Andrew Wilson Chief Economist for Domain.com.au Key findings House rents in Sydney, Melbourne, Brisbane, Adelaide and Darwin all remain steady Canberra is
Property Report. South Australia
 Property Report South Australia National overview Looking back over 2011 it s clear that the Australian property market was and in early 2012, still is far from homogenous. Cooler market conditions in
3 November rd QUARTER FNB SEGMENT HOUSE PRICE REVIEW. Affordability of housing
 3 November 2011 3 rd QUARTER FNB SEGMENT HOUSE PRICE REVIEW JOHN LOOS: HOUSEHOLD AND PROPERTY SECTOR STRATEGIST 011-6490125 John.loos@fnb.co.za EWALD KELLERMAN: PROPERTY MARKET ANALYST 011-6320021 ekellerman@fnb.co.za
The Profile for Residential Building Approvals by Type and Geography
 The Profile for Residential Building Approvals by Type and Geography Key Points: ABS Building Approvals for Australia peaked back in October 2015. As we have frequently highlighted, approvals have subsequently
UDIA WA PROPERTY MARKET STATISTICS
 UDIA WA PROPERTY MARKET STATISTICS OCTOBER 217 1 IN THIS ISSUE KEY TRENDS INDUSTRY UPDATE 3 4 ECONOMY RESIDENTIAL LAND DEVELOPMENT RESIDENTIAL PROPERTY SETTLEMENTS RESIDENTIAL PROPERTY MARKET RESIDENTIAL
Market Commentary Brisbane CBD Office
 Market Commentary Brisbane CBD Office May 2016 Executive Summary There was a relatively soft start to the year for the CBD office leasing market with net absorption of 2,614 sqm recorded in 1Q16. Just
Economy. Denmark Market Report Q Weak economic growth. Annual real GDP growth
 Denmark Market Report Q 1 Economy Weak economic growth In 13, the economic growth in Denmark ended with a modest growth of. % after a weak fourth quarter with a decrease in the activity. So Denmark is
ECONOMIC CURRENTS. Vol. 4, Issue 3. THE Introduction SOUTH FLORIDA ECONOMIC QUARTERLY
 ECONOMIC CURRENTS THE Introduction SOUTH FLORIDA ECONOMIC QUARTERLY Vol. 4, Issue 3 Economic Currents provides an overview of the South Florida regional economy. The report presents current employment,
RP Data - Nine Rewards Consumer housing market sentiment survey Released: Wednesday 26 February, 2014
 National Media Release RP Data - Nine Rewards Consumer housing market sentiment survey Released: Wednesday 26 February, 2014 Survey reveals - Australian s confident about housing market conditions The
Quarterly Review The Australian Residential Property Market and Economy
 Quarterly Review The Australian Residential Property Released January 2018 Contents Introduction 3 Housing Market 4 Mortgage Lending 11 Housing Supply 17 Demographic Overview 20 Household Finances 22 National
DETACHED MULTI-UNIT APPROVALS
 HIA New Home Sales DETACHED MULTI-UNIT APPROVALS SALES MULTI-UNIT DETACHED A monthly update on the sales of new homes December 217 TAX BURDEN TAKES TOLL ON New Home Sales during 217 Sales still post modest
VIEW FROM PROPERTY EXPERTS VIEW FROM NAB ECONOMICS. NAB Behavioural & Industry Economics NAB RESIDENTIAL PROPERTY INDEX
 NAB RESIDENTIAL PROPERTY SURVEY Q3-218 CURRENT MARKET SENTIMENT AMONG PROPERTY PROFESSIONALS DIPS TO A 7-YEAR LOW AND CONFIDENCE COLLAPSES AS WEAKENING HOUSE PRICES IN NSW & VIC WEIGH HEAVILY ON THE MARKET.
Australian home size hits 22-year low
 Australian home size hits 22-year low CommSec Home Size Trends Report Economics November 16 2018 The average floor size of an Australian home (houses and apartments) has fallen to a 22-year low. Data commissioned
PROJECT ADVICE HORIZONS NORTH
 PROJECT ADVICE HORIZONS NORTH Project overview Matusik Property Insights has been engaged to provide advice on the new land subdivision to be called Horizons North, off Taintons Road, Woombye. Report coverage
PROPERTY. Property Prices Median Sale Price (Log Scale) $450,000
 $450,000") Property Prices Median Sale Price (Log Scale) $450,000 $320,000 $230,000 $165,000 Units Vacant Land Houses Herron Todd White does Property Valuations Herron Todd White Cairns has a wealth of experience
Property Prices Median Sale Price (Log Scale) $450,000 $320,000 $230,000 $165,000 Units Vacant Land Houses Herron Todd White does Property Valuations Herron Todd White Cairns has a wealth of experience
Property Report. Victoria
 Property Report Victoria Upgraders & investors reap rewards Welcome to this edition of the Westpac/ Property Report, a first hand look at how Australia s residential property market is performing on a
UK Office Market Report
 UK Office Market Report Winter 21 211 will remain challenging for some cities, however, the muted development pipeline will help underpin rents. Prime yields have continued to harden, albeit at a slower
Property Report. Queensland
 Property Report National overview Taken as a whole, the Australian property market has cooled over recent months though in a market as diverse as ours, there are pockets of growth even amid quieter conditions.
RP Data - Nine Rewards Consumer housing market sentiment survey Released: Thursday 24 October, 2013
 National Media Release RP Data - Nine Rewards Consumer housing market sentiment survey Released: Thursday 24 October, 2013 Housing market confidence dips in October 1,045 Australian residents respond to
Economic Highlights. Payroll Employment Growth by State 1. Durable Goods 2. The Conference Board Consumer Confidence Index 3
 August 26, 2009 Economic Highlights Southeastern Employment Payroll Employment Growth by State 1 Manufacturing Durable Goods 2 Consumer Spending The Conference Board Consumer Confidence Index 3 Real Estate
Housing Price Forecasts. Illinois and Chicago PMSA, January 2018
 Housing Price Forecasts Illinois and Chicago PMSA, January 2018 Presented To Illinois Realtors From R E A L Regional Economics Applications Laboratory, Institute of Government and Public Affairs University
RENTAL SNAPSHOT. Monthly market report: July Media Release 01 August Rent.com.au monthly market report: July 2018 Page 1
 RENTAL SNAPSHOT Monthly market report: July 2018 Media Release 01 August 2018 For further information, please contact: Rent.com.au p: 1300 736 810 e: agents@rent.com.au Rent.com.au monthly market report:
Hamilton s Housing Market and Economy
 Hamilton s Housing Market and Economy Growth Indicator Report November 2016 hamilton.govt.nz Contents 3. 4. 5. 6. 7. 7. 8. 9. 10. 11. Introduction New Residential Building Consents New Residential Sections
Signs that the housing market may be peaking
 National Media Release: 21 October, 2015 Market movement s data released today show which markets are moving out of peak cycles. Signs suggesting that Australia s housing market may be moving through the
MONTHLY RESEARCH BULLETIN SEPTEMBER 2016
 MONTHLY RESEARCH BULLETIN SEPTEMBER 2016 ABOUT REIV The Real Estate Institute of Victoria has been the peak professional association for the Victorian real estate industry since 1936. Over 2,000 real estate
Update. Property Market. ljhcommercial.com.au Canberra. Canberra Industrial Market - December 2013
 Industrial Market - December 2013 This is a guide to the industrial market conditions in the Australian Capital Territory, including nearby Queanbeyan across the border in New South Wales. With a population
ECONOMIC CURRENTS. Vol. 5 Issue 2 SOUTH FLORIDA ECONOMIC QUARTERLY. Key Findings, 2 nd Quarter, 2015
 ECONOMIC CURRENTS THE Introduction SOUTH FLORIDA ECONOMIC QUARTERLY Economic Currents provides an overview of the South Florida regional economy. The report presents current employment, economic and real
ARLA Members Survey of the Private Rented Sector
 Prepared for The Association of Residential Letting Agents & the ARLA Group of Buy to Let Mortgage Lenders ARLA Members Survey of the Private Rented Sector Fourth Quarter 2010 Prepared by: O M Carey Jones
UDIA WA PROPERTY MARKET STATISTICS
 UDIA WA PROPERTY MARKET STATISTICS APRIL 218 1 IN THIS ISSUE KEY TRENDS INDUSTRY UPDATE ECONOMY RESIDENTIAL LAND DEVELOPMENT RESIDENTIAL PROPERTY SETTLEMENTS RESIDENTIAL PROPERTY MARKET RESIDENTIAL CONSTRUCTION
Bargara Property Factsheet
 Bargara Property Factsheet 1st Half 2018 OVERVIEW Bargara* is located in the Bundaberg Region of south-east Queensland, approximately 384km north of Brisbane s CBD. Over the last 7 years the population
Property Report. Tasmania
 Property Report Tasmania Upgraders & investors reap rewards Welcome to this edition of the Westpac/ Property Report, a first hand look at how Australia s residential property market is performing on a
South Australia Department of Treasury and Finance
 to the South Australia Department of Treasury and Finance on the State Tax Review 13 April 2015 Foreword...3 1. Executive Summary...4 2. Economic and housing backdrop in South Australia...4 3. Taxation
Housing Price Forecasts. Illinois and Chicago PMSA, May 2018
 Housing Price Forecasts Illinois and Chicago PMSA, May 2018 Presented To Illinois Realtors From R E A L Regional Economics Applications Laboratory, Institute of Government and Public Affairs University
CoreLogic RP Data Quarterly Rental Review
 CoreLogic RP Data Quarterly Rental Review December 2014 Released January 2015 Rental market overview Headline results for December 2014 Over the 2014 calendar year, advertised rental rates on a national
Australian office vacancy decreased by 0.5% over the last six months to 9.1%
 Australian Vacancy: 1990-2018 25% 20% 15% 10% 5% 0% Jan-90 Jul-90 Jan-91 Jul-91 Jan-92 Jul-92 Jan-93 Jul-93 Jan-94 Jul-94 Jan-95 Jul-95 Jan-96 Jul-96 Jan-97 Jul-97 Jan-98 Jul-98 Jan-99 Jul-99 Jan-00 Jul-00
CONTENTS. The QBE Australian Housing Outlook
 CONTENTS The QBE Australian Housing 2017 2020 About this report Produced by BIS Oxford Economics for QBE Lenders Mortgage Insurance. This report provides an analysis and forecast of the key drivers influencing
BIS Oxford Economics median house price forecasts
 BIS Oxford Economics median house price forecasts While other economists and forecasters may comment on residential house prices, few make definitive forecasts, particularly beyond the next twelve months.
RP Data chart pack. November 2014
 RP Data chart pack November 2014 Macro housing market indicators 2 Residential real estate underpins Australia's wealth Residential Real Estate $5.6 Trillion Australian Superannuation $1.8 Trillion Australian
REA Group Property Demand Index. Nerida Conisbee REA Group Chief Economist. Introduction NOVEMBER 2016
 REA Group Property Demand Index Nerida Conisbee REA Group Chief Economist NOVEMBER 216 Introduction Perhaps there is a sense of nervousness among Australians following the recent US election, because demand
Property Barometer Q2 2012
 Property Barometer Q2 2012 Measuring the Property Market Analysis by Annette Hughes, DKM Economic Consultants Contents 3 Introduction + Highlights 4 Market analysis 8 County by County Analysis: Market
San Francisco Housing Market Update
 San Francisco Housing Market Update California Economic and Housing Market Outlook The national economy maintained a healthy growth rate in the first quarter of 2005 and appeared to be settling in for
QUARTERLY RENTAL SNAPSHOT
 QUARTERLY RENTAL SNAPSHOT Q2 2018 (Apr-Jun) Media Release 01 July 2018 For further information, or to organise an interview with Rent.com.au CEO Greg Bader, please contact: Daniel Paproth Media & Capital
DETACHED MULTI-UNIT APPROVALS
 HIA New Home Sales DETACHED MULTI-UNIT APPROVALS SALES MULTI-UNIT DETACHED A monthly update on the sales of new homes September 214 MULTI-UNIT SALES REACH New Cyclical Peak The HIA New Home Sales Report
House price report. September quarter Dr Andrew Wilson Senior Economist for the Domain Group
 September quarter 2014 Dr Andrew Wilson Senior Economist for the Domain Group Key findings Most capital city housing markets recorded falls in house prices over the September quarter September quarter
Adelaide house market. Outlook. Adelaide unit market. Outlook. Adelaide: dwelling prices CONTENTS. New dwelling supply
 CONTENTS Adelaide house market Despite the weakness in the economy, there has been modest house price growth in Adelaide over the past four years. Lower interest rates and prices at a relatively low base
Performance of the Private Rental Market in Northern Ireland
 Summary Research Report July - December Performance of the Private Rental Market in Northern Ireland Research Report July - December 1 Northern Ireland Rental Index: Issue No. 8 Disclaimer This report
VIEW FROM NAB ECONOMICS VIEW FROM PROPERTY EXPERTS. NAB Behavioural & Industry Economics NAB HEDONIC HOUSE PRICE FORECASTS (%)*
*") NAB RESIDENTIAL PROPERTY SURVEY Q2-218 CURRENT MARKET SENTIMENT AMONG PROPERTY PROFESSIONALS AT ITS LOWEST LEVEL IN 2 YEARS AS HOUSE PRICES IN NSW & VIC COME UNDER MORE PRESSURE. CONFIDENCE (NEXT 1-2 YEARS)
NAB RESIDENTIAL PROPERTY SURVEY Q2-218 CURRENT MARKET SENTIMENT AMONG PROPERTY PROFESSIONALS AT ITS LOWEST LEVEL IN 2 YEARS AS HOUSE PRICES IN NSW & VIC COME UNDER MORE PRESSURE. CONFIDENCE (NEXT 1-2 YEARS)
Housing Bulletin Monthly Report
 August 21 Housing Bulletin Monthly Report 1 C a n a da s P r e li m i n a ry H o u s i n g S ta r t s s l i p i n J u ly Preliminary Housing St arts in Albert a* and Canada* July 28 to July 21 25, Canada
Autumn Review Dublin Office Market
 Autumn Review 2012 Dublin Office Market . Transaction activity in the Dublin office weakened more than expected in recent months amid persistent uncertainty in the international environment. This tension
Estimating National Levels of Home Improvement and Repair Spending by Rental Property Owners
 Joint Center for Housing Studies Harvard University Estimating National Levels of Home Improvement and Repair Spending by Rental Property Owners Abbe Will October 2010 N10-2 2010 by Abbe Will. All rights
City Futures Research Centre
 Built Environment City Futures Research Centre Estimating need and costs of social and affordable housing delivery Dr Laurence Troy, Dr Ryan van den Nouwelant & Prof Bill Randolph March 2019 Estimating
Snapshot Adelaide Apartment Market
 Snapshot Adelaide Apartment Market December 215 Executive Summary Our View The Adelaide apartment market is undergoing considerable growth, particularly in the CBD where around 4 apartments will complete
Asking Price Index Released 14/03/17 March 2017
 EMBARGOED UNTIL 14/03/17 HOME.CO UK ASKING PRICE INDEX March 2017 Released: 14/03/2017 1 of 6 Asking Price Index Released 14/03/17 March 2017 Demand Heads North as London Slumps Headlines A dose of spring
Australian home size hits 20-year low
 Australian home size hits 20-year low CommSec Home Size Trends Report Economics November 17 2017 The average floor size of an Australian home (houses and apartments) has fallen to a 20-year low. Data commissioned
Residential Commentary Brisbane Apartment Market
 Residential Commentary Brisbane Apartment Market July 2016 Executive Summary Approximately 15,200 apartments are under construction and are expected to complete over 2016-2021 within Inner Brisbane. The
COMMERCIAL PROPERTY PRICES REMAIN IN SLOWDOWN PATTERN AS MARKET REACTS TO INVESTOR PULLBACK
 CCRSI RELEASE MARCH 2016 (With data through February 2016) COMMERCIAL PROPERTY PRICES REMAIN IN SLOWDOWN PATTERN AS MARKET REACTS TO INVESTOR PULLBACK DESPITE DECLINE IN PROPERTY PRICING, LEASING ACTIVITY
RESIDENTIAL MARKET REPORT MARCH QUARTER 2017
 RESIDENTIAL MARKET REPORT MARCH QUARTER 2017 EXECUTIVE SUMMARY RESIDENTIAL LAND MARKET - VICTORIA The established house and vacant land markets across Greater Melbourne continued to remain buoyant in the
INLAND EMPIRE REGIONAL INTELLIGENCE REPORT. School of Business. April 2018
 INLAND EMPIRE REGIONAL INTELLIGENCE REPORT April 2018 Key economic indicators suggest that the Inland Empire s economy will continue to expand throughout the rest of 2018, building upon its recent growth.
MULTIFAMILY 2012 MULTI-FAMILY HAMPTON ROADS MARKET REVIEW. Author. Data Analysis. Financial Support. Disclosure. Charles Dalton.
 HAMPTON ROADS MARKET REVIEW MULTIFAMILY Author Data Analysis Financial Support Disclosure Charles Dalton Real Data The E. V. Williams Center for Real Estate and Economic Development (CREED) functions and
RP Data chart pack. September 2014
 RP Data chart pack September 2014 Macro housing market indicators 2 Residential real estate absolutely underpins Australia s wealth position Residential Real Estate $5.5 Trillion Australian Superannuation
State of the Market Report
 State of the Market Report Dr Andrew Wilson Senior Economist for the Domain Group Sydney About us Domain Group Domain Group, a Fairfax Media real estate business, is a leading supplier of multi-platform
National Overview. Opting for a unit rather than a house is often a more affordable option, and inner-city apartment developments offer a combination
 Queensland Property Report National Overview The lowest home loan interest rates seen in generations, restrictions on investment lending and softer market conditions across some state capitals are creating
INLAND EMPIRE REGIONAL INTELLIGENCE REPORT
 INLAND EMPIRE REGIONAL INTELLIGENCE REPORT June 2016 EMPLOYMENT After a slow start to 2016, the Inland Empire s labor market returned to form, in recent job figures. Seasonally adjusted nonfarm employment
RP Data Housing market update. October 2014
 RP Data Housing market update October 2014 Residential real estate absolutely underpins Australia s wealth position Residential Real Estate $5.6 Trillion Australian Superannuation $1.5 Trillion $1.8 Trillion
Domain House Price Report
 Domain House Price Report June Quarter 2016 Dr Andrew Wilson Chief Economist for Domain Key findings median house price back up over $1 million Median house prices hit new record in Melbourne, and, with
EDITION 1 GEELONG REGIONAL CENTRE REVIEW GEELONG 2017 MARCH
 2017 EDITION 1 GEELONG REGIONAL CENTRE REVIEW 2017 MARCH GEELONG GEELONG AT A GLANCE OVERVIEW MAJOR GOVERNMENT FUNDED PROJECTS National Disability Insurance Agency Headquarters / Department of Human Services
Summary. Houston. Dallas. The Take Away
 Page Summary The Take Away The first quarter of 2017 was marked by continued optimism through multiple Texas metros as job growth remained positive and any negatives associated with declining oil prices
Creswick Property Factsheet
 Creswick Property Factsheet 1st Half 2018 OVERVIEW Creswick, located 129km north west of Melbourne is 430m above sea level. A population of 3,170 was recorded in the 2016 ABS census. The area provides
Smoothed Weighted National Housing Index (base = January 2008)
") HOUSING INDEX February 2013 House Prices Remain Stubbornly High 1 1 1 120 Smoothed Weighted National Housing Index (base = January 8) 178.6 102.2 Value Index Volume Index The FNB House Price Index fell
HOUSING INDEX February 2013 House Prices Remain Stubbornly High 1 1 1 120 Smoothed Weighted National Housing Index (base = January 8) 178.6 102.2 Value Index Volume Index The FNB House Price Index fell
UDIA WA PROPERTY MARKET STATISTICS
 UDIA WA PROPERTY MARKET STATISTICS AUGUST 217 1 What s new in strata? Learn how community title schemes and leasehold strata are changing the strata game. Visit landgate.wa.gov.au/strata-reform Subscribe
2017 Australian Conference of Economists July 2017, Sydney, Australia
 2017 Australian Conference of Economists 19-21 July 2017, Sydney, Australia Land supply and new housing in Western Australia Bankwest Curtin Economics Centre (BCEC Report No 2 April 2014. P100) Conclusion:
Melbourne Industrial Vacancy October 2016
 Kimberley Paterson +61 3 9604 4608 Kimberley.Paterson@au.knightfr ank.com Matt Whitby +61 418 404 854 Matt.Whitby@au.knightfrank.co m Melbourne Industrial Vacancy October 2016 Despite gross take-up being
UDIA WA PROPERTY MARKET STATISTICS
 UDIA WA PROPERTY MARKET STATISTICS JUNE 218 1 IN THIS ISSUE KEY TRENDS INDUSTRY UPDATE ECONOMY RESIDENTIAL LAND DEVELOPMENT RESIDENTIAL PROPERTY SETTLEMENTS RESIDENTIAL PROPERTY MARKET RESIDENTIAL CONSTRUCTION
Western Australia Property Report January 2016
 Western Australia Property Report National Overview As we head into 2016, two key factors are taking some of the heat out of a number of metropolitan property markets. APRA-initiated caps on investment
Rethinking Housing Affordability: Speculative Boom or Structural Burden?
 Rethinking Housing Affordability: Speculative Boom or Structural Burden? Terry Rawnsley Affordable Housing Australasia Melbourne 14 th 16 th November 2016 Overview Housing is a multidimensional topic (social,
RESIDENTIAL RESEARCH A REVIEW OF KEY DEVELOPMENT DRIVERS, RESIDENTIAL MARKET TRENDS & OUTLOOK
 RESIDENTIAL RESEARCH A REVIEW OF KEY DEVELOPMENT DRIVERS, RESIDENTIAL MARKET TRENDS & OUTLOOK Dec-15 Dec-16 Dec-17 Dec-15 Dec-16 Dec-17 Dec-15 Dec-16 Dec-17 Dec-15 Dec-16 Dec-17 Residential development