PROPERTY ASSESSMENT AND RE USE PLANNING PROJECT
|
|
|
- Leo Harrison
- 5 years ago
- Views:
Transcription


1 PROPERTY ASSESSMENT AND RE USE PLANNING PROJECT Town of Ware, Massachusetts Prepared For: Ware Board of Selectmen and Community Development Authority Pioneer Valley Planning Commission Prepared By: Community Opportunities Group, Inc. Boston, Massachusetts Jeffrey Donohoe Associates, LLC Hopkinton, New Hampshire Property Assessment and Re use Planning Project August, 2014
2
3 Acknowledgements Community Opportunities Group, Inc., wishes to acknowledge the following individuals for their assistance in developing the Town of Ware Property Assessment and Re Use Plan: Board of Selectmen: Greg Harder, Chairman John E. Carroll, Vice Chairman John A. Desmond, Recording Clerk Richard A. Norton, Sr. Nancy J. Talbot Town Manager: Stuart B. Beckley Community Development Authority: Karen M. Cullen, AICP, Director of Planning & Community Development, Ex Officio (until July 1, 2014) Mary Harder Dave Gravel Tracy Opalinski (term began July 1, 2014) Paul Opalinski (term began July 1, 2014) Bill Cooper (term began July 1, 2014) Ware Town Departments: Assessors Building Department Health Department PARP Committee Members: Maureen Berkley Sheila Cuddy Joel Harder Steve Lowell Michelle McGuigian George Staiti Regional Participants: Christopher Dunphy, Pioneer Valley Planning Commission
4
5 Table of Contents 1. INTRODUCTION Background Goals of this Plan 2 2. WARE REGIONAL HOUSING MARKET ANALYSIS 5 3. RECOMMENDATIONS Property Owners Town of Ware 41 APPENDICES 45 List of Potential Sites for Demolition List of Potential Candidates for CDBG funded Housing Rehabilitation List of Sites Identified for Public Private Partnership PARP Properties and Assessors Cards Resources Available for Housing Rehabilitation Assistance All photography by Community Opportunities Group, Inc.
6
 from the Massachusetts Department of Housing and Community Development to undertake a comprehensive property")
7 Property Assessment and Re-Use Planning Project 1 1. Introduction 1.1 Background The Town of Ware received an FY 2012 Community Development Block Grant (CDBG) from the Massachusetts Department of Housing and Community Development to undertake a comprehensive property assessment and re use planning (PARP) project within the town s CDBG Target Area. Ware s Census Designated Place (CDP) serves as the community s CDBG Target Area. The Town s FY 2012 CDBG application defines the CDP as a four square mile area encompassing the Town s core residential and commercial areas. Over $30 million in state and federal funds has been invested in this area to aid redevelopment. Map 1.1. Ware CDBG Target Area (Ware CDP)

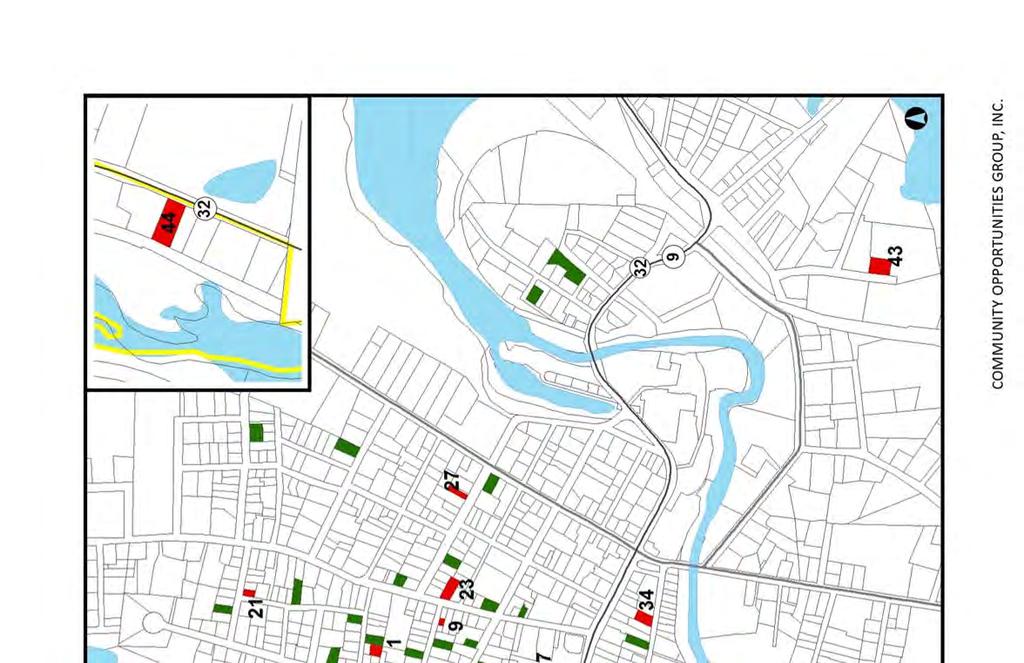
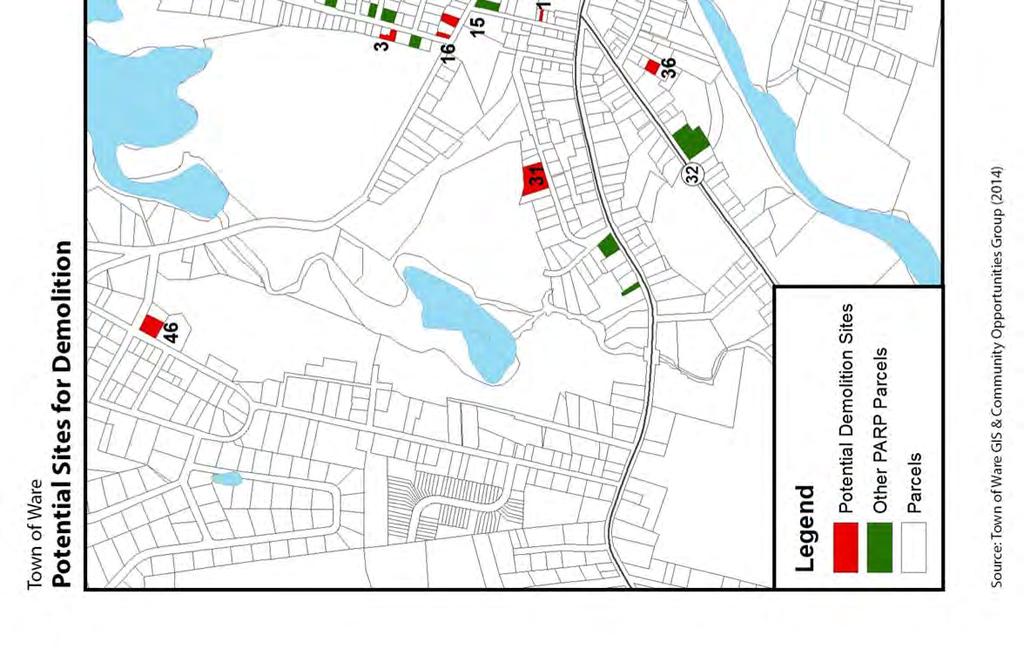
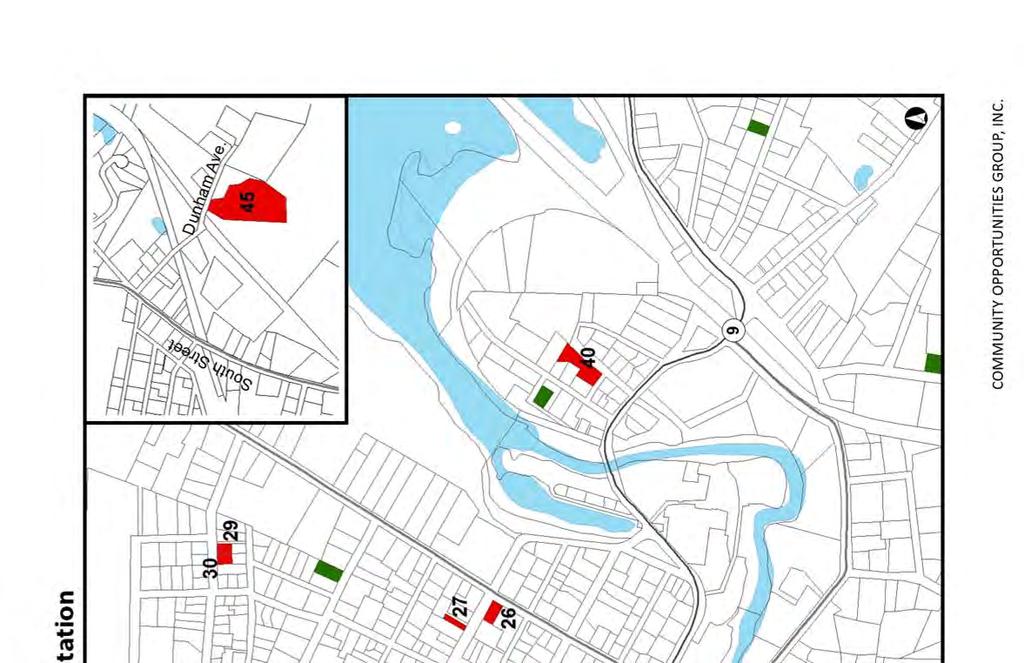
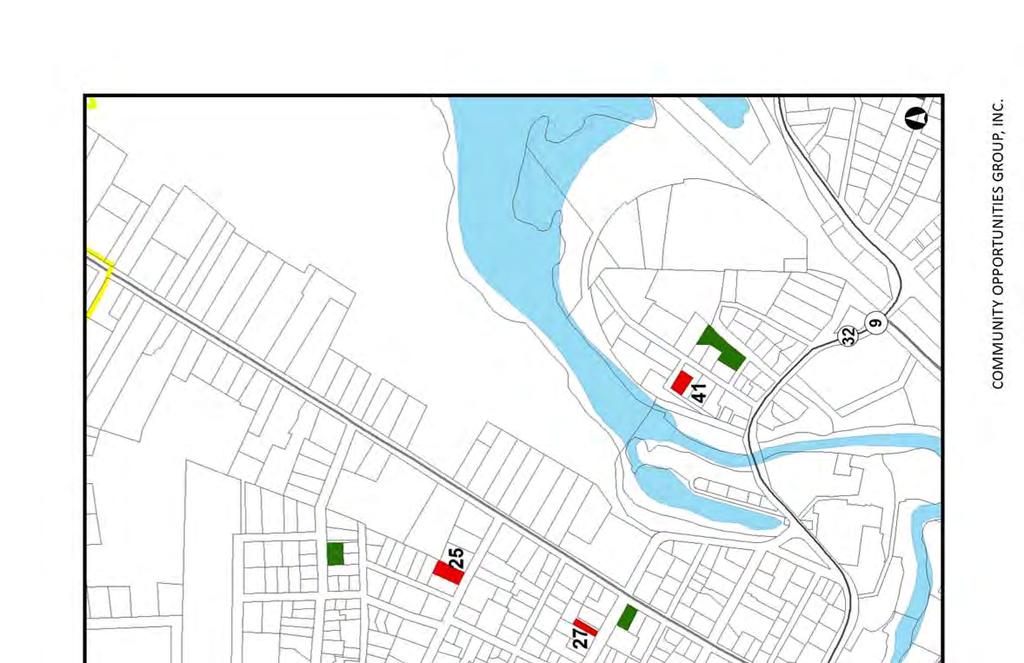
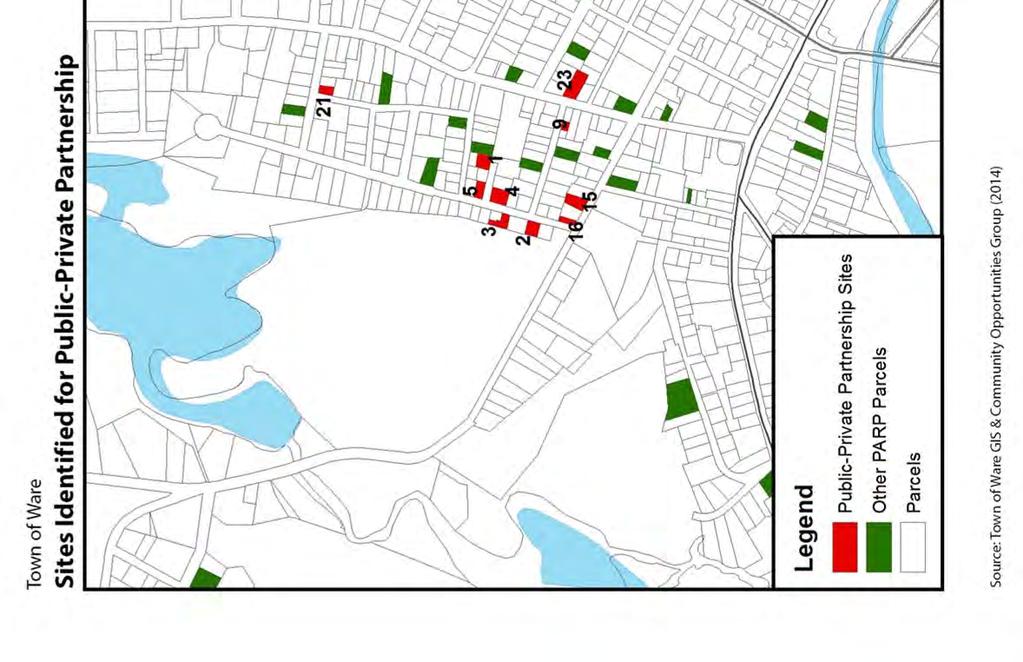
8 2 Property Assessment and Re-Use Planning Project The PARP project originated through the Ware Community Development Authority s (CDA) frustration at the continuing problems in certain neighborhoods, particularly within the downtown core, including blighted conditions of private property, chronic vacancy or abandonment. Based on programs observed in other communities, the CDA wanted to go back into these neighborhoods to identify constructive ways to get these distressed properties out of their current condition whether by demolition necessitated by years of neglect or by rehabilitation. 1.2 Goals of this plan The Town identified forty seven distressed properties through the PARP project, notably those which were abandoned, vacant, blighted, and/or foreclosed. After determining site restrictions/limitations, building condition and restoration/rehabilitation cost, re use recommendations would be developed for each site. An ad hoc advisory committee consisting of key partners in the community would assist in the identification of financing strategies and programs for redevelopment. Upon completion of the plan and this final report, the town can move towards formal implementation of the agreed upon recommendations. Map 1.2. Ware CDBG Target Area Windshield Survey Results


9 Map 1.3. Properties Considered for PARP Property Assessment and Re-Use Planning Project 3


10 4 Property Assessment and Re-Use Planning Project Map 1.4. Final PARP Properties
11 Property Assessment and Re-Use Planning Project 5 2. Ware Regional Housing Market Analysis Introduction and Overview Housing market indicators play a vital role in determining the best reuse scenario for distressed properties. To determine local market conditions and Ware s position in the region, an analysis was completed. This analysis examined the housing market in Ware and six additional surrounding or nearby communities: Belchertown, Hardwick, North Brookfield, Palmer, Warren and West Brookfield. The purpose of this analysis is to understand current housing market activity levels in Ware and the surrounding communities, in terms of sales prices for single family homes and condominiums, transaction volume, new construction activity, apartment supply and apartment pricing. This analysis presents summary information for each of the seven communities, providing consistent evaluation of key factors for each community, as well as a summarized evaluation for the region as a whole. Factors evaluated include: Median Single Family Home Price; Median Condominium Price; Transaction Volume; Building Permit Activity; Apartment Unit Supply; Apartment Pricing; and Vacancy Information. Methodology In order to understand the communities, site visits to each of the seven communities were conducted to see typical housing products, meet with local municipal officials, interview local real estate professionals, and to understand transportation in the region, which affects the marketability of housing products. Additional research of housing types and market factors using public and private data sources was conducted, including the U.S. Decennial Census, Nielsen (a leading demographic service), the National Association of Realtors, the Warren Group (a commercial research service that summarizes real estate sales activity), Ware River News, and online sources such as Realtor.com and Craigslist.org. Town Summaries The sections below provide information on housing market indicators for the Town of Ware and the six adjacent communities. Data is presented individually for each community, with a summary of the seven town region at the end of the report.
12 6 Property Assessment and Re-Use Planning Project WARE Ware had a total population of 9,872 at the time of the 2010 Census. More recent population estimates from Nielsen indicate a 2013 population of 9,754, indicating a loss of population of just over 1% in three years. The Town has an estimated median age of 41.5 years, and an estimated 4,085 households, according to Nielsen. The average household size was estimated to be The Town had an estimated 4,552 housing units in 2013, with owner occupied units accounting for just over two thirds of the 4,085 occupied housing units in the community. The median value of owner occupied housing units was estimated to be $195,187 in Median household income was estimated to be $50,086 in 2013, while the average household income was estimated to be $62,060. Median Single Family Home Price Pricing for single family homes in Ware has been affected by the housing crash in 2007/2008, in addition to being affected by the prior housing recession between 1996 and According to the Warren Group, the median single family home price in Ware was $160,000 in This represents a decline of 20% in the median since the peak in 2006, and is approximately equal to the median in The median single family home price in the community has been relatively stable since 2008, as shown in the graph below.
13 Property Assessment and Re-Use Planning Project 7 Median Condominium Price The Town of Ware has a very limited supply of condominiums. As such, there is insufficient data to evaluate a trend in the median condominium price. According to the Warren Group, there have been only fifteen condominium sales in the town since 2004, an average of less than two sales per year. This is consistent with data from Nielsen, which indicates that the town had only 127 single family attached housing units in Transaction Volume The number of sales in Ware peaked in 2003, when there were 115 total sales in the Town. During that year, all of the sales were single family homes there were no condominium sales. In fact, there have only been fifteen condominium sales in Ware since 2004, an average of 1.5 sales per year. The number of single family home sales exceeded 100 transactions only four times in the past twenty years, including 2001 through 2003 and in Since 2008, the number of transactions has ranged from a low of 51 (2011) to a high of 81 (2009 and 2012), with the average number of sales being 71 over that period. Building Permit Activity According to the U.S. Census, the Town of Ware has not had any new multi family projects permitted since 2003, when 80 units were permitted. In contrast, the town has seen a significant number of new single family homes permitted since From 2003 through 2007, the Census indicates that 166 single family homes were permitted in
14 8 Property Assessment and Re-Use Planning Project Ware. In contrast, building activity slowed significantly beginning in Between 2008 and 2012, only 48 new single family homes were permitted in Ware, an average of less than ten units per year. This represents a significant decline from the 2003 through 2007 time period, when an average of 33 new single family homes were permitted annually. Only four total new homes were permitted in Ware between 2011 and Apartment Unit Supply Ware has several apartment complexes which account for a significant portion of the available rental unit inventory in the community. As part of this analysis, larger complexes (generally 20 units and larger) were visited. Key complexes which were visited include Colonial Village, Brookside Manor, Home Crest Apartments, Hillside Village and Highland Village. These complexes account for more than 250 total rental units in Ware. According to the 2010 Census, there were 1,532 rental housing units in Ware. These units included 1,365 renter occupied units and 167 units available for rent. More recent housing unit data from Nielsen indicates that there are 1,595 housing units which are not classified as either single family attached or single family detached homes. The vast majority of these units (more than 1,100) are in buildings which have four or fewer units in a structure. Apartment Pricing Discussions with property managers at larger apartment complexes indicate rents in the range of $575 to $725 for one bedroom units; $675 to $875 for two bedroom units; and $700 to $1,000 for three bedroom units. In general, these rental rates require tenants to pay for their own heat and electricity. In addition to speaking with property managers, a sampling of available rental units posted on CraigsList.org was also reviewed. More than a dozen available one, two and three bedroom units were reviewed. In most cases, these units were located in older two, three or four unit buildings, with limited amenities. In general, pricing for these units was consistent with pricing at the larger complexes. However, the units in older buildings tended to have more square footage than their modern counterparts. Vacancy Information The 2010 U.S. Census estimated the vacancy rate for rental units in Ware to be 10.9% for all rental units. However, it is important to recognize that although there are 1,595 housing units which are not classified as either single family attached or single family detached homes, and 1,355 renter occupied housing units, there are not necessarily 240 vacant apartments in Ware. The 2010 Census indicated that 167 of the town s 470 vacant housing units were available for rent. Other vacant units included seasonal use properties, properties available for sale and sold or rented but not occupied.
15 Property Assessment and Re-Use Planning Project 9 In discussions with property managers for larger rental properties, vacancy was noted to be very low. Overall, the property managers indicated approximately ten vacant units out of an inventory of more than 250 units, indicating a vacancy rate of less than 4%. Some managers did report an increase in delinquency, with some tenants being habitually late with rent payments. Overall, it is estimated that the vacancy rate in Ware is just below 10%.
16 10 Property Assessment and Re-Use Planning Project BELCHERTOWN The Town of Belchertown had a total population of 14,649 at the time of the 2010 Census. More recent population estimates from Nielsen indicate a 2013 population of just 14,652, essentially unchanged over the three year period. The Town has an estimated median age of 41.4 years, and an estimated 5,575 households, according to Nielsen. The average household size was estimated to be The Town had an estimated 5,817 housing units in 2013, with owner occupied units accounting for just over 82% of the 5,575 occupied housing units in the community. The median value of owner occupied housing units was estimated to be $250,700 in Median household income was estimated to be $74,614 in 2013, while the average household income was estimated to be $84,936. The Belchertown median household income is almost 50% higher than the Ware median, while the average household income is 37% higher than the Ware average. Median Single Family Home Price Although pricing for single family homes in Belchertown was affected by the housing crash in 2007/2008, Belchertown s impacts actually began to be evident as early as 2005, when the median price for a single family home peaked at $272,000. Between 2005 and 2011, the trend in the median price in Belchertown continued downward. In 2011, the median price was $237,400, 12.7% less than the 2005 median. The median single family home price in the community has seen slight increases since 2010, as shown in the graph below.
17 Property Assessment and Re-Use Planning Project 11 Median Condominium Price Belchertown has a more active condominium market than Ware and the surrounding communities. Nevertheless, sales volumes average fewer than 15 transactions per year. According to the Warren Group, Belchertown s median condominium sale price skyrocketed from less than $60,000 in 2001 to almost $214,000 in Since that time, the condominium market has performed somewhat erratically, with the median price reaching a low of less than $180,000 in 2012, but bouncing back to almost $209,000 in Transaction Volume While Belchertown has a more active condominium market than Ware, sales of condominiums represent less than 7.5% of transactions. The number of condominium sales peaked in 2005, when 21 transactions were recorded. Between 2009 and 2013, the average number of condominium sales was 14 annually. The number of single family home sales peaked at 227 in Over the period from 2000 through 2007, Belchertown averaged 184 single family home sales annually. Since 2008, the number of transactions has ranged from a low of 111 (2011) to a high of 140 (2012), with the average number of sales being 127 over that period. This represents a decline of more than 30% in annual transactions in Belchertown.
18 12 Property Assessment and Re-Use Planning Project Building Permit Activity According to the U.S. Census, the Town of Belchertown has not had any new multifamily projects permitted since 2003, when eight duplexes were permitted. The town has seen a significant number of new single family homes permitted since From 2003 through 2007, the Census indicates that 441 single family homes were permitted in Belchertown, an average of 88 units annually over the period. In contrast, building activity slowed significantly beginning in Between 2008 and 2012, only 103 new single family homes were permitted in Belchertown an average of just over twenty units per year. In terms of average annual building permits, the recent average of just over twenty new units per year represents a 75% decrease over the annual average of 88 units during the 2003 through 2007 time period. Apartment Unit Supply Belchertown has a limited supply of apartment units located in larger complexes. According the 2010 U.S. Census, Belchertown has 1,043 rental units. Larger complexes are estimated to account for less than 20% of total units, with the majority of units in structures with 5 to 19 units. Housing unit data from Nielsen indicates that there are 1,114 housing units which are not classified as either single family attached or single family detached homes. Almost half of these units (more than 500) are in buildings which have 5 to 19 units per structure.
19 Property Assessment and Re-Use Planning Project 13 Apartment Pricing Discussions with property managers at larger apartment complexes indicate rents in the range of $575 to $675 for one bedroom units; and $800 to $950 for two bedroom units. In general, these rental rates require tenants to pay for their own heat and electricity. In addition to speaking with property managers, a sampling of available rental units posted on CraigsList.org was also reviewed. More than a forty available one, two and three bedroom units were reviewed. In addition, several studio apartments and four bedroom units were also available. Because the Belchertown apartment market is heavily influenced by its proximity to colleges (UMass, Amherst College, Hampshire College), pricing for some units is extremely high as compared to pricing at traditional apartment complexes. For example, several one bedroom units were listed for as much as $1,100 per month, and some two bedroom units were listed as high as $1,400 per month. Vacancy Information The 2010 U.S. Census estimated the vacancy rate for rental units in Belchertown to be less than 5% for all rental units. The 2010 Census indicated that 48 of the town s 244 vacant housing units were available for rent. Other vacant units included seasonal use properties, properties available for sale and sold or rented but not occupied. Discussions with property managers for larger rental properties indicated that vacancy was very low. Overall, it is estimated that the vacancy rate in Belchertown is below 5%.
20 14 Property Assessment and Re-Use Planning Project HARDWICK Hardwick had a total population of 2,990 at the time of the 2010 Census. More recent population estimates from Nielsen indicate a 2013 population of just 3,074, an estimated gain of 84 residents, or 2.8%, in three years. The Town has an estimated median age of 39.2 years, and an estimated 1,124 households, according to Nielsen. The average household size was estimated to be The Town had an estimated 1,248 housing units in 2013, with owner occupied units accounting for almost 70% of the 1,124 occupied housing units in the community. The median value of owner occupied housing units was estimated to be $234,200 in Median household income was estimated to be $63,788 in 2013, while the average household income was estimated to be $86,200. The Hardwick median household income was almost 40% higher than the Ware median, while the average household income is more than 25% higher than the Ware average. Median Single Family Home Price Hardwick s median price for single family homes experienced a generally upward trend from 1998 through 2007, increasing from less than $90,000 to almost $290,000, an increase of more than 225% over the period. However, beginning in 2008, the Town s median single family home price experienced a steep decline, falling to $157,500 by 2010, a decline of more than 45%. Since that time, the median price has experienced both increases and decreases, as shown in the graphic below. The median saw some recovery by 2013, when it had increase to $195,000, an increase of 30% from the 2012 median of just $150,000. These swings in the median price are due in part to the reduced number of transactions in the community over the past several years.
21 Property Assessment and Re-Use Planning Project 15 Median Condominium Price Hardwick s has a very limited condominium market, with only one year (2007) generating sufficient sales activity to calculate a median price ($98,700). Since 2007, there have been only three condominium sales reported. Transaction Volume In the Town of Hardwick, sales of singles family homes account for the vast majority of transactions. Since 1994, condominiums have represented just 9 of the 397 transactions reported for the community. Hardwick s single family home sales peaked at 31 transactions in Over the period from 2000 through 2006, Hardwick averaged 24 single family home sales annually. Since 2007, the number of transactions has averaged 15 transactions per year. This represents a decline of more than 37% in annual transactions in Hardwick. Building Permit Activity According to the U.S. Census, the Town of Hardwick did not develop any multi family housing units in the analysis period of 2003 through The town has seen a limited number of single family homes permitted in the recent past. According to the U.S. Census, only five units were permitted between 2008 and 2012, or just one unit per year on average. However, prior to that time, the Hardwick market saw a higher level of permit activity for new single family homes. From 2003 through 2007,
22 16 Property Assessment and Re-Use Planning Project the Census indicates that 41 single family homes were permitted in Hardwick, an average of 8 units annually over the period. In terms of average annual building permits, the recent average of just a single unit annually represents an 87% decrease over the annual average of 8 units during the 2003 through 2008 time period. Apartment Unit Supply According to the Hardwick Assessor, the town has no large apartment complexes. The town s rental inventory is dominated by older buildings which have been subdivided into multi unit apartments. Although a specific number could not be provided, the Census does offer some insight into the number of rental units in Hardwick. According the 2010 U.S. Census, Hardwick had 336 renter occupied households and 29 units available for rent, indicating a total supply of 365 units. These estimates are similar to Nielsen s 2013 estimates for Hardwick. Apartment Pricing Due to the limited number of apartments in Hardwick, limited information was available on pricing. No major property managers were identified, and there were only two units identified as being available for rent. Pricing was quoted in the $600 to $800 range for both one and two bedroom units. A more detailed evaluation of the Hardwick apartment market was beyond the scope of this assignment. Vacancy Information The 2010 U.S. Census estimated the vacancy rate for rental units in Hardwick to be less than 8% for all rental units. The 2010 Census indicated that 29 of the town s 124 vacant housing units were available for rent. Other vacant units included seasonal use properties, properties available for sale and sold or rented but not occupied. Given the lack of available data for the community, it is considered prudent to rely upon the estimated 8% vacancy rate from the 2010 Census.
23 Property Assessment and Re-Use Planning Project 17 NORTH BROOKFIELD The Town of North Brookfield had a total population of 4,680 at the time of the 2010 Census. More recent population estimates from Nielsen indicate a 2013 population of just 4,675, essentially unchanged over the three year period. The Town has an estimated median age of 41.8 years, and an estimated 1,866 households, according to Nielsen. The average household size was estimated to be The Town had an estimated 2,062 housing units in 2013, with owner occupied units accounting for almost 74% of the 1,866 occupied housing units in the community. The median value of owner occupied housing units was estimated to be $200,000 in Median household income was estimated to be $59,302 in 2013, while the average household income was estimated to be $75,161. The median household income in North Brookfield is more than 20% higher than the Ware median, while the average household income is 18% higher than the Ware average. Median Single Family Home Price Although pricing for single family homes in North Brookfield was affected by the housing crash in 2007/2008, North Brookfield s impacts actually began to be evident as early as 2004, when the median price for a single family home peaked at $227,450. Between 2005 and 2007, the trend in the median price in North Brookfield experienced a slight downward trend. As the financial crisis became more serious in 2008 and beyond, the town s median price fell more significantly. By 2012, the median price was $120,000, more than 47% below the 2004 median. The median single family home price rebounded to $168,000 in 2013, an increase of 40% over the prior year, as shown in the graph below.
24 18 Property Assessment and Re-Use Planning Project Median Condominium Price In North Brookfield, condominium sales account for just over 7% of all transactions. Since the calculation of a median price require at least three transactions, it is not possible to calculate a median condominium price for many years, given low transaction volumes in North Brookfield. According to the Warren Group, North Brookfield s median condominium sale price increased between 1998 and 2005 from $72,450 to $165,000, an increase of 127%. In 2013, the median was reported to be $115,000, though this was based on only three transactions. Transaction Volume As discussed above, the Town of North Brookfield has a limited number of condominium transactions annually. Over the past twenty years, only 63 transactions have been reported, or an average of just over three transactions per year. The number of condominium sales peaked in 2004, when 8 transactions were recorded. Since 2007, the town has averaged just two transactions annually. The number of single family home sales peaked at 61 in Over the period from 1997 through 2006, North Brookfield averaged 48 single family home sales annually. Since 2007, the number of transactions has ranged from a low of 28 (2007) to a high of 50 (2009), with the average number of sales being 39 over that period. This represents a decline of just over 18% in annual transactions in North Brookfield.
25 Property Assessment and Re-Use Planning Project 19 Building Permit Activity According to the U.S. Census, the Town of North Brookfield has not had any new multifamily projects permitted between 2003 and Although the town saw a significant number of new homes permitted between 2003 and 2007, the Census indicates that no new homes have been permitted in North Brookfield since From 2003 through 2007, the Census indicates that 95 single family homes were permitted in North Brookfield, an average of 19 units annually over the period. However, the Census indicates that no new single family homes have been permitted since that time. Apartment Unit Supply According to the Town of North Brookfield, the town has no large apartment complexes. The town s rental inventory is dominated by older buildings which have been subdivided into multi unit apartments. Although specific number could not be provided, the Census does offer some insight into the number of rental units in North Brookfield. According the 2010 U.S. Census, North Brookfield had 491 renter occupied households and 45 units available for rent, indicating a total supply of 536 units. These estimates are consistent with the more recent data acquired from Nielsen. Apartment Pricing Due to the limited number of apartments in North Brookfield, limited information was available on pricing. No major property managers were identified, and no units were identified as being available for rent. A more detailed evaluation of the North Brookfield apartment market was beyond the scope of this assignment.
26 20 Property Assessment and Re-Use Planning Project Vacancy Information The 2010 U.S. Census estimated the vacancy rate for rental units in North Brookfield to be 8.3% for all rental units. The 2010 Census indicated that 45 of the town s 196 vacant housing units were available for rent. Other vacant units included seasonal use properties, properties available for sale and sold or rented but not occupied. Given the lack of available data for the community, it is considered prudent to rely upon the estimated 8.3% vacancy rate from the 2010 Census.
27 Property Assessment and Re-Use Planning Project 21 PALMER Palmer had a total population of 12,140 at the time of the 2010 Census. More recent population estimates from Nielsen indicate a 2013 population of just 12,060, an estimated loss of 80 residents in three years. The Town has an estimated median age of 41.3 years, and an estimated 5,089 households, according to Nielsen. The average household size was estimated to be The Town had an estimated 5,524 housing units in 2013, with owner occupied units accounting for just over 67% of the 5,089 occupied housing units in the community. The median value of owner occupied housing units was estimated to be $204,200 in Median household income was estimated to be $52,307 in 2013, while the average household income was estimated to be $66,011. The Palmer median household income was slightly higher than the Ware median, while the average household income is approximately 6% higher than the Ware average. Median Single Family Home Price Palmer s median price for single family homes rose steadily from 1997 through 2006, increasing from $99,900 to $198,300. However, beginning in 2006, the Town s median single family home price declined steadily, to $152,000 by 2011, a decline of more than 23%. The median saw some recovery by 2013, when it had increase to $169,300, an increase of more than 11% from the 2011 low point. The median single family home price in the community is shown in the graph below.
28 22 Property Assessment and Re-Use Planning Project Median Condominium Price Palmer s condominium market is more active than the Ware condominium market. The local market averages just over 18 transactions per year. According to the Warren Group, Palmer s median condominium sale price increased from less than $40,000 in 1999 to $136,000 in 2004, an increase of 240%. Between 2004 and 2006, the Palmer condominium market was generally stable, with the median price remaining relatively flat. Since that time, the condominium market has performed very erratically, with the median price reaching a low of less than $56,000 in 2012, but more than doubling to more than $120,000 in This erratic performance is attributable, in part, to reduced transaction volumes. Transaction Volume In the Town of Palmer, sales of condominiums represent one in six sales, or 17% of all transactions. The number of condominium sales peaked in 2005, when 43 transactions were recorded. An average of 32 condominium sales occurred annually between 2003 and Between 2008 and 2013, the average number of condominium sales was 11 annually. This represents a decrease in the number of transactions or more than 60%. Palmer s single family home sales peaked at 132 transactions in Over the period from 2000 through 2007, Palmer averaged 121 single family home sales annually. Since 2008, the number of transactions has generally been in the range of 80 to 90 per year, with an average of 85 transactions per year. This represents a decline of almost 30% in annual transactions in Palmer.

29 Property Assessment and Re-Use Planning Project 23 Building Permit Activity According to the U.S. Census, the Town of Palmer has developed 12 units of multifamily housing since 2009, in addition to developing 22 units in No multi family units were permitted between 2003 and The town has seen a limited number of single family homes permitted in the recent past. According to the U.S. Census, only 25 units were permitted between 2008 and However, prior to that time, there were a significant number of single family homes permitted in Palmer. From 2003 through 2007, the Census indicates that 179 single family homes were permitted in Palmer, an average of 36 units annually over the period. In contrast, building activity slowed significantly beginning in In terms of average annual building permits, the recent average of five units annually represents an 86% decrease over the annual average of 36 units during the 2003 through 2008 time period. Apartment Unit Supply Palmer has almost 300 apartment units located in larger complexes. According the 2010 U.S. Census, Palmer had 1,816 rental units at that time. Larger complexes are estimated to account for less than 20% of total units. Housing unit data from Nielsen indicates that there are only 1,565 housing units which are not classified as either single family attached or single family detached homes, while there are 1,668 renter occupied housing units. This indicates that a number of single
30 24 Property Assessment and Re-Use Planning Project family homes are renter occupied, particularly in light of the fact that approximately 150 vacant housing units are being marketed as rentals. Apartment Pricing Discussions with property managers at larger apartment complexes indicate rents in the range of $550 to $650 for one bedroom units; and $750 to $900 for two bedroom units. There are a limited number of three bedroom units in the $950 to $1,050 range. In general, these rental rates require tenants to pay for their own heat and electricity. A sampling of available rental units in Palmer posted on CraigsList.org was also reviewed. More than thirty available one, two and three bedroom units were reviewed. In addition, several studio apartments were also available. Pricing for units available on CraigsList was consistent with pricing for units in the sampling of larger complexes, though the units listed on Craigslist had a broader range of square footage. Vacancy Information The 2010 U.S. Census estimated the vacancy rate for rental units in Palmer to be approximately 8.2% for all rental units. The 2010 Census indicated that 149 of the town s 435 vacant housing units were available for rent. Other vacant units included seasonal use properties, properties available for sale and sold or rented but not occupied. Discussions with property managers for larger rental properties indicated that vacancy was virtually non existent. While the vacancy rate is estimated to be approximately 8% at the present time, some property managers complained that many tenants are either behind on their rent or slow in paying each month.
31 Property Assessment and Re-Use Planning Project 25 WARREN The Town of Warren had a total population of 5,135 at the time of the 2010 Census. More recent population estimates from Nielsen indicate a 2013 population of just 5,193, an increase of just over 1% between 2010 and The Town has an estimated median age of 40.1 years, and an estimated 2,046 households, according to Nielsen. The average household size was estimated to be The Town had an estimated 2,238 housing units in 2013, with owner occupied units accounting for almost 73% of the 2,046 occupied housing units in the community. The median value of owner occupied housing units was estimated to be $187,800 in Median household income was estimated to be $56,818 in 2013, while the average household income was estimated to be $72,710. The median household income in Warren is more than 13% higher than the Ware median, while the average household income is 13% higher than the Ware average. Median Single Family Home Price Although pricing for single family homes in Warren was affected by the housing crash in 2007/2008, Warren s median single family home price peaked in 2005 at $215,000. Between 2005 and 2007, the trend in the median price in Warren experienced a slight downward trend, declining by approximately 7%. As the financial crisis worsened, the town s median single family home price fell more significantly. By 2011, the median price was $105,500, less than half of what it had been when it peaked in The median single family home price increased by more than 45% between 2011 and 2013, but it is still below the 2003 median, as shown in the graph below.
32 26 Property Assessment and Re-Use Planning Project Median Condominium Price In Warren, condominium sales account for just over 5% of all transactions. However, over the past twenty years, there have been a total of just 46 transactions, or an average of slightly more than two transactions annually. Since the calculation of a median price requires at least three transactions, it is not possible to calculate a median condominium price for many years. According to the Warren Group, Warren s median condominium sale price actually increased from $52,500 in 2002 to $135,000 in However, only six transactions occurred between 2010 and 2013, and calculation of a median in any of these years was not possible due to low transaction volume. Transaction Volume As discussed above, the Town of Warren has a limited number of condominium transactions annually. Over the past twenty years, only 46 transactions have been reported, or an average of just over two transactions per year. The number of condominium sales peaked at 7 transactions, which occurred in 1995, 2001 and Since 2005, the town has averaged just two transactions annually. The number of single family home sales peaked at 71 in Over the period from 1999 through 2008, Warren averaged 54 single family home sales annually. Since 2009, the number of transactions has ranged from a low of 23 (2013) to a high of 49 (2012), with the average number of sales being 36 over that period. This represents a decline of almost one third in annual transactions in Warren.
33 Property Assessment and Re-Use Planning Project 27 Building Permit Activity According to the U.S. Census, the Town of Warren had only one year in which new multi family projects were permitted between 2003 and In 2008, five new multifamily units were permitted, including a duplex and a tri plex. The town has seen a limited number of single family homes permitted in the recent past. According to the U.S. Census, only 23 units were permitted between 2008 and However, prior to that time, there were a significant number of single family homes permitted in Warren. From 2003 through 2007, the Census indicates that 163 single family homes were permitted in Warren, an average of 33 units annually over the period. Building activity slowed significantly beginning in In terms of average annual building permits, the recent average of less than five units annually represents a decrease of 85% over the annual average of 33 units during the 2003 through 2007 time period. Apartment Unit Supply According to the Warren Assessor s office, the town has two apartment complexes with twelve or more units. These two properties include an estimated 32 total units. The town s rental inventory is dominated by older buildings which have been subdivided into multi unit apartments. Although specific numbers could not be provided, the Census does offer some insight into the number of rental units in Warren. According the 2010 U.S. Census, Warren had 557 renter occupied households and 57 units available for rent, indicating a total supply of 614 units. Given a supply of 614 units, the 32 units
34 28 Property Assessment and Re-Use Planning Project identified in larger complexes comprise just 5% of the inventory. Though no new rental units have been developed in the community, some single family attached or detached units may have been moved to rental status since the 2010 Census. Apartment Pricing Although Warren has two larger apartment complexes, neither had on site management available at the time the sites were visited. No major property managers were identified, and no units were identified as being available for rent. A review of listings on CraigsList.org indicated six available apartments including one, two, three and four bedroom units. Pricing was consistent with the larger region. Vacancy Information The 2010 U.S. Census estimated the vacancy rate for rental units in Warren to be 9.2% for all rental units. The 2010 Census indicated that 57 of the town s 190 vacant housing units were available for rent. Other vacant units included seasonal use properties, properties available for sale and sold or rented but not occupied. Given the lack of available data for the community, it is considered prudent to rely upon the estimated 9.2% vacancy rate from the 2010 Census.
35 Property Assessment and Re-Use Planning Project 29 WEST BROOKFIELD The Town of West Brookfield had a total population of 3,701 at the time of the 2010 Census. More recent population estimates from Nielsen indicate a 2013 population of just 3,720, an increase of 0.5% between 2010 and The Town has an estimated median age of 47.4 years (making it the oldest town in the region) and an estimated 1,495 households, according to Nielsen. The average household size was estimated to be The Town had an estimated 1,718 housing units in 2013, with owner occupied units accounting for more than 76% of the 1,495 occupied housing units in the community. The median value of owner occupied housing units was estimated to be $214,455 in Median household income was estimated to be $61,664 in 2013, while the average household income was estimated to be $75,246. The median household income in West Brookfield is more than 23% higher than the Ware median, while the average household income is 21% higher than the Ware average. Median Single Family Home Price West Brookfield s median single family home price peaked in 2005 at $244,000. Between 2005 and 2007, the median price in West Brookfield experienced a slight downward trend, declining by only 2%. As the financial crisis became more severe in 2008, the median single family price fell precipitously, declining from $240,000 in 2007 to $174,500 in 2008, a decline of more than 27% in one year. Between 2008 and 2013, the median single family home price stayed within a relatively tight range, with the 2008 median and the 2013 median being essentially the same, as shown in the graph below.
36 30 Property Assessment and Re-Use Planning Project Median Condominium Price In West Brookfield, condominium sales account for just over 5% of all transactions. However, over the past twenty years, there have been a total of just 46 transactions, or an average of slightly more than two transactions annually. Since the calculation of a median price requires at least three transactions, it is not possible to calculate a median condominium price for many years. According to the Warren Group, West Brookfield s median condominium sale price has been very erratic, with a single year where the median exceeded $120,000. This was more than double the median in any other year. The Warren Group reports no condominium transactions since 2009 in West Brookfield. Transaction Volume As discussed above, the Town of West Brookfield has a limited number of condominium transactions annually. Over the past twenty years, only 46 transactions have been reported, or an average of just over two transactions per year. The number of condominium sales peaked at 9 transactions in Since 2007, the town has had only four condominium transactions. The number of single family home sales peaked at 64 in Over the period from 1999 through 2007, West Brookfield averaged 52 single family home sales annually. Since 2008, the number of transactions has ranged from a low of 25 (2011) to a high of 45 (2008), with the average number of transactions being 36 over that period. This represents a decline of more than 30% in annual transactions in West Brookfield.
37 Property Assessment and Re-Use Planning Project 31 Building Permit Activity According to the U.S. Census, the Town of West Brookfield did not permit any new multi family projects between 2003 and The town permitted a limited number of single family homes between 2003 and According to the U.S. Census, only 33 units were permitted between 2008 and 2012, an average of just over six units annually. Prior to that time, there was a higher level of permit activity for single family homes in West Brookfield. From 2003 through 2007, the Census indicates that 47 single family homes were permitted in West Brookfield, an average of more than nine units annually over the period. In terms of average annual building permits, the recent average of just over six units annually represents a decrease of 32% over the annual average of more than nine units during the 2003 through 2007 time period. Apartment Unit Supply West Brookfield has two larger apartment complexes, with an estimated 60 apartment units located in larger complexes. According the 2010 U.S. Census, West Brookfield has 380 rental units. Larger complexes are estimated to account for less than 20% of total units. Housing unit data from Nielsen indicates that there are only 357 housing units which are not classified as either single family attached or single family detached homes. This indicates that some single family homes are renter occupied.
38 32 Property Assessment and Re-Use Planning Project Apartment Pricing Discussions with property managers at larger apartment complexes indicate rents in the range of $550 to $650 for two bedroom units. No information was available for one bedroom units. These rental rates require tenants to pay for their own heat and electricity. CraigsList.org was reviewed to identify additional pricing information. However, no apartment units were identified as available in West Brookfield. Vacancy Information The 2010 U.S. Census estimated the vacancy rate for rental units in West Brookfield to be approximately 6.6% for all rental units. The 2010 Census indicated that 25 of the town s 220 vacant housing units were available for rent. The vacancy rate in West Brookfield is estimated to be below 6% at the present time.

39 Property Assessment and Re-Use Planning Project 33 REGIONAL SUMMARY The seven town region comprised of Ware and the surrounding six communities include a mix of very rural and slightly urbanized areas. Ware, Palmer and Belchertown serve as commercial and retail centers for the region, while Hardwick, West Brookfield, North Brookfield and Warren are more rural in character, with limited retail and service businesses. Overall, the population of the seven town region was estimated to be 53,128 in 2013, as illustrated in the graphic below.

40 34 Property Assessment and Re-Use Planning Project Household Income In terms of median and average household incomes, Ware is clearly at the low end of the regional income level. Belchertown and Hardwick are the only two communities with average household income in excess of $80,000 in The remaining communities have average household incomes in the range of $62,000 to $75,000.

41 Property Assessment and Re-Use Planning Project 35 Median Single Family Home Price The median single family home price in the seven town region rose steadily in most of the communities through At that time, prices began to flatten, and in some cases decline. As the financial crisis worsened in 2008 and beyond, prices fell more significantly. In general, Belchertown is the most expensive housing market in the region. In addition, Belchertown was also less affected by the real estate downturn than the other communities in the region. Warren and North Brookfield experienced the steepest declines in pricing after 2006.
42 36 Property Assessment and Re-Use Planning Project Median Condominium Price Within the seven town region, condominium activity is sporadic. Only Belchertown and Palmer have condominium markets with consistent annual sales activity, as shown in the graphic below. Pricing in Belchertown is generally higher than other communities, and again was less affected by the real estate downturn in 2007/2008.

43 Property Assessment and Re-Use Planning Project 37 Transaction Volume As with most real estate markets, transaction volume is closely tied to population levels within the seven town region. The chart below provides an overview of transaction levels for the past twenty years. In general, the communities with the highest number of transactions have the highest population levels. Transaction volumes decreased substantially after reaching peak activity levels in 2004/2005. In several cases, transaction levels fell by 50% or more between the peaks of 2004/2005 and the trough of 2008/2009.
44 38 Property Assessment and Re-Use Planning Project Building Permit Activity Within the seven town region, building permit activity for new single family homes was lower for the 2008 through 2012 period than it was in the 2003 through 2007 period. Belchertown showed the most significant decline in permit activity, falling from 441 units in the 2003 through 2007 time period to just over 100 units between 2008 and Total permits within the seven town region fell from 1,132 to 237. This represents a decline in permit activity of almost 80% between the two periods.
45 Property Assessment and Re-Use Planning Project 39 Apartment Unit Supply It is estimated that the seven town region has almost 6,300 rental units. Palmer and Ware have the largest supply of rental units, with Palmer having more than 1,800 units and Ware having more than 1,500 units. These two communities comprise more than 50% of the apartment units in the seven town region. Belchertown has more than 1,000 rental units, in part due to its proximity to several colleges. Town Total Ware 1,532 Belchertown 1,043 Hardwick 365 North Brookfield 536 Palmer 1,818 Warren 614 West Brookfield 360 Total 6,268 Across the seven town region, it is estimated that approximately 15% of all units are located in larger apartment complexes. Units in larger complexes are estimated to total approximately 850 units. Apartment Pricing Pricing in the region is relatively consistent, with most one bedroom units in the range of $575 to $750 per month; two bedroom units in the range of $700 to $900 per month; and three bedroom units in the range of $900 to $1,050. While many older units are priced in the price range consistent with the larger complexes, in many cases, these units have more square footage per unit than the larger complexes. Belchertown is a unique case in the regional apartment complex. Belchertown s proximity to three large colleges, which drives higher occupancy rates, leads to abovemarket rental rates for some properties. Belchertown had several one bedroom units that were listed at rates above $1,000 per month, and some two bedroom units that were listed as high as $1,400 per month. Vacancy Information Overall, it is estimated that there are more than 520 vacant apartment units in the seven town region. In general, the property managers of larger apartment complexes in the region indicated little to no vacancy. This means that virtually all of the vacant units in the seven town region are in smaller buildings with one to four units. The Table below summarizes the occupancy and vacancy estimates for each community.
46 40 Property Assessment and Re-Use Planning Project Town Occupied Vacant Total Vacancy % Ware 1, , % Belchertown , % Hardwick % North Brookfield % Palmer 1, , % Warren % West Brookfield % Total 5, , % As shown in the Table, Ware has the highest number of available units, with more than 30% of all available units. In addition, Ware has the highest estimated vacancy rate in the seven town region, while Warren has the second highest vacancy rate at 9.3%. Belchertown has the lowest estimated vacancy rate, at less than 5%. The Town of Palmer has an estimated 150 vacant apartment units.
47 Property Assessment and Re-Use Planning Project Recommendations 3.1 Property Owners The properties identified through the PARP process exhibit myriad, interconnected challenges that result in a distressed status. Vacancy, neglect both for the structure and property, vandalism/squatters, neighborhood crime, and a weak housing market, among other factors, contribute to the problems faced by homeowners when trying to revitalize properties. Regardless of the plainly evident challenges, owners must be first willing and able to take action. The municipality may assist property owners in many ways, but in a majority of the properties identified it is ultimately the owner s responsibility to take action resulting in a positive re use for the property. Whether the owners are willing to undertake rehabilitation/reuse and financially able to do so varies greatly among the 47 PARP sites. An appendix to this report provides an individual assessment and a re use recommendation for each property. Additionally, a toolkit of funding sources (Resources Available for Housing Rehabilitation Assistance) available to both public and private property owners can act as a roadmap for owners looking to find the best use for a distressed property. The Town is eager to assist in any way possible and is an invaluable resource and not just for rehabilitation of the existing structure. The most advantageous re use of some sites will be demolition or redevelopment for housing (new construction) or for another purpose. 3.2 Town of Ware The Town of Ware has taken a critical first step in identifying some of the most distressed properties in the downtown core. However, given that the majority of PARP sites are privately held, the Town s ability to effect change is constrained. It is difficult for the Town to be the primary agent for the re use or rehabilitation of a private property. However, the Town can both actively and passively press for re use of these sites. The housing market analysis does not show strong demand locally, thus neighborhoods that face additional burdens such as higher crime or excessive blight will struggle longer than others. Moreover, sales values and rent levels are too low to make the substantial monetary reinvestment needed for many of the properties to produce an adequate financial return. In short, it is unlikely that privately funded investment alone will remediate the conditions documented within the study area. Thus, in order to achieve the larger goals of reducing blight and restoring neighborhood vitality, a successful effort will require a combination of private property owners willing to invest, and public funding assistance. Given cooperative owners, many of the
48 42 Property Assessment and Re-Use Planning Project properties studied are good candidates for a combined public private investment. Such candidate properties are identified in the appendix that follows. For many years the Town has effectively used Community Development Block Grant (CDBG) funds to operate a conventional housing rehabilitation program. CDBG funding also could be a vital resource for addressing many of the properties studied through the PARP. However, the estimated cost of rehabilitating most of the properties will exceed the current $35,000 per unit cap for assistance imposed by the Department of Housing and Community Development (DHCD). If the Town wants to pursue CDBG funds for selected properties, it should seek DHCD s advanced approval for a waiver provision that will enable it to provide financial assistance that exceeds DHCD s current cap for a Targeted Properties Initiative via the Community Development Fund I. Blight ordinances and their enforcement will be another effective strategy. More frequent and systematic inspections of rental units for code compliance will induce some absentee landlords to invest in their properties. Recognizing the likely limitations of local funding to support this type of effort, the Town could also seek CDBG funding to create a Code Enforcement Program, which would provide the resources for a Code Enforcement Officer, as well as costs related to the program, such as attorney fees. Together with a targeted program to provide financial assistance to rehabilitate distressed properties, a Code Enforcement Program could be a compelling funding request. Alone or as a complementary effort to an aggressive code enforcement effort, the Town should consider establishing an Eyesore Property initiative. Under this, the Town would periodically identify and publicize derelict and problem properties, including the owner s name and, if available, contact information. These properties could be publicized on the Town s website, in public locations, on Ware Community TV, the Ware River News and via social media, such as Twitter. Such an effort would both demonstrate the Town s awareness of problem properties and potentially direct sufficient pressure from the public such that owners would take actions to improve the properties. Several of the properties reviewed during the PARP are foreclosures that are bank owned. All but one of these OREO (Other Real Estate Owned) properties are currently owned by Fannie Mae or out of state lenders. Given the length of time that these properties have been languished as lender owned, the Town should consider obtaining control of them. Contact could be made either with the lender directly, or with the real estate agency that is marketing them on the lender s behalf. While this recommendation does not ignore the difficulty of doing this, the Town could pursue this course of action while simultaneously undertaking aggressive code enforcement efforts that will require the current owner to address the hazardous and blighting
49 Property Assessment and Re-Use Planning Project 43 conditions. If further combined with a listing as an Eyesore Property, publicized via social media, the Town may find that far quicker action is taken by the current owner, as corporations routinely have staff that monitor social media in order to protect their corporate reputation. Recalcitrant owners of vacant and abandoned properties are likely to continue to pose a major challenge to the Town s effort to reduce the number of distressed properties. The Town should consider participating in the Abandoned Properties Initiative (API) operated by the Attorney General s Office (AGO). Using the resources of the AGO and the court system, this program presents an opportunity to address some of the most problematic properties in the study area. As the process of the AGI is both complex and lengthy, the Town should view this resource as part of a longer term strategy for improving conditions in the area. Planning for the re use of sites in the event the property comes under town control through tax title foreclosure or other means presents opportunities to lessen the chance of vacant and neglected properties sitting idle in the hands of investors who care more about their bottom line than the community as a whole. Although town held properties present short term burdens to town government, the potential long term gains should be considered. When the Town takes possession of a property through tax title or other means, it should evaluate the preferred option for the property s future disposition. While in some cases this may be to auction the property, in other circumstances it may be through a public disposition process that considers other factors than purchase price alone. Examples of such factors are intended owneroccupancy, preference to local residents, financial capacity, or experience in managing rental properties.
50 44 Property Assessment and Re-Use Planning Project
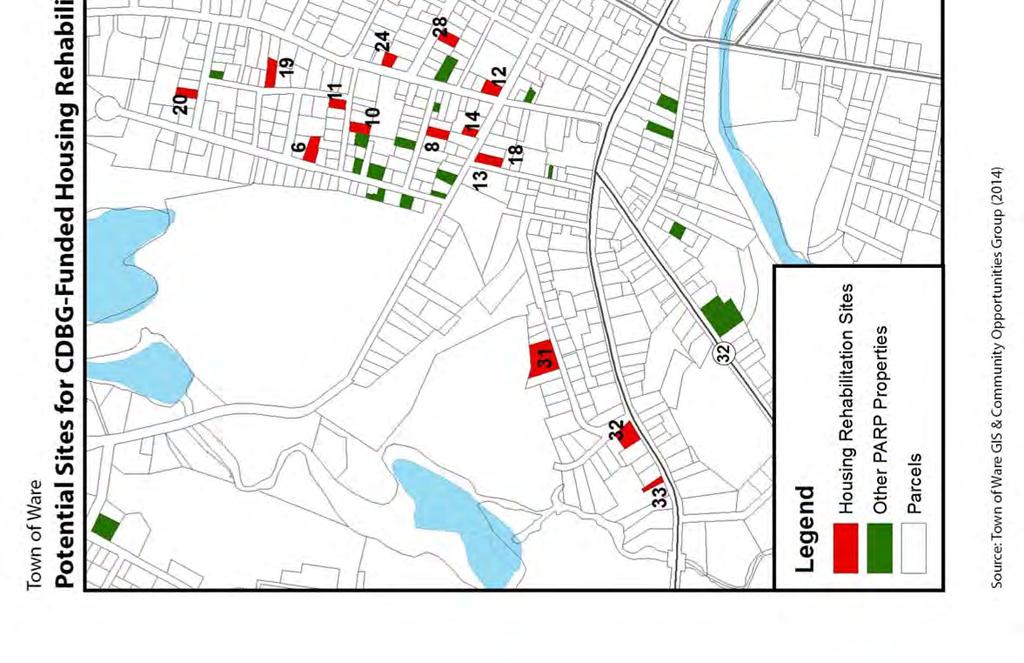
51 Property Assessment and Re-Use Planning Project 45 Appendices List of Potential Sites for Demolition List of Potential Candidates for CDBG-funded Housing Rehabilitation List of Sites Identified for Public-Private Partnership PARP Properties and Assessor Cards Resources Available for Housing Rehabilitation Assistance
52
53 List of Potential Sites for Demolition Address Parcel ID 28 GILBERTVILLE RD RD AV WEBB CT MECHANIC ST PULASKI ST ASPEN CT PLEASANT ST PLEASANT ST PARKER ST EDDY ST (*partial demolition only) ASPEN ST VIGEANT ST HIGH ST NORTH ST EAGLE ST SHERWIN ST
54
55
56
57 List of Potential Candidates for CDBG-funded Housing Rehabilitation Address Parcel ID 29 DUNHAM AV PLEASANT ST PARKER ST EDDY ST WEST MAIN ST WEST MAIN ST ASPEN ST PLEASANT ST CHERRY ST HIGH ST VIGEANT ST NORTH ST HIGH ST CHURCH ST PLEASANT ST DALE ST DALE ST BELLEVUE AV WALNUT ST WALNUT ST SHERWIN ST
58
59
60
61 List of Sites Identified for Public-Private Partnership Address Parcel ID 23 ASPEN ST ASPEN CT ASPEN ST PLEASANT ST PLEASANT ST ASPEN ST ASPEN ST COTTAGE ST GROVE ST VIGEANT ST HIGH ST NORTH ST SHERWIN ST
62
63
City of Lonsdale Section Table of Contents
 City of Lonsdale City of Lonsdale Section Table of Contents Page Introduction Demographic Data Overview Population Estimates and Trends Population Projections Population by Age Household Estimates and
ARLA Members Survey of the Private Rented Sector
 Prepared for The Association of Residential Letting Agents & the ARLA Group of Buy to Let Mortgage Lenders ARLA Members Survey of the Private Rented Sector Fourth Quarter 2010 Prepared by: O M Carey Jones
Characteristics of Recent Home Buyers
 Characteristics of Recent Home Buyers Special Studies, February 1, 2019 By Carmel Ford Economics and Housing Policy National Association of Home Builders Introduction To analyze home buyers NAHB uses the
Quarterly Housing Market Update
 Quarterly Housing Market Update An Overview New Hampshire s current housing market performance, as well as its overall economy, is slowly improving, with positives such as increasing employment and rising
August 2015 Washington, DC Market Trends Report Limited supply, high demand continue pushing prices to record highs
 FOR IMMEDIATE RELEASE Contact: Bobette Banks 301-590-8764 Director of Communications Greater Capital Area Association of REALTORS bbanks@gcaar.com August 2015 Washington, DC Market Trends Report Limited
REAL ESTATE MARKET OVERVIEW 1 st Half of 2015
 REAL ESTATE MARKET OVERVIEW 1 st Half of 2015 With Comparisons to the 2 nd Half of 2014 September 4, 2015 Prepared for: First Bank of Wyoming Prepared by: Ken Markert, AICP MMI Planning 2319 Davidson Ave.
ARLA Members Survey of the Private Rented Sector
 Prepared for The Association of Residential Letting Agents ARLA Members Survey of the Private Rented Sector Second Quarter 2014 Prepared by: O M Carey Jones 5 Henshaw Lane Yeadon Leeds LS19 7RW June, 2014
The State of Renters & Their Homes
 FORECLOSURES FINDING #14 The number of pre-foreclosure notices issued to one- to four-unit properties and condominiums in 2015 fell from the previous year. Pre-foreclosure notices for one- to four-unit
The Corcoran Report 4Q16 MANHATTAN
 The Corcoran Report 4Q16 MANHATTAN Contents Fourth Quarter 2016 4/7 12/23 3 Overview 8 9 10 Market Wide 11 Luxury 24 2 Sales / Days on Market 3 Inventory / Months of Supply 4 5 Market Share Resale Co-ops
Status of HUD-Insured (or Held) Multifamily Rental Housing in Final Report. Executive Summary. Contract: HC-5964 Task Order #7
 Multifamily Rental Housing in Final Report. Executive Summary. Contract: HC-5964 Task Order #7") Status of HUD-Insured (or Held) Multifamily Rental Housing in 1995 Final Report Executive Summary Cambridge, MA Lexington, MA Hadley, MA Bethesda, MD Washington, DC Chicago, IL Cairo, Egypt Johannesburg,
Status of HUD-Insured (or Held) Multifamily Rental Housing in 1995 Final Report Executive Summary Cambridge, MA Lexington, MA Hadley, MA Bethesda, MD Washington, DC Chicago, IL Cairo, Egypt Johannesburg,
REGIONAL. Rental Housing in San Joaquin County
 Lodi 12 EBERHARDT SCHOOL OF BUSINESS Business Forecasting Center in partnership with San Joaquin Council of Governments 99 26 5 205 Tracy 4 Lathrop Stockton 120 Manteca Ripon Escalon REGIONAL analyst april
Housing Market Update
 Housing Market Update September 2017 EXECUTIVE SUMMARY TIGHT HOUSING MARKET CONTINUES, REFLECTS LOW INVENTORY AND HIGHER PRICES Dean J. Christon, Executive Director September 2017 The trend continues in
Housing Market Update
 Housing Market Update March 2017 New Hampshire s Housing Market and Challenges Market Overview Dean J. Christon Executive Director, New Hampshire Housing Finance Authority New Hampshire s current housing
November An updated analysis of the overall housing needs of the City of Aberdeen. Prepared by: Community Partners Research, Inc.
 City of Aberdeen HOUSING STUDY UPDATE November 2010 An updated analysis of the overall housing needs of the City of Aberdeen Prepared by: Community Partners Research, Inc. nd 10865 32 Street North Lake
ECONOMIC CURRENTS. Vol. 5 Issue 2 SOUTH FLORIDA ECONOMIC QUARTERLY. Key Findings, 2 nd Quarter, 2015
 ECONOMIC CURRENTS THE Introduction SOUTH FLORIDA ECONOMIC QUARTERLY Economic Currents provides an overview of the South Florida regional economy. The report presents current employment, economic and real
ECONOMIC CURRENTS. Vol. 4, Issue 3. THE Introduction SOUTH FLORIDA ECONOMIC QUARTERLY
 ECONOMIC CURRENTS THE Introduction SOUTH FLORIDA ECONOMIC QUARTERLY Vol. 4, Issue 3 Economic Currents provides an overview of the South Florida regional economy. The report presents current employment,
Housing Indicators in Tennessee
 Housing Indicators in l l l By Joe Speer, Megan Morgeson, Bettie Teasley and Ceagus Clark Introduction Looking at general housing-related indicators across the state of, substantial variation emerges but
2013 Profile of Home Buyers and Sellers Metro Indianapolis Report
 Prepared for: Metro Indianapolis Board of REALTORS Prepared by: Research Division December 2013 Table of Contents Introduction... 2 Highlights... 3 Conclusion... 6 Methodology..7 Report Prepared by: Jessica
2015 First Quarter Market Report
 2015 First Quarter Market Report CAAR Member Copy Expanded Edition Charlottesville Area First Quarter 2015 Highlights: Median sales price for the region was up 5.1% over Q1-2014, rising from $244,250 to
2007 Sales (thru September)
") Third Quarter Market Report Challenges, Opportunities, and Surprises, Oh My! By Dave Phillips, CEO Charlottesville Area Association of REALTORS Someone named Anonymous once said, "Many an opportunity is
Third Quarter Market Report Challenges, Opportunities, and Surprises, Oh My! By Dave Phillips, CEO Charlottesville Area Association of REALTORS Someone named Anonymous once said, "Many an opportunity is
New affordable housing production hits record low in 2014
 1 Falling Further Behind: Housing Production in the Twin Cities Region December 2015 Key findings Only a small percentage of added housing units were affordable to households with low and moderate incomes.
Manhattan Rental Market Report August 2013 mns.com
 Manhattan Rental Market Report August 2013 TABLE OF CONTENTS 03 Introduction 04 A Quick Look 07 Mean Manhattan Rental Prices 11 Manhattan Price Trends 12 Neighborhood Price Trends 12 Battery Park City
The 2017 Flathead County Real Estate Market
 The 2017 Flathead County Real Estate Market The Flathead Real Estate Market continues to improve with record number of home sales in 2017 By Jim Kelley Kelley Appraisal 1001 South Main Street Kalispell,
Chapter 4: Housing and Neighborhoods
 Chapter 4: Housing and Neighborhoods Introduction Medina is a growing community that provides a variety of housing types and neighborhood styles while protecting and enhancing the City s open spaces and
ECONOMIC CURRENTS. Vol. 3, Issue 1. THE SOUTH FLORIDA ECONOMIC QUARTERLY Introduction
 ECONOMIC CURRENTS THE SOUTH FLORIDA ECONOMIC QUARTERLY Introduction Economic Currents provides an overview of the South Florida regional economy. The report contains current employment, economic and real
WASHINGTON STATE APARTMENT MARKET REPORT SPRING 2018
 WASHINGTON STATE APARTMENT MARKET REPORT SPRING 2018 Vacancy Summary The statewide apartment vacancy rate increased from 3.7% to 4.7% in Fall 2018. While there is variability among the individual county
The Seattle MD Apartment Market Report
 The Seattle MD Apartment Market Report Volume 16 Issue 2, December 2016 The Nation s Crane Capital Seattle continues to experience an apartment boom which requires constant construction of new units. At
Single Family Sales Maine: Units
 Maine Home Connection 19 Commercial St Portland, Maine 04101 MaineHomeConnection.com Office: (207) 517-3100 Email: Info@MaineHomeConnection.com For the fourth consecutive year, Maine home sales set a new
2012 Profile of Home Buyers and Sellers New Jersey Report
 Prepared for: New Jersey Association of REALTORS Prepared by: Research Division December 2012 Table of Contents Introduction... 2 Highlights... 4 Conclusion... 7 Report Prepared by: Jessica Lautz 202-383-1155
CHAPTER 3. HOUSING AND ECONOMIC DEVELOPMENT
 CHAPTER 3. HOUSING AND ECONOMIC DEVELOPMENT This chapter analyzes the housing and economic development trends within the community. Analysis of state equalized value trends is useful in estimating investment
CITI HABITATS. Manhattan Residential Sales Market Report
 Manhattan Residential Sales Market Report Contents 4/7 12/17 3 8 9 10 Market Wide 4 Sales / Days on Market 5 / Months of Supply 6 7 Market Share Resale Co-ops Resale Condos New Developments 11 Luxury Neighborhoods
CHAPTER 2: HOUSING. 2.1 Introduction. 2.2 Existing Housing Characteristics
 CHAPTER 2: HOUSING 2.1 Introduction Housing Characteristics are related to the social and economic conditions of a community s residents and are an important element of a comprehensive plan. Information
rd Quarter Market Report
 2012 3 rd Quarter Market Report The voice of real estate in Central Virginia CAAR Member Copy Expanded Edition Charlottesville Area 3 rd Quarter 2012 Highlights: Overall sales in Greater Charlottesville
FEBRUARY 2019 Harrisonburg & Rockingham County Real Estate Market Report
 FEBRUARY 219 Real Estate Market Report An analysis of real estate activity through January 31, 219 provided courtesy of Scott P. Rogers, Funkhouser Real Estate Group Immaculate Brick Highland Park Colonial
nd Quarter Market Report
 2015 2 nd Quarter Market Report The voice of real estate in Central Virginia CAAR Member Copy Expanded Edition Charlottesville Area 2 nd Quarter 2015 Highlights: Closed sales in the Greater Charlottesville
Housing Needs in Burlington s Downtown & Waterfront Areas
 Housing Needs in s Downtown & Waterfront Areas Researched and written by Vermont Housing Finance Agency for the City of Planning & Zoning Department 10/31/2011 Contents Introduction... 2 Executive Summary...
The Impact of Market Rate Vacancy Increases Eleven-Year Report
 The Impact of Market Rate Vacancy Increases Eleven-Year Report January 1, 1999 - December 31, 2009 Santa Monica Rent Control Board April 2010 TABLE OF CONTENTS Summary 1 Vacancy Decontrol s Effects on
RESIDENTIAL MARKET ANALYSIS
 RESIDENTIAL MARKET ANALYSIS CLANCY TERRY RMLS Student Fellow Master of Real Estate Development Candidate Oregon and national housing markets both demonstrated shifting trends in the first quarter of 2015
Brooklyn Rental Market Report August 2015 mns.com
 Brooklyn Rental Market Report August 2015 TABLE OF CONTENTS 03 Introduction 04 A Quick Look 05 Mean Brooklyn Rental Prices 10 Brooklyn Price Trends 11 Neighborhood Price Trends 11 Bay Ridge 12 Bedford-Stuyvesant
Missing Middle Housing Types Showcasing examples in Springfield, Oregon
 Missing Middle Housing Types Showcasing examples in Springfield, Oregon MissingMiddleHousing.com is powered by Opticos Design Illustration 2015 Opticos Design, Inc. Missing Middle Housing Study Prepared
Housing Bulletin Monthly Report
 January 21 1 Housing Bulletin Monthly Report Most new homes built in second half of 29 25, 2, 15, 1, 5, Dec 7 Jan 8 Feb 8 mar 8 apr 8 Alberta s 29 housing starts increased 72.8 per cent over 28, suggesting
San Francisco Bay Area to Alameda and Contra Costa Counties Housing and Economic Outlook
 San Francisco Bay Area to 2020 Alameda and Contra Costa Counties Housing and Economic Outlook Economic Forecast Summary 2017 Presented by Pacific Union International, Inc. and John Burns Real Estate Consulting,
MARKET WATCH: Dakota County
 MARKET WATCH: Dakota County Trends in the unsubsidized multifamily rental market Minnesota Housing Partnership OCTOBER 2018 Across the Twin Cities, the growing ranks of renter households are facing an
The Coldwell Banker Carlson Real Estate Market Report
 The Coldwell Banker Carlson Real Estate Market Report 2017 Year-End Stowe Area Report Our 2017 Year-End Market Report uses market-wide data, based on transactions that closed in 2017 in the Multiple Listing
2014 Plan of Conservation and Development
 The Town of Hebron Section 1 2014 Plan of Conservation and Development Community Profile Introduction (Final: 8/29/13) The Community Profile section of the Plan of Conservation and Development is intended
MARCH 2019 Harrisonburg & Rockingham County Real Estate Market Report
 MARCH 219 Real Estate Market Report An analysis of real estate activity through February 28, 219 provided courtesy of Scott P. Rogers, Funkhouser Real Estate Group Spacious Four Bedroom Brick Colonial
Myth Busting: The Truth About Multifamily Renters
 Myth Busting: The Truth About Multifamily Renters Multifamily Economics and Market Research With more and more Millennials entering the workforce and forming households, as well as foreclosed homeowners
Appendix 1: Gisborne District Quarterly Market Indicators Report April National Policy Statement on Urban Development Capacity
 Appendix 1: Gisborne District Quarterly Market Indicators Report April 2018 National Policy Statement on Urban Development Capacity Quarterly Market Indicators Report April 2018 1 Executive Summary This
MULTIFAMILY 2012 MULTI-FAMILY HAMPTON ROADS MARKET REVIEW. Author. Data Analysis. Financial Support. Disclosure. Charles Dalton.
 HAMPTON ROADS MARKET REVIEW MULTIFAMILY Author Data Analysis Financial Support Disclosure Charles Dalton Real Data The E. V. Williams Center for Real Estate and Economic Development (CREED) functions and
The Impact of Market Rate Vacancy Increases Eight-Year Report
 The Impact of Market Rate Vacancy Increases Eight-Year Report January 1, 1999 - December 31, 2006 Santa Monica Rent Control Board March 2007 TABLE OF CONTENTS Summary 1 Units Rented at Market Rates Rates
CHAPTER 4: MODERATE INCOME HOUSING ELEMENT
 The Utah Municipal Code, -9a-()(a)(iii) requires that all cities adopt a Plan for Moderate Income Housing as part of their General Plan. Section -9a-() of the Utah Municipal Code, outlines that this Plan
Brooklyn Rental Market Report October 2015 mns.com
 Brooklyn Rental Market Report October 2015 TABLE OF CONTENTS 03 Introduction 04 A Quick Look 05 Mean Brooklyn Rental Prices 10 Brooklyn Price Trends 11 Neighborhood Price Trends 11 Bay Ridge 12 Bedford-Stuyvesant
2013 Profile of Home Buyers and Sellers Texas Report
 2013 Profile of Home Buyers and Sellers Report Prepared for: Association of REALTORS Prepared by: NATIONAL ASSOCIATION OF REALTORS Research Division December 2013 2013 Profile of Home Buyers and Sellers
September 2016 RESIDENTIAL MARKET REPORT
 September 2016 RESIDENTIAL MARKET REPORT The real estate investment market in Japan has had an abundance of capital (both domestic & foreign) over the past couple of years. This, along with the low (now
Washington Apartment Market Spring 2010
 Washington Apartment Market Spring 2010 Since 1996 the Washington Center for Real Estate Research (WCRER) at Washington State University has been providing valuable apartment market statistics for communities
The Corcoran Report 3Q17 MANHATTAN
 The Corcoran Report 3Q17 MANHATTAN Contents Third Quarter 2017 4/7 12/23 3 Overview 8 9 10 Market Wide 11 Luxury 24 4 Sales / Days on Market 5 Inventory / Months of Supply 6 7 Market Share Resale Co-ops
San Francisco Bay Area to Marin, San Francisco, and San Mateo Counties Housing and Economic Outlook
 San Francisco Bay Area to 2020 Marin, San Francisco, and San Mateo Counties Housing and Economic Outlook Economic Forecast Summary 2017 Presented by Pacific Union International, Inc. and John Burns Real
OBSERVATION. TD Economics IS THE AMERICAN HOUSING REBOUND SUSTAINABLE?
 OBSERVATION TD Economics IS THE AMERICAN HOUSING REBOUND SUSTAINABLE? Highlights 2012 was a very good year for the U.S. housing market. Home prices were up almost 8% and housing starts by close to 30%.
San Francisco Bay Area to Santa Clara and San Benito Counties Housing and Economic Outlook
 San Francisco Bay Area to 2020 Santa Clara and San Benito Counties Housing and Economic Outlook Economic Forecast Summary 2017 Presented by Pacific Union International, Inc. and John Burns Real Estate
The 2016 Flathead County Real Estate Market
 The 2016 Flathead County Real Estate Market The Flathead Real Estate Market continues to improve with a near record number of sales in 2016 By Jim Kelley Kelley Appraisal 1001 South Main Street Kalispell,
Regional Housing Markets
 Regional Housing Markets REGIONAL HOUSING MARKETS ADJUST TO CHANGING CIRCUMSTANCES After several years of what one real estate professional called a red-hot housing market, things have cooled off in Hampton
NOVEMBER 2018 Harrisonburg & Rockingham County Real Estate Market Report
 NOVEMBER 218 Real Estate Market Report An analysis of real estate activity through October 31, 218 provided courtesy of Scott P. Rogers, Funkhouser Real Estate Group Custom-Built Highland Park Home with
Real Estate Market Analysis
 One of the challenges facing the West Berkeley shuttle is to consider whether to expand the service beyond the current operations serving major employers, to a system that provides access to a more diverse
Median Income and Median Home Price
 Homeownership Remains Unaffordable; Rental Affordability Showing Signs of Improvement Richard E. Taylor, Research Manager at MaineHousing MaineHousing has released the 217 Maine Homeownership and Rental
Communities at the Crossroads: A Survey of Five First-Ring Suburbs
 Communities at the Crossroads: A Survey of Five First-Ring Suburbs 19 inner ring suburbs of Cleveland Inner-ring Suburban Key Challenges Bottom feeding flippers and speculators Increase in vacant homes
May 2016 Loudoun County Market Trends Report Homes selling twice as fast as 2015 with re-emergence of seller s market
 FOR IMMEDIATE RELEASE Contact: Christine Windle 703-777-2468 Dulles Area Association of REALTORS cwindle@dullesarea.com Sponsored by: Access National Bank Tom Ciolkosz, (703) 871-1045, tciolkosz@accessnationalbank.com
FOR IMMEDIATE RELEASE Contact: Bobette Banks Director of Communications Greater Capital Area Association of REALTORS
 FOR IMMEDIATE RELEASE Contact: Bobette Banks 301-590-8764 Director of Communications Greater Capital Area Association of REALTORS bbanks@gcaar.com April 2016 Washington, DC Market Trends Report Sales and
City Center Market-Rate Housing Study
 City Center Market-Rate Housing Study OVERVIEW The City of Bellingham, with the assistance of students from Western Washington University, conducted a study of market-rate rental housing during April and
APARTMENT MARKET TRENDS
 VOLUME 21 1ST QUARTER 2018 Featuring data from the Center for Business and Economic Research The Las Vegas apartment market saw a slight increase in the average asking rent and an increase the vacancy
City of Exeter Housing Element
 D. Housing Stock Characteristics Government Code Section 65583(a) requires an analysis and documentation of household characteristics, including level of payment compared to ability to pay, housing characteristics,
Gold Beach Buildable Lands Analysis
 Gold Beach Buildable Lands Analysis Final Report Submitted to: City of Gold Beach Prepared by: Community Planning Workshop Community Service Center 1209 University of Oregon Eugene, OR 97403-1209 http://darkwing.uoregon.edu/~cpw
San Francisco Housing Market Update
 San Francisco Housing Market Update California Economic and Housing Market Outlook The national economy maintained a healthy growth rate in the first quarter of 2005 and appeared to be settling in for
Manhattan Rental Market Report November 2015 mns.com
 Manhattan Rental Market Report November 2015 TABLE OF CONTENTS 03 Introduction 04 A Quick Look 07 Mean Manhattan Rental Prices 11 Manhattan Price Trends 12 Neighborhood Price Trends 12 Battery Park City
MISSISSIPPI GULF COAST APARTMENT SURVEY
 MISSISSIPPI GULF COAST APARTMENT SURVEY PREPARED FOR AND COORDINATED BY GULF REGIONAL PLANNING COMMISSION 1232 PASS ROAD TELEPHONE (228) 864-1167 GULFPORT MISSISSIPPI 39507 PREPARED BY W. S. LOPER AND
Table of Contents. Title Page # Title Page # List of Tables ii 6.7 Rental Market - Townhome and Apart ment Rents
 RESIDENTIAL MONITORING REPORT 2013 Table of Contents Title Page # Title Page # List of Tables ii 6.7 Rental Market - Townhome and Apart ment Rents 21 List of Figures iii 7.0 Other Housing Demands and Trends
Housing and Homelessness. City of Vancouver September 2010
 Housing and Homelessness City of Vancouver September 2010 1 Table of Contents Overview Key Housing Issues Homelessness Rental Housing Affordable Home Ownership Key Considerations 2 OVERVIEW 3 Overview
San Francisco Bay Area to Sonoma County Housing and Economic Outlook
 San Francisco Bay Area to 2020 Sonoma County Housing and Economic Outlook Economic Forecast Summary 2017 Presented by Pacific Union International, Inc. and John Burns Real Estate Consulting, LLC On Nov.
ARLA Survey of Residential Investment Landlords
 Prepared for The Association of Residential Letting Agents & the ARLA Group of Buy to Let Mortgage Lenders ARLA Survey of Residential Investment Landlords March 2010 Prepared by O M Carey Jones 5 Henshaw
Addressing the Impact of Housing for Virginia s Economy
 Addressing the Impact of Housing for Virginia s Economy A REPORT FOR VIRGINIA S HOUSING POLICY ADVISORY COUNCIL NOVEMBER 2017 Appendix Report 2: Housing the Commonwealth's Future Workforce 2014-2024 Jeannette
Multifamily Market Commentary February 2017
 Multifamily Market Commentary February 2017 Affordable Multifamily Outlook Incremental Improvement Expected in 2017 We expect momentum in the overall multifamily sector to slow in 2017 due to elevated
Coachella Valley Median Detached Home Price Mar Mar 2018
 Median Price $450,000 Coachella Valley Median Detached Home Price Mar 2002 - Mar 2018 $392,000 $400,000 $366,285 $350,000 $300,000 $250,000 $200,000 $150,000 Media Detached Price 4% Growth Curve Summary
OCTOBER 2018 Harrisonburg & Rockingham County Real Estate Market Report
 OCTOBER 218 Real Estate Market Report An analysis of real estate activity through September 3, 218 provided courtesy of Scott P. Rogers, Funkhouser Real Estate Group Five Bedroom City Home with Finished
CLARK COUNTY NEIGHBORHOOD REVITALIZATION PLAN. Effective Date. January 1, Revised
 CLARK COUNTY NEIGHBORHOOD REVITALIZATION PLAN Effective Date January 1, 2007 Revised January 1, 2010 KANSAS NEIGHBORHOOD REVITALIZATION ACT K.S.A. 1996 Supp. 12-17, 114 et seq. This law authorizes any
Manhattan Rental Market Report December 2017 mns.com
 Manhattan Rental Market Report December 2017 TABLE OF CONTENTS 03 Introduction 04 A Quick Look 07 Mean Manhattan Rental Prices 11 Manhattan Price Trends 12 Neighborhood Price Trends 12 Battery Park City
Brooklyn Rental Market Report October 2014 mns.com
 Brooklyn Rental Market Report October 2014 TABLE OF CONTENTS 03 Introduction 04 A Quick Look 05 Mean Brooklyn Rental Prices 10 Brooklyn Price Trends 11 Neighborhood Price Trends 11 Bay Ridge 12 Bedford-Stuyvesant
Connecticut First Nine Months Housing Report 2014
 Connecticut First Nine Months Housing Report 2014 First Nine Months of 2014 Highlight Positive Outlook for Multi-family Home Construction Millennial buyers are finally increasing their rate of household
Manhattan Rental Market Report Year End 2009
 Manhattan Rental Market Report Year End 2009 Table of Contents Introduction 3 A Quick Look 4 Mean Manhattan Rental Prices 5 Notable Trends 7 Manhattan Price Trends 7 Neighborhood Price Trends Upper West
ental Market report Apartment vacancy rate almost unchanged in 2004 St.Catharines-Niagara Vacancy rate falls in larger centers IN THIS ISSUE
 r ental Market report St.Catharines-Niagara Canada Mortgage and Housing Corporation Apartment vacancy rate almost unchanged in 2004 The vacancy rate in the St. Catharines-Niagara Census Metropolitan (CMA)
May 2016 Montgomery County Market Trends Report Double-digit gains in closed sales, exceeding the five-year May average
 FOR IMMEDIATE RELEASE Contact: Bobette Banks 301-590-8764 Director of Communications Greater Capital Area Association of REALTORS bbanks@gcaar.com May 2016 Montgomery County Market Trends Report Double-digit
Housing Health Report Housing supply outlook suggests market high is leveling off
 November 2018 Housing Health Report Housing supply outlook suggests market high is leveling off For the first time since 2011, new and existing housing supply experiences blanket declines. 2018 activity
Brooklyn Rental Market Report September 2015 mns.com
 Brooklyn Rental Market Report September 2015 TABLE OF CONTENTS 03 Introduction 04 A Quick Look 05 Mean Brooklyn Rental Prices 10 Brooklyn Price Trends 11 Neighborhood Price Trends 11 Bay Ridge 12 Bedford-Stuyvesant
March 2016 Washington, DC Market Trends Report March sales represent a 12 percent increase; top the five-year March average
 FOR IMMEDIATE RELEASE Contact: Bobette Banks 301-590-8764 Director of Communications Greater Capital Area Association of REALTORS bbanks@gcaar.com March 2016 Washington, DC Market Trends Report March sales
TOP-TIER REAL ESTATE REPORT
 TOP-TIER REAL ESTATE REPORT Jan 1 - Jun 30, 2014 Cover property listed by Greg Carros TOP-TIER REAL ESTATE REPORT Table of Contents introduction 3 NATIONAL SUMMARY 4 Vancouver MARKET SUMMARY 7 Overall
Estimating National Levels of Home Improvement and Repair Spending by Rental Property Owners
 Joint Center for Housing Studies Harvard University Estimating National Levels of Home Improvement and Repair Spending by Rental Property Owners Abbe Will October 2010 N10-2 2010 by Abbe Will. All rights
Manhattan Rental Market Report October 2017 mns.com
 Manhattan Rental Market Report October 2017 TABLE OF CONTENTS 03 Introduction 04 A Quick Look 07 Mean Manhattan Rental Prices 11 Manhattan Price Trends 12 Neighborhood Price Trends 12 Battery Park City
MISSISSIPPI GULF COAST APARTMENT SURVEY
 MISSISSIPPI GULF COAST APARTMENT SURVEY PREPARED FOR GULF REGIONAL PLANNING COMMISSION 1635 POPPS FERRY ROAD, SUITE G TELEPHONE (228) 864-1167 BILOXI, MISSISSIPPI 39532 PREPARED BY W. S. LOPER AND ASSOCIATES
May 2016 Washington, DC Market Trends Report Listings continue to move quickly as sales climb nearly 14 percent
 FOR IMMEDIATE RELEASE Contact: Bobette Banks 301-590-8764 Director of Communications Greater Capital Area Association of REALTORS bbanks@gcaar.com May 2016 Washington, DC Market Trends Report Listings
Residential May Karl L. Guntermann Fred E. Taylor Professor of Real Estate. Adam Nowak Research Associate
 Residential May 2008 Karl L. Guntermann Fred E. Taylor Professor of Real Estate Adam Nowak Research Associate The use of repeat sales is the most reliable way to estimate price changes in the housing market
2012 Profile of Home Buyers and Sellers Texas Report
 2012 Profile of Home and Sellers Report Prepared for: Association of REALTORS Prepared by: NATIONAL ASSOCIATION OF REALTORS Research Division December 2012 2012 Profile of Home and Sellers Report Table
2013 Arizona Housing Market Mid-Year Report
 2013 Arizona Housing Market Mid-Year Report This mid-year market report outlines the latest trends in Arizona real estate. The housing market hit bottom in mid to late 2011, and has been in recovery mode