MARKET WATCH: Dakota County
|
|
|
- Judith Simpson
- 5 years ago
- Views:
Transcription
1 MARKET WATCH: Dakota County Trends in the unsubsidized multifamily rental market Minnesota Housing Partnership OCTOBER 2018 Across the Twin Cities, the growing ranks of renter households are facing an increasingly challenging housing market with rising rents and declining vacancy rates. While developers are leveraging public and private resources to create new affordable units, current owners of unsubsidized rental properties have few tools to preserve and improve aging properties to maintain homes for current and future tenants. In this research series, Minnesota Housing Partnership tracks key trends in the unsubsidized multifamily rental markets across the Twin Cities. This report analyzes data for 23,800 unsubsidized rental units in properties with four or more units in Dakota County from the CoStar database. Data information and limitations on page 2. SIGNIFICANT INCREASE IN RENTER HOUSEHOLDS, THOUSANDS PAYING TOO MUCH IN RENT 1 In 2016, slightly more than 1 in 4 households in Dakota County were renters, significantly lower than St. Paul and Minneapolis, where renters make up the majority of households. However, Dakota County has seen a higher rate of growth in the number of renter households, rising 18% since 2000 to a total of 40,564 renter households. This is notably higher than the 12% increase in renters statewide and 12% and 13% increases in St. Paul and Minneapolis respectively. A number of cities in Dakota County have seen dramatic increases in renter households, including (112%) and Inver Grove (71%). The cities with the highest renter populations are those that are closest to Hennepin and Ramsey counties, including West St. Paul (42%), (36%), South St. Paul (34%), and (31%). These are also the cities with the largest percentages of people of color. Overall, 52% of Dakota County renter households are people of color, with West St. Paul (70%), (60%), and South St. Paul (61%) containing the largest proportion of renter communities of color. Like the rest of the Twin Cities and the state, households of color are far more likely to be renters; for instance, only 22% of white households in Dakota County are renters compared to 66% of Black and 55% of Latino households. From 2000 to 2016, median rent in Dakota County increased 6%, while median renter income decreased 8%. Of the 40,564 renters in Dakota County, 18,601 earn under 60% of AMI, and 15,376 of those renters earning under 60% of AMI (or 83%) are cost burdened, with 54% (8,275) paying more than half of their income on housing. 2 Percent renter households Change in renters, % households of color that are renters Dakota County 26% 18% 52% West St. Paul 42% -2% 70% 36% 17% 60% South St. Paul 34% 22% 61% 31% 36% 54% Inver Grove 31% 71% 59% Hastings 28% 64% 78% 21% 112% 39% Rosemount 15% 114% 29% 13% 133% 26% 13% 86% 14% Mendota 12% 64% 33% 46% In Dakota County, 46% of renter households (18,601 families) earn less than 60% of area median income } 83% 54% Of those households, 83% pay more than 30% and 54% pay more than half of their monthly income on housing 1- Unless otherwise noted, information in this section comes from the U.S. Census Bureau, American Community Survey 2- Metropolitan Council staff analysis of U.S. Census Bureau, American Community Survey Public Use Microdata Sample five-year data 1
2 DATA NOTES AND LIMITATIONS: DATA SOURCE: Unless otherwise noted, data on pages 3-11 in this report comes from CoStar, a commercial real estate database that tracks multifamily properties with four or more units. This includes 6,627 market rate, existing multifamily properties in the 7-county Twin Cities metro, for which data is directly sourced from property management by CoStar researchers. This report analyzes data for approximately 23,800 unsubsidized rental units in 330 properties with 4 or more units in Dakota County, excluding those that are currently under construction or renovation. Data for this report was accessed and downloaded the first week of June RENT DATA: CoStar provides average, rather than median, rent data. Of the approximately 23,800 unsubsidized rental units in Dakota County tracked by CoStar and included in this analysis, 56% include rent data. All rent data in this report is adjusted for inflation. BOUNDARIES: This report analyzes Dakota County cities by city boundary. In the county, there are a total of 21 cities, 14 of which have properties in the CoStar database. Cities that do not have any rental properties in CoStar include: Coates, Mendota, Miesville, New Trier, Randolph, and Sunfish Lake. CLASSES: CoStar defines building class in the following way. CLASS A buildings represent current trends and standards in design and/or are of a timeless, perhaps historic quality. They include high quality finishes such as hardwood floors, granite countertops, and/or stainless steel appliances, as well as on-site shared facilities like clubhouse/ party room, fitness center, business center, etc. CLASS B buildings are aesthetically average and contextually appropriate. They include average quality finishes and a few on-site shared facilities and spaces. CLASS C buildings are purely functional, often with below average finishes, small windows and likely no on-site facilities or shared spaces. Lilydale Mendota West St Paul Sunfish Lake South St Paul Inver Grove Rosemount Nininger Hastings Coates Empire Vermillion Marshan Ravenna Eureka Castle Rock Hampton New Trier Douglas Miesville Randolph Greenvale Waterford Sciota 2
3 AVERAGE RENT OUT OF REACH FOR MANY From 2010 to June 2018, average rent in Dakota County for multifamily properties with four units or more rose 13% to $1,171. Average rent is lower than that of the 7-county metro ($1,217 in Q2 2018) and the magnitude of increase has been slower (compared to a 17% increase for the 7-county region since 2010). Still, rent is moving out of reach for a large segment of the renting population. Unsubsidized units that are affordable to households earning 40% to 60% of the area median income (AMI) 3 for instance, a family of four earning $34,340 to $51,480 annually are often referred to as naturally occurring affordable housing (NOAH). By traditional measures, rent is considered affordable when a household spends no more than 30% of its gross income on housing costs. Countywide, rent is largely affordable to families making 60% of AMI but not for those at lower incomes. For instance, as of June 2018, the average rent for a onebedroom apartment is $1,041 a full $363 more per month than a household at 40% AMI could afford. Similarly, the average two-bedroom apartment costs $1,245, just over $430 a month more than what a 40% AMI household could pay. While 89% of the buildings in our dataset were constructed prior to 2010, new units that have been built in the past eight years are commanding much higher rents. The average rent in properties that have come on the market since 2010 is $1,722 47% higher than that of the county average. These new buildings are concentrated in just a few cities: (4), (3), (1) and Lilydale (1). Dakota County Average Rent by Unit Size $1,036 $1,171 $1,722 Average rent for properties constructed since 2010 $764 $937 Average rent 2010 $949 $633 Average rent June 2018 Rent adjusted for inflation $856 $915 % increase in average rent $1,041 $1,017 $678 Affordable to 60% area median income $1,092 Affordable to 40% area median income $1,245 $1,220 $814 13% 23% 15% 14% OVERALL STUDIO 1 BEDROOM 2 BEDROOM 3- Area median income is calculated for the 13-county HUD Metro MN-WI area of Minneapolis- St. Paul- Bloomington. 3
4 DRAMATIC RENT INCREASES IN NORTH/WESTERN CITIES From 2010 to 2017, rent has increased the most in, with a 27% increase, followed by Inver Grove (16%), Rosemount (15%) and (13%). Nine of the 14 cities in our analysis have seen gains of more than 10%. South St. Paul is the only city that saw rent remain flat from 2010 to % change in rent, % Rosemount +15% AVERAGE RENT BY DAKOTA COUNTY MUNICIPALITES, $978 $1,073 $1,241 $1,238 Mendota +13% +12% +13% Burnville +13% $1,068 $1,070 $1,049 $1,007 $1,207 $1,193 $1,183 $1,138 Inver Grove +16% $948 $1,095 +3% $1,055 $1,082 West St. Paul +5% Hastings +2% $918 $857 $877 $962 South St. Paul 0% This graphic only includes cities with more than 100 units in our dataset $849 $849 # of units in dataset units 250-2K units Less than 250 units $883 $976 Rent 2010 Rent 2017 Rent adjusted for inflation RENTAL HOUSING IN 1-3 UNIT PROPERTIES Our dataset includes only properties with four or more units, not townhomes, condos, duplexes, or single family rental homes. HousingLink s Twin Cities Rental Revue for the second quarter of 2018 tracked 323 rental unit listings (or vacant, available units) in Dakota County, for which the average rent was $1,567. This is slightly below the average across the 7-county metro ($1,645). The majority of these listings were for townhomes (51%) and single family rental homes (36%). Countywide, condos had the lowest average rent at $1,146, while single family rental homes had the most expensive average rents at $1,835. Average rent for a two-bedroom unit was $1,350 and $1,509 for a three-bedroom units. Two and three-bedroom units in condos, townhomes or single family rental homes were more expensive than the multifamily market, where two-bedroom units average $1,225 and threebedroom units average $1,361., and had the most listings tracked by HousingLink for the first quarter of In these cities, the rental properties are majority townhomes, with rent averaging from $1,424 in to $1,658 in. Learn more about this data source at housinglink.org. 4
5 SIGNIFICANT NEED FOR AFFORDABLE RENTAL PRESERVATION IN DAKOTA COUNTY Unsubsidized affordable rental housing is typically Class C 4 : older properties that provide basic shelter without additional amenities. In Dakota County, the vast majority of buildings and units in our dataset are Class C: 83% of properties and 71% of units. Class B buildings comprise 24% of units, while Class A buildings comprise just 5% of the county's units in our dataset. A UNITS Class C: 71% (16,885) Class B: 24% (5,619) Class A: 5% (1,399) B C A B BUILDINGS Class C: 83% (275) Class B: 15% (48) Class A: 2% (8) C Average rent in Class C buildings during the second quarter of 2018 in Dakota County was $1,200, higher than that of the 7-County region at $1,023. In contrast to the 7-county region, which sees a 33% difference in average rent in Class C and B buildings, there is little variation between the two in Dakota County. However, there is a $423 distinction between Class B rents, and those of Class A. AVERAGE BUILDING SIZE BY CLASS (# of units) CLASS A Dakota County Twin Cities Minneapolis / St. Paul Like other cities in the region, there is a dramatic distinction in building size by class. While Class A buildings in Dakota County average 200 units, Class C buildings average 61 units. This is dramatically larger than the central cities. For comparison, in Minneapolis the average Class C building contains just 17 units, and in St. Paul just 21 units. CLASS B CLASS C Average rent by building class in Dakota County $2,500 Class A Class B Class C Difference in rent b/w Class C and B Difference in rent b/w Class B and A $2,000 $1,500 $1,000 $1,705 $1,282 $1, % +7% $1,573 $1,042 $ % +26% $1,556 $1, % $ % $1,862 $1,316 $1, % +12% $500 0 Overall Studio 1 bedroom 2 bedroom 4- Full descriptions of CoStar class designations on page 2. 5
6 DESPITE UPTICK IN 2017, VACANCY RATES PLUNGE COUNTYWIDE In Dakota County, the vacancy rate 5 has fallen from 5.1% in 2010 to 3.2% in the second quarter of 2018, a drop of 37%. 8% Vacancy Rates Dakota County Twin Cities metro When vacancy rates fall below 5%, renter households struggle to find affordable housing choices as property owners are able to be more selective in tenant screening and potentially more inclined to increase rent. This has been the case in Dakota County since % 6% 5% 4% 6.5% 5.7% 5.5% 4.5% 3.8% Into the second quarter of 2018, vacancy rates are extremely low in the cities of Inver Grove (1.8%) and Mendota (1.3%). These two cities have seen enormous changes in vacancy rates over time, falling 64% since 2010 in Inver Grove, and falling 58% in Mendota.. 3% 3.5% 2% Vacancy rate change, , by municipality 8% 6% 6.7% 5.9% 8.5% 4.6% 5.4% 5.2% 5.4% 6.1% 5.1% 6.1% Vacancy rate % Vacancy rate Q % 4% 4.6% 4.4% 4.4% 4.3% 3.1% 5- For our vacancy data points, we remove any building in its first year of leasing. CoStar vacancy rate data is higher than reported by other data sources, like Marquette Advisors. This may be due to the fact that the sample size is much larger, includes properties with 4 or more units, as opposed to 10 or more, and is directly sourced rather than relying on survey data. 2% South St Paul 3.5% 3.4% 3.1% 2.5% 2.5% Rosemount West St Paul Hastings 1.8% Inver Grove 1.3% Mendota Vacancy by Building Class Class A 6% Class B 3.4% Class C 3.3% Similar to regional trends, in Dakota County vacancy rates are significantly higher for Class A buildings, at 6% in the second quarter of 2018, than Class B or Class C. However, this is markedly lower than the 7-county average of 10%. Like rent levels, Class C and Class B properties in Dakota County have similar vacancy rates 3.4% for Class B and 3.3% for Class C. Again, for Class B, this is markedly lower than the regional average of 5%. 6
7 MORE THAN 9,000 NATURALLY OCCURRING AFFORDABLE UNITS IN DAKOTA COUNTY In Dakota County, renters with low or moderate income 40 to 60% of AMI are able to afford housing by renting in unsubsidized, naturally occurring affordable housing (NOAH). These properties are typically built from 1960 to 1990, and are basic, safe structures without extra amenities. In our dataset, there are a total of 9,320 units in 111 buildings that are affordable to households earning 40% to 60% of AMI or NOAH units. This accounts for 39% of all units in our dataset, which is notably higher than the 7-county region, in which 19% of units are NOAH. Geographically, the distribution of affordable units across Dakota County follows the cities that contain the most overall multifamily units in our dataset. contains the most NOAH units with a total of 2,517 units. West St. Paul (2,001), (1,902), and Inver Grove (1,121) also have more than 1,000 NOAH units. Properties containing NOAH units are on average larger than similar properties in Minneapolis and St. Paul. Only 23% of these buildings contain less than 25 units, while 42% contain more than 100 units, with the average size of 108 units. Nearly half of NOAH units are two-bedroom apartments (4,521 or 48%), with one-bedroom apartments accounting for 42% of NOAH units (3,892). Like the central cities, though, three- and four-bedroom units are very scarce with just 374 three-bedroom NOAH units and 20 four-bedroom NOAH units in our dataset. BUILDINGS WITH UNITS AFFORDABLE TO HOUSEHOLDS EARNING 40-60% OF AMI Lilydale Mendota Eureka Rosemount Empire West St Paul Lilydale West St Paul South St Mendota Paul Sunfish Lake Sunfish Lake Inver Grove Rosemount Empire Castle Rock Inver Grove Coates South St Paul Coates Vermillion Vermillion Hampton Property containing units affordable to 40-60% AMI Nininger Nininger New Trier Hastings Marshan Douglas Miesville Median Renter Income under $35,000 $35,001 - $46,000 $46,001 - $53,000 over $53,001 No Data Ravenna Hastings Marshan Ravenna Median und $35 $46 ove No City 40%-60% AMI units 2,517 West St. Paul 2,001 1,902 Inver Grove 1, Hastings 357 South St. Paul 239 Greenvale Waterford Sciota Randolph 112 Eureka Castle Rock Hampton New Trier Douglas Miesville Hampton 8 Greenvale Waterford Sciota Randolph 42% 23% 13% Size of buildings with NOAH units Less than 25 units units 22% units 100+ units 7


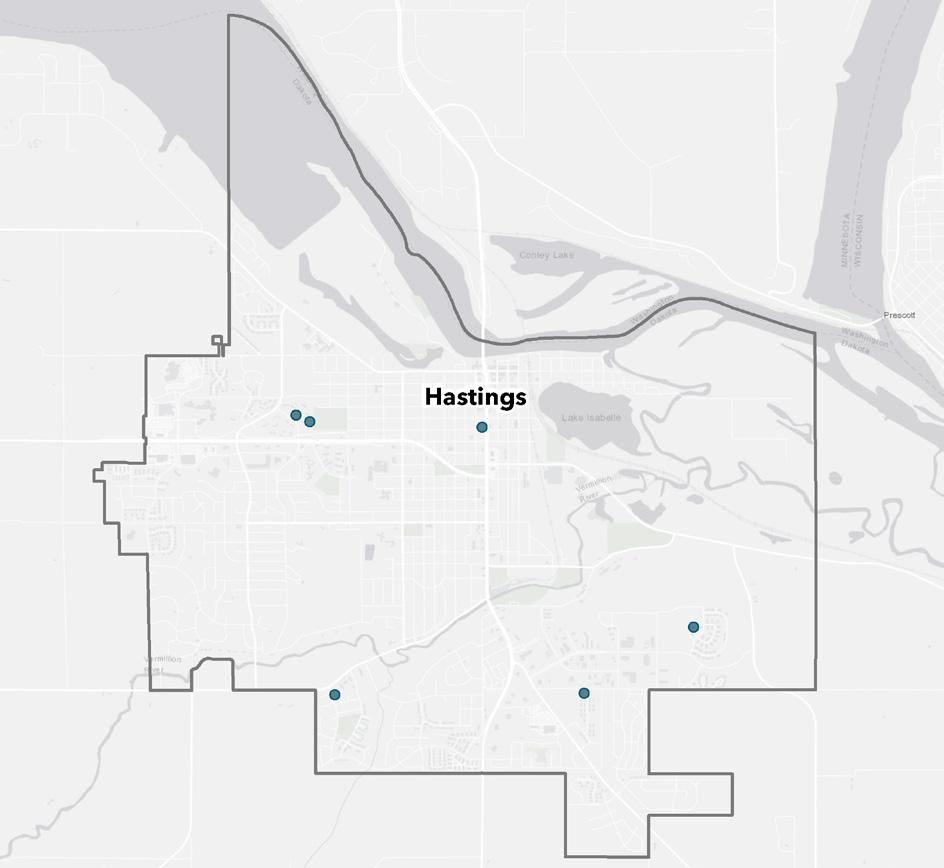
8 BUILDINGS WITH UNITS AFFORDABLE TO HOUSEHOLDS EARNING 40-60% AMI West St Paul South St Paul Inver Grove 8
9 MORE THAN 8,000 UNITS IMPACTED BY PROPERTY SALES SINCE 2010 From 2010 to 2017, 8,158 units in 103 buildings were sold in Dakota County. These property sales peaked in 2016 with 24 buildings sold, impacting 2,975 units or 13% of all units in our dataset in that year. In 2017, sales declined slightly to 21 impacting 1,215 units but still remained higher than the previous seven years. In line with the regional trend, the overwhelming majority of sales were Class C properties, comprising 81% of buildings and 63% of units sold from 2010 to Class B buildings represented 17% of buildings and 33% of units. Only two Class A buildings experienced a sale. In contrast to the regional trend, sales in Dakota County impacted larger properties. The average size of buildings sold from 2010 to 2017 was 76 units significantly higher than that of the overall 7-county metro, which saw an average of 45 units. Of these sales, only 10% were built prior to 1960, while the vast majority were built between 1960 and 1989 (76%), and just 11% in buildings built in 1990 or after. PROPERTIES SOLD IN DAKOTA COUNTY UNITS SOLD IN DAKOTA COUNTY 25 Class C 24 BLDGS , ,607 1, % of buildings sold from were built between 1960 and
10 PROPERTY SALES CONCENTRATED IN NORTHWEST CITIES From 2010 to 2017, the largest number of sales occurred in (20), (13), Hastings (13) and West St. Paul (10). However, the largest number of units impacted is slightly different with 2,623 units impacted in, 2,388 in, 902 in Inver Grove and 428 in. Lilydale Mendota West St Paul Sunfish Lake South St Paul PROPERTY SALES, Property Sale No Data Inver Grove Rosemount Nininger Hastings Coates Empire Vermillion Marshan Ravenna Eureka Castle Rock Hampton New Trier Douglas Miesville Greenvale Waterford Sciota Randolph # bldgs # units 20 2, ,388 Inver Grove Hastings West St. Paul South St. Paul Hampton 2 16 Rosemount
11 SUBSIDIZED AFFORDABLE HOUSING NOT FILLING THE GAP NEW MULTIFAMILY PRODUCTION IN DAKOTA COUNTY, Not included in this analysis are affordable rental housing developments created with public and/or private capital funding that include affordability obligations. Therefore, in addition to the 23,800 unsubsidized rental units analyzed in this report, the Metropolitan Council reported there were 913 new units of affordable rental housing created in Dakota County from 2010 to Over this timeframe, there were no rental units produced that were affordable to under 30% of AMI; the vast majority of units created were affordable at 60% or 80% of AMI with fewer than 30% of units affordable to those earning 50% of AMI. These production counts are similar to the distribution at the 7-county level; regionally, 54% of affordable housing units were affordable at 60% of AMI, followed by 25% affordable to 50% AMI, 17% affordable at 80% AMI, and finally 4% of all produced units were affordable to 30% of AMI. Over that same timeframe, 1,869 unsubsidized rental units were created in Dakota County, with an average asking rent of $1,585 in % AMI 60% AMI 50% AMI 913 units ,869 units Average rent $1,585 in 2016 Data for rental housing production is based on building permits issued during each calendar year by cities and citys within the 7-county Twin Cities region. Data is collected via an annual survey of community officials, in conjunction with collection of data on residential building permits. The data on returned surveys were verified by Metropolitan Council staff. Subsidized Unsubsidized This report was published in August 2018, with data analysis, writing and mapping by Gabriela Norton, Research Associate at Minnesota Housing Partnership, with editing, graphics and design by Carolyn Szczepanski, MHP Director of Research and Communications. Research assistance and input provided by Matt Schroeder (Metropolitan Council), and Erin Olson. Minnesota Housing Partnership Learn more: mhponline.org
MARKET WATCH: Twin Cities Trends in the unsubsidized multifamily rental market
 MARKET WATCH: Twin Cities Trends in the unsubsidized multifamily rental market Issue #3 NOV 2018 Naturally occurring affordable housing (NOAH) appears in distinctly different forms throughout the 7-county
New affordable housing production hits record low in 2014
 1 Falling Further Behind: Housing Production in the Twin Cities Region December 2015 Key findings Only a small percentage of added housing units were affordable to households with low and moderate incomes.
March 3, 2017 Prepared by
 MN Housing Measures 2012-2015 March 3, 2017 Prepared by 2012-2015 MINNESOTA HOUSING MEASURES Naturally Occurring Affordable Housing (NOAH) Percent of Private Market Rental Listings Affordable to 60% AMI
The State of Renters & Their Homes
 FORECLOSURES FINDING #14 The number of pre-foreclosure notices issued to one- to four-unit properties and condominiums in 2015 fell from the previous year. Pre-foreclosure notices for one- to four-unit
City of Lonsdale Section Table of Contents
 City of Lonsdale City of Lonsdale Section Table of Contents Page Introduction Demographic Data Overview Population Estimates and Trends Population Projections Population by Age Household Estimates and
Minneapolis Trends. Permitted residential conversions, remodels and additions. Permitted non-residential conversions, remodels and additions
 Minneapolis Trends A Quarterly Overview of Socioeconomic & Housing Trends in Minneapolis Highlights for the third quarter of 213 third quarter 213 Labor force 219,777 residents change from 3Q-13 2Q-13
Housing Indicators in Tennessee
 Housing Indicators in l l l By Joe Speer, Megan Morgeson, Bettie Teasley and Ceagus Clark Introduction Looking at general housing-related indicators across the state of, substantial variation emerges but
Key Findings on the Affordability of Rental Housing from New York City s Housing and Vacancy Survey 2008
 Furman Center for real estate & urban policy New York University school of law n wagner school of public service 110 West 3rd Street, Suite 209, New York, NY 10012 n Tel: (212) 998-6713 n www.furmancenter.org
Housing Study & Needs Assessment
 Housing Study & Needs Assessment Phase II Public Engagement Presentation #2 Winston-Salem, North Carolina January 25, 2018 MEETING OVERVIEW Welcome & Introductions Purpose & Goals Community Discussions
Carver County AFFORDABLE HOUSING UPDATE
 Carver County AFFORDABLE HOUSING UPDATE July 2017 City of Chaska Community Partners Research, Inc. Lake Elmo, MN Executive Summary - Chaska Key Findings - 2017 Affordable Housing Study Update Chaska is
Analysis of Condo Converted Properties in Minneapolis
 Analysis of Condo Converted Properties in Minneapolis 2000-2005 Prepared for the Housing Preservation Project September 14, 2005 Introduction The purpose of this report is to provide an analysis of pre-conversion
Housing Characteristics
 CHAPTER 7 HOUSING The housing component of the comprehensive plan is intended to provide an analysis of housing conditions and need. This component contains a discussion of McCall s 1990 housing inventory
2015 First Quarter Market Report
 2015 First Quarter Market Report CAAR Member Copy Expanded Edition Charlottesville Area First Quarter 2015 Highlights: Median sales price for the region was up 5.1% over Q1-2014, rising from $244,250 to
Addressing the Impact of Housing for Virginia s Economy
 Addressing the Impact of Housing for Virginia s Economy A REPORT FOR VIRGINIA S HOUSING POLICY ADVISORY COUNCIL NOVEMBER 2017 Appendix Report 2: Housing the Commonwealth's Future Workforce 2014-2024 Jeannette
Multifamily Market Commentary February 2017
 Multifamily Market Commentary February 2017 Affordable Multifamily Outlook Incremental Improvement Expected in 2017 We expect momentum in the overall multifamily sector to slow in 2017 due to elevated
Multifamily Market Commentary February 2018
 Multifamily Market Commentary February 2018 2018 Multifamily Affordable Market Outlook A Long Way to Go Momentum in the overall multifamily sector will likely slow in 2018 due to elevated levels of new
Minneapolis Trends. Permitted residential conversions, remodels and additions. Permitted non-residential conversions, remodels and additions
 Minneapolis Trends A Quarterly Overview of Socioeconomic & Housing Trends in Minneapolis Highlights for the third quarter of 214 third quarter 214 Labor force 221,16 residents change from 3Q-14 2Q-14 3Q-13
PROFILE. Cultivate Hopkins Comprehensive Plan 8/21/18 DRAFT. Cultivate Hopkins Appendix B3: Housing 1
 APPENDIX B3: PROFILE HOUSING Cultivate Hopkins Comprehensive Plan 8/21/18 DRAFT Cultivate Hopkins Appendix B3: Housing 1 Existing Conditions This section describes existing conditions in housing stock
Carver County AFFORDABLE HOUSING UPDATE
 Carver County AFFORDABLE HOUSING UPDATE July 2017 City of Carver Community Partners Research, Inc. Lake Elmo, MN Executive Summary - Carver Key Findings - 2017 Affordable Housing Study Update Carver has
Out of. Reach. The growing gap between. Minnesota 2017 WAGES AND RENT. An annual report from
 Out of Reach Minnesota 2017 The growing gap between WAGES AND RENT An annual report from Executive Summary When families pay too much for rent, they re forced to sacrifice to make ends meet cutting back
State of Renters and Their Homes
 State of Renters and Their Homes As rents rose and renters incomes remained stagnant from to, many New Yorkers continued to face heavy rent burdens. In, roughly 30 percent of the city s renter households
Minneapolis Trends. Permitted residential conversions, remodels and additions. Permitted non-residential conversions, remodels and additions
 Minneapolis Trends A Quarterly Overview of Socioeconomic & Housing Trends in Minneapolis Highlights for the fourth quarter of 214 fourth quarter 214 Labor force 219,419 residents change from 4Q-14 3Q-14
Detroit Inclusionary Housing Plan & Market Study Preliminary Inclusionary Housing Feasibility Study Executive Summary August, 2016
 Detroit Inclusionary Housing Plan & Market Study Preliminary Inclusionary Housing Feasibility Study Executive Summary August, 2016 Inclusionary Housing Plan & Market Study Objectives 1 Evaluate the citywide
CHAPTER 2: HOUSING. 2.1 Introduction. 2.2 Existing Housing Characteristics
 CHAPTER 2: HOUSING 2.1 Introduction Housing Characteristics are related to the social and economic conditions of a community s residents and are an important element of a comprehensive plan. Information
Carver County AFFORDABLE HOUSING UPDATE
 Carver County AFFORDABLE HOUSING UPDATE July 2017 City of Waconia Community Partners Research, Inc. Lake Elmo, MN Executive Summary - Waconia Key Findings - 2017 Affordable Housing Study Update Waconia
City Center Market-Rate Housing Study
 City Center Market-Rate Housing Study OVERVIEW The City of Bellingham, with the assistance of students from Western Washington University, conducted a study of market-rate rental housing during April and
White Oak Science Gateway Master Plan Staff Draft AFFORDABLE HOUSING ANALYSIS. March 8, 2013
 White Oak Science Gateway Master Plan Staff Draft AFFORDABLE HOUSING ANALYSIS March 8, 2013 Executive Summary The Draft White Oak Science Gateway (WOSG) Master Plan encourages development of higher density,
FOR IMMEDIATE RELEASE Contact: Brenda Morton Dulles Area Association of REALTORS
 FOR IMMEDIATE RELEASE Contact: Brenda Morton 703 777 2468 Dulles Area Association of REALTORS bmorton@dullesarea.com August 2018 Loudoun County Market Trends Report Despite persistent low inventory, sales
Wi n t e r 2008 In this issue: Housing Market Update Affordable Housing Update Special Focus: Tracking Subsidized Housing
 www.neighborhoodinfodc.org District of Columbia Housing Monitor Wi n t e r 2008 In this issue: Housing Market Update Affordable Housing Update Special Focus: Tracking Subsidized Housing In the Spotlight
Metro Atlanta Rental Housing Affordability: How Hot is Too Hot for Low-Income Workers?
 Metro Atlanta Rental Housing Affordability: How Hot is Too Hot for Low-Income Workers? July 2018 Atlanta Regional Commission For more information, contact: cdegiulio@atlantaregional.org Metro Atlanta s
Glenmont Sector Plan Staff Draft AFFORDABLE HOUSING ANALYSIS
 Glenmont Sector Plan Staff Draft AFFORDABLE HOUSING ANALYSIS November 1, 2012 Center for Research and Information Systems Montgomery County Planning Department M NCPPC Executive Summary The Glenmont Sector
Highlights. U.S. and the 25 Largest Metropolitan Area Trends Twin Cities Residential Construction: Glimmers of Hope in 2010 July 2011
 Twin Cities Residential Construction: limmers of Hope in July 211 This MetroStats summarizes data on new residential construction within the Twin Cities region through. Analysis comparing the thirteen-county
Glenmont Sector Plan Staff Draft AFFORDABLE HOUSING ANALYSIS
 Glenmont Sector Plan Staff Draft AFFORDABLE HOUSING ANALYSIS UPDATED December 4, 2012 Center for Research and Information Systems Montgomery County Planning Department M-NCPPC Executive Summary The Glenmont
Nonresidential construction activity in the Twin Cities region was robust in 2013
 1 Recent Nonresidential Construction Activity in the Twin Cities Region March 2015 Key Findings After bottoming out in 2010, nonresidential construction activity in the Twin Cities region is once again
REGIONAL. Rental Housing in San Joaquin County
 Lodi 12 EBERHARDT SCHOOL OF BUSINESS Business Forecasting Center in partnership with San Joaquin Council of Governments 99 26 5 205 Tracy 4 Lathrop Stockton 120 Manteca Ripon Escalon REGIONAL analyst april
OUT OF REACH IOWA 2018 THE HIGH COST OF HOUSING
 2018 THE HIGH COST OF HOUSING EXECUTIVE SUMMARY This publication is the second edition of Out of Reach Iowa, a report that documents the gap between wages and rent in the state of Iowa. This report builds
Money Talks, but Most Landlords Aren t Listening
 Money Talks, but Most Landlords Aren t Listening A survey of the acceptance of Section 8 vouchers in suburban Hennepin, Anoka, Dakota, and Counties, Minnesota Table of Contents Page SUMMARY 1 INTRODUCTION
Minneapolis St. Paul Residential Real Estate Index
 University of St. Thomas Minneapolis St. Paul Residential Real Estate Index September 2017 Welcome to the latest edition of the UST Minneapolis St. Paul Residential Real Estate Index. The University of
The Impact of Market Rate Vacancy Increases Eight-Year Report
 The Impact of Market Rate Vacancy Increases Eight-Year Report January 1, 1999 - December 31, 2006 Santa Monica Rent Control Board March 2007 TABLE OF CONTENTS Summary 1 Units Rented at Market Rates Rates
Dakota County 2015 Rental Market Survey. 30th Annual Market Survey
 Dakota County 2015 Rental Market Survey 30th Annual Market Survey December 2015 TABLE OF CONTENTS I. Introduction II. III. Methodology County Summary A. Graph 1 - Response Rate by Survey Method B. Graph
Subsidized. Housing. in 2017
 FACT BRIEF DECEMBER 2018 NYCHA s State Outsized of Role In New Housing York New City s York s Poorest Households Subsidized Housing Public housing is a critical part of the affordable housing landscape
2015 New York City. Housing Security Profile and Affordable Housing Gap Analysis
 2015 New York City Housing Security Profile and Affordable Housing Gap Analysis 1 Contents: Housing Insecurity in New York City 3 A City of Renters. 6 Where the Housing Insecure Population Lives 16 Housing
Housing Needs in Burlington s Downtown & Waterfront Areas
 Housing Needs in s Downtown & Waterfront Areas Researched and written by Vermont Housing Finance Agency for the City of Planning & Zoning Department 10/31/2011 Contents Introduction... 2 Executive Summary...
APARTMENT MARKET TRENDS
 VOLUME 22 2nd QUARTER 2018 Featuring data from the Center for Business and Economic Research The Las Vegas apartment market saw an increase in the average asking rent and a decrease in the vacancy rate
HOUSINGSPOTLIGHT. The Shrinking Supply of Affordable Housing
 HOUSINGSPOTLIGHT National Low Income Housing Coalition Volume 2, Issue 1 February 2012 The Shrinking Supply of Affordable Housing One way to measure the affordable housing problem in the U.S. is to compare
WHERE WILL WE LIVE? ONTARIO S AFFORDABLE RENTAL HOUSING CRISIS
 WHERE WILL WE LIVE? ONTARIO S AFFORDABLE RENTAL HOUSING CRISIS 48% of Ontario renters make less than $40,000 a year. Nearly half of Ontario renters pay unaffordable rental housing costs. 46% of all renters
ECONOMIC CURRENTS. Vol. 5 Issue 2 SOUTH FLORIDA ECONOMIC QUARTERLY. Key Findings, 2 nd Quarter, 2015
 ECONOMIC CURRENTS THE Introduction SOUTH FLORIDA ECONOMIC QUARTERLY Economic Currents provides an overview of the South Florida regional economy. The report presents current employment, economic and real
Carver County AFFORDABLE HOUSING UPDATE
 Carver County AFFORDABLE HOUSING UPDATE July 2017 City of Cologne Community Partners Research, Inc. Lake Elmo, MN Executive Summary - Cologne Key Findings - 2017 Affordable Housing Study Update Cologne
APARTMENT MARKET TRENDS
 VOLUME 23 3rd QUARTER 2018 Featuring data from the Center for Business and Economic Research The Las Vegas apartment market saw a slight increase in the average asking rent and an increase in the vacancy
nd Quarter Market Report
 2015 2 nd Quarter Market Report The voice of real estate in Central Virginia CAAR Member Copy Expanded Edition Charlottesville Area 2 nd Quarter 2015 Highlights: Closed sales in the Greater Charlottesville
Housing Affordability in Lexington, Kentucky
 University of Kentucky UKnowledge CBER Research Report Center for Business and Economic Research 6-29-2009 Housing Affordability in Lexington, Kentucky Christopher Jepsen University of Kentucky, chris.jepsen@uky.edu
MONTGOMERY COUNTY RENTAL HOUSING STUDY. NEIGHBORHOOD ASSESSMENT June 2016
 MONTGOMERY COUNTY RENTAL HOUSING STUDY NEIGHBORHOOD ASSESSMENT June 2016 AGENDA Model Neighborhood Presentation Neighborhood Discussion Timeline Discussion Next Steps 2 WORK COMPLETED Socioeconomic Analysis
Repo. gional Metropolitan Agricultural Preserves Program Status Report. Twin Cities Metropolitan Area
 .. 04-0189 I gional Repo.' 2001-2002 Metropolitan Agricultural Preserves Program Status Report Twin Cities Metropolitan Area.. Do ~MetropolitanCouncil _Minn. Stat. 473H.06 Subd. 5 ~ Building communities
Regional Snapshot: Affordable Housing
 Regional Snapshot: Affordable Housing Photo credit: City of Atlanta Atlanta Regional Commission, June 2017 For more information, contact: mcarnathan@atlantaregional.com Summary Home ownership and household
REAL ESTATE MARKET OVERVIEW 1 st Half of 2015
 REAL ESTATE MARKET OVERVIEW 1 st Half of 2015 With Comparisons to the 2 nd Half of 2014 September 4, 2015 Prepared for: First Bank of Wyoming Prepared by: Ken Markert, AICP MMI Planning 2319 Davidson Ave.
Multifamily Market Commentary September 2016
 Multifamily Market Commentary September 2016 Big Impact from Small Multifamily Properties Multifamily rental units can be found in high-rise structures or in garden-style buildings, but there are a number
3 RENTAL HOUSING STOCK
 3 RENTAL HOUSING STOCK The nation s rental housing comes in all structure types, sizes, prices, and locations. But with the recent growth in high-income renter households, most additions to the stock have
Housing & Neighborhoods Trends
 Housing & Neighborhoods Trends Where do we stand in 2017 At A Glance: Indicator Trend Comparison to State Financial Housing Burden Tax Burden To Note: In 2017, there were a number of Housing & Neighborhood
Multifamily Market Commentary December 2018
 Multifamily Market Commentary December 218 Small Multifamily a Big Deal in Los Angeles Small multifamily properties those with five- to 5-units are getting more attention as an important source of affordable
City of Mitchell RENTAL HOUSING UPDATE
 City of Mitchell RENTAL HOUSING UPDATE March 2015 An updated examination of rental housing market conditions in the Mitchell area Community Partners Research, Inc. 10865 32 nd Street North Lake Elmo, MN
APARTMENT MARKET TRENDS
 VOLUME 21 1ST QUARTER 2018 Featuring data from the Center for Business and Economic Research The Las Vegas apartment market saw a slight increase in the average asking rent and an increase the vacancy
City of Exeter Housing Element
 D. Housing Stock Characteristics Government Code Section 65583(a) requires an analysis and documentation of household characteristics, including level of payment compared to ability to pay, housing characteristics,
Multifamily Market Commentary February 2019
 Multifamily Market Commentary February 2019 2019 Multifamily Affordable Outlook An Overwhelming Need for Workforce Housing Multifamily housing affordability is likely to face significant headwinds in 2019.
5 RENTAL AFFORDABILITY
 5 RENTAL AFFORDABILITY While affordability has improved somewhat, the share of renter households with cost burdens remains well above levels in 21. Although picking up since 211, renter incomes still lag
While the United States experienced its larg
 Jamie Davenport The Effect of Demand and Supply factors on the Affordability of Housing Jamie Davenport 44 I. Introduction While the United States experienced its larg est period of economic growth in
WASHINGTON STATE APARTMENT MARKET REPORT SPRING 2018
 WASHINGTON STATE APARTMENT MARKET REPORT SPRING 2018 Vacancy Summary The statewide apartment vacancy rate increased from 3.7% to 4.7% in Fall 2018. While there is variability among the individual county
Single Family Sales Maine: Units
 Maine Home Connection 19 Commercial St Portland, Maine 04101 MaineHomeConnection.com Office: (207) 517-3100 Email: Info@MaineHomeConnection.com For the fourth consecutive year, Maine home sales set a new
August 2017 Loudoun County Market Trends Report Sales Price Reaches Record High; Sales Decline; Inventory Remains Low
 FOR IMMEDIATE RELEASE Contact: Christine Windle 703 777 2468 Dulles Area Association of REALTORS cwindle@dullesarea.com August 2017 Loudoun County Market Trends Report Sales Price Reaches Record High;
Carver County AFFORDABLE HOUSING UPDATE
 Carver County AFFORDABLE HOUSING UPDATE July 2017 City of Watertown Community Partners Research, Inc. Lake Elmo, MN Executive Summary - Watertown Key Findings - 2017 Affordable Housing Study Update Watertown
Introduction. Sidney Ainkorn, Peter Mathison, and David Tomporowski. General History and Context. Geographic Context
 Sidney Ainkorn, Peter Mathison, and David Tomporowski Introduction General History and Context Geographic Context Richfield is a first-ring suburb, located just outside the city of Minneapolis (Map 1).
About Streams. Streams is 2017 by HousingLink
 About Streams Contents ABOUT STREAMS... 2 HOW TO USE STREAMS (at a high level)... 2 MORE ABOUT FILTERS THAN YOU WANT TO KNOW... 2 Search by... 3 Filter by... 3 Funding Source... 3 Funding Categories...
Dan Immergluck 1. October 12, 2015
 Examining Recent Declines in Low-Cost Rental Housing in Atlanta, Using American Community Survey Data from 2006-2010 to 2009-2013: Implications for Local Affordable Housing Policy Dan Immergluck 1 October
UC Berkeley Fisher Center Working Papers
 UC Berkeley Fisher Center Working Papers Title The Case for Preserving Costa-Hawkins - The Potential Impacts of Rent Control on Single Family Homes Permalink https://escholarship.org/uc/item/8wt9p088 Author
May 2016 Loudoun County Market Trends Report Homes selling twice as fast as 2015 with re-emergence of seller s market
 FOR IMMEDIATE RELEASE Contact: Christine Windle 703-777-2468 Dulles Area Association of REALTORS cwindle@dullesarea.com Sponsored by: Access National Bank Tom Ciolkosz, (703) 871-1045, tciolkosz@accessnationalbank.com
Briefing Book. State of the Housing Market Update San Francisco Mayor s Office of Housing and Community Development
 Briefing Book State of the Housing Market Update 2014 San Francisco Mayor s Office of Housing and Community Development August 2014 Table of Contents Project Background 2 Household Income Background and
The supply of single-family homes for sale remains
 Oh Give Me a (Single-Family Rental) Home Harold D. Hunt and Clare Losey December, 18 Publication 2218 The supply of single-family homes for sale remains tight in many markets across the United States.
Minneapolis St. Paul Residential Real Estate Index
 University of St. Thomas Minneapolis St. Paul Residential Real Estate Index Welcome to the latest edition of the UST Minneapolis St. Paul Residential Real Estate Index. The University of St Thomas Residential
The Impact of Market Rate Vacancy Increases Eleven-Year Report
 The Impact of Market Rate Vacancy Increases Eleven-Year Report January 1, 1999 - December 31, 2009 Santa Monica Rent Control Board April 2010 TABLE OF CONTENTS Summary 1 Vacancy Decontrol s Effects on
Introduction. Charlotte Fagan, Skyler Larrimore, and Niko Martell
 Charlotte Fagan, Skyler Larrimore, and Niko Martell Introduction Powderhorn Park Neighborhood, located in central-southern Minneapolis, is one of the most economically and racially diverse neighborhoods
Methodological Appendix: The Growing Shortage of Affordable Housing for the Extremely Low Income in Massachusetts
 Appendix A: Estimating Extremely Low-Income Households This report uses American Community Survey (ACS) five-year estimate microdata to attain a sample size and geographic coverage that are sufficient
San Diego County Vol. XX, Issue I Rental Trends Executive Summary March 2007
 Real Estate Research and Consulting for over 25 years Vol. XX, Issue I Rental Trends Executive Summary Editor: Robert D. Martinez- Director of Research s institutional grade rental complexes experienced
A Tale of Two Canadas
 Centre for Urban and Community Studies Research Bulletin #2 August 2001 A Tale of Two Canadas Homeowners Getting Richer, Renters Getting Poorer Income and Wealth Trends in Toronto, Montreal and Vancouver,
Connecticut First Nine Months Housing Report 2014
 Connecticut First Nine Months Housing Report 2014 First Nine Months of 2014 Highlight Positive Outlook for Multi-family Home Construction Millennial buyers are finally increasing their rate of household
JASPER PLACE NEIGHBOURHOOD HOUSING ASSESSMENT NOVEMBER West Jasper Place. Glenwood. Britannia Youngstown. Canora
 JASPER PLACE NEIGHBOURHOOD HOUSING ASSESSMENT NOVEMBER 2013 West Jasper Place Glenwood Britannia Youngstown Canora TABLE OF CONTENTS A: INTRODUCTION................................... 01 B: PHOTOGRAPHIC
Manhattan Rental Market Report August 2013 mns.com
 Manhattan Rental Market Report August 2013 TABLE OF CONTENTS 03 Introduction 04 A Quick Look 07 Mean Manhattan Rental Prices 11 Manhattan Price Trends 12 Neighborhood Price Trends 12 Battery Park City
SJC Comprehensive Plan Update Housing Needs Assessment Briefing. County Council: October 16, 2017 Planning Commission: October 20, 2017
 SJC Comprehensive Plan Update 2036 Housing Needs Assessment Briefing County Council: October 16, 2017 Planning Commission: October 20, 2017 Overview GMA Housing Element Background Demographics Employment
Little Haiti Community Needs Assessment: Housing Market Analysis December 2015
 Little Haiti Community Needs Assessment: Housing Market Analysis December 2015 Prepared by: EXECUTIVE SUMMARY Background The Little Haiti Housing Needs Assessment provides a current market perspective
The Knox County HOUSING MARKET
 T E C H REPORT SERIES The Knox HOUSING MARKET Date: August 2007 For more information: MPC Contact Person: Bryan Berry 215-2500 MPC Website and e-mail www.knoxmpc.org contact@knoxmpc.org INTRODUCTION In
FOR IMMEDIATE RELEASE Contact: Brenda Morton Dulles Area Association of REALTORS
 FOR IMMEDIATE RELEASE Contact: Brenda Morton 703 777 2468 Dulles Area Association of REALTORS bmorton@dullesarea.com February 2018 Loudoun County Market Trends Report Inventory reaches yet another record
Washington Apartment Market Fall 2017
 Washington Apartment Market Fall 2017 Washington State s apartment vacancy rate increased from 3.1% to 3.7% in fall 2017. While there is variability among the individual county rates, all counties included
ECONOMIC CURRENTS. Vol. 4, Issue 3. THE Introduction SOUTH FLORIDA ECONOMIC QUARTERLY
 ECONOMIC CURRENTS THE Introduction SOUTH FLORIDA ECONOMIC QUARTERLY Vol. 4, Issue 3 Economic Currents provides an overview of the South Florida regional economy. The report presents current employment,
High-priced homes have a unique place in the
 Livin' Large Texas' Robust Luxury Home Market Joshua G. Roberson December 3, 218 Publication 2217 High-priced homes have a unique place in the overall housing market. Their buyer pool, home characteristics,
quarter andd Figure % (2009 Q3) 15.68% Drop $741 (2013 Q1) Average Vacancy Rate (%) Average Rent
 15.68% Drop $741 (2013 Q1) Average Vacancy Rate (%) Average Rent") Lied Institute Report on featuring data from the Center for Business Economic Research Volume 17, 1 st Quarter, 2017 in 1 st Quarter 2017 The Las Vegas apartment market saw a slight increase in the average
Lied Institute Report on featuring data from the Center for Business Economic Research Volume 17, 1 st Quarter, 2017 in 1 st Quarter 2017 The Las Vegas apartment market saw a slight increase in the average
RESIDENTIAL MARKET ANALYSIS
 RESIDENTIAL MARKET ANALYSIS RMLS Student Fellow Master of Real Estate Development Candidate Many of the single family housing trends in the second quarter of 2017 bounced upwards following a continuation
Demographic and Housing Trends
 Demographic and Housing Trends In the New Orleans Metro Presented by: Allison Plyer www.gnocdc.org A product of Nonprofit Knowledge Works 1 Housing Production 2 Demographic and Housing Trends Katrina dramatically
H o u s i n g N e e d i n E a s t K i n g C o u n t y
 1999 2000 2001 2002 2003 2004 2005 2006 2007 2008 2009 2010 Number of Affordable Units H o u s i n g N e e d i n E a s t K i n g C o u n t y HOUSING AFFORDABILITY Cities planning under the state s Growth
CHAPTER 3. HOUSING AND ECONOMIC DEVELOPMENT
 CHAPTER 3. HOUSING AND ECONOMIC DEVELOPMENT This chapter analyzes the housing and economic development trends within the community. Analysis of state equalized value trends is useful in estimating investment
Trends. Trends in Condominiums, Co-Ops and PUDs. Condominium Summary
 in Condominiums, Co-Ops and PUDs THE SAMPLE This 2012 edition reflects 2011 financial data from 2,062 properties in the United States and Canada, representing 264,084 units. Table 1 breaks down the sample
ARLA Members Survey of the Private Rented Sector
 Prepared for The Association of Residential Letting Agents ARLA Members Survey of the Private Rented Sector Second Quarter 2014 Prepared by: O M Carey Jones 5 Henshaw Lane Yeadon Leeds LS19 7RW June, 2014
Massachusetts 2016 First Quarter Housing Report
 Massachusetts 2016 First Quarter Housing Report Outlook for 2016 Positive as Unit Sales Continue to Climb The re-entry of boomerang buyers and potential for millennial homeownership point to a strengthening