COMMITTEE OF THE WHOLE AGENDA April 18, :30 PM City Hall Council Chambers
|
|
|
- Nigel Francis
- 5 years ago
- Views:
Transcription
1 COMMITTEE OF THE WHOLE AGENDA April 18, :30 PM City Hall Council Chambers Committee of the Whole Meeting 1. Presentation Bluestem and TPAS - Kathy Anderson, Executive Director Board of Appeals & Equalization Preview - Nathan Aakre, Assessing Division 3. Reports Upon request, accommodations for individuals with disabilities, language barriers, or other needs to allow participation in City Council meetings will be provided. To arrange assistance, call the City Clerk s office at (voice) or 711 (TDD/TTY). Visit our website at
2
3 Memorandum To: Mayor Williams and Members of the Moorhead City Council From: Scott A. Hutchins, Deputy City Manager Date: April 14, 2016 Re: April 18 City Council Committee of the Whole Hello. Please note a presentation on the Clay County Jail/LEC, which was scheduled for this Committee of the Whole, has been moved to the Committee of the Whole of May 16 in order to better accommodate scheduless of several folks interested in attending/presenting on this subject. In its place on this agenda, the Council will hear from Kathy Anderson, Executive Director Bluestem and TPAS. Thanks and see you Monday.

4 Mayor and Council Communication April 18, 2016 Page 1 of 2 SUBJECT: 2016 Board of Appeals & Equalization Preview - Nathan Aakre, Assessing Division RECOMMENDATION: The Mayor and City Council are asked to receive a presentation on the upcoming Board of Appeal and Equalization Hearing. BACKGROUND / KEY POINTS: Last year converted to a new Computer Aided Mass Appraisal system. o Last year all residential properties converted. o This year all apartments converted. o Will take 2-3 years to convert all commercial properties due to diversity and complexity. Plan is to convert segments by use (ex: banks, office buildings, retail, etc) Assessment Statistics received from DOR on 4/4/2016 o Apartments 94% median rapidly increasing market in last 3-4 years o Commercial 97% median segment of the market was adjusted this year o Residential just under 95% median DOR regulates not just assessment level, but assessment quality. Coefficient of Dispersion = 7.2 lowest in years Price Related Differential = 1.00 balance between assessment of high and low valued homes As good as it gets in an imperfect market o Capability of new system to do comprehensive sales studies and accurately track the market each year will keep it fair for property owners, so no one pays more or less than their fair share - #1 goal. Also helps avoid across the board adjustments to entire classes of property. Segments of the market can be addressed when not assessed fairly. Ex: this year s affordable homes (1 st time home-buyer market) Local Board of Appeal and Equalization o Scheduled for this Wednesday, April 20 th at 6:30 PM. o This year s process: Board will make a decision on every appeal that our office has had time to review and respond to. Board will hear any other appeals that haven t contacted our office, but will table any decision until the following Wednesday. o Extremely reduced call volume this year compared to last year, and we are very satisfied with the quality of assessment.
5 Mayor and Council Communication - April 18, 2016 Page 2 of 2 FINANCIAL CONSIDERATIONS: None VOTING REQUIREMENTS: Not Applicable Disclaimer: Voting requirements may be subject to changes in the law, parliamentary procedural matters, or other unforeseen issues. The City Attorney provides opinion on questions of voting requirements in accordance with the Moorhead City Code, Minnesota State Statues, and parliamentary procedure. Department: Prepared by: Attachments: Assessor Nathan Aakre, Appraiser 2016 Committee of the Whole MEMO 2016 BOAE Booklet Opening Statement for BOAE Agenda Item No. 2.
6 TO: Mayor and City Council MEMO FROM: City of Moorhead Assessor s Office DATE: April 12, 2016 RE: Committee of the Whole April 18, 2016 Nathan Aakre from the Assessor s Office is scheduled to give a brief update to the Committee of the Whole on April 18, Updates will be given on the progress of the software conversion that began in 2014, the assessment level and quality of the 2016 assessment, and the Board of Appeal and Equalization meeting scheduled for April 20, An outline including topics to be presented to the Committee of the Whole is attached for your review in advance of this meeting, and Nathan will be available to answer any questions in regards to this information on the 18th. The Assessor s Office compiled more extensive educational material this year than in previous years for the Board of Appeal and Equalization to serve as background information in handling appeals. These memos were disbursed to the Council in recent weeks and provide more detail on much of what will be included in the update. Educational memos are included in the 2016 BOAE Booklet starting on page 47, which is attached once again for any additional review. The final attachment is an opening statement Mayor Williams will present prior to the Board hearing any appeals at the BOAE meeting. This year property owners who have not contacted the Assessor s Office to discuss valuation and classification prior to the meeting will be heard by the Board; however, a decision will not be made until Assessing Staff has had an opportunity to review and respond to the appeal, and provide a recommendation to the Board. If you have questions about any of the information provided, feel free to contact the Assessor s Office by phone ( ), or by (assessor@ci.moorhead.mn.us).


7 Wednesday, April 20th 6:30 PM Appeals 1st Floor City Hall Chambers 2016 Local Board of Appeal & Equalization 1

8 Memo To: Mayor Del Rae Williams, Chair, Board of Appeal and Equalization Moorhead Board of Appeal and Equalization Members Moorhead City Council From: Peter Doll and Assessing Staff Date: March 23, 2016 Re: 2016 Board of Appeal and Equalization The Board of Appeal and Equalization board meeting is scheduled for April 20, 2016 in the Council Chambers beginning at 6:30 PM. Due to the scheduled pre-meeting on March 30 th, we anticipate starting at 6:30 PM with scheduled appeals. A quorum, including one trained member, must be in attendance in order for any valid action to be taken. If anyone knows that they will not be able to be in attendance please let our office know. As in the past, our valuation notices were mailed jointly with tax statements as a cost savings measure. The notices and statements will be mailed out on or around April 1, which would meet the 10 day mailing criteria. For the regular meeting, the assessment department will prepare written material for all who indicate they may come before the Board of Appeal and Equalization. The Board should be prepared to handle the issues staff have reviewed and responded to in writing at the first meeting. The Board should table only complex issues that need additional research, or appeals which staff have not had time to review and respond to. It is the burden of the property owner to prove the classification or value placed on the property is incorrect by providing information the board can use to determine a change is warranted. The purpose of the Board of Appeal and Equalization process is to make sure all the property is properly classified and valued. This is done to ensure that all property owners pay only their fair share of property taxes, no more and no less. The Local Board of Appeal and Equalization has the authority to change the valuation and/or the classification of the property for the current assessment year. When hearing appeals, the Board should only rely on factual, market derived information that is relevant to the classification and valuation of the property Board of Appeal and Equalization City of Moorhead, MN March 23,
9 The annual report is broken down into several sections: Section 1: Purpose, Duties, Limitations and Make-up of the Local Board of Appeal and Equalization Section 2: An Overview of Assessment Levels, Assessment Activities, and Market Trends by Residential, Apartment and Commercial Property Classifications Section 3: General Overall City Statistics Section 4: What is New or Changed Addendum: Miscellaneous Exhibits Department of Revenue Fact Sheets 12b, 12c, and 12a, Comparable Sales Search Example, Educational Memo #1, Educational Memo #2, Inquiry/Formal Appeal Letters, and Grade Guide Meeting Format: Due to the increased capabilities of the CAMA system for residential properties, which will typically perform an electronic sales search; all residential appeals will be heard first, starting with those who have scheduled an appointment ahead of time. This should allow the best customer service to the greatest number of people. For residential appeals a homeowner should need no more than 3-5 minutes to state their factual, market-based, non-repetitive arguments before the Board can make a decision. After all residential appeals have been heard, we will address apartments, followed by commercial properties. Breaking these into the three groups of classifications will allow the Board to better focus on each type of property. Order of Appeals: 1. Scheduled Residential 2. Unscheduled Residential to be Heard and Tabled 3. Scheduled Apartment 4. Unscheduled Apartment to be Heard and Tabled 5. Scheduled Commercial/Industrial 6. Unscheduled Commercial/Industrial to be Heard and Tabled 2016 Board of Appeal & Equalization Del Rae Williams Steve Gehrtz Jim Haney Tom Barth Bruce Johnson Wilhelmine Jacobson Bryce Huotari Mayor Council Council Appraiser Realtor Realtor / At-Large Realtor / At-Large 2016 Board of Appeal and Equalization City of Moorhead, MN March 23,
10 SECTION 1 Purpose, Duties, Limitations and Make-up of the Local Board of Appeal and Equalization Minnesota Statutes, Section , provides that the town board of each township and the governing body of cities shall be the Board of Appeal and Equalization. The purpose of the Local Board of Appeal and Equalization is to provide a fair and objective forum for property owners to appeal their valuation or classification. The local board often serves as the first formal step in the appeals process for taxpayers. The goal of the Local Board of Appeal and Equalization should be to attempt to address property owners issues efficiently, fairly, and objectively. The Board of Appeal and Equalization must complete its work and adjourn within twenty days from the time of convening as specified in the notice of the clerk, unless the Commissioner of Revenue approves a longer period. No action taken subsequent to such date shall be valid. Duties of Local Board of Appeal and Equalization 1. They are to determine that all taxable (real and personal) property in the jurisdiction is properly assessed, valued and classified. 2. If any property has been omitted, the board must correct the assessment by adding it to the list of assessments along with its market value. 3. The assessments of each description of real property consisting of land and buildings are reviewed by the Board. Larger assessment districts accomplish this by monitoring the level of assessments and statistical measurements of residential, apartment, and commercial properties. 4. The authority of the local board is limited to the individual assessments of real and personal property. The board cannot increase or decrease, by percentage, all of the assessments in the district of a given class of property. Changes in the aggregate assessments by class are only made by the County Board of Appeal and Equalization. 5. Although the local Board of Appeal and Equalization has the authority to increase or reduce individual assessments, the total of such adjustments must not reduce the aggregate assessment made by the County Assessor by more than one percent. If the total of such adjustments does lower the aggregate assessment made by the County Assessor by more than one percent, none of the adjustments will be allowed. This limitation does not apply, however, to the correction of clerical errors or the removal of duplicate assessments. 6. The local Board of Appeal and Equalization does not have the authority in any year to reopen former assessments on which taxes are due and payable Board of Appeal and Equalization City of Moorhead, MN March 23,
11 7. In reviewing the individual assessments, the board may find instances of under valuation. Before the board raises the market value of property, it must notify the owner. The law does not prescribe any particular form of notice except that the person whose property is to be increased in assessment must be notified of the intent of the board to make the increase. The local Board of Appeal and Equalization meeting assures a property owner of an opportunity to contest the valuation or classification that has been placed on their property or to contest or to protest any other matter relating to the taxation of their property. The board is required to review the matter and make any corrections deemed necessary. 8. When a local Board of Appeal and Equalization convenes, a majority of the members must be in attendance in order for valid action to be taken. The assessor is required by law to be present with the assessment books and records. The assessor is required to take part in the proceedings but has no voting rights. 9. It is the primary duty of each Board of Appeal and Equalization to examine the assessment record to see that all taxable property in the assessment district has been properly placed upon the list and valued by the assessor. In the event a property, either real or personal, has been omitted, the board has the duty of making the assessment. 10. The complaints and objections of taxpayers who feel aggrieved with any assessments for the current year should be considered by the board. Staff should provide the technical analysis for board consideration, which will then make corrections if deemed necessary. If the Assessment staff was refused entry by the property owner to inspect that property, the local Board of Appeal and Equalization may not adjust the market value or classification in a way that would benefit the property. 11. A taxpayer may file written objections to their assessment with the assessor prior to the Board of Appeal and Equalization meeting. Such objections must be presented to the board for consideration while it is in session. 12. Before adjourning, the Board of Appeal and Equalization should prepare an official list of the changes. The law requires that the changes be listed on a separate form, which is appended to the assessment book. The assessments of omitted property must be listed in detail with their market values. All assessments that have been increased or decreased should be shown as prescribed in the form along with the market values. After the changes have been completed, the record should be signed and dated by the members of the Board of Appeal and Equalization. 13. The County Board of Equalization is scheduled for Tuesday, June 14 th, 2016 at 6:30 PM in the County Board Room of the Courthouse Board of Appeal and Equalization City of Moorhead, MN March 23,
12 Limitations A local Board of Appeal and Equalization may increase or reduce assessments upon petition of the taxpayer; the total adjustments must not reduce the aggregate assessment made by the County assessor by more than one percent. If the total adjustments would lower the aggregate assessments made by the county assessor by more than one percent, none of the adjustments may be made. The assessor may correct any clerical errors or double assessments discovered by the Board of Appeal and Equalization without considering the one percent referred to above. (M.S ) Total Estimated Market Value x 1% = Maximum Total Adjustments $2,926,588,100 x 1% = $29,265,881 (Unofficially - according to assessment records 3/21/2016) Market Value and Highest and Best Use The purpose of most appraisals is to determine market value. Appraisals for property tax purposes must conform to the definitions in statues, which usually define value as the dollar or cash price that would result if the property were sold in a competitive market with both the buyer and seller being knowledgeable of the property and neither being under undue pressure. Market value is also time-specific. Mass appraisal is the valuation of many properties as of a given date, using standard procedures and statistical testing. There are four forces that impact value economic, social, governmental, and environmental. Highest and Best Use is the reasonable and probable use that supports the highest present value as of the date of the appraisal. Highest and Best Use must be physically possible, legally permissible, financially feasible, and maximally productive. Just as real estate values change over time, so may the highest and best use of a property. Properties are valued at highest and best use, and classified according to their current use Board of Appeal and Equalization City of Moorhead, MN March 23,
13 SECTION 2 An overview of Assessment Levels, Assessment Activities and Market trends by Residential, Apartment, and Commercial Property Classifications¹ Residential Sales Ratio Study² 2012 Median Sales Ratio (Assessment Level before adjustments) 97.5% 2013 Median Sales Ratio (Assessment Level before adjustments) 97.8% 2014 Median Sales Ratio (Assessment Level before adjustments) 91.8% 2015 Median Sales Ratio (Assessment Level before adjustments) 90.1% 2016 Median Sales Ratio (Assessment Level before adjustments) 93.1% 2016 Time-Adjusted Median (7.5% Time Adjustment) 88.2% 2012 Median Sale Price $138, Median Sale Price $134, Median Sale Price $145, Median Sale Price $152, Median Sale Price $160,000 Percent change in Median Sales Price (from 2015 to 2016) 4.9% Annualized Time Trend from Department of Revenue 7.50% 2012 Coefficient of Dispersion Coefficient of Dispersion Coefficient of Dispersion Coefficient of Dispersion Coefficient of Dispersion 8.6 Assessment 2012 Total Number of Sales in the Ratio Study 326 Assessment 2013 Total Number of Sales in the Ratio Study 481 Assessment 2014 Total Number of Sales in the Ratio Study 578 Assessment 2015 Total Number of Sales in the Ratio Study 586 Assessment 2016 Total Number of Sales in the Ratio Study 747 ¹Year indicated is for the assessment year, the data provided is for the previous year. ²Summary Data for State Board of Review 2012, 2013, 2014, 2015 and 2016 MN Department of Revenue Board of Appeal and Equalization City of Moorhead, MN March 23,
14 Residential Assessment Overview Once again the residential market in Moorhead increased in the number of sales and sale prices for the third straight year. The number of residential arms-length sales increased to 747 for this year s sales study, a 27% increase over the previous year. The median sale price increased nearly 5% to $160,000. A maintaining of low interest rates and a growing economy continue to drive demand for residential property, as well as commercial and apartment property. For the second straight year, the Department of Revenue calculated an annual time trend of 7.5%, or 0.6% per month. When this time adjustment was applied to the residential sales, it decreased the median sale ratio from 93.1% to 88.2%. Our statutory obligation is to have a median ration within the range of 90% - 105%. Traditionally, our policy has been to target 95% - 98% as it is the center of the range and school aid is not discounted due to a lower ratio. Since our adjusted median ratio was below our statutory obligation, we were required to make upward changes to our residential assessment level. A comprehensive sales study was conducted to identify different types of homes, locations, ages, sizes, and styles, where assessed values were either too high or too low when compared to the sales data. Due to this study, many properties in the center of the City will see an increase in assessed value ranging from 10% to 15%. Most newer homes in newer subdivisions only needed to increase 2% to 3%. A very small percentage of residential properties actually received a reduction in value due to the study. After all the adjustments, the median sales ratio sits at 95.26%, with a COD* of 7.30 and a PRD* of 1.01; which puts us into compliance. *A measurement of appraisal quality is the coefficient of dispersion (COD). It measures the average percentage by which individual ratios vary from the median ratio. A low COD (15.0 or less) indicates that appraisals within the class of property are uniform; a high COD indicates that properties are being appraised at inconsistent percentages of market value. *The price related differential (PRD) measures the relationship between the mean ratio and the aggregate mean ratio. A PRD greater than 1.00 would show that high-value properties are under-appraised relative to low-value properties. A PRD less than 1.00 indicates that lower priced properties are under-appraised. The Department of Revenue looks for a PRD of 0.97 to In 2015, 2,528 residential properties were inspected as part mass appraisal, representing 21.5% of all residential properties in Moorhead. In comparison, prior to using the new CAMA, mass appraisal counts totaled 1,400 in 2013, 552 in 2012, and 1,308 in For the 2016 Assessment, 319 parcels were impacted by changes due to remodeling permits, adding approximately $3.65 Million in new value. Moorhead had 290 parcels of under construction/completed new home construction, which added approximately $43.7 Million in new value. 197 new 1, 2, and 3 family housing permits were issued in Based on information supplied by City Planning, there are approximately 144 platted, fully serviced lots in inventory. In addition, 223 partially-serviced lots are scheduled to be fully-serviced with streets and utilities in 2016, a 2-year supply based on current construction trends Board of Appeal and Equalization City of Moorhead, MN March 23,
15 City of Moorhead Sales Ratio Group Statistics Wed, March 23, :19 AM Page 1 Study Name Study Date Table Basis A /01/ /30/2015 Main Tables PDFs Time Adj. NUTC 1, per month. Study Date 01/02/ Group Tally Number of sales in group = 753 Deeds: 0; Contracts: 0; Other: 753 Value Source: Appraised Values Only. Low Assd Value Mean High Assd Value Total Sale Price 45, , , ,600,424 Land Value 4,500 33,403 50,500 25,152,400 Improvement Value 47, , , ,748,000 Total Assd Value 52, , , ,900,400 Low PIN Statistical Measures High Ratio High PIN Low Ratio Weighted Mean Mean Median Coefficient of Dispersion - Median 7.30 Coefficient of Dispersion - Mean 7.28 Coefficient of Variance - Mean Price Related Differential (PRD) 1.01 Price Related Bias (PRB)
16 Residential Market Trends Median residential property SALE PRICE over the last several assessment years: 2016 Median Sale $169, % from prior year 2015 Median Sale $158, % from prior year 2014 Median Sale $145, % from prior year 2013 Median Sale $132, % from prior year 2012 Median Sale $135, % from prior year 2011 Median Sale $134, % from prior year 2010 Median Sale $131,000 The median sale price has increased substantially each of the last 3 years following a few years of relatively stable prices. The following illustrates the MEDIAN ASSESSED VALUE of a residential property Citywide over the last several assessment years: 2016 Market Value $169, % from prior year 2015 Market Value $150, % from prior year 2014 Market Value $134, % from prior year 2013 Market Value $127, % from prior year 2012 Market Value $127, % from prior year 2011 Market Value $126, % from prior year 2010 Market Value $124,600 The median assessed value increased 12.6% due to rising market values (7.5% time adjustment for 2016), and the strong first-time homebuyer market in the lower range of the housing market. Please remember that the increased median assessed value does not indicate an average increase in value of 12.6%. The average increase in assessed value not due to new construction is 6.9%. Here is the trend of a typical and actual residential property (1300 SF 1950 s rambler) that has been tracked over the last several assessment years: 2016 Market Value $173,400 ($2000 NC) +11.9% from prior year 2015 Market Value $155, % from prior year 2014 Market Value $144, % from prior year 2013 Market Value $139, % from prior year 2012 Market Value $139, % from prior year 2011 Market Value $139, % from prior year 2010 Market Value $139,900 As previously mentioned, with the detailed sales study capabilities of the Vanguard CAMA system in place, all different types of homes changed at different rates depending on styles, locations, conditions, and other factors Board of Appeal and Equalization City of Moorhead, MN March 23,
17 Apartment Sales Ratio Study, Apartment Sales and Market Analysis Sales activity decreased slightly this year, with 11 total apartment sales, only 5 of which were arms-length transactions. Once again, outliers are always expected when examining apartment sales; as we are dealing with a wide range of age, unit sizes, and conditions, with only a small sample size of sales. This year sales represented a variety of locations, styles, sizes, and conditions. Department of Revenue Current Sales Ratio: 81.7% (Valid Sales from 10/2014 to 9/2015) Sales Ratio Acceptable Range: 90% to 105% COD: 5.64 (Under 20 is preferred) PRD: 0.99 (0.98 to 1.03 is preferred) DOR Sales Ratio Order Insufficient valid sales, no adjustment required Our Analysis: With a median sales ratio below 90% and all valid sales falling below a 90% sales ratio, an adjustment was deemed necessary despite only 5 valid sales to keep apartments consistent with market values between 90% and 105%. Rental rates continue to increase while interest rates and vacancy rates remain low, which increases the value of apartment properties. In 2015 every apartment was viewed and entered into the new CAMA. Using both the hybrid cost-market approach and income approach, we discovered the income approach most accurately followed market trends. The income approach was set up using equalized expense ratios and capitalization rates, which were deduced from sales analysis. Rental ranges for different ages and types of apartments were gathered from as many advertised rates as possible. Every apartment was then reassessed using an equalized income approach within the CAMA, adjusting market income and expenses away from the typical rates for factors such as size of the units, quality and condition, age, location, and amenities. Here are the results of the revaluation: Sales Ratio: 93.5% (Acceptable Range: 90% to 105%) COD: 5.17 (Under 20 is preferred) PRD: 0.99 (0.98 to 1.03 is preferred) Average Increase in EMV not due to NC: 13.3% To get an idea of market trends with apartments, note that all apartments were reassessed for the 2012 assessment following a 75.4% median sales ratio. In 2015 this process was repeated due to an 87.9% median sales ratio. Even after a large majority of apartments increased in assessed value last year, the ratio fell below 90% once again this year at 81.7%. We believe the income approach will help keep apartment valuation up to date with the current market Board of Appeal and Equalization City of Moorhead, MN March 23,


18 A2016 APARTMENT SALES YB: 2014 UNITS: 80 SF/UNIT: 1, TH ST S DATE: 7/1/2015 SALE: $8,100,000 $101,250/UNIT YB: 2003 UNITS: 12 SF/UNIT: 1, BELSLY BLVD DATE: 7/10/2015 SALE: $1,025,000 $85,400/UNIT 1Bdrm=20 2Bdrm=48 3Bdrm=12 1Bdrm=4 2Bdrm= TH ST S TH ST S YB: 2007 DATE: 12/16/2011 YB: 2009 DATE: 6/1/2012 UNITS: 90 SALE: $6,999,775 UNITS: 90 SALE: $6,903,000 SF/UNIT: 1,092 $77,800/UNIT SF/UNIT: 1,158 $76,700/UNIT 1Bdrm=12 2Bdrm=60 3Bdrm=18 1Bdrm=19 2Bdrm=53 3Bdrm=


19 A2016 APARTMENT SALES YB: 2006 UNITS: 54 SF/UNIT: 1, ST AVE S DATE: 7/30/2010 SALE: $3,896,900 $72,200/UNIT YB: 2007 UNITS: 114 SF/UNIT: 1, BELSLY BLVD DATE: 2/15/2011 SALE: $7,976,400 $70,000/UNIT 1Bdrm=14 2Bdrm=31 3Bdrm=9 Eff=6 1Bdrm=18 2Bdrm=72 3Bdrm= YB: 1961 UNITS: 4 SF/UNIT: 1, TH 1/2 ST S DATE: 12/31/2014 SALE: $250,000 $62,500/UNIT /0530 YB: 1967 UNITS: 16 SF/UNIT: BROOKDALE RD DATE: 9/29/2015 SALE: $750,000 $46,900/UNIT 2Bdrm=4 1Bdrm=2 2Bdrm=


20 A2016 APARTMENT SALES TH 1/2 ST S TH ST N YB: 1964 DATE: 2/19/2014 YB: 1953 DATE: 2/28/2013 UNITS: 6 SALE: $279,000 UNITS: 8 SALE: $370,000 SF/UNIT: 1,200 $46,500/UNIT SF/UNIT: 539 $46,300/UNIT 1Bdrm=20 2Bdrm=48 3Bdrm=12 1Bdrm= YB: 1955 UNITS: 4 SF/UNIT: TH AVE N DATE: 1/2/2014 SALE: $175,000 $43,800/UNIT YB: 1965 UNITS: 12 SF/UNIT: ND AVE S DATE: 6/1/2012 SALE: $523,000 $43,600/UNIT 2Bdrm=4 1Bdrm=4 2Bdrm=8 3 14


21 A2016 APARTMENT SALES YB: 1965 UNITS: 12 SF/UNIT: TH ST S DATE: 12/31/2013 SALE: $520,000 $43,300/UNIT YB: 1962 UNITS: 4 SF/UNIT: TH 1/2 ST S DATE: 12/27/2013 SALE: $170,000 $42,500/UNIT 1Bdrm=4 2Bdrm=8 2Bdrm= YB: 1962 UNITS: 4 SF/UNIT: TH 1/2 ST S DATE: 5/5/2014 SALE: $165,000 $41,300/UNIT 2Bdrm= YB: 1961 UNITS: 4 SF/UNIT: 1, TH 1/2 ST S DATE: 12/16/2013 SALE: $165,000 $41,300/UNIT 2Bdrm=4 4 15


22 A2016 APARTMENT SALES YB: 1961 UNITS: 4 SF/UNIT: TH ST S DATE: 6/26/2014 SALE: $160,000 $40,000/UNIT YB: 1977 UNITS: 36 SF/UNIT: TH ST S DATE: 6/9/2014 SALE: $1,368,000 $38,000/UNIT 1Bdrm=1 2Bdrm=3 2Bdrm= YB: 1977 UNITS: 20 SF/UNIT: TH ST S DATE: 6/9/2014 SALE: $760,000 $38,000/UNIT YB: 1951 UNITS: 4 SF/UNIT: TH ST S DATE: 12/15/2013 SALE: $151,500 $37,900/UNIT 1Bdrm=5 2Bdrm=14 3Bdrm=1 1Bdrm=2 2Bdrm=2 5 16


23 A2016 APARTMENT SALES YB: 1963 UNITS: 12 SF/UNIT: TH ST S DATE: 11/29/2013 SALE: $452,000 $37,700/UNIT YB: 1977 UNITS: 36 SF/UNIT: TH ST S DATE: 6/1/2014 SALE: $1,332,000 $37,000/UNIT 1Bdrm=7 2Bdrm=5 Eff=6 1Bdrm=6 2Bdrm= TH ST S YB: 1977 DATE: 6/1/2014 UNITS: 36 SALE: $1,260,000 SF/UNIT: 767 $35,000/UNIT Eff=6 1Bdrm=6 2Bdrm=23 3Bdrm= YB: 1993 UNITS: 20 SF/UNIT: TH ST CIR S DATE: 10/31/2013 SALE: $716,000 $35,800/UNIT 1Bdrm=


24 A2016 APARTMENT SALES TH ST S TH AVE S YB: 1961 DATE: 5/2/2014 YB: 1960 DATE: 10/30/2013 UNITS: 4 SALE: $130,750 UNITS: 4 SALE: $109,480 SF/UNIT: 672 $32,700/UNIT SF/UNIT: 664 $27,400/UNIT 1Bdrm=1 2Bdrm=3 1Bdrm= TH ST S TH ST S YB: 1924 DATE: 3/13/2015 YB: 1918 DATE: 3/13/2015 UNITS: 8 SALE: $185,000 UNITS: 8 SALE: $185,000 SF/UNIT: 560 $23,100/UNIT SF/UNIT: 585 $23,100/UNIT Eff=4 1Bdrm=4 1Bdrm=6 2Bdrm=2 7 18
25 A2016 Assessment Parcel # Address GEO Sale Date Sale $ A16 VALUE Ratio /2 St S College 12/31/14 $250,000 $186, th St S South 7/1/15 $8,100,000 $7,532, / Brookdale Rd South 9/29/15 $750,000 $698, th St S College 3/13/15 $185,000 $174, th St S College 3/13/15 $185,000 $180, Belsly Blvd South 7/10/15 $1,025,000 $1,037,
26 Commercial/Industrial Sales Ratio and Market Analysis Between October 2014 and September 2015, 12 valid commercial sales fell into the current sales study, which are enough to generate a stand-alone Commercial/Industrial ratio. These sales represent a large cross-section of properties, with a variety of age ranges, property uses, and conditions. Due to the small sample size, statistical measures are highly affected by outliers. Since Commercial/Industrial properties can range from a $30,000 metal pole building to a $3,000,000 manufacturing plant, some outliers are to be expected. Department of Revenue Current Sales Ratio: 97.4% (Valid Sales - October 2013 to September 2014) Sales Ratio Acceptable Range: 90% to 105% COD: (Under 20 is preferred) PRD: 1.01 (0.98 to1.03 is preferred) DOR Sales Ratio Order: Values are acceptable as is, No Adjustment Required Our Analysis: Although the median sales ratio lies directly in the middle of the acceptable range at 97.4%, one segment of the market needed to be addressed in warehouse/shop/general purpose buildings. Sales from the last two years of these types of properties were analyzed and all properties in this segment of the commercial class were revalued based on the sales data. This revaluation impacted just over 300 properties, and resulted in the following: Comm/Ind Sales Ratio: 97.42% (Acceptable Range: 90% to 105%) COD: 9.27 (Under 20 preferred) PRD: 1.03 (0.98 to 1.03 is preferred) Increase in Comm/Ind EMV not due to NC: 2.58% As you can see from the reduced Coefficient of Dispersion (COD), revaluation of warehouses/shops/general purpose buildings resulted in a more uniformed and equalized assessment. This will also help prevent unacceptably low commercial sales ratios in future years assessments. Effective Tax Rate: Moorhead is classified by the state legislature as a Border City. As a Border City, Commercial/Industrial and Apartment property in Moorhead is granted an effective tax rate lower than the actual tax rate, with the state making up the difference. For the taxes payable in 2013 the effective tax rate was 2.3%. For 2014 the legislature revised the statute to decrease the effective tax rate to 1.9%. For taxes payable starting in 2015, the rate was again reduced to 1.6%. *Apartment properties now benefit from the same Boarder City tax rate as commercial properties do, as the net tax rate for apartments has reached the 1.6% threshold for taxes payable in This is a direct result of the increased school referendum passed in 2015, which increased the tax rate on apartments to 1.68% Board of Appeal and Equalization City of Moorhead, MN March 23,


27 A2016 COMMERCIAL SALES YB: 2005 RETAIL/OFFICE SIZE: 29,669 SF BUILDING: $77/SF 805/819 30TH AVE S DATE: 10/1/2014 SALE: $3,000,000 LAND: $725,200 OAR: $101/SF YB: 2000 OFFICE SIZE: 10,702 SF BUILDING: $96/SF 1500/ AVE S DATE: 2/26/2015 SALE: $1,269,475 LAND: $242,400 OAR: $119/SF YB: 1975 OFFICE SIZE: 19,672 SF BUILDING: $37/SF 725 CENTER AVE DATE: 10/28/2014 SALE: $1,090,261 LAND: $360,200 OAR: $55/SF YB: 2003 OFFICE SIZE: 4,184 SF BUILDING: $118/SF TH AVE S DATE: 7/15/2015 SALE: $627,000 LAND: $132,400 OAR: $150/SF 1 21
28 A2016 COMMERCIAL SALES /80/ TH AVE S TH AVE S YB: 1977/1979 DATE: 12/30/2014 YB: 1968 DATE: 11/28/2014 WAREHOUSE SALE: $530,000 SHOP/OFFICE SALE: $370,000 SIZE: 8,528 SF LAND: $321,400 SIZE: 9,676 SF LAND: $156,500 BUILDING: $24/SF OAR: $62/SF BUILDING: $22/SF OAR: $38/SF TH ST S TH ST S YB: 2009 DATE: 12/18/2014 YB: 1975 DATE: 10/31/2014 WAREHOUSE SALE: $350,000 SHOP/OFFICE SALE: $325,000 SIZE: 4,800 SF LAND: $50,100 SIZE: 5,500 SF LAND: $64,900 BUILDING: $62/SF OAR: $73/SF BUILDING: $47/SF OAR: $59/SF 2 22


29 A2016 COMMERCIAL SALES YB: 1956 GAS STATION SIZE: 2,020 SF BUILDING: $8/SF 721 HWY 75 N DATE: 8/25/2015 SALE: $250,000 LAND: $232,900 OAR: $18/SF YB: 2003 WAREHOUSE SIZE: 4,000 SF BUILDING: $51/SF ND AVE S DATE: 1/6/2015 SALE: $235,000 LAND: $32,600 OAR: $59/SF /40/50 YB: 1956 GAS STATION SIZE: 2,030 SF BUILDING: $12/SF 1329 MAIN AVE DATE: 8/11/2015 SALE: $130,000 LAND: $105,300 OAR: $64/SF YB: 1953 SHOP/OFFICE SIZE: 3,180 SF BUILDING: $28/SF ST AVE S DATE: 8/31/2015 SALE: $100,000 LAND: $10,900 OAR: $31/SF 3 23
30 A2016 Commercial Sales Ratio After Reassessment Parcel Address Sale Date Sale Amount A16 Value A16 NC Ratio TH AVE S 2/26/15 $1,269,475 $1,065, % TH ST S 12/18/14 $350,000 $311, % ND AVE S 1/6/15 $235,000 $212, % TH AVE S 7/15/15 $625,000 $587, % ST AVE S 8/31/15 $100,000 $95, % TH AVE S 11/28/14 $370,000 $356, % CENTER AVE 10/28/14 $1,090,261 $1,237,200 $163, % TH AVE S 10/17/14 $3,000,000 $3,011, % HWY 75 N 8/25/15 $250,000 $253, % TH ST S 10/31/14 $325,000 $335, % TH AVE S 12/30/14 $530,000 $552, % MAIN AVE 8/11/15 $130,000 $195, % TOTALS n/a n/a $8,274,736 $8,214,300 $163, % Median Ratio: 97.42% AAD: 9.03% COD: 9.27 PRD 1.03 A2016 Warehouse Market Sales Ratio BEFORE Reassessment A2016 Warehouse Market Sales Ratio AFTER Reassessment Parcel Sale Date Sale Amount A15 Value n/a Ratio Parcel Sale Date Sale Amount A16 Value A16 NC Ratio /18/14 $350,000 $211, % /14/14 $4,300,000 $3,179, % /6/15 $235,000 $152, % /18/14 $350,000 $311, % /14/14 $4,300,000 $3,043, % /0080 4/10/15 $900,000 $802, % /17/14 $850,000 $666, % /6/15 $235,000 $212, % /0020 6/1/15 $2,274,000 $1,813, % /0020 6/1/15 $2,274,000 $2,155, % /0052 1/29/15 $225,000 $195, % /17/14 $850,000 $812, % /0080 4/10/15 $900,000 $789, % /31/15 $100,000 $95, % /31/15 $100,000 $90, % /28/14 $370,000 $356, % /28/14 $370,000 $356, % /23/14 $185,000 $179, % /23/14 $185,000 $179, % /13/14 $250,000 $242, % /13/14 $250,000 $242, % /23/14 $110,000 $183,500 $73, % /31/14 $325,000 $323, % /0052 1/29/15 $225,000 $226, % /23/14 $110,000 $109, % /31/14 $325,000 $335, % /80/90 12/30/14 $530,000 $570, % /80/90 12/30/14 $530,000 $552, % /30/14 $154,000 $184, % /30/14 $154,000 $168, % TOTALS n/a $11,158,000 $8,928,200 n/a 80.02% TOTALS n/a $11,158,000 $9,813,900 $73, % Median Ratio: 90.40% Median Ratio: 96.32% *Luxsun condos were removed from this analysis as those are AAD: 12.50% AAD: 5.48% new repetitive sales skewing the ratio into compliance for this COD: COD: 5.69 year. PRD: 1.11 PRD: 1.10 *Luxsun condos were removed from this analysis as those are new repetitive sales skewing the ratio into compliance for this year. 24

31 A2016 WAREHOUSE SALES / HWY 10 E YB: 1996/2000/2011 DATE: 6/1/2015 SIZE: 16,063 SF SALE: $2,274,000 OAR: $141.57/SF LAND: $863,100 BUILDING RATE = $87.84/SF TH ST S #H YB: 2014 DATE: 12/31/2014 SIZE: 784 SF SALE: $68,000 OAR: $86.73/SF LAND: $3,300 BUILDING RATE = $82.53/SF TH ST S #I YB: 2014 DATE: 11/1/2014 SIZE: 784 SF SALE: $66,900 OAR: $85.33/SF LAND: $3,300 BUILDING RATE = $81.12/SF TH ST S #F YB: 2014 DATE: 11/30/2015 SIZE: 1,200 SF SALE: $99,500 OAR: $82.92/SF LAND: $5,200 BUILDING RATE = $78.58/SF 1 25
32 A2016 WAREHOUSE SALES ST ST S #K YB: 2014 DATE: 6/3/2015 SIZE: 672 SF SALE: $54,900 OAR: $81.70/SF LAND: $2,800 BUILDING RATE = $77.53/SF TH ST S #K YB: 2014 DATE: 10/13/2015 SIZE: 672 SF SALE: $54,900 OAR: $81.70/SF LAND: $2,800 BUILDING RATE = $77.53/SF TH ST S #N TH ST S #J YB: 2014 DATE: 11/26/2014 YB: 2014 DATE: 11/26/2014 SIZE: 672 SF SALE: $54,900 SIZE: 784 SF SALE: $63,900 OAR: $81.70/SF LAND: $2,800 OAR: $81.51/SF LAND: $3,300 BUILDING RATE = $77.53/SF BUILDING RATE = $77.30/SF 2 26
33 A2016 WAREHOUSE SALES ST ST S #G YB: 2014 DATE: 10/30/2015 SIZE: 1,200 SF SALE: $97,000 OAR: $80.83/SF LAND: $5,200 BUILDING RATE = $76.50/SF TH ST S #E YB: 2014 DATE: 2/24/2015 SIZE: 1,200 SF SALE: $94,900 OAR: $79.08/SF LAND: $5,200 BUILDING RATE = $74.75/SF TH ST S #B YB: 2014 DATE: 12/30/2014 SIZE: 1,400 SF SALE: $109,900 OAR: $78.50/SF LAND: $6,100 BUILDING RATE = $74.14/SF TH ST S #C YB: 2014 DATE: 4/9/2015 SIZE: 1,400 SF SALE: $109,900 OAR: $78.50/SF LAND: $6,100 BUILDING RATE = $74.14/SF 3 27


34 A2016 WAREHOUSE SALES ST ST S #A YB: 2014 DATE: 10/30/2015 SIZE: 1,400 SF SALE: $97,000 OAR: $69.29/SF LAND: $6,100 BUILDING RATE = $64.93/SF TH ST S YB: 2009 DATE: 12/18/2014 SIZE: 4,800 SF SALE: $350,000 OAR: $72.92/SF LAND: $50,100 BUILDING RATE = $62.48/SF TH AVE S / ND AVE S YB: 2006 DATE: 10/14/2014 YB: 2005 DATE: 4/10/2015 SIZE: 66,278 SF SALE: $4,300,000 SIZE: 11,700 SF SALE: $900,000 OAR: $64.88/SF LAND: $319,300 OAR: $76.92/SF LAND: $244,200 BUILDING RATE = $60.06/SF BUILDING RATE = $56.05/SF 4 28


35 A2016 WAREHOUSE SALES ND AVE S YB: 2003 DATE: 1/6/2015 SIZE: 4,000 SF SALE: $235,000 OAR: $58.75/SF LAND: $32,600 BUILDING RATE = $50.60/SF TH ST S YB: 1975 DATE: 10/31/2014 SIZE: 5,500 SF SALE: $325,000 OAR: $59.09/SF LAND: $64,900 BUILDING RATE = $47.29/SF TH ST S YB: 1960 DATE: 11/16/2015 SIZE: 1,500 SF SALE: $67,900 OAR: $45.27/SF LAND: $9,400 BUILDING RATE = $39.00/SF TH AVE S YB: 2007 DATE: 12/17/2014 SIZE: 16,872 SF SALE: $850,000 OAR: $50.38/SF LAND: $193,500 BUILDING RATE = $38.91/SF 5 29


36 A2016 WAREHOUSE SALES / TH AVE S YB: 2001 DATE: 6/21/2013 SIZE: 26,980 SF SALE: $1,675,000 OAR: $62.08/SF LAND: $643,500 BUILDING RATE = $38.23/SF TH ST N YB: 1960 DATE: 10/5/2015 SIZE: 1,259 SF SALE: $120,000 OAR: $95.31/SF LAND: $75,100 BUILDING RATE = $35.66/SF / ST ST S YB: 2006 DATE: 6/28/2013 SIZE: 22,320 SF SALE: $1,200,000 OAR: $53.76/SF LAND: $423,900 BUILDING RATE = $34.77/SF / TH AVE S YB: 1996 DATE: 1/29/2015 SIZE: 2,880 SF SALE: $225,000 OAR: $78.13/SF LAND: $125,700 BUILDING RATE = $34.48/SF 6 30


37 A2016 WAREHOUSE SALES TH ST N YB: 1958 DATE: 1/23/2014 SIZE: 4,100 SF SALE: $185,000 OAR: $45.12/SF LAND: $56,300 BUILDING RATE = $31.39/SF TH AVE S YB: 1980 DATE: 9/13/2014 SIZE: 6,454 SF SALE: $250,000 OAR: $38.74/SF LAND: $58,100 BUILDING RATE = $29.73/SF ST AVE S YB: 1953 DATE: 8/31/2015 SIZE: 3,180 SF SALE: $100,000 OAR: $31.45/SF LAND: $10,900 BUILDING RATE = $28.02/SF / MAIN AVE SE YB: 1953 DATE: 1/24/2014 SIZE: 6,300 SF SALE: $600,000 OAR: $95.24/SF LAND: $424,400 BUILDING RATE = $27.87/SF 7 31


38 A2016 WAREHOUSE SALES /80/ TH AVE S YB: 1977/1979 DATE: 12/30/2014 SIZE: 8,528 SF SALE: $530,000 OAR: $62.15/SF LAND: $319,500 BUILDING RATE = $24.68/SF TH AVE N YB: 1964 DATE: 5/23/2014 SIZE: 3,696 SF SALE: $110,000 OAR: $29.76/SF LAND: $35,700 BUILDING RATE = $20.10/SF HWY 75 N YB: 1973 DATE: 5/30/2014 SIZE: 4,860 SF SALE: $154,000 OAR: $31.69/SF LAND: $56,600 BUILDING RATE = $20.04/SF TH AVE S YB: 1968 DATE: 11/28/2014 SIZE: 14,156 SF SALE: $370,000 OAR: $26.14/SF LAND: $156,500 BUILDING RATE = $15.08/SF 8 32
39 SECTION 3 City of Moorhead, Minnesota General Overall City Statistics 1. Total EMV taxable real property $2,926,588,100 Preliminary 2016 CAMA data 2. Change in EMV of taxable real property from 2015 $259,946,300 (Growth between 2015 Spring Mini-Abstract and 2016 CAMA data) 3. Change in EMV of taxable real property from $82,306,600 New Construction 4. Change in EMV of taxable real property from $177,639,700 Local Effort, Demolition, Taxable/Exempt status Residential 2014 Spring Mini $1,578,655, Spring Mini $1,893,184, CAMA Data $2,070,134,700 Apartment 2014 Spring Mini $262,010, Spring Mini $296,869, CAMA Data $341,402,800 Commercial 2014 Spring Mini $358,946, Spring Mini $383,120, CAMA Data $401,301,600 Industrial 2014 Spring Mini $61,203, Spring Mini $61,218, CAMA Data $61,407, Board of Appeal and Equalization City of Moorhead, MN March 23,
40 SECTION 4 What is New or Changed? Vanguard CAMA System: For last year s assessment, all residential properties were converted over to the new CAMA system. This year, all apartments were fully integrated as well. Each property was viewed, sketched, cost out using Vanguard s cost manual, and input into the Income Module within the system. Using the hybrid cost/market approach and the income approach, we found that the income approach was the most consistent with market trends. It is our belief that apartment properties are bought and sold based on the income they bring in, so we migrated completely to the income approach to value apartments using the Income Module developed within the CAMA system. The three components of the income approach are the income, expenses, and capitalization rates. As many advertised rental figures as possible were gathered to determine typical market rental rates for apartments of different ages, styles, sizes, locations, quality, and condition. Expense ratios and capitalization rates were deduced from the recent sales data on apartments. Each apartment parcel valuation was then built one-by-one, and a determination was made on whether that parcel s market rent, expenses, and capitalization rates were average for its type, or above or below average. We believe the result is a fair, consistent, and equalized assessment of all apartment properties in Moorhead based on the market income they bring in. Miscellaneous Department of Revenue Directives: The Department of Revenue provided clarification on the valuation of billboard and cell tower lease sites, agricultural containment facilities, contamination tax, and underground storage tanks. Please see the attached educational memos regarding each of these. Flood Plain: A comprehensive sales study was conducted this winter regarding properties located in the flood plain. The results show that in the current market, the value of a property located in the flood plain is not negatively impacted. In fact, it appears due to the natural amenities that typically come with those properties, those properties often sell for a premium compared to the typical residential property. Because of this discovery, all obsolescence previously placed on flood-impacted property was removed for this year s assessment. Please see the attached educational memos regarding this study Board of Appeal and Equalization City of Moorhead, MN March 23,
41 Tax Court Activities: Active tax court cases are the following: Property Owner Assessment Year(s) Status Menards 2011/2012/2013/2014/2015 Under Appeal Valuation Issue Drywall Supply Inc. 2012/2013/2014 Settled Valuation Issue CIII Asset Management, LLC 2013/2014 Settled (Easten) Valuation Issue Supervalu 2013/2014 Pending Court (Hornbachers) The filing deadline for tax court is April 30, 2016 for the 2015 assessment Board of Appeal and Equalization City of Moorhead, MN March 23,
42 ADDENDUM 2016 Board of Appeal and Equalization City of Moorhead, MN March 23,
43 Understanding Property Taxes 12a Property Tax Fact Sheet 12a Fact Sheet This fact sheet is the first in a series of three fact sheets that were designed to assist taxpayers in the understanding of the basic concepts of their annual assessment and property tax administration. Please see Fact Sheets 12b and 12c for additional information. Why do we have property taxes? The money raised by property taxes is a major source of funding for school districts, cities and townships, counties, and special taxing districts. Local property taxes help fund many programs and services including public schools, fire stations, police protection, streets, libraries, and more. Certain types of properties including seasonal/cabin, commercial/industrial, and un-mined iron ore are also subject to a state-level property tax. Receipts from this state general tax go into the general fund. A key benefit of the property tax system is that the revenue it raises tends to remain stable. Compared with sales or income taxes, the property tax is less susceptible to recessions or other changes in income or spending trends. In addition, since local jurisdictions only levy what they need to cover their annual needs, there is no surplus or deficit. What affects my property tax bill? Government spending and revenues will affect your tax bill the most. If spending increases or revenues from other sources such as state aid decrease, your property taxes may increase. Conversely, if spending decreases or revenue from other sources increases, you may see a decrease in your property tax bill. Since property taxes are levy-based, it is possible to have your property tax increase while your market value decreases and vice versa. Your share of the overall property tax levy is determined by the market value and classification of your property. The estimated market value and classification of your home are determined by the Property Tax Division - Mail Station 3340 St. Paul, MN Revised 08/11 assessor as of January 2 of each year. Assessors estimate the value of your property using historical sales of similar properties. There is no direct relationship between estimated market value and property tax liability. Instead, your property s taxable market value is used to determine how much property tax is due. These two values may differ for a number of reasons, including tax deferral programs, homestead and other value exclusions, or reductions for specific types of property. The classification of your property is based on its use on January 2. Each class of property (residential, apartment, cabin, farm, commercial, etc.) has a different classification rate. These rates are set by the Legislature and calibrated so that some property types pay a greater share of the property tax than others. For example, commercial properties pay more than residential homesteads and agricultural properties. How are my taxes determined? First, each local jurisdiction will determine the revenue needed from property taxes. This amount the levy is calculated by subtracting all non-property tax revenue from the total proposed budget. Total Proposed Local Budget -- All non-property tax revenue (state aid, fees, etc.) = Property tax revenue needed (levy) The levy is then spread among all taxable properties according to their net tax capacity. A property s tax capacity is calculated by multiplying the taxable market value by the state-mandated classification rate. (Taxable Market Value) x (Class Rate) = Tax Capacity This fact sheet is intended to help you become more familiar with Minnesota tax laws and your rights and responsibilities under the laws. Nothing in this fact sheet supersedes, alters, or otherwise changes any provisions of the tax law, administrative rules, court decisions, or other revenue notices. Alternative formats available upon request. Minnesota Revenue, Understanding Property Taxes 1 37
44 The final step is to calculate the local property tax rate by dividing the property tax revenue needed in a jurisdiction by its total tax capacity. Local Tax Rate = (Property tax revenue needed) (Total Tax Capacity) The county auditor will also calculate and apply any credits, referendum levies, and the state general tax (for certain types of property). Combining the above calculations, the basic formula to determine an individual property s tax amount is: Taxable Market Value x Class Rate = Tax Capacity x Local Tax Rate = Base Tax -- Credits + Referendum Amounts + State General Tax = Total Property Tax Payable What is a Truth in Taxation notice? Every year, after November 10, but before November 25, all property owners receive a Truth-in-Taxation notice by mail. The notice contains: valuation and classification information on your property for the current and previous assessment years; your current-year property tax amounts; and an estimate of how your taxes may change based on your taxing district and local budget decisions for the following year. Property Tax Statement The County Treasurer s Office mails a tax statement to property owners by March 31 of each year. The statement provides an itemized list of the property tax due to each taxing authority. The dollar amounts must be listed separately for the state general tax (if applicable), county, municipality or township, voterapproved school tax, other local school tax, and other special taxing districts. The statement must also include any tax on contamination value and any other special assessments on the property. Real property taxes are due in equal installments on May 15 and October 15 of each year (unless the amount is $50 or less [$250 or less starting with taxes payable in 2010] in which case taxes are due in full on May 15). If a property is classified as agricultural property, the 2 nd half is not due until November 15. Conclusion In conclusion, it is essential that taxpayers understand that there is no direct relationship between estimated market value and property tax revenue. It is possible to have your property tax increase while your market value decreases and vice versa. Government spending and revenues will affect your tax bill the most. For additional information, please refer to Fact Sheet 12b How the Assessor Estimates Your Market Value and Fact Sheet 12c Understanding Your Assessment and the Appeals Process. The Truth-in-Taxation notices are required to show dates, times, and places for the scheduled meetings in which the budget and levy will be discussed and finalized. These meetings must occur after November 24. The public must be allowed to speak at these meetings for the city, county, and school district and they must not be held prior to 6 p.m. These meetings are held to give taxpayers an opportunity to voice their concerns over the jurisdiction s proposed budget. They are not a forum for taxpayers to appeal their market value or their individual proposed property tax amounts. Minnesota Revenue, Understanding Property Taxes 2 38
45 How the Assessor Estimates Your Market Value 12b Property Tax Fact Sheet 12b Fact Sheet This fact sheet is the second in a series of three fact sheets that were designed to assist taxpayers in the understanding of the basic concepts of their annual assessment and property tax administration. Please see Fact Sheets 12a and 12c for additional information. Property Tax Assessment Process Minnesota has what is known as an ad valorem property tax. This means property tax is divided among taxable properties according to their value. The final amount of property tax the owner of a property pays in any given year is the end result of a process that begins over two years before property tax statements are actually mailed to property owners. The process begins with the assessor collecting data on sales of properties within the market during a specific time period between October of one year and September of the following year (this period is known as a sales study period). Over the next several months and by using mass appraisal techniques, assessors analyze the data in order to estimate each property s market value for the next assessment (January 2). Pursuant to Minnesota Statutes, section assessors must estimate the value of property at a value that would represent what the property would sell for in an open-market arm s length transaction on January 2 of each year. The assessor cannot adopt a higher or lower standard of value because the value will be used for the purposes of taxation. Assessors also classify property according to its use on January 2. Between April and June, taxpayers have an opportunity to appeal both the estimated market value and the classification of their property. Values and classifications are generally finalized July 1 of each year. Local units of government then finalize their estimated budgets for the upcoming year. Once the budgets are finalized in December, the market values and classifications are used to divide the overall tax levy among all taxable properties. Tax statements are mailed by the following March 31. For example, sales of properties that occur between October 1, 2008 and September 30, 2009 are used by assessors to estimate a property s market value for the January 2, 2010 assessment. Following an appeal process that occurs between April 1, 2010 and June 30, 2010, the valuations and classifications generally become final on July 1, This lengthy time frame may result in a significant difference between actual sales prices occurring in the current market and assessors estimated market values for the current year s assessment. Using the final values and the local jurisdictions proposed budgets, the auditor then estimates each property s proposed taxes payable for After public budget meetings are held and final budget numbers are adopted, property tax statements are mailed to taxpayers by March 31, In summary, sales taking place from October 2008 to September 2009 are used to estimate a property s market value as of January 2, 2010 which will in turn be used to calculate property taxes payable in What is the role of the assessor? Assessors use historical sales in order to estimate each property s market value as of the assessment date (January 2) of each year. The assessor also classifies the property according to its use on January 2 of each year. Assessors also review other quantifiable data such as supply/demand, marketing times, sales concessions, vacancy rates, etc. to help in analyzing whether a market is increasing, stable, or decreasing. During increasing markets, this may benefit some property owners because a buyer may pay a price that is significantly higher than the assessor placed on the property for the last assessment. For example, if a property is valued by the assessor at $180,000 for the 2009 assessment (based on sales that occurred between October 2007 and September 2008), and it sells for $230,000 in August 2009, the new property owner is benefiting from the lower market value for the 2009 assessment which will be used to calculate taxes payable in The August 2009 sale of the property will be included in the study period of October 2008 to September 2009 which the Property Tax Division - Mail Station 3340 St. Paul, MN Revised 07/09 This fact sheet is intended to help you become more familiar with Minnesota tax laws and your rights and responsibilities under the laws. Nothing in this fact sheet supersedes, alters, or otherwise changes any provisions of the tax law, administrative rules, court decisions, or other revenue notices. Alternative formats available upon request. Minnesota Revenue, How the Assessor Estimates Your Market Value 1 39
46 assessor will use to value property for the 2010 assessment for taxes payable in This same lag time is also present in declining markets. For example, if the assessor places a market value of $200,000 on a property for the 2009 assessment (again using sales that occurred between October 2007 and September 2008), but the property sells for $175,000 in August 2009, does it mean the January 2, 2009 assessed value is incorrect? Not necessarily. It could signal a downturn in the housing market just began to occur between September 2008 and August The assessor will use the August 2009 sale as well as others occurring in the market to estimate 2010 market values. The assessor does not raise property tax revenues by increasing values. Total property tax revenues are a function of county, school district, and city/town spending as well as state-paid local government aid and other factors. The value and classification of the property are merely a way to divide the total property tax levy among all taxpayers. The total amount of the levy will be collected whether values increase or decrease from one year to the next. An individual s share of the overall tax burden may change from year to year, however. What are sales ratio studies? Sales ratios show the relationship between the assessor s estimated market value on a property and the actual sale price of a property. Each year the assessor performs sales ratio studies on properties that have sold in their jurisdiction. These sales are stratified many different ways including by location and property type (residential, agricultural, commercial, etc.). The sales can also be stratified further such as by home style, subdivision, age of structure, location on or off water frontage, price range, etc. A single sale may not represent the true market activity. Rather, sales of all properties are reviewed to determine market trends. However, even if there are no sales occurring within the sales ratio study period, assessors are still expected to use their professional judgment and knowledge of the local market to annually value properties in their jurisdiction. Whenever any real estate is sold for a consideration in excess of $1,000, a Certificate of Real Estate Value (CRV) is filed. These CRVs are the foundation of all sales ratio studies because they contain important information about each transaction. Assessors then verify the information contained on the CRV in order to determine whether or not the sale represents an open-market arm s length transaction. If the sale does not represent an open-market, arm s length transaction, it may not be used in the sales ratio study. Simply having an extremely high or low sales ratio is not a valid reason to remove a sale from the sales ratio study. Rather, the extreme ratio indicates a need for additional investigation by the assessor. Again, sales ratio study periods are generally October 1 of a given year to September 30 of the following year. For example, for the 2010 assessment, assessors use sales that took place between October 1, 2008 and September 30, This is the reason that assessors market values may lag a bit behind current market activity. Assessors will use the median sales ratio as the statistical measure of the overall level of assessment. The median ratio is the middle ratio of all the ratios when they are arranged in order from highest to lowest (or vice versa). The median is used because it is not affected by extreme ratios. Department of Revenue guidelines indicate that the median ratio of a sales ratio study should be between 90 and 105 percent. Is it possible for the values of some properties to decrease while others increase? Yes. Each segment of the market is different. Sales prices of certain types of properties can vary widely. Currently, sales of both farmland and recreational properties are strong and show appreciation. However, the sales of residential properties are stable or declining in some areas. Sometimes it can be difficult to estimate the rate at which a market is increasing or declining. Ideally, a property would sell twice within a certain period of time, such as one year, but all other characteristics of the property would remain the same. That way an appraiser or assessor would be able to isolate a time adjustment to indicate whether the market is increasing or decreasing or simply remaining stable. Do all areas increase or decline at the same rate? No. Some areas or neighborhoods are declining at a much faster rate than others that are showing stable values or values that are slightly increasing. Conclusion In conclusion, it is essential that taxpayers understand that there may be a legitimate reason for the assessor s annual market value to be different from current market conditions due to the lag time between sales study periods and sales taking place today. For additional information, please refer to Fact Sheet 12a Understanding Property Taxes and Fact Sheet 12c Understanding Your Assessment and the Appeals Process. Minnesota Revenue, How the Assessor Estimates Your Market Value 2 40
47 Understanding Your Assessment and the Appeals Process Property Tax Fact Sheet 12c 12c Fact Sheet This fact sheet is the third in a series of three fact sheets that were designed to assist taxpayers in the understanding of the basic concepts of their annual assessment and property tax administration. Please see Fact Sheets 12a and 12c for additional information. The role of the assessor The assessor has an important role in the property tax process in that it is very important to make sure all property is valued at its market value and classified according to its use so the property tax levy is divided correctly among all taxable properties. The assessor does not determine your property taxes. Likewise, assessors do not raise revenue by increasing market values. This fact sheet discusses estimated market value and classification. The assessor determines these factors each year, and they are shown annually on your Notice of Valuation and Classification. This fact sheet also explains what you can do if you and the assessor disagree about the value or classification of your property. How is my property value estimated? Using a mass appraisal system and historical sales data, the assessor s job is to estimate the market value of all properties on the assessment date of January 2 each year. The assessor will consider the location of your property, the amount of land you own, any improvements to the land, physical characteristics of the improvements (including square footage, decks, porches, etc.), and the quality of construction. The assessor will then compare your property to similar properties in your area that have recently sold in order to estimate what your property would sell for in an open-market arm s length transaction. This value is called the estimated market value. Classification and class rates All property is classified by the assessor according to its use. Each class of property (home, apartment, cabin, farm, commercial) has its own classification rate. This class rate is determined by the state legislature. Like market value, the class rate of your property plays a role in how much property tax you pay. Notice of valuation and classification Each spring, the assessor will mail you a Notice of Valuation and Classification informing you of the market Property Tax Division - Mail Station 3340 St. Paul, MN value and classification of your property. If you believe the classification or the estimated market value of your property is incorrect, you have several appeal options. What if I disagree with how my property was assessed? If you have a disagreement over valuation or classification of your property, the first step is to contact your assessor. Most issues can be resolved at this level. Verify information about your property, such as its dimensions, age, and condition of its structures. Review records to determine the market values of similar properties in your neighborhood. Review sales data to find out what similar properties in your area are selling for. Ask the assessor to explain the criteria used for classifying your property. You may also review the classifications of other properties used in the same manner as yours. If your property has not be inspected recently, both interior and exterior, ask the assessor to come out to review your property. If your concern is not resolved after conferring with the assessor, you may attend the annual Local Board of Appeal and Equalization or Open Book meeting identified on your valuation notice. Appealing your assessment There are formal methods of appeal available. Keep in mind that, by law, the Local Board of Appeal and Equalization cannot make a change favoring a taxpayer if the assessor is not allowed to inspect the property. You have the right to appeal your market value estimate and/or property classification if you feel your property is: Classified improperly. Valued at an amount higher or lower than you could sell your property for. Valued at a level different from similar property in your area. This fact sheet is intended to help you become more familiar with Minnesota tax laws and your rights and responsibilities under the laws. Nothing in this fact sheet supersedes, alters, or otherwise changes any provisions of the tax law, administrative rules, court decisions, or other revenue notices. Alternative formats available upon request. Revised 07/09 Minnesota Revenue, Understanding Your Assessment and the Appeals Process 1 41
48 Remember, your assessor is not responsible for the dollar amount of taxes that you pay. Tax rates are determined by your local taxing authorities (the city, the county, school, districts, etc.). If you think your taxes are too high, you should make your opinion known to your taxing authorities during the budget meetings in November and December. Local Board of Appeal and Equalization If you choose to appeal to your boards of appeal and equalization, first must first meet with your Local (city or town) Board of Appeal and Equalization. These are often the same people as your city council or town board. The board meets on a specified day in April or May. The exact date is listed on your Notice of Valuation and Classification. We strongly recommend that you contact your city or town clerk to schedule your appearance. Some jurisdictions hold an open book meeting instead of a Local Board of Appeal and Equalization. Please check your Notice of Valuation and Classification for date, time, and place. You may make your appeal in person, by letter, or have someone else appear for you. The assessor will be present to answer questions. You must present your case to the city or town board before going to the County Board of Appeal and Equalization. Cities and towns have the option of transferring their board powers to the County Board of Appeal and Equalization. If your municipality has elected to do this, your Notice of Valuation and Classification will direct you where to begin your appeal. County Board of Appeal and Equalization If you are not satisfied after your Local Board of Appeal and Equalization or open book meeting, or if your city or town has transferred its powers to the county, you may appeal to the County Board of Appeal and Equalization. This board meets in June. The exact date is listed on your Notice of Valuation and Classification. The members are usually the county board of commissioners or their appointees. We strongly recommend that you contact your county auditor or assessor to schedule your appearance before the board. Many counties request that taxpayers make appointments to appear. You may make your appeal in person, by letter, or have someone else appear for you. The assessor will be present to answer questions. If you are not satisfied with the decision of the County Board of Appeal and Equalization, you may appeal to the Minnesota Tax Court. Minnesota Tax Court You have until April 30 of the year the tax becomes payable to appeal your assessment to the Minnesota Tax Court. In other words, you must appeal your 2009 valuation and classification on or before April 30, The Tax Court has two divisions: The Small Claims Division and the Regular Division. The Small Claims Division only hears appeals involving one of the following situations: The assessor s estimated market value of your property is less than $300,000. Your entire parcel is classified as a residential homestead (1a or 1b) and the parcel contains no more than one dwelling unit. Your entire property is classified as an agricultural homestead. You re appealing the denial of a current year application for homestead classification of your property. The proceedings of the Small Claims Division are less formal and many people represent themselves. Decisions made by the small claims division are final and cannot be appealed further. The Regular Division will hear all appeals including those within the jurisdiction of the small claims division. Decisions made here can be appealed to a higher court. Most people who appeal to the regular division hire an attorney because the hearing is conducted according to the Minnesota Rules of Civil Procedure. You may obtain complete information on Tax Court appeals by writing or calling the court administrator in your county or by contacting: Minnesota Tax Court Minnesota Judicial Center Suite Reverend Dr. Martin Luther King, Jr. Boulevard St. Paul, MN (651) Conclusion In conclusion, it is essential that taxpayers understand that assessors use historical sales data to estimate a property s market value. This estimate may be appealed informally by speaking with the assessor or formally by appearing at the Local or County Boards of Appeal and Equalization. For additional information, please refer to Fact Sheet 12a Understanding Property Taxes and Fact Sheet 12b How the Assessor Estimates Your Market Value Minnesota Revenue, Understanding Your Assessment and the Appeals Process 2 42
49 Vanguard Comparable Sales Search The following is an example of a sales comparable search on a typical 1950 s rambler, using the new Vanguard CAMA system. The report created takes the sale price, adjusts that price according to the time adjustment, and finally adjusts to account for differences between the comparable property and the subject property. The end result is a price that the subject property likely would have sold for based on that particular sale. This search does have a few mechanical limitations. Though it can find similar properties with similar amenities, it cannot easily account for different neighborhood types. Because of that, discretion must be used to determine what is a good comparable property based on knowledge of the City. The other substantial limitation involves special assessments. The Estimated Market Value is calculated as a fee simple estate, which is absolute ownership of a property limited only by the four governmental powers: taxation, eminent domain, police power, and escheat. This means that assumed special assessments at the time of sale need to be accounted for when considering the sale price. For example, a home that sells for $200,000 with $25,000 in special assessments assumed by the buyer sold for a $225,000 cashequivalent price. For many newer homes that typically have significant special assessment balances, we need to manually consider that addition when using comparable sales prices Board of Appeal and Equalization City of Moorhead, MN March 23,
50 PDF+PIN Address RD ST S SUBJECT P/SF $ Base Land (SF) 11, $37,400 Style 1 Story Frame Main SF 1,302 $92,000 Addtns SF 0 Qtrs Over Porch SF 0 Garage SF 0 Bsmt/Attic Full / None $17,880 Heat/AC Yes / No TLA/GLA 1,302 1,302/0 Yr/Age/Cond / 62 / NML Rms / Bedrms 9 / 3 Bath Fixtures 2 $2,400 Appliances 0 Bsmt Finish $16,592 Porches 0 SF Decks/Patios 252 SF $630 Veneer 0 LF Fireplace 1 $7,150 Att. Garages 528 SF $13,210 Bsmt Stalls 0 Grade/Mult. 4 / $7,494 Phy. Depr. 26% -$39,803 F/E/Othr 0%/0%/0% Bldg Extras 0 Det. Garages 0 SF Yard Extras 0 Ag Buildings 0 Map Factor PDF+PIN Address Cd/Rec D Analysis info 03/25/2015/ 90,000.00% adj/mo Sale Date/Amt 08/18/2014 $150,000 Time Sale Adj 5 mo /Adj $900 per mo $4,500 Adj Sale Amt $154,500 Base Difference Land (SF) 9, $32,200 $5,200 Qtrs Over Porch SF 0 Garage SF 0 Bsmt/Attic Full / None $17,380 $500 Bsmt/Attic Full / None $17,880 Heat/AC Yes / Yes $2,330 -$2,330 Heat/AC Yes / Yes $2,400 -$2,400 TLA/GLA 1,248 1,248/0 TLA/GLA 1,288 1,288/0 Yr/Age/Cond / 58 / NML Yr/Age/Cond / 57 / A NML Rms / Bedrms 9 / 3 Rms / Bedrms 8 / 3 Bath Fixtures 2 $2,400 Bath Fixtures 2 $2,400 Appliances 0 Appliances 0 Bsmt Finish $18,791 -$2,199 Bsmt Finish $17,510 -$918 Porches 0 SF Porches 0 SF Decks/Patios 0 SF $630 Decks/Patios 80 SF $200 $430 Veneer 0 LF Veneer 0 LF Fireplace 0 $7,150 Fireplace 1 $7,150 Att. Garages Bsmt Stalls Grade/Mult. 4 / $7,004 $490 Phy. Depr. 24% -$35,298 -$4,505 F/E/Othr 0%/0%/0% Mkt Influence TH ST S Rank SF 0 100% P/SF $ $9,190 $4,020 Att. Garages Bsmt Stalls Bldg Extras 0 Bldg Extras 0 Det. Garages 0 SF Det. Garages 0 SF Yard Extras 0 Yard Extras 0 Ag Buildings 0 Ag Buildings 0 Map Factor Map Factor PDF+PIN Address Style 1 Story Frame Style 1 Story Frame Main SF 1,248 $89,980 $2,020 Main SF 1,288 $92,000 Addtns SF 0 Addtns SF 0 Qtrs Over Porch SF 0 Garage SF 0 Grade/Mult. 4+5 / $16,119 -$8,625 Phy. Depr. 18% -$32,927 -$6,876 F/E/Othr 0%/0%/0% Mkt Influence TH ST S Rank SF 0 100% P/SF $ Cd/Rec D E Analysis info 03/25/ ,100.00% adj/mo Sale Date/Amt 03/28/2014 $173,500 Time Sale Adj 10 mo /Adj $1,041 per mo $10,410 Adj Sale Amt $183,910 Base Difference Land (SF) 9, $36,400 $1,000 $21,650 -$8,440 Total (without rounding) Land Dwelling $117,600 Impr. Total $155,000 $154,953 Appraised B of R St Equalized $37,400 Total (without rounding) $143,977 Total (without rounding) $180,782 Net Adjustments Indicated Value $15,476 $165,476 Net Adjustments Indicated Value -$15,419 $158,081 Land Dwelling Impr. Total Appraised $32,200 $111,800 $144,000 B of R State Equalized Land Dwelling Impr. Total Appraised $36,400 $144,400 $180,800 B of R State Equalized Comparable Search - Market Value - Sales City of Moorhead 44
51 PDF+PIN Address RD ST S PDF+PIN Address BROOKDALE RD PDF+PIN Address TH ST S SUBJECT P/SF $ Base Land (SF) 11, $37,400 Style 1 Story Frame Main SF 1,302 $92,000 Addtns SF 0 Qtrs Over Porch SF 0 Garage SF 0 Bsmt/Attic Full / None $17,880 Heat/AC Yes / No TLA/GLA 1,302 1,302/0 Yr/Age/Cond / 62 / NML Rms / Bedrms 9 / 3 Bath Fixtures 2 $2,400 Appliances 0 Bsmt Finish $16,592 Porches 0 SF Decks/Patios 252 SF $630 Veneer 0 LF Fireplace 1 $7,150 Att. Garages 528 SF $13,210 Bsmt Stalls 0 Grade/Mult. 4 / $7,494 Phy. Depr. 26% -$39,803 F/E/Othr 0%/0%/0% Bldg Extras 0 Det. Garages 0 SF Yard Extras 0 Ag Buildings 0 Map Factor Total (without rounding) Land Dwelling $117,600 Impr. Total $155,000 $154,953 Appraised B of R St Equalized $37,400 Comparable Search - Market Value - Sales Cd/Rec D Analysis info 03/25/ ,900.00% adj/mo Sale Date/Amt 08/28/2014 $169,900 Time Sale Adj 5 mo /Adj $1,019 per mo $5,095 Adj Sale Amt $174,995 Base Difference Land (SF) 8, $36,600 $800 Qtrs Over Porch SF 0 Garage SF 0 Bsmt/Attic Full / None $18,400 -$520 Bsmt/Attic Full / None $16,120 $1,760 Heat/AC Yes / Yes $2,460 -$2,460 Heat/AC Yes / Yes $2,250 -$2,250 TLA/GLA 1,344 1,344/0 TLA/GLA 1,120 1,120/0 Yr/Age/Cond / 53 / BL NML Yr/Age/Cond / 57 / BL NML Rms / Bedrms 8 / 3 Rms / Bedrms 8 / 3 Bath Fixtures 2 $1,850 $550 Bath Fixtures 2 $2,950 -$550 Appliances 0 Appliances 0 Bsmt Finish $8,064 $8,528 Bsmt Finish $18,060 -$1,468 Porches 200 SF $8,820 -$8,820 Porches 0 SF Decks/Patios 144 SF $468 $162 Decks/Patios 84 SF $273 $357 Veneer 0 LF Veneer 0 LF Fireplace 1 $7,150 Fireplace 0 $7,150 Att. Garages Bsmt Stalls Grade/Mult. 4+5 / $15,326 -$7,832 Phy. Depr. 25% -$42,147 $2,344 F/E/Othr 0%/0%/0% Mkt Influence Land Dwelling Impr. Total Rank 3 Appraised $36,600 $126,400 $163, SF 0 100% B of R P/SF $ Style 1 Story Frame Style 1 Story Frame Main SF 1,344 $93,960 -$1,960 Main SF 1,120 $84,880 $7,120 Addtns SF 0 Addtns SF 0 $12,090 Bldg Extras 0 Bldg Extras 0 Det. Garages 0 SF Det. Garages 0 SF Yard Extras 0 Yard Extras 0 Ag Buildings 0 Ag Buildings 0 Map Factor Map Factor State Equalized $1,120 Att. Garages Bsmt Stalls Cd/Rec D e Analysis info 03/25/2015/ 81,000.00% adj/mo Sale Date/Amt 06/13/2014 $135,000 Time Sale Adj 7 mo /Adj $810 per mo $5,670 Adj Sale Amt $140,670 Base Difference Land (SF) 9, $27,500 $9,900 Qtrs Over Porch SF 0 Garage SF 0 Grade/Mult. 4 / $6,664 $830 Phy. Depr. 28% -$39,088 -$715 F/E/Othr 0%/0%/0% Mkt Influence Total (without rounding) $163,041 Total (without rounding) $128,339 Net Adjustments Indicated Value -$2,993 $166,907 Net Adjustments Indicated Value $32,284 $167,284 Land Dwelling Impr. Total Rank 4 City of Moorhead Appraised $27,500 $100,800 $128, SF 0 100% B of R P/SF $ $8,730 $4,480 State Equalized 45
52 PDF+PIN Address RD ST S SUBJECT P/SF $ Base Land (SF) 11, $37,400 Style 1 Story Frame Main SF 1,302 $92,000 Addtns SF 0 Qtrs Over Porch SF 0 Garage SF 0 Bsmt/Attic Full / None $17,880 Heat/AC Yes / No TLA/GLA 1,302 1,302/0 Yr/Age/Cond / 62 / NML Rms / Bedrms 9 / 3 Bath Fixtures 2 $2,400 Appliances 0 Bsmt Finish $16,592 Porches 0 SF Decks/Patios 252 SF $630 Veneer 0 LF Fireplace 1 $7,150 Att. Garages 528 SF $13,210 Bsmt Stalls 0 Grade/Mult. 4 / $7,494 Phy. Depr. 26% -$39,803 F/E/Othr 0%/0%/0% Bldg Extras 0 Det. Garages 0 SF Yard Extras 0 Ag Buildings 0 Map Factor PDF+PIN Address Cd/Rec D Analysis info 03/25/2015/ 92,400.00% adj/mo Sale Date/Amt 02/14/2014 $154,000 Time Sale Adj 11 mo /Adj $924 per mo $10,164 Adj Sale Amt $164,164 Base Difference Land (SF) 10, $34,500 $2,900 Style 1 Story Frame Main SF 1,134 $84,880 $7,120 Addtns SF 0 Qtrs Over Porch SF 0 Garage SF 0 Bsmt/Attic Full / None $16,120 $1,760 Heat/AC Yes / Yes $2,250 -$2,250 TLA/GLA 1,134 1,134/0 Yr/Age/Cond / 50 / NML Rms / Bedrms 8 / 3 Bath Fixtures 2 $2,400 Appliances 0 Bsmt Finish $17,413 -$821 Porches 0 SF Decks/Patios 296 SF $962 -$332 Veneer 0 LF Fireplace 0 $7,150 Att. Garages Bsmt Stalls Grade/Mult. 4 / $7,031 $463 Phy. Depr. 20% -$29,529 -$10,274 F/E/Othr 0%/0%/0% Bldg Extras 0 Det. Garages 0 SF Yard Extras 0 Ag Buildings 0 Map Factor Mkt Influence TH ST S Rank SF 0 100% P/SF $ $12,090 $1,120 Total (without rounding) Land Dwelling $117,600 Impr. Total $155,000 $154,953 Appraised B of R St Equalized $37,400 Comparable Search - Market Value - Sales Total (without rounding) $148,117 Net Adjustments Indicated Value $17,000 $171,000 Land Dwelling Impr. Total Appraised $34,500 $118,100 $152,600 B of R State Equalized City of Moorhead 46
53 TO: FROM: MEMO Board of Appeal and Equalization City of Moorhead Assessor s Office DATE: February 29, 2016 RE: 2016 Board of Appeal and Equalization Introduction: Three meetings are currently scheduled for 2016 Board of Appeal and Equalization: Wednesday, April 20 th, 2016 at 6:30 PM Wednesday, April 27 th, 2016 at 6:30 PM (if necessary, follow-up) Wednesday, May 4 th, 2016 at 6:30 PM (if necessary, follow-up) You are invited and encouraged to attend a pre-meeting educational session on Wednesday, March 9 th, at 5:30 PM with Assessing Staff and the Board in preparation for the 2016 Board of Appeal and Equalization. Please contact the Assessor s Office if this date will not work for you; by phone at , or nathan.aakre@ci.moorhead.mn.us. The alternative date would be Wednesday, March 16 th, at 5:30 PM. Additional pre-meetings can be scheduled if the Board would like further information on anything discussed. Staff is suggesting that no valuation or classification decisions be made at the first meeting on April 20 th if the property owner had not contacted the Assessor s Office prior to appearing before the Board, and Assessing Staff has not formally reviewed the property owner s request. Allowing staff the opportunity to review the property and analyze the data provided by the taxpayer is vital for the Board to make a well-informed decision. These appeals would be received and then tabled to a 2 nd meeting on April 27 th. The Assessor s Office will review the appeal and make a recommendation to the Board. Board of Appeal and Equalization Department of Revenue e-training: It is important that all or as many Board Members as possible complete the training as possible, in order to maintain Moorhead s authority to hold a Board of Appeal and Equalization meeting each year. If at least one certified Board Member is not present at the meeting, Moorhead would forfeit its ability to hold a meeting, and shift all appeals directly to the County Board of Appeal and Equalization. Board Members can access the training here on the Department of Revenue site: The materials for the training can take a few days to be received, and the entire training takes about minutes to complete. 47
54 If you have not completed the training, the training has been closed for 2016 as of January 31, Please complete the training for 2017, so Moorhead can retain its right to hold a Local Board of Appeal and Equalization. Educational Memos: In order to update the Board of changes in valuation and classification for 2016, as well as studies conducted in 2015, Assessing Staff will provide the Board educational memos. Two memos have been prepared to date, and are attached: Educational Memo #1 Factors Affecting the 2016 Assessment o Sales Ratio Study Residential Apartments Commercial/Industrial o County Assessor Directives Billboard/Communication Sites Underground Tanks o Contamination Tax o Flood Plain Sales Study o Central Business District Land Study Educational Memo #2 Truth in Taxation o 12/7/2015 City Truth in Taxation Hearing Response to Resident Inquiries Our hope is that this background information will give Board Members a good foundation to make decisions regarding appeals. Please contact the Assessor s Office at with any questions regarding any of this information. 48
55 TO: FROM: MEMO Board of Appeal and Equalization City of Moorhead Assessor s Office DATE: February 29, 2016 RE: Educational Memo #1 Factors Affecting the 2016 Assessment Sales Ratio Study: The 2015 Assessment Sales Ratio Study has been completed, which includes arms-length sales occurring between 10/1/2014 and 9/30/2015. The sale prices are compared to assessed values certified for the 2015 Assessment for statistical analysis. The results are as follows: Residential o 747 Arms-Length Sales o Annual Time Adjustment = 7.5% o Median Sales Ratio = 88.21% DOR acceptable Level of Assessment = 90% to 105% o DOR Finding: Assessment Level must be increased. o Staff Finding: Agree with Sales Ratio, and will increase Level of Assessment into compliance. Apartments o 5 Arms-Length Sales 6 Sales is minimum to determine compliance with DOR o Median Sales Ratio = 81.73% DOR acceptable Level of Assessment = 90% to 105% o DOR Finding: Inadequate sales for a DOR formal mandate of compliance. o Staff Finding: Values are increasing. Level of Assessment must increase to stay near the acceptable Sales Ratio range. Commercial/Industrial o 12 Arms-Length Sales o Median Sales Ratio = 97.42% DOR acceptable Level of Assessment = 90% to 105% o DOR Finding: No assessment change required. o Staff Finding: Assessment changes will be limited to warehouse/shop buildings. 49
56 Residential: 2015 proved to be another strong year of residential sales in Moorhead. Despite a significant increase in assessed values in 2015, the Median Sales Ratio finished at 88.21% after the 7.5% annual time adjustment was applied by the Department of Revenue. In order to increase the Median Sales Ratio into compliance, the following steps have been taken for the 2016 Assessment based on a comprehensive sales study: Increased nearly all residential land values to a minimum of $550/Front Foot. This mainly impacts property in the center of the City where homes built in the 1970 s and prior are located. Previous land value for these properties was either $400/FF or $450/FF. This increased a typical property value in these areas by $7,000 to $10,000. Increased 1-story base structure value on a graduated scale from 7% for a rambler/bilevel between 0 SF and 1200 SF, down to 1% for a 2000 SF rambler/bi-level. This typically resulted in an overall value increase of 1% to 4%. Increased Oakport residential land values by 10% across the board. Created a grading ceiling for good quality 2-story homes built between the 1980 s and the present time due to two good years of sales data showing that ceiling. We identified a point at which 2-story homes built in the 2000 s and graded higher than a 2 consistently sold for less than their assessed values. 2-story homes built between 1980 and 1999 reached their ceiling at grade 3. The results are as follows: o story homes will decrease in value for 2016 by typically less than 5%. o 15 2-story homes will increase only slightly in comparison to the rest of the City, by typically less than 2%. Applied a 2.5% across the board increase to all residential building values after applying the adjustments referred to above, resulting in a Median Sales Ratio of 95.24%. Moderately priced housing stock, typically $250,000 and less, saw the largest increase in the housing market in 2015, and most of the above increases are targeted at increasing the values of these homes to reflect that market. Staff appraisers spent the summer and fall in mass appraisal of residential properties mainly between 8 th Street South and 20 th Street South, from Main Avenue to the Interstate; and also between 8 th Street South and the Red River, from Main Avenue to 9 th Street South. Appraisers inspected and updated data on 2,543 parcels (out of a total of 11,787), which represents 21.6% of the City s residential properties. The new CAMA system and the use of tablets in the field is much more efficient, and has increased the number of inspections substantially. For comparison, approximately 1,400 residential properties were inspected in 2013, resulting in an increase of 81.6% in mass appraisal production in
57 Apartments: Despite not having enough sales (minimum of 6) to determine an official Sales Ratio for the Sales Study, 2015 was another strong year for the apartment market. In order to avoid falling behind and causing a large upward value adjustment in the future, apartment values will be increased for the 2016 Assessment. Staff appraisers viewed all apartments this past fall, and input all data into the new CAMA system. Rental data was also gathered for a large number of the apartments and recorded. The goal is to revalue all apartments for the 2016 Assessment using a combination of the Cost and Income Approaches in the new CAMA to reflect the current market. This implementation would also make future valuation maintenance much more efficient. Commercial/Industrial: Commercial property values held relatively steady in 2015, and no major adjustments will be necessary. However, warehouse/shop buildings are trending upward, and all of these structures have had building value adjustments for 2016 according to the last two years of sales data. Clay County Assessor 2016 Assessment Directives: Nancy Gunderson, Clay County Assessor, has provided guidance for local assessment offices regarding valuation of billboard sites, communication tower sites, underground storage tanks, and Ag containment facilities for the 2016 assessment year. *Please see the attached from Nancy Gunderson on Page 6. Billboard/Communication Sites, Underground Tanks, and Ag Containment: In 2015 The Department of Revenue gave direction and clarification on laws regarding billboard/cell communication sites and underground storage tanks, and both are required to be assessed and taxed. Physical billboards and towers themselves are considered personal property, and should not be taxed as real estate. However, the value of the site generating income from billboards or towers must be captured and taxed to the property owner as real property. If the billboard/tower stands on exempt property, the value is captured and taxed to the lessee as personal property, similar to how mobile home parks are taxed. The City will begin implementing valuation and classification in these areas as soon as the 2016 Assessment. *Please see the attached memos from the Department of Revenue regarding Billboard and Communication Tower Sites, and Underground Storage Tanks on Pages
58 In addition, agricultural containment facilities used to contain fertilizers and chemicals will be exempt for the 2016 Assessment. Contamination Tax: During the 2015 Board of Appeal and Equalization, property owners petitioned the Board for value reductions due to contamination. As a result, the Assessor s Office researched and reviewed how and when market value adjustments should be made for contamination, and found that neither staff or the Board properly addressed contamination. Minnesota law is clear on this matter, and requires that a parcel which receives a reduction in market value due to contamination be subject to a Contamination Tax. Determination of the amount of loss in value caused by the presence of any known contamination would be based upon one of three things: A court determination. A sale of the parcel indicating duress. A written estimate of the cost to clean up the parcel contained in an approved Response Action Plan. Contamination Tax is not a property tax, but a property-related tax which applies to contamination-related reductions in market value. It impacts those properties whose market value is negatively impacted by contamination involving the structures, soil, ground water, or air. The contamination may include commercial chemicals, petroleum products, asbestos, radon gas, pesticide, fertilizers, and other harmful substances. The Contamination Value is that which the market value is reduced by, and is then taxed separately from the property tax. Tax rates range from 12.5% of the contamination net tax capacity to 100%, depending on who is the responsible party, and if there is a cleanup plan. According to the Department of Revenue, the distribution of contamination taxes depends on whether or not there is a cleanup plan or asbestos abatement plan. The purpose of the law is to prevent property that is contaminated to benefit from not cleaning up. Without a Response Action Plan in place, the Contamination Tax will likely be larger than the reduction in property tax. Properties reduced in value due to contamination would pay an alternative tax on the amount of the value reduction, which typically would go to the State to help fund cleanup grants. *Please see the attached flowchart on how/when to implement Contamination Tax on Page 10. More information will be provided on the implementation of the Contamination Tax at the March 9 th pre-meeting. Flood Plain Study: At the beginning of 2016, City of Moorhead Engineering, GIS, and Wastewater Treatment provided the Assessor s Office with a list of 363 parcels impacted by the current 100-Year Flood 52
59 Plain. Parcels on this list are either in the flood plain, recently taken out by a Letter of Map Change, or potentially in the flood plain (too close to call). All sales of these properties since 2009 were retrieved, and arms-length (open market) sales of homes in the flood plain at the time of sale were studied. Sales data was broken down by the year of sale, elevation, location, and price range, to determine trends and the impact of the flood plain in Moorhead s housing market. From 2010 to 2014, the flood plain appeared to have a negative impact on the market for those properties ranging from 4% to 8% on average. However, in 2015, sales of homes in the flood plain fell right in line with sales throughout the rest of the City, indicating no negative impact on value due to the flood plain in today s market. Although this may not seem rational to some, market facts demonstrate buyers are willing to take on the risk and cost of these homes in order to gain the natural amenities that typically come with property in the flood plain. Due to the results of this comprehensive flood plain study, the Assessor s Office will remove any previously applied obsolescence due to property elevation and location in the Flood Plain for the 2016 Assessment. The market has shown while the flood plain has been a minor factor in property value in recent years, it no longer is negatively influencing property values. *Please see the attached study on Pages for additional details. Central Business District Land Study: This fall a study was completed on land values along the corridors of Main Avenue, Center Avenue, and 1 st Avenue North to determine equity and quality of assessment along those corridors. Data gathered showed that while properties along Main Avenue and Center Avenue are assessed accurately and equitably, sales along 1 st Avenue North are frequently exceeding assessed values, resulting in unacceptably low sales ratios. As mentioned earlier in this memo, increases in building value for warehouse/shop structures will occur in These building value increases will impact many of the properties on 1 st Avenue North causing the low sales ratios. Staff believes land has been valued fairly and accurately along this corridor, and that the increase in building value for warehouses and shops should improve the equitability of overall values along 1 st Avenue North in comparison with the rest of the City. Staff plans to implement building value increases for warehouses and shops across the City, and continue to monitor sales along 1 st Avenue North to determine if further land value adjustments are necessary in the future. *Please see the attached Land Value study on Pages for additional details. 53
60 Peter Doll From: Sent: To: Subject: Attachments: Nancy Gunderson Friday, February 19, :37 PM Peter Doll 2016 assessment billboard and communication tower memo pdf; taxation of underground fuel storage tanks pdf Pete After today s region meeting, I just wanted to touch base and stress the completion of a couple of required items for the 2016 assessment as directed by the Department of Revenue. 1. Please complete the valuation of billboard sites. The billboard and supporting framework are not taxable. 2. Please complete the valuation of communication tower sties. The towers themselves are not taxable. #1 and #2 were to be implanted for the 2014 assessment per DOR s November 22, 2013 bulletin. Document attached. 3. Please complete the valuation of tanks above and below ground. DOR had a bulletin on this as well dated June 8, 2015 attached. 4. If Moorhead has any ag containment facilities, make sure you have reviewed and make any portion of them, that qualify, exempt. 5. Also, please take time to review your 5 year history of classes where there might have been limited sales activity occurring residential is not an issue. But maybe apartments and commercial. As far as I gathered from the meeting, this will be follow up issues if there appears to be issues with ratios. Moorhead might not even have concerns with this. Just be aware. If you should have any follow up questions on any of these items, I will sure try and help you out. Enjoy your weekend. Nancy Nancy Gunderson Clay County Assessor 807 N 11 th St Moorhead MN Direct: Office: nancy.gunderson@co.clay.mn.us
61 Memo Date: November 22, 2013 To: From: Subject: All Assessors Andrea Fish, Supervisor Information & Education Section, Property Tax Division Taxation of billboard sites and cell antenna/tower sites We are aware that there is ongoing confusion regarding the taxation of billboard and cell antenna/tower sites. The purpose of this memo is to clarify our guidelines for assessment practices. We expect these guidelines to be implemented for the 2014 assessment. For purposes of this memo, a site may include land, but may also include a rooftop, steeple, wall, water tower, etc. 1. Billboard structures, cell antenna/tower structures, and other communication tower structures are exempt a) Billboards, along with the supporting framework and superstructure are exempt from ad valorem property tax as business equipment. b) Cell antennae/towers and communication towers are also exempt as equipment. 2. Billboard and cell/communication antenna/tower sites are taxable The site that billboards, cell antennae/towers, and other communication antennae/towers are located on are taxable. A sub-record may be created for the site, but the site is still taxable real estate. If the owner of the site is an exempt entity (e.g. the state of Minnesota), then the land is taxable in personam to the lessee of the site. 3. Classification of billboard and cell antenna/tower sites a) Because classification is based on the actual use of a property, our opinion is the appropriate classification for billboard sites should be 3a commercial property. b) For cell and other communication antennae/towers, the site should be classified as 3a commercial property. 4. Valuation of billboard and cell/communication sites a) For billboards, valuation should reflect the highest and best use of the site, consider market rents, and the location of the billboard site. For example, a billboard in a low traffic area may only be able to command minimal rents and the use may be only incidental. It may be appropriate to value that site no differently from the surrounding sites. However, a Property Tax Division Tel: North Robert Street Fax: Mail Station 3340 TTY: Call 711 for Minnesota Relay St. Paul, MN An equal opportunity employer 55
62 billboard located on a heavy-traffic highway area may generate significant income for the site that should be recognized when valuing the property. b) For cell and communication antenna/tower sites, the value should be based on the income approach and reflect a capitalization of the annual market rent payments the site would command. When valuing the billboard or cell/communication sites, we recommend using a gross income multiplier (GIM). Annual market income is multiplied by the GIM to establish a value for those site rights. A GIM is usually established by identifying and verifying sales of similar properties, establishing the annual gross income, and dividing the sale price by the gross income to determine the GIM. You will need to gather and verify all necessary data for your county. Income data, applicable multipliers, and sale prices will vary depending on the location of the billboard or cellular antenna and the details of the lease so verification of income data is very important. This market is dominated by regional and national players and any sale data may include multiple properties. As with other income producing properties, the income used in any valuation model should be market rent. It is possible that a value could be derived from a supportable rate such as dollars per traffic count or through direct capitalization if expenses are verified and cap rates can be derived. However, for uniformity, we are recommending the use of a GIM. 5. Creating a separate parcel identification (PID) for a billboard or cell/communication site If an easement is recorded for site use rights for billboards or antenna sites, a separate PID for that easement s legal description may be created. This is only for cases in which the easement is for someone other than the property owner. The PID is treated as real property, and the taxes are the responsibility of the easement holder; delinquency or forfeiture proceedings would result if that easement owner did not pay his or her taxes on that legally described site right. The easement PID could forfeit if taxes were unpaid (and the holder of the underlying land title would have first rights to repurchase the easement right). The property taxes assessed to the easement are in rem (against the easement) rather than in personam (against the owner of easement rights). If you have any questions, please speak with your county s Property Tax Compliance Officer, or the Information & Education Section at proptax.questions@state.mn.us. Property Tax Division Tel: North Robert Street Fax: Mail Station 3340 TTY: Call 711 for Minnesota Relay St. Paul, MN An equal opportunity employer 56
63 Memo Date: June 8, 2015 To: All Assessors From: Subject: Andrea Fish, Supervisor Information and Education Section, Property Tax Division Property taxation on underground fuel storage tanks The purpose of this memo is to address questions about whether underground fuel storage tanks are taxable or exempt, specifically questions related to underground storage tanks at convenience stores/gas stations. Are underground fuel storage tanks taxable? Yes; underground fuel storage tanks are taxable, as they provide a shelter function and are not necessary to the production of fuel or the equipment needed to dispense fuel. Both above-ground and below-ground fuel storage tanks are taxable. How are these tanks to be valued? Use the common approaches when valuing underground fuel storage tanks: cost income sales comparison You may have already included the contributory value of fuel storage tanks if you are valuing based on the income approach or on sales of comparable convenience store/gas station properties. If you have concerns with identifying values for convenience store/gas station properties, please contact your Property Tax Compliance Officer. When should the tanks become taxable? If you are not currently taxing these tanks, please comply with this change for the 2016 assessment year. Questions? If you have questions regarding this memo, please contact your Property Tax Compliance Officer or proptax.questions@state.mn.us. Thank you. 600 N. Robert St., St. Paul, MN An equal opportunity employer If you have a disability, we will provide this material in an alternate format 57
64 Contamination Tax Application 1. Are one of the three scenarios applicable to determine the amount of loss in value caused by the presence of contamination? A Court determination of contamination. A sale of the parcel indicating duress, with known contamination. A written estimate of cost to clean up from a Response Action Plan. 2. ***If NONE of these three scenarios apply, the property is to be valued at FULL MARKET VALUE.*** If one of the three scenarios DOES apply, what is the identified loss in value due to contamination? $ 3. Calculating Contamination Tax Net Tax Capacity at Full Market Value = EMV x Class Rate = Net Tax Capacity at Reduced Market Value due to Contamination = EMV x Class Rate = Difference is Net Tax Capacity for Contamination Tax = 4. If owner is responsible party: a. If NO Response Action Plan in place, Contamination Tax = 100% of Contamination Tax Capacity = $ b. If YES Response Action Plan in place, Contamination Tax = 50% of Contamination Tax Capacity = $ If owner is NOT responsible party: c. If NO Response Action Plan in place, Contamination Tax = 25% of Contamination Tax Capacity = $ d. If YES Response Action Plan in place, Contamination Tax = 12.5% of Contamination Tax Capacity = $ 58
65 TO: FROM: Michael Redlinger, City Manager MEMO City of Moorhead Assessor s Office DATE: January 20, 2016 RE: January 2016 Flood Plain Sales Study Methodology: At the beginning of 2016, City of Moorhead Engineering, GIS, and Wastewater Treatment provided the Assessor s Office with a list of 363 parcels impacted by the current 100-Year Flood Plain. Parcels on this list are either in the flood plain, recently taken out by a Letter of Map Change, or potentially in the flood plain (too close to call). All sales of these properties since 2009 were retrieved, and arms-length (open market) sales of homes in the flood plain at the time of sale were studied. Sales data was broken down by the year of sale, elevation, location, and price range, to determine trends and the impact of the flood plain in Moorhead s housing market. Common to all the sales was the Sales Ratio at the time of sale. The Sales Ratio equals the assessed value of the property at the time of sale, divided by the actual sales price. A Sales Ratio below 100% means the property sold for more than the assessed value. A Sales Ratio above 100% means the property sold for less than the assessed value. The Department of Revenue requires the Median Sales Ratio for the City each year to be within a range of 90% to 105%. Note that to determine the Sales Ratio at the time of sale, obsolescence that had been applied for elevation was removed to calculate an assessed value that would have resulted had no discount been given. This placed those assessed values on an even playing field with the rest of the City for this study. An annual Median Sales Ratio was calculated for all arms-length sales of properties in the flood plain, and compared to the Median Sales Ratio throughout the City that year. The difference between the two gave an indication of the impact being in the flood plain had on the market. Ratios were also organized by elevation, location, and sale price in order to identify other trends within the sales on an annual basis. 59
66 Conclusions: From 2010 to 2014, the flood plain appeared to have a negative impact on the market for those properties ranging from 4% to 8% on average. However, in 2015, sales of homes in the flood plain fell right in line with sales throughout the rest of the City, indicating no negative impact on value due to the flood plain in today s market. Although this does not seem rational, buyers appear to be willing to take on the risk and cost in order to gain the natural amenities that typically come with property in the flood plain. Throughout this six-year study, there seemed to be no correlation between a home a few inches into the flood plain, or 2-3 feet into the flood plain. There was a tendency, however, for upper valued homes to be less impacted by flood plain than the lower valued homes. Buyers who can afford the higher end of the housing market it Moorhead appear to be the most willing to accept that risk and cost associated with owning a home in the flood plain. Due to the results of this comprehensive flood plain study, the Assessor s Office will remove any previously applied obsolescence due to elevation for the 2016 Assessment. The market has shown while the flood plain has been a minor factor in property value in recent years, it no longer is negatively influencing property values. 60
67 January 2016 Flood Plain Sales Study Annual Comparison of Residential Sales in the Flood Plain to All Residential Sales Total Parcels Studied = 363 Total # of Arms Length Sales IN Flood Plain Sale IN Flood Plain 97.36% 97.62% 98.28% % % 99.21% 98.42% 88.60% City Level of Assessment (unadjusted) n/a 96.70% 94.60% 97.50% 97.80% 91.80% 90.10% 88.90% In 2015, the sales ratios of sales in the flood plain lined up directly with sales outside of the flood plain, showing no indication of flood impact. Flood Plain Sales by Price Range Flood Plain Sales by Price Range $150K $150K $250K $250K $400K $400K & Up # of Arms Length Sales IN Flood Plain Sale IN Flood Plain 95.00% % 93.16% 80.41% The flood plain appears to have less of an impact on upper valued homes, as buyers are willing to take on the risk and cost to obtain the natural amenities that typically come with homes in the flood plain. 61
68 2009 Flood Plain Sales BFE (RIVER Parcel_ID Land_Address STAGE Floodstage_Touc Elev_Cert 39.3 FT) LAG 2014 LiDar LOMC Flood Plain Status Sale Date Sale Amount Sale Ratio CADDY AVE 38.7 Feet Yes No In 100 year confirmed by EC 7/24/2009 $140,500 $123, % TH ST S Feet No Yes Confirmed out by LOMC # P 10/29/2009 $96,000 $85, % DALE AVE 39.5 Feet No Yes Confirmed out by LOMC # P 1/16/2009 $205,000 $186, % TH AVE SW 42.4 Feet No Yes Confirmed out by LOMC # A 2/24/2009 $260,000 $242, % TH AVENUE CIR S 39.5 Feet No No In 100 year 10/29/2009 $190,000 $177, % TH AVE N 38.5 Feet No No In 100 year 6/17/2009 $320,000 $303, % DALE AVE 39 Feet No Yes Confirmed out by LOMC # P 2/23/2009 $198,000 $198, % RIVERVIEW CIR S 39.3 Feet Yes No In 100 year confirmed by EC 6/12/2009 $261,000 $271, % ELM ST N 38.5 Feet No No In 100 year 2/23/2009 $185,100 $197, % HORN AVE 39 Feet No Yes Confirmed out by LOMC # P 7/31/2009 $269,500 $289, % CADDY AVE 39.3 Feet Yes No In 100 year confirmed by EC 5/13/2009 $305,000 $352, % OAKPORT ST N 39 Feet No No In 100 year 5/15/2009 $236,500 $291, % Sorted by Elevation Parcel_ID Land_Address Floodstage_Touc Ratio TH AVE N 38.5 Feet 94.88% ELM ST N 38.5 Feet % CADDY AVE 38.7 Feet 87.97% DALE AVE 39 Feet % HORN AVE 39 Feet % OAKPORT ST N 39 Feet % RIVERVIEW CIR S 39.3 Feet % CADDY AVE 39.3 Feet % TH ST S Feet 88.65% DALE AVE 39.5 Feet 91.17% TH AVENUE CIR S 39.5 Feet 93.42% TH AVE SW 42.4 Feet 93.31% 2009 City wide Median Sales Ratio = 96.70% 2009 Median Sales Ratio of Homes in the Flood Plain = 97.62% Note: This was the first year of wide spread flooding in Moorhead. Observations: Sales ratios for sales in the flood plain in 2009 fell mostly in the 88% to 107% range. No correlation observed from elevation, location, or price range. Sorted North to South by Location Parcel_ID Land_Address Floodstage_Touc Ratio TH AVE N 38.5 Feet 94.88% ELM ST N 38.5 Feet % OAKPORT ST N 39 Feet % CADDY AVE 38.7 Feet 87.97% CADDY AVE 39.3 Feet % DALE AVE 39 Feet % DALE AVE 39.5 Feet 91.17% HORN AVE 39 Feet % TH ST S Feet 88.65% RIVERVIEW CIR S 39.3 Feet % TH AVENUE CIR S 39.5 Feet 93.42% TH AVE SW 42.4 Feet 93.31% Sorted by Price Range Parcel_ID Land_Address Sale Amount Ratio TH ST S 2 $96, % CADDY AVE $140, % ELM ST N $185, % TH AVENUE CIR S $190, % DALE AVE $198, % DALE AVE $205, % OAKPORT ST N $236, % TH AVE SW $260, % RIVERVIEW CIR S $261, % HORN AVE $269, % CADDY AVE $305, % TH AVE N $320, % 62
69 2010 Flood Plain Sales BFE (RIVER Parcel_ID Land_Address STAGE Floodstage_Touc Elev_Cert 39.3 FT) LAG 2014 LiDar LOMC Flood Plain Status Sale Date Sale Amount Sale Ratio RD ST N 39 Feet No No In 100 year 11/22/2010 $293,000 $257, % CADDY AVE 38.7 Feet Yes No In 100 year confirmed by EC 9/24/2010 $132,500 $119, % ST ST NW 39.5 Feet No No Too close to call 3/19/2010 $149,900 $135, % WALL STREET AVE NW39.5 Feet No No Likely out by LiDAR 8/18/2010 $250,000 $243, % TH AVE N 41.8 Feet Yes Yes Confirmed out by LOMC # A 11/19/2010 $257,308 $250, % RIVERSHORE DR S 39 Feet No No In 100 year 6/1/2010 $167,900 $166, % DALE AVE 39 Feet Yes Yes Confirmed out by LOMC # P 10/12/2010 $206,050 $212, % ND ST S 38.9 Feet No No Very likely in by City survey shots (No EC) 5/14/2010 $200,000 $220, % RIVERSHORE DR S 39.5 Feet No No Very likely in by City survey shots (No EC) 3/16/2010 $170,500 $192, % VALLEY AVE 39 Feet Yes Yes Confirmed out by LOMC # P 2/12/2010 $150,500 $200, % Sorted by Elevation Parcel_ID Land_Address Floodstage_Touc Ratio CADDY AVE 38.7 Feet 90.19% ND ST S 38.9 Feet % RD ST N 39 Feet 87.99% RIVERSHORE DR S 39 Feet 99.05% DALE AVE 39 Feet % VALLEY AVE 39 Feet % ST ST NW 39.5 Feet 90.66% WALL STREET AVE NW39.5 Feet 97.20% RIVERSHORE DR S 39.5 Feet % TH AVE N 41.8 Feet 97.51% 2010 City wide Median Sales Ratio = 94.60% 2010 Median Sales Ratio of Homes in the Flood Plain = 98.28% Note: This was the second consecutive year of wide spread flooding in Moorhead. Observations: Sales ratios for sales in the flood plain in 2010 fell mostly in the 88% to 112% range. No correlation observed from elevation or price range. Lowest Sales Ratios were on the North side, highest Sales Ratios were on the South side. Sorted North to South by Location Parcel_ID Land_Address Floodstage_Touc Ratio RD ST N 39 Feet 87.99% WALL STREET AVE NW39.5 Feet 97.20% ST ST NW 39.5 Feet 90.66% CADDY AVE 38.7 Feet 90.19% TH AVE N 41.8 Feet 97.51% DALE AVE 39 Feet % VALLEY AVE 39 Feet % RIVERSHORE DR S 39 Feet 99.05% ND ST S 38.9 Feet % RIVERSHORE DR S 39.5 Feet % Sorted by Price Range Parcel_ID Land_Address Sale Amount Ratio CADDY AVE $132, % ST ST NW $149, % VALLEY AVE $150, % RIVERSHORE DR S $167, % RIVERSHORE DR S $170, % ND ST S $200, % DALE AVE $206, % WALL STREET AVE NW $250, % TH AVE N $257, % RD ST N $293, % 63
70 2011 Flood Plain Sales BFE (RIVER Parcel_ID Land_Address STAGE Floodstage_Touc Elev_Cert 39.3 FT) LAG 2014 LiDar LOMC Flood Plain Status Sale Date Sale Amount Sale Ratio RIVERSHORE DR S 39.9 Feet No Yes Confirmed out by LOMC # A 9/12/2011 $195,900 $180, % TH AVE N 39.5 Feet No No In 100 year 6/17/2011 $152,400 $143, % TH ST S 38 Feet No No In 100 year 12/30/2011 $132,000 $125, % RIVERSHORE DR S 39.4 Feet Yes No Very likely out by EC (No LOMC) 12/1/2011 $184,900 $177, % TH AVE N 39.5 Feet No No In 100 year 5/20/2011 $160,000 $160, % HORN AVE 39 Feet No Yes Confirmed out by LOMC # P 4/15/2011 $173,000 $174, % TH AVE N 38.5 Feet No No In 100 year 5/20/2011 $217,899 $222, % VALLEY AVE 39 Feet No Yes Confirmed out by LOMC # P 2/10/2011 $180,000 $186, % VALLEY AVE 39 Feet Yes Yes Confirmed out by LOMC # P 12/29/2011 $190,000 $200, % CADDY AVE 38.7 Feet Yes No In 100 year confirmed by EC 6/8/2011 $93,000 $113, % TH ST N 39 Feet No No In 100 year 9/9/2011 $180,000 $227, % TH ST S 39 Feet No Yes Confirmed out by LOMC # P 11/29/2011 $112,500 $157, % Sorted by Elevation Parcel_ID Land_Address Floodstage_Touc Ratio TH ST S 38 Feet 95.00% TH AVE N 38.5 Feet % CADDY AVE 38.7 Feet % HORN AVE 39 Feet % VALLEY AVE 39 Feet % VALLEY AVE 39 Feet % TH ST N 39 Feet % TH ST S 39 Feet % RIVERSHORE DR S 39.4 Feet 95.78% TH AVE N 39.5 Feet 94.36% TH AVE N 39.5 Feet % RIVERSHORE DR S 39.9 Feet 91.88% 2011 City wide Median Sales Ratio = 97.50% 2011 Median Sales Ratio of Homes in the Flood Plain = % Note: This was the third consecutive year of wide spread flooding in Moorhead. Observations: Sales ratios for sales in the flood plain in 2011 fell mostly in the 94% to 106% range. No correlation observed from elevation, location, or price range. Sorted North to South by Location Parcel_ID Land_Address Floodstage_Touc Ratio TH AVE N 38.5 Feet % TH ST N 39 Feet % TH AVE N 39.5 Feet % TH AVE N 39.5 Feet 94.36% CADDY AVE 38.7 Feet % TH ST S 38 Feet 95.00% HORN AVE 39 Feet % VALLEY AVE 39 Feet % VALLEY AVE 39 Feet % TH ST S 39 Feet % RIVERSHORE DR S 39.9 Feet 91.88% RIVERSHORE DR S 39.4 Feet 95.78% Sorted by Price Range Parcel_ID Land_Address Sale Amount Ratio CADDY AVE $93, % TH ST S $112, % TH ST S $132, % TH AVE N $152, % TH AVE N $160, % HORN AVE $173, % VALLEY AVE $180, % TH ST N $180, % RIVERSHORE DR S $184, % VALLEY AVE $190, % RIVERSHORE DR S $195, % TH AVE N $217, % 64
71 2012 Flood Plain Sales BFE (RIVER Parcel_ID Land_Address STAGE Floodstage_Touc Elev_Cert 39.3 FT) LAG 2014 LiDar LOMC Flood Plain Status Sale Date Sale Amount Sale Ratio RD ST N 42.1 Feet Yes No Very likely out by EC (No LOMC) 3/9/2012 $80,000 $12, % TH ST S 39.1 Feet Yes No In by Elevation Certificate 3/23/2012 $175,000 $144, % ST ST NW 39 Feet no No In 100 year 11/12/2012 $175,000 $152, % BROOK AVE 39.5 Feet No Yes Confirmed out by LOMC # P 9/10/2012 $145,900 $129, % TH AVE SW 41.8 Feet Yes Yes Confirmed out by LOMC # A 1/9/2012 $285,000 $265, % TH ST S 39 Feet No Yes Confirmed out by LOMC # P 10/15/2012 $179,000 $183, % DALE AVE 39.5 Feet Yes Yes Confirmed out by LOMC # P 5/14/2012 $173,000 $180, % TH ST S 39 Feet No Yes Confirmed out by LOMC # P 10/26/2012 $165,000 $173, % BROOK AVE 39.5 Feet No Yes Confirmed out by LOMC # P 7/31/2012 $119,900 $130, % TH ST S 39.5 Feet Yes No Very likely out by EC (No LOMC) 4/9/2012 $29,664 $32, % TH ST N 38 Feet No No In 100 year 2/28/2012 $157,700 $173, % RD ST N 39.5 Feet No No Too close to call 3/9/2012 $138,000 $163, % Sorted by Elevation Parcel_ID Land_Address Floodstage_Touc Ratio TH ST N 38 Feet % ST ST NW 39 Feet 86.86% TH ST S 39 Feet % TH ST S 39 Feet % TH ST S 39.1 Feet 82.40% BROOK AVE 39.5 Feet 88.42% DALE AVE 39.5 Feet % BROOK AVE 39.5 Feet % TH ST S 39.5 Feet % RD ST N 39.5 Feet % TH AVE SW 41.8 Feet 93.16% RD ST N 42.1 Feet 15.00% 2012 City wide Median Sales Ratio = 97.80% 2012 Median Sales Ratio of Homes in the Flood Plain = % Note: This was the first year since 2008 without wide spread flooding. Observations: Sales ratios for sales in the flood plain in 2012 fell mostly in the 86% to 110% range. No correlation observed from elevation, location, or price range. Sorted North to South by Location Parcel_ID Land_Address Floodstage_Touc Ratio TH ST N 38 Feet % RD ST N 42.1 Feet 15.00% RD ST N 39.5 Feet % ST ST NW 39 Feet 86.86% TH ST S 39.5 Feet % TH ST S 39.1 Feet 82.40% TH ST S 39 Feet % TH ST S 39 Feet % BROOK AVE 39.5 Feet % BROOK AVE 39.5 Feet 88.42% DALE AVE 39.5 Feet % TH AVE SW 41.8 Feet 93.16% Sorted by Price Range Parcel_ID Land_Address Sale Amount Ratio TH ST S $29, % RD ST N $80, % BROOK AVE $119, % RD ST N $138, % BROOK AVE $145, % TH ST N $157, % TH ST S $165, % DALE AVE $173, % TH ST S $175, % ST ST NW $175, % TH ST S $179, % TH AVE SW $285, % 65
72 2013 Flood Plain Sales BFE (RIVER Parcel_ID Land_Address STAGE Floodstage_Touc Elev_Cert 39.3 FT) LAG 2014 LiDar LOMC Flood Plain Status Sale Date Sale Amount Sale Ratio TH ST S 38.1 Feet Yes No In 100 year confirmed by EC 6/4/2013 $241,400 $186, % ND ST N 39 Feet No No In 100 year 7/31/2013 $165,000 $129, % VALLEY AVE 39 Feet No Yes Confirmed out by LOMC # P 7/25/2013 $170,000 $143, % RIVERSHORE DR S 39.5 Feet Yes Yes Confirmed out by LOMC # P 5/31/2013 $250,000 $229, % DALE AVE 39 Feet No Yes Confirmed out by LOMC # P 7/22/2013 $207,000 $190, % ND ST N 39 Feet no No In 100 year 10/1/2013 $190,500 $183, % VALLEY AVE 39 Feet No Yes Confirmed out by LOMC # P 6/21/2013 $200,000 $193, % ST ST NW 38.5 Feet No No In 100 year 5/10/2013 $169,500 $172, % TH AVE CIR S 39.5 Feet No No In 100 year 12/17/2013 $165,000 $168, % TH AVE N 39.5 Feet no No In 100 year 12/20/2013 $172,000 $175, % TH AVE S 37.6 Feet No No Very likely in by City survey shots (No EC) 7/29/2013 $180,000 $187, % RIVERVIEW CIR S 39 Feet No No In 100 year 6/14/2013 $243,000 $259, % RIVERVIEW CIR S 39.5 Feet No No In 100 year 9/20/2013 $240,000 $261, % RIVERVIEW CIR S 38.9 Feet Yes No In 100 year confirmed by EC 10/30/2013 $232,000 $259, % Sorted by Elevation Parcel_ID Land_Address Floodstage_Touc Ratio TH AVE S 37.6 Feet % TH ST S 38.1 Feet 77.38% ST ST NW 38.5 Feet % RIVERVIEW CIR S 38.9 Feet % DALE AVE 39 Feet 92.03% VALLEY AVE 39 Feet 96.70% VALLEY AVE 39 Feet 84.53% ND ST N 39 Feet 96.43% ND ST N 39 Feet 78.48% RIVERVIEW CIR S 39 Feet % RIVERSHORE DR S 39.5 Feet 91.84% TH AVE CIR S 39.5 Feet % RIVERVIEW CIR S 39.5 Feet % TH AVE N 39.5 Feet % 2013 City wide Median Sales Ratio = 91.80% 2013 Median Sales Ratio of Homes in the Flood Plain = 99.21% Note: This was the second consecutive year without wide spread flooding, and the housing market as a whole saw a 6.25% increase. Observations: Sales ratios for sales in the flood plain in 2013 fell mostly in the 91% to 108% range. No correlation observed from elevation or price range. There was a slight tendancy for a higher sales ratio once again on the South side. Sorted North to South by Location Parcel_ID Land_Address Floodstage_Touc Ratio ND ST N 39 Feet 96.43% ND ST N 39 Feet 78.48% TH AVE N 39.5 Feet % ST ST NW 38.5 Feet % TH ST S 38.1 Feet 77.38% DALE AVE 39 Feet 92.03% VALLEY AVE 39 Feet 96.70% VALLEY AVE 39 Feet 84.53% RIVERSHORE DR S 39.5 Feet 91.84% RIVERVIEW CIR S 39 Feet % RIVERVIEW CIR S 39.5 Feet % RIVERVIEW CIR S 38.9 Feet % TH AVE CIR S 39.5 Feet % TH AVE S 37.6 Feet % Sorted by Price Range Parcel_ID Land_Address Sale Amount Ratio ND ST N $165, % TH AVE CIR S $165, % ST ST NW $169, % VALLEY AVE $170, % TH AVE N $172, % TH AVE S $180, % ND ST N $190, % VALLEY AVE $200, % DALE AVE $207, % RIVERVIEW CIR S $232, % RIVERVIEW CIR S $240, % TH ST S $241, % RIVERVIEW CIR S $243, % RIVERSHORE DR S $250, % 66
73 2014 Flood Plain Sales BFE (RIVER Parcel_ID Land_Address STAGE Floodstage_Touc Elev_Cert 39.3 FT) LAG 2014 LiDar LOMC Flood Plain Status Sale Date Sale Amount Sale Ratio RIVERSHORE DR S 39.5 Feet No No Very likely in by City survey shots (No EC) 9/26/2014 $315,000 $233, % ELM ST S 39.1 Feet Yes No In 100 year confirmed by EC 8/22/2014 $143,500 $111, % ST ST N 40.5 Feet No No Likely out by LiDAR 5/28/2014 $290,000 $232, % FAIRWAY DR 39.5 Feet No No Too close to call (Deck) 1/10/2014 $167,000 $152, % CADDY AVE 38.7 Feet Yes No In 100 year confirmed by EC 8/15/2014 $137,000 $129, % RIVERSHORE DR S 39 Feet No No In 100 year 6/27/2014 $249,900 $244, % TH AVE N 39 Feet No No In 100 year 10/13/2014 $175,000 $171, % TH ST S 38 Feet No No In 100 year 1/27/2014 $95,000 $93, % TH ST S 35 Feet Yes No In 100 year confirmed by EC 5/30/2014 $115,000 $115, % TH ST S 39 Feet No No In 100 year 5/1/2014 $144,000 $145, % DALE AVE 39.5 Feet No Yes Confirmed out by LOMC # P 5/15/2014 $187,500 $191, % VALLEY AVE 39 Feet Yes Yes Confirmed out by LOMC # P 12/12/2014 $190,038 $197, % WALL ST AVE N 39.5 Feet No No In 100 year 9/12/2014 $240,000 $287, % RIVERSHORE DR S 39 Feet Yes Yes Confirmed out by LOMC # P 8/28/2014 $200,000 $246, % WALL STREET AVE N 38.5 Feet No No In 100 year 3/5/2014 $73,000 $97, % Sorted by Elevation Parcel_ID Land_Address Floodstage_Touc Ratio TH ST S 35 Feet % TH ST S 38 Feet 98.42% WALL STREET AVE N 38.5 Feet % CADDY AVE 38.7 Feet 94.16% RIVERSHORE DR S 39 Feet 97.72% TH AVE N 39 Feet 97.89% TH ST S 39 Feet % VALLEY AVE 39 Feet % RIVERSHORE DR S 39 Feet % ELM ST S 39.1 Feet 77.84% RIVERSHORE DR S 39.5 Feet 74.06% FAIRWAY DR 39.5 Feet 91.50% DALE AVE 39.5 Feet % WALL ST AVE N 39.5 Feet % ST ST N 40.5 Feet 80.14% 2014 City wide Median Sales Ratio = 90.10% 2014 Median Sales Ratio of Homes in the Flood Plain = 98.42% Note: This was the third consecutive year without wide spread flooding, and the housing market as a whole saw a 7.50% increase. Observations: Sales ratios for sales in the flood plain in 2013 fell mostly in the 91% to 103% range. No correlation observed from elevation or location. Some of the highest priced homes produced the lowest sales ratios. Sorted North to South by Location Parcel_ID Land_Address Floodstage_Touc Ratio TH AVE N 39 Feet 97.89% ST ST N 40.5 Feet 80.14% WALL STREET AVE N 38.5 Feet % WALL ST AVE N 39.5 Feet % FAIRWAY DR 39.5 Feet 91.50% CADDY AVE 38.7 Feet 94.16% ELM ST S 39.1 Feet 77.84% TH ST S 39 Feet % TH ST S 38 Feet 98.42% TH ST S 35 Feet % DALE AVE 39.5 Feet % VALLEY AVE 39 Feet % RIVERSHORE DR S 39 Feet % RIVERSHORE DR S 39 Feet 97.72% RIVERSHORE DR S 39.5 Feet 74.06% Sorted by Price Range Parcel_ID Land_Address Sale Amount Ratio WALL STREET AVE N $73, % TH ST S $95, % TH ST S $115, % CADDY AVE $137, % ELM ST S $143, % TH ST S $144, % FAIRWAY DR $167, % TH AVE N $175, % DALE AVE $187, % VALLEY AVE $190, % RIVERSHORE DR S $200, % WALL ST AVE N $240, % RIVERSHORE DR S $249, % ST ST N $290, % RIVERSHORE DR S $315, % 67
74 2015 Flood Plain Sales BFE (RIVER Parcel_ID Land_Address STAGE Floodstage_Touc Elev_Cert 39.3 FT) LAG 2014 LiDar LOMC Flood Plain Status Sale Date Sale Amount Sale Ratio TH ST S 39.1 Feet Yes No In by Elevation Certificate 10/30/2015 $186,000 $142, % TH AVE N 43.6 Feet Yes No Very likely out by EC (No LOMC) 5/29/2015 $470,000 $363, % TH AVE CIR S 39.5 Feet No No In 100 year 10/16/2015 $235,000 $189, % TH AVE N 38.5 Feet no No In 100 year 9/18/2015 $404,000 $337, % TH ST N 39 Feet No No In 100 year 3/27/2015 $229,900 $197, % TH ST N 38 Feet No No In 100 year 4/15/2015 $191,000 $166, % TH ST S 37 Feet No No In 100 year 8/18/2015 $132,550 $116, % RIVER OAKS PT 40.6 Feet Yes No Very likely out by EC (No LOMC) 3/27/2015 $335,000 $296, % RIVERSHORE DR S 39.7 Feet Yes No Very likely out by EC (No LOMC) 7/15/2015 $265,000 $236, % TH ST S 39 Feet No No In 100 year 9/4/2015 $119,000 $106, % TH AVE N 39.5 Feet No No Too close to call 8/25/2015 $252,500 $227, % TH AVE N 39.5 Feet No No Too close to call 7/1/2015 $236,000 $213, % ST ST NW 38.5 Feet No No In 100 year 12/14/2015 $209,250 $199, % ND ST N 39 Feet No No In 100 year 1/15/2015 $205,000 $195, % ELM ST N 38.5 Feet No No In 100 year 8/21/2015 $120,000 $166, % Sorted by Elevation Parcel_ID Land_Address Floodstage_Touc Ratio TH ST S 37 Feet 87.97% TH ST N 38 Feet 87.33% TH AVE N 38.5 Feet 83.42% ST ST NW 38.5 Feet 95.10% ELM ST N 38.5 Feet % TH ST N 39 Feet 86.04% TH ST S 39 Feet 89.66% ND ST N 39 Feet 95.22% TH ST S 39.1 Feet 76.72% TH AVE CIR S 39.5 Feet 80.77% TH AVE N 39.5 Feet 89.94% TH AVE N 39.5 Feet 90.42% RIVERSHORE DR S 39.7 Feet 89.36% RIVER OAKS PT 40.6 Feet 88.60% TH AVE N 43.6 Feet 77.40% 2015 City wide Median Sales Ratio = 88.90% 2015 Median Sales Ratio of Homes in the Flood Plain = 88.60% Note: This was the third consecutive year without wide spread flooding, and the housing market as a whole saw a 7.50% increase. Observations: Sales ratios for sales in the flood plain in 2015 fell mostly in the 86% to 95% range. No correlation observed from elevation or location. Some of the highest priced homes produced the lowest sales ratios once again. Sorted North to South by Location Parcel_ID Land_Address Floodstage_Touc Ratio ND ST N 39 Feet 95.22% TH ST N 39 Feet 86.04% TH ST N 38 Feet 87.33% TH AVE N 38.5 Feet 83.42% TH AVE N 39.5 Feet 90.42% ELM ST N 38.5 Feet % ST ST NW 38.5 Feet 95.10% TH AVE N 39.5 Feet 89.94% TH AVE N 43.6 Feet 77.40% TH ST S 37 Feet 87.97% TH ST S 39 Feet 89.66% TH ST S 39.1 Feet 76.72% TH AVE CIR S 39.5 Feet 80.77% RIVERSHORE DR S 39.7 Feet 89.36% RIVER OAKS PT 40.6 Feet 88.60% Sorted by Price Range Parcel_ID Land_Address Sale Amount Ratio TH ST S $119, % ELM ST N $120, % TH ST S $132, % TH ST S $186, % TH ST N $191, % ND ST N $205, % ST ST NW $209, % TH ST N $229, % TH AVE CIR S $235, % TH AVE N $236, % TH AVE N $252, % RIVERSHORE DR S $265, % RIVER OAKS PT $335, % TH AVE N $404, % TH AVE N $470, % 68
75 Flood Plain Sales by Price Range BFE (RIVER Parcel_ID Land_Address STAGE Floodstage_Touc Elev_Cert 39.3 FT) LAG 2014 LiDar LOMC Flood Plain Status Sale Date Sale Amount Sale Ratio TH ST S 39.5 Feet Yes No Very likely out by EC (No LOMC) 4/9/2012 $29,664 $32, % WALL STREET AVE N 38.5 Feet No No In 100 year 3/5/2014 $73,000 $97, % RD ST N 42.1 Feet Yes No Very likely out by EC (No LOMC) 3/9/2012 $80,000 $12, % CADDY AVE 38.7 Feet Yes No In 100 year confirmed by EC 6/8/2011 $93,000 $113, % TH ST S 38 Feet No No In 100 year 1/27/2014 $95,000 $93, % TH ST S Feet No Yes Confirmed out by LOMC # P 10/29/2009 $96,000 $85, % TH ST S 39 Feet No Yes Confirmed out by LOMC # P 11/29/2011 $112,500 $157, % TH ST S 35 Feet Yes No In 100 year confirmed by EC 5/30/2014 $115,000 $115, % TH ST S 39 Feet No No In 100 year 9/4/2015 $119,000 $106, % BROOK AVE 39.5 Feet No Yes Confirmed out by LOMC # P 7/31/2012 $119,900 $130, % ELM ST N 38.5 Feet No No In 100 year 8/21/2015 $120,000 $166, % TH ST S 38 Feet No No In 100 year 12/30/2011 $132,000 $125, % CADDY AVE 38.7 Feet Yes No In 100 year confirmed by EC 9/24/2010 $132,500 $119, % TH ST S 37 Feet No No In 100 year 8/18/2015 $132,550 $116, % CADDY AVE 38.7 Feet Yes No In 100 year confirmed by EC 8/15/2014 $137,000 $129, % RD ST N 39.5 Feet No No Too close to call 3/9/2012 $138,000 $163, % CADDY AVE 38.7 Feet Yes No In 100 year confirmed by EC 7/24/2009 $140,500 $123, % ELM ST S 39.1 Feet Yes No In 100 year confirmed by EC 8/22/2014 $143,500 $111, % TH ST S 39 Feet No No In 100 year 5/1/2014 $144,000 $145, % BROOK AVE 39.5 Feet No Yes Confirmed out by LOMC # P 9/10/2012 $145,900 $129, % ST ST NW 39.5 Feet No No Too close to call 3/19/2010 $149,900 $135, % VALLEY AVE 39 Feet Yes Yes Confirmed out by LOMC # P 2/12/2010 $150,500 $200, % TH AVE N 39.5 Feet No No In 100 year 6/17/2011 $152,400 $143, % TH ST N 38 Feet No No In 100 year 2/28/2012 $157,700 $173, % TH AVE N 39.5 Feet No No In 100 year 5/20/2011 $160,000 $160, % ND ST N 39 Feet No No In 100 year 7/31/2013 $165,000 $129, % TH AVE CIR S 39.5 Feet No No In 100 year 12/17/2013 $165,000 $168, % TH ST S 39 Feet No Yes Confirmed out by LOMC # P 10/26/2012 $165,000 $173, % FAIRWAY DR 39.5 Feet No No Too close to call (Deck) 1/10/2014 $167,000 $152, % RIVERSHORE DR S 39 Feet No No In 100 year 6/1/2010 $167,900 $166, % ST ST NW 38.5 Feet No No In 100 year 5/10/2013 $169,500 $172, % VALLEY AVE 39 Feet No Yes Confirmed out by LOMC # P 7/25/2013 $170,000 $143, % RIVERSHORE DR S 39.5 Feet No No Very likely in by City survey shots (No EC) 3/16/2010 $170,500 $192, % TH AVE N 39.5 Feet no No In 100 year 12/20/2013 $172,000 $175, % HORN AVE 39 Feet No Yes Confirmed out by LOMC # P 4/15/2011 $173,000 $174, % DALE AVE 39.5 Feet Yes Yes Confirmed out by LOMC # P 5/14/2012 $173,000 $180, % TH ST S 39.1 Feet Yes No In by Elevation Certificate 3/23/2012 $175,000 $144, % ST ST NW 39 Feet no No In 100 year 11/12/2012 $175,000 $152, % TH AVE N 39 Feet No No In 100 year 10/13/2014 $175,000 $171, % TH ST S 39 Feet No Yes Confirmed out by LOMC # P 10/15/2012 $179,000 $183, % VALLEY AVE 39 Feet No Yes Confirmed out by LOMC # P 2/10/2011 $180,000 $186, % TH AVE S 37.6 Feet No No Very likely in by City survey shots (No EC) 7/29/2013 $180,000 $187, % TH ST N 39 Feet No No In 100 year 9/9/2011 $180,000 $227, % RIVERSHORE DR S 39.4 Feet Yes No Very likely out by EC (No LOMC) 12/1/2011 $184,900 $177, % ELM ST N 38.5 Feet No No In 100 year 2/23/2009 $185,100 $197, % TH ST S 39.1 Feet Yes No In by Elevation Certificate 10/30/2015 $186,000 $142, % DALE AVE 39.5 Feet No Yes Confirmed out by LOMC # P 5/15/2014 $187,500 $191, % TH AVENUE CIR S 39.5 Feet No No In 100 year 10/29/2009 $190,000 $177, % VALLEY AVE 39 Feet Yes Yes Confirmed out by LOMC # P 12/29/2011 $190,000 $200, % VALLEY AVE 39 Feet Yes Yes Confirmed out by LOMC # P 12/12/2014 $190,038 $197, % ND ST N 39 Feet no No In 100 year 10/1/2013 $190,500 $183, % TH ST N 38 Feet No No In 100 year 4/15/2015 $191,000 $166, % RIVERSHORE DR S 39.9 Feet No Yes Confirmed out by LOMC # A 9/12/2011 $195,900 $180, % DALE AVE 39 Feet No Yes Confirmed out by LOMC # P 2/23/2009 $198,000 $198, % VALLEY AVE 39 Feet No Yes Confirmed out by LOMC # P 6/21/2013 $200,000 $193, % ND ST S 38.9 Feet No No Very likely in by City survey shots (No EC) 5/14/2010 $200,000 $220, % RIVERSHORE DR S 39 Feet Yes Yes Confirmed out by LOMC # P 8/28/2014 $200,000 $246, % DALE AVE 39.5 Feet No Yes Confirmed out by LOMC # P 1/16/2009 $205,000 $186, % ND ST N 39 Feet No No In 100 year 1/15/2015 $205,000 $195, % DALE AVE 39 Feet Yes Yes Confirmed out by LOMC # P 10/12/2010 $206,050 $212, % DALE AVE 39 Feet No Yes Confirmed out by LOMC # P 7/22/2013 $207,000 $190, % ST ST NW 38.5 Feet No No In 100 year 12/14/2015 $209,250 $199, % TH AVE N 38.5 Feet No No In 100 year 5/20/2011 $217,899 $222, % TH ST N 39 Feet No No In 100 year 3/27/2015 $229,900 $197, % RIVERVIEW CIR S 38.9 Feet Yes No In 100 year confirmed by EC 10/30/2013 $232,000 $259, % TH AVE CIR S 39.5 Feet No No In 100 year 10/16/2015 $235,000 $189, % TH AVE N 39.5 Feet No No Too close to call 7/1/2015 $236,000 $213, % OAKPORT ST N 39 Feet No No In 100 year 5/15/2009 $236,500 $291, % RIVERVIEW CIR S 39.5 Feet No No In 100 year 9/20/2013 $240,000 $261, % WALL ST AVE N 39.5 Feet No No In 100 year 9/12/2014 $240,000 $287, % TH ST S 38.1 Feet Yes No In 100 year confirmed by EC 6/4/2013 $241,400 $186, % RIVERVIEW CIR S 39 Feet No No In 100 year 6/14/2013 $243,000 $259, % RIVERSHORE DR S 39 Feet No No In 100 year 6/27/2014 $249,900 $244, % RIVERSHORE DR S 39.5 Feet Yes Yes Confirmed out by LOMC # P 5/31/2013 $250,000 $229, % WALL STREET AVE NW39.5 Feet No No Likely out by LiDAR 8/18/2010 $250,000 $243, % TH AVE N 39.5 Feet No No Too close to call 8/25/2015 $252,500 $227, % TH AVE N 41.8 Feet Yes Yes Confirmed out by LOMC # A 11/19/2010 $257,308 $250, % TH AVE SW 42.4 Feet No Yes Confirmed out by LOMC # A 2/24/2009 $260,000 $242, % RIVERVIEW CIR S 39.3 Feet Yes No In 100 year confirmed by EC 6/12/2009 $261,000 $271, % RIVERSHORE DR S 39.7 Feet Yes No Very likely out by EC (No LOMC) 7/15/2015 $265,000 $236, % HORN AVE 39 Feet No Yes Confirmed out by LOMC # P 7/31/2009 $269,500 $289, % TH AVE SW 41.8 Feet Yes Yes Confirmed out by LOMC # A 1/9/2012 $285,000 $265, % ST ST N 40.5 Feet No No Likely out by LiDAR 5/28/2014 $290,000 $232, % RD ST N 39 Feet No No In 100 year 11/22/2010 $293,000 $257, % CADDY AVE 39.3 Feet Yes No In 100 year confirmed by EC 5/13/2009 $305,000 $352, % RIVERSHORE DR S 39.5 Feet No No Very likely in by City survey shots (No EC) 9/26/2014 $315,000 $233, % TH AVE N 38.5 Feet No No In 100 year 6/17/2009 $320,000 $303, % RIVER OAKS PT 40.6 Feet Yes No Very likely out by EC (No LOMC) 3/27/2015 $335,000 $296, % TH AVE N 38.5 Feet no No In 100 year 9/18/2015 $404,000 $337, % TH AVE N 43.6 Feet Yes No Very likely out by EC (No LOMC) 5/29/2015 $470,000 $363, % 69
76 70 Matched Pair Sales in the Flood Plain Parcel_ID Land_Address Floodstage_T Elev_Cert BFE (RIVER LAG 2014 LiDar LOMC Flood Plain Status Sale Date Sale Amount Sale Ratio % Change/Month City Time Adjustment % Difference TH ST S 39 Feet No Yes Confirmed out by LOMC # P 11/29/2011 $112,500 $157, % TH ST S 39 Feet No Yes Confirmed out by LOMC # P 10/26/2012 $165,000 $173, % 4.24% 0.00% 4.24% TH AVE CIR S 39.5 Feet No No In 100 year 12/17/2013 $165,000 $168, % TH AVE CIR S 39.5 Feet No No In 100 year 10/16/2015 $235,000 $189, % 1.93% 0.63% 1.30% VALLEY AVE 39 Feet Yes Yes Confirmed out by LOMC # P 2/12/2010 $150,500 $200, % VALLEY AVE 39 Feet Yes Yes Confirmed out by LOMC # P 12/29/2011 $190,000 $200, % 1.14% 0.00% 1.14% TH AVE N 38.5 Feet No No In 100 year 6/17/2009 $320,000 $303, % TH AVE N 38.5 Feet no No In 100 year 9/18/2015 $404,000 $337, % 0.35% 0.29% 0.06% VALLEY AVE 39 Feet No Yes Confirmed out by LOMC # P 2/10/2011 $180,000 $186, % VALLEY AVE 39 Feet No Yes Confirmed out by LOMC # P 4/30/2015 $216,000 $226, % 0.39% 0.36% 0.03% TH AVE N 39.5 Feet No No In 100 year 5/20/2011 $160,000 $160, % TH AVE N 39.5 Feet no No In 100 year 12/20/2013 $172,000 $175, % 0.24% 0.26% 0.02% TH ST S 39.1 Feet Yes No In by Elevation Certificate 3/23/2012 $175,000 $144, % TH ST S 39.1 Feet Yes No In by Elevation Certificate 10/30/2015 $186,000 $142, % 0.15% 0.49% 0.34% Time Adjustments Year Annual Monthly A % 0.20% A % 0.00% A % 0.00% A % 0.00% A % 0.52% A % 0.63% A % 0.63% Observation: Matched pair sales data shows a tendancy of homes in the flood plain to increase in value at a faster rate than the City wide time trends.
77 MEMO TO: FROM: Michael Redlinger, City Manager Nathan Aakre, Assessor s Office DATE: October 12, 2015 RE: Commercial Land Values on Main Avenue, Center Avenue, and 1 st Avenue North The Request Council Member Haney, in a recent to the City Manager, referenced actions of the 2015 Moorhead Board of Appeal and Equalization (BOAE), to equalize values of commercial property, which varied from $3 $6 per square foot, along the 1 st Avenue North corridor. The request of Council Member Haney was to receive a spreadsheet and map showing assessed values of commercial property along the Center Avenue (Red River to 14 th St.) and Main Ave. (Red River to I 94) corridors and any changes in values over the years (see Council Member Haney attached). The Process and Art of Establishing Value: Local Assessors, the Minnesota Department of Revenue, and the Market In brief, local assessors determine, for the purpose of establishing a property s value, its: 1) class (commercial, residential/apartment, industrial); 2) quality and condition of improvements; and 3) type of functional use (warehouse, office, retail etc.). Local assessors also allocate value between land and improvements to the land. The Minnesota Department of Revenue (MDOR), pursuant to Minnesota State Statutes, requires the local assessor to value property at its most likely selling price. The goal of this effort is to assure that every property is valued correctly, so that the property taxes paid by the owner, based upon the assessed value of his/her property, are neither too much nor too little. Incorrect valuation practices shift the responsibility for the payment of property taxes from one property owner to another property owner in the same jurisdiction, in this case the City of Moorhead. To assist the local assessor and assure the true and correct value of property is achieved, MDOR provides significant oversight, including several statistical metrics to gauge the quality of a local jurisdiction s assessment practices and compliance with MDOR statutes and rules. One of these benchmarks is the Sales Ratio. Others include the Coefficient of Dispersion and Quintile Timeline. The Sales Ratio is used to measure levels of assessment and ensure uniformity among and across comparable properties of the same class and type. On an annual basis, for each and every commercial property sale judged to be valid and arms length, the Assessors Estimated Market Value is divided by the market sales price to establish a Sales Ratio. To determine if a sale is an arms length sale, the MDOR requires the Assessor s Office to make contact with either the buyer or seller of every commercial sale, and acquire background information specific to that sale. With MDOR guidance 1 71
78 throughout this process, a determination is made as to whether or not the sale was a reflection of the market. MDOR requires the Median Sales Ratio each year for each class of property to be between 90% and 105%. Local assessors work with MDOR utilizing various methods to achieve this ratio. Failure to do so creates the risk of MDOR ordering an across the board adjustment for all property within a class. Obviously, this is the most unfair and unequitable method of achieving the Median Sales Ratio as it shifts additional value onto individual properties which are, by market standards, already valued correctly. The better, preferred method is when local assessors identify segments (types) of the market, in any class, which is having a negative effect on the Median Sales Ratio due to extremely strong market conditions. It is best that these properties be isolated and their values increased to reflect market rather than raise an entire class of property. In summary, the objective of a quality local assessment process is to achieve compliance with MDOR statutes and rules in order to establish accurate and equalized values for all properties in the jurisdiction. Meeting this objective assures all property tax payers in the jurisdiction pay no more or less than their fair share of property taxes. It is also important to recognize that equalizing land values along a corridor does not mean that a single uniform rate for all land within the corridor be established. Comparable land is consistent with like property, but market dictates site specific value (e.g. locational or other unique characteristics of an individual property s land and site improvements located on the corridor). Corridor Analysis Methodology Assessing staff utilized the following methodology to formulate a response to Council Member Haney s inquiry. Rather than undertake a fresh review of several hundreds of parcels along these three corridors, staff reviewed the results of a 2010 Comprehensive Equalization Study, wherein all commercial property parcels along the Main Avenue, Center Avenue, and 1 st Avenue North corridors were equalized amongst the three corridors. This was done in 2010 as part of a three year process to revalue and equalize all commercial land in three segments, based on low sales ratios at that time. The results of that study were mapped and illustrate the range of values that exist in various locations along these corridors. The 2010 study conclusions remain accurate today, based upon sales trends over the last five years, with the exception of 1 st Avenue North. A current Median Sales Ratio Analysis of the three main commercial corridors shows the following: Main Avenue: 99.81% Median Sales Ratio; Land assessed value per square foot range of $1.72 $13.33 Center Avenue: % Median Sales Ratio; Land assessed value per square foot range of $4.00 $ st Avenue North: 81.37% Median Sales Ratio; Land assessed value per square foot range of $1.60 $8.00 Please also note the following adjustments since 2010: A depth factor which was applied to commercial parcels having a depth of less than 150 feet An increase in land values along 1 st Avenue North due to the results of a 2012 Sales Ratio Study which demonstrated market sales values of property along the 1 st Avenue North corridor to be of significantly higher value than the property s assessed value 2 72
79 Additional steps were taken to test the appropriateness of applying the 2010 study results to the current assessed values in light of existing market conditions. Assessing staff selected a representative sample of parcels along each of the three corridors to evaluate. The parcels chosen had varying characteristics, such as: Corner vs. interior Lot depth Physical characteristics Distance from primary intersections Zoning, etc. As part of this process, staff also identified recent property sales along these corridors, some of which consisted of land plus improvements and others which were bare ground only, without improvements and prepared a Sales Ratio Analysis for each specific sale. Result data was illustrated in a matrix as well as mapped. Results and Conclusions A quality assessment is one which values land and improvements as near to the market as possible. Further, since market sales provide the basis for determining assessed values, it is recognized that along the expanse of these corridors, land values will have a range in value reflecting the market. For example, a property located at the corner of 8 th Street and Main Avenue will have a higher square foot land value than one located at the 20/21st St./SE Main Ave. intersection. The results of the current Median Sales Ratio Study are both affirming and concerning at the same time. Currently, both the Main Avenue and Center Avenue Corridors are properly assessed which is verified by the current Median Sales Ratio. However, the 1 st Avenue North Corridor is under assessed which is verified by the Median Sales Ratio of 81.37%. In fact, this is well below MDOR statutes and rules. Assessing staff will review sales data and current assessed valuations along the 1 st Avenue North Corridor within the next several months to determine if an adjustment in per square foot land values is warranted in order to achieve the minimum Median Sales Ratio standard of 90% for commercially classed property. If the low Median Sales Ratio on 1 st Avenue North were to negatively impact the total commercial class sales ratio, MDOR could choose to unilaterally impose an increase in the assessed values of all commercial properties located throughout the entire City. It is possible that the property sales along just one corridor can influence the Sales Ratio for an entire class of property. To explain further, it is first important to recognize that since Moorhead usually has just a handful of qualified commercial sales (106 in the last 10 years, ranging from 6 to 15 per year), a couple of poor sales (low Sales Ratio) will have an inordinate effect on the overall Median Sales Ratio for a particular property class. This fact alone raises the risk of a MDOR imposed increase and demonstrates the importance of maintaining quality assessment practices. However, the efforts of assessing staff can lessen or even eliminate the risk of an across the board MDOR imposed increase. First, assessing staff will engage MDOR staff to discuss the problem and possible 3 73
80 strategies to avoid an across the board increase. All sales used to determine the Median Sales Ratio will be examined and assessing staff will seek to eliminate from the calculation of Median Sales Ratio, those sales it feels are detrimental to Moorhead s interest. Of course, the facts must support staff s claim in this regard. In addition, assessing staff will examine the sales used in determining the Median Sales Ratio to see if certain trends appear. For instance, in today s market (October 2015), small industrial type storage/operations facilities are selling for a premium, more than current assessed values, thus a sub standard Median Sales Ratio will result from these sales. Assessing staff will advocate that this particular property type, within the general class of commercial/industrial property, receive a valuation increase and not the entire class of commercial/industrial property. Another trend which could appear is that sales used in determining the Median Sales Ratio are clustered in a geographical area or corridor. In this instance assessing staff would seek MDOR approval to adjust values within the specific corridor and avoid a MDOR ordered class wide adjustment. The local assessor and the City s BOAE are committed to maintaining top notch, professional assessment practices consistent with state statutes, rules, and MDOR procedures in the City of Moorhead. Attaining this goal assures property owners throughout Moorhead a fair and equitable valuation of their property. The local assessor, trained, certified, and credentialed by MDOR, is the individual responsible to see that this goal is achieved. The BOAE, established by Minnesota Statutes, is an opportunity (in addition to the local assessor) for a property owner to ask questions about the assessment/valuation process and request changes to the assessed value as determined by the local assessor. In order to make the most informed decision on such a request, the BOAE considers information presented by the petitioner and the recommendation of the local assessor to arrive at a decision, which is factually based and consistent with MDOR assessment practice and methods. 4 74
81 75
82 76
83 77
84 78
85 79
86 80
87 81

88 82
89 RECENT SALES Parcel_Number Number Address Corridor Zoning Sale Date Sale Amount Land $ Building $ Land Size Land $/SF Building Size Building $/SF Comments TH ST N 1ST AVE N MU3: Commercial Mixed Use 4/1/2011 $300,000 $82,500 $217,500 15,000 $5.50 1,800 $ Corner of 11th St N and 1st Ave N. $300,000 Commercial + $125,000 Residential sale ST AVE N 1ST AVE N MU3: Commercial Mixed Use 3/19/2013 $60,000 $60,000 7,500 $ #DIV/0! Interior lot between 12th and 13th St on 1st Ave N. Purchased by Matt's Automotive in order to add on to existing business ST AVE N 1ST AVE N MU3: Commercial Mixed Use 9/30/2011 $275,000 $80,625 $194,375 15,750 $5.12 3,200 $60.74 Combined corner and interior lots on 1st Ave N and 13th St. Buyer was leasing with the option to purchase ST AVE N 1ST AVE N MU3: Commercial Mixed Use 3/4/2013 $250,000 $106,600 $143,400 19,384 $5.50 7,360 $19.48 Corner of 1st Ave N and 14th St N. Purchased as offices, showroom and shop; and converted to a retail store ST AVE N 1ST AVE N MU3: Commercial Mixed Use 12/16/2013 $150,000 $57,200 $92,800 35,850 $1.60 1,456 $63.74 Long, narrow parcel on the corner of 8th St and 1st Ave N. Minimal utility due to lack of depth ST AVE N 1ST AVE N MU3: Commercial Mixed Use 4/18/2014 $185,000 $185,000 37,591 $4.92 4, Corner of 9th St N and 1st Ave N. Old Hardees - vacant restaurant for multiple years, minimal utility ST AVE N 1ST AVE N CC: Community Commercial 2/8/2011 $65,000 $85,000 -$20,000 14,519 $5.85 9,768 -$2.05 Corner of 18th St N and 1st Ave N. $20,000 demo cost estimated due to asbestos and rediation costs ST AVE N 1ST AVE N MU3: Commercial Mixed Use 2/5/2014 $92,010 $62,200 $29,810 11,312 $5.50 4,544 $6.56 Corner of 1st Ave N and 15th St N. Building was shell building in poor condition TH ST N CENTER AVE MU1: Downtown Mixed Use 7/1/2013 $685,000 $165,500 $519,500 41,372 $ ,000 $8.66 Corner of 10th St and Center Ave. Simon Warehouse CENTER AVE CENTER AVE MU1: Downtown Mixed Use 10/28/2014 $1,090,261 $360,200 $730,061 36,022 $ ,672 $37.11 Corner of 8th St and Center Ave. Also sold in 2012 for $700, / CENTER AVE CENTER AVE MU1: Downtown Mixed Use 6/28/2013 $329,000 $127,500 $201,500 21,250 $ ,400 $17.68 Both interior lots within 1&2 blocks from 8th St on Center Ave. #0450 is a vacant interior lot / CENTER AVE CENTER AVE MU1: Downtown Mixed Use 8/3/2010 $79,800 $52,500 $27,300 8,749 $6.00 8,749 $3.12 Corner of 8th St and Center Ave. NAPA parking lot on East and North sides of building. Building value is concrete CENTER AVE 29 CENTER AVE MU1: Downtown Mixed Use 6/28/2010 $275,000 $30,900 $244,100 5,000 $6.18 5,000 $48.82 Thai Orchid in Moorhead Center Mall HWY 10 E HIGHWAY 10 RC: Regional Commercial 2/7/2014 $1,400,000 $495,700 $904,300 82,624 $6.00 8,805 $ Corner of Hwy 10 and 34th St S. Grizzly's/Bennigan's restaurant / HWY 10 E HIGHWAY 10 RC: Regional Commercial 6/1/2015 $2,274,000 $862,900 $1,411, ,864 $ ,063 $87.85 Hwy 10 corner frontage. Trade for & HWY 10 E HIGHWAY 10 RC: Regional Commercial 9/1/2010 $160,000 $180,000 -$20,000 24,696 $7.29 7,500 -$2.67 Hwy 10 Frontage Road. Ole's Nursery, estimated $30,000 demo cost. Demo'd and new Auto Repair shop built 2 months after sale MAIN AVE MAIN AVE CC: Community Commercial 7/21/2010 $160,000 $160,000 16,800 $9.52 3, Corner of Main and 10th St. All value in the land - building in poor condition and was completely remodeled after sale MAIN AVE MAIN AVE MU3: Commercial Mixed Use 4/23/2014 $200,000 $200,000 15,000 $ #DIV/0! Corner of 9th St and Main Ave. Multi-parcel with , now combined MAIN AVE MAIN AVE CC: Community Commercial 5/11/2012 $150,000 $170,000 -$20,000 17,819 $ #DIV/0! Interior lot between 10th and 11th St on Main Ave. Purchased by CMCU, demo'd existing Don's Car Wash (est $20,000) MAIN AVE MAIN AVE MU3: Commercial Mixed Use 10/1/2009 $220,000 $92,100 $127,900 26,325 $3.50 4,054 $31.55 Interior lot between 13th and 14th St on Main Ave. Purchased with neighboring corner lot MAIN AVE MAIN AVE MU3: Commercial Mixed Use 10/1/2009 $30,000 $20,600 $9,400 6,250 $3.30 6,250 $1.50 Corner lot on 13th St and Main Ave. Building value is concrete parking lot in poor condition / TH AVE S MAIN AVE SE LI: Light Industrial 1/29/2015 $225,000 $125,700 $99,300 62,934 $2.00 2,880 $34.48 Interior lot off of Main Ave SE on 20th Ave. Sale was for $375,000 minus $150,000 inventory MAIN AVE SE MAIN AVE SE CC: Community Commercial 8/8/2014 $453,500 $453, ,142 $ #DIV/0! Known contamination TH ST S MAIN AVE SE RC: Regional Commercial 3/30/2011 $91,341 $91,341 20,473 $ #DIV/0!.47 acres split off of and merged with TH AVE S MAIN AVE SE LI: Light Industrial 8/2/2013 $104,750 $104,750 45,000 $ #DIV/0! Interior lot off of Main Ave SE on 16th Ave. Aggressive Towing site. $96,750 + $8,000 in special assessments / MAIN AVE SE MAIN AVE SE CC: Community Commercial 1/24/2014 $600,000 $424,400 $175, ,681 $2.36 6,300 $27.87 Corner of 16th Ave and Main Ave SE. Frontage parcel allocated at $2.75/SF, interior parcel allocated at $2.25/SF TH AVE S MAIN AVE SE CC: Community Commercial 7/21/2014 $80,000 $28,400 $51,600 12,600 $2.25 1,256 $41.08 Interior lot off of Main Ave SE on 12th Ave. 94 Liquors. 1ST AVE N SALES RATIO ANALYSIS Parcel Sale Date Sale Amount Sale Sales Ratio Comments /16/2013 $150,000 $240, % This sale triggered the commercial land depth factor adjustments, and EMV has been reduced /18/2014 $185,000 $206, % Abandoned Hardees building /4/2013 $250,000 $229, % Clothes Junkie /8/2011 $65,000 $58, % Helgeson building /5/2014 $92,010 $67, % Valley Windows & Siding /30/2011 $275,000 $189, % Matt's Automotive /1/2011 $425,000 $230, % Moorhead Auto Center and adjacent residential parcel /9/2013 $60,000 $24, % Land adjacent to Matt's Automotive. Median Sales Ratio: 81.37% CENTER AVENUE SALES RATIO ANALYSIS Parcel Sale Date Sale Amount Sale Sales Ratio Comments /1/2010 $160,000 $168, % Advanced Alignment /28/2010 $275,000 $276, % Thai Orchid in Moorhead Center Mall /7/2014 $1,400,000 $1,403, % Bennigans /1/2013 $685,000 $685, % Simon Warehouse /0740 6/28/2013 $329,000 $327, % Two interior lots on Center Avenue 1&2 blocks from 8th Street /28/2014 $1,090,261 $1,074, % Corner of Center Avenue and 8th Street /0770 8/3/2010 $79,800 $65, % Two open lots surrounding NAPA /0020 6/1/2015 $2,274,000 $1,813, % Muscatell. Median Sales Ratio: 99.81% MAIN AVENUE SALES RATIO ANALYSIS Parcel Sale Date Sale Amount Sale Sales Ratio Comments /11/2012 $150,000 $204, % Central Minnesota Credit Union - Was Don's Car Wash, CMCU bought and demolished /21/2010 $160,000 $216, % Now the location of 99 Bottles /8/2014 $453,500 $575, % Former truck stop with known contamination /30/2011 $91,341 $102, % 0.47 Acres split and sold to Minnesota School of Business /21/2014 $80,000 $84, % 94 Liquors /1/2009 $30,000 $30, % Parking lot next to Ray's Auto Repair /1140 1/24/2014 $600,000 $606, % Mortenson Masonry - Commercial and Residential /1/2009 $220,000 $209, % Ray's Auto Repair /0055 1/29/2015 $225,000 $195, % Lien Excavating - Total sale was $375,000 but Land + Building in sale was $225, /2/2013 $104,750 $90, % Aggressive Towing land /23/2014 $200,000 $150, % New Subway. Median Sales Ratio: % 83
90 COMMERCIAL LAND VALUE SAMPLE 1ST AVENUE NORTH PARCEL ADDRESS ZONING LAND $/SF COMMENTS st Ave N MU3: Commercial Mixed Use $5.50 No recent changes. Corners of 9th and 10th St N and 1st Ave N st Ave N MU3: Commercial Mixed Use $3.50 No recent changes. Interior lot 2 blocks from 8th St, 1 block from 11th St N st Ave N MU3: Commercial Mixed Use $5.50 Increased from $4/SF to $5.50/SF in Corner of 13th St and 1st Ave N st Ave N MU3: Commercial Mixed Use $4.50 Reduced from $5.50/SF to $5/SF to $4.50/SF in 2014 and 2015 by BOE. Corner of 14th St and 1st Ave N st Ave N MU3: Commercial Mixed Use $4.125 Reduced from $5.50/SF in 2013 by BOE via 25% discount for contamination. Corners of 15th St and 16th St N and 1st Ave N st Ave N CC: Community Commercial $5.50 Increased from $4/SF to $5.50/SF in Corner of 17th St and 1st Ave N st Ave N CC: Community Commercial $4.125 Actually $5.50/SF less $20,000 for demo costs. Corner of 18th St and 1st Ave N. CENTER AVENUE PARCEL ADDRESS ZONING LAND $/SF COMMENTS Center Ave MU1: Downtown Mixed Use $10.00 No recent changes. Corner lot of 6th St and Center Ave Center Ave MU1: Downtown Mixed Use $10.00 No recent changes. Corner lot of 8th St and Center Ave th St S CC: Community Commercial $6.00 No recent changes. Interior lot near 8th St th St N MU1: Downtown Mixed Use $4.00 No recent changes. 2 blocks away from 8th St Center Ave CC: Community Commercial $ % Depth Factor adjustment for A15. 3 blocks away from 8th St Hwy 10 E RC: Regional Commercial $7.00 No recent changes. Corner of 21st St and Center Ave Hwy 10 E RC: Regional Commercial $6.00 No recent changes. Interior lot on Frontage Road off of Center Ave Hwy 10 E RC: Regional Commercial $8.00 No recent changes. Highway 10 corner frontage Hwy 10 E RC: Regional Commercial $6.00 No recent changes. Corner of Hwy 10 and 34th St. MAIN AVENUE PARCEL ADDRESS ZONING LAND $/SF COMMENTS th St S MU1: Downtown Mixed Use $6.75 2% increase in 2009 to that area. Corner of Main and 5th St S Main Ave MU1: Downtown Mixed Use $25.00 No recent changes. Corner of 8th and Main Main Ave CC: Community Commercial $20.00 No recent changes. Interior lot just off of 8th St Main Ave MU3: Commercial Mixed Use $10.00 Reduced from $20/SF in Corner of Main and 10th St S. Failed Assemblage Main Ave CC: Community Commercial $3.00 6% Depth Factor adjustment for A15. Interior lot 3 blocks from 8th St Main Ave MU3: Commercial Mixed Use $3.50 No recent changes. Interior lot 3 blocks from 8th St MU3 zoning on south side of Main th St S CC: Community Commercial $3.00 No recent changes. Corner of 14th and Main Main Ave CC: Community Commercial $ % Depth Factor adjustment to $3.00/SF for A15. Interior lot between 15th and 16th St on Main st Ave S CC: Community Commercial $ % Depth Factor adjustment to $3.00/SF for A15. Interior lot between 16th and 17th St on Main Main Ave SE CC: Community Commercial $4.00 Increased from $3/SF to $4/SF in 2012 during Industrial Park revaluation. Corner of 12th Ave S and Main Ave SE Main Ave SE CC: Community Commercial $2.75 Increased from $2.50/SF to $2.75/SF in 2012 Industrial Park revaluation. Corner of 16th Ave S and Main Ave SE Main Ave SE CC: Community Commercial $2.15 Increased from $1.90/SF (2008 BOE) to $2.15/SF in 2012 Industrial Park revaluation. Interior lot between 20th Ave and 24th Ave on Main Ave SE th Ave S #2 RC: Regional Commercial $5.00 No recent changes. Corner of 24th Ave S and Main Ave SE. 84
91 2015 EMV 1ST AVENUE NORTH LAND ASSESSMENTS AND SALES RECENT SALE September 2015 (A) ALLOCATED LAND VALUE FROM SALE $4.92/SF 2015 EMV = $5.50/SF $1.60/SF (A) $3.50/SF $5.50/SF (A) 2015 EMV = $5.50/SF $8.00/SF 2015 EMV = $5.00/SF $5.50/SF $5.50/SF (A) 2015 EMV = $5.50/SF 2015 EMV = $1.60/SF (Depth Factor) $5.50/SF (A) 2015 EMV = 5.50/SF $4.125/SF $5.50/SF $5.85/SF 2015 EMV = $4.125/SF ($5.50/SF - Demo) $5.50/SF (Assessor) $4.50/SF (BOE) 85
92 2015 EMV CENTER AVENUE LAND ASSESSMENTS AND SALES RECENT SALE September 2015 (A) ALLOCATED LAND VALUE FROM SALE $6.18/SF (A) 2015 EMV = $6.18/SF $6.00/SF (A) 2015 EMV = $6.00/SF $6.00/SF (A) 2015 EMV = $6.00/SF $10.00/SF $10.00/SF (A) 2015 EMV = $10.00/SF $10.00/SF $6.00/SF $6.00/SF (A) 2015 EMV = $6.00/SF $4.00/SF (A) 2015 EMV = $4.00/SF $3.00/SF 86
93 HIGHWAY 10 LAND ASSESSMENTS AND SALES (A) 2015 EMV RECENT SALE ALLOCATED LAND VALUE FROM SALE September $7.00/SF $6.00/SF $7.29/SF 2015 EMV = $6.00/SF $6.00/SF $8.00/SF (A) 2015 EMV = $8.00/SF $6.00/SF (A) 2015 EMV = $6.00/SF 87

 2015 EMV = 3.50/SF 58.721.0110 $3.00/SF 58.721.0130 $2.40/SF ($3/SF - Depth Factor) 58.721.0130 $2.55/SF ($3/SF - Depth Factor) 88")
94 2015 EMV MAIN AVENUE LAND ASSESSMENTS AND SALES RECENT SALE September 2015 (A) ALLOCATED LAND VALUE FROM SALE $6.75/SF $25.00/SF $9.52/SF 2015 EMV = 10.00/SF $20.00/SF $13.33/SF 2015 EMV = 15.00/SF $10.00/SF $9.54/SF 2015 EMV = $4.00/SF $2.82/SF ($3/SF - Depth Factor) $3.30/SF (A) 2015 EMV = 3.50/SF $3.50/SF $3.50/SF (A) 2015 EMV = 3.50/SF $3.00/SF $2.40/SF ($3/SF - Depth Factor) $2.55/SF ($3/SF - Depth Factor) 88
 2015 EMV = $2.75/SF 58.900.1084 $2.33/SF 2015 EMV = $2.00/SF 58.900.1085 $2.25/SF (A) 2015 EMV = $2.25/SF 58.752.0010 $2.")
95 2015 EMV MAIN AVENUE SE LAND ASSESSMENTS AND SALES RECENT SALE September 2015 (A) ALLOCATED LAND VALUE FROM SALE $2.25/SF (A) 2015 EMV = $2.25/SF $4.00/SF $2.15/SF $1.72/SF 2015 EMV = 2.25/SF $2.75/SF (A) 2015 EMV = $2.75/SF $2.33/SF 2015 EMV = $2.00/SF $2.25/SF (A) 2015 EMV = $2.25/SF $2.75/SF $5.00/SF $4.46/SF 2015 EMV = $5.00/SF Asking $10.00/SF /0055 $2.00/SF (A) 2015 EMV = $2.00/SF 89
96 February 3, 2016 Nathan Aakre City of Moorhead Assessor s Office nathan.aakre@ci.moorhead.mn.us Dear Mr. Aakre: Thank you for submitting your questions to the Property Tax Division regarding property values, which are answered in turn below. Scenario: A number of citizens have expressed concerns over large value increases between the 2015 and 2016 assessment years. Question 1: Do jurisdictions have the authority to phase in value increases on existing single-family residential property? Answer 1: No. All properties are to be valued at market value. No jurisdiction may use an artificial value, or phase in value increases. Question 2: Has the Department of Revenue ever allowed or granted the authority to any jurisdiction to phase in value increases? Or, is there a rule, statute, or standard practice that allows a jurisdiction to do so? Answer 2: The department does not allow individual jurisdictions to phase in property values, nor does any statute at this time. There are special value phase-ins, deferrals, and exclusions (e.g. plat law, Green Acres, etc.), but estimated market value is always full estimated market value. The only instance in which the department would recommend changes in estimated market values is if a sales ratio study for your jurisdiction showed that prices for a given class of property needed to be increased or decreased based on market analysis. You will work with your County Assessor and Property Tax Compliance Officer to make those determinations. If you have any further questions, please contact our division at proptax.questions@state.mn.us. Sincerely, Andrea Fish Supervisor, Information & Education Section Property Tax Division Phone: (651) proptax.questions@state.mn.us 600 N. Robert St., St. Paul, MN An equal opportunity employer If you have a disability, we will provide this material in an alternate format 105
97 Assessor s Office 500 Center Ave - PO Box 779 Moorhead, MN Date: INFORMAL INQUIRY Re: Parcel #: After your inquiry, we reviewed your property at. As a result of this review, we determined that no change to the Value or Classification is warranted. Enclosed are some comparable sales information to support the value placed on your property. Your inquiry and our response is considered informational, and not a formal appeal at this point. If you do not agree with this decision and would like to Formally Appeal, you may attend the 2016 Local Board of Appeal and Equalization meeting on Wednesday, April 20, 2016 at 6:30 PM in the Council Chambers at City Hall in Moorhead to present your appeal to the Board. If you plan on doing so, please call the Assessor s Office at to reserve your time slot at the meeting. If you do not reserve a time, you may still appeal to the Board, but your appeal will be heard according to the Order of Meeting below. In order to appeal to the County Board of Appeal and Equalization, a Formal Appeal must be made to the Local Board of Appeal and Equalization. An inspection of the property may be required before the Board can make a decision. Order of Meeting: 1. Scheduled Residential Appeals 2. Unscheduled Residential Appeals 3. Scheduled Apartment Appeals 4. Unscheduled Apartment Appeals 5. Scheduled Commercial/Industrial Appeals 6. Unscheduled Commercial/Industrial Appeals If you do plan on attending the meeting, some things you may consider preparing for the Board are: - A list of any sales of comparable properties you are using as support of value. Remember that any special assessments assumed or paid off independent of the sale price must be added to the purchase price. - Any appraisals performed on the subject property in the last three years. Note that there was a 7.5% Annual Time Adjust ment (0.6% Monthly) in 2015, a 7.5% Annual Time Adjustment (0.6% Monthly) in 2014, and a 6.25% Annual Time Adjust ment (0.5% Monthly) in All appraisals and sales must be time-adjusted to January 2, Any lease/rental information including cost and expenses. - Any information regarding physical changes to the property or neighborhood. Feel free to call the Assessor s Office with any questions you may have about this process
98 Assessor s Office 500 Center Ave - PO Box 779 Moorhead, MN Date: FORMAL APPEAL Re: Parcel #: After your inquiry, we reviewed your property at. As a result of this review, the following is our conclusion in regards to the Estimated Market Value for the 2016 Assessment/Taxes Payable 2017: Change the 2016 Classification from to. Reduce the 2016 Value from $ to $. Increase the 2016 Value from $ to $. This is a Formal Appeal at this point, and the above conclusion will be recommended to the Board. If you do not agree with this decision, you may attend the 2016 Local Board of Appeal and Equalization meeting on Wednesday, April 20, 2016 at 6:30 PM in the Council Chambers at City Hall in Moorhead to present your appeal to the Board. Please call or the Assessor s Office at ( assessor@ci.moorhead.mn.us) to notify us of your agreement with this recommendation, or to reserve your time slot at the meeting if you do not agree. If you do not reserve a time, you may still appeal to the Board, but your appeal will be heard according to the Order of Meeting below. This Formal Appeal also preserves your right to appeal to the County Board of Appeal and Equalization. Order of Meeting: 1. Scheduled Residential Appeals 2. Unscheduled Residential Appeals 3. Scheduled Apartment Appeals 4. Unscheduled Apartment Appeals 5. Scheduled Commercial/Industrial Appeals 6. Unscheduled Commercial/Industrial Appeals If you do plan on attending the meeting, some things you may consider preparing for the Board are: - A list of any sales of comparable properties you are using as support of value. Remember that any special assessments assumed or paid off independent of the sale price must be added to the purchase price. - Any appraisals performed on the subject property in the last three years. Note that there was a 7.5% Annual Time Adjust ment (0.6% Monthly) in 2015, a 7.5% Annual Time Adjustment (0.6% Monthly) for 2014, and a 6.25% Annual Time Adjust ment (0.5% Monthly) in All appraisals and sales must be time-adjusted to January 2, Any lease/rental information including cost and expenses. - Any information regarding physical changes to the property or neighborhood. Feel free to call the Assessor s Office with any questions you may have about this process OFFICE USE ONLY Owner Agreed via ( ) Phone; ( ) ; ( ) In Person; Date: / / Owner Disagreed via ( ) Phone; ( ) ; ( ) In Person; Date: / / AND ( ) will attend ( ) will not attend Board of Equalization Meeting. No Response - Assessment Staff Recommendation 107
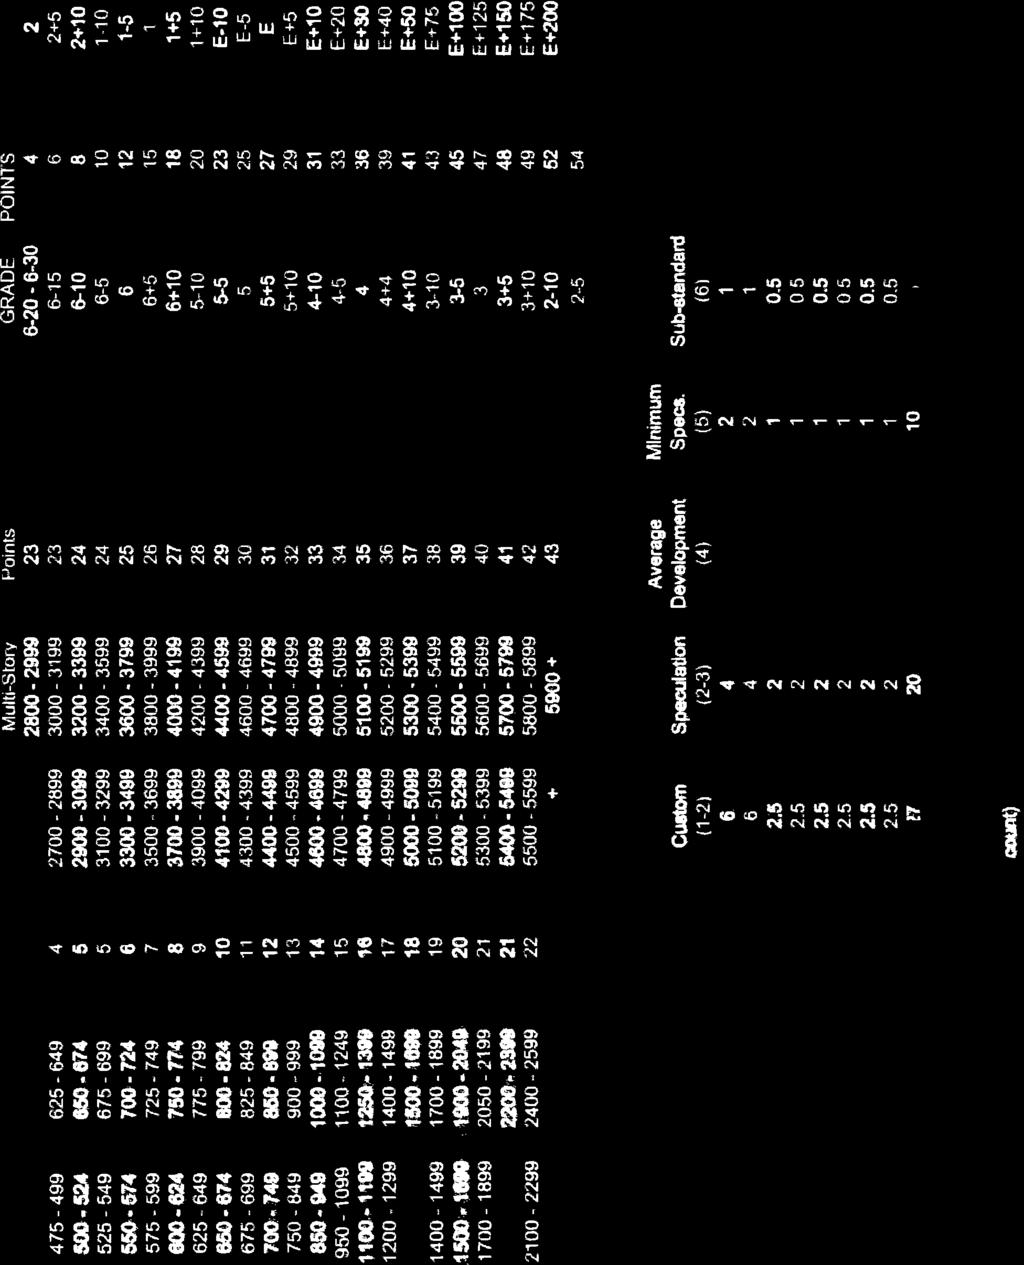
99 108

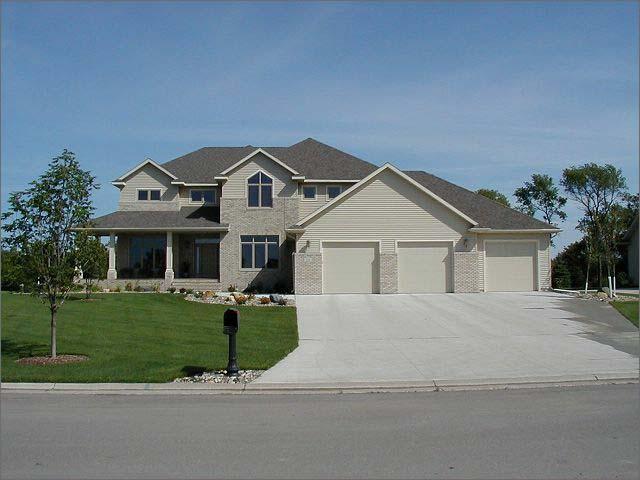


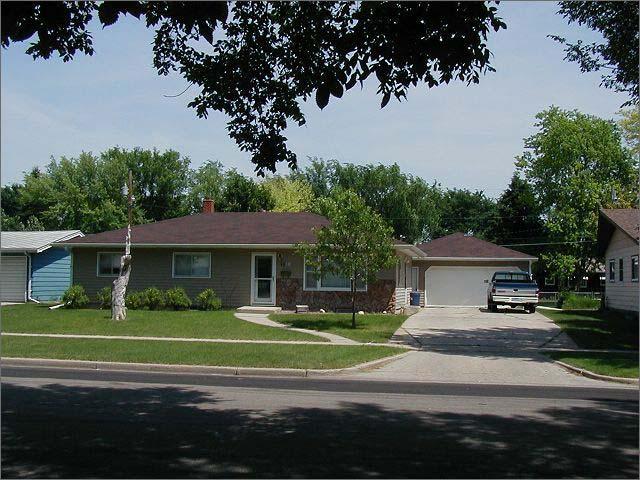
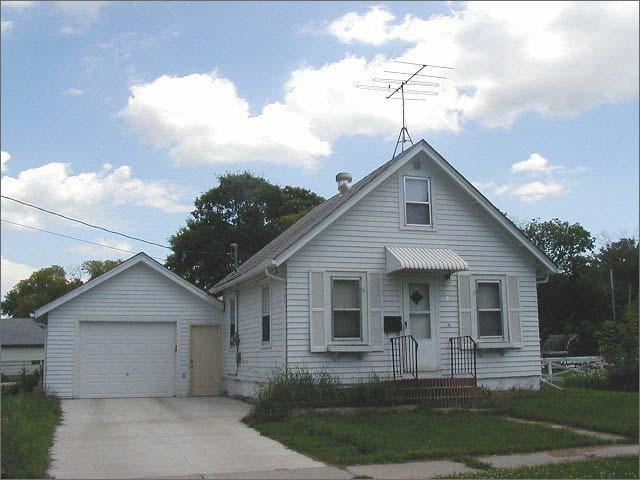
100 Vanguard CAMA Residential Grading Grade: E Grade: 1 Grade: 2 Grade: 3 Grade: 4 Grade: 5 109
Introduction. Bruce Munneke, S.A.M.A. Washington County Assessor. 3 P a g e
 Assessment 2016 Report This report includes specific information regarding the 2016 assessment as well as general information about both the appeals and assessment processes. Contents Introduction... 3
Past & Present Adjustments & Parcel Count Section... 13
 Assessment 2017 Report This report includes specific information regarding the 2017 assessment as well as general information about both the appeals and assessment processes. Contents Introduction... 3
Board of Appeal and Equalization Handbook
 Board of Appeal and Equalization Handbook This handbook was created to satisfy the training requirements of Minnesota Statutes, sections 274.014 and 274.135 Updated January 2018 Table of Contents Introduction...
We look forward to working with you to build on our collaboration and enhance our partnership on behalf of all Minnesotans.
 Date: February 27, 2017 To: County Assessors, Auditors, and Treasurers From: Cynthia Rowley, Director Property Tax Division Subject: Property Tax Services Report The Property Tax Division of the Minnesota
We hope the trends provide additional perspective on your county s work. We know it provided valuable insight on the work we do here at Revenue.
 Date: March 6, 2018 To: County Assessors, Auditors, and Treasurers From: Jon Klockziem, Acting Director Subject: Property Tax Services Report The Property Tax Division of the is pleased to provide the
2011 ASSESSMENT RATIO REPORT
 2011 Ratio Report SECTION I OVERVIEW 2011 ASSESSMENT RATIO REPORT The Department of Assessments and Taxation appraises real property for the purposes of property taxation. Properties are valued using
April 12, The Honorable Martin O Malley And The General Assembly of Maryland
 April 12, 2011 The Honorable Martin O Malley And The General Assembly of Maryland As required by Section 2-202 of the Tax-Property Article of the Annotated Code of Maryland, I am pleased to submit the
ASSESSMENT AND TAXATION
 ABSTRACT A brief synopsis of the assessment, appeal and taxation process as implemented by the Code of Iowa and Administrative Rules. ASSESSMENT AND TAXATION Iowa State Association of Assessors General
Special Plainview City Council Meeting Board of Appeals and Equalization Meeting AGENDA Tuesday, April 16, 2019, at 6:00 P.M.
 Special Plainview City Council Meeting Board of Appeals and Equalization Meeting AGENDA Tuesday, April 16, 2019, at 6:00 P.M. Special meetings are meetings held at a time or place that is different from
CITY OF OWATONNA ASSESSMENT REPORT. Steele County Assessor s Department. William G. Effertz, SAMA Steele County Assessor
 2017 CITY OF OWATONNA ASSESSMENT REPORT Steele County Assessor s Department William G. Effertz, SAMA Steele County Assessor Tyler Diersen, AMA, Assistant County Assessor April 11, 2017 2017 Assessment
The Honorable Larry Hogan And The General Assembly of Maryland
 2015 Ratio Report The Honorable Larry Hogan And The General Assembly of Maryland As required by Section 2-202 of the Tax-Property Article of the Annotated Code of Maryland, I am pleased to submit the Department
DIRECTIVE # This Directive Supersedes Directive # and #92-003
 Division Of Property Valuation Docking State Office Building 915 SW Harrison St., Room 400N Topeka, KS 66612-1588 Nick Jordan, Secretary David N. Harper, Director phone: 785-296-2365 fax: 785-296-2320
GENERAL ASSESSMENT DEFINITIONS
 21st Century Appraisals, Inc. GENERAL ASSESSMENT DEFINITIONS Ad Valorem tax. A tax levied in proportion to the value of the thing(s) being taxed. Exclusive of exemptions, use-value assessment laws, and
Assessment Year 2016 Assessment Valuations / Mass Appraisal Summary Report
 Assessment Year 2016 Assessment Valuations / Mass Appraisal Summary Report Overview Following up on last year s work, additional work was done cleaning up the sales data. The land valuation model was further
2017 Property Values and Assessment Practices Report Assessment Year 2016
 2017 Property Values and Assessment Practices Report Assessment Year 2016 Property Tax Division March 1, 2017 Per Minnesota Statutes, section 3.197, any report to the Legislature must contain, at the
Duties of the Assessors
 Duties of the Assessors Value Properties Determine New Growth Set Tax Rate Assess Property Taxes Abate & Exempt Taxes Manage Overlay Account Assess Local Excises 1 Value Property Assessments based on fair
ASSESSORS ANSWER FREQUENTLY ASKED QUESTIONS ABOUT REAL PROPERTY Assessors Office, 37 Main Street
 A. THE ASSESSMENT PROCESS: ASSESSORS ANSWER FREQUENTLY ASKED QUESTIONS ABOUT REAL PROPERTY Assessors Office, 37 Main Street What is mass appraisal? Assessors must value all real and personal property in
2018 Property Values and Assessment Practices Report Assessment Year 2017
 This document is made available electronically by the Minnesota Legislative Reference Library as part of an ongoing digital archiving project. http://www.leg.state.mn.us/lrl/lrl.asp 2018 Property Values
Rockwall CAD. Basics of. Appraising Property. For. Property Taxation
 Rockwall CAD Basics of Appraising Property For Property Taxation ROCKWALL CENTRAL APPRAISAL DISTRICT 841 Justin Rd. Rockwall, Texas 75087 972-771-2034 Fax 972-771-6871 Introduction Rockwall Central Appraisal
MAAO Sales Ratio Committee 2013 Fall Conference Seminar
 MAAO Sales Ratio Committee 2013 Fall Conference Seminar Presented By: Al Whitcomb Dakota County (Retired) John Keefe Chisago County Assessor Brent Reid City of Coon Rapids Michael Thompson Scott County
YOUNG COUNTY APPRAISAL DISTRICT
 YOUNG COUNTY APPRAISAL DISTRICT 2017 - ANNUAL APPRAISAL REPORT AS OF 10/6/2017 1 2 TABLE OF CONTENTS ITEM PAGE Introduction 4 Purpose of Report...4 Taxing Entities, Rates & Exemptions 5 Property Types
COMAL APPRAISAL DISTRICT ANNUAL APPRAISAL REPORT
 COMAL APPRAISAL DISTRICT 2016 ANNUAL APPRAISAL REPORT TABLE OF CONTENTS Introduction..2 Mission Statement... 2 Purpose of Report...2 Entities Served..2 Legislative Changes.3 Property Types.3 Appraisal
City of Nashua, NH 2018 Revaluation Informational Meeting
 City of Nashua, NH 2018 Revaluation Informational Meeting Legal Requirements Constitutional Duty of the City: [Art.] 6. [Valuation and Taxation.] The public charges of government, or any part thereof,
COMAL APPRAISAL DISTRICT ANNUAL APPRAISAL REPORT
 COMAL APPRAISAL DISTRICT 2017 ANNUAL APPRAISAL REPORT TABLE OF CONTENTS Introduction..2 Mission Statement... 2 Purpose of Report...2 Entities Served..2 Legislative Changes.3 Property Types.3 Appraisal
OFFICE OF PROPERTY ASSESSMENT FISCAL YEAR 2017 BUDGET TESTIMONY April 6, 2016 INTRODUCTION
 OFFICE OF PROPERTY ASSESSMENT FISCAL YEAR 2017 BUDGET TESTIMONY April 6, 2016 INTRODUCTION Good morning, President Clarke and Members of City Council. I am Michael Piper, Chief Assessment Officer. Joining
LLANO CENTRAL APPRAISAL DISTRICT REAPPRAISAL PLAN FOR TAX YEARS 2017 & 2018 AS ADOPTED BY THE BOARD OF DIRECTORS
 LLANO CENTRAL APPRAISAL DISTRICT REAPPRAISAL PLAN FOR TAX YEARS 2017 & 2018 AS ADOPTED BY THE BOARD OF DIRECTORS TABLE OF CONTENTS ITEM PAGE Executive Summary 5 Revaluation Decision (Statutory or Administrative)
Equalization. Overview. Multiplier Basics
 The purpose of this primer is to outline the Illinois Department of Revenue s (IDOR) process in the determination of Cook County s equalization factor commonly known as the multiplier. It describes how
STEVEN J. DREW Assessor OFFICE OF THE ASSESSOR Service, Integrity, Fairness, Internationally Recognized for Excellence
 STEVEN J. DREW Assessor OFFICE OF THE ASSESSOR Service, Integrity, Fairness, Internationally Recognized for Excellence OVERVIEW OF RESIDENTIAL APPRAISAL PROCESS And Cost Valuation Report Introduction The
BOARD OF REVIEW SCRIPT
 BOARD OF REVIEW SCRIPT CLERK'S SCRIPT: 1. Clerk introduces the case by stating the following information: a. Tax Key # b. Property address c. Property Owner d. Mailing address if different. e. Class of
REAL ESTATE MARKET AND YOUR TAX
 REAL ESTATE MARKET AND YOUR TAX ASSESSMENT All of us Island property owners received our tax assessment notices from the County recently. As real estate agents we have been fielding many questions about
UNDERSTANDING PROPERTY TAXES IN COLORADO
 UNDERSTANDING PROPERTY TAXES IN COLORADO This brochure was created to provide general information on the Colorado property tax system. For more specific information on any one of these topics, please visit
Village of Scarsdale
 Village of Scarsdale VILLAGE HALL / 1001 POST ROAD / SCARSDALE, NY 10583 914.722.1110 / WWW.SCARSDALE.COM Village Wide Revaluation Frequently Asked Questions Q1. How was the land value for each parcel
PROPERTY REASSESSMENT AND TAXATION. State Tax Commission Jefferson City, Missouri
 PROPERTY REASSESSMENT AND TAXATION State Tax Commission Jefferson City, Missouri Revised January, 2017 INTRODUCTION Some aspects of the property tax system are confusing to many taxpayers. It is important
Office of Legislative Services Background Report The Revaluation of Real Property: Answers to Frequently Asked Questions About the Revaluation Process
 Office of Legislative Services Background Report The Revaluation of Real Property: Answers to Frequently Asked Questions About the Revaluation Process OLS Background Report No. 119 Prepared By: Local Government
Date: March 2018 TOWN OF WATERFORD Department of Assessment
 Date: March 2018 TOWN OF WATERFORD 1. Overview: The purpose of this workshop is to explain the Assessment Disclosure Notice, how assessments are derived and how to challenge your assessment if you do not
PIATT COUNTY BOARD OF REVIEW RULES & PROCEDURES 2013
 PIATT COUNTY BOARD OF REVIEW RULES & PROCEDURES 2013 1. SUGGESTION. It is strongly recommended that the tax payer discuss his or her assessment with their township assessor prior to filing a complaint
Revaluation process ongoing in Norwalk
 Revaluation process ongoing in Norwalk Property owners will have the opportunity to appeal assessment beginning December 5 (Norwalk, Conn.) The City of Norwalk is in the final phase of its revaluation
Publication 136 April 2016
 Illinois Department of Revenue Constance Beard, Director Publication 136 April 2016 Property Assessment and Equalization The information in this publication is current as of the date of the publication.
Property Assessment Seminar
 1 Property Assessment Seminar Bloomfield Township Property Appeals Process Understanding the assessment change notice and preparing for the March Board of Review. The Seminar will also include a question
The Department s Role
 CITY ASSESSOR The Department s Role on the h Ci City s T Team August 21, 2013 Who we are... Micheal Lohmeier City Assessor (2012) (Commercial Appraiser 1998-2005, Assr. 2010-12) 12) Administration and
QUESTIONS? CALL THE ASSESSOR S OFFICE
 2018 GRIEVANCE PACKET PLEASE NOTE: The Assessor s Office will make five (5) copies of the RP 524 complaint form and suppor ng documenta on for the Board of Assessment Review members if received on or before
A GUIDE TO THE PROPERTY VALUATION APPEAL PROCESS - EQUALIZATION APPEALS*
 A GUIDE TO THE PROPERTY VALUATION APPEAL PROCESS - EQUALIZATION APPEALS* LAND AND BUILIDNGS USED FOR RESIDENTIAL AND COMMERICAL PURPOSES (*IN COUNTIES WITHOUT HEARING OFFICER/PANELS) (Rev. 08/2016) Kansas
City of Norwalk Revaluation Project
 City of Norwalk 2018 Revaluation Project Presenter: Paul Miller Supervisor: Salim Serdah Appraisers: James Steiner, John Valente, Steve Beccio, Rich Nicolosi, and Gynt Grube. Why Revaluation? It s important
INTRODUCTION MISSION OVERVIEW
 INTRODUCTION The Austin County Appraisal District is a political subdivision of the State of Texas. The Constitution of the State of Texas, the Texas Property Tax Code, and the Rules of the Texas Comptroller
Camp Central Appraisal District LEGAL AND ADMINISTRATIVE REQUIREMENTS
 Camp Central Appraisal District LEGAL AND ADMINISTRATIVE REQUIREMENTS Counties are responsible for creating and establishing an Appraisal District. As a political subdivision of the state the major responsibility
GOVERNANCE OF ASSESSOR
 GOVERNANCE OF ASSESSOR State of NH Constitution NH State Statutes (RSA) State Supreme Court Case Law NH Assessing Standard Board Rules NH Department of Revenue Rules Professional Code of Conduct (USPAP)
UNDERSTANDING PROPERTY ASSESSMENT APPEALS A GUIDE TO REGULAR ASSESSMENT APPEALS UNDER TRUE MARKET VALUE AND COMMON LEVEL RANGE STANDARDS
 UNDERSTANDING PROPERTY ASSESSMENT APPEALS A GUIDE TO REGULAR ASSESSMENT APPEALS UNDER TRUE MARKET VALUE AND COMMON LEVEL RANGE STANDARDS This information was developed to assist property owners in preparing
2019 Revaluation Update. Presented by the Mecklenburg County Assessor s Office
 2019 Revaluation Update Presented by the Mecklenburg County Assessor s Office Progress to Date 203,933 Parcels Completed 914 Residential Neighborhoods Completed (57%) All neighborhoods will be completed
IMPORTANT ANNOUNCEMENT: Our website is changing! Please click here for details.
 IMPORTANT ANNOUNCEMENT: Our website is changing! Please click here for details. Home Search Downloads Exemptions Agriculture Maps Tangible Links Contact Home Frequently Asked Questions (FAQ) Frequently
Saskatchewan Municipal Board Assessment Appeals Committee
 Saskatchewan Municipal Board Assessment Appeals Committee Appeal: 2009-0039 RESPONDENT: Town of Hudson Bay In the matter of an appeal to the Assessment Appeals Committee, Saskatchewan Municipal Board,
Minnesota Department of Revenue 2012 Sales Ratio Study Criteria
 Minnesota Department of Revenue 2012 Sales Ratio Study Criteria Special Notes Forward-Adjusted Methodology Transition In the 2012 sales ratio study, the Department of Revenue will use a forward-adjusted
Cook County Assessor s Office: 2019 North Triad Assessment. Evanston Residential Assessment Narrative Updated: April 8 th, 2019
 Cook County Assessor s Office: 2019 North Triad Assessment Evanston Residential Assessment Narrative Updated: April 8 th, 2019 1 Updates to this report A previous version of this report was rendered in
Allegan County Equalization Department
 Allegan County Equalization Department 2011 Department Report Equalization Report Recap 2010 2011 projects January 1- December 31, 2010 Blaine R. McLeod Director of Equalization 1 Message from the Director
2014 Annual Report. Fayette County Appraisal District P. O. Box 836 La Grange, TX 78945
 2014 Annual Report Fayette County Appraisal District P. O. Box 836 La Grange, TX 78945 FCAD 2014 Annual Report 1 2014 ANNUAL REPORT FAYETTE COUNTY APPRAISAL DISTRICT INTRODUCTION The Fayette County Appraisal
RAINS COUNTY APPRAISAL DISTRICT
 RAINS COUNTY APPRAISAL DISTRICT 2017 MASS APPRAISAL SUMMARY REPORT mass appraisal report 2017 uspap_appr_report RAINS COUNTY APPRAISAL DISTRICT 2017 MASS APPRAISAL SUMMARY REPORT Identification of Subject:
OFFICIAL PROCEEDINGS City of Williston Local Board of Equalization May 3, :00 pm City Hall Williston, North Dakota
 1. Roll Call of Commissioners OFFICIAL PROCEEDINGS City of Williston Local Board of Equalization May 3, 2017 6:00 pm City Hall Williston, North Dakota COMMISSIONERS PRESENT: Deanette Piesik, Tate Cymbaluk,
For the Property Owner who wants to know!
 For the Property Owner who wants to know! Answers to frequently asked questions concerning PROPERTY ASSESSMENTS and PROCEDURES. Provided by the Town of York Assessor s Office This booklet will attempt
9/27/2017. Your County Government. Leadership Property Assessments Budget Library. Hennepin County Citizens Academy
 Your County Government Leadership Property Assessments Budget Library 1 Welcome Carolyn Marinan, Public Relations Officer Hennepin County Overview Jan Callison, Chair Hennepin County Commissioner, District
ALACHUA COUNTY VALUE ADJUSTMENT BOARD. Process and Procedures 2007
 ALACHUA COUNTY VALUE ADJUSTMENT BOARD Process and Procedures 2007 VALUE ADJUSTMENT BOARD County Commissioner Chair Lee Pinkoson School Board Member Vice Chair Wes Eubank County Commissioner Paula M. DeLaney
MOTLEY COUNTY APPRAISAL DISTRICT
 MOTLEY COUNTY APPRAISAL DISTRICT Jim Finley RPA, RTA Chief Appraiser PO Box 249-104 E California Floydada, Texas 79235 806-983-5256 phone, 806-983-6230 fax floydcad@sbcglobal.net LOCAL PROPERTY TAXATION
Cranes in the air! Amari & Locallo
 Cranes in the air! If you work, live in or visit Chicago s Central Business District (CBD) you cannot help but notice many construction cranes in the air heralding the beginnings of new real estate. You
9/19/2018. Your County Government. Leadership Property Assessments Budget Library
 Your County Government Leadership Property Assessments Budget Library 1 Welcome Hennepin County Citizens Academy Carolyn Marinan, Public Relations Officer Hennepin County Overview Jan Callison, Chair Hennepin
2018 Annual Appraisal Report
 2018 Annual Appraisal Report SUMMARY OF APPRAISAL ACTIVITIES, EXEMPTIONS, EQUALIZATION AND TAX RATES FOR 2018 TAX YEAR Wendy Grams, RPA, CTA, CCA CENTRAL APPRAISAL DISTRICT OF BANDERA COUNTY P. O. BOX
New Models for Property Data Verification and Valuation
 New Models for Property Data Verification and Valuation for 2006 IAAO Councils and Sections Joint Seminar May 9-11, 2006 Charleston, South Carolina Presented by George Donatello, CMS Principal Consultant
Request for Proposals For Assessor. Charter Township of Augusta Washtenaw County
 Request for Proposals For Assessor (Michigan Certified Assessing Officer) Charter Township of Augusta Washtenaw County Charter Township of Augusta 8021 Talladay Road Whittaker, MI 48190 Phone 734-461-6117
Sales Ratio: Alternative Calculation Methods
 For Discussion: Summary of proposals to amend State Board of Equalization sales ratio calculations June 3, 2010 One of the primary purposes of the sales ratio study is to measure how well assessors track
RESIDENTIAL PROPERTY VALUATION PROCESS
 RESIDENTIAL PROPERTY VALUATION PROCESS Introduction Gregg County is comprised of approximately 276 square miles of area. Gregg County Appraisal District (GCAD) is responsible for the appraisal of the approximately
Pickens County Reassessment Program. Utilizing CAMA GIS MLS SQL
 1 Pickens County 2019 Reassessment Program Utilizing CAMA GIS MLS SQL Pickens County Reassessment History 1980 Countywide Reappraisal 1990 Countywide Reappraisal 1999 Countywide Reappraisal 2004 Countywide
FREEDOM OF INFORMATION ACT POSTING
 CHIEF COUNTY ASSESSING OFFICIAL KENDALL COUNTY ANDREW P. NICOLETTI 111 West Fox Street Rm. 303 Yorkville, Illinois 60560-1498 630-553-4146 FREEDOM OF INFORMATION ACT POSTING The purpose of the Freedom
2016 Annual Report. Carmen Ottmer, Chief Appraiser AUSTIN COUNTY APPRAISAL DISTRICT 906 E. AMELIA ST., BELLVILLE, TEXAS 77418
 2016 Annual Report Carmen Ottmer, Chief Appraiser AUSTIN COUNTY APPRAISAL DISTRICT 906 E. AMELIA ST., BELLVILLE, TEXAS 77418 INTRODUCTION The Austin County Appraisal District is a political subdivision
PAYMENT UNDER PROTEST APPEAL GUIDE
 PAYMENT UNDER PROTEST APPEAL GUIDE In Kansas you have two opportunities to appeal the value of your property. If you appeal at the time of paying taxes, it is called a Payment Under Protest. This guide
BOROUGH OF ISLAND HEIGHTS OCEAN COUNTY NEW JERSEY PROFESSIONAL SERVICES SOLICITATION
 BOROUGH OF ISLAND HEIGHTS OCEAN COUNTY NEW JERSEY PROFESSIONAL SERVICES SOLICITATION PROFESSIONAL SERVICES: PROPOSAL FOR REASSESSMENT AND/OR REVALUATION OF ALL PROPERTY IN THE BOROUGH OF ISLAND HEIGHTS
Edmonton Composite Assessment Review Board
 Edmonton Composite Assessment Review Board Citation: CVG v The City of Edmonton, 2013 ECARB 01878 Assessment Roll Number: 10002533 Municipal Address: 10904 102 A venue NW Assessment Year: 2013 Assessment
Revaluation Explained
 Revaluation Explained Northeast Revaluation Group, LLC 615 Jefferson Blvd., Suite 203, Warwick, RI 02886 401-737-0300 support@nereval.com Revaluation Process in a Nutshell 1. Take a group of properties
COMPLAINT ON REAL PROPERTY ASSESSMENT GUIDANCE (UNINCORPORATED TOWN OF GREENBURGH AND ALL VILLAGES) (Residential 1, 2, or 3 family homes)
 (Residential 1, 2, or 3 family homes)") COMPLAINT ON REAL PROPERTY ASSESSMENT GUIDANCE (UNINCORPORATED TOWN OF GREENBURGH AND ALL VILLAGES) (Residential 1, 2, or 3 family homes) Although the assessment staff is very knowledgeable to answer your
COMPLAINT ON REAL PROPERTY ASSESSMENT GUIDANCE (UNINCORPORATED TOWN OF GREENBURGH AND ALL VILLAGES) (Residential 1, 2, or 3 family homes) Although the assessment staff is very knowledgeable to answer your
The Texas Constitution sets out five basic rules for property taxes in our state:
 Why does the appraisal district look at values each year? The Texas Constitution sets out five basic rules for property taxes in our state: 1. Taxation must be equal and uniform. No single property or
How to Petition for a Review of Your Property Taxes: County Board of Equalization
 How to Petition for a Review of Your Property Taxes: County Board of Equalization Talk with the Assessor There are several reasons why you may want to petition for a review of your property taxes. Whatever
Dear Brazos County Citizens and Property Owners,
 2017 Annual Report Dear Brazos County Citizens and Property Owners, It is my pleasure to present the 2017 Annual Report of the Brazos Central Appraisal District. The annual report provides general information
NCGS , ,
 NCGS 105-283, 105-286, 105-317 Requires Counties to establish values based on current market conditions. Values should be at or near 100% of market value as of the reappraisal date. Counties MUST do a
Pecos County Appraisal District. Chief Appraiser: Sam Calderon III
 Pecos County Appraisal District Chief Appraiser: Sam Calderon III Meet Your Appraiser Staff Agenda The goals and objectives of this presentation is to provide Property Owner s an overview of PCAD s Appraisal
Office of the City Auditor. Audit of the Office of the Real Estate Assessor
 Report Date: August 28, 2015 Office of the City Auditor 2401 Courthouse Drive, Room 344 Virginia Beach, Virginia 23456 757.385.5870 Promoting Accountability and Integrity in City Operations Contact Information
EDMONTON Assessment Review Board
 EDMONTON Assessment Review Board 10019 103 Avenue, Edmonton, AB T5J 0G9 Ph: 780-496-5026 Email: assessmentreviewboard@edmonton.ca NOTICE OF DECISION NO.0098 212/12 Canadian Valuation Group The City of
UNDERSTANDING YOUR ASSESSMENT
 UNDERSTANDING YOUR ASSESSMENT An informational booklet explaining property assessments and procedures. Provided by the Town of York Assessor s Office This booklet will attempt to explain the Assessment
VAN ZANDT COUNTY APPRAISAL DISTRICT 2018 ANNUAL REPORT
 VAN ZANDT COUNTY APPRAISAL DISTRICT 2018 ANNUAL REPORT INTRODUCTION The Van Zandt County Appraisal District is a political subdivision of the state. The Constitution of the State of Texas, the Texas Property
MAP. METHODS AND ASSISTANCE PROGRAM 2013 REPORT Hood County Appraisal District. Susan Combs Texas Comptroller of Public Accounts
 MAP METHODS AND ASSISTANCE PROGRAM 2013 REPORT Hood County Appraisal District Susan Combs Texas Comptroller of Public Accounts January 22, 2014 Chief Appraiser County Appraisal District Board of Directors
To: Property Appraisers, Taxing Authorities and Interested Parties From: James McAdams Date: June 5, 2012 Bulletin: PTO 12-04
 Property Tax Oversight Bulletin: PTO 12-04 To: Property Appraisers, Taxing Authorities and Interested Parties From: James McAdams Date: Bulletin: PTO 12-04 FLORIDA DEPARTMENT OF REVENUE PROPERTY TAX INFORMATIONAL
APPEAL PROCESS GUIDE FOR THE PROPERTY OWNER
 2018 APPEAL PROCESS GUIDE FOR THE PROPERTY OWNER IMPORTANT DATES TO KNOW 2018 APPEAL PROCESS TIME FRAME March 1 - assessment notices must be mailed March 15 - last day to file for owner-occupied status
Cook County Assessor s Office: 2019 North Triad Assessment. Norwood Park Residential Assessment Narrative March 11, 2019
 Cook County Assessor s Office: 2019 North Triad Assessment Norwood Park Residential Assessment Narrative March 11, 2019 1 Norwood Park Residential Properties Executive Summary This is the current CCAO
BASTROP CENTRAL APPRAISAL DISTRICT ANNUAL REPORT 2016
 BASTROP CENTRAL APPRAISAL DISTRICT ANNUAL REPORT 2016 EXECUTIVE SUMMARY The first part of the year included gathering information on new construction and the analyzing of data for the 2016 appraisal roll.
Athens County Auditor, Jill Thompson provides homeowners answers to the most commonly asked questions about the countywide 2014 reappraisal
 Contact: Jill Thompson Athens County Auditor Phone 740.592.3223 Fax 740.594.3270 15 S. Court Street, Room 330 Athens, Ohio 45701 www.athenscountyauditor.org Jill Thompson Athens County Auditor Property
METHODOLOGY GUIDE VALUING LANDS IN TRANSITION IN ONTARIO. Valuation Date: January 1, 2016
 METHODOLOGY GUIDE VALUING LANDS IN TRANSITION IN ONTARIO Valuation Date: January 1, 2016 August 2017 August 22, 2017 The Municipal Property Assessment Corporation (MPAC) is responsible for accurately assessing
Understanding Mississippi Property Taxes
 Understanding Mississippi Property Taxes Property tax revenues are a vital component of the budgets of Mississippi s local governments. Property tax revenues allow these governments to provide important
Kitsap County Assessor
 Kitsap County Assessor Narrative for Countywide Model Tax Year: 2018 Appraisal Date: 1/1/2017 Property Type: Hangar - Airplane Area Overview Countywide models are for properties located throughout Kitsap
Reappraisal Important Property Tax Information
 Reappraisal 2013 Important Property Tax Information Spartanburg County Assessor PO Box 5762 Spartanburg, SC 29304 Telephone: (864)596-2544 Fax: (864)596-2940 Fax: (864)596-2223 www.spartanburgcounty.org
H.B. 75 As Introduced
 AM0200X1 H.B. 75 As Introduced Topic: Complaint resolutions; reappraisal notice contents; counterclaims moved to amend as follows: In line 1 of the title, delete "section" and insert "sections 5713.01
EXPLAINING MASS APPRAISAL
 EXPLAINING MASS APPRAISAL PROMOTING THE ROLE OF THE ASSESSOR MAAO SUMMER CONFERENCE, JUNE 24, 2015 RICHARD W. FINNEGAN, MAA Please excuse the length of this letter. I didn t have time to write a short
2018 Annual Report. Fayette County Appraisal District P. O. Box 836 La Grange, TX 78945
 2018 Annual Report Fayette County Appraisal District P. O. Box 836 La Grange, TX 78945 FCAD 2018 Annual Report 1 2018 ANNUAL REPORT FAYETTE COUNTY APPRAISAL DISTRICT INTRODUCTION The Fayette County Appraisal
MAP. METHODS AND ASSISTANCE PROGRAM 2013 REPORT McLennan County Appraisal District. Susan Combs Texas Comptroller of Public Accounts
 MAP METHODS AND ASSISTANCE PROGRAM 2013 REPORT McLennan County Appraisal District Susan Combs Texas Comptroller of Public Accounts January 22, 2014 Chief Appraiser County Appraisal District Board of Directors
Arlington County, Virginia. Internal Audit of the Real Estate Assessment Appeals Process Calendar Year Ended December 31, 2014
 Arlington County, Virginia Internal Audit of the Real Estate Assessment Appeals Process Calendar Year Ended December 31, 2014 Table of Contents Transmittal Letter... 1 Executive Summary... 2-9 Background...