Monthly Research Tool Published by the Denver Metro Association of REALTORS Market Trends Committee. Denver Metro. Real Estate Market Trends Report
|
|
|
- Archibald Todd
- 5 years ago
- Views:
Transcription


1 Monthly Research Tool Published by the Denver Metro Association of REALTORS Market Trends Committee Denver Metro Real Estate Market Trends Report 11-County MLS Stats & Trends for Adams, Arapahoe, Boulder, Broomfield, Clear Creek, Denver, Douglas, Elbert, Gilpin, Jefferson & Park County February Metro Association of REALTORS 1
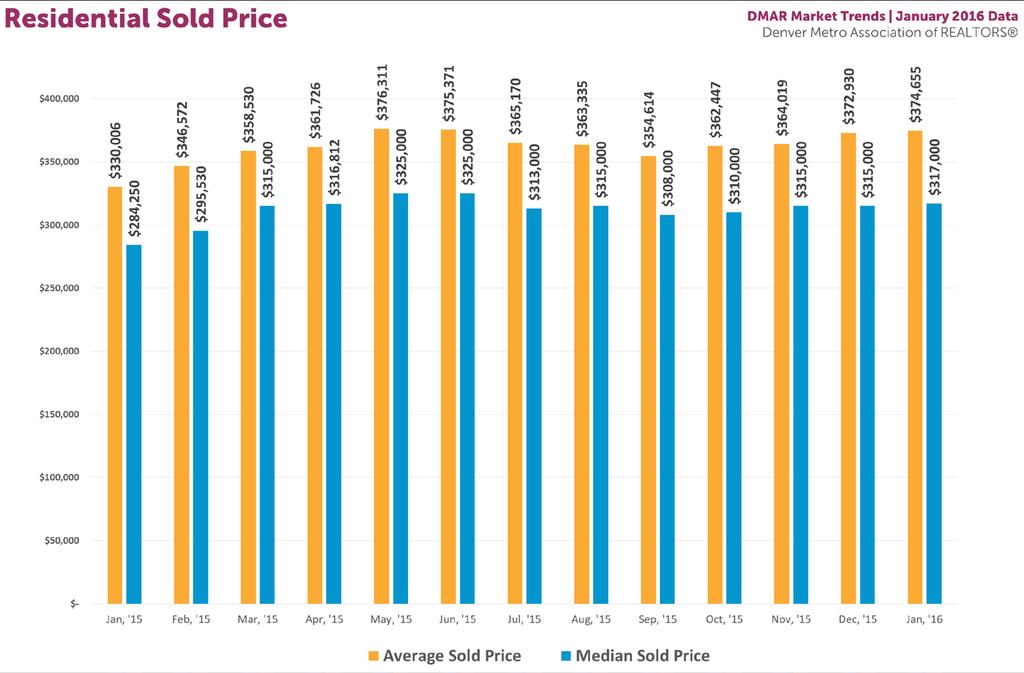
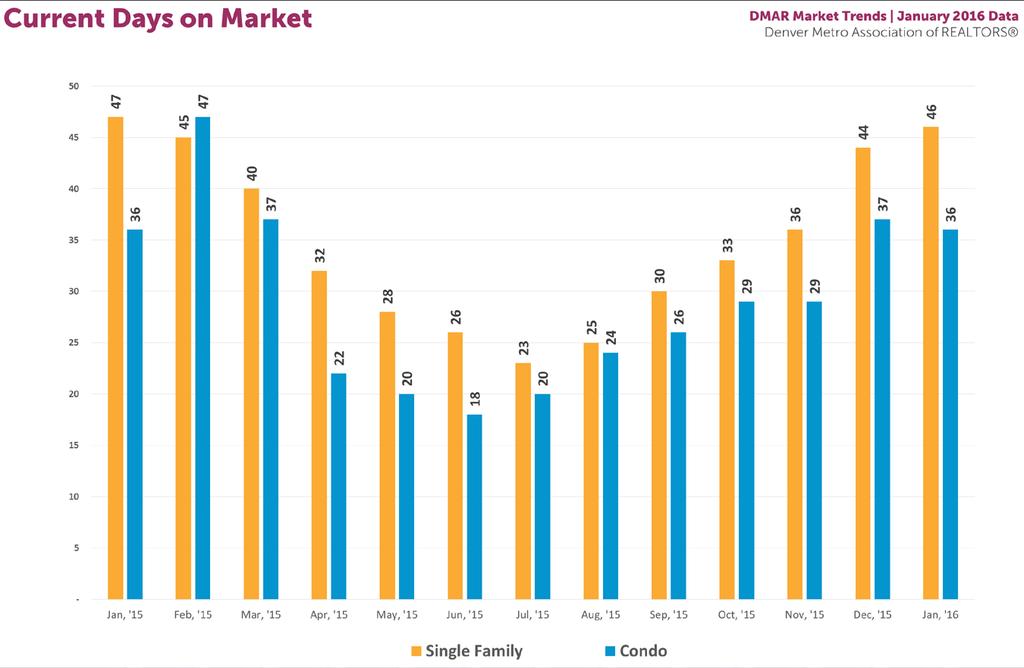
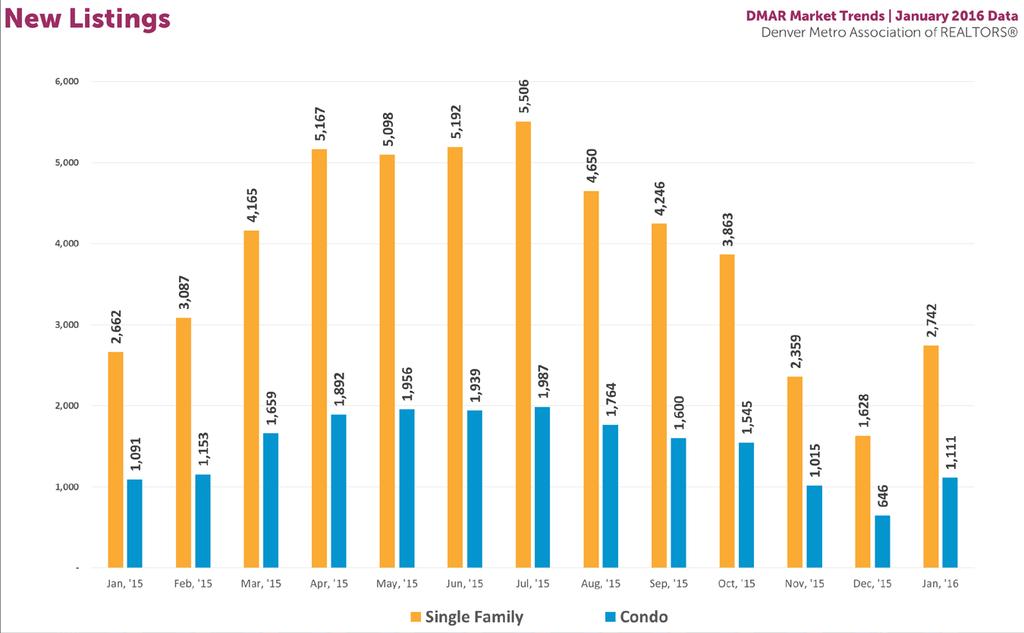
2 The February report, according to recent data provided by the Denver Metro Association of REALTORS Market Trends Committee, showcases the January market transactions encompassing the 11 Counties of the Denver Metro Area*. Here are the highlights: Residential (Single Family plus Condo) Active Inventory 4, % prior month 1.20% YOY Sold Homes 2, % prior month 4.44% YOY Average Sold Price $374, % prior month 13.53% YOY Median Sold Price $317, % prior month 11.52% YOY Average Days on Market % prior month 0.00% YOY Single Family (aka Detached Single Family) Active Inventory 3, % prior month -0.68% YOY Sold Homes 1, % prior month 6.75% YOY Average Sold Price $413, % prior month 11.70% YOY Median Sold Price $346, % prior month 8.13% YOY Average Days on Market % prior month -2.13% YOY Condo (aka Attached Single Family) Active Inventory % prior month 9.28% YOY Sold Homes % prior month -1.20% YOY Average Sold Price $270, % prior month 17.34% YOY Median Sold Price $215, % prior month 15.59% YOY Average Days on Market % prior month 0.00% YOY * Adams, Arapahoe, Boulder, Broomfield, Clear Creek, Denver, Douglas, Elbert, Gilpin, Jefferson, and Park. 2
3 January 2016 set records in all three home categories: Residential, Single Family, and Condo. January 2016 finished with 24% fewer listings under $200,000 than we did in 2014, and 82% fewer listings from January 2013 to Buyer demand remains strong and inventory remains low. More apartments are coming on the grid which is increasing apartment vacancy. Apartment dwellers are looking at the horizon to decide if now is the time to buy. Broker sentiment is that there is so little decent inventory on the market, while buyers are becoming frustrated and worried about the looming spring season. The struggle to find affordable housing continues to be an ongoing issue - especially for first-time home buyers. Low inventory is setting us up for another fast-paced spring that will most certainly rival Educate your buyers and sellers about what the expectations are from all parties, so closing delays or misunderstandings can be prevented. Prepare buyers and sellers for another record selling season. Buyers need to have their financing solidified before starting their search while sellers should be prepared for full disclosure of latent defects in their home. Top three SOLD Price Ranges in thousands, in January 2016 (in order): Single Family: $300 $399; $200 $299; $400 $499. Condo/Townhome: $100 $199; $200 $299; $ Title, Financing and TRID o Contracts are closing in what would be considered a "regular" 30-day closing with agents, lenders and title companies working together to create seamless transactions. o Title companies are reporting an increase in earnest money disputes more so than any other time. DMAR's Market Trends Committee will be digging deeper to provide additional insight. o Interest rates were expected to rise on news that the Fed would be raising rates, yet it seems the opposite has taken place in last 45 days. Buyers are eager to take advantage of this opportunity. o TRID is having an effect on closings as Days Under Contract (DUC) in January was 45 Days - up 5% from December 2015 (43 days) and up 13% year-overyear. 3

 to repeat last year's recordbreaking")
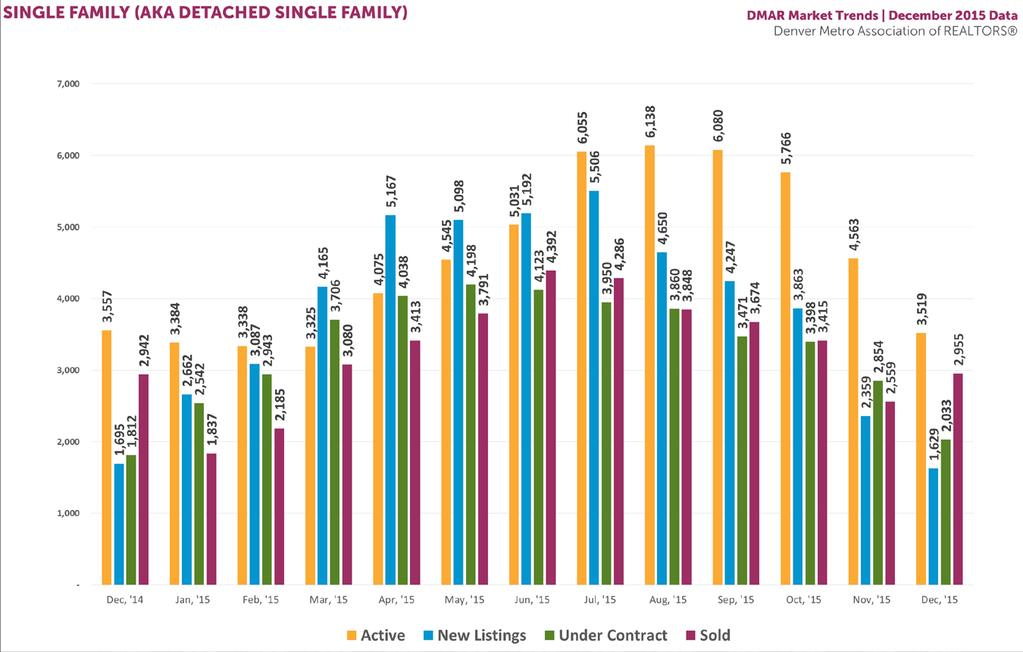
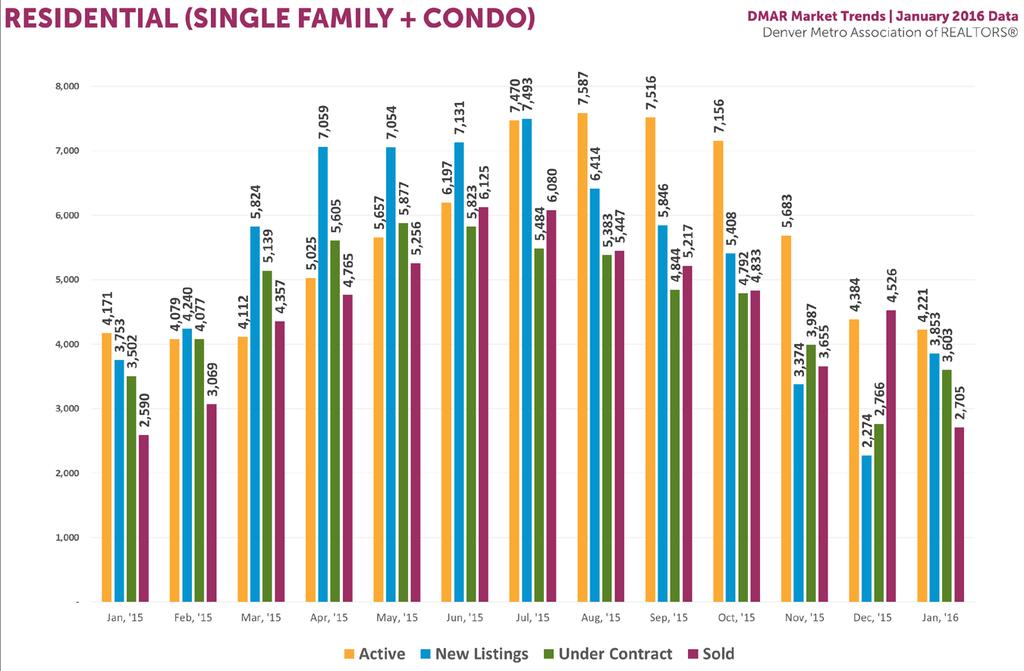
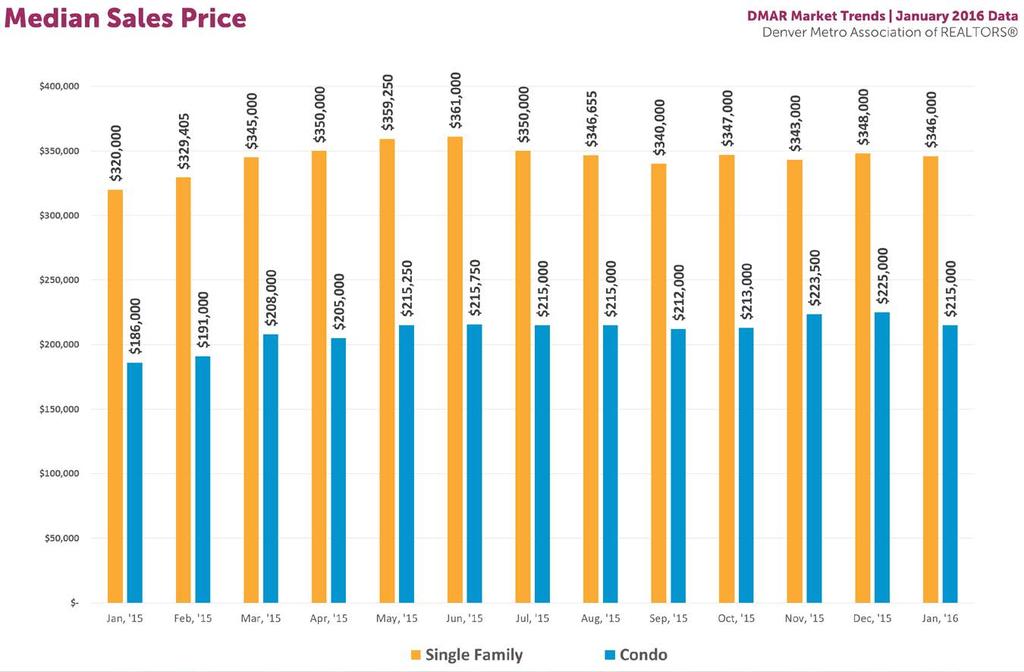
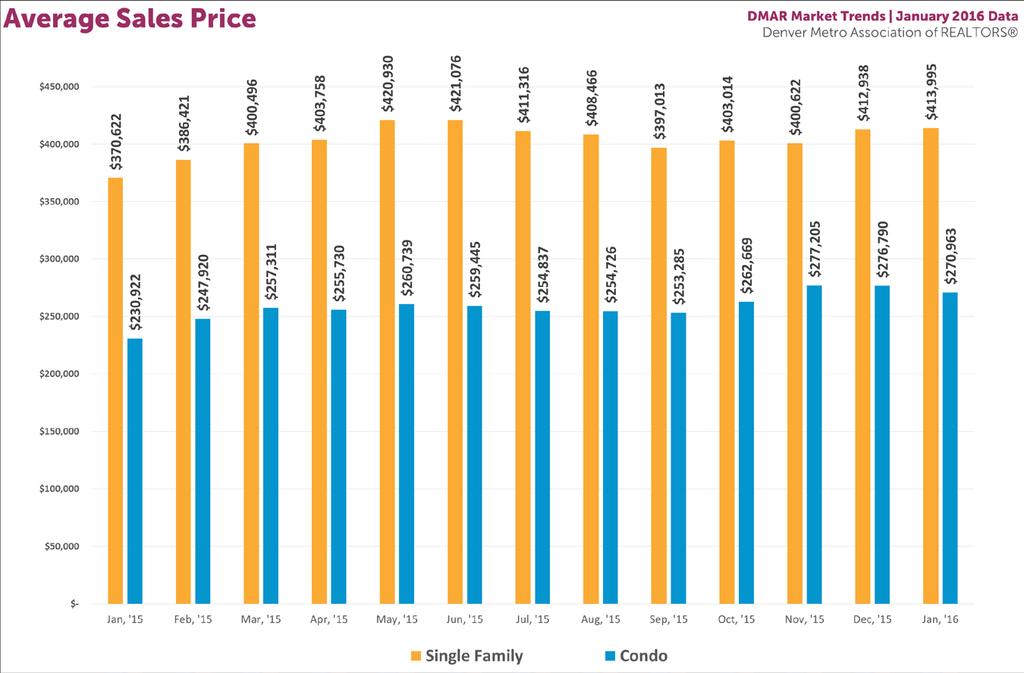
4 As the city finds itself buried in a foot of snow, my fellow REALTORS find ourselves wondering when the avalanche of new listings will make their way into our marketplace. I honestly dislike talking about the ongoing lack of inventory and rapidly increasing home prices each month, but it is what it is and simply put, we have to keep finding ways to do more with less. Looking back at the last three decades ( ), January has averaged 14,426 available listings with a record-high in January 2006 when we had 24,387 - nearly 6x more than today! Even with the inventory reality of today, our 11-County Denver metro area real estate market continues to thrive and 2016 is shaping up (for better or worse) to repeat last year's recordbreaking totals. Digging into and summarizing the January MLS housing stats: For the entire Residential (RES) market, which includes Attached & Detached properties, 3,853 New Listings came on the market (+69.44), 3,603 homes were placed Under Contract (+30.26) and 2,705 homes Sold and Closed (-40.23). We closed out the month with 4,221 Active Listings representing a 3.72% decrease in inventory over the previous month, but 1.20% more properties than we had available in January As we look at the month-over-month Detached Single Family Home market, New Listings spiked 68.43% over the previous month and 3.01% over January Average and Median Sold Prices remained relatively flat from the previous month with a slight increase of 0.26% to $413,995 and decrease of -0.57% to $346,000 respectively. The Condo market (aka Attached Single Family) showed the supply of New Listings skyrocket 71.98% over the previous month and 1.83% year-over-year, while the Average & Median Sold Prices dropped -2.11% to $270,963 and -4.44% to $215,000. For a brief year-over-year perspective, Active, Sold Listings, Average/Median Sales Prices are all well ahead of January 2015 including just over $1 Billion in Sales Volume! Our niche markets of Luxury ($1+ Million) Signature ($750-$999k) and Premier ($500-$750k) are up year-over-year. Final Tidbit: Is anyone else surprised to see mortgage interest rates remaining flat after the Federal Reserve meeting and announcement in December? Currently, mortgage interest rates for a 30-year fixed conventional mortgage with a median credit score of 740 or better are trending ~3.75% and Jumbo money (greater than $417,000) for a 30-year fixed is ~3.625% (with no points)! Don t allow talk of interest rates increases frighten your clients because it's unlikely we'll see any dramatic changes coming soon. - Anthony Rael, Chairman of the DMAR Market Trends Committee 4

5 Metro Association of REALTORS 5
6 6
7 7
8 8
9 9
10 10
11 11
12 12
13 13
14 14
15 Snapshot Month-over-Month and Year-over-Year Comparisons Jan. '16 Prior Month Year Ago Prior Month Year Ago Residential (Single Family + Condo) Active 4,221 4,384 4, % 1.20% New Listings 3,853 2,274 3, % 2.66% Under Contract 3,603 2,766 3, % 2.88% DOM % 0.00% Sold 2,705 4,526 2, % 4.44% Average Sold Price $374,655 $372,930 $330, % 13.53% Median Sold Price $317,000 $315,000 $284, % 11.52% Sales Volume $1,013,441,255 $1,687,880,949 $854,715, % 18.57% Single Family (aka Detached Single Family) Active 3,361 3,519 3, % -0.68% New Listings 2,742 1,628 2, % 3.01% Under Contract 2,594 2,033 2, % 2.05% DOM % -2.13% Sold 1,961 3,196 1, % 6.75% Average Sold Price $413,995 $412,938 $370, % 11.70% Median Sold Price $346,000 $348,000 $320, % 8.13% Sales Volume $811,844,515 $1,319,749,952 $680,831, % 19.24% Condo (aka Attached Single Family) Active % 9.28% New Listings 1, , % 1.83% Under Contract 1, % 5.10% DOM % 0.00% Sold 744 1, % -1.20% Average Sold Price $270,963 $276,790 $230, % 17.34% Median Sold Price $215,000 $225,000 $186, % 15.59% Sales Volume $201,596,740 $368,130,997 $173,884, % 15.94% 15
16 Snapshot Year-to-Date and Year-over-Year Comparisons YTD 2016 YTD 2015 YTD 2014 '16 vs '15 '16 vs '14 Residential (Single Family + Condo) Active 4,221 4,171 6, % % Sold 2,705 2,590 2, % 1.42% Average Sold Price $374,655 $330,006 $303, % 23.60% Sales Volume $1,013,441,255 $854,715,954 $808,419, % 25.36% Single Family (aka Detached Single Family) Active 3,361 3,384 4, % % Sold 1,961 1,837 2, % -3.06% Average Sold Price $413,995 $370,622 $334, % 23.85% Sales Volume $811,844,515 $680,831,834 $676,230, % 20.05% Condo (aka Attached Single Family) Active , % % Sold % 15.53% Average Sold Price $270,963 $230,922 $205, % 32.01% Sales Volume $201,596,740 $173,884,120 $132,189, % 52.51% Connect: To stay up to date with relevant real estate news and statistics please visit and join the conversation using the hashtag #DMARSTATS on social media. 16
17 January Data YTD 2016 to YTD YTD YTD YTD YTD Versus Versus Versus Versus Residential (Single Family + Condo) Active Listings at month end 4,221 4,171 6,298 7,094 10, % % % % New Listings 3,853 3,753 3,988 5,304 5, % -5.89% % -0.84% Current Days on Market % % % % Sold 2,705 2,590 2,667 2,690 2, % -2.89% -0.86% 22.72% Average Sold Price $374,655 $330,006 $303,119 $277,172 $251, % 8.87% 9.36% 10.39% Median Sold Price $317,000 $284,250 $250,000 $230,000 $199, % 13.70% 8.70% 15.58% Sales Volume $1,013,441,255 $854,715,954 $808,419,678 $745,315,964 $550,359, % 5.73% 8.47% 35.42% Single Family (aka Detached Single Family) Active Listings at month end 3,361 3,384 4,983 5,834 8, % % % % New Listings 2,742 2,662 2,855 4,209 4, % -6.76% % -0.66% Current Days on Market % % % % Sold 1,961 1,837 2,023 2,125 1, % -9.19% -4.80% 22.83% Average Sold Price $413,995 $370,622 $334,271 $304,911 $277, % 10.87% 9.63% 9.94% Median Sold Price $346,000 $320,000 $275,000 $250,000 $224, % 16.36% 10.00% 11.14% Sales Volume $811,844,515 $680,831,834 $676,230,576 $647,935,608 $479,816, % 0.68% 4.37% 35.04% Condo (aka Attached Single Family) Active Listings at month end ,315 1,260 2, % % 4.37% % New Listings 1,111 1,091 1,133 1,095 1, % -3.71% 3.47% -1.53% Current Days on Market % % % % Sold % 16.93% 13.98% 22.29% Average Sold Price $270,963 $230,922 $205,263 $172,660 $152, % 12.50% 18.88% 13.08% Median Sold Price $215,000 $186,000 $156,500 $141,000 $119, % 18.85% 10.99% 17.60% Sales Volume $201,596,740 $173,884,120 $132,189,102 $97,380,356 $70,542, % 31.54% 35.75% 38.04% 17
18 Price Range Single Family Condo Sold Active MOI Sold Active MOI $0 to $99, $100,000 to $199, $200,000 to $299, $300,000 to $399, $400,000 to $499, $500,000 to $749, $750,000 to $999, $1,000,000 and over TOTALS 1,961 3, Price Range Single Family Sold % change Condo Sold % change Jan. '16 Dec. '15 Jan. '15 Dec. '15 $0 to $99, % % $100,000 to $199, % % $200,000 to $299, % % $ to $399, % % $400,000 to $499, % % $500,000 to $749, % % $750,000 to $999, % % $1,000,000 and over % % TOTALS 1,961 3, % 744 1, % Price Range Single Family Sold % change Condo Sold % change YTD Jan. '16 YTD Jan. '15 YTD Jan.'16 YTD Jan. '15 $0 to $99, % % $100,000 to $199, % % $200,000 to $299, % % $300,000 to $399, % % $400,000 to $499, % % $500,000 to $749, % % $750,000 to $999, % % $1,000,000 and over % % TOTALS 1,961 1, % % 18


19 Along with the rest of the city, the January higher end real estate market went into a deep freeze at the beginning of the year. Keeping in mind the seasonal impact, it's still an unexpected and unsettling occurrence for those who were sure the heat of last summer's market had no end in sight. The number of sold properties in January in the Luxury ($1,000,000+), Signature ($750,000-$999,999) and the Premiere ($500,000-$749,999) markets dropped from nearly 39% to 50% from December. Luxury condo numbers are starting to trail as Cherry Creek North's 250 Columbine's impact peters out with 53 units closed in the last few months of 2015 and only three closed in January. The difference in high end condo inventory from December to January is stark, with a 69% increase along with a 13% price increase. Move-up buyers are waiting for the city and prices to thaw out before they strike, and while the inventory on paper looks adequate, from actual market experience we can surmise that homes staying on the market tend to be over-priced and under-updated," said Brooke Livingston, DMAR Market Trends Committee Member. Homebuyers are uncertain that a jump in price range will garner them more amenities, exemplified by the fact that of the 240 listings sold in the $500,000 to $749,000 range in the eleven county area, more than half were remodeled, but 73% of those still on the market do not list updated or remodeling. That means those that are updated or remodeled are selling first and the others are languishing. "A sizable amount of move-up buyers are searching for more space and amenities, and are finding themselves frustrated by the lack of options. They're debating whether the higher price tag is worth the seemingly lackluster upgrades being offered in the $500,000 and up range," said Livingston. Sellers need to work with their REALTORS to price accordingly if they don't want to update, or they need to spend the cold months doing some updates to make sure it gets them top dollar in the spring. DMAR Market Trends Committee Member, Jill Schafer adds, "I suggest sellers contact their DMAR REALTOR to get an idea of the latest trends and best updates to do for the greatest return." For sellers to get the most out of this still predominantly hot market, they'll need to price their properties at or slightly below true market value to capitalize on multiple buyer interest. Buyers in this mid- to upper-price range may want to open their options to homes that need updating, as well as look at loans that allow them to make improvements that make their new house their home." - Jill Schafer & Brooke Livingston, DMAR Market Trends Committee Spokespersons 19
20 Snapshot Month-over-Month & Year-over-Year Comparisons LUXURY Single Family (aka Detached Single Family) Jan. '16 PRIOR MONTH LAST YEAR PRIOR MONTH LAST YEAR # SOLD % 65.71% AVERAGE PRICE $ 1,579,831 $ 1,488,108 $ 1,384, % 14.11% SALES VOLUME $ 91,630,198 $ 151,787,016 $ 48,456, % 89.10% CDOM % 34.75% SALE/LIST PRICE 95.09% 95.61% 96.18% -0.54% -1.13% PSF TOTAL $ 266 $ 253 $ % 4.31% Condo (aka Attached Single Family) Jan. '16 PRIOR MONTH LAST YEAR PRIOR MONTH LAST YEAR # SOLD % % AVERAGE PRICE $ 1,839,311 $ 1,524,521 $ 1,140, % 61.34% SALES VOLUME $ 18,393,110 $ 30,490,420 $ 2,280, % % CDOM % % SALE/LIST PRICE 96.93% 99.33% 94.08% -2.42% 3.03% PSF TOTAL $ 591 $ 619 $ % 20.37% Residential (Single Family + Condo) Jan. '16 PRIOR MONTH LAST YEAR PRIOR MONTH LAST YEAR # SOLD % 83.78% AVERAGE PRICE $ 1,617,990 $ 1,494,077 $ 1,371, % 17.99% SALES VOLUME $ 110,023,320 $ 182,277,394 $ 50,736, % % CDOM % 25.62% SALE/LIST PRICE 95.36% 96.22% 96.06% -0.89% -0.73% PSF TOTAL $ 313 $ 313 $ % 16.79% Snapshot Year-to-Date and Year-over-Year Comparisons LUXURY Single Family (aka Detached Single Family) YTD 2016 YTD 2015 YTD 2014 '16 vs '15 '16 vs '14 # SOLD % 81.25% AVERAGE PRICE $ 1,579,831 $ 1,384,458 $ 1,588, % -0.54% SALES VOLUME $ 91,630,198 $ 48,456,030 $ 50,827, % 80.28% CDOM % 55.88% SALE/LIST PRICE 95.09% 96.18% 94.76% -1.13% 0.35% PSF TOTAL $ 266 $ 255 $ % 8.57% Condo (aka Attached Single Family) YTD 2016 YTD 2015 YTD 2014 '16 vs '15 '16 vs '14 # SOLD % % AVERAGE PRICE $ 1,839,311 $ 1,140,000 $ 2,467, % % SALES VOLUME $ 18,393,110 $ 2,280,000 $ 9,868, % 86.38% CDOM % 28.57% SALE/LIST PRICE 96.93% 94.08% 95.81% 3.03% 1.17% PSF TOTAL $ 591 $ 491 $ % -0.34% Residential (Single Family + Condo) YTD 2016 YTD 2015 YTD 2014 '16 vs '15 '16 vs '14 # SOLD % 88.89% AVERAGE PRICE $ 1,617,990 $ 1,371,244 $ 1,686, % -4.03% SALES VOLUME $ 110,023,320 $ 50,736,028 $ 60,696, % 81.27% CDOM % 50.50% SALE/LIST PRICE 95.36% 96.06% 94.88% -0.73% 0.51% PSF TOTAL $ 313 $ 268 $ % 10.21% 20
21 Snapshot Month-over-Month and Year-over-Year Comparisons SIGNATURE Single Family (aka Detached Single Family) Jan. '16 PRIOR MONTH LAST YEAR PRIOR MONTH LAST YEAR # SOLD % 24.49% AVERAGE PRICE $ 846,456 $ 841,366 $ 841, % 0.57% SALES VOLUME $ 51,633,816 $ 84,977,966 $ 41,239, % 25.20% CDOM % % SALE/LIST PRICE 97.17% 98.16% 96.62% -1.01% 0.57% PSF TOTAL $ 185 $ 196 $ % 0.00% Condo (aka Attached Single Family) Jan. '16 PRIOR MONTH LAST YEAR PRIOR MONTH LAST YEAR # SOLD % 37.50% AVERAGE PRICE $ 854,007 $ 828,533 $ 883, % -3.31% SALES VOLUME $ 9,394,077 $ 18,227,726 $ 7,066, % 32.95% CDOM % 5.63% SALE/LIST PRICE 98.02% 97.54% 99.52% 0.49% -1.51% PSF TOTAL $ 346 $ 327 $ % 3.59% Residential (Single Family + Condo) Jan. '16 PRIOR MONTH LAST YEAR PRIOR MONTH LAST YEAR # SOLD % 26.32% AVERAGE PRICE $ 847,610 $ 839,070 $ 847, % 0.02% SALES VOLUME $ 61,027,920 $ 103,205,610 $ 48,306, % 26.34% CDOM % % SALE/LIST PRICE 97.30% 98.05% 97.03% -0.76% 0.28% PSF TOTAL $ 210 $ 220 $ % 1.94% Snapshot Year-to-Date and Year-over-Year Comparisons SIGNATURE Single Family (aka Detached Single Family) YTD 2016 YTD 2015 YTD 2014 '16 vs '15 '16 vs '14 # SOLD % 45.24% AVERAGE PRICE $ 846,456 $ 841,632 $ 834, % 1.46% SALES VOLUME $ 51,633,816 $ 41,239,968 $ 35,040, % 47.35% CDOM % -2.80% SALE/LIST PRICE 97.17% 96.62% 96.51% 0.57% 0.68% PSF TOTAL $ 185 $ 185 $ % 5.71% Condo (aka Attached Single Family) YTD 2016 YTD 2015 YTD 2014 '16 vs '15 '16 vs '14 # SOLD % % AVERAGE PRICE $ 854,007 $ 883,259 $ 866, % -1.41% SALES VOLUME $ 9,394,077 $ 7,066,072 $ 3,465, % % CDOM % 11.94% SALE/LIST PRICE 98.02% 99.52% 95.59% -1.51% 2.54% PSF TOTAL $ 346 $ 334 $ % -5.98% Residential (Single Family + Condo) YTD 2016 YTD 2015 YTD 2014 '16 vs '15 '16 vs '14 # SOLD % 56.52% AVERAGE PRICE $ 847,610 $ 847,474 $ 837, % 1.26% SALES VOLUME $ 61,027,920 $ 48,306,018 $ 38,505, % 58.49% CDOM % -3.85% SALE/LIST PRICE 97.30% 97.03% 96.43% 0.28% 0.90% PSF TOTAL $ 210 $ 206 $ % 9.38% 21
22 Snapshot Month-over-Month and Year-over-Year Comparisons PREMIER Single Family (aka Detached Single Family) Jan. '16 PRIOR MONTH LAST YEAR PRIOR MONTH LAST YEAR # SOLD % 14.29% AVERAGE PRICE $ 594,153 $ 594,232 $ 600, % -1.04% SALES VOLUME $ 147,349,944 $ 241,258,192 $ 130,291, % 13.09% CDOM % % SALE/LIST PRICE 98.26% 98.49% 98.11% -0.23% 0.15% PSF TOTAL $ 163 $ 169 $ % 0.00% Condo (aka Attached Single Family) Jan. '16 PRIOR MONTH LAST YEAR PRIOR MONTH LAST YEAR # SOLD % -7.50% AVERAGE PRICE $ 602,647 $ 601,730 $ 594, % 1.43% SALES VOLUME $ 22,297,939 $ 42,722,830 $ 23,766, % -6.18% CDOM % -4.44% SALE/LIST PRICE 98.16% 97.99% 98.04% 0.17% 0.12% PSF TOTAL $ 316 $ 314 $ % 10.88% Residential (Single Family + Condo) Jan. '16 PRIOR MONTH LAST YEAR PRIOR MONTH LAST YEAR # SOLD % 10.89% AVERAGE PRICE $ 595,255 $ 595,348 $ 599, % -0.70% SALES VOLUME $ 169,647,675 $ 283,980,996 $ 154,057, % 10.12% CDOM % % SALE/LIST PRICE 98.24% 98.42% 98.10% -0.18% 0.14% PSF TOTAL $ 183 $ 191 $ % 0.55% Snapshot Year-to-Date and Year-over-Year Comparisons PREMIER Single Family (aka Detached Single Family) YTD 2016 YTD 2015 YTD 2014 '16 vs '15 '16 vs '14 # SOLD % 26.53% AVERAGE PRICE $ 594,153 $ 600,422 $ 593, % 0.08% SALES VOLUME $ 147,349,944 $ 130,291,574 $ 116,356, % 26.64% CDOM % % SALE/LIST PRICE 98.26% 98.11% 98.10% 0.15% 0.16% PSF TOTAL $ 163 $ 163 $ % 8.67% Condo (aka Attached Single Family) YTD 2016 YTD 2015 YTD 2014 '16 vs '15 '16 vs '14 # SOLD % 94.74% AVERAGE PRICE $ 602,647 $ 594,159 $ 576, % 4.50% SALES VOLUME $ 22,297,939 $ 23,766,360 $ 10,957, % % CDOM % 2.38% SALE/LIST PRICE 98.16% 98.04% 96.91% 0.12% 1.29% PSF TOTAL $ 316 $ 285 $ % 17.04% Residential (Single Family + Condo) YTD 2016 YTD 2015 YTD 2014 '16 vs '15 '16 vs '14 # SOLD % 32.56% AVERAGE PRICE $ 595,255 $ 599,447 $ 592, % 0.52% SALES VOLUME $ 169,647,675 $ 154,057,879 $ 127,314, % 33.25% CDOM % % SALE/LIST PRICE 98.24% 98.10% 97.99% 0.14% 0.26% PSF TOTAL $ 183 $ 182 $ % 13.66% 22
23 Active Listings = the number of properties available for sale at the end of the reported period. The availability of homes for sale has a big effect on supply-demand dynamics and home prices. New Listings = the number of properties which became available during the reported period. Under Contract = the number of listings that were changed status from Active to Under Contract at the end of the reported period. Under Contract listings are counted at the end of the reported period. Each listing can only be counted one time. If a listing goes into Under Contract, out of Under Contract, then back into Under Contract all in one reported period, the listing would only be counted once. This is the most real-time measure possible for home buyer activity, as it measures signed contracts on sales rather than the actual closed sale. As such, it is called a leading indicator of buyer demand. Days on Market (DOM) = a measure of how long it takes a given property to sell, on average. Sold Listings = a measure of home sales that sold and closed during the reported period. Average Sales Price = a sum of all home sales prices divided by the total number of sales. Not considered the most accurate gauge since data from the high-end can easily skew the results. Median Sales Price = a measure of home values in a market area where 50% of activity was higher and 50% was lower than this price point. This method is preferred because it's more insulated from outlying activity occurring at either tail end of the market. Months Supply of Inventory (MOI) = A measure of how balanced the market is between buyers and sellers. It is expressed as the number of months it would hypothetically take to sell through all the available homes for sale currently, given current levels of home sales. A balanced market ranges from 4 to 6 months of supply. A buyer s market has a higher number, reflecting fewer buyers relative to homes for sale. A seller s market has a lower number, reflecting more buyers relative to homes for sale. Residential (RES) = Represents the overall housing market which includes activity of Single Family Homes as well as Condos. Single Family (Detached Homes) = activity of Detached Single Family Homes. Condo (Attached Homes) = activity of Attached Condos & Townhomes. Premier Market = properties priced between $500,000 and $749,999. Signature Market = properties priced between $750,000 and $999,999. Luxury Market = properties priced at $1,000,000+ ($1M+). REcolorado = the source of our MLS listings data. 23
24 The DMAR Market Trends Committee, part of the Denver Metro Association of REALTORS, provide timely, consistent, and relevant monthly summaries of valuable local real estate market statistical data for both its members and the general public. Statistics from the Denver Metro Real Estate Market Trends Report provide data for the following counties: Adams, Arapahoe, Boulder, Broomfield, Clear Creek, Denver, Douglas, Elbert, Gilpin, Jefferson and Park. Source of the reported data is REcolorado. DMAR s Market Trends Committee consists of the following members: Anthony Rael, Committee Chair, REALTOR at RE/MAX Alliance Steve Danyliw, Broker/Owner at Danyliw & Associates Brooke Livingston, Broker Associate at Live Urban Real Estate Jill Schafer, Broker Associate at Kentwood Real Estate To stay up to date with relevant real estate news and statistics please visit and join the conversation using the hashtag #DMARSTATS on social media. Contact: communications@dmarealtors.com Media Contact: andrea@decibelblue.com Andrea Kalmanovitz, Director, Public Relations, Decibel Blue Creative Marketing & PR on behalf of the Denver Metro Association of REALTORS. Connect: DMAR REALTOR and Affiliate members are encouraged to share this report in any form or by any means of redistribution including: electronic, mechanical, photocopying or otherwise; without the prior written permission of the publisher. However, all DMAR logos, watermarks, sourcing and copyright information shall not be removed or edited in any way. The Denver Metro Association of REALTORS is a membership-based organization comprised of over 6,000 real estate professionals in the Denver Metropolitan area. The association offers continuing education, advocacy for the real estate community, and is a resource for industry news and market statistics. For more information, visit or call (303)
The Voice of Real Estate in the Denver metro area. Denver Metro. Real Estate Market Trends Report
 The Voice of Real Estate in the Denver metro area Denver Metro Real Estate Market Trends Report Monthly Research Tool Published by the Denver Metro Association of REALTORS Market Trends Committee 11-County
Dear Respected Journalist:
 2016 PRESS KIT 2016 Dear Respected Journalist: It is a pleasure to introduce you to the Denver Metro Association of REALTORS (DMAR), one of the nation s leading REALTOR organizations and The Voice of Real
Monthly Indicators % % %
 Monthly Indicators 2016 Percent changes calculated using year-over-year comparisons. New Listings were down 27.6 percent for single family homes and 41.8 percent for townhouse-condo properties. Pending
Monthly Indicators % + 9.7% %
 Monthly Indicators 2016 Percent changes calculated using year-over-year comparisons. New Listings were up 11.1 percent for single family homes and down 30.8 percent for townhouse-condo properties. Pending
Monthly Indicators % % - 9.2%
 Monthly Indicators 2016 New Listings were down 1.4 percent for single family/duplex homes and 25.0 percent for townhouse-condo properties. Pending Sales increased 58.3 percent for single family/duplex
PRINCE GEORGE S COUNTY JULY 2018
 STATPAK PRINCE GEORGE S COUNTY JULY 2018 McEnearney.com MARKET IN A MINUTE A SUMMARY OF MARKET CONDITIONS FOR JUNE & FIRST HALF 2018 Contract activity in June 2018 was up 16.4% from June 2017, and through
PRINCE GEORGE S COUNTY FEBRUARY 2018
 STATPAK PRINCE GEORGE S COUNTY FEBRUARY 2018 McEnearney.com MARKET IN A MINUTE A SUMMARY OF MARKET CONDITIONS FOR JANUARY 2018 Contract activity in January 2018 was up 20.9% from January 2017, and there
MONTGOMERY COUNTY JULY 2018
 STATPAK MONTGOMERY COUNTY JULY 2018 McEnearney.com MARKET IN A MINUTE A SUMMARY OF MARKET CONDITIONS FOR JUNE & FIRST HALF 2018 Contract activity in June 2018 was up 1.2% from June 2017, solely because
NORTHERN VIRGINIA MARCH 2017
 STATPAK NORTHERN VIRGINIA MARCH 2017 McEnearney.com MARKET IN A MINUTE A SUMMARY OF MARKET CONDITIONS FOR FEBRUARY 2017 Contract activity in February 2017 was up 4.0% from February 2016, and there were
STATPAK MARKET IN A MINUTE A SUMMARY OF MARKET CONDITIONS FOR APRIL McEnearney.com CONTRACTS URGENCY INDEX INVENTORY INTEREST RATES
 STATPAK WASHINGTON, DC MAY 2018 McEnearney.com MARKET IN A MINUTE A SUMMARY OF MARKET CONDITIONS FOR APRIL 2018 Contract activity in April 2018 was up 9.4% from April 2017, and four of the six price categories
Housing Statistics. Kelly Moye RE/MAX Alliance
 Housing Statistics Kelly Moye RE/MAX Alliance Not all statistics are the same CAR Market Trends Report 1 All MLS systems across the state! Zillow County Records Title Mortgage Companies 1 One MLS system
Monthly Indicators % % - 3.5%
 Monthly Indicators 2017 New Listings were up 6.3 percent for the category but decreased 33.1 percent for the category. Pending Sales increased 5.0 percent for but decreased 1.3 percent for. The Median
STATPAK MARKET IN A MINUTE A SUMMARY OF MARKET CONDITIONS FOR JANUARY McEnearney.com CONTRACTS URGENCY INDEX INVENTORY INTEREST RATES
 STATPAK LOUDOUN COUNTY FEBRUARY 2018 McEnearney.com MARKET IN A MINUTE A SUMMARY OF MARKET CONDITIONS FOR JANUARY 2018 Contract activity in January 2018 was down just 2.0% from January 2017, but that is
STATPAK MARKET IN A MINUTE A SUMMARY OF MARKET CONDITIONS FOR JULY McEnearney.com CONTRACTS URGENCY INDEX INVENTORY INTEREST RATES AFFORDABILITY
 STATPAK LOUDOUN COUNTY AUGUST 2017 McEnearney.com MARKET IN A MINUTE A SUMMARY OF MARKET CONDITIONS FOR JULY 2017 Contract activity in July 2017 was down 8.7% from July 2016, and there were decreases in
STATPAK MARKET IN A MINUTE A SUMMARY OF MARKET CONDITIONS FOR JUNE & FIRST HALF McEnearney.com CONTRACTS URGENCY INDEX INVENTORY INTEREST RATES
 STATPAK LOUDOUN COUNTY JULY 2018 McEnearney.com MARKET IN A MINUTE A SUMMARY OF MARKET CONDITIONS FOR JUNE & FIRST HALF 2018 Contract activity in June 2018 was up 5.1% from June 2017. Through the first
HOUSING REPORT WASHTENAW SEPTEMBER 2018
 WASHTENAW SEPTEMBER 2018 Washtenaw County Recovery Run How Much Longer? This month marks the 10-year anniversary of the market peak prior to the burst of the housing bubble. The nationwide median home
YTD TOTAL VOLUME YTD SOLD PROPERTIES Q: WHAT IS YOUR HOME WORTH? A: CALL ME. SOLD DOM
 SOLD DOM 2012-13 2013-14 2014-15 306 387 324 Q: WHAT IS YOUR HOME WORTH? A: CALL ME. YTD SOLD PROPERTIES YTD TOTAL VOLUME CONDO & TOWN CONDO MEDIAN HOME SALES MEDIAN PRICE SALES PRICE 2013 2014 2015 2013
STATPAK MARKET IN A MINUTE A SUMMARY OF MARKET CONDITIONS FOR FEBRUARY McEnearney.com CONTRACTS URGENCY INDEX INVENTORY INTEREST RATES
 STATPAK LOUDOUN COUNTY MARCH 2018 McEnearney.com MARKET IN A MINUTE A SUMMARY OF MARKET CONDITIONS FOR FEBRUARY 2018 Contract activity in February 2018 was almost unchanged, up just 0.2% from February
Monthly Indicators % % %
 Monthly Indicators 2018 Percent changes calculated using year-over-year comparisons. New Listings were down 12.9 percent for single family homes and 21.3 percent for townhouse-condo properties. Pending
MONTGOMERY COUNTY JANUARY 2019 MARKET IN A MINUTE A SUMMARY OF MARKET CONDITIONS FOR DECEMBER & 4TH QUARTER 2018
 STATPAK MONTGOMERY COUNTY JANUARY 2019 McEnearney.com MARKET IN A MINUTE A SUMMARY OF MARKET CONDITIONS FOR DECEMBER & 4TH QUARTER 2018 Contract activity in December 2018 was down 10.1% from December 2017
STATPAK MARKET IN A MINUTE A SUMMARY OF MARKET CONDITIONS FOR AUGUST McEnearney.com CONTRACTS URGENCY INDEX INVENTORY INTEREST RATES
 STATPAK WASHINGTON, DC SEPTEMBER 2017 McEnearney.com MARKET IN A MINUTE A SUMMARY OF MARKET CONDITIONS FOR AUGUST 2017 Contract activity in August 2017 was up 4.9% from August 2016, and there were increases
MONTGOMERY COUNTY MAY 2018
 STATPAK MONTGOMERY COUNTY MAY 2018 McEnearney.com MARKET IN A MINUTE A SUMMARY OF MARKET CONDITIONS FOR APRIL 2018 Contract activity in April 2018 was up just 0.9% from, but there were increases in four
STATPAK MARKET IN A MINUTE A SUMMARY OF MARKET CONDITIONS FOR JULY McEnearney.com CONTRACTS URGENCY INDEX INVENTORY INTEREST RATES AFFORDABILITY
 STATPAK WASHINGTON, DC AUGUST 2018 McEnearney.com MARKET IN A MINUTE A SUMMARY OF MARKET CONDITIONS FOR JULY 2018 Contract activity in July 2018 was up just 0.5% from July 2017. Through the first seven
Single Family Sales Maine: Units
 Maine Home Connection 19 Commercial St Portland, Maine 04101 MaineHomeConnection.com Office: (207) 517-3100 Email: Info@MaineHomeConnection.com For the fourth consecutive year, Maine home sales set a new
MONTGOMERY COUNTY APRIL 2018
 STATPAK MONTGOMERY COUNTY APRIL 2018 McEnearney.com MARKET IN A MINUTE A SUMMARY OF MARKET CONDITIONS FOR MARCH 2018 Contract activity in March 2018 was down 6.0% from March 2017, and there were decreases
Q SOUTHWEST REGION
 Quarterly Indicators SOUTHWEST REGION Monthly Snapshot Includes the Durango Area Association of REALTORS, Four Corners Board of REALTORS, Pagosa Springs Area Association of REALTORS and the San Luis Valley
August 2015 Washington, DC Market Trends Report Limited supply, high demand continue pushing prices to record highs
 FOR IMMEDIATE RELEASE Contact: Bobette Banks 301-590-8764 Director of Communications Greater Capital Area Association of REALTORS bbanks@gcaar.com August 2015 Washington, DC Market Trends Report Limited
Monthly Indicators + 4.8% - 3.5% %
 Monthly Indicators 2015 New Listings were up 45.0 percent for single family/duplex homes but decreased 44.1 percent for townhouse-condo properties. Pending Sales increased 14.3 percent for single family/duplex
Monthly Market Watch for the Prescott Quad City Area. Provided by Keller Williams Check Realty Statistics from August 2012 Prescott MLS
 August 2012 Monthly Market Watch for the Prescott Quad City Area Provided by Keller Williams Check Realty Statistics from August 2012 Prescott MLS Report Overview: This report includes MLS data for the
2007 Sales (thru September)
") Third Quarter Market Report Challenges, Opportunities, and Surprises, Oh My! By Dave Phillips, CEO Charlottesville Area Association of REALTORS Someone named Anonymous once said, "Many an opportunity is
Third Quarter Market Report Challenges, Opportunities, and Surprises, Oh My! By Dave Phillips, CEO Charlottesville Area Association of REALTORS Someone named Anonymous once said, "Many an opportunity is
MARKET IN A MINUTE A SUMMARY OF MARKET CONDITIONS FOR MARCH & 1st QUARTER 2016
 STATPAK ` WASHINGTON, DC APRIL 2016 MARKET IN A MINUTE A SUMMARY OF MARKET CONDITIONS FOR MARCH & 1st QUARTER 2016 Contract activity in March 2016 was up 12.6% from March of 2015, and there were increases
DATA FOR NOVEMBER Published December 20, Sales are down -2.7% month-over-month. The year-over-year comparison is at 4.0%.
 Permission is granted only to ARMLS Subscribers for reproduction with attribution on to ARMLS COPYRIGHT 2017. For questions regarding this publication contact Brand@ARMLS.com. DATA FOR NOVEMBER 2017 -
California Housing Market Update. Monthly Sales and Price Statistics January 2018
 California Housing Market Update Monthly Sales and Price Statistics January 2018 Sales Started with a Slight Decrease California, Jan. 2018 Sales: 388,800 Units, -2.9% YTD, -2.9% YTY 700,000 600,000 500,000
PRINCE GEORGE S COUNTY AUGUST 2018
 STATPAK PRINCE GEORGE S COUNTY AUGUST 2018 McEnearney.com MARKET IN A MINUTE A SUMMARY OF MARKET CONDITIONS FOR JULY 2018 Contract activity in July 2018 was up 19.7% from July 2017, and through the first
FOR IMMEDIATE RELEASE Contact: David B. Bennett President & CEO Phone:
 FOR IMMEDIATE RELEASE Contact: David B. Bennett President & CEO Phone: 727-216-32 Email: dbennett@tampabayrealtor.com Real Estate Statistics for September 217 September s numbers are out, and it comes
DATA FOR SEPTEMBER Published October 13, Sales are down -9.7% month-over-month. The year-over-year comparison is at 0%.
 Permission is granted only to ARMLS Subscribers for reproduction with attribution on to ARMLS COPYRIGHT 2017. For questions regarding this publication contact Brand@ARMLS.com. DATA FOR SEPTEMBER 2017 -
rd Quarter Market Report
 2012 3 rd Quarter Market Report The voice of real estate in Central Virginia CAAR Member Copy Expanded Edition Charlottesville Area 3 rd Quarter 2012 Highlights: Overall sales in Greater Charlottesville
February 2018 Montgomery County Market Trends Report Closed sales dip while median sales price reaches highest February mark since 2007
 FOR IMMEDIATE RELEASE Contact: Bobette Banks 301-590-8764 Director of Communications Greater Capital Area Association of REALTORS bbanks@gcaar.com February 2018 Montgomery County Market Trends Report Closed
Oahu Real Estate December 2014 Year End Report
 Oahu Real Estate December 2014 Year End Report By: Mike Gallagher Real Estate, Inc. In order to view the next large Excel Spread depicting all Areas around Oahu and how they performed over twelve months
2015 First Quarter Market Report
 2015 First Quarter Market Report CAAR Member Copy Expanded Edition Charlottesville Area First Quarter 2015 Highlights: Median sales price for the region was up 5.1% over Q1-2014, rising from $244,250 to
STATPAK MARKET IN A MINUTE A SUMMARY OF MARKET CONDITIONS FOR MAY McEnearney.com CONTRACTS URGENCY INDEX INVENTORY INTEREST RATES AFFORDABILITY
 STATPAK WASHINGTON, DC JUNE 2017 McEnearney.com MARKET IN A MINUTE A SUMMARY OF MARKET CONDITIONS FOR MAY 2017 Contract activity in May 2017 was up 2.9% from May 2016, and there were increases for the
NORTHERN VIRGINIA NOVEMBER 2017
 STATPAK NORTHERN VIRGINIA NOVEMBER 2017 McEnearney.com MARKET IN A MINUTE A SUMMARY OF MARKET CONDITIONS FOR OCTOBER 2017 Contract activity in October 2017 was up 3.8% from October 2016, and there were
Summary Statistics. Closed Sales. Paid in Cash. Median Sale Price. Average Sale Price. Dollar Volume. Median Time to Sale.
 Summary Statistics January 219 January 218 Paid in Cash 15,526 16,561-6.2% 4,556 5,34-9.5% $249,9 $24, 4.1% Average Sale Price Dollar Volume $34,241 $334,381 1.8% $5.3 Billion $5.5 Billion -4.6% Median
Summary Statistics. Closed Sales. Paid in Cash. Median Sale Price. Average Sale Price. Dollar Volume. Median Time to Sale.
 ly Market Detail - January 218 Summary Statistics January 218 January 217 Paid in Cash 7,634 7,29 5.9% 4,328 4,298.7% $179,9 $161, 11.7% Average Sale Price Dollar Volume $286,44 $244,52 17.1% $2.2 Billion
June 2018 Montgomery County Market Trends Report Median sales price reaches highest June level on record
 FOR IMMEDIATE RELEASE Contact: Bobette Banks 301-590-8764 Director of Communications Greater Capital Area Association of REALTORS bbanks@gcaar.com June 2018 Montgomery County Market Trends Report Median
Summary Statistics. Closed Sales. Paid in Cash. Median Sale Price. Average Sale Price. Dollar Volume. Median Time to Sale.
 Summary Statistics November 218 November 217 Paid in Cash 2,578 19,983 3.% 5,338 5,372 -.6% $255, $24, 6.3% Average Sale Price Dollar Volume $331,711 $314,76 5.4% $6.8 Billion $6.3 Billion 8.5% Median
DATA FOR OCTOBER Published November 14, Sales are down -0.8% month-over-month. The year-over-year comparison is at 4.1%.
 Permission is granted only to ARMLS Subscribers for reproduction with attribution on to ARMLS COPYRIGHT 2017. For questions regarding this publication contact Brand@ARMLS.com. DATA FOR OCTOBER 2017 - Published
Summary Statistics. Closed Sales. Paid in Cash. Median Sale Price. Average Sale Price. Dollar Volume. Median Time to Sale.
 ly Market Detail - May 218 Summary Statistics May 218 May 217 Paid in Cash 12,25 11,551 4.1% 6,24 6,285-1.3% $188, $177,6 5.9% Average Sale Price Dollar Volume $282,262 $261,48 7.9% $3.4 Billion $3. Billion
STATPAK MARKET IN A MINUTE A SUMMARY OF MARKET CONDITIONS FOR OCTOBER McEnearney.com CONTRACTS URGENCY INDEX INVENTORY INTEREST RATES
 STATPAK LOUDOUN COUNTY NOVEMBER 2018 McEnearney.com MARKET IN A MINUTE A SUMMARY OF MARKET CONDITIONS FOR OCTOBER 2018 Contract activity in October 2018 was down 7.6% from last October and was down in
Coachella Valley Median Detached Home Price Mar Mar 2018
 Median Price $450,000 Coachella Valley Median Detached Home Price Mar 2002 - Mar 2018 $392,000 $400,000 $366,285 $350,000 $300,000 $250,000 $200,000 $150,000 Media Detached Price 4% Growth Curve Summary
January 2018 Loudoun County Market Trends Report Inventory has another record low month; home sales continue to decline compared to last year.
 FOR IMMEDIATE RELEASE Contact: Brenda Morton 703 777 2468 Dulles Area Association of REALTORS bmorton@dullesarea.com January 2018 Loudoun County Market Trends Report Inventory has another record low month;
May 2017 Montgomery County Market Trends Report Median sales price increases 5.8 percent; active listings drop 11.8 percent
 FOR IMMEDIATE RELEASE Contact: Bobette Banks 301-590-8764 Director of Communications Greater Capital Area Association of REALTORS bbanks@gcaar.com May 2017 Montgomery County Market Trends Report Median
September 2017 Washington, DC Market Trends Report September median sales price drops 6.4 percent but still near record high
 FOR IMMEDIATE RELEASE Contact: Bobette Banks 301-590-8764 Director of Communications Greater Capital Area Association of REALTORS bbanks@gcaar.com September 2017 Washington, DC Market Trends Report September
DATA FOR MAY Published June 23, Sales are up +11.3% month-over-month. The year-over-year comparison shows an increase of +11.1%.
 Permission is granted only to ARMLS Subscribers for reproduction with attribution on to ARMLS COPYRIGHT 2017. For questions regarding this publication contact Brand@ARMLS.com. DATA FOR MAY 2017 - Published
Summary Statistics. Closed Sales. Paid in Cash. Median Sale Price. Average Sale Price. Dollar Volume. Median Time to Sale.
 ly Market Detail - Q1 217 Summary Statistics Q1 217 Q1 216 Paid in Cash 6,69 57,779 5.% 18,678 2,133-7.2% $226, $24,74 1.7% Average Sale Price Dollar Volume $311,2 $286,99 8.8% $18.9 Billion $16.5 Billion
Long & Foster Real Estate Family of Companies Long & Foster Christie s Virginia Properties Fonville Morisey Urban Pace
 District of Columbia Luxury Housing Market Update December 217 District of Columbia - December 217 The real estate market is always changing, and if you re buying or selling a home especially a luxury
DATA FOR JANUARY Published Feburary 16, Sales are down -14.0% month-over-month. The year-over-year comparison is up +2.5%.
 Permission is granted only to ARMLS Subscribers for reproduction with attribution on to ARMLS COPYRIGHT 2018. For questions regarding this publication contact Brand@ARMLS.com. DATA FOR JANUARY 2018 - Published
2013 Year-End Market Report
 2013 Year-End Market Report The voice of real estate in Central Virginia CAAR Member Copy Expanded Edition Charlottesville Area Year-End 2013 Highlights: Yearly home sales in Greater Charlottesville were
FOR IMMEDIATE RELEASE Contact: Brenda Morton Dulles Area Association of REALTORS
 FOR IMMEDIATE RELEASE Contact: Brenda Morton 703 777 2468 Dulles Area Association of REALTORS bmorton@dullesarea.com February 2018 Loudoun County Market Trends Report Inventory reaches yet another record
2015 Residential Real Estate Market Report for Ada County
 2015 Residential Real Estate Market Report for Ada County Provided by the Ada County Association of REALTORS (ACAR) in January 2016, based primarily on data from the Intermountain MLS (IMLS), a subsidiary
FOR IMMEDIATE RELEASE Contact: David B. Bennett President & CEO Phone:
 FOR IMMEDIATE RELEASE Contact: David B. Bennett President & CEO Phone: 727-216-32 Email: dbennett@tampabayrealtor.com Real Estate Statistics for September 216 At this time of year everyone starts to get
Contents. off the fence. It s a good life!
 I hope you enjoy the latest edition of Brian Buffini s Real Estate Report. The goal of this piece is to help you stay educated on today s market and position yourself as a true professional and your clients
Summary Statistics. Closed Sales. Paid in Cash. Median Sale Price. Average Sale Price. Dollar Volume. Median Time to Sale.
 Summary Statistics Q3 218 Q3 217 Paid in Cash 28,894 26,39 9.5% 14,3 13,783 3.8% $182,5 $171,945 6.1% Average Sale Price Dollar Volume $254,582 $239,736 6.2% $7.4 Billion $6.3 Billion 16.3% Median Percent
Arlington County Virginia Luxury Housing Market Update
 Arlington County Virginia Luxury Housing Market Update August 218 Arlington County, Virginia - August 218 The real estate market is always changing, and if you re buying or selling a home especially a
September 2017 Montgomery County Market Trends Report Median sales price highest since September 2007
 FOR IMMEDIATE RELEASE Contact: Bobette Banks 301-590-8764 Director of Communications Greater Capital Area Association of REALTORS bbanks@gcaar.com September 2017 Montgomery County Market Trends Report
FOR IMMEDIATE RELEASE Contact: David B. Bennett President & CEO Phone:
 FOR IMMEDIATE RELEASE Contact: David B. Bennett President & CEO Phone: 727-216-32 Email: dbennett@tampabayrealtor.com Real Estate Statistics for December 217 wrapped up a sizzling 217 with a steady month
May 2016 Montgomery County Market Trends Report Double-digit gains in closed sales, exceeding the five-year May average
 FOR IMMEDIATE RELEASE Contact: Bobette Banks 301-590-8764 Director of Communications Greater Capital Area Association of REALTORS bbanks@gcaar.com May 2016 Montgomery County Market Trends Report Double-digit
DATA FOR DECEMBER Published January 23, Sales are up.01% month-over-month. The year-over-year comparison is at +0.5%.
 Permission is granted only to ARMLS Subscribers for reproduction with attribution on to ARMLS COPYRIGHT 2017. For questions regarding this publication contact Brand@ARMLS.com. DATA FOR DECEMBER 2017 -
See Full Corridor Study Volumes I and II as separate attachments.
 See Full Corridor Study Volumes I and II as separate attachments. See Housing Values 2000-2010 and 2000-2013 as separate attachments. 2013 2 nd Quarter and Mid-Year Market Report The voice of real estate
REAL ESTATE MARKET REVIEW. Presented by. sueadler. team
 REAL ESTATE MARKET REVIEW Presented by sueadler team Dear Neighbor, It is a pleasure to share with you our first annual review of the Mid-Town Direct Train Line residential real estate market. In this
Summary Statistics. Closed Sales. Paid in Cash. Median Sale Price. Average Sale Price. Dollar Volume. Median Time to Sale.
 Summary Statistics July 216 July 215 Paid in Cash 24,83 26,165-8.% 6,48 8,533-24.9% $223,238 $199,999 11.6% Average Sale Price Dollar Volume $299,292 $277,17 8.% $7.2 Billion $7.3 Billion -.6% Median Percent
Monthly Indicators - 8.1% + 3.6% - 0.6% Activity Overview New Listings Pending Sales. Closed Sales. Days on Market Until Sale. Median Sales Price
 Monthly Indicators 2019 In addition to ongoing housing price increases and affordability concerns in the state of New York, the first quarter of 2019 saw a fair share of adverse weather as well. Sales
MARKET IN A MINUTE A SUMMARY OF MARKET CONDITIONS FOR SEPTEMBER & 3rd QUARTER 2017
 STATPAK LOUDOUN COUNTY OCTOBER 2017 McEnearney.com MARKET IN A MINUTE A SUMMARY OF MARKET CONDITIONS FOR SEPTEMBER & 3rd QUARTER 2017 Contract activity in September 2017 was up just 0.6% from September
Summary Statistics. Closed Sales. Paid in Cash. Median Sale Price. Average Sale Price. Dollar Volume. Median Time to Sale.
 ly Market Detail - January 217 Summary Statistics January 217 January 216 Paid in Cash 7,29 6,791 6.2% 4,298 4,28 2.1% $161, $151, 6.6% Average Sale Price Dollar Volume $244,52 $235,221 4.% $1.8 Billion
Austin-area home prices set August record, outpace household income growth in August 2015
 Austin-area home prices set August record, outpace household income growth in August 2015 Market Reports Austin Board of REALTORS releases real estate statistics for August 2015 AUSTIN, Texas September
If you are planning to undertake a move in the coming
 trebtalk Buying a new home BY BILL JOHNSTON If you are planning to undertake a move in the coming months, you have probably considered whether to choose new or resale housing. Both options have advantages.
Summary Statistics. Closed Sales. Paid in Cash. Median Sale Price. Average Sale Price. Dollar Volume. Median Time to Sale.
 Summary Statistics February 8 February 7 Paid in Cash 8.%.% $8, $8, -6.8% Average Sale Price Dollar Volume $9,76 $7, -.7% $79,68 $9, 6.% Median Percent of Original List Price Received 97.% 9.%.% Median
Summary Statistics. Closed Sales. Paid in Cash. Median Sale Price. Average Sale Price. Dollar Volume. Median Time to Sale.
 Summary Statistics November 216 November 215 Paid in Cash 19,763 17,523 12.8% 5,827 6,65-11.8% $22, $199,99 1.% Average Sale Price Dollar Volume $29,49 $273,155 6.2% $5.7 Billion $4.8 Billion 19.8% Median
nd Quarter Market Report
 2015 2 nd Quarter Market Report The voice of real estate in Central Virginia CAAR Member Copy Expanded Edition Charlottesville Area 2 nd Quarter 2015 Highlights: Closed sales in the Greater Charlottesville
A Dillon commercial lot with a Walgreen's Pharmacy on it sold for an eye-popping $7.4 million at the end of June, according to local property records.
 Eli Pace July 23, 2018 A Dillon commercial lot with a Walgreen's Pharmacy on it sold for an eye-popping $7.4 million at the end of June, according to local property records. The sale of the 2.5-acre commercial
CAAR Market Report 2010 Mid-Year Published by the Charlottesville Area Association of REALTORS
 CAAR Market Report 2010 Mid-Year Published by the Charlottesville Area Association of REALTORS Where Are We Now? The pace of home purchases in the Charlottesville market area showed a significant increase
Summary Statistics. Closed Sales. Paid in Cash. Median Sale Price. Average Sale Price. Dollar Volume. Median Time to Sale.
 ly Market Detail - September 217 Summary Statistics September 217 September 216 Paid in Cash 18,3 22,653-2.4% 4,698 6,344-25.9% $239,9 $223, 7.6% Average Sale Price Dollar Volume $36,77 $289,781 5.9% $5.5
Summary Statistics. Closed Sales. Paid in Cash. Median Sale Price. Average Sale Price. Dollar Volume. Median Time to Sale.
 ly Market Detail - March 217 Summary Statistics March 217 March 216 Paid in Cash 25,921 23,714 9.3% 7,567 7,594 -.4% $231,9 $29,969 1.4% Average Sale Price Dollar Volume $318,115 $285,868 11.3% $8.2 Billion
Summary Statistics. Closed Sales. Paid in Cash. Median Sale Price. Average Sale Price. Dollar Volume. Median Time to Sale.
 Summary Statistics November 8 November 7 Paid in Cash 8.% 66.7% $,7 $7, -6.% Average Sale Price Dollar Volume $6,87 $8,7-7.% $8, $, 66.% Median Percent of Original List Price Received 8.6% 9.% -.% Median
FOR IMMEDIATE RELEASE Contact: Bobette Banks Director of Communications Greater Capital Area Association of REALTORS
 FOR IMMEDIATE RELEASE Contact: Bobette Banks 301-590-8764 Director of Communications Greater Capital Area Association of REALTORS bbanks@gcaar.com December 2018 Washington, DC Market Trends Report DC closes
March 2018 Washington, DC Market Trends Report Median sales price reaches highest March level on record
 FOR IMMEDIATE RELEASE Contact: Bryan Frantz 301-590-8765 Communications Specialist District of Columbia Association of REALTORS bfrantz@dcrealtors.org March 2018 Washington, DC Market Trends Report Median
MARKET AREA UPDATE Report as of: 1Q 2Q 3Q 4Q
 MARKET AREA UPDATE Report as of: 1Q 2Q 3Q 4Q Year: 2013 Market Area (City, State): Arlington, Virginia Provided by (Company / Companies): McEnearney Associates, Inc. Realtors What are the most significant
MARKET AREA UPDATE Year: 2017 Report as of: 1Q 2Q 3Q 4Q
 MARKET AREA UPDATE Year: 2 Report as of: 1Q 2Q 3Q 4Q Market Area (City, State): Fort Myers/Cape Coral, Florida Provided by (Company / Companies): Real Estate Provided by RDC Member(s): What are the most
DATA FOR FEBRUARY Published March 20, Sales are up +19.6% month-over-month. The year-over-year comparison is down -7.3%.
 Permission is granted only to ARMLS Subscribers for reproduction with attribution on to ARMLS COPYRIGHT 2019. For questions regarding this publication contact Brand@ARMLS.com. DATA FOR FEBRUARY 2019 -
Anne Arundel County Maryland
 Anne Arundel County Maryland Luxury Housing Market Update October 17 Anne Arundel County, Maryland - October 17 The real estate market is always changing, and if you re buying or selling a home especially
November 2017 Montgomery County Market Trends Report Median sales price up slightly as median days on market quickens
 FOR IMMEDIATE RELEASE Contact: Bobette Banks 301-590-8764 Director of Communications Greater Capital Area Association of REALTORS bbanks@gcaar.com November 2017 Montgomery County Market Trends Report Median
Summary Statistics. Closed Sales. Paid in Cash. Median Sale Price. Average Sale Price. Dollar Volume. Median Time to Sale.
 ly Market Detail - October 218 Summary Statistics October 218 October 217 Paid in Cash 22,272 2,535 8.5% 5,97 5,347 11.7% $253,853 $235,9 7.6% Average Sale Price Dollar Volume $331,626 $38,94 7.4% $7.4
September 2017 Market Statistics
 tember 2017 ket Statistics for Ada and Canyon Counties Monthly Analysis Despite rising home prices, today s housing market doesn t have much else in common with the market we saw prior to the recession.
Summary Statistics. Closed Sales. Paid in Cash. Median Sale Price. Average Sale Price. Dollar Volume. Median Time to Sale.
 ly Market Detail - Q1 216 Summary Statistics Q1 216 Q1 215 Paid in Cash 57,913 57,742.3% 2,133 23,724-15.1% $23,5 $182, 11.8% Average Sale Price Dollar Volume $285,447 $266,453 7.1% $16.5 Billion $15.4
Summary Statistics. Closed Sales. Paid in Cash. Median Sale Price. Average Sale Price. Dollar Volume. Median Time to Sale.
 ly Market Detail - September 217 Summary Statistics September 217 September 216 Paid in Cash 7,411 8,8-15.8% 3,92 4,92-2.7% $173, $16, 8.1% Average Sale Price Dollar Volume $239,786 $222,38 7.9% $1.8 Billion
Summary Statistics. Closed Sales. Paid in Cash. Median Sale Price. Average Sale Price. Dollar Volume. Median Time to Sale.
 ly Market Detail - February 218 Summary Statistics February 218 February 217 Paid in Cash 18,62 18,33 3.3% 5,588 5,859-4.6% $246,5 $225, 9.6% Average Sale Price Dollar Volume $336,61 $313,41 7.4% $6.3
Summary Statistics. Closed Sales. Paid in Cash. Median Sale Price. Average Sale Price. Dollar Volume. Median Time to Sale.
 ly Market Detail - April 218 Summary Statistics April 218 April 217 Paid in Cash 24,84 23,829 4.1% 6,429 6,573-2.2% $253,895 $234,9 8.1% Average Sale Price Dollar Volume $353,948 $32,574 1.4% $8.8 Billion
Summary Statistics. Closed Sales. Paid in Cash. Median Sale Price. Average Sale Price. Dollar Volume. Median Time to Sale.
 ly Market Detail - July 218 Summary Statistics July 218 July 217 Paid in Cash 25,488 24,546 3.8% 6,243 5,972 4.5% $255, $24, 6.3% Average Sale Price Dollar Volume $335,55 $316,887 5.7% $8.5 Billion $7.8
Summary Statistics. Closed Sales. Paid in Cash. Median Sale Price. Average Sale Price. Dollar Volume. Median Time to Sale.
 ly Market Detail - 213 Summary Statistics 213 212 Paid in Cash 225,46 23,85 11.% 11,334 92,853 9.1% $168,5 $145, 16.2% Average Sale Price Dollar Volume $246,86 $22,89 11.8% $55.5 Billion $44.7 Billion
Durham Region Housing Report
 Follow us for industry news and more! F DRAR54 T @DurhamREnews Durham Region December 2017 Durham REALTORS, We Work Where You Live. Economic Indicators Real GDP Growth 1 Q3 2017 1.7% Inflation (Yr./Yr.