Oahu Real Estate December 2014 Year End Report
|
|
|
- Brittney Blankenship
- 5 years ago
- Views:
Transcription

1 Oahu Real Estate December 2014 Year End Report By: Mike Gallagher Real Estate, Inc. In order to view the next large Excel Spread depicting all Areas around Oahu and how they performed over twelve months ago you will need to click the below links: Oahu S.F.H. Executive Summary ALL December 2014 Oahu S.F.H. Executive Summary ALL Year End
2 Oahu Condo Executive Summary ALL December 2014 Oahu Condo Executive Summary ALL Year End
")
 3")
3 2014 (above) vs (below) 3
4 In the Upper Right Hand Corner Box of this map is general information pertaining statistics for all Oahu Single Family Homes (S.F.H.) and Condos for the Month. The first figures you will see are A.C.S. percentage figures for both SFH s and Condos. A.C.S. stands for Active Continue to Show. This category is assigned to homes that are in Escrow by the Honolulu Board of Realtors within 15 days of a home solidifying an Accepted Offer. This data is the newest, freshest data available, unlike Sold Data which is often 60+ days old. Therefore, when we look at A.C.S. data we can where we are going vs. Sold Data where we see where we have been. The A.C.S. percentage for SFH s is noted next to a RED Arrow and Condos next to a GREEN Arrow. The A.C.S percentage is derived by dividing the total inventory For Sale by the number of homes in Escrow that have a Just Accepted Offer. The percentage gives us an indication of the health of a particular market. The A.C.S. percentage can either rise or fall depending upon other influences such as the amount of inventory For Sale and how many homes are in the A.C.S. category. The higher the A.C.S. percentage will most likely indicate a high amount of buyers putting homes into escrow while there is relatively low For Sale inventory available. The opposite can happen as well which would result in a lower A.C.S. percentage when there is relatively too much For Sale inventory and a low amount of buyers putting homes into Escrow. Also in the Upper Right Hand Corner of this map with the A.C.S percentage you will find the Average For Sale and Average Sold Prices for both Single Family Homes and Condos. Please also note that all of the figures on the rest of the Oahu map are in Averages as well. I personally like to look at Averages vs. Medians as Averages will provide us with a much better picture of what is truly happening. As an example: The Kailua S.F.H. Median For Sale Price for the month last year was $937,000 but the Average For Sale Price of all Kailua Homes is $2,279,395. Big difference is it not? Beside each A.C.S. percentage box is the Area name or City name. Please remember that the RED Arrows are next to the A.C.S. percentage for Single Family Homes and the Average For Sale and Average Sold figures for these S.F.H. s are in GREEN / RED respectively. The Average For Sale Price and Average Sold Price for Condos are next to the A.C.S. percentage box where there is a GREEN Arrow which stands for Condos. The Average For Sale Price is in PINK and the Average Sold Price is in BLUE for Condos. The color of the A.C.S. percentage for each Area or City, as well as the direction of the Arrow for both S.F.H. s and Condos will be in RED if under the Oahu Average and the Arrow will be in a Downward position. If the A.C.S. percentage is above the Oahu Average the A.C.S. percentage will be in GREEN and the Arrow will be in an Up position. 4


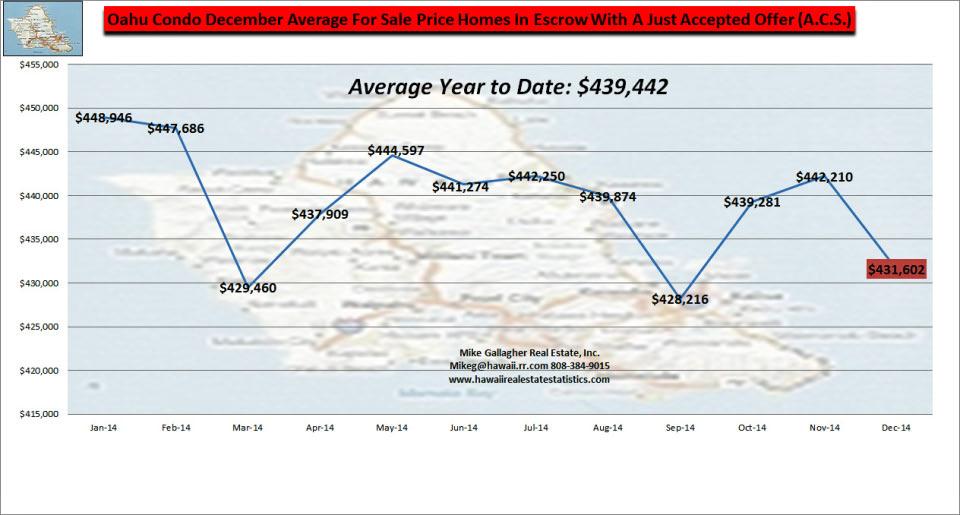
5 The A.C.S. percentage has steeply climbed from the beginning of 2012 due to a severe inventory shortage and an interest rate driven buyer demand for homes.the year 2014 has brought us down to a much lower level of activity but a stable one. 5


6 6

7 7

8 8

9 9

10 10

11 It is a given that many high end properties are coming onto the market and although they are selling, the majority of buyers are purchasing in the lower price ranges. This has been an ongoing trend since year
12 I am little concerned with the some of the numbers the Honolulu Board of Realtors issues as they just do not look correct. One concern I have are their Median Sold Prices. I professionally do not trust the figures issued from The Honolulu Board of Realtors as I have seen too many oddities when I calculate the numbers from the Board site. In short, when their figures do not make sense, they simply change them later down the road. 12
13 13


14 The Honolulu Board of Realtors method of measuring Days On Market only measures those amount of days for Correctly Priced Homes since they count from day one on the market until it goes into Escrow, not how long the home was on the market in its entirety. 14


15 15

16 The Honolulu Board of Realtors tracks statistics called List to Sell ratios. All real estate data is tied to the property address. Any changes in a listing for sale are recorded by the Board to the property address. Any changes in the listing price, price reductions, how many times the property is Re-Listed and by whom, etc. are all recorded to each Multiple Listing Service (M.L.S.) listing. Above is an example of Sold Listings and their List to Sell Percentage Ratios showing if the home was sold at 100%+, 100%, 90%, 80%, etc. These reports, produced by the Board DO NOT show how many times the property address was Re-Listed nor do they show price reductions. This is kept away from the General Public. The following graphs show what was reported by the Honolulu Board of Realtors as Sold At Full Price Or More and I have shown what the real figures show as Sold At Full Price Or More. Please pay particular attention the Days On Market for all of the homes Sold and compare it to the Days On Market for the homes Sold At Full Price Or More. It pays to price your home correctly. Immediately following the graphs titiled Percentage Sold At Full Price Or More you will see two more graphs of which one of them is for Single Family Homes and the other for Condos on Oahu. These graphs show exactly how the Major Brokerages on the Island of Oahu have done in selling their client s homes in obtaining their client s highest possible price versus the Listing Price. The performance is shocking to say the least and trust me you are going to be surprised. 16


17 Further investigation has to be done by a member of the Board, such as a Real Estate Agent with access to the M.L.S. to show the true story. In Reports circulated to the Public announcing the latest List to Sell Percentage Ratios, such as the graphs I created above, the Average amount of S.F.H. s sold in December 2014 reportedly sold at 100% Or More of List Price by the Honolulu Board of Realtors was 46% of all sold listings. This is not true. If you take out the price reductions and re-listings, the true figure is 35%. The Honolulu Board of Realtors reports that for December 2014 Condos Sold At Full Price Or More at 46%. This is not true. The true average is 36%. 17

18 It might also be said from looking at the two graphs above that in reality, Year to Date, 65% of Single Family Homes were priced incorrectly if only 35% sold at Full Price or more Year to Date and 66% of Condos were priced incorrectly. These numbers supplied by the Honolulu Board of Realtors, in light of what I have described to you above concerning Reductions to the Original Listing Price and the Withdrawn and Expired Listings for the same home, make the numbers for Homes Sold At Full Price Or More supplied by the Honolulu Board of Realtors completely false. 18


19 Unfortunately, the average has been steadily dropping as For Sale Prices are not sticking and Sellers are lowering their prices more frequently, which of course the Honolulu Board of Realtors does not want you to know. 19

20 20


21 The graphs below tell an amazing story of the Top Four Unit Sales Brokerages on Oahu who do the most unit sales volume and just how many or how few they sell at 100%+ of Listing Price: 21

22 22
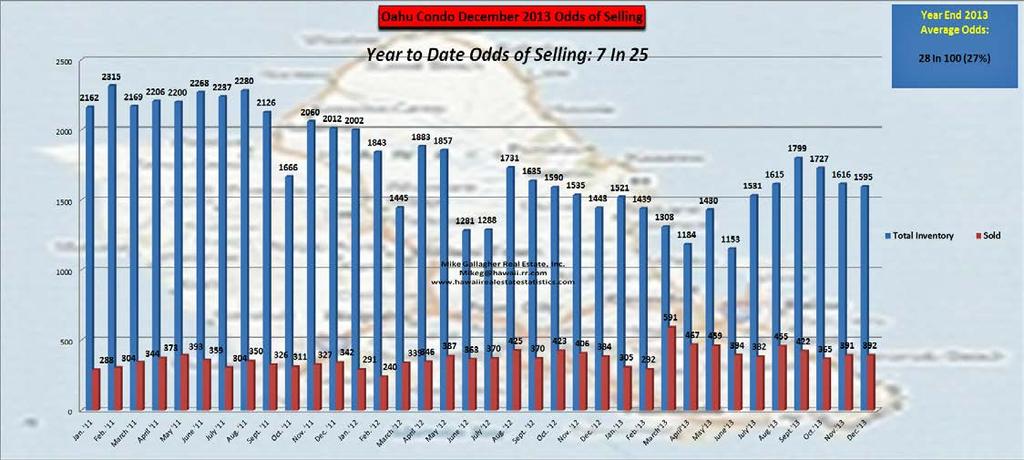
23 This is a little scray is it not? It PAYS to check out the Brokerage and Agent you are contemplating in selling your home regardless of relationships. You deserve the most money for your home. I can do this for you. There are of course only so many homes that come onto the market each year and only so many that sell. Many of the homes that come onto the market go through Re-Listings or Price Reductions unless they are Withdrawn or the listings Expire and taken off of the market. Realizing your Odds of Selling will help you price your home or offer the right price for a home. Pay attention: The percentage or Odds are dropping! 23

24 24


25 25


26 Another great graph I have recently come up with is what I call Multi-Graphs where you can see at a glance everything that is For Sale, In Escrow (A.C.S.) and Sold, all on one graph: 26


27 27


28 I think we have hit Bottom! 28

29 29


30 30
31 31

32 32


33 33


34 The Average Year to Date Months of Supply is highlighted in the Caption in the center of the graphs but the actually Monthly Months of Supply are shown in RED. The current month is compared with the same time last year and we can see the percentage decline in Months of Supply for both Single Family Homes and Condos all across the Island. Please remember: Inventory and Months of Supply are two separate things. Inventory is just the supply of homes on hand that are For Sale. Months of Supply is the supply of inventory For Sale measured in average units Sold. 34

35 Inventory is low for Single Family Homes and if you are a Buyer I recommend that you do not procrastinate in consumating an offer on the home you want before someone else does. The Real Estate Industry uses the six month level as a dividing line and has statistically proven that any inventory under the six months level is a Sellers Market and anything over the six month level is a Buyers Market. Months of Supply or M.O.S. is falling as unit sales pick up and but the reduction is even more attributible to the loss of New Listings and the overall reduction in inventory. It is a Shrinking Market where there is much less choices for most Buyers. Oahu December 2014 Months of Supply Oahu December 2013 Months of Supply 35

36 Last year it was going to be a Seller s Market for a long time to come. This year it is going it is still going to be Seller s Market for a long time to come. 36

37 37

38 Now let us see where the inventory is: 38
39 The percentage of inventory for Single Family Homes For Sale priced above $1,000,000 is forty-four percent (+10% from last month). For Condos the percentage of inventory priced over $500,000 is thirty-four percent (+1% from last month). 39
40 40
41 41
42 What has sold is really Looking Backwards. We see what Sold by Price Range for the Month but these homes that Sold started their sales process when they went into Escrow almost two months ago on average. Only sixteen percent of the Single Family priced at $1,000,000+ is in Escrow (+2% over last month) 42
 At the end of the year it is not until I produce the Year End Reports that I fully understand what has happened during the course of the year and frankly, I could not have")
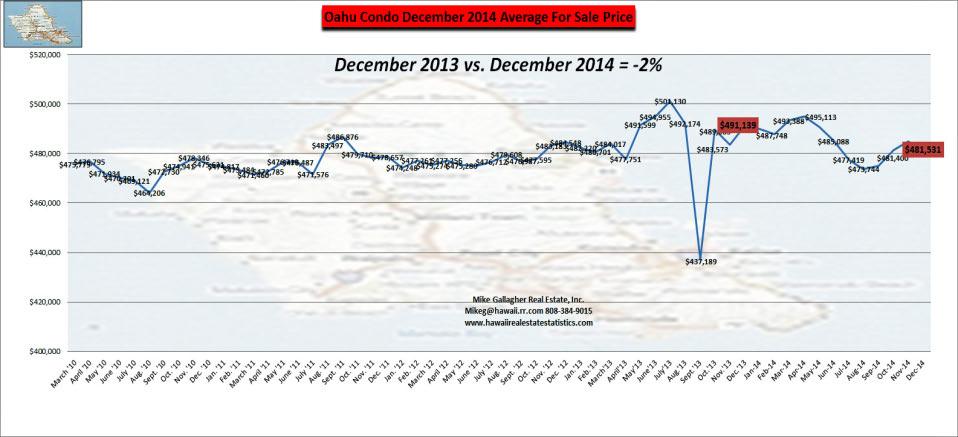
43 Forty-two percent of the Condos priced $250,000-$499,999 are in Escrow. ( -7% from last month) At the end of the year it is not until I produce the Year End Reports that I fully understand what has happened during the course of the year and frankly, I could not have guessed it would have ended like this. Producing and seeing the results is always a surprise to me. Let us see how I well I predicted: Mike Gallagher s Famous Crystal Ball Predictions for Year 2014 Single Family Home Price will be Flat-Line (Actual: -2%) Condo Prices will Fall by 1-5% (Actual: -1%) Single Family Unit Sales Volume will be Flat-Line (Actual: +7%) Condo Unit Sales Volume will Increase by 5-7% and higher for the High End Condos (Results are Not in Yet. I still have to calculate) Single Family Home Days On Market will continue to increase (Actual: - 4%) Condo Days On Market will decrease (Actual: +15%) Single Family Home Inventory will be Flat-Line to +2% (Actual: -4%) Condo Inventory will increase by 1-5% (Actual: -4%) Much to my chagrin, I stink at yearly predictions. Out of eight predictions, I still have one unanswered resulting in I have two correct out of seven or 29%! Needless to say I am NOT going to present any predictions for year Let us all just hope that it is good one for all of us! 43


44 I hope that you have enjoyed this report and of course if you have any questions about buying or selling Real Estate in Hawaii please do not hesitate to call me. I know of no other Realtor or Agent on this Island of Oahu who knows the Market as well as I do and more importantly, where the Market is headed. If you really want to have the straight info on what is really happening in Hawaii Real Estate you will be refreshed by visiting my website and speaking to me, as I tell it like it is. I have been in this business for twelve years and I have helped buy and sell many homes for my clients. My references and knowledge are both excellent. 44
45 Mike Gallagher, Mike Gallagher Real Estate, Inc.-Principal Broker You may also want to visit at my website to learn more about various other Neighborhoods around the Island and see the comprehensive report for Oahu. A quick trip there will provide you with a wealth of Real Estate knowledge you never before even knew was available. I sometimes offer Videos of my Sales Reports but I only do these as time permits. What I do have available is on my website and Youtube.com 45
Oahu Report 1 st. Quarter March 2017
 Oahu Report 1 st. Quarter March 2017 Overall the best way to describe the Oahu S.F.H. Market is to tell you that it is Flat- Line. Unit Sales are barely up at +6%. New Listings are barely off at -6%. The
Oahu Report 2 nd. Quarter June 2017
 Oahu Report 2 nd. Quarter June 2017 Oahu Condo Executive Summary ALL June 2017 P.D.F. Overall the best way to describe the Oahu S.F.H. Market is to tell you that it is believe it or not, a very healthy
Mike Gallagher s Real Estate Crystal Ball Predictions for Year 2011
 Mike Gallagher s Real Estate Crystal Ball Predictions for Year 211 CAUTION: DO NOT BELIEVE EVERYTHING YOU READ IN THE HONOLULU STAR-BULLETIN REGARDING REAL ESTATE SALES It has been a heck of a year! Many
MARKET IN A MINUTE A SUMMARY OF MARKET CONDITIONS FOR SEPTEMBER & 3rd QUARTER 2017
 STATPAK LOUDOUN COUNTY OCTOBER 2017 McEnearney.com MARKET IN A MINUTE A SUMMARY OF MARKET CONDITIONS FOR SEPTEMBER & 3rd QUARTER 2017 Contract activity in September 2017 was up just 0.6% from September
STATPAK MARKET IN A MINUTE A SUMMARY OF MARKET CONDITIONS FOR AUGUST McEnearney.com CONTRACTS URGENCY INDEX INVENTORY INTEREST RATES
 STATPAK WASHINGTON, DC SEPTEMBER 2017 McEnearney.com MARKET IN A MINUTE A SUMMARY OF MARKET CONDITIONS FOR AUGUST 2017 Contract activity in August 2017 was up 4.9% from August 2016, and there were increases
PRINCE GEORGE S COUNTY AUGUST 2018
 STATPAK PRINCE GEORGE S COUNTY AUGUST 2018 McEnearney.com MARKET IN A MINUTE A SUMMARY OF MARKET CONDITIONS FOR JULY 2018 Contract activity in July 2018 was up 19.7% from July 2017, and through the first
OAHU HOUSING SALES CLOSE OUT 2016 STRONG AMID STABLE MEDIAN PRICES
 FOR IMMEDIATE RELEASE MEDIA CONTACT: Jocelyn Collado Becker Communications, Inc. (808) 533-4165 OAHU HOUSING SALES CLOSE OUT 2016 STRONG AMID STABLE MEDIAN PRICES HONOLULU (Jan.6, 2016) Oahu homebuyers
Kailua S.F.H. & Condo November 2017
 Kailua S.F.H. & Condo November 2017 Kailua S.F.H. Executive Summary ALL Third Quarter Year to Date September 2017 P.D.F September 2017 Kailua S.F.H. Stats Taking a look at just the stats for the month
Oh, the Games Real Estate Agents Must Play
 Oh, the Games Real Estate Agents Must Play The Real Estate industry commonly utilizes a practice in tracking how efficient their agents are in obtaining the most amount of money for their Seller s listings
MARKET IN A MINUTE A SUMMARY OF MARKET CONDITIONS FOR MARCH & 1st QUARTER 2016
 STATPAK ` WASHINGTON, DC APRIL 2016 MARKET IN A MINUTE A SUMMARY OF MARKET CONDITIONS FOR MARCH & 1st QUARTER 2016 Contract activity in March 2016 was up 12.6% from March of 2015, and there were increases
PRINCE GEORGE S COUNTY JULY 2018
 STATPAK PRINCE GEORGE S COUNTY JULY 2018 McEnearney.com MARKET IN A MINUTE A SUMMARY OF MARKET CONDITIONS FOR JUNE & FIRST HALF 2018 Contract activity in June 2018 was up 16.4% from June 2017, and through
STATPAK MARKET IN A MINUTE A SUMMARY OF MARKET CONDITIONS FOR MAY McEnearney.com CONTRACTS URGENCY INDEX INVENTORY INTEREST RATES AFFORDABILITY
 STATPAK WASHINGTON, DC JUNE 2017 McEnearney.com MARKET IN A MINUTE A SUMMARY OF MARKET CONDITIONS FOR MAY 2017 Contract activity in May 2017 was up 2.9% from May 2016, and there were increases for the
The Crossroads of Real Estate
 The Crossroads of Real Estate By: Mike Gallagher, Mike Gallagher Real Estate, Inc. At no other time like the present do I see it being more critical for Young Families to choose wisely whether to buy a
MARKET AREA UPDATE Report as of: 1Q 2Q 3Q 4Q
 MARKET AREA UPDATE Report as of: 1Q 2Q 3Q 4Q Year: 2013 Market Area (City, State): Arlington, Virginia Provided by (Company / Companies): McEnearney Associates, Inc. Realtors What are the most significant
Is There Trouble Brewing in Hawaii Real Estate?
 Is There Trouble Brewing in Hawaii Real Estate? By: Mike Gallagher, Mike Gallagher Real Estate, Inc. Is there trouble brewing in Hawaii s Real Estate Market? For several reasons, one in particular is the
PRINCE GEORGE S COUNTY FEBRUARY 2018
 STATPAK PRINCE GEORGE S COUNTY FEBRUARY 2018 McEnearney.com MARKET IN A MINUTE A SUMMARY OF MARKET CONDITIONS FOR JANUARY 2018 Contract activity in January 2018 was up 20.9% from January 2017, and there
Kailua S.F.H. & Condo July 2017
 Kailua S.F.H. & Condo July 2017 Kailua S.F.H. Executive Summary ALL June 2017 P.D.F. 1 July 2017 Stats Taking a look at just the stats for the month of July we first see that Unit Sales are off by -30%
STATPAK MARKET IN A MINUTE A SUMMARY OF MARKET CONDITIONS FOR JULY McEnearney.com CONTRACTS URGENCY INDEX INVENTORY INTEREST RATES AFFORDABILITY
 STATPAK LOUDOUN COUNTY AUGUST 2017 McEnearney.com MARKET IN A MINUTE A SUMMARY OF MARKET CONDITIONS FOR JULY 2017 Contract activity in July 2017 was down 8.7% from July 2016, and there were decreases in
STATPAK MARKET IN A MINUTE A SUMMARY OF MARKET CONDITIONS FOR JULY McEnearney.com CONTRACTS URGENCY INDEX INVENTORY INTEREST RATES AFFORDABILITY
 STATPAK WASHINGTON, DC AUGUST 2018 McEnearney.com MARKET IN A MINUTE A SUMMARY OF MARKET CONDITIONS FOR JULY 2018 Contract activity in July 2018 was up just 0.5% from July 2017. Through the first seven
Year to Date (thru June)
") CAAR Market Report 2009 Mid-Year Published by the Charlottesville Area Association of REALTORS Where Are We Now? The pace of home purchases in the Charlottesville area continues to improve from the dismal
CAAR Market Report 2009 Mid-Year Published by the Charlottesville Area Association of REALTORS Where Are We Now? The pace of home purchases in the Charlottesville area continues to improve from the dismal
MONTGOMERY COUNTY APRIL 2018
 STATPAK MONTGOMERY COUNTY APRIL 2018 McEnearney.com MARKET IN A MINUTE A SUMMARY OF MARKET CONDITIONS FOR MARCH 2018 Contract activity in March 2018 was down 6.0% from March 2017, and there were decreases
MONTGOMERY COUNTY JULY 2018
 STATPAK MONTGOMERY COUNTY JULY 2018 McEnearney.com MARKET IN A MINUTE A SUMMARY OF MARKET CONDITIONS FOR JUNE & FIRST HALF 2018 Contract activity in June 2018 was up 1.2% from June 2017, solely because
Single-Family Home Resales. Condominium Resales
 FOR IMMEDIATE RELEASE November 7, 2013 MEDIA CONTACT: Caroline Witherspoon Becker Communications, Inc. (808) 533-4165 HONOLULU HOME AND CONDOMINIUM SALES REMAIN STABLE, ACCORDING TO THE HONOLULU BOARD
STATPAK MARKET IN A MINUTE A SUMMARY OF MARKET CONDITIONS FOR JANUARY McEnearney.com CONTRACTS URGENCY INDEX INVENTORY INTEREST RATES
 STATPAK LOUDOUN COUNTY FEBRUARY 2018 McEnearney.com MARKET IN A MINUTE A SUMMARY OF MARKET CONDITIONS FOR JANUARY 2018 Contract activity in January 2018 was down just 2.0% from January 2017, but that is
STATPAK MARKET IN A MINUTE A SUMMARY OF MARKET CONDITIONS FOR JUNE & FIRST HALF McEnearney.com CONTRACTS URGENCY INDEX INVENTORY INTEREST RATES
 STATPAK LOUDOUN COUNTY JULY 2018 McEnearney.com MARKET IN A MINUTE A SUMMARY OF MARKET CONDITIONS FOR JUNE & FIRST HALF 2018 Contract activity in June 2018 was up 5.1% from June 2017. Through the first
Coachella Valley Median Detached Home Price Jan Jan 2017
 The Desert Housing Report Median Price $450,000 Coachella Valley Median Detached Home Price Jan 2002 - Jan 2017 $400,000 $350,000 $300,000 $250,000 $335,000 $340,000 $200,000 $150,000 CV Detached Median
MONTGOMERY COUNTY MAY 2018
 STATPAK MONTGOMERY COUNTY MAY 2018 McEnearney.com MARKET IN A MINUTE A SUMMARY OF MARKET CONDITIONS FOR APRIL 2018 Contract activity in April 2018 was up just 0.9% from, but there were increases in four
STATPAK MARKET IN A MINUTE A SUMMARY OF MARKET CONDITIONS FOR APRIL McEnearney.com CONTRACTS URGENCY INDEX INVENTORY INTEREST RATES
 STATPAK WASHINGTON, DC MAY 2018 McEnearney.com MARKET IN A MINUTE A SUMMARY OF MARKET CONDITIONS FOR APRIL 2018 Contract activity in April 2018 was up 9.4% from April 2017, and four of the six price categories
STATPAK MARKET IN A MINUTE A SUMMARY OF MARKET CONDITIONS FOR FEBRUARY McEnearney.com CONTRACTS URGENCY INDEX INVENTORY INTEREST RATES
 STATPAK LOUDOUN COUNTY MARCH 2018 McEnearney.com MARKET IN A MINUTE A SUMMARY OF MARKET CONDITIONS FOR FEBRUARY 2018 Contract activity in February 2018 was almost unchanged, up just 0.2% from February
NORTHERN VIRGINIA NOVEMBER 2017
 STATPAK NORTHERN VIRGINIA NOVEMBER 2017 McEnearney.com MARKET IN A MINUTE A SUMMARY OF MARKET CONDITIONS FOR OCTOBER 2017 Contract activity in October 2017 was up 3.8% from October 2016, and there were
Arashi Is The Future For Oahu Real Estate Values
 Arashi Is The Future For Oahu Real Estate Values By: Mike Gallagher If you are like me, you may have not ever heard about this band of singers but you might want to take notice of them. This group just
What is Currently Happening in Kakaako? By: Mike Gallagher
 What is Currently Happening in Kakaako? By: Mike Gallagher For some time now I have been tracking what I term the High End Sales for Single Family Homes in Oahu s seven Top Volume neighborhoods where homes
Sell Your House in DAYS Instead of Months
 Sell Your House in DAYS Instead of Months No Agents No Fees No Commissions No Hassle Learn the secret of selling your house in days instead of months If you re trying to sell your house, you may not have
MONTGOMERY COUNTY JANUARY 2019 MARKET IN A MINUTE A SUMMARY OF MARKET CONDITIONS FOR DECEMBER & 4TH QUARTER 2018
 STATPAK MONTGOMERY COUNTY JANUARY 2019 McEnearney.com MARKET IN A MINUTE A SUMMARY OF MARKET CONDITIONS FOR DECEMBER & 4TH QUARTER 2018 Contract activity in December 2018 was down 10.1% from December 2017
Ridgefield. Interpreting the Market. Real Estate Report 2016 Mid Year Review. karlamurtaugh.com
 Ridgefield Real Estate Report 2016 Mid Year Review Interpreting the Market karlamurtaugh.com 203.856.5534 REAL ESTATE REPORT 2016 MID YEAR REVIEW Ridgefield Real Estate 2016 Mid Year Review Sales During
CAAR Market Report 2010 Mid-Year Published by the Charlottesville Area Association of REALTORS
 CAAR Market Report 2010 Mid-Year Published by the Charlottesville Area Association of REALTORS Where Are We Now? The pace of home purchases in the Charlottesville market area showed a significant increase
2008 Mid-Year CAAR Market Report Real Estate Market is as Hot as ANWR
 2008 Mid-Year CAAR Market Report Real Estate Market is as Hot as ANWR By Dave Phillips, CEO Charlottesville Area Association of REALTORS Just about everything in life is relative to your perspective. Based
Quick Facts. For Week Ending July 14, 2018 Publish Date: July 23, 2018 All comparisons are to % - 2.7% - 14.
 Weekly Market Report A RESEARCH TOOL FROM THE SAINT PAUL AREA ASSOCIATION OF REALTORS. BROUGHT TO YOU BY THE UNIQUE DATA-SHARING TRADITIONS OF THE REALTOR COMMUNITY For Week Ending July 14, 2018 Publish
TUCSON and SOUTHERN ARIZONA
 TUCSON and SOUTHERN ARIZONA MID-Year Housing Report (520) 840-0963 MathewRodriguez@LongRealty.com 2018 Mid-Year Housing Report INVENTORY Housing market trends For the overall real estate market in Tucson
NORTHERN VIRGINIA MARCH 2017
 STATPAK NORTHERN VIRGINIA MARCH 2017 McEnearney.com MARKET IN A MINUTE A SUMMARY OF MARKET CONDITIONS FOR FEBRUARY 2017 Contract activity in February 2017 was up 4.0% from February 2016, and there were
STATPAK MARKET IN A MINUTE A SUMMARY OF MARKET CONDITIONS FOR OCTOBER McEnearney.com CONTRACTS URGENCY INDEX INVENTORY INTEREST RATES
 STATPAK LOUDOUN COUNTY NOVEMBER 2018 McEnearney.com MARKET IN A MINUTE A SUMMARY OF MARKET CONDITIONS FOR OCTOBER 2018 Contract activity in October 2018 was down 7.6% from last October and was down in
DATA FOR JULY Published August 16, Sales are down -7.7% month-over-month. The year-over-year comparison is up +6.7%. ARMLS STAT JULY 2018
 Permission is granted only to ARMLS Subscribers for reproduction with attribution on to ARMLS COPYRIGHT 2018. For questions regarding this publication contact Brand@ARMLS.com. DATA FOR JULY 2018 - Published
Weekly Market Activity Report
 X0A0T Weekly Market Report A RESEARCH TOOL FROM THE MINNEAPOLIS AREA ASSOCIATION OF REALTORS BROUGHT TO YOU BY THE UNIQUE DATA-SHARING TRADITIONS OF THE REALTOR COMMUNITY For Week Ending July 14, 2018
Housing Supply Overview
 Housing Supply Overview A RESEARCH TOOL PROVIDED BY SOUTH CAROLINA REALTORS February 2018 Mortgage rates are on the rise. When this happens, it means that buyers in the lower-priced categories tend to
Condos or Single Family Homes?
 Condos or Single Family Homes? October 15, 2016 Considering how many actual reports I write each month in order to provide my website visitors a comprehensive look at what is really going on I find very
CMA "Price It Right"- Matrix
 CMA "Price It Right"- Matrix Houston Association of Realtors 3 Hours CE Course#: 3160 2 Table of Contents 1. Overview 3 2. Subject Property Information 3 3. Selecting Comparables (Comps) 5 4. History Report
Summary Statistics. Closed Sales. Paid in Cash. Median Sale Price. Average Sale Price. Dollar Volume. Median Time to Sale.
 ly Market Detail - 213 Summary Statistics 213 212 Paid in Cash 225,46 23,85 11.% 11,334 92,853 9.1% $168,5 $145, 16.2% Average Sale Price Dollar Volume $246,86 $22,89 11.8% $55.5 Billion $44.7 Billion
Seattle Housing Market Overview January 2019
 Seattle Housing Market Overview January 2019 A review of recent trends and thoughts about the future of the Seattle housing market. Bill King President, Chief Valuation Officer Real Info, Inc. City of
MARKET AREA UPDATE Year: 2017 Report as of: 1Q 2Q 3Q 4Q
 MARKET AREA UPDATE Year: 2 Report as of: 1Q 2Q 3Q 4Q Market Area (City, State): Fort Myers/Cape Coral, Florida Provided by (Company / Companies): Real Estate Provided by RDC Member(s): What are the most
Charlottesville Housing Market Report Year-End (Published by the Charlottesville Area Association of REALTORS )
") Charlottesville Housing Market Report - 2009 Year-End (Published by the Charlottesville Area Association of REALTORS ) This Quarterly Market Report is produced by the Charlottesville Area Association of
Charlottesville Housing Market Report - 2009 Year-End (Published by the Charlottesville Area Association of REALTORS ) This Quarterly Market Report is produced by the Charlottesville Area Association of
Monthly Indicators. December Quick Facts % % Year-Over-Year Change Year-Over-Year Change - 1.3% - 1.4% % + 0.1% - 1.4% + 2.
 Monthly Indicators A RESEARCH TOOL PROVIDED BY THE MASSACHUSETTS ASSOCIATION OF REALTORS 2018 Home prices were consistently up again in most markets in 2018 but at reduced levels compared to recent years.
2015 First Quarter Market Report
 2015 First Quarter Market Report CAAR Member Copy Expanded Edition Charlottesville Area First Quarter 2015 Highlights: Median sales price for the region was up 5.1% over Q1-2014, rising from $244,250 to
May 2016 Washington, DC Market Trends Report Listings continue to move quickly as sales climb nearly 14 percent
 FOR IMMEDIATE RELEASE Contact: Bobette Banks 301-590-8764 Director of Communications Greater Capital Area Association of REALTORS bbanks@gcaar.com May 2016 Washington, DC Market Trends Report Listings
Summary Statistics. Closed Sales. Paid in Cash. Median Sale Price. Average Sale Price. Dollar Volume. Median Time to Sale.
 Summary Statistics July 216 July 215 Paid in Cash 24,83 26,165-8.% 6,48 8,533-24.9% $223,238 $199,999 11.6% Average Sale Price Dollar Volume $299,292 $277,17 8.% $7.2 Billion $7.3 Billion -.6% Median Percent
Summary Statistics. Closed Sales. Paid in Cash. Median Sale Price. Average Sale Price. Dollar Volume. Median Time to Sale.
 ly Market Detail - January 217 Summary Statistics January 217 January 216 Paid in Cash 7,29 6,791 6.2% 4,298 4,28 2.1% $161, $151, 6.6% Average Sale Price Dollar Volume $244,52 $235,221 4.% $1.8 Billion
Summary Statistics. Closed Sales. Paid in Cash. Median Sale Price. Average Sale Price. Dollar Volume. Median Time to Sale.
 Summary Statistics November 216 November 215 Paid in Cash 19,763 17,523 12.8% 5,827 6,65-11.8% $22, $199,99 1.% Average Sale Price Dollar Volume $29,49 $273,155 6.2% $5.7 Billion $4.8 Billion 19.8% Median
May 2016 Loudoun County Market Trends Report Homes selling twice as fast as 2015 with re-emergence of seller s market
 FOR IMMEDIATE RELEASE Contact: Christine Windle 703-777-2468 Dulles Area Association of REALTORS cwindle@dullesarea.com Sponsored by: Access National Bank Tom Ciolkosz, (703) 871-1045, tciolkosz@accessnationalbank.com
Weekly Market Activity Report A RESEARCH TOOL PROVIDED BY THE CHARLOTTE REGIONAL REALTOR ASSOCIATION FOR MORE INFORMATION CONTACT A REALTOR
 Weekly Market Report A RESEARCH TOOL PROVIDED BY THE CHARLOTTE REGIONAL REALTOR ASSOCIATION FOR MORE INFORMATION CONTACT A REALTOR For Week Ending February 3, 2018 Data current as of February 12, 2018
Summary Statistics. Closed Sales. Paid in Cash. Median Sale Price. Average Sale Price. Dollar Volume. Median Time to Sale.
 ly Market Detail - September 217 Summary Statistics September 217 September 216 Paid in Cash 18,3 22,653-2.4% 4,698 6,344-25.9% $239,9 $223, 7.6% Average Sale Price Dollar Volume $36,77 $289,781 5.9% $5.5
Summary Statistics. Closed Sales. Paid in Cash. Median Sale Price. Average Sale Price. Dollar Volume. Median Time to Sale.
 ly Market Detail - March 217 Summary Statistics March 217 March 216 Paid in Cash 25,921 23,714 9.3% 7,567 7,594 -.4% $231,9 $29,969 1.4% Average Sale Price Dollar Volume $318,115 $285,868 11.3% $8.2 Billion
Lake Martin Waterfront Residential Report September 2018
 Lake Martin Waterfront Residential Report September 18 Monthly Indicators Recent Figures Trends Total Residential Sales Current Month September 18 29 Lake Martin Waterfront residential* sales during the
Summary Statistics. Closed Sales. Paid in Cash. Median Sale Price. Average Sale Price. Dollar Volume. Median Time to Sale.
 Summary Statistics January 219 January 218 Paid in Cash 15,526 16,561-6.2% 4,556 5,34-9.5% $249,9 $24, 4.1% Average Sale Price Dollar Volume $34,241 $334,381 1.8% $5.3 Billion $5.5 Billion -4.6% Median
FOR IMMEDIATE RELEASE Contact: David B. Bennett President & CEO Phone:
 FOR IMMEDIATE RELEASE Contact: David B. Bennett President & CEO Phone: 727-216-32 Email: dbennett@tampabayrealtor.com Real Estate Statistics for September 217 September s numbers are out, and it comes
Summary Statistics. Closed Sales. Paid in Cash. Median Sale Price. Average Sale Price. Dollar Volume. Median Time to Sale.
 ly Market Detail - January 218 Summary Statistics January 218 January 217 Paid in Cash 7,634 7,29 5.9% 4,328 4,298.7% $179,9 $161, 11.7% Average Sale Price Dollar Volume $286,44 $244,52 17.1% $2.2 Billion
Summary Statistics. Closed Sales. Paid in Cash. Median Sale Price. Average Sale Price. Dollar Volume. Median Time to Sale.
 Summary Statistics November 218 November 217 Paid in Cash 2,578 19,983 3.% 5,338 5,372 -.6% $255, $24, 6.3% Average Sale Price Dollar Volume $331,711 $314,76 5.4% $6.8 Billion $6.3 Billion 8.5% Median
A buyers agents fees are paid from the sellers funds at closing. what this means to you is YOU DO NOT PAY ME!
 Agency Law Who Represents Whom? You have Questions - Here are some Answers You may enter into a written agreement with an Agent to have him or her act on your behalf. This is called Buyer Agency or buyer
Quick Facts. For Week Ending July 14, 2018 Data current as of July 23, % + 9.2% % Metrics by Week
 Charlotte Region Weekly Market Report A RESEARCH TOOL PROVIDED BY THE CHARLOTTE REGIONAL REALTOR ASSOCIATION FOR MORE INFORMATION CONTACT A REALTOR For Week Ending July 14, 2018 Data current as of July
Summary Statistics. Closed Sales. Paid in Cash. Median Sale Price. Average Sale Price. Dollar Volume. Median Time to Sale.
 Summary Statistics February 8 February 7 Paid in Cash 8.%.% $8, $8, -6.8% Average Sale Price Dollar Volume $9,76 $7, -.7% $79,68 $9, 6.% Median Percent of Original List Price Received 97.% 9.%.% Median
Housing Supply Overview
 Housing Supply Overview A RESEARCH TOOL PROVIDED BY SOUTH CAROLINA REALTORS March 2017 Low supply and steadily rising rates and prices have been the story so far after the first quarter of the year zipped
Summary Statistics. Closed Sales. Paid in Cash. Median Sale Price. Average Sale Price. Dollar Volume. Median Time to Sale.
 ly Market Detail - May 218 Summary Statistics May 218 May 217 Paid in Cash 12,25 11,551 4.1% 6,24 6,285-1.3% $188, $177,6 5.9% Average Sale Price Dollar Volume $282,262 $261,48 7.9% $3.4 Billion $3. Billion
Weekly Market Activity Report
 Weekly Market Report A RESEARCH TOOL FROM THE MINNEAPOLIS AREA ASSOCIATION OF REALTORS BROUGHT TO YOU BY THE UNIQUE DATA-SHARING TRADITIONS OF THE REALTOR COMMUNITY For Week Ending February 24, 2018 Publish
Summary Statistics. Closed Sales. Paid in Cash. Median Sale Price. Average Sale Price. Dollar Volume. Median Time to Sale.
 Summary Statistics November 8 November 7 Paid in Cash 8.% 66.7% $,7 $7, -6.% Average Sale Price Dollar Volume $6,87 $8,7-7.% $8, $, 66.% Median Percent of Original List Price Received 8.6% 9.% -.% Median
Single Family Sales Maine: Units
 Maine Home Connection 19 Commercial St Portland, Maine 04101 MaineHomeConnection.com Office: (207) 517-3100 Email: Info@MaineHomeConnection.com For the fourth consecutive year, Maine home sales set a new
Summary Statistics. Closed Sales. Paid in Cash. Median Sale Price. Average Sale Price. Dollar Volume. Median Time to Sale.
 ly Market Detail - Q1 216 Summary Statistics Q1 216 Q1 215 Paid in Cash 57,913 57,742.3% 2,133 23,724-15.1% $23,5 $182, 11.8% Average Sale Price Dollar Volume $285,447 $266,453 7.1% $16.5 Billion $15.4
Monthly Indicators + 5.7% % % Market Overview New Listings Pending Sales. Closed Sales. Days on Market Until Sale. Median Sales Price
 Monthly Indicators 2018 The three most prominent national market trends for residential real estate are the ongoing lack of abundant inventory, the steadily upward movement of home prices and year-over-year
Monthly Indicators % % %
 Monthly Indicators 2018 Percent changes calculated using year-over-year comparisons. New Listings were down 12.9 percent for single family homes and 21.3 percent for townhouse-condo properties. Pending
Summary Statistics. Closed Sales. Paid in Cash. Median Sale Price. Average Sale Price. Dollar Volume. Median Time to Sale.
 ly Market Detail - Q1 217 Summary Statistics Q1 217 Q1 216 Paid in Cash 6,69 57,779 5.% 18,678 2,133-7.2% $226, $24,74 1.7% Average Sale Price Dollar Volume $311,2 $286,99 8.8% $18.9 Billion $16.5 Billion
Housing Supply Overview
 Housing Supply Overview A RESEARCH TOOL PROVIDED BY SOUTH CAROLINA REALTORS May 2015 The last 12 months have seen a lot of buyer activity. Prices are up in most markets and buyers are hungry to purchase,
DATA FOR APRIL Published May 15, Sales are down -4.4% month-over-month. The year-over-year comparison is up +3.7%. ARMLS STAT APRIL 2018
 Permission is granted only to ARMLS Subscribers for reproduction with attribution on to ARMLS COPYRIGHT 2018. For questions regarding this publication contact Brand@ARMLS.com. DATA FOR APRIL 2018 - Published
Coachella Valley Median Detached Home Price May May 2018
 Median Price $450,000 $400,000 Coachella Valley Median Detached Home Price May 2002 - $389,000 $412,000 $350,000 $300,000 $250,000 $200,000 $150,000 CV Detached Median Price 4 % Growth Curve Summary The
DATA FOR MAY Published June 23, Sales are up +11.3% month-over-month. The year-over-year comparison shows an increase of +11.1%.
 Permission is granted only to ARMLS Subscribers for reproduction with attribution on to ARMLS COPYRIGHT 2017. For questions regarding this publication contact Brand@ARMLS.com. DATA FOR MAY 2017 - Published
Coachella Valley Median Detached Home Price April April 2017
 The Desert Housing Report Median Price $450,000 $400,000 Coachella Valley Median Detached Home Price April 2002 - $349,000 $389,000 $350,000 $300,000 $250,000 $200,000 $150,000 CV Detached Median Price
MARKET AREA UPDATE Year: 2018 Report as of: 1Q 2Q 3Q 4Q
 Market Area (City, State): Los Angeles County, CA Provided by (Company / Companies): Coldwell Banker Residential Brokerage - SoCal Provided by RDC Member(s): Thomas Hilmar MARKET AREA UPDATE Year: 2018
CAAR Market Report 2010 First Quarter Published by the Charlottesville Area Association of REALTORS
 CAAR Market Report 2010 First Quarter Published by the Charlottesville Area Association of REALTORS Where Are We Now? In the first quarter of 2010, the Charlottesville real estate market continued the
Housing Supply Overview
 Housing Supply Overview A RESEARCH TOOL PROVIDED BY SOUTH CAROLINA REALTORS June 2018 We are firmly within summer during an economically strong year in the U.S., thus real estate activity is busy. There
FOR IMMEDIATE RELEASE Contact: David B. Bennett President & CEO Phone:
 FOR IMMEDIATE RELEASE Contact: David B. Bennett President & CEO Phone: 727-216-32 Email: dbennett@tampabayrealtor.com Real Estate Statistics for September 216 At this time of year everyone starts to get
Summary Statistics. Closed Sales. Paid in Cash. Median Sale Price. Average Sale Price. Dollar Volume. Median Time to Sale.
 ly Market Detail - 216 Summary Statistics 216 215 Paid in Cash 268,731 266,29.9% 8,84 95,65-16.3% $219,9 $196, 12.2% Average Sale Price Dollar Volume $293,581 $276,482 6.2% $78.9 Billion $73.6 Billion
The Desert Housing Report. Coachella Valley Median Detached Home Price March March 2019 $392,000 $415,000
 Median Price $450,000 $400,000 $350,000 $300,000 $250,000 $200,000 $150,000 Coachella Valley Median Detached Home Price March 2002 - $392,000 $415,000 CV Detached Median Price Summary 4% Growth Curve The
MARKET AREA UPDATE Year: 2017 Report as of: 1Q 2Q 3Q 4Q
 MARKET AREA UPDATE Year: 2017 Report as of: 1Q 2Q 3Q 4Q Market Area (City, State): San Diego County Provided by (Company / Companies): Coldwell Banker Residential Brokerage - SoCal Provided by RDC Member(s):
Summary Statistics. Closed Sales. Paid in Cash. Median Sale Price. Average Sale Price. Dollar Volume. Median Time to Sale.
 Summary Statistics Q3 218 Q3 217 Paid in Cash 28,894 26,39 9.5% 14,3 13,783 3.8% $182,5 $171,945 6.1% Average Sale Price Dollar Volume $254,582 $239,736 6.2% $7.4 Billion $6.3 Billion 16.3% Median Percent
MARKET AREA UPDATE Year: 2017 Report as of: 1Q 2Q 3Q 4Q
 MARKET AREA UPDATE Year: 2017 Report as of: 1Q 2Q 3Q 4Q Market Area (City, State): Los Angeles County, CA Provided by (Company / Companies): Coldwell Banker Residential Brokerage - SoCal Provided by RDC
Summary Statistics. Closed Sales. Paid in Cash. Median Sale Price. Average Sale Price. Dollar Volume. Median Time to Contract. Median Time to Sale
 Summary Statistics 217 216 Paid in Cash 3,84 3,63 6.6% 2,38 2,319 2.6% $225, $21, 7.1% Average Sale Price Dollar Volume $362,29 $328,965 1.1% $1.4 Billion $1.2 Billion 17.4% Median Percent of Original
Summary Statistics. Closed Sales. Paid in Cash. Median Sale Price. Average Sale Price. Dollar Volume. Median Time to Sale.
 ly Market Detail - December 16 Summary Statistics December 16 December 1 Paid in Cash 1.% N/A $6, $67, -3.7% Average Sale Price Dollar Volume $18,1 $67, 89.8% $6, $13, 37.% Median Percent of Original List
MARKET AREA UPDATE Year: 2018 Report as of: 1Q 2Q 3Q 4Q
 MARKET AREA UPDATE Year: 2 Report as of: 1Q 2Q 3Q 4Q Market Area (City, State): Dallas-Fort Worth & N. Texas Metropolitan Area Provided by (Company / Companies): Coldwell Banker Residential Brokerage,
The Coldwell Banker Carlson Real Estate Market Report
 The Coldwell Banker Carlson Real Estate Market Report 2017 Year-End Stowe Area Report Our 2017 Year-End Market Report uses market-wide data, based on transactions that closed in 2017 in the Multiple Listing
Quarterly Indicators Gallatin County, Montana
 Quarterly Indicators Gallatin County, Montana Quick Facts - 0.6% + 14.6% Some economy observers are pointing to 2018 as the final period in a long string of sentences touting several happy years of buyer
DATA FOR JANUARY Published Feburary 16, Sales are down -14.0% month-over-month. The year-over-year comparison is up +2.5%.
 Permission is granted only to ARMLS Subscribers for reproduction with attribution on to ARMLS COPYRIGHT 2018. For questions regarding this publication contact Brand@ARMLS.com. DATA FOR JANUARY 2018 - Published
Weekly Market Activity Report
 Weekly Market Report A RESEARCH TOOL FROM THE MINNEAPOLIS AREA ASSOCIATION OF REALTORS BROUGHT TO YOU BY THE UNIQUE DATA-SHARING TRADITIONS OF THE REALTOR COMMUNITY For Week Ending July 8, 2017 Publish
2007 Sales (thru September)
") Third Quarter Market Report Challenges, Opportunities, and Surprises, Oh My! By Dave Phillips, CEO Charlottesville Area Association of REALTORS Someone named Anonymous once said, "Many an opportunity is
Third Quarter Market Report Challenges, Opportunities, and Surprises, Oh My! By Dave Phillips, CEO Charlottesville Area Association of REALTORS Someone named Anonymous once said, "Many an opportunity is
Baldwin County Condo Report February 2018
 Baldwin County Condo Report February 218 Monthly Indicators Recent Figures Trends Total Condo Sales Current Month February 218 113 vs. Prior Month January 218 11 11.9% vs. Last Year February 217 114 -.9%