REALIZINGDENSITY. Strategies for Compact Suburban Development
|
|
|
- Magnus Amos Flowers
- 5 years ago
- Views:
Transcription

1 REALIZINGDENSITY Strategies for Compact Suburban Development DECEMBER2004
2


3 REALIZINGDENSITY Strategies for Compact Suburban Development DECEMBER2004

4 Created in 1965, the Delaware Valley Regional Planning Commission (DVRPC) is an interstate, intercounty and intercity agency that provides continuing, comprehensive and coordinated planning to shape a vision for the future growth of the Delaware Valley region. The region includes Bucks, Chester, Delaware, and Montgomery counties, as well as the City of Philadelphia, in Pennsylvania; and Burlington, Camden, Gloucester and Mercer counties in New Jersey. DVRPC provides technical assistance and services; conducts high priority studies that respond to the requests and demands of member state and local governments; fosters cooperation among various constituents to forge a consensus on diverse regional issues; determines and meets the needs of the private sector; and practices public outreach efforts to promote two-way communication and public awareness of regional issues and the Commission. Our logo is adapted from the official DVRPC seal, and is designed as a stylized image of the Delaware Valley. The outer ring symbolizes the region as a whole, while the diagonal bar signifies the Delaware River. The two adjoining crescents represent the Commonwealth of Pennsylvania and the State of New Jersey. DVRPC is funded by a variety of funding sources including federal grants from the U.S. Department of Transportation s Federal Highway Administration (FHWA) and Federal Transit Administration (FTA), the Pennsylvania and New Jersey departments of transportation, as well as by DVRPC s state and local member governments. The authors, however, are solely responsible for its findings and conclusions, which may not represent the official views or policies of the funding agencies.
5 Table of Contents Introduction 1 Chapter 1: Measuring Density 3 Density Measures 3 National Standards of Density 9 Land Development Trends in the DVRPC Region 11 Why Are Actual Development Densities Lower 15 Than Allowed Densities? Chapter 2: Defining Density 21 Perceptions of Density 21 Benefits of Compact Development and Higher Densities 25 Chapter 3: Designing Density 31 Appealing Qualities of Mid-to-High Density Neighborhoods 31 Typology of Design Elements /Design and Form 36 Chapter 4: Marketing Density 47 Demographic Trends 47 Consumer Demand 48 Benefits and Impacts of Multifamily Homes 50 Market for Higher Density in the Philadelphia Region 51 Working on Public Perception of Density 52 Well-Designed Density: Washington Town Center 53 City of Philadelphia: Design Guidelines 56 Delaware Valley Smart Growth Alliance 57 Chapter 5: Achieving Density 59 Policy Approaches to Density 59 Form-Based Codes 60 Design Guidelines 62 Next Steps 64 Bibliography 65 Acknowledgements 69 Appendix: Density in the DVRPC Region 71
6 List of Figures Figure 1: Top 15 Most Dense Municipalities by Population Density in the DVRPC Region 3 Figure 2: Top 15 Least Dense Municipalities by Population Density in the DVRPC Region 4 Figure 3: Top 15 Most Dense Municipalities by Gross Housing Unit Density in the DVRPC Region 5 Figure 4: Top 15 Least Dense Municipalities by Gross Housing Unit Density in the DVRPC Region 6 Figure 5: Top 15 Most Dense Municipalities by Net Housing Unit Density in the DVRPC Region 7 Figure 6: Top 15 Least Dense Municipalities by Net Housing Unit Density in the DVRPC Region 8 Figure 7: Net Density Categories for the Delaware Valley Region 10 Figure 8: Residential Land Use in 2000 for DVRPC Region by County 13 Figure 9: Sample Net Densities of Older Boroughs and Cities 14 Figure 10: Putting Residential Density into Perspective 19 Figure 11: The Transect 62
7 Introduction Recent analyses at the county, regional, and state level in the Delaware Valley region have revealed a trend toward lowering land development densities in suburban areas. While the region has a legacy of higher density development in its core cities, older boroughs and firstgeneration suburbs, most development over the past 30 years has been built at very low densities. Building at higher densities, however, is beginning to gain acceptance throughout the United States, though the Delaware Valley still lags behind other regions in accepting and encouraging higher densities. Local residential zoning codes heavily favor low-to-medium-density developments, often single- family homes on half-acre to one-acre lots. This is in direct contrast to the types of densities found in many desirable older boroughs in the region; and while many residents find these communities attractive places to live, they oppose new developments at these same densities. This trend toward de-densification has resulted in increased land consumption and higher costs for providing municipal services, such as sewer and water infrastructure, schools, roads, and transit. Simply put, fewer people are living on more land. The region s long-range plan, Horizons: The Year 2025 Land Use and Transportation Plan for the Delaware Valley, prepared by the Delaware Valley Regional Planning Commission, provides a vision and overall framework for the region s future growth and development. The plan recommends policies for four different geographic areas of the region, including Core Cities, First Generation Suburbs, Growing Suburbs, and Rural Areas. The plan supports revitalizing urban centers, while stabilizing and restoring First Generation Suburbs (the older, more dense boroughs, townships, and cities adjacent to the Core Cities or along the passenger and freight rail network). In the Growing Suburbs, those areas that have grown significantly in the last 30 years and traditionally associated with sprawl, the plan recommends center-based planning, growth management, and enhanced community design. Center-based planning strives to create a greater sense of place and community identity through a more compact, mixed-use development pattern and related community services, while preserving the character of existing communities and neighborhoods. For Rural Areas, the plan recommends preservation of farmland, natural features, open space, and limited growth. 1
8 This study supports plan policies outlined for Growing Suburbs, by encouraging higher densities and enhanced community design in designated Growth Areas. Higher densities, if designed well, can yield a greater sense of community, the preservation of open space and recreational facilities, less costly infrastructure investments, and facilitate the provision of affordable housing. It can also lead to the provision of more transportation choices, including the ability to support transit and transit-oriented development (TOD), and more spending on road maintenance/repair, intelligent transportation systems (ITS), and other methods to maximize transportation efficiency, while minimizing the need for major investments in new roadways. This study will take a critical look at what is meant by density, including what low, medium, and high densities mean to different suburbs in Pennsylvania and New Jersey with examples from other regions. How is density measured and how is it perceived? Why is there frequently a negative perception of density? What has been the rationale for low-density development? What are the benefits and impacts of higher density? How has the region grown over the last 10 years and what density trends are apparent? Beyond defining and measuring density in the region, the study will also address the market for higher densities in the region, as well as nationally. What demographic groups do higher density developments appeal to? What amenities and incentives are necessary to attract residents to higher density living? Lastly, the study will address the critical importance of good design as it relates to density. Beyond changing local zoning, encouraging and requiring good design is the most important factor in marketing higher density developments. Design elements such as street patterns, building types, open spaces, site planning, parking treatments, and others will be explored. Local examples of successful higher density housing are summarized. This study is intended for municipal and township officials and planners seeking to enhance suburban communities through better design and higher densities. It will also build support for policies that can make higher densities more desirable, and for greater understanding of the language of density. 2
 per acre.")
9 Chapter 1: Measuring Density Residential density can be measured in a variety of ways, the most common of which are by population density, or persons or households per square mile or acre; or by housing unit density, or number of dwelling/housing units (du/hu) per acre. Housing unit density is more commonly used over population density in municipal planning since it reflects neighborhood density more accurately by taking into account the density of housing types, not just people. Housing unit density can be expressed in gross or net terms. Another less common density measure, at least in the Philadelphia region, is floor-area ratio, or FAR. All are discussed below. Density Measures Population Density or Persons Per Square Mile Population density reflects the number of persons occupying an area in relation to the size of that area. Population density is calculated by dividing the number of people by the area they occupy, traditionally by square mile or by acre. (In this case, per square mile is used.) Data can be obtained from the United States Census ( For the purposes of this study, population density by minor civil division or municipality was used. County averages are also shown. Appendix A: Density in the DVRPC Region by County and Municipality for Year 2000 lists each municipality and each county s population density. For the region as a whole, the gross population density is 1,408 persons per square mile, or 2.2 persons per acre. As expected, the county with the highest population density is Philadelphia (10,640 persons per square mile), followed by Delaware County (2,888), Camden County (2,237), Montgomery County (1,539), Mercer County (1,533), Bucks County (965), Gloucester County (756), Chester County (571), and Burlington County (520). Population density for a given area is heavily influenced by the size of the area (the denominator in the calculation), so areas with fewer square miles, like Delaware County (190 square miles) should have a higher population density than large counties, like Burlington County (819 square miles), the region s largest county by land area. Delaware County has approximately 550,000 people in a 190-square-mile area, while Burlington County has approximately 426,000 people in an 819-square-mile area, almost four times the size. Figure 1: Top 15 Most Dense Municipalities by Population Density (Persons Per Square Mile) in the DVRPC Region 1. Millbourne Borough, Delaware County (13,911 persons per square mile) 2. East Lansdowne Borough, Delaware County (13,189) 3. Darby Borough, Delaware County (12,564) 4. Woodlynne Borough, Camden County (12,328) 5. Parkside Borough, Delaware County (11,333) 6. Clifton Heights Borough, Delaware County (10,686) 7. Philadelphia City, Philadelphia County (10,640) 8. Upper Darby Township, Delaware County (10,490) 9. Trenton City, Mercer County (10,489) 10. Collingdale Borough, Delaware County (9,794) 11. West Chester Borough, Chester County (9,751) 12. Colwyn Borough, Delaware County (9.544) 13. Lansdowne Borough, Delaware County (9,192) 14. Narberth Borough, Montgomery County (9,092) 15. Telford Borough, Bucks County (8,964) Source: DVRPC 2004, U.S. Census Philadelphia has a population density of 10,640 persons per square mile. 3
 3. Bass River Township, Burlington County (19) 4. Pine Valley Borough, Camden County (21) 5. West Marlborough Township, Chester County (51) 6.")
10 Figure 2: Top 15 Least Dense Municipalities by Population Density (Persons Per Square Mile) in the DVRPC Region 1. Washington Township, Burlington County (6 persons per square mile) 2. Woodland Township, Burlington County (12) 3. Bass River Township, Burlington County (19) 4. Pine Valley Borough, Camden County (21) 5. West Marlborough Township, Chester County (51) 6. Highland Township, Chester County (65) 7. Tavistock Borough, Camden County (86) 8. Newlin Township, Chester County (96) 9. Haycock Township, Bucks County (104) 10. East Nantmeal Township, Chester County (109) 11. Springfield Township, Burlington County (109) 12. Upper Oxford Township, Chester County (125) 13. Warwick Township, Chester County (133) 14. Tinicum Township, Bucks County (136) 15. West Fallowfield Township, Chester County (136) Source: DVRPC 2004, U.S. Census Figures 1 and 2 list the top 15 most dense and least dense municipalities (respectively) by population density in the region. These range from 6 persons per square mile in Washington Township, Burlington County, to the 13,911 persons per square mile in Millbourne Borough in Delaware County. The first-generation suburbs (the inner ring ) of Delaware County are among the densest municipalities in the region according to the population density measure. The townships in Burlington and Chester counties are some of the least dense municipalities, according to the same measure. Housing Unit Density, or Housing Units Per Acre Dwelling, or housing units per acre, measures the number of residential units contained in a square acre. This number can either be expressed as a gross density or net density figure. Gross density refers to the number of housing units per acre for the area of the entire municipality, including other land uses besides residential, along with infrastructure and public spaces. Net density refers to the number of housing units per residential acre, for residential land areas only, and would not include other land uses, public rights-of-way and parks. Gross density paints a far less accurate picture of a neighborhood than net density. If gross acreage is used, a few dense housing units in an area with several offices and shopping centers could appear to be low-density sprawl. Net density is a much more useful and accurate figure as it only considers residential land in the equation. As net density increases, lot sizes become smaller and land needed for roads per housing unit decreases. Also, when lot sizes are decreased and houses clustered, there is more opportunity to preserve natural site features and open space. Developers can save on lower land and infrastructure improvement costs per unit due to higher densities because these costs can be spread over a greater number of units. Additional savings can also come from decreased front setbacks (as less money is needed for pavement), extension of utilities, and materials. Woodbury has a net density of six housing units per acre. 4
11 Gross Housing Unit Density, or Housing Units Per Acre Gross housing unit density is derived from obtaining the number of housing units per municipality from the United States Census for the Year 2000, and dividing this by the total acreage in the municipality. Appendix A: Density in the DVRPC Region by County and Municipality for Year 2000 lists each municipality and each county s gross housing unit density. As expected, the county with the highest gross housing unit density is Philadelphia (7.3 housing units per acre), followed by Delaware County (1.8), Camden County (1.4), Montgomery County (1.0), Mercer County (0.9), Bucks County (0.6), Gloucester County (0.4), Chester County (0.3), and Burlington County (0.30). These rankings closely mirror the rankings for population density, as gross housing unit density is also influenced by the size of the area that can accommodate housing units. In addition, the average gross housing unit density for all the municipalities in each county can be measured, and returns slightly different results. While Philadelphia remains the most dense at 7.3 housing units per acre (hu/acre), Delaware County municipalities average out to be 3.3, followed by Camden County at 2.5, Montgomery County at 1.8, Mercer County at 1.7, Bucks County at 1.2, Burlington County at 1.0, Gloucester County at 0.9, and Chester County at 0.7. These rankings match the overall density for the county as a whole, but taking the average of all municipalities gives a better sense of densities at the municipal level. Figures 3 and 4 list the 15 most dense and least dense municipalities by gross housing unit density in the region. Millbourne Borough, Delaware County, ranks as the densest at 10 housing units per acre, followed by several other boroughs in Delaware County, including Darby (8 housing units per acre), East Lansdowne (8), Clifton Heights (7), Lansdowne (7), Parkside (7), and Upper Darby Township (7). The City of Philadelphia has seven housing units per acre. Many of the least dense municipalities are found in Burlington County, including Washington Township (0.003 hu/acre), Woodland Township (0.007), and Bass River Township (0.012); the same is true for Chester County, including West Marlborough Township (0.035), Highland Township (0.042), East Nantmeal Township (0.056), and Newlin Township (0.058). The average gross housing unit density for all 353 municipalities in the nine-county region is 1.6 housing units Figure 3: Top 15 Most Dense Municipalities by Gross Housing Unit Density (Housing Units Per Acre) in the DVRPC Region 1. Millbourne Borough, Delaware County (10 housing units per acre) 2. Darby Borough, Delaware County (8) 3. East Lansdowne Borough, Delaware County (8) 4. Clifton Heights Borough, Delaware County (7) 5. Lansdowne Borough, Delaware County (7) 6. Narberth Borough, Montgomery County (7) 7. Parkside Borough, Delaware County (7) 8. Philadelphia City, Philadelphia County (7) 9. Upper Darby Township, Delaware County (7) 10. Woodlynne Borough, Camden County (7) 11. Collingdale Borough, Delaware County (6) 12. Collingswood Borough, Camden County (6) 13. Colwyn Borough, Delaware County (6) 14. Media Borough, Delaware County (6) 15. Jenkintown Borough, Montgomery County (6) 16. Trenton City, Mercer County (6) 17. Prospect Park Borough, Delaware County (6) 18. West Chester Borough, Chester County (6) Source: DVRPC 2004, U.S. Census
12 per acre. The median, or the number in the middle of a set of given numbers, is a low 1.0 housing unit per acre. Figure 4: Top 15 Least Dense Municipalities by Gross Housing Unit Density (Housing Units Per Acre) in the DVRPC Region 1. Washington Township, Burlington County (0.003 housing units per acre) 2. Woodland Township, Burlington County (0.007) 3. Bass River Township, Burlington County (0.012) 4. West Marlborough Township, Chester County (0.035) 5. Highland Township, Chester County (0.042) 6. East Nantmeal Township, Chester County (0.056) 7. Newlin Township, Chester County (0.058) 8. Springfield Township, Burlington County (0.060) 9. Haycock Township, Bucks County (0.062) 10. Chesterfield Township, Burlington County (0.067) 11. Upper Oxford Township, Chester County (0.069) 12. Londonderry Township, Chester County (0.073) 13. West Fallowfield Township, Chester County (0.074) 14. Shamong Township, Burlington County (0.075) 15. Tabernacle Township, Burlington County (0.075) 16. Woolwich Township, Gloucester County (0.075) Source: DVRPC 2004, U.S. Census Net Housing Unit Density, or Housing Units Per Residential Acre Net housing unit density is derived from obtaining the number of housing units per municipality from the United States Census for the Year 2000, and dividing this by the number of residential acres in the municipality, based on Year 2000 land use analysis by DVRPC. Appendix A: Density in the DVRPC Region By County and Municipality for Year 2000 lists each municipality and each county s net housing unit density. As expected, the county with the highest population density is Philadelphia (18.2 housing units per residential acre), followed by Camden County (4.1), Delaware County (3.9), Mercer County (3.3), Burlington County (2.6), Montgomery County (2.5), Gloucester County (2.3), Bucks County (2.1), and Chester County (1.5). These rankings differ from population density and gross housing unit density. Net housing unit density better reflects the lot sizes of housing units as it only measures residential acres. Thus, while the top three densest counties continue to be Philadelphia, Delaware, and Camden, Burlington County is now ranked fifth most dense, whereas it is the least dense county in population density and gross housing unit density. This results from excluding nonresidential acreage from the calculations, as Burlington County has very large wetland areas and the New Jersey Pinelands. Chester County is the least dense according to this more accurate measure. The average net housing unit density for all the municipalities in each county can be measured, and returns higher results and different rankings than the county overall. While Philadelphia remains the most dense at 18.2 housing units per residential acre, Delaware County municipalities average out to be 7.0, followed by Camden County at 4.8, Mercer County at 3.9, Montgomery County at 3.6, Burlington County at 3.2, Bucks County at 2.8, Gloucester County at 2.8, and Chester County at 1.9. Figures 5 and 6 list the top 15 most dense and least dense municipalities by net housing unit density in the region. Millbourne Borough, Delaware County, is the densest at 30 housing units per residential acre, followed by Philadelphia City (18 housing units per residential acre), Darby Borough, Delaware County (15), and Marcus Hook Borough, Delaware County (15). The region s core cities of Trenton (15), Camden (13), and Chester (12) are also within the top 15 most dense. Many of the first generation 6

13 suburbs, mostly boroughs in close-in counties, are also included, such as Eddystone (14), Clifton Heights (13), and Colwyn (13) boroughs in Delaware County, and Bridgeport (13) and Norristown (12) boroughs in Montgomery County. The least dense municipality is once again Washington Township, Burlington County, at 0.38 housing units per residential acre. This is followed by Salford Township, Montgomery County (0.60), Thornbury Township, Delaware County (0.61), Upper Makefield Township, Bucks County (0.61), and Wallace Township, Chester County (0.61). All 15 of the least dense municipalities by net housing unit density are townships, mostly in the outlying (from Philadelphia) counties of Chester, Bucks, and Gloucester. For all 353 municipalities in the nine-county region, the average net housing unit density by municipality is 3.7 housing units per residential acre. The median, or the number in the middle of a set of given numbers, is 2.7 housing units per residential acre. Net-Net Housing Unit Density Net-net density, typically used to calculate site plan densities, includes only net buildable land, excluding streets, sidewalks, waterways, and other nonbuildable land area. Net-net housing densities are always higher, sometimes significantly, than gross density or net densities. Some municipalities also exclude utilities rightsof-way, and environmental features such as floodplains, wetlands, and steep slopes. Others subtract out environmentally constrained soils. Once these features have been excluded, the number of units or lots that can be built is calculated. Net-net density is calculated on a site-by-site basis, and cannot be determined for the region. Cluster Zoning and Lot Averaging: Responses to Calculating Buildable Land Cluster zoning allows the developer to build the same number of units under traditional zoning, but on smaller lots, in order to preserve a significant amount of land as open space within the development. Generally, cluster zoning requires new construction to be located on only a portion of the parcel, generally half or 50 percent, and permanently preserving the other half as open space under a conservation easement. To achieve this gain, lot sizes are usually reduced by half. A related technique is lot averaging, which allows the developer to vary the lot sizes, allowing more flexibility in siting units on the leftover buildable land. These and other design techniques to Figure 5: Top 15 Most Dense Municipalities by Net Housing Unit Density (Housing Units Per Residential Acre) in the DVRPC Region 1. Millbourne Borough, Delaware County (30 housing units per residential acre) 2. Philadelphia City, Philadelphia County (18) 3. Darby Borough, Delaware County (15) 4. Marcus Hook Borough, Delaware County (15) 5. Trenton City, Mercer County (15) 6. Eddystone Borough, Delaware County (14) 7. Bridgeport Borough, Montgomery County (13) 8. Camden City, Camden County (13) 9. Clifton Heights Borough, Delaware County (13) 10. Colwyn Borough, Delaware County (13) 11. Chester City, Delaware County (12) 12. Norristown Borough, Montgomery County (12) 13. Bristol Borough, Bucks County (11) 14. Folcroft Borough, Delaware County (11) 15. Upper Darby Township, Delaware County (11) Source: DVRPC 2004, U.S. Census Collingswood, New Jersey, has a net density of eight housing units per acre. 7
14 Figure 6: Top 15 Least Dense Municipalities by Net Housing Unit Density (Housing Units Per Residential Acre) in the DVRPC Region 1. Washington Township, Burlington County (0.38 housing units per resid. acre) 2. Salford Township, Montgomery County (0.60) 3. Thornbury Township, Delaware County (0.61) 4. Upper Makefield Township, Bucks County (0.61) 5. Wallace Township, Chester County (0.61) 6. London Britain Township, Chester County (0.63) 7. East Nantmeal Township, Chester County (0.65) 8. Wrightstown Township, Bucks County (0.65) 9. Woolwich Township, Gloucester County (0.65) 10. Franklin Township, Chester County (0.66) 11. West Vincent Township, Chester County (0.66) 12. Haycock Township, Bucks County (0.69) 13. South Harrison Township, Gloucester County (0.69) 14. West Nantmeal Township, Chester County (0.70) 15. Woodland Township, Burlington County (0.71) Source: DVRPC 2004, U.S. Census support higher density will be discussed in detail in Chapter 3. Floor Area Ratio (FAR) Floor area ratio (FAR) is another method to measure density of a given area, specifically measuring the ratio between building size and lot size. It is expressed as the ratio of the floor area of a building to the lot on which the building is located. For example, a FAR of 1.0 would allow a one-story building covering an entire lot, two stories covering half the lot, or four stories covering a quarter of the lot. Floor area ratio is a way to control the overall size of a building while still allowing it to be built in different shapes, such as a short and wide building using most of the site, or a tall and slender building covering less of the site and leaving more open space. It provides architects and developers with greater design flexibility. FAR can be tempered by height regulations, however, so even if a building qualifies with the correct floor area ratio, it may not exceed maximum height standards. FAR is mostly used to express density of commercial building projects, specifically to determine the maximum bulk of a building. Bulk is often regulated in cities to control congestion and traffic problems. Cities often try to attract higher densities in their central business districts by offering more floor area (a FAR bonus) to developers if they provide public amenities within the building or on the same site, such as public space, public art, retail space, passageways, or museums. FAR is also occasionally used in large-lot residential zones, to control floor area ratio of new homes and additions to existing homes, to prevent an overabundance of "McMansions" huge homes that are too big for their lots. These teardowns of smaller homes to build larger homes on the same lots is not as common in the Delaware Valley as in other regions that are experiencing rapid growth and acceleration of land values. FAR bonuses are also sometimes granted in residential areas if developers agree to participate in affordable housing programs. FAR is also used by real estate developers and transportation planners to measure trip generation. Most American central business districts have FARs of 2-10, while neighborhood Main Streets are typically zoned for 8

 across the country.")
15 FARs of 1-2, and suburban zoning limits FAR to a maximum of National Standards of Density and How the DVRPC Region Compares While there are no national standards for density, or what defines high density, medium density, and low density, a look at other regions will give insight into how the Delaware Valley region compares. A Brookings Institution study in 2001 on Who Sprawls Most? How Growth Patterns Differ Across the United States ranks population density (in this case, population per total acre, as opposed to DVRPC s analysis that looks at square mile) across the country. Population density looks at population over total area, and the Brookings study looks at the average for an entire urban area. In almost every region, density can vary widely on a community or neighborhood level (from high-rise apartments to low-density suburbs), but the urbanized area includes all such areas. According to this measure, Honolulu, Hawaii, is the densest urban area, with persons per urbanized acre; followed by Los Angeles- Anaheim-Riverside, California, with 8.31 persons per urbanized acre; then New York-Northern New Jersey-Long Island with 7.99 persons per urbanized acre. Philadelphia- Wilmington-Trenton did not rank in the top 20, but still had a fairly dense 5.03 persons per urbanized acre. The urbanized area in this analysis includes roughly the inner half of our nine-county region. For the region as a whole, our gross density is 2.2 persons per acre. Honolulu, Hawaii, is the densest because of a variety of geological and geographic features, such as mountains and ocean-bordering areas that are already developed or contain parkland. The study estimates Honolulu s net housing unit density at 5 to 10 housing units per residential acre, with most housing consisting of small apartment buildings or single-family homes with small yards. Many former industrial buildings have been converted into lofts, such as the Acme Piano Company Lofts in Queen Village in Philadelphia. Philadelphia has a high net density of 18 housing units per acre. Brookings equates sprawl with areas that have an average net housing unit density of one to four households per residential acre. As stated earlier, this report finds the average net housing unit density for all municipalities in the nine-county DVRPC region is 3.7 housing units per residential acre, and the average for each county, excepting Philadelphia, ranges from 1.9 to 7 housing units 1 Trans 21. The Good City. Planner s Guide to Automated People Movers 2002/2003. Transportation Systems for the Twenty-First Century. Boston, MA. 9
16 per residential acre. By Brookings standards, the Philadelphia region is a sprawling one. Figure 7: Net Density Categories for the Delaware Valley Region 0-1 housing unit/acre Very Low 1-2 housing unit/acre Low 2-8 housing unit/acre Medium 8+ housing unit/acre High Net Densities of Municipalities in Each County Philadelphia High Delaware Medium-High Camden Medium-High Montgomery Medium Burlington Medium Mercer Medium Gloucester Medium-Low Bucks Medium-Low Chester Very Low-Low Source: DVRPC, Los Angeles, the number two most dense urban area based on population density, is also constrained by mountains and desert, while New York City s average density (#3) is lower than to be expected, due to very low density suburbs within the metropolitan area. Manhattan s most dense census tract has 800 households per residential acre, far higher than Honolulu s most dense census tract, but land area plays a role in these figures. Ultimately the Brookings study of population density shows that their measure is not the best one, though it can be a good measure for sprawl. Honolulu sprawls least because there is less land available to sprawl onto at the edge. Brookings finds that establishing urban limit lines and protecting farmland can help a region sprawl less, and become denser in their population density rankings. To measure true neighborhood density, however, net housing unit density is the best indicator. Brookings also finds that the metropolitan density of the United States declined from 5 persons per urbanized acre in 1982 to 4.22 persons per urbanized acre in 1997, a 15.7 percent decline. Of the 281 metropolitan areas covered in their study, only 17 either increased in density or held steady from 1982 to According to a Place Type Menu developed by San Francisco s Association of Bay Area Governments (ABAG) 2, very high density for San Francisco is a 20 or more story residential building with supporting commercial; high density is 8 or more stories of residential with supporting commercial; medium-high density is 4 or more stories of residential with supporting commercial; medium density is 3-story residential (townhouses, small-lot single family) with supporting commercial zones nearby; low density is single-family developments, some 2-story garden apartments, with supporting commercial centers; and very low density is large-lot single-family with minimal commercial; and rural residential is large acreage agriculture-oriented single family (over five acres typical) with minimal commercial nearby


17 Boulder, Colorado s Boulder Valley Comprehensive Plan 3 considers low net density as 2 to 6 dwelling units per acre, medium density as 6 to 14 dwelling units per acre, and high density as 14 and above dwelling units per acre. For the Delaware Valley region, DVRPC categorized very low net density as less than one housing units per acre, while low density is one to two housing units per acre, medium density as greater than two but less than eight housing units per acre, and high density as eight or more housing units per acre. By this measure, only 32 of the region s 353 municipalities could be considered high density. Land Development Trends in the DVRPC Region Fast Growing Counties (or Counties Outpacing Regional Growth) According to a USA Today article, Cool climates, hot suburbs, mixed blessings by Martha T. Moore, on November 11, 2003, booming suburban areas can be found on the edge of older metropolitan areas like Philadelphia, with development patterns not unlike the Sun Belt region of the United States. These areas have boomed because of cheap land and housing, though this is gradually changing as real estate prices rise. This economic growth brings with it heavier traffic, crowded schools, and costly infrastructure investments. In the Philadelphia region, Chester County s population has grown 15 percent from 1990 to 2000, with a year 2000 population of 433,501, while the metropolitan area only grew 5 percent during this time. Similarly, Gloucester County grew 11 percent between 1990 and 2000, for a year 2000 population of 254,673. Bucks County grew 10 percent between 1990 and 2000, with a year 2000 population of 597,635. All three of these counties have had double-digit growth rates since These three counties could be considered the outer suburbs, while counties such as Delaware, Philadelphia, Camden, Burlington, Mercer, and portions of Montgomery contain the majority of the region s core cities and first-generation suburbs. The Reserve at Packer Park in South Philadelphia is an example of a new neotraditional infill community. The outer suburban counties of Chester, Bucks, and Gloucester continue to see rapid residential growth, with large new luxury homes in subdivisions. 3 floorarearatio.pdf 11

18 Unlike the Sun Belt however, most of these new residents are moving from communities in the same metropolitan region, not other parts of the country. Thus, this growth might better be called intra-urban migration. In reality this growth can be characterized as metropolitan sprawl. This trend can create a mixed blessing for regions such as Philadelphia s that are not experiencing the same level of growth as some of their counties. Many of these counties new residents moved from smaller homes in the firstgeneration inner ring suburbs or from the City of Philadelphia itself. While still contributing to overall population and job growth in the region, these booming counties can create conflicts with their neighboring counties over scarce public funds. Booming counties want transportation funding spent on new roads, while the inner suburbs and city in most cases would favor money spent on repairing existing roadways, or public transit service, for instance. Housing Units Authorized by Building Permits, Years Region-wide, residential permit activity declined by 7.5 percent between 2000 and 2001 but increased by 5 percent between 2001 and 2002, resulting in a net decrease of 2.5 percent between 2000 and The largest percentage of building permit activity occurred in Montgomery, Chester, Bucks and Burlington counties, although the percentage of the region s permits issued in its three other New Jersey counties continues to increase each year. Over 80 percent of the permits issued annually in the region were for single-family units. The region s more developed counties, including Delaware and Philadelphia, experienced less construction activity overall but were home to a significant percentage of permits for duplexes and units in multiple-unit structures. Clifton Heights in Delaware County has a high net density of 13 housing units per acreh. Land Use for the Region by Square Mile in 2000 The nine-county DVRPC region occupies approximately 3,814 square miles. In 2000, 676 square miles, or 18 percent was single-family residential, while 48 square miles, or 1 percent was multifamily. Thus, 724 square miles, or approximately 19 percent of the region s total area was occupied by residential land uses. Figure 8: Residential Land Use in 2000 for DVRPC Region by County shows the breakdown of residential land use types by square mile for each county. In 2000, 33 percent of the land was wooded; followed by 22 percent agricultural; 19 percent residential; 9 percent transportation; 4 percent vacant; 3 percent commercial; 3 12

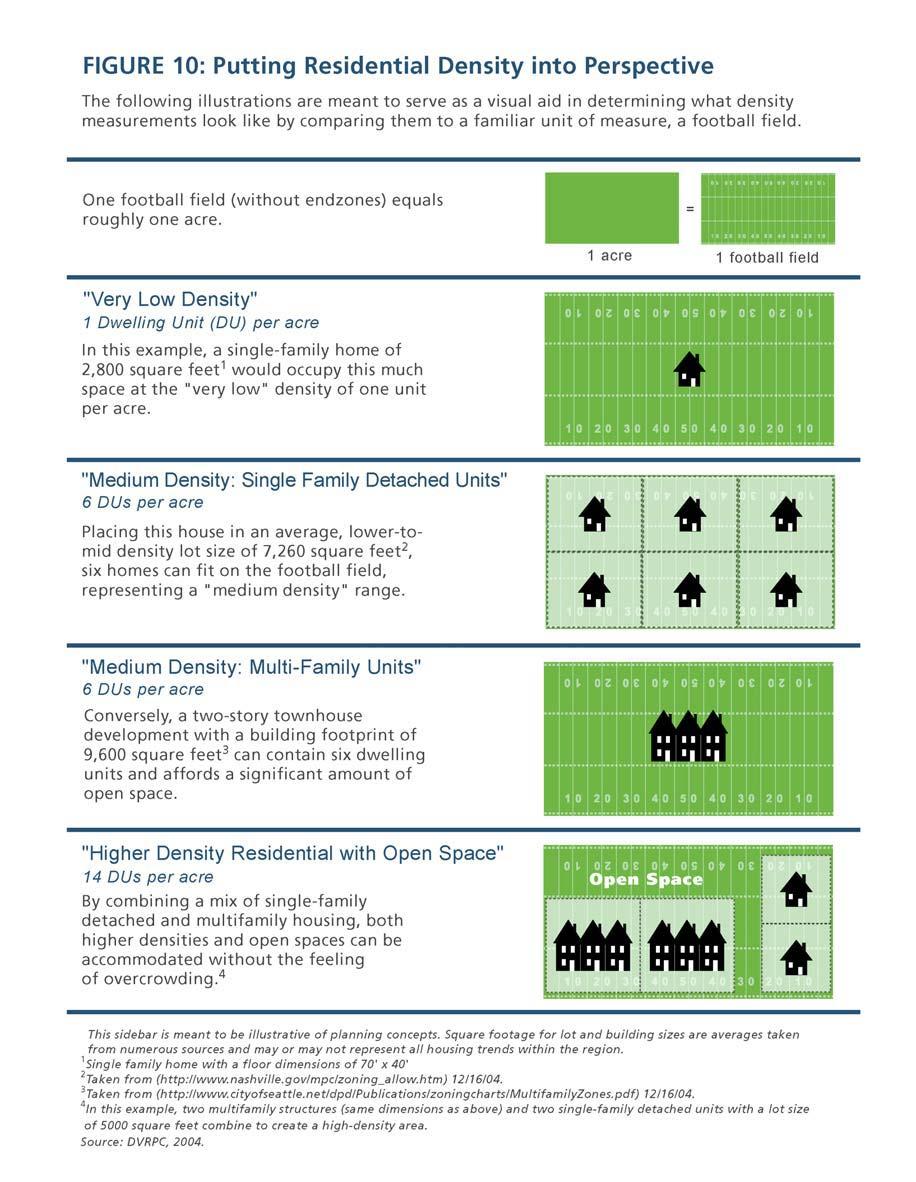
19 percent water; 2 percent manufacturing; 2 percent recreation; 1 percent community services; and less than 1 percent each for utilities, military, bogs, and mining land uses. Figure 8: Residential Land Use in 2000 for DVRPC Region by County County Single Family Square Miles % of County Total Square Miles Multi- Family Square Miles % of County Total Square Miles Total Residential Square Miles Bucks % 7 1% % Chester % 6.7% % Delaware 60 31% 5 3% 65 34% Montgomery % 9 2% % Philadelphia 34 24% 8 6% 42 30% Burlington 67 8% 4.4% 71 8% Camden 52 23% 4 2% 56 25% Gloucester 48 14% 1.4% 49 14% Mercer 42 19% 4 2% 46 21% Total % 48 1% % Source: DVRPC Data Bulletin #78, March % of Residential Square Miles in County Density Trends In the Counties A sampling of densities in the counties illustrates what density looks like in Delaware and Bucks counties, and why higher densities are not always achieved. A recent trend toward higher densities in Burlington County is discussed. Delaware County reports net densities ranging from 0.50 to 15 housing units per acre (excluding Millbourne, at almost 30 units per acre). For single-family detached homes, densities range from.50 housing units per acre (typically a single-family detached home on a two-acre lot, in such places as Chadds Ford Township, a sparsely developed western municipality) to 8 dwelling units per acre (typically a single-family detached home on a 5,000-square-foot lot, in such places as Upper Darby Township, a densely developed eastern municipality). For single-family attached homes, densities range from 4 housing units per acre (found in Thornbury Township, a relatively sparsely developed western municipality) to 14 housing units per acre (in Upper Darby Township). For multifamily homes, densities range from 7 housing units per acre (in Thornbury Township) to 14 housing units per acre (in Upper Darby Township). Narberth Borough in Montgomery County has a medium net density of eight housing units per acre. 13
20 According to planners at Delaware County, attempts at higher densities for single-family detached homes have been successful in western municipalities (where there is significant development pressure) when tweaking area regulations. Small decreases in lot square footage have yielded higher densities. Opposition has been great, however, to attempts to increase densities for multifamily housing. Figure 9: Sample Net Densities of Older Boroughs and Cities 18 hu/acre Philadelphia 15 hu/acre Trenton Marcus Hook 14 hu/acre Eddystone 13 hu/acre Camden 12 hu/acre Bridgeport Norristown Chester 11 hu/acre Bristol 10 hu/acre Conshohocken Media 9 hu/acre Bordentown Coatesville West Chester 8 hu/acre Ambler Collingswood Jenkintown Lansdowne Narberth Pottstown 7 hu/acre Lindenwold Phoenixville 6 hu/acre Burlington Lansdale Woodbury 4 hu/acre Glassboro Haddonfield Source: DVRPC, In Bucks County, according to county planners, densities for new development generally range from 0.33 to 10 housing units per acre. For single family detached homes, densities range from 0.50 to 7 housing units per acre, with the occasional 0.33 housing unit per acre district (one unit per three acre tract), though these are generally to protect specific natural resources, such as along the Delaware River. For single- family attached homes, typically townhomes, densities range from 2.5 to 8 housing units per acre. For multifamily homes, typically apartments, densities range from 3 to 10 housing units per acre, with the median around 6 to 8 housing units per acre. According to Bucks County planners, many townships allow for 10 housing units per acre for multifamily, but it is often not achieved, as developers opt to build bigger units. In the growing municipalities of Bucks County, developers are allowed (by zoning) to build at five to six housing units per acre, but rarely do, given the types of housing developments they choose to build (traditional single-family detached subdivisions with homes on half-acre lots, resulting in two housing units per acre). In Bucks County, the highest density that is generally acceptable is 10 housing units per acre. While Burlington County densities range from 0.3 to 8 housing units per acre, it is interesting to note that many densities recently proposed are much higher. Since the opening of New Jersey Transit s River Line from Trenton to Camden earlier this year, there has been much interest from the development community in building new units within walking distance of the rail stations. Proposed densities of various developments include: 23 housing units per acre at Cass Street in Trenton; several new housing developments at 10, 15, 20, and 23 housing units per acre in Burlington City; 21 housing units per acre in Beverly; 18 housing units per acre in Delanco; and 10 housing units per acre in Edgewater Park. 14

 reactions from nearby property")
21 Why Are Actual Development Densities Lower Than Allowed Densities? In the DVRPC region, and nationally, it is often the case that the densities built are not nearly as high as the densities allowed in the local zoning ordinance. Developers sometimes find that they are unable to build at the allowed density, or are unwilling to do so. Possible reasons for developers being unable to build at higher densities include site issues, market issues, policy constraints, including Not In My Backyard (NIMBY) reactions from nearby property owners. Site Issues Site issues can include environmental constraints on certain parcels of land, allowing only portions of the parcel to be developed. A developer who is required to set aside a portion of the property as open space, but who builds a high net density of residential units on the other portion of the property may not end up with a high gross density development, thus skewing the density figures downward. Often there is a lack of assembled parcels to build densely on, since the unit costs for doing high density on small parcels may be too expensive (also a market issue). This is particularly true for infill projects. Also, developers may be unwilling to build densely if it requires additional infrastructure, such as roads and sewers. Sometimes infrastructure costs can be lower as they are spread over a larger number of people in denser developments, where the marginal costs of each additional person per acre may be very low. Other times the cost of an infrastructure improvement can be so high that the density of the development does not matter. Cherry Hill Township in Camden County has a medium net density of three housing units per acre. Market Issues Market issues center on the financial feasibility of highdensity development, and the fact that some higher density developments just do not make financial sense. Some components of particular concern are the costs of parking, construction types, and soft costs of development. Parking Many higher density developments would necessitate the use of structured parking, in multiple stories above or below ground. Structured parking is significantly more expensive to build compared to surface parking. In general, the cost of structured parking can range from $9,000 per space for aboveground structures to over Moorestown Township in Burlington County has a low net density of 1.8 housing units per acre. 15


22 $25,000 for belowground spaces. 4 Revenue gain from uses above or below the structured parking is frequently not enough to justify the parking infrastructure, unless the parcel itself has very high land values, such as in the central city. Or, if the facility is in the central city, some revenue can be regained through higher parking fees. Local property owners may also object to the visual impact of a multistory garage in a suburban setting. Actual development densities are often lower than what is originally proposed. Structured parking thus becomes more difficult in suburban settings, where land values are lower and surface parking makes more sense financially. Operating costs for structured parking also tend to be higher than for surface lots. Compounding these difficulties is the reality that most suburban office locations do not charge for parking, as opposed to lots and structures in the city. On the other hand, structured parking offers covered and secure spaces, and most often direct entry into buildings; features that are very desirable and can generate higher premiums on sales and leases of commercial space or residential units. One way to reduce the parking costs in a structured development is to reduce the number of parking spaces per residential unit, to 1.5 or 1.0 spaces per dwelling unit. Lowering parking ratios, particularly effective for areas near a transit station, is the least expensive method of reducing the parking-cost component of a project. Doylestown Township in Bucks County has a low net density of 1.3 housing units per acre. Situations where structured parking could work in suburban locations include when the demand for on-site parking is high, such as at large regional malls and hospitals. Structured parking may also work if the site s slope, grading, or foundation yields unusable space that could be used for parking. Other design techniques to mitigate the appearance and height of a structured parking facility can also help to gain community acceptance. Ultimately, some form of public subsidy would probably be necessary to build and operate a parking structure in a suburban setting. Construction Types Another market issue with high-density development is construction types, namely the need in higher buildings for concrete and steel construction, which can raise individual dwelling unit costs. Wood-frame construction has the lowest costs per foot. A possible compromise in construction types is wood-frame construction above a 4 ECONorthwest. Metro Urban Centers: An Evaluation of the Density of Development. July

23 concrete parking podium, which could be used for mid-rise development of four to six stories. Again, underlying land values can offset these costs, as can the greater yield of dwelling units or leasable retail or office space. Soft Costs Another market problem frequently cited by developers is the harder to control soft costs related to development. These include regulatory bureaucracy that can add delays to the development process, such as additional permitting or a longer permitting process, additional fees, or other predevelopment costs. Difficulties in construction not foreseen at the start of a project can also add costs. The need for additional community outreach for acceptance of higher densities can also add delay and cost. These unknown variables add risk, though as more developers become comfortable building at higher densities, these should decrease. Ultimately, the market needs to be strong enough to support higher densities, and requiring higher density development in areas where it may not be viable can hinder development. A possible solution is to allow for current development that does not preclude development at higher densities at a later time (when the market can support it). One such approach used in Portland, Oregon, is shadow platting, that requires developers to design their development to achieve targeted densities over time, while not preventing development in the present. 5 Chesterfield Township in Burlington County has a very low net density of 0.89 housing units per acre. The marketplace is constantly changing, and is iterative, such that development activity over time can increase densities and demand, and that can then spur more density. If a region has a high quality of life, demand for housing will increase, and can lead to higher density living. Policy Constraints Developers may not want to build at higher densities due to longer planning and permitting processes, higher parking requirements, outdated development standards, and perceived community resistance. Higher parking requirements continue to be a hurdle, as higher density developments should be able to lower their requirements on the assumption that more people will walk, bike, or use transit, and may not even own a car. Unfortunately, financial institutions giving the loan on the project will require certain parking ratios to ensure the success of the project and lower their risk. 5 Ibid. 17

24 Often zoning and development codes are outdated and only allow higher density and innovative site plans through the use of variances, which adds another layer to the development process. Community resistance, or perceived resistance, can also add delay and costs, as residents may feel increased density will bring noise, traffic, and overcrowded schools, or detract from a community s character. Ironically, many of the close-in suburban areas that people admire for their character and community spirit are built at higher densities, and farther out suburbs are dissatisfied with newer lowdensity development. The need for additional community outreach and/or design studies for acceptance of higher densities can also add delay and cost. The public sector must assist by spurring demand for such housing, or by affecting supply and demand of land so that land values increase, though some would argue that this is not government s role. Metropolitan areas with a constrained land supply often are the densest and most expensive, such as Manhattan (naturally constrained since it is an island) or Portland (constrained through an adopted urban growth boundary). These attempts at density also come at the cost of other policy objectives, such as providing affordable housing. The public sector can also subsidize development costs to make higher densities profitable. Such subsidies could include tax abatement, land assembly, or fee waivers. West Vincent Township in Chester County has a very low net density of 0.66 housing units per acre. Ultimately, zoning is a planning tool, and as such, planning and zoning should look ahead to what the region should be, and thus, getting lower-than-planned densities is likely and not necessarily problematic. Supportive policy, a strong real estate market with high land values, and consumer demand for higher densities have to evolve over time to achieve the goal of higher density. In addition, if most communities in the region have not adopted minimum densities, this can lower overall allowed and actual density in the region. Research has shown that in general across the country, the actual densities of residential development are 60 to 80 percent of the maximum densities allowed by zoning. The Portland region has the highest percentage of actual-to-allowed residential density, at about 90 percent. 6 6 Ibid. 18
25 19
26 20

27 Chapter 2: Defining Density Determining density by the number of people or dwelling units per net or gross acre, while useful to quantify or compare different areas, is simply not an adequate gauge of the dynamism of density and compact development. Quality of life measurements like walkability, aesthetics, open space, convenience, sense of belonging and identity, richness of social interaction and access to transportation are all criteria that stretch beyond the quantitative measure of units per acre. 7 The context in which density is observed, for example, plays a significant role in how it is measured by residents. The disreputable Pruitt-Igoe public housing complex in Saint Louis, now demolished, was the same density as the eminently livable and attractive Greenwich Village neighborhood in Manhattan. 8 This illustrates how two distinctly different environments could be judged based on the single criteria of gross density figures. No one could argue that the density of development was the singular reason for Pruitt-Igoe s failures, nor could they argue the same about Greenwich Village s success. Design is one of the key components of the contextual framework by which we view a neighborhood; therefore design and the setting are ultimately what make density workable. This section will take a look at how density is perceived, beyond the numbers, as well as the benefits of density. Perceptions of Density While many suburban residents say they would like the amenities typical to an urban setting, such as walkability and a range of land uses, in broad terms the predominant preference of American suburban residents is for singlefamily homes surrounded by greenery. 9 Much of the distaste for density is founded on popular misconceptions. These misconceptions fuel NIMBYism, where residents resist any development or change in their neighborhood or Not In My Backyard. NIMBYs have since spawned BANANAs (Build Absolutely Nothing Anywhere Near Attractive multifamily dwellings in Conshohocken. 7 Anderson, G., Elmer, F., Hinshaw, M., Stepner, M., and Meck, S Getting to Density. American Planning Association and Lincoln Institute of Land Planning Audioconference. November 6, Fader, S. Density by Design: New Directions in Residential Development, Second Edition. Urban Land Institute Talen, Emily. Traditional Urbanism Meets Residential Affluence. Journal of the American Planning Association. 67:2 (Spring)

28 Anybody), NOTEs (Not Over There Either) and NOPEs (Not On Planet Earth). Douglas Kelbaugh, Dean of the Taubman College of Architecture and Urban Planning, University of Michigan, states, These groups may now be a bigger deterrent to density as cheap gas and cheap land. Density does not beget density. Residents do not beget more residents. On the contrary they resist them, often tenaciously. 10 Some of the myths that drive these attitudes reflect dated and sometimes false information on what density and compact development is, and how it is articulated in urban and suburban areas. Density Equals Overcrowding The most common myth is that increased density in the suburbs will bring the ills of inner-city life, namely crime, poverty, lower property values, and congestion. These factors are based on historical artifact. The generation of baby boomers that moved out of the cities often equates density with these problems, rather than other causal factors such as poverty, drug abuse and crime. Higher housing unit density often does not mean higher population densities, or overcrowding. 11 Above a certain density, increasing the number of units has an inverse impact on population. As housing density increases by building multifamily condos or apartments, families with children begin to disappear, leading to smaller household sizes. Older suburbs in the Philadelphia region are often quite dense, yet do not feel crowded or congested. The Delaware Valley Region has some of the oldest, most densely developed suburbs in the country. These communities have far higher densities than newer suburbs on the edge of the metropolitan area, yet their residents do not complain about overcrowding. This is because these neighborhoods have existed as higher density blocks for some time now--they have grown up dense, therefore they do not feel dense. These older suburbs contain beautiful 19 th century row homes, well-appointed single-family homes and historic multifamily homes and town houses, making it difficult to point to higher density as causing the problems associated with overcrowding. Density Lowers Property Values Many people equate higher densities with blight and lower property values. To the contrary, many high-density 10 Kelbaugh, Douglas. Density, the D-word. American Institute of Architects Conference on Density. Boston Laplante, Martin. Too High a Density Can Also Promote Sprawl. Planetizen. February 9,
29 neighborhoods and suburbs have the highest property values in the region. Also, neighborhood investment in infill residential development (thereby adding density) nearly always increases property values. Money, residents, and resources pour into an existing neighborhood. This kind of community reinvestment strengthens property values. Mixed-use infill can bring new businesses (and their tax money) that add vitality. Adding more housing to an existing area can also keep housing costs down. When there is a shortage of housing, prices go up the phenomenon largely responsible for dislocation in gentrifying neighborhoods. Denser development helps keep inflation in check by producing an adequate housing stock that reflects demand. Higher densities can also allow for both upper-income and affordable housing. By creating enough upper-income housing to offset the costs of lower priced units, developers can afford to build both types of housing. 12 Density Consumes Open Space Many people believe that dense development consumes open space and farmland. The fact is that any development will consume open space, and dense development actually consumes less space because of smaller building footprints, tighter development clusters, and oftentimes, a requirement for the developer to set aside a certain percentage of land for open space Density Takes Away Privacy and Individual Green Space Many people feel that they would be giving up privacy and a backyard if they lived in a denser community. While yard sizes may decrease, most compact communities still offer some individual private space such as a small backyard, back deck or roof deck, patio, or balcony. More community green space, such as a neighborhood park, often makes up for the smaller backyard, and some consumers prefer this to maintaining a large lawn and backyard. Compact homes are also often designed with privacy in mind, through their site design and architecture. An older example of this can be found in Philadelphia, where many rowhomes are built so that the first floor is elevated far enough up from street level so passers-by cannot look through the front windows. Other design elements that add privacy will be discussed in Chapter Mallis, R. Redefining Density. New Urban News. Vol. 8, No.8. December
30 Density Causes Traffic Congestion The most counter-intuitive myth is that increased density causes traffic congestion. Sprawl development relies on the automobile as the primary means of transportation and mobility. Multiple car trips per day are a necessity in many suburban residential areas, as single-use zoning has isolated residential uses from commercial, industrial, and institutional uses. Lowering densities makes providing public transit to these areas more costly and thus less feasible. Transit and density work in a positive feedback loop. The more people in an area, the better the level of transit service that can be provided, and the better the transit options, the more people will be drawn to live nearby. The San Francisco League of Conservation Voters has created a density calculator that calculates density s impacts on the following: land and water consumption, roads and sidewalks, local shopping, transit service, vehicle ownership, parking, vehicle miles traveled, fuel usage, gasoline cost, automobile cost, and air pollution from driving. Different densities of San Francisco neighborhoods are presented and their impacts calculated. The average sprawl density of three housing units per acre is also calculated. More information can be found at Suburban residents often must drive farther to access their daily needs, and Vehicle Miles Traveled (VMT) is higher in sprawling suburbs than in more accessible locations. Suburban residents also must spend more money on gas and maintenance of their automobiles. Air pollution also increases with more vehicle miles traveled. Conversely, highly desirable dense neighborhoods boast high walk-towork ratios. Residents that can walk to work, eat, shop and play in or around their neighborhood are contributing to a cleaner environment and less traffic congestion. A comparison between one of the region s older centers, Narberth Borough in Montgomery County, and one of the newer, lower density townships, Worcester Township in Montgomery County, finds that although the pair of municipalities is similar in total population (4,278 and 4,686 in 1990, respectively) and in median family income ($54,866 and $55,000 in 1990, respectively), they differ in terms of population density, average dwellings per acre, access to public transit, vehicle ownership, means by which most people travel to work, and potential for reverse commuting. While Narberth has a population density of 9,102 per square mile and 10.6 dwelling units per acre, Worcester has 289 persons per square mile and 1.1 dwelling units per acre. While Narberth households have an average of 1.53 vehicles, Worcester households have Thirteen percent of Narberth residents use public transit to get to work, compared to Worcester s 2 percent share. Seventy-four percent of Narberth s residents use a personal automobile to get to work, while 93 percent of Worcester residents do. Twelve percent of Narberth s households have no car and 48 percent have only one car, 24

31 compared to 3 percent with no car and 28 percent with only one car in Worcester. 13 Density Equals Height People frequently equate density with height. They assume that anything that is high density must be a tall building, when in reality many dense neighborhoods, such as those in Center City Philadelphia, are made up of twoto three-story homes. Other neighborhoods in major metropolitan cities that have four- to six-story buildings are also very dense, yet few people would say these buildings are tall or that their height detracts from the livability of the neighborhood. Density Represents Fear of the Unknown Many Americans have limited personal experience with dense living. Many younger and baby boom Americans grew up in the suburbs, and perhaps only lived in a dense environment in college, in a dormitory or off-campus apartment. Many people assume that denser housing is all rental housing, when often it is for sale and, increasingly, luxury units. Or they equate density with affordable or public housing, such as the many high-rise public housing projects built over the last half century. Benefits of Compact Development and Higher Densities Reducing Automobile Trips and Vehicle Miles Traveled (VMT) As densities rise, trips get shorter, transit and walk mode shares increase and vehicle trip rates drop. All this translates into lower Vehicle Miles Traveled. By various estimates, doubling urban density results in a percent reduction in VMT, or a slightly smaller reduction when the effects of other variables are controlled. 14 As mentioned previously in the Narberth Borough and Worcester Township comparison, density and the built environment affect travel mode, vehicle ownership, traffic congestion, and VMT. Enabling Alternate Transportation Options, like Biking, Walking and Transit Media Borough in Delaware County has a net density of 10 housing units per acre, supporting light rail. 13 Delaware Valley Regional Planning Commission. The New Regionalism: Building Livable Communities Across the Delaware Valley. July Ewing, Reid. Is Los Angeles-Style Sprawl a Desirable Planning Goal? Journal of the American Planning Association. Vol. 63, No.1. Winter
 is feasible at 4 housing units per residential acre (net density), while intermediate bus service of")
32 Places with higher density can support greater levels of transit service, since there are more riders available along these routes. According to research studies, in general, a bus with headways over 30 minutes (minimal service) is feasible at 4 housing units per residential acre (net density), while intermediate bus service of every 30 minutes becomes feasible above 7 housing units per residential acre, and every 10 minutes at 15 housing units per residential acre. 15 Light rail service with five-minute peak headways is feasible above 9 housing units per residential acre, while rapid transit with five minute peak headways is feasible above 12 housing units per residential acre. Commuter rail becomes feasible at one to two housing units per residential acre, if operated on existing track. Public transit use increases fourfold as density increases from 7 to 30 housing units per acre. When amenities are close by, walking and bicycling become feasible. When development is focused around a transit stop, the convenience of its location makes it a logical choice for travel. High-density downtown centers have experienced this phenomenon for years if there are alternative transportation options available, a car becomes an added expense and often an inconvenience. Compact development can preserve green space and support improved air quality. Preserving Open Space and Farmland Compact development generally leaves more green spaces for parks, recreation and preserved land. Agricultural land and open space face a greater threat with sprawl development. Sprawl-style development can eat up as much as two-and-a-half times as much land as compact development, surrendering even more pristine agricultural land than is necessary. 16 Sprawl development seldom leaves land in its natural state, which leads to intangible costs on the environment and society. Species fragmentation, stormwater runoff, groundwater recharge, water pollution controls (in wetland areas) and habitat disruption represent some of the externalities that could be avoided if new developments were designed more compactly. Community parks are seldom razed to make room for more development. Rather, development is drawn to these nearby open spaces because green space is a desirable amenity. Developers often pay for the maintenance of 15 Pushkarev, Boris and Zupan, Jeffrey. "Where Transit Works: Urban Densities for Public Transportation. Urban Transportation: Perspectives and Prospects. Eno Foundation Ewing, Reid. Is Los Angeles-Style Sprawl a Desirable Planning Goal? Journal of the American Planning Association. Vol. 63, No.1. Winter
33 parks and open space because it adds value to their property. Supporting Better Air Quality and Other Environmental Concerns Auto reliance causes environmental problems on multiple fronts. As worldwide demand for oil increases with the industrialization of India and China, there is an increased strain to extract more crude oil from an already limited supply. Further exploration and extraction will lead to the environmental degradation of protected wildlands and the world s oceans. Previously protected lands in Alaska have had their protections repealed to make way for further resource consumption. The relationship of energy consumption to urban form parallels that of travel to urban form. In energy studies, centralized development patterns consistently out-perform low-density sprawl insofar as consuming less fuel. 17 In other words, sprawl requires greater energy expenditures, which come at a great cost, fiscally, diplomatically and environmentally. There is a clear correlation between vehicle miles of travel (VMT) and vehicular emissions. The Delaware Valley region is classified as a non-attainment area in relation to the federal air quality standards. The main reason for this great health and environmental risk is the growth of mobile source emissions due to growth in VMT and vehicle trips. Carbon dioxide buildup in the atmosphere is also causing global climate change; despite numerous international treaties and referendums on curbing emissions, it is anticipated that these emissions will rise globally 30 percent by Compact development is clearly a better alternative than sprawl when it comes to curbing emissions and reducing energy consumption. By reducing the number of auto trips, encouraging bicycling, walking and transit, and providing for more green space, some of the effects of auto emissions can be mitigated. By combining increased incentives for those who walk and use transit with fewer automobile subsidies and fuel prices that reflect the true cost of the commodity, the inevitable impact on air quality and public health can be reduced. 17 Ibid. 18 Ibid. 27

34 Offering the Health Benefits of a Walkable, Bike- Friendly Community A number of recent studies have determined that suburban sprawl may have physiological impacts on residents, in addition to environmental and traffic impacts. The American suburb may now be contributing to medical problems from obesity to depression to high blood pressure. Studies published by the American Journal of Public Health, and the American Journal of Health Promotion, find a significant connection between sprawl and obesity and between sprawl and hypertension. Higher density communities offer the health benefits of walking and biking. Public health experts point to the amount of time Americans spend in their cars as directly contributing to obesity. The number of miles Americans travel by car has doubled since Suburban neighborhoods, with few sidewalks and attached garages, enable residents to stay in their cars from door to door. With few sidewalks, many residents are forced to drive to the mall if they wish to walk for exercise or enjoyment. Long commutes also lead to added stress and hypertension. Ever increasing prescriptions of antidepressants are harbingers of the widespread problems individuals face when they have to sit in traffic if they want to shop, recreate, eat, work or travel. These studies begin to establish a common language between planners and public health professionals on the topic of sprawl. Their shared agenda is combating health problems like obesity, coronary disease, diabetes, asthma and mental disorders such as anxiety and depression that can be linked with the American auto culture. Compact development, with its combination of walkability, greenery and transit accessibility, is at least one antidote to these sprawl syndromes. Attracting Intellectual Capital and the Creative Class A 2002 survey of 4,000 recent college graduates reported in the Wall Street Journal found that 75 percent identified location as more important than the availability of a job when selecting a place to live. 19 The creative class, a term coined by Richard Florida, Carnegie Mellon University, are highly educated, mobile young people working in creative professions, such as artists, musicians, engineers, architects, planners, and 19 Florida, Richard. Revenge of the Squelchers. The Next American City. Issue

35 scientists. These people congregate in regions with a high quality of life, with constructed amenities from arts and culture to high-end restaurants. 20 Cities with compact environments where young people can meet, mingle and mate are attractive to this group. Regions with a high creative class index include Silicon Valley, Seattle, Boston, New York, and Austin. These areas have higher overall job growth, higher per capita wages and higher population growth than other regions. Education is a strong economic sector in these cities, and they have been able to retain recent graduates, thereby attracting high-end technical employers. Carnegie-Mellon University recently studied 300 regions and found that the high-tech and patenting industries are strongly correlated to regions with high population density. The creative class is attracted to the amenities that come with density, and can spur economic growth and innovation in a region. Higher densities also support the economic vitality of neighborhood retail. Research shows that 7 housing units per acre or higher are needed to support a small corner store, whereas 18 units per acre or higher are needed for a small supermarket. Reducing Infrastructure Costs The Urban Land Institute has found that infrastructure costs per housing unit drop dramatically as density increases. The estimated infrastructure cost for utilities, schools, and streets for one dwelling unit on four acres (0.25 hu/acre) is $90,000, while the same infrastructure costs for one dwelling unit on a 1,500 square foot lot (30 hu/acre) is $10,000. It is also less expensive for municipal services, such as fire, police, and emergency response. Providing Housing Choices for Mixed Income, Elderly and Disabled Citizens A signature characteristic of dense neighborhoods is the diversity of the people that inhabit them. In higher density developments, there can be enough market-rate housing that a developer or property owner has the financial ability to create some affordable units. Compact development that is near transit also saves on transportation costs, as the need for a car or a second car can be eliminated. There are also social and psychological benefits to living in an economically diverse community. New subdivisions often are characterized by their selling prices, so that those who can afford a home over $200,000 live in one development, those who can afford over $300,000 live in another, and so on, creating an economic monoculture. If the family s economic circumstances change, they may be forced to move to an entirely different community. An economically diverse community gives the family the choice to move nearby, to an apartment unit or less These attached townhomes in Conshohocken offer housing choices for a range of incomes. 20 Ibid. 29

36 expensive home. The economic monoculture can also generate keeping up with the Joneses, a constant battle to keep consuming on par with one s neighbors and economic status. There are also social and psychological benefits for those living in affordable units to be close to market-rate units. An entire development of affordable units can also suffer from an unhealthy economic monoculture. Suburban subdivisions often present a monoculture of design. Encouraging mixed-use neighborhoods with a range of housing creates a more diverse and interesting landscape. Elderly and disabled citizens benefit from compact development as well. In low-density areas, elderly and disabled people often have to rely on relatives or costly home-care services to provide them with the assistance they need, particularly with automobile travel. In more urbanized dense areas, these people have the option of calling upon close-by neighbors for assistance, or walking or taking transit to access services. Creating a More Diverse Landscape Compact development and higher densities allows for a greater range of housing styles and choices, thereby creating a more diverse landscape. Mixed-use developments that allow retail and office next to or in the same building as residential add to the vibrant mix. Zoning that allows for only one type of use, such as single-family detached residential, can often lead to a monoculture of design and a less diverse landscape. 30

37 Chapter 3: Designing Density Density does not define a place, design does. As this study has demonstrated, density in and of itself does not tell us much about a neighborhood. A dense neighborhood can be very attractive, such as Greenwich Village in New York City or Society Hill in Philadelphia, or can be a failure, such as the Pruitt-Igoe public housing project in Saint Louis, or Martin Luther King Homes in Philadelphia. These areas have similar densities, but their design is a larger factor in their success or failure. This section will look at what the appealing qualities of midto-high density neighborhoods are, and attempt to offer a typology of design elements that make up a neighborhood or development. Appealing Qualities of Mid-to-High Density Neighborhoods There are many attractive mid-to-high density neighborhoods in the Philadelphia region, whether they are in the city, in a first-generation suburb, or in a newer suburb. What makes these places attractive? Why do people live there? What design elements stand out? The six broad design elements that add to the overall feeling of community and quality of life are: interconnectedness, green infrastructure, public space, defined private spaces, diversity, and design. Interconnectedness Most appealing places are interconnected and accessible. This includes an easy-to-navigate system of roadways, bike paths, sidewalks, trails, and transit. These elements connect neighborhoods to each other and to the broader metropolitan area. Cities and older first-generation suburbs often have a much more intricate and efficient circulation system made up of grid and/or numbered streets, alleyways, sidewalks, and trails. They allow for shortcuts, either roadway shortcuts or pedestrian cutthroughs that provide quicker and safer ways to move about. These networks provide other options than traveling on highways or major arterial roadways. Children can walk or bike to school, to shops, to friend s houses, without burdening the parent to drive them. Most first-generation suburbs have sidewalks. Many newer suburban subdivisions have one entry roadway into a subdivision, from a major arterial roadway. 31


38 They lack a network of alternate roadways, causing traffic congestion and frustration. Suburban development, with its emphasis on single-use zoning, creates the need for driving to access school, shopping, and work. Strip shopping centers, regional malls, and large new schools are frequently surrounded by huge parking lots that do not connect with any neighboring land uses. These uses only serve one user well those arriving by automobile. Pedestrians and bicyclists are unsafe in this environment, and so these land uses fail the interconnectivity test. Older suburbs often have informal networks of alleyways and shortcuts. Urban designers are now focusing on the importance of streets and pathways to good design and community cohesion. Rather than creating a street hierarchy based solely on traffic flow and volume, designers are using streets, pathways, and open space to define neighborhoods. There is a new emphasis on creating a street hierarchy based on the meaning of streets as pathways for all users, not just the automobile. Street networks should link neighborhoods to each other, and the current suburban model of subdivisions linked only by a major arterial road fails in building community amongst these separate developments. Similarly, state departments of transportation are focusing on context sensitive design when implementing roadway improvements. Green Infrastructure As research has shown that most Americans generally prefer single-family detached homes with greenery, incorporating as much green infrastructure into neighborhoods is desirable. Older suburbs have the benefit of age, in mature trees and landscaping, and in planned green space, such as neighborhood parks. Almost all of the most attractive Philadelphia suburbs and city neighborhoods have mature street trees and welldefined and used local parks. A shared neighborhood green can be an amenity in a higher density neighborhood. According to the Conservation Fund, Green infrastructure provides a diversity of public and private functions and values that address both natural and human needs and benefit the environment and communities. 21 Green infrastructure has environmental, psychological and economic benefits. Green infrastructure is essential to supporting native species, maintaining natural ecological processes, and sustaining air and water resources. 21 The Conservation Fund and U.S. Forest Service. 32


39 Psychologically, research indicates that trees help reduce stress in the workplace, and increase worker productivity. Trees also speed recovery for hospital patients. Green infrastructure enhances economic development. Home values are higher in areas adjacent to parks, green spaces and natural features. Cities that are known to be green, with ample parks, recreational amenities, and easy access to nearby mountains, national and state parks, and hiking and biking trails, attract many people to move there from less green cities. Seattle, Portland, and Boulder have all seen population increases, due in part to their allure to environmentalists and others. As green infrastructure adds to quality of life, many businesses are also attracted to these regions. Because these cities want to keep it green, they have instituted environmental policies, including progressive land use regulations to protect open space and natural features. Street trees can add value and soften the harder edges of a streetscape, such as along this row of homes in Camden. A study by the USDA found that street trees increase residential property values by 10 to 20 percent. 22 Street trees in commercial districts have also been shown to increase the number of customers and shoppers, according to the National Arbor Day Foundation. Apartments and offices located near trees also tend to rent quicker. Trees can also reduce air conditioning needs and costs by 30 percent, and cut energy used for heating by 35 to 50 percent. Trees have also been shown to improve air quality by absorbing carbon dioxide and water quality by reducing the impact of rain on soil erosion and runoff. They reduce noise pollution by absorbing sound. They sustain wildlife by providing a suitable habitat for birds and animals. Public Space Well-designed public spaces add value to any neighborhood. Public space is so vital that it could be considered the cornerstone of human society. From the ancient Greek forums, the places from which the ideals of democracy sprung, to the typical neighborhood street where kids and parents mingle and play games, public places that allow people to come together have done much to advance democracy, understanding, equality and the overall well-being of our communities. Street trees create a beautiful canopy in Media. Lansdale hosts concerts and other events in their railroad station plaza. 22 City of Golden Valley, Minnesota, Web site. 33


40 A neighborhood gathering space provides a place to socialize, exchange goods, recreate, and enjoy nature. Streets with sidewalks are the most common public spaces. A well-designed street that provides adequate room for pedestrians, whether it s an alley, a country lane, a busy commercial street, or a wide public boulevard, can offer a place to interact with neighbors and fellow citizens. Streets give meaning to places. Homes that are built facing the street, with shallow setbacks and front porches, animate a residential street. Porches provide the transitional space between the private home and the public street, as well as eyes on the street, making a neighborhood safer. Front porches provide transitional space between the private home and the public sidewalk. Other public spaces include neighborhood parks, pocket parks, greens, plazas, squares, community gardens, or shared yards. If public space is strategically located and well articulated it can compensate for small or nonexistent yards. The single-loaded street, with a row of homes across from a green, can be an attractive option for a developer, as the homes narrower lots and higher sales prices offset efficiency losses. Public space can be integrated into new and infill development to mitigate the perceived impacts of increased density. Suburban sprawl development often overlooks public space for more private space. Homes with garages in front create a barrier between the private home and the public street and often dominate the streetscape. Backyard decks have become more common than front porches, adding to the privatization of space in the suburbs. Suburban streets are often cul-de-sacs that do not connect to neighboring streets. Auto-oriented suburban design characteristics do not necessarily mean there is no social interaction, but oftentimes there is less. Some of the best-loved neighborhoods in the suburbs and city are those with recognizable public spaces, whether those are attractive streets, neighborhood parks, or other public spaces. These spaces add value. Trees and fences can create private spaces, even in dense environments. Defined Private Spaces Good design can provide private, usable outdoor spaces on even the smallest lots. Private space can be accommodated in medium to high-density areas through small backyards, side yards, patios, back decks or roof decks, balconies, and front, back, and side porches. Private yards can generally be accommodated at up to nine dwelling units per acre, above which green space is better provided through a community asset, such as a park or square. 34


41 Through careful placement and design of buildings, accessory structures, rooftops, and landscaping, private outdoor space can be an amenity offered to residents of higher density neighborhoods. Private space can be demarcated through the use of hedges, garden walls, and fences. To maximize usable private space, a home s active and passive orientation should be considered. The active side should contain a majority of the windows and allow the occupants to observe their surroundings. The passive side should have smaller and fewer windows. These windows should also be placed strategically to not interfere with the active side of the adjacent home. The thoughtful placement of windows can create usable private space. Trees and fences can provide privacy between densities. Diversity Diversity in architectural forms, in building types, and in land uses prevents the monotony many people associate with contemporary high-density, and often low-density, developments. Many inner ring suburbs benefit from a wide variety of architectural styles, from Victorian to Colonial to Bungalow, often depending on the year the house was built. Newer subdivisions often have only one architectural style or variations of it. Offering different housing types, such as single-family attached, single-family detached, twins, rowhomes, apartments, cottages, lofts, accessory units, senior housing, and assisted living, offers a choice to consumers. It also creates an intergenerational neighborhood, allowing older people to move into a smaller unit or an assisted living facility while remaining in the same area, close to existing friends and family. Single people, once married with children, can also transition to a family home. Many suburban subdivisions, as mentioned previously, offer monocultures of one economic class. Many older suburbs also have retail and institutional uses mixed in. A berm can reduce noise and provide privacy. Design Design is what defines a good neighborhood. A more detailed discussion of design elements follows. A linear park can also provide a neighborhood amenity and also provide privacy between densities. 35


 helps define the success of the space.")
42 Typology of Design Elements/Design and Form Mix of high, medium, and low residential densities, with retail and day care. Mix of densities, including single family detached, townhomes, and apartments with small front setbacks on grid street pattern. The physical environment of a neighborhood is made up of three basic component parts: buildings, streets, and open spaces. The permutations of how these parts are arranged, what they are made of and how they are articulated is what creates the endless variety of neighborhood character. By altering the way a street moves through a block, or the facing of a building, living environments can be created that are comfortable, intuitive and aesthetically pleasing. Manipulating these components affects both perceived density and the physical character of the neighborhood, which (barring social and economic factors) helps define the success of the space. Neighborhood Types The layout of an overall neighborhood affects the achievable housing densities. Research has shown that a neighborhood of single-family detached homes organized along curvilinear streets or cul-de-sacs can only achieve densities of five housing units per acre, and typically range between one and five housing units per acre. Adding in a gridiron street pattern, still with single-family detached homes, can achieve densities ranging from 1 to 17 housing units per acre. Adding in some multifamily buildings into an area with single-family detached homes can achieve densities of 6 to 18 housing units per acre. Single-family attached homes, with shared walls but private yards, can achieve densities of housing units per acre. Multifamily homes in small two- to three-story buildings yield eight to 40 housing units per acre, while multifamily in four- to ten-story buildings achieve housing units per acre. High-rise multifamily, in buildings higher than 10 stories, can achieve densities of 80 housing units and above. 23 Buildings Higher density added in to lower density neighborhood. A street connection is also established. Pairing cul-de-sacs to form loop streets is another option. Housing Types Buildings define the space of a neighborhood, by building blocks. According to research done by the San Francisco League of Conservation Voters, net housing unit densities 23 Campoli, J., MacLean, A. Visualizing Density: A Catalog Illustrating the Density of Residential Neighborhoods, Working Paper. Lincoln Institute of Land Policy. November
 with a home, possibly several outbuildings, such as barns and horse stalls, found in a rural")

43 across the country typically take the form of the following housing types. At less than one housing unit per acre is a ranchette, a large multi-acre tract of land (like a ranch) with a home, possibly several outbuildings, such as barns and horse stalls, found in a rural community such as Wallace Township, Chester County. At one housing unit per acre is the lowest density of single-family detached dwellings, usually in a sprawling area in the growing suburbs or exurbs such as Harrison Township, Gloucester County. At three housing units per acre are typical low-density singlefamily detached dwellings most common in sprawl. The single-family detached home has emerged as the dominant paradigm in most suburban development. At 10 housing units per acre are row houses with occasional single-family dwellings and apartment houses, generally found in older suburbs or sections of large cities, such as Bristol Borough, Bucks County. At 100 housing units per acre are mostly three- to five-story apartment houses with occasional mid- to high-rises and single-family dwellings, and can be found in certain Philadelphia neighborhoods, or in other city neighborhoods, such as Nob Hill in San Francisco, Beacon Hill in Boston, and River North in Chicago. At 500 housing units per acre are mostly mid- to high-rise apartment buildings in cities, such as the Upper East and West Sides in Manhattan, and smaller neighborhoods in Chicago, San Francisco and elsewhere. According to the Affordable Housing Design Advisor ( developed by the United States Department of Housing and Urban Development (HUD), more compact housing models can achieve the following densities: compact single-family detached at 7-21 units per acre, single family with secondary unit at units per acre, multiple units with a single family appearance at 8-22 units per acre (also called a mansion house ), row houses at units per acre, multifamily walk-up flats and apartments at units per acre, and multifamily elevator apartments at units per acre. Medium and low-density neighborhoods with shared green space, future street connections reserved. Mixed use with retail, apartments, parking, shopping, and twin homes. Often times the rowhome or townhome is criticized as unattractive, as all too often the site planning in suburban settings is less than optimal. Many newer townhome developments are built in clusters around large surface parking lots, and lack the traditional urban grid and block patterns, and accompanying street trees and well-defined green space. Or the rowhome is viewed as lacking in amenities and size, though this is often built on old assumptions. A 2,000-square-foot lot measuring 20 feet by 100 feet deep can contain a rowhome that is 20 feet 37
, a five-foot front setback, and a 20 by 35 foot deep rear yard.")

44 wide and 40 feet deep, for a footprint of 800 square feet. With a basement, two floors, and a habitable attic, the house becomes 3,200 square feet. It also allows a 20 by 20 foot garage in the back (accessible by alley), a five-foot front setback, and a 20 by 35 foot deep rear yard. Or, it could allow a smaller yard, such as 15 feet, and a larger 65-foot depth house footprint. 24 Many suburban townhomes are built in clusters around parking lots, with no sidewalks, street trees, or defined green space. These townhomes also lack a town or street life, the usual tradeoff for living more densely. Building Materials The use of appropriate and varied building materials can add visual interest to a dense community, and prevent the visual monotony of one house style often found in large developments. The use of brick, stucco, stone, wood, siding, and shingles can create interesting facades with different textures. Windows, doors, rooflines, trim and exterior details can be varied in size and placement. The use of color is also encouraged, as many suburban communities shy away from anything but conservative colors, often creating a bland product. All of these elements make up an identity for a neighborhood. Streets and Sidewalks Streets and sidewalks serve both a transportation purpose and a social purpose. Streets behave differently depending on their size, capacity, and use. Streets are also public spaces where neighbors meet and children play. Streets also help define a place, from the wide boulevard of the Champs Elysee in Paris, to the bustling Fifth Avenue in New York, to the narrow lanes of London s West End, to the highways in Los Angeles, to the one-way narrow streets of Center City Philadelphia. All of these streets give an identity to their cities. Prospect New Town, in Longmont, Colorado, uses bold colors, interesting rooflines, and front porches to make homes unique and highly desirable. Street Hierarchy Streets are usually categorized into a hierarchy based on form and function. Traditionally, function and volume define the type of street. This often includes the following street types: arterials, collector streets, and local streets. These can be further classified according to major and minor terminology. Major arterials are generally interregional roads that carry vehicle traffic to and from the region, and are often controlled access streets. Minor arterials connect to the major arterials and serve boroughs, villages, and points in between. Collectors provide connections to local access and arterial streets. Local 24 Lewis, Roger K. The Much Maligned Rowhouse Offers Several Advantages Over A Detached Home. The Washington Post. April 19,

45 streets provide direct access to adjacent land uses and individual residences and commercial areas. While highway engineers and planners design around this hierarchy, often times these street types and terminology ignore the local conditions and surrounding land uses. These streets may not adequately address community design. A new street hierarchy based more on building livable communities rather than just volume and efficiency of vehicle movements, might include the following categories. Neighborhood Interior Streets These are the basic building blocks for any street network. The streets are the most narrow and have the shortest blocks. Neighborhoods are built around these streets and function as the public domain for residents. To be most effective at fostering livability and community, streetscape and street design guidelines should be observed, including the use of street trees and sidewalks. Neighborhood Main Street A neighborhood Main Street is an essential ingredient for a livable community. A successful Main Street and its neighborhood maintain a mutually supportive relationship. Neighborhood-scale businesses serve the community s basic retailing needs without the necessity of traveling to a larger shopping center. Many Main Streets in the DVRPC region are also state highways, and this presents a challenge to make the road both a thriving business district and an efficient through roadway. Main Streets are often several feet wider than interior streets. Main Streets should also focus on an attractive streetscape, wide sidewalks, on-street parking, and bike lanes. Main Streets need to accommodate cars without detracting from the livability of the street. Many older suburbs in the region have attractive Main Streets that provide an alternative to the shopping mall. Broadway Broadway streets serve two primary purposes for the town or city scale. First, they act as edges or boundaries for neighborhoods. Secondly, these streets are major traffic thoroughfares for the town or city. Accordingly, these streets are wider to match the scale of the commercial activity. The scale of the buildings and sidewalks will also match in proportion to the increased commercial activity and wider streets. Medians are appropriate to mitigate the higher street width. Boulevard/Avenue Boulevards and Avenues are larger than Broadways. They exist on a city or even regional scale. They are populated by office, retail and apartments. The center of the road will often have a median strip on it wide enough to 39

46 accommodate two rows of trees. This prevents the pedestrian from becoming overwhelmed by the scale of the street and also provides a safe haven for the pedestrian crossing the street. The Benjamin Franklin Parkway is an example of a boulevard with many of Philadelphia s cultural institutions and large apartment buildings along it. A particular challenge for boulevards and avenues is to make them pedestrian-friendly, and this usually must go beyond just a median strip for safe crossing. The Center City District of Philadelphia is studying redesigns for the Parkway to calm traffic and make the Parkway more pedestrian-friendly. Part of the strategy is to introduce retail uses, including restaurants and cafes to enliven the boulevard. Street Design Grids and Cul De Sacs The cities and older first generation suburbs in the Delaware Valley were generally built on a grid street system, oftentimes numbered for ease of use. Suburban development of the past 40 years has often included subdivisions entered off a major or minor arterial, with an internal street system of winding roadways and cul-desacs. Rarely are these streets numbered or systematically named. This makes wayfinding more difficult. The grid street pattern offers several advantages over the cul-de-sac. The grid system provides an interconnected network of streets, offering multiple paths for automobiles, bicyclists, and pedestrians. Having a variety of routes can decrease overall congestion. The grid can increase accessibility and often provides a better system for direct trips. Direct trips are often shorter on the grid system, reducing overall vehicle miles traveled (VMT). The system is legible and can be easier for nonlocals to understand. Visibility and sight lines are better on the grid s straight streets, making it easier for motorists to notice bicyclists, pedestrians, and approaching vehicles. Developers building neotraditional suburban communities have once again embraced the grid as a livable street design. The cul-de-sac street pattern oftentimes creates an inefficient and isolated network of streets. Many cul-desacs were built to offer a safe area for children to play, and to decrease the amount of through traffic on a residential street. The cul-de-sac was really an early form of traffic calming. Unfortunately, by removing traffic and creating a neighborhood of dead ends, the overall street network suffers. Because there are very few connections between streets, trips tend to be indirect and longer. Suburban 40


47 streets that feed into a major arterial are often congested, as they are the only paths to shopping, work, and recreation. Pedestrians usually suffer, as their paths to friends homes, the mall, or school can be circuitous and long, even when these uses are physically nearby. Driving to these uses then becomes a necessity, and walking often involves using arterials, which may or may not have sidewalks. Cul-de-sacs result in fewer residents walking to access goods and services, let alone work and school, decreasing daily social interaction along the street. Walking is generally only done in these communities for recreational purposes. An alternative to the cul-de-sac is the crescent street, which has a jog in the alignment that serves to calm traffic but also maintains street connectivity. The grid pattern need not be monotonous, as it can also accommodate curving streets and diagonals, as long as the overall mix promotes connectivity and clarity. Crescents, ovals, and circles can add aesthetic variety when combined with a grid pattern. Block Length Block length plays a role in community design. Shorter blocks, between 250 to 500 feet, make walking less intimidating, as cars move slower due to an increased number of intersections. More intersections provide accessibility and slow traffic down. Shorter blocks add visual interest, and foster economic diversity and greater social interaction. More people are willing to walk several short blocks than one long monotonous block that offers no chance to turn and start a new path. The combination of short blocks with a grid street pattern creates an urban fabric of intricate cross-uses. If shorter blocks are not possible, midblock footpaths or sidewalks between parallel streets are a good compromise. Street Width As the road informs the driver, so too does street width influence the design of neighborhoods as well as the behavior of drivers. Narrower streets slow down drivers and increase safety. Many suburban subdivisions built in the last several decades have residential street widths of 32 to 40 feet. Research has shown that wider streets encourage people to drive faster, resulting in more automobile accidents. Twenty-four foot wide streets are considered the safest, according to Traditional Neighborhood Street Design guidelines. Residential street width has also been shown to have an effect on the sociability of neighbors. On narrower streets with less traffic, more neighbors knew each other than on wider streets with more traffic. It is interesting to note that many Narrow streets slow down drivers and increase safety. Many new subdivisions have streets that are too wide. These attractive homes in Philadelphia are located on a very narrow street, on lots under 1,000 square feet. 41

48 of Center City Philadelphia s streets are 26 feet wide, considerably narrower than many streets in American cities. These 26-foot wide streets can accommodate two travel lanes of 10 feet each, and one lane of on-street parking. A frequent criticism of narrow streets is that they lack adequate room for the turning movements of emergency response equipment, such as fire trucks, which usually need 10 feet of clear travel width for turning. By restricting on-street parking at street corners, or installing curb bulbouts or extensions, trucks can climb a curb if need be to make the turn. Shorter block lengths also are effective, such that a 300-foot fire hose can extend the length of the block. On-Street Parking On-street parking has several benefits. It provides closeby and short-term parking for a Main Street s stores and it can reduce the number of spaces needed in surface parking lots. On-street parking also provides a buffer between pedestrians and moving traffic lanes, effectively serving as a traffic calming technique. Sidewalks, street trees and on-street parking make a street livable. Streetscape Many communities have begun investing in streetscape improvements, often in retail districts, but also in some cases along residential streets. The streetscape addresses the space between the curb and the building. If designed well, this area has tremendous potential to increase the livability of a community. Streetscape elements include special sidewalk pavers, such as decorative brick; pedestrian-scale lighting; street furniture such as benches, bus shelters, café seating, planters, decorative trash cans, pocket parks, bollards, and kiosks or community display boards. These increase comfort, make walking more enjoyable and let the pedestrian know they are provided for. Sidewalks Sidewalks are essential to provide pedestrian access and community cohesion. A rule of thumb for this region might be that any area with the density to support public sewers (generally 2 units per acre) should also have sidewalks. Sidewalks should be installed on all streets, whether they are residential, commercial, industrial, or mixed use. Residential sidewalks should be at least four-and-a-half feet wide, while commercial sidewalks should be at least six feet wide or larger to accommodate higher volumes of pedestrian traffic and street furniture. Some cities, like Ann 42


49 Arbor, Michigan, have mid-block sidewalk bulbouts for café seating, interspersed with parked cars, which creates a lively street life and also calms traffic. A sidewalk can also be continued at the end of a cul-de-sac street as a footpath or trail through to the next neighborhood. Street Trees As mentioned previously, street trees add to the livability of a street. They shield pedestrians from traffic, and create a canopy cover that provides shade, color, smell and shape to a street. They help to create an outdoor room. Streets without trees often have a visual void in the center, separating each side from the other. Street trees help to narrow the perception of the width of the street. Street trees should be deciduous in variety, and a hardy species to withstand variations in weather. In residential areas, a spreading shade tree can provide a cooling canopy; in retail areas, an open-leafed tree provides a more retailfriendly environment that allows signs and stores to be seen. Site Planning and Open Spaces Site planning is one of the most important determinants to good design in higher density environments. Site planning determines how large the lot size will be, how the home is situated, how green space and private space is allotted, how to accommodate parking, and what role the height of structures plays. Since many consumers prefer a yard and convenient private parking, creative solutions to providing green space, privacy, and workable parking must be devised. Good site design takes into account efficiency, functionality and aesthetics. Lot Sizes Lot sizes have varied over the years and across the region. Residential lot sizes in the older boroughs and townships in the pre-world War II era were typically plotted in 50-foot increments. The average lot was 50 feet by 100 feet, resulting in a 5,000-square-foot lot, with a one-car garage in the rear of the lot. 25 After the war, lot sizes began their ascent to 70-foot increments and higher. Quarter-acre, or 10,000-square-foot lots with two-car garages became the norm in many communities. Developers continue to build homes on half-acre and acre lots, particularly in exurban areas. At the same time, escalating land scarcity and higher land values in many communities led lot sizes to decrease in the 1990s overall. These smaller lot sizes are Typical one-acre lot sizes, representing one hu/acre, along cul-de-sac street. Dashed line represents possible future street addition. Typical two-acre lot sizes, representing 0.5 hu/acre. Dashed line represents possible future street addition. 25 Fader, S. Density by Design: New Directions in Residential Development, Second Edition. Urban Land Institute

, move the homes once again closer to the sidewalk and street line.")
50 challenging developers to rethink their typical lot layouts and come up with more innovative solutions to accommodating yards and garages. Lot Layout Similar trends are underway regarding lot layout. Prior to World War II, most homes were built with a small front setback allowing for a front yard, and a modest backyard. As lot sizes increased, more homes were built with larger front setbacks from the street, usually situated in the middle of the lot with equal side yards, and including a backyard. Recent trends, such as New Urbanism and Traditional Neighborhood Design (TND), move the homes once again closer to the sidewalk and street line. Front setbacks as short as 10 to 20 feet in some smaller lot subdivisions are not uncommon. Oftentimes homes will be moved closer to one side of the lot, with a zero lot line on one side, to allow for a larger side yard on the other. These innovative layouts can provide privacy in the backyards and side yards. Typical two-acre lot with front garage and driveway. Rear garage, front drive. The placement of the garage can also be a hot button issue. Prior to World War II, garages were accommodated behind the home, either accessed through a front driveway or a back alley. After World War II, more homes were built with an attached garage, almost always in the front of the house, to accommodate our automobile culture. These front-loading garages often dominate the streetscape and the house design, allowing fewer windows in the front of the house, and encourage exit and entry from the house through the garage. These homes also create more curb cuts along the sidewalk, disrupting the pedestrian experience and depleting on-street parking spaces. Frontloading garages also do not allow as much light to enter through the front of the house. Much of the American family s social activity moved from the front yard and porch to the backyard. Recent articles on snout houses lament this trend toward a street of garages with attached homes. New Urbanists and others, by moving homes closer to the front lot line or side lot line, have opened up space once again for the rear garage. These rear garages, accessed by back alleys, create a streetscape that is once again oriented on the homes, not dominated by the garage and a large array of parked cars. The rear garage also provides a buffer from the neighbor s yard, and can create a private yard for each residence. While builders often believe rear service alleys cost more to pave than front driveways, this is not always the case, and hinges on required street widths for alleys. Alleyways of 10 to 12 feet of pavement can cost less overall. Side-loaded garages are also a desirable alterative to front-facing garages. 44


51 Parking The treatment of parking is often critical to the design of higher density housing. Parking can be contained within each parcel, in a shared surface lot, or in a shared structure. Parking within each parcel is feasible at one to five housing units per acre, and is the typical low-density suburban driveway approach with two cars parked side by side. At six to nine housing units per acre, tandem parking (one car parked behind the other in a driveway) or parking in a mid-block service alley is possible. At nine housing units per acre and above, parking next to the housing unit becomes difficult, except for townhomes; and a developer must then decide whether to do surface parking or structured parking in one location. Parking in a shared surface lot, a typical solution in a medium density development, is feasible for 9 to 22 housing units per acre. Parking in a shared structure, a high-density approach, is feasible when the development is above 20 housing units per acre. 26 Rear garage on alley. Certain treatments are effective at masking parking, including placing the parking behind homes or stores, using berms or attractive plantings to soften the hardscape of the parking lot, planting trees or plants along the street edge of a surface lot to maintain the illusion of the street wall, or wrapping a parking garage with first floor retail. According to the Urban Land Institute, the typical cost per parking space depending on type are: $2,500 per space for surface lot, $5,000 per space in a wood-frame garage, $8,500 per space in an above-grade parking structure, $15,000 per space in podium parking supporting residential units above, and $20,000 per space in an underground garage. 27 Shared parking lot between residential and retail uses. Green Space and Landscaping The treatment of green space in higher density housing is also critical, as most consumers prefer some green space amenities. At 10 housing units per acre and above, a developer must decide whether green space should still be assigned to individual units or become a community asset. Landscaping can also create continuity and visual interest in a dense community, and buffer noise and neighboring uses. 26 Campoli, J.,MacLean, A. Visualizing Density: A Catalog Illustrating the Density of Residential Neighborhoods, Working Paper. Lincoln Institute of Land Policy. November Schmitz, Adrienne, et al. The New Shape of Suburbia: Trends in Residential Development. Urban Land Institute Shared parking garage in mixed use downtown, with apartments above retail. 45

52 Visual Screening Berms and mounding can be used to visually screen land uses, parking, highways, and rail lines from residential uses. This technique is often used in site planning to buffer homes from noises and vehicle lights, and to provide greater privacy. Some would argue that this technique is a bandage to a problem; one that better designed density could ameliorate. Interior shared parking in high density, mixed-use setting. Height Height is another issue in density, and people often confuse height with density, and believe buildings that are lower to the ground are more in touch with nature. This building-ground relationship can be maintained at up to 24 housing units per acre, such as in the row house neighborhoods of Philadelphia, before higher densities require multistory apartment buildings. 28 Even so, a combination of townhomes and multistory buildings, if designed well, can create a better balance of ground space (allowing some open space and parks) and amenity supporting density (such as stores, schools, recreation, and transit) Campoli, J., MacLean, A. Visualizing Density: A Catalog Illustrating the Density of Residential Neighborhoods, Working Paper. Lincoln Institute of Land Policy. November Langdon, Philip. In Central Vancouver, Modernism and New Urbanism Mesh. New Urban News. Volume 8. Number 8. December


53 Chapter 4: Marketing Density Demographic Trends With the resurgence of center cities and urban areas in general, the market for higher density housing products appears to be on the rise. More people today are opting for townhomes and condominiums, when available, instead of single-family detached homes. Young singles with or without roommates, young childless couples (married or not), and empty-nesters, just to name a few, are demographic groups with the highest desire to live within a more densely populated area that offers concentrated amenities, cultural opportunities and social interaction. Even in more suburban communities, the demand for higher density living is rising and the types of housing product desired is changing along with it. The United States Census found that in 2000, only 24 percent of all households are married couples with children, a significant decline from the 40 percent in The share of married couples without children has remained relatively stable, at 28 percent of all households in 2000, compared to 30 percent in One-person households have increased significantly, to 25 percent of all households in 2000, compared with 17 percent in Other family or nonfamily household arrangements have risen significantly as well, to 21 percent in 2000, from 12 percent in The market for townhomes and attached housing has grown in the Philadelphia region, particularly among empty nesters. Household size has decreased, with average household size in 2000 of 2.62 persons, compared to 3.14 persons in Between 1970 and 2000, the share of households with five or more persons dropped from 21 percent to 10 percent of all households, while those with only one or two household members grew from 46 percent to 59 percent. Similar trends can be found in the Delaware Valley region. In the year 2000, only 23 percent of all households were married couples with children (compared to 24 percent nationally). The share of married couples without children is 26 percent of all households (28 percent nationally). One-person households account for 27 percent (higher than the national average of 25 percent), with the remaining 24 percent made up of other family and nonfamily household arrangements (compared to 21 percent nationally). Average household size in the region is 2.58 persons, close to the national average of 2.62 persons. Some suburban homes may be closer to suburban employment centers. 47
54 Consumer Demand Allure of Outer Suburbs Homebuyers and renters move to outer, newer suburbs from the central city or inner ring boroughs or townships for a variety of reasons. Oftentimes, the homes offered farther out are larger, and provide more house for less money. In some cases, the public school system in cities and older boroughs is lacking, and newer suburbs offer better schools and newer facilities. Frequently consumers, who might prefer to live in an attractive inner ring suburb, cannot afford a house in more desirable communities. Consumers who want new construction can often find much more of this type of product farther out, though with new infill projects increasing in the region, this is changing. Many suburban subdivisions offer a larger yard and more personal space to the homeowner. In addition, these homes may be closer to suburban employment centers. If what you market is privacy and exclusivity, then every new house is a degradation of the amenity. If what you market is community, then every new house is an enhancement of the asset. -Vince Graham Amenity-Rich Homes According to the National Association of Homebuilders (NAHB) consumer survey, What 21 st Century Home Buyers Want, prospective homebuyers have high demands for what they want in a home. Many respondents want plenty of space, especially storage space, upscale interior and exterior features such as high ceilings, marble countertops, top-of-the-line appliances, patios/decks and whirlpool tubs. The preferred square footage of a new home was 2,071 square feet. Nearly 40 percent wanted a minimum of four bedrooms, while 49 percent would accept three bedrooms. In fact, the U.S. Commerce Department reports that more than a third of new homes in 2002 had four or more bedrooms. Amenity-Rich Communities An interesting part of the NAHB survey, most relevant to this study, concerned whether or not the respondents would prefer a larger home with fewer amenities or a smaller home with high-quality products and amenities. Fifty-one percent opted for a larger home and 49 percent for a smaller home with more extras. 30 In addition, among 22 community amenities, park areas and walking/jogging trails were the top-rated amenities with 62 percent and 58 percent of respondents, respectively, saying that these features would have an influence on their home purchases. 30 National Association of Home Builders. Housing Facts, Figures and Trends,

55 Smaller Homes According to a USA Today article entitled McMansion passion is diminishing, February 2004, some buyers are rejecting ready-made mansions in favor of scaled-down homes with features tailored to their personal tastes. Several architects, including Sarah Susanka of Raleigh, North Carolina, author of the book The Not So Big House (1998), and Dennis Wedlick of New York, are seeing a scaling-down trend among clients building new homes. Wedlick comments, The issues of square footage virtually never comes up. People use words like cozy and intimate when describing what they want. Susanka states, Many people are reassessing whether it makes sense to buy a massive house to gain volumes of space, half of which will go unused. Comfort is born of smaller scale and fine details. A large portion of the market still looks for bigger, but the trend is changing. Stephen Schreiber, director of the University of South Florida s architecture school in Tampa, sees a trend in buyers who are probing life beyond the subdivision. People who could afford bigger homes in gated enclaves are opting for smaller homes in close-knit communities offering a mix of lively commercial and residential lifestyles. Smaller houses also offer important environmental advantages by consuming less energy. 31 Many of the larger homes have rooms that are never used and the homeowners have to heat and cool all of that space, regardless of whether they use it. Real estate brokers, appraisers and bankers still perpetuate the notion that a house needs a formal living room and dining room for resale. It may take some time before real estate professionals embrace the changing residential market, especially when it comes to smaller spaces and less rooms. Attractive new attached townhomes in Longmont, Colorado, offer bright colors and modern design. Architects are also finding that consumers and potential homebuyers are looking at some larger homes as poorly built. People simply want better homes, states Georgia Bizios, a professor of architecture at North Carolina State University. Space was seen as a luxury. Now they realize that just having additional square footage is not all there is to it. Design is the key to a smaller home not feeling confined. 31 Gardner, Marilyn. Smaller Houses for Bigger Living. Christian Science Monitor. November

56 Multifamily Homes One in four American households are living in multifamily homes, according to the NAHB. Clearly, it is important to understand the wants and housing choices of these consumers. Convenient location, a lack of maintenance and repair responsibilities, and affordability are just a few of the reasons people choose to live in multifamily homes. 32 The demographics of multifamily homebuyers include individuals who are young, move frequently and desire to live in urban areas. Multifamily residents also tend to have fewer children and make smaller demands on public infrastructure and services. Still, homebuilders of multifamily housing products often face negative public perceptions and a lack of support from community and political leaders. One in four American households are living in multifamily homes. Most people assume that multifamily homes in dense environments, such as apartments or condos, do not offer as much square footage as single-family homes. Living densely does not have to mean less individual space. The size of new multifamily units has adjusted over the years to meet market preferences for more space (though some part of the market, as mentioned above, would trade less space for better designed space). For instance, in 1971, according to the U.S. Bureau of the Census, 33 percent of new multifamily units were 1,000 square feet or more; while in 2002, 63 percent of new multifamily units are 1,000 square feet or more, almost double the percentage of larger units than 30 years prior. In addition to overall unit size, the number of bedrooms and bathrooms has also increased, as well as a growing percentage of units with central air conditioning (92 percent in 2002), which was nonexistent in The percentage of units with two bedrooms has remained fairly constant, fluctuating slightly around 50 percent over the last few decades. Units with one bedroom have decreased from 37 percent to 29 percent from 1971 to 2002, while three bedroom units have increased in percentage share over the same time period, from 13 percent to 20 percent. Benefits and Impacts of Multifamily Homes To address some of these obstacles, the NAHB has documented the benefits of multifamily homes and the reasons multifamily housing should be embraced in every community. Economic impacts, for one, are substantial on both the national economy and on the local economy. For instance, a typical 100-unit project in an average city 32 National Association of Home Builders. Housing Facts, Figures and Trends,


57 generates 559 jobs, $161.7 million in local income and $25.5 million in local taxes and fees, all over a 10-year period. Again, residents of multifamily homes generate fewer students for public schools than single-family residents. One hundred typical homes generate an average of 54.7 school-aged children while multifamily homes generate only 36.7 school-aged children per 100 households. 33 Surprisingly, even home appreciation values for singlefamily houses were greater when multifamily buildings were in the vicinity, according to the American Housing Survey for 1997 through The average annual appreciation rate for single-family homes within 300 feet of a multifamily building was 2.9 percent compared to 2.6 percent without the presence of a multifamily building within the same proximity. Because multifamily homes are built at higher densities, local government capital and operating costs are reduced. Factors such as traffic, water usage and other public services are also notably less impacted with multifamily developments. In recent years, the average number of vehicle trips generated per single-family dwelling unit was 9.75, while the number of trips per multifamily dwelling unit was 6.59 for homes in buildings with one to two stories and 4.2 for homes in buildings with three or more stories. 34 Market for Higher Density in the Philadelphia Region According to a 2000 study for 10,000 Friends of Pennsylvania, Inc. and the Pennsylvania Environmental Council, Market Position Analysis of the Residential Market Potential for Compact and Sustainable Development, the potential market for new compact market-rate rental and for-sale units depends on several factors: household mobility rates, median incomes, lifestyle characteristics, housing preferences, location (of the site), and the competitive environment. In the Philadelphia region, however, new housing is not necessarily an indicator of consumer preferences. There is a relatively narrow range of available new housing options. With slow population growth for the region overall in the last decade, especially in the urban core and inner ring suburbs, the size of lots in exurban areas have increased and the new construction styles seem limited to large, homogenous single-family homes and townhomes. New homes at Shot Tower Place in Philadelphia s Queen Village are attractive, high density, and in high demand. Their heavy massing is relieved by projecting bay windows and variety in exterior materials and textures. Bella Vista Court, under construction in Philadelphia s Bella Vista neighborhood, will offer luxury high-density living, with balconies, gardens, basements, and twocar parking. A 10-year tax abatement for all new construction homes in Philadelphia is an added incentive. 33 Ibid. 34 Ibid. 51


58 New homes at Front and Washington in South Philadelphia offer three to four bedrooms, elevators, and smart-home technology. New homes in Philadelphia s Bella Vista neighborhood offer attached garages, double bay windows, and roof decks. These homes have contributed to rising real estate values. This infill development features homes with and without a ground floor garage. Working on Public Perception of Density In September of 2003, The Congress for New Urbanism held a national conference on Density. The goal of the conference was to examine density s positive effects on revitalizing distressed neighborhoods, and achieving regional economic competitiveness. 35 Higher densities help meet many public goals as well as meet consumer concerns such as affordability and traffic congestion. Higher densities allow for better transit connections and promote walking to work. Density promotes the creation of affordable housing by creating enough upper-income housing to offset the costs of lower-priced units, therefore creating a critical mass of each so that neither dominates. 36 All of these factors should prove selling points to planning and zoning bodies in times of shrinking public resources. In order to overcome consumer perception problems, there will be a need for a commonly understood language for density. Many Americans have no clear frame of reference when it comes to pedestrian-oriented compact and sustainable neighborhood alternatives. 37 Despite the many successful models in older communities in the Delaware Valley region, many suburban residents still lack good examples of new quality compact development in their own communities. Citizens are therefore likely to oppose higher densities due to misperceptions. Citizens often cite reasons for opposition: higher densities have a negative impact on neighboring property values, higher densities lead to greater negative environmental impacts, rental properties introduce a transient population into stable and predominantly ownership neighborhoods, increased traffic flow, storm water management issues, and school overcrowding. 38 Studies are beginning to show property values rising for single-family homes adjacent to new multifamily/higher density developments. The Urban Land Institute, in their publication Fall 2003 Multifamily Trends, finds that major factors determining whether density is good or bad are 35 Mallis, Ron. Redefining Density. Congress for the New Urbanism, vol. 8, no. 8, December Mallis, Ron. Redefining Density. New Urban News. Volume 8. Number 8. December Pennsylvania Environmental Council, 10,000 Friends of Pennsylvania, Inc., Zimmerman/Volk Associates, Inc. Market Position Analysis of the Residential Market Potential for Compact and Sustainable Development on Five Representative Sites in Southeastern Pennsylvania. February Ibid. 52

59 within the control of developers, community leaders and local officials. Learning from the mistakes of other new infill developments can guide developers and communities in building successful and attractive higher density housing. Today, most multifamily developments built nationally are 100 to 200 units, carefully designed and sited and have modest to luxurious amenities, according to the Brookings Institute. These developments are causing neighboring property values to swell. For instance, in Wheaton, Maryland, an older inner-ring suburb of Washington, D.C., seven new developments of approximately 50 to 250 units have been built over the last three years or are in the planning stages. Most of the units are town houses, apartments and condominiums clustered around a Metrorail station and an old mall that is being repositioned. Older homes nearby have increased in home value by percent, annually, over the last three years. This trend is happening elsewhere and more frequently, illustrated through recent research performed by the Harvard Joint Center for Housing Studies, New York University, Wayne State University and others. Well-Designed Density: Washington Town Center An excellent example in the Delaware Valley region of well-designed new density is Washington Town Center, located in Washington Township, in Mercer County, New Jersey. Washington Town Center is the first new town in New Jersey to be fully designed and developed by a municipality in partnership with the development community. The developer is Sharbell Development Corporation. Homes in Washington Town Center are set close to the street, with sidewalks and attractive landscaping. Washington Town Center is a 1,250-acre community based on neo-traditional, compact design principles. The community currently consists of 350 homes, while another 80 have been sold. Sharbell is building new houses at a rate of about 120 per year. A total of 828 homes are planned in the Town Center, as well as 172 apartments planned for the upper floors of the commercial buildings. Housing types include town houses, duplexes, singlefamily detached, and apartments. The net density goal is six housing units per acre or a gross density of four housing units per acre if the total acreage of the town center is considered. There will be 450,000 square feet of commercial retail space along a village Main Street, 22 public parks and gardens, including a village square, and 53
 that runs through the Town Center into a commercial Main Street.")

60 500 acres of preserved greenbelt around the 450-acre development core. Washington Township has succeeded in converting the portion of state highway (Route 33) that runs through the Town Center into a commercial Main Street. Route 33 will be narrowed to two lanes, with on-street parking and 16- foot sidewalks, with buildings abutting the sidewalk. Main Street commercial uses are within walking distance of all of the homes. The township is a 20-square-mile community with a population of 100,000 located approximately 10 miles outside New Jersey s state capitol of Trenton. Historically this area has been a farm-based community. It was not until the 1980s that pressure for suburbanization began. At the time, township officials did not want to see the standard sprawl pattern of strip malls and subdivisions in their community. To avoid this scenario, the officials partnered with developers, property owners and County, state and federal officials to develop a comprehensive plan and development initiative. Early on in the process officials chose to view their role as community designers as opposed to processors of development permits. Washington Town Center offers an array of home styles. A community green provides neighborhood green space. Part of the township s strategy was to front-load the development process with a detailed comprehensive plan. Goals and guidelines were created. Both township officials and the developer contributed to the creation of a place that was livable and community-oriented as the township desired, but also practical and fiscally manageable for the developer. This early collaboration vested both parties and helped ensure its success. Implementation of the Washington Town Center initiative is regulated through a master plan created in The township adopted Town Center Zoning and Design Regulations, which allows for mixed-use, compact land uses, and also sets out design specifications for buildings and site design. The township also adopted Open Space Design Standards. These standards control the aesthetic design and implementation of spaces that are to remain within the public realm. Included are streets, sidewalks, parks, alleys, plazas and squares. The level of detail for these guidelines plays an important role in consistency and enforcing the township s goal of creating a livable community. Detailed conceptual designs for all of the 22 parks and public spaces are provided. Other details include the location and species for every street tree, material vocabularies for sidewalks, walls and street furniture. These regulations are not only a blueprint for development; they are also legal documents that the 54

61 township can use to implement its vision. Typically, New Jersey municipalities have little control over these elements, instead allowing those decisions to be made by the developer. Sharbell Development Corporation used innovative design techniques and offered a wide-variety of attractive homes to attract all types of residents. By providing townhomes, carriage homes and larger single-family homes, Sharbell was able to lessen some of the concerns about an influx of school-age children and fears of over-burdened schools. The tax burden created by additional school children is a major issue in New Jersey, as almost all school funding comes from local property taxes. Residential land uses are typically considered negative ratables, in comparison to higher revenues from commercial land uses. The commercial component of Washington Town Center has also proved to be a very good tax ratable. These neo-traditional homes on compact lots also attract childless couples, empty nesters, and singles, and therefore less children overall. Early projections estimated that the development would produce 805 school-age children; as opposed to 2,282 school-age children that a typically single-use-zoned suburban subdivision would produce. As the town is being built, the total number of school age children is turning out to be even less than projected. For 481 built units, planners estimated 245 children in In 2002, this same number of units has only generated 153 children. Home prices may have some impact on numbers of children. Townhomes and coach homes, both singlefamily attached home types, with three bedrooms and twoand-a-half baths, ranging in size from 1,800 square feet to 2,300 square feet, begin at $345,000. Single-family detached homes, known as carriage homes and village homes, with three or four bedrooms and two-and-a-half baths, range in size from 1,900 to 3,100 square feet, and are priced at $394,000 to $550,000. There are no association or monthly dues. Washington Town Center has won multiple awards from the New Jersey Builders Association Sales and Marketing Awards, including the 2002 Community of the Year-Single Family Homes $250,000-$350,000, the 2002 "Best Landscaping for a Single Family Home $250,000- $350,000," and the 2002 Best Interior Design for a Single Family Home $250,000-$350,000." Prices have risen since Washington Township has succeeded in A new infill home in Philadelphia s Queen Village neighborhood has an attractive two-colored cornice and interesting brickwork to distinguish itself. 55


62 creating a town center that embodies the concepts of smart growth and livable communities. City of Philadelphia: Design Guidelines The City of Philadelphia published Design Guidelines for Commercial Façade Improvements in 2003, to promote good building design in neighborhood commercial corridors. The guidelines help business and property owners understand storefront design and building maintenance. They are intended to improve the quality of physical alterations to neighborhood corridors, protect and conserve neighborhood architectural character, enhance the pedestrian experience, and encourage economic investment. The guidelines cover such elements as upper façade and building cornices; entrances, including doors and ADA access ramps; windows, including materials, sizes, maintenance, displays and lighting; signage; awnings; security grilles; building color; and landscaping/planting. Some new infill homes, such as these in Philadelphia s Pennsport neighborhood, feature window openings that are too small for the overall scale of the building. The lack of articulation of the façade makes the homes appear out of scale with adjacent homes. These new infill homes in Philadelphia s Bella Vista neighborhood, while well proportioned and offering many amenities, could benefit from the use of different colors on the façade. Accommodating the garage on ground level also has its drawbacks, among them a discontinuation of a pedestrianonly sidewalk and the loss of public onstreet parking. The City of Philadelphia also recently published Neighborhood Design Guidelines: For All of Philadelphia s Neighborhoods in These guidelines are intentionally general, and are not prescriptive or narrowly interpret what is right and wrong. They do not adhere to a specific taste or style, and their intent instead is to educate what is meant by good community design. These guidelines are directed at multiple users, including community planners, community development corporations, residents, small business owners, developers, architects, and lastly all city agencies that review development requests and proposals. These guidelines discuss such neighborhood physical amenities as urban open space, cultural and historic resource sites, landmarks, architectural curiosities, architectural combinations, viewpoints, surface qualities, civic art, and signs and symbols. Residential guidelines vary according to three types of neighborhoods, including: neighborhoods that need only modest enhancements and practical maintenance; neighborhoods that need robust reinvestment and infill development; and neighborhoods with a high number of neighborhood centers. Commercial guidelines vary according to the type of commercial use, including: retail core/center city, corner store/mom and pop business, transit commercial corridor, big box, and malls and strip commercial centers. Design guidelines are offered for commercial development in existing residential neighborhoods, and for new large-scale 56
63 commercial development, such as in a new neighborhood center, or in a big box development. Urban open space design guidelines are also covered, discussing both individual open space, such as side yards and backyards, and community open space, with ideas for reuse of the city s many vacant lots. These could be converted to tot lots, playing fields, community gardens and greens, school grounds, outdoor markets, neighborhood gateway parks, art parks, neighborhood heritage sites, tree lots, urban farms, naturalized parks, or for use as stormwater detention. The city s many brownfields are also addressed, with design ideas on how to convert vacant industrial structures and parcels into residential and mixed-use communities. Delaware Valley Smart Growth Alliance The Delaware Valley Smart Growth Alliance (DVSGA) is a new initiative of various government, private sector and non-profit organizations in the Greater Philadelphia region encompassing Southeastern Pennsylvania, Southern New Jersey, and Delaware. The Alliance s Project Recognition Program recognizes specific development proposals that exemplify smart growth characteristics. By recognizing the value of proposed projects, the program encourages developers, citizen groups, and elected officials to strive for smart growth. To be considered, a proposed project must first meet all five base criteria. These include: location in an area designated or appropriate for growth; sufficient density, good design, and a diversity of uses; accessibility to multiple modes of transportation, including public transit; protection, conservation or mitigation of environmental features; and generation of community assets and participation. Projects meeting these five base criteria are then reviewed against more detailed criteria. Each recognized project receives a letter of endorsement and an offer of testimony before local approval authorities. An independent, regionally diverse jury reviews projects on a quarterly basis. The Alliance s criteria for density does not specify a numerical target for housing units per acre, but instead has the jury assess a project against a set of questions such as Will net density exceed the density of the surrounding area? or Is density sufficient to encourage mixed uses, walking, biking, use of civic spaces, increased public transportation, and the reduction of single-occupant 57
64 vehicle trips? The coupling of density with design and land use diversity in the criteria clearly reflects the Alliance s understanding of the importance of density in promoting Smart Growth in the region. 58

, and allowing accessory apartments on residential lots.")
65 Chapter 5: Achieving Density Policy Approaches to Density Local government policy can encourage higher density development through a number of mechanisms, from merely allowing density to occur, to relieving some regulations and bureaucracy, to providing direct financial assistance to developers. These approaches make it easier for the development community to build more densely. Municipalities should first allow the density to be able to occur, by increasing permitted densities, allowing density bonuses, permitting the purchase or transfer of development rights, allowing mixed-use zoning (allowing developers to choose a mix of uses that would support a higher density development), and allowing accessory apartments on residential lots. Directing density to appropriate places is important. Density works best near existing or planned transit hubs, to take advantage of this commuting option and create more transit benefits. It also works well in or near town centers, thereby strengthening the downtown with more residents and shoppers. Density works at the junction of two neighborhoods, creating a mixed-use corridor and larger community node. Density should be built near major retail and employment destinations, making these areas more active in the evenings and on weekends, and also making them safer. Higher density development should be designed to blend with the existing neighborhood or context. Higher densities should be concentrated next to shops or offices, or toward the center of a site, while stepping down building heights to lower densities next to existing neighborhoods. Mixed-use developments can be either vertical mixed use, with multiple land uses within the same building, or horizontal mixed use, with multiple land uses in the same development though not the same building. The DVRPC region has mostly built horizontal mixed use, though more town centers are being built with the traditional vertical mixed use, such as apartments above downtown stores. Underperforming or vacant shopping centers, also known as greyfields, can be redeveloped into mixed-use, denser neighborhoods. Vacant industrial buildings or parcels, also known as brownfields, can become vibrant new residential communities. Density can strengthen a community by New infill homes in Philadelphia s Pennsport neighborhood offer density plus good design. These new infill homes in Philadelphia s Queen Village offer a courtyard entrance, allowing greater privacy and distance from the street. 59


66 adding more residents, workers, shoppers, amenities, connections, and services. Some consumers prefer smaller homes, with less yard, such as these homes in Westville, New Jersey. Prospect New Town in Colorado offers a wide array of modern and traditional single-family home designs, as well as apartments, live-work units, courtyard homes, and carriage houses above garages. Unique design is the community s strongest selling point. Placing density in appropriate locations is supported by the long-range plan for the Delaware Valley region, Horizons: The Year 2025 Plan for the Delaware Valley. The plan calls for concentrating development in centers and corridors in the region, areas that already have the infrastructure to support such density. A hierarchy of centers is identified, from metropolitan centers to regional centers to growth centers, among others. The plan also supports transit-oriented development, by encouraging higher densities within a quarter to a half-mile of a transit station. Local governments can also provide regulatory relief through reducing fees, streamlining permitting, and instituting design standards that can assist the developer in designing a higher density development at less cost. Providing direct financial incentives to developers is possible through assembling land, providing infrastructure, offering grants or low-interest loans for land, parking, or infrastructure, or by developing a split-rate property tax (shifts property tax to value of land and eliminates tax on capital improvements, thus encouraging developers to spend less on land and more on improvements). Local governments can also make it easier on the development community to build more densely. Such approaches might include increasing the maximum density, or establishing higher minimum density zoning. Oftentimes zoning ordinances only go so far as to allow higher densities, not require. Form-Based Codes It is widely recognized that Smart Growth is hard to build under conventional zoning. Euclidean zoning that sought to separate different land uses and regulate densities has contributed to a sprawling single-use landscape. Zoning s original purpose of separating industry from residences served a useful purpose then, but less so today. Industry has become less polluting, so separation is less imperative. We are left with zoning codes that are often arcane, complicated, and discouraging to innovative development approaches. Zoning today often protects communities from bad development, but does nothing to encourage the creation of good community design. 60

67 Likewise, as detailed in this study, traditional zoning focuses too heavily on numbers, whether it s the number of residential units allowed, the length of a setback, the height of a building, or the amount of parking required. Too often these numbers are not based on an overall community vision. An innovative new land use control called Form-Based Codes or Smart Growth Codes seeks to move beyond the numbers game of traditional zoning. These regulations focus more on the size, form, and placement of buildings and parking, rather than land use or density. They support mixed-use neighborhoods with a range of housing types, allowing developers to build single-family homes, apartments, retail or office based on market demand. A developer must still comply with some numbers set by the community, such as building height, but as long as the buildings meet the form-based code, they are allowed. Form-based codes are more flexible. Rather than limit development through regulation, a community s zoning should actively seek to create livable neighborhoods. Form-based codes express what a community wants to see, rather than what is forbidden. Most form-based codes have the express intention of allowing mixed-use, a range of building types, avoiding blank walls on buildings, and building out to the sidewalk to create a sense of place. Form-based codes do not necessarily prescribe what the design of a building should be, leaving this up to the individual owner. Some communities also have adopted design guidelines that may further discuss design of individual buildings, but form-based codes are meant to be more flexible, with modest demands on developers, and not meant to discourage development. An attractive home in Wayne, PA, appears to be a single family, but is actually a twin home. This new trend in zoning focuses more on form (building type) and less on land use. It allows communities to have a mix of land uses, and a mix of residential types, rather than continuing to create single-use neighborhoods with all homes similarly priced and therefore socially stratified. Thus, form-based codes can have social equity benefits. Form-based codes, through mixing of land uses, can also concentrate employment, housing, and services, therefore improving mobility, decreasing dependence on automobiles, while promoting the use of alternative travel modes. The Smart Code is a specific form-based code developed by the firm of Duany Plater-Zyberk of Miami, Florida, a leading voice in the New Urbanist movement. The Smart Code is grounded in theories of new urbanism, smart 61

68 growth, and environmentalism. It is based on Duany s Transect theory. The Transect theory encourages all intensities of development to be accommodated and placed in the appropriate place. It is defined as a geographic crosssection of a region used to reveal a sequence of environments. Highest intensity uses are located in the center with the most rural uses on the outskirts of the area. Figure 11: The Transect illustrates this theory. Figure 11: The Transect Courtesy of Duany Plater-Zyberk, The Transect is the foundation for the Smart Code permitting a diversity of uses, and accommodating and encouraging community diversity and density in appropriate locations. Forecasting all anticipated uses can be challenging for a municipality to attempt, so the Code may first be applied to small developments. Belmont, North Carolina, Hillsborough County and Dade Counties in Florida, and Nashville, Tennessee, have developed a Smart Code. No municipality in the Greater Philadelphia region has adopted a Smart Code based on the Transect theory. Design Guidelines Design Guidelines are another tool that a municipality can adopt to create a more livable community. They are particularly helpful when designing for density. Design guidelines apply an overall aesthetic framework for a community or a specific development. Design guidelines are the generally accepted tool for controlling appearance, though many municipalities in the region have design provisions in various sections of zoning and land development regulations. Most municipalities 62
69 have design controls regulating signs, landscaping, and buffering, though few municipalities regulate building design. Existing design controls tend to focus on the functional aspects of design, rather than aesthetics. They can be adopted for an existing built area, such as a downtown, or for a new development. They can be used for an entire community or a specific zoning district. They can be mandatory or voluntary, or strongly encouraged. In most communities, they are voluntary, and their purpose is to provide guidance to developers and designers when planning a development. Such guidelines should be studied and followed if a developer wants approval of a project, though exceptions can be made if the design meets the overall intent of the guidelines. Design guidelines can be very specific, discussing building design, such as cornices, window size, building materials, colors, facades, rooflines, horizontal and vertical massing, and storefront design. These specific guidelines are often found in historic districts, which are focused on maintaining the historic architectural character of a neighborhood or community. They can also extend to site design, including streetscape elements, landscape, sidewalk width, significant corners, gateways, pedestrian pathways between parking lots and buildings, lighting, and signage, among others. They can also extend to street design, including street widths, parking, bike lanes, sidewalks, signage, and striping. Design guidelines for new town centers are often quite specific and prescriptive, as these places are created from scratch. For existing communities adopting design guidelines, these often are less specific, but equally important to guide any redevelopment or infill development, or encourage renovation of buildings that do not meet the new guidelines. Major new mixed-use developments can also benefit from design guidelines. National models of design guidelines are available to municipalities to customize to local objectives and conditions. The most successful guidelines are developed through open, public participatory processes. Visioning techniques, such as visual preference surveys and computer imaging, can help the public better understand design choices. 63
70 Next Steps DVRPC will continue its efforts to encourage higher densities and good design, as supported by its long range planning efforts and related studies. The agency s Municipal Outreach and Education program will continue to offer training programs to local officials on such topics as curbing sprawl. DVRPC is also committed to publishing studies that highlight the importance of good design and the quality of the built environment. This extends to improving the design of the agency s reports, by including illustrations, photo simulations, and graphics to better communicate the agency s recommendations. More information on DVRPC s resources can be found at 64
71 Bibliography Alexander, Ernest R. Density Measures: A Review and Analysis. Journal of Architectural and Planning Research. 10:3 (Autumn) Anderson, G.; Elmer, F.; Hinshaw, M.; Stepner, M.; and Meck, S. Getting to Density. American Planning Association and Lincoln Institute of Land Planning Audioconference. November 6, Arendt, Randall. Crossroads, Hamlet, Village, Town: Design Characteristics of Traditional Neighborhoods, Old and New. American Planning Association. Planning Advisory Service Report Number 523/524. April Campoli, J.; MacLean, A. Visualizing Density: A Catalog Illustrating the Density of Residential Neighborhoods, Working Paper. Lincoln Institute of Land Policy. November Delaware Valley Regional Planning Commission. The New Regionalism: Building Livable Communities Across the Delaware Valley. July ECONorthwest. Metro Urban Centers: An Evaluation of the Density of Development. July Ewing, Reid. Is Los Angeles-Style Sprawl a Desirable Planning Goal? Journal of the American Planning Association. Vol. 63, No.1. Winter Fulton, W.; Pendall, R.; Nguyen, M.; Harrison, A. Who Sprawls Most? How Growth Patterns Differ Across the U.S. The Brookings Institution. July Fader, S. Density by Design: New Directions in Residential Development, Second Edition. Urban Land Institute Florida, Richard. Revenge of the Squelchers. The Next American City. Issue Gardner, Marilyn. Smaller Houses for Bigger Living. Christian Science Monitor. November Kelbaugh, Douglas. Density, the D-word. American Institute of Architects Conference on Density. Boston
72 Kessler, Kristina. The Next Icon? The Urban Land Institute. November/December Langdon, Philip. In Central Vancouver, Modernism and New Urbanism Mesh. New Urban News. Volume 8. Number 8. December Laplante, Martin. Too High a Density Can Also Promote Sprawl. Planetizen. February 9, Lewis, Roger K. Intelligent Growth and Design Helped the City of Roses To Blossom. The Washington Post. August 7, Lewis, Roger K. Is Density a Four-Letter Word? Smart Growth s Future Depends On Convincing People It s Not. The Washington Post. February 24, Lewis, Roger K. The Much Maligned Rowhouse Offers Several Advantages over a Detached Home. The Washington Post. April 19, Mallis, Ron. Redefining Density. New Urban News. Volume 8. Number 8. December McIlwain, John. Density Is a Seven-Letter Word. Urban Land Institute, Multifamily Trends. Fall Moore, Martha T. Cool climates, hot suburbs, mixed blessings. USA Today. November 11, National Association of Home Builders. Affordable Land Development Volume One National Association of Home Builders. Housing Facts, Figures and Trends, New Jersey Office of State Planning. Designing New Jersey. June Pawlukiewicz, Michael and Myerson, Deborah L. Urban Land Institute. ULI/NHMC/AIA Joint Forum on Housing Density. February 7, Pennsylvania Environmental Council, 10,000 Friends of Pennsylvania, Inc., Zimmerman/Volk Associates, Inc. Market Position Analysis of the Residential Market Potential for Compact and Sustainable Development on Five Representative Sites in Southeastern Pennsylvania. February
73 Price-Robinson, Kathy. Multifamily s New Look. Urban Land Institute, Multifamily Trends. Fall Pushkarev, Boris and Zupan, Jeffrey. "Where Transit Works: Urban Densities for Public Transportation. Urban Transportation: Perspectives and Prospects. Eno Foundation Schmitz, Adrienne, et al. The New Shape of Suburbia: Trends in Residential Development. Urban Land Institute Talen, Emily. Traditional Urbanism Meets Residential Affluence. Journal of the American Planning Association. 67:2 (Spring) Trans21. The Good City. Planner s Guide to Automated People Movers 2002/2003. Transportation Systems for the Twenty-First Century. Witten, G. Ronald. Shifting Growth Patterns: Will Tomorrow s Demographics Change the Apartment Business? Multifamily Trends Archives of the Urban Land Institute. Fall
74 68
75 Acknowledgements DVRPC Staff: Karin Morris, AICP, Senior Regional Planner, Project Manager Richard G. Bickel, AICP, Deputy Director, Regional Planning Kevin Denton, Regional Planner Rebecca Maule, Graphics Douglas Giuliano, Graduate Student Intern Illustrations and site plans by Brown and Keener Urban Design. Photographs by DVRPC. 69
76 70
77 Appendix: Density in the DVRPC Region By County and Municipality for Year 2000 Population Density, Gross and Net Housing Unit Density Sources: Year 2000 Census, Year 2000 DVRPC Land Use Files Population Density Gross Housing Unit Density (Persons Per Square Mile) (HU/Acre) Net Housing Unit Density (HU/Res. Acre) Bucks County Bedminster township Bensalem township 2, Bridgeton township Bristol borough 5, Bristol township 3, Buckingham township Chalfont borough 2, Doylestown borough 3, Doylestown township 1, Dublin borough 3, Durham township East Rockhill township Falls township 1, Haycock township Hilltown township Hulmeville borough 2, Ivyland borough 1, Langhorne borough 4, Langhorne Manor borough 1, Lower Makefield township 1, Lower Southampton township 2, Middletown township 2, Milford township Morrisville borough 4, New Britain borough 2, New Britain township New Hope borough 1, Newtown borough 4, Newtown township 1, Nockamixon township Northampton township 1, Penndel borough 5, Perkasie borough 3,
78 Gross Housing Unit Density Net Housing Unit Density Population Density Plumstead township Quakertown borough 4, Richland township Richlandtown borough 4, Riegelsville borough Sellersville borough 3, Silverdale borough 2, Solebury township Springfield township Telford borough 8, Tinicum township Trumbauersville borough 2, Tullytown borough Upper Makefield township Upper Southampton township 2, Warminster township 3, Warrington township 1, Warwick township 1, West Rockhill township Wrightstown township Yardley borough 2, OVERALL BUCKS COUNTY BUCKS CO. AVG. OF ALL MUNIC. 2, Chester County Atglen borough 1, Avondale borough 2, Birmingham township Caln township 1, Charlestown township Coatesville city 5, Downingtown borough 3, East Bradford township East Brandywine township East Caln township East Coventry township East Fallowfield township East Goshen township 1, East Marlborough township East Nantmeal township East Nottingham township East Pikeland township Easttown township 1, East Vincent township East Whiteland township
79 Gross Housing Unit Density Net Housing Unit Density Population Density Elk township Elverson borough Franklin township Highland township Honey Brook borough 2, Honey Brook township Kennett township Kennett Square borough 4, London Britain township Londonderry township London Grove township Lower Oxford township Malvern borough 2, Modena borough 1, New Garden township Newlin township New London township North Coventry township Oxford borough 2, Parkesburg borough 2, Penn township Pennsbury township Phoenixville borough 4, Pocopson township Sadsbury township Schuylkill township South Coatesville borough South Coventry township Spring City borough 4, Thornbury township Tredyffrin township 1, Upper Oxford township Upper Uwchlan township Uwchlan township 1, Valley township Wallace township Warwick township West Bradford township West Brandywine township West Caln township West Chester borough 9, West Fallowfield township West Goshen township 1, West Grove borough 4,
80 Gross Housing Unit Density Net Housing Unit Density Population Density West Marlborough township West Nantmeal township West Nottingham township West Pikeland township West Sadsbury township Westtown township 1, West Vincent township West Whiteland township 1, Willistown township OVERALL CHESTER COUNTY CHESTER CO. AVG. OF ALL MUNIC. 1, Delaware County Aldan borough 7, Aston township 2, Bethel township 1, Chadds Ford township Brookhaven borough 4, Chester city 6, Chester township 3, Chester Heights borough 1, Clifton Heights borough 10, Collingdale borough 9, Colwyn borough 9, Concord township Darby borough 12, Darby township 6, East Lansdowne borough 13, Eddystone borough 1, Edgmont township Folcroft borough 5, Glenolden borough 7, Haverford township 4, Lansdowne borough 9, Lower Chichester township 3, Marcus Hook borough 1, Marple township 2, Media borough 7, Middletown township 1, Millbourne borough 13, Morton borough 7,
81 Gross Housing Unit Density Net Housing Unit Density Population Density Nether Providence township 2, Newtown township 1, Norwood borough 7, Parkside borough 11, Prospect Park borough 8, Radnor township 2, Ridley township 5, Ridley Park borough 6, Rose Valley borough 1, Rutledge borough 5, Sharon Hill borough 7, Springfield township 3, Swarthmore borough 4, Thornbury township Tinicum township Trainer borough 1, Upland borough 4, Upper Chichester township 2, Upper Darby township 10, Upper Providence township 1, Yeadon borough 7, OVERALL DELAWARE COUNTY 2, DELAWARE CO. AVG. OF ALL MUNIC. 5, Montgomery County Abington township 3, Ambler borough 7, Bridgeport borough 6, Bryn Athyn borough Cheltenham township 4, Collegeville borough 4, Conshohocken borough 7, Douglass township East Greenville borough 6, East Norriton township 2, Franconia township Green Lane borough 1, Hatboro borough 5, Hatfield borough 4, Hatfield township 1, Horsham township 1, Jenkintown borough 7,
82 Gross Housing Unit Density Net Housing Unit Density Population Density Lansdale borough 5, Limerick township Lower Frederick township Lower Gwynedd township 1, Lower Merion township 2, Lower Moreland township 1, Lower Pottsgrove township 1, Lower Providence township 1, Lower Salford township Marlborough township Montgomery township 2, Narberth borough 9, New Hanover township Norristown borough 8, North Wales borough 5, Pennsburg borough 3, Perkiomen township 1, Plymouth township 1, Pottstown borough 4, Red Hill borough 3, Rockledge borough 7, Royersford borough 5, Salford township Schwenksville borough 4, Skippack township Souderton borough 5, Springfield township 2, Telford borough (part) * 4, Towamencin township 1, Trappe borough 1, Upper Dublin township 1, Upper Frederick township Upper Gwynedd township 1, Upper Hanover township Upper Merion township 1, Upper Moreland township 3, Upper Pottsgrove township Upper Providence township Upper Salford township West Conshohocken borough 1, West Norriton township 2, West Pottsgrove township 1, Whitemarsh township 1,
83 Gross Housing Unit Density Net Housing Unit Density Population Density Whitpain township 1, Worcester township OVERALL MONTGOMERY COUNTY 1, MONTGOMERY CO. AVG. OF ALL MUNIC. 2, Philadelphia City/County Center City 23, South Philadelphia 9, Southwest Philadelphia 6, West Philadelphia 14, Lower North Philadelphia 14, Upper North Philadelphia 15, Bridesburg Kensington Richmond 10, Roxborough Manayunk 6, Germantown Chestnut Hill 7, Olney Oak Lane 19, Near Northeast Philadelphia 12, Far Northeast Philadelphia 5, OVERALL PHILA COUNTY 10, PHILA CO. AVG. OF ALL AREAS 12, Burlington County Bass River township Beverly city 3, Bordentown city 4, Bordentown township Burlington city 2, Burlington township 1, Chesterfield township Cinnaminson township 1, Delanco township Delran township 2, Eastampton township 1, Edgewater Park township 2, Evesham township 1, Fieldsboro borough 1, Florence township 1, Hainesport township Lumberton township Mansfield township Maple Shade township 4,
84 Gross Housing Unit Density Net Housing Unit Density Population Density Medford township Medford Lakes borough 3, Moorestown township 1, Mount Holly township 3, Mount Laurel township 1, New Hanover township North Hanover township Palmyra borough 2, Pemberton borough 7, Pemberton township Riverside township 4, Riverton borough 2, Shamong township Southampton township Springfield township Tabernacle township Washington township Westampton township Willingboro township 4, Woodland township Wrightstown borough OVERALL BURLINGTON COUNTY BURLINGTON CO. AVG. OF ALL MUNIC. 1, Camden County Audubon borough 6, Audubon Park borough 6, Barrington borough 4, Bellmawr borough 3, Berlin borough 1, Berlin township 1, Brooklawn borough 4, Camden city 7, Cherry Hill township 2, Chesilhurst borough Clementon borough 2, Collingswood borough 7, Gibbsboro borough 1, Gloucester township 2, Gloucester City city 4, Haddon township 5, Haddonfield borough 4, Haddon Heights borough 4,
85 Gross Housing Unit Density Net Housing Unit Density Population Density Hi-Nella borough 4, Laurel Springs borough 4, Lawnside borough 1, Lindenwold borough 4, Magnolia borough 4, Merchantville borough 6, Mount Ephraim borough 4, Oaklyn borough 6, Pennsauken township 2, Pine Hill borough 2, Pine Valley borough Runnemede borough 3, Somerdale borough 3, Stratford borough 4, Tavistock borough Voorhees township 2, Waterford township Winslow township Woodlynne borough 12, OVERALL CAMDEN COUNTY 2, CAMDEN CO. AVG. OF ALL MUNIC. 3, Gloucester County Clayton borough Deptford township 1, East Greenwich township Elk township Franklin township Glassboro borough 2, Greenwich township Harrison township Logan township Mantua township Monroe township National Park borough 2, Newfield borough Paulsboro borough 2, Pitman borough 4, South Harrison township Swedesboro borough 2, Washington township 2, Wenonah borough 2, West Deptford township 1,
86 Gross Housing Unit Density Net Housing Unit Density Population Density Westville borough 3, Woodbury city 4, Woodbury Heights borough 2, Woolwich township OVERALL GLOUCESTER COUNTY GLOUCESTER CO. AVG. OF ALL MUNIC. 1, Mercer County East Windsor township 1, Ewing township 2, Hamilton township 2, Hightstown borough 4, Hopewell borough 2, Hopewell township Lawrence township 1, Pennington borough 2, Princeton borough 7, Princeton township Trenton city 10, Washington township West Windsor township OVERALL MERCER COUNTY 1, MERCER CO. AVG. OF ALL MUNIC. 2, * Housing unit density figures for specific Philadelphia neighborhoods was unavailable. 80
87
88
89 Realizing Density: Strategies for Compact Suburban Development Publication No.: Date Published: December 2004 Geographic Area Covered: Nine-county Delaware Valley region with discussion of individual counties and municipalities. Key Words: population density, housing unit density, dwelling units per acre, gross density, net density, floor area ratio, cluster zoning, lot averaging, design, neighborhood types, building types, streets, parking, streetscape, form-based codes, Smart Code, the Transect, design guidelines ABSTRACT: As a means to help implement policies advocated in the DVRPC long-range land use and transportation plan, this study takes a critical look at what is meant by residential density, including what low, medium, and high densities mean to different suburbs in Pennsylvania and New Jersey. How is density measured and how is it perceived? Why is there frequently a negative perception of density? What has been the rationale for low-density development? What are the benefits and impacts of higher density? How has the region grown over the last ten years and what density trends are apparent? Beyond defining and measuring density in the region, the study also looks at the market for higher densities in the Delaware Valley region, as well as nationally. What demographic groups do higher density developments appeal to? Lastly, the study addresses the critical importance of good design as it relates to density, and recommends policies and guidelines that achieve better community design. Delaware Valley Regional Planning Commission The Bourse Building 8 th Floor 111 South Independence Mall East Philadelphia PA Phone: Fax: Internet: Staff Contact: Karin Morris, AICP, Sr. Regional Planner Direct Phone: kmorris@dvrpc.org

90 The Bourse Building 111 South Independence Mall East Philadelphia, PA
2014 Plan of Conservation and Development. Development Plan & Policies
 The Town of Hebron Section 3 2014 Plan of Conservation and Development Development Plan & Policies C. Residential Districts I. Residential Land Analysis This section of the plan uses the land use and vacant
Regional, County, and Municipal Population and Employment Forecasts,
 Regional, County, and Municipal Population and Employment s, No. 14 August 2007 The Delaware Valley Regional Planning Commission (DVRPC) is an interstate, intercounty and intercity agency serving the Philadelphia-Camden-Trenton
3,324,183 3,396,955 3,900,829 4,609,289 5,128,226 5,024,422 5,182,705 5,387,407
 in The Delaware Valley, - No. 82 April 2006 The Delaware Valley Regional Planning Commission is an interstate, intercounty and intercity agency that provides comprehensive and coordinated planning for
Appendix D HOUSING WORK GROUP REPORT JULY 10, 2002
 Appendix D HOUSING WORK GROUP REPORT JULY 10, 2002 Work Group Assignment At the 20/20 forum in April 2001, the community expressed a need for housing policies which will protect both the Town s social
BUILD-OUT ANALYSIS GRANTHAM, NEW HAMPSHIRE
 BUILD-OUT ANALYSIS GRANTHAM, NEW HAMPSHIRE A Determination of the Maximum Amount of Future Residential Development Possible Under Current Land Use Regulations Prepared for the Town of Grantham by Upper
8Land Use. The Land Use Plan consists of the following elements:
 8Land Use 1. Introduction The Land Use Plan consists of the following elements: 1. Introduction 2. Existing Conditions 3. Opportunities for Redevelopment 4. Land Use Projections 5. Future Land Use Policies
Land Use. Land Use Categories. Chart 5.1. Nepeuskun Existing Land Use Inventory. Overview
 Land Use State Comprehensive Planning Requirements for this Chapter A compilation of objectives, policies, goals, maps and programs to guide the future development and redevelopment of public and private
Gold Beach Buildable Lands Analysis
 Gold Beach Buildable Lands Analysis Final Report Submitted to: City of Gold Beach Prepared by: Community Planning Workshop Community Service Center 1209 University of Oregon Eugene, OR 97403-1209 http://darkwing.uoregon.edu/~cpw
Existing Land Use. Typical densities for single-family detached residential development in Cumberland County: 1
 Existing Land Use A description of existing land use in Cumberland County is fundamental to understanding the character of the County and its development related issues. Economic factors, development trends,
Place Type Descriptions Vision 2037 Comprehensive Plan
 Place Type Descriptions Vision 2037 Comprehensive Plan The Vision 2037 Comprehensive Plan establishes a range of place types for Oxford, ranging from low intensity (limited development) Rural and Natural
Chapter 5: Testing the Vision. Where is residential growth most likely to occur in the District? Chapter 5: Testing the Vision
 Chapter 5: Testing the Vision The East Anchorage Vision, and the subsequent strategies and actions set forth by the Plan are not merely conceptual. They are based on critical analyses that considered how
Residential Capacity Estimate
 Residential Capacity Estimate Montgomery County Department of Park & Planning Research & Technology Center January 2005 Current plans allow 75,000 more housing units. by Matthew Greene, Research Planner
Dense housing and urban sustainable development
 The Sustainable City VI 443 Dense housing and urban sustainable development B. Su School of Architecture, Unitec Institute of Technology, New Zealand Abstract There are close relationships between urban
To achieve growth, property development, redevelopment and an improved tax base in the cities and boroughs in the Lehigh Valley.
 Most growth in property valuation is in townships. Between 1991 and 2004, the assessed valuation of the townships in the Lehigh Valley increased by more than $2.8 billion, an increase of 41%. At the same
Missing Middle Housing Types Showcasing examples in Springfield, Oregon
 Missing Middle Housing Types Showcasing examples in Springfield, Oregon MissingMiddleHousing.com is powered by Opticos Design Illustration 2015 Opticos Design, Inc. Missing Middle Housing Study Prepared
LAND USE ASSUMPTIONS REPORT POTENTIAL FUTURE DEVELOPMENT WEST WHITELAND TOWNSHIP, CHESTER COUNTY, PA
 LAND USE ASSUMPTIONS REPORT POTENTIAL FUTURE DEVELOPMENT WEST WHITELAND TOWNSHIP, CHESTER COUNTY, PA Adopted June 17, 2015 by Township Resolution No. 2015-30 Prepared by Theurkauf Design & Planning, LLC
Addressing the Impact of Housing for Virginia s Economy
 Addressing the Impact of Housing for Virginia s Economy A REPORT FOR VIRGINIA S HOUSING POLICY ADVISORY COUNCIL NOVEMBER 2017 Appendix Report 2: Housing the Commonwealth's Future Workforce 2014-2024 Jeannette
Land Use Survey Summer 2014
 Land Use Survey Summer 2014 North Ogden City, Utah Robert Scott, City Planner Travis Lund, Planning Intern Contents General Information... 1 Land Use Groups... 1 Urbanized Land Uses... 1 Residential...
410 Land Use Trends Comprehensive Plan Section 410
 411 410 Comprehensive Plan Section 410 In order to plan future land use, we must know how the land is used today. This section includes the following: Definition of analyzed land-use categories Summary
RESEARCH BRIEF. Jul. 20, 2012 Volume 1, Issue 12
 RESEARCH BRIEF Jul. 2, 212 Volume 1, Issue 12 Do Agricultural Land Preservation Programs Reduce Overall Farmland Loss? When purchase of development rights () programs are in place to prevent farmland from
Compact Housing Sustaining Communities and the Environment
 Compact Housing Sustaining Communities and the Environment 1 Compact Housing Models 1. Compact Single Family Detached 7 21 units per acre 2. Single Family with Secondary Unit 17-24 units per acre 3. Multiple
During the time devoted to this course, we will talk about the following matters.
 Exhibit A Course Outline During the time devoted to this course, we will talk about the following matters. To get started, we will address some background matters. We will: Present a short history of joint
2016 Census Bulletin Changing Composition of the Housing Stock
 Metro Vancouver s Role Every five years, the Census of Canada provides benchmark data that is instrumental in analyzing and evaluating local government planning policies and services. Representing member
Analysis of Infill Development Potential Under the Green Line TOD Ordinance
 Analysis of Infill Development Potential Under the Green Line TOD Ordinance Prepared for the Los Angeles County Second Supervisorial District Office and the Department of Regional Planning Solimar Research
2014 Plan of Conservation and Development
 The Town of Hebron Section 1 2014 Plan of Conservation and Development Community Profile Introduction (Final: 8/29/13) The Community Profile section of the Plan of Conservation and Development is intended
CHAPTER 7 HOUSING. Housing May
 CHAPTER 7 HOUSING Housing has been identified as an important or very important topic to be discussed within the master plan by 74% of the survey respondents in Shelburne and 65% of the respondents in
Old Neighborhoods and Housing Provide New Models for the Future.
 Old Neighborhoods and Housing Provide New Models for the Future. 2. Lack of Positive Models - Most people and many professional planners and public officials are simply unaware of models like these small
County Survey. results of the public officials survey in the narrative. Henry County Comprehensive Plan,
 Introduction During the planning process, a variety of survey tools where used to ensure the Henry County Comprehensive Plan was drafted in the best interests of county residents and businesses. The surveys
Nonresidential construction activity in the Twin Cities region was robust in 2013
 1 Recent Nonresidential Construction Activity in the Twin Cities Region March 2015 Key Findings After bottoming out in 2010, nonresidential construction activity in the Twin Cities region is once again
Bylaw No , being "Official Community Plan Bylaw, 2016" Schedule "A" DRAFT
 Bylaw No. 2600-2016, being "Official Community Plan Bylaw, 2016" Schedule "A" Urban Structure + Growth Plan Urban Structure Land use and growth management are among the most powerful policy tools at the
Provide a diversity of housing types, responsive to household size, income and age needs.
 8 The City of San Mateo is a highly desirable place to live. Housing costs are comparably high. For these reasons, there is a strong and growing need for affordable housing. This chapter addresses the
2005 COTTAGE GROVE BUILDABLE LANDS ANALYSIS UPDATE
 2005 COTTAGE GROVE BUILDABLE LANDS ANALYSIS UPDATE Adopted June 13, 2005 Prepared by Satre Associates, P.C. Planners, Landscape Architects and Environmental Specialists 132 East Broadway, Suite 536 Eugene,
Challenging Trends Facing Housing in La Crosse
 Challenging Trends Facing Housing in La Crosse September 2010 (Revised) Karl Green, Associate Professor Department of Community Development, La Crosse County UW-Extension Introduction: The intent of this
RESEARCH BRIEF. Oct. 31, 2012 Volume 2, Issue 3
 RESEARCH BRIEF Oct. 31, 2012 Volume 2, Issue 3 PDR programs affect landowners conversion decision in Maryland PDR programs pay farmers to give up their right to convert their farmland to residential and
Urban Land Use. Unit 4 GEO22F PB
 Urban Land Use Unit 4 GEO22F PB Important Concepts Land Value Land in Canada is either privately owned by individuals or organizations, or it belongs to the government (crown land). The value of land is
2014 Charleston Tri-County Region
 2014 Tri-County Region OUR REGION + DENSITY + COST + TRANSPORTATION + CONSTRUCTION Produced for the community by: Trident Association of REALTORS South Carolina Community Loan Fund Research and analysis
Article Optional Method Requirements
 Article 59-6. Optional Method Requirements [DIV. 6.1. MPDU DEVELOPMENT IN RURAL RESIDENTIAL AND RESIDENTIAL ZONES Sec. 6.1.1. General Requirements... 6 2 Sec. 6.1.2. General Site and Building Type Mix...
Whither the Wilderness County?
 Whither the Wilderness County Lane Kendig Kendig Keast Collaborative Scott Clark Director, Kootenai County Community Development Wilderness City Wilderness City is an oxymoron. Urban City cannot be a wilderness.
White Oak Science Gateway Master Plan Staff Draft AFFORDABLE HOUSING ANALYSIS. March 8, 2013
 White Oak Science Gateway Master Plan Staff Draft AFFORDABLE HOUSING ANALYSIS March 8, 2013 Executive Summary The Draft White Oak Science Gateway (WOSG) Master Plan encourages development of higher density,
NATIONAL ASSOCIATION OF REALTORS. National Center for Real Estate Research
 NATIONAL ASSOCIATION OF REALTORS National Center for Real Estate Research COMMUNITY ACCEPTANCE OF AFFORDABLE HOUSING C. Theodore Koebel Robert E. Lang Karen A. Danielsen Center for Housing Research and
CHAPTER 2 VACANT AND REDEVELOPABLE LAND INVENTORY
 CHAPTER 2 VACANT AND REDEVELOPABLE LAND INVENTORY CHAPTER 2: VACANT AND REDEVELOPABLE LAND INVENTORY INTRODUCTION One of the initial tasks of the Regional Land Use Study was to evaluate whether there is
Chapter 4: Housing and Neighborhoods
 Chapter 4: Housing and Neighborhoods Introduction Medina is a growing community that provides a variety of housing types and neighborhood styles while protecting and enhancing the City s open spaces and
LAND USE. Doubling Land Use Survey Montgomery County, Pennsylvania. Montgomery County Data: Major Growth Trends between
 Montgomery County Data: LAND USE 2015 Land Use Survey Montgomery County, Pennsylvania Doubling of area of all residential categories combined between 1970 and 2015. Every five years the Montgomery County
Housing Prices Under Supply Constraints. Markets behave in certain reliable ways. When the supply of a
 Housing Prices Under Supply Constraints Markets behave in certain reliable ways. When the supply of a good increases, we can expect the price to fall. For example, when a new technology like fracking increases
PORTLAND PLAN. Household and Employment Forecasts and Development Capacity
 PORTLAND PLAN Household and Employment Forecasts and Development Capacity Managing Change In recent decades, the Portland Metropolitan region and the City of Portland experienced a steady increase in population.
Generic Environmental Impact Statement. Build-Out Analysis. City of Buffalo, New York. Prepared by:
 Generic Environmental Impact Statement Build-Out Analysis City of Buffalo, New York 2015 Prepared by: TABLE OF CONTENTS 1.0 INTRODUCTION 1 2.0 METHODOLOGY 2 3.0 EXISTING LAND USE 3 4.0 EXISTING ZONING
PLANNING AND IMPLEMENTING TOD: KEY FACTORS FOR SUCCESS. Sujata Srivastava Knowledge Corridor TOD Workshop June 5, 2013
 PLANNING AND IMPLEMENTING TOD: KEY FACTORS FOR SUCCESS Sujata Srivastava Knowledge Corridor TOD Workshop June 5, 2013 6-year old partnership dedicated to improving practice through technical assistance,
The New California Dream How Demographic and Economic Trends May Shape the Housing Market
 Voices on the Future The New California Dream How Demographic and Economic Trends May Shape the Housing Market A Land Use Scenario for 2020 and 2035 ARTHUR C. NELSON Executive Summary The New California
III. Housing Profile and Analysis
 III. Housing Profile and Analysis 3-1 III. Housing Profile and Analysis A. Housing Types Information on the type of housing available is important to have a clear picture of what Lacey has in its housing
UNDERSTANDING THE TAX BASE CONSEQUENCES OF LOCAL ECONOMIC DEVELOPMENT PROGRAMS
 UNDERSTANDING THE TAX BASE CONSEQUENCES OF LOCAL ECONOMIC DEVELOPMENT PROGRAMS Richard K. Gsottschneider, CRE President RKG Associates, Inc. 277 Mast Rd. Durham, NH 03824 603-868-5513 It is generally accepted
MEMORANDUM Planning Commission Travis Parker, Planning Director DATE: April 4, 2018 Lakewood Zoning Amendments Housing and Mixed Use
 MEMORANDUM TO: FROM: Travis Parker, Planning Director DATE: April 4, 2018 SUBJECT: Lakewood Zoning Amendments Housing and Mixed Use In August 2017, the Lakewood Development Dialogue process began with
TRANSFER OF DEVELOPMENT RIGHTS IN THE PHILADELPHIA REGION HOPE OR HYPE?
 TRANSFER OF DEVELOPMENT RIGHTS IN THE PHILADELPHIA REGION HOPE OR HYPE? Dorothy Ives Dewey Department of Geography and Planning West Chester University West Chester, PA 19383 ABSTRACT: This paper is a
CHAPTER 4: MODERATE INCOME HOUSING ELEMENT
 The Utah Municipal Code, -9a-()(a)(iii) requires that all cities adopt a Plan for Moderate Income Housing as part of their General Plan. Section -9a-() of the Utah Municipal Code, outlines that this Plan
City of Lonsdale Section Table of Contents
 City of Lonsdale City of Lonsdale Section Table of Contents Page Introduction Demographic Data Overview Population Estimates and Trends Population Projections Population by Age Household Estimates and
An Executive Summary. Residential Market Potential
 T1 Residential Market Potential for New Traditional Neighborhoods, Neighborhood Centers, Town Centers, Urban Centers, and The Urban Core T2 October 2004 Conducted by Zimmerman/Volk Associates Inc. Clinton,
6. Review of Property Value Impacts at Rapid Transit Stations and Lines
 6. Review of Property Value Impacts at Rapid Transit Stations and Lines 6.0 Review of Property Value Impacts at Rapid Transit Station April 3, 2001 RICHMOND/AIRPORT VANCOUVER RAPID TRANSIT PROJECT Technical
4.0. Residential. 4.1 Context
 4. 0Residential 4.1 Context In 1986, around the time of Burnaby s last Official Community Plan, the City had a population of 145,000 living in 58,300 residential units. By 1996, there were 179,000 people
Comprehensive Plan /24/01
 IV The is a central component of the Comprehensive Plan. It is an extension of the general goals and policies of the community, as well as a reflection of previous development decisions and the physical
What does the Census of 2000 tell us about
 Inside Indiana s Counties: Township Population Changes, 1990 to 2000 Morton J. Marcus Executive Director, Indiana Business Research Center, Kelley School of Business, Indiana University Figure 2 Distribution
Housing Supply Restrictions Across the United States
 Housing Supply Restrictions Across the United States Relaxed building regulations can help labor flow and local economic growth. RAVEN E. SAKS LABOR MOBILITY IS the dominant mechanism through which local
Myth Busting: The Truth About Multifamily Renters
 Myth Busting: The Truth About Multifamily Renters Multifamily Economics and Market Research With more and more Millennials entering the workforce and forming households, as well as foreclosed homeowners
Town of. River Falls. Land Use Element Vierbicher Associates, Inc
 Town of River Falls 2005 Vierbicher Associates, Inc Contents Contents s. 66.1001(2)(h) Wis. Stats................................................. ii Introduction................................................................
Zoning Analysis. 2.0 Residential Use. 1.0 Introduction
 Zoning Analysis 1.0 Introduction For zoning to be an effective community development tool, it must recognize the unique land use characteristics of the various portions of the community. The Lawrence Zoning
RBC-Pembina Home Location Study. Understanding where Greater Toronto Area residents prefer to live
 RBC-Pembina Home Location Study Understanding where Greater Toronto Area residents prefer to live RBC-Pembina Home Location Study: Understanding where Greater Toronto Area residents prefer to live July
A. Land Use Relationships
 Chapter 9 Land Use Plan A. Land Use Relationships Development patterns in Colleyville have evolved from basic agricultural and residential land uses, predominate during the early stages of Colleyville
DRAFT. Amendment to the Master Plan Land Use Element for Block 5002, Lot Township of Teaneck, Bergen County, New Jersey.
 DRAFT Amendment to the Master Plan Land Use Element for Block 5002, Lot 18.01 Township of Teaneck, Bergen County, New Jersey Prepared for: Township of Teaneck Planning Board Prepared by: Janice Talley,
TOD and Equity. TOD Working Group. James Carras Carras Community Investment, Inc. August 7, 2015
 TOD and Equity TOD Working Group James Carras Carras Community Investment, Inc. August 7, 2015 What is Equitable TOD? Equity is fair and just inclusion. Equitable TOD is the precept that investments in
Business Item Community Development Committee Item:
 Business Item Community Development Committee Item: 2008-124 C Meeting date: July 21, 2008 ADVISORY INFORMATION Date: May 21, 2008 Subject: Flexible Residential Development Ordinance Guidelines District(s),
New affordable housing production hits record low in 2014
 1 Falling Further Behind: Housing Production in the Twin Cities Region December 2015 Key findings Only a small percentage of added housing units were affordable to households with low and moderate incomes.
DRAFT FOR DISCUSSION PURPOSES ONLY. Port Credit Local Area Plan Built Form Guidelines and Standards DRAFT For Discussion Purposes
 Port Credit Local Area Plan Built Form Guidelines and Standards DRAFT For Discussion Purposes 1 Local Area Plan - Project Alignment Overview Directions Report, October 2008 (General Summary Of Selected
To: Ogunquit Planning Board From: Lee Jay Feldman, Director of Planning Date: April 18, 2018 Re: Senior/Affordable Multi-Family Housing Assessment
 To: Ogunquit Planning Board From: Lee Jay Feldman, Director of Planning Date: April 18, 2018 Re: Senior/Affordable Multi-Family Housing Assessment I. Introduction The Planning Board held a workshop on
Annual (2013) Review of the Surrey Official Community Plan
 Review of the Surrey Official Community Plan") CORPORATE REPORT NO: R118 COUNCIL DATE: JUNE 23, 2014 REGULAR COUNCIL TO: Mayor & Council DATE: June 23, 2014 FROM: General Manager, Planning and Development FILE: 6440-01 SUBJECT: Annual (2013) Review
CORPORATE REPORT NO: R118 COUNCIL DATE: JUNE 23, 2014 REGULAR COUNCIL TO: Mayor & Council DATE: June 23, 2014 FROM: General Manager, Planning and Development FILE: 6440-01 SUBJECT: Annual (2013) Review
Reviewing Growth Management Planning for Housing
 Washington Research Council BRIEFLY Policy makers should avoid overly proscriptive regulation of the housing market, maximizing opportunities for residential and commercial development that is consistent
HOUSING & RESIDENTIAL AREAS
 CHAPTER 10: HOUSING & RESIDENTIAL AREAS OVERVIEW With almost 90% of Ridgefield zoned for residential uses, the patterns and form of residential development can greatly affect Ridgefield s character. This
LAKE MERRITT STATION AREA PLAN
 LAKE MERRITT STATION AREA PLAN Emerging Plan Open House Summary October 2011 2 1 Introduction The City of Oakland, Bay Area Rapid Transit (BART), and the Peralta Community College District, through a grant
INFILL DEVELOPMENT. Elective Course January 14, 2017 Derek Pomreinke Tammy Henry Nazim Virani
 INFILL DEVELOPMENT Elective Course January 14, 2017 Derek Pomreinke Tammy Henry Nazim Virani Agenda 9:05 What is infill? 9:20 How is it regulated? 9:45 How do developers view infill? Break 10:30 Applications
POPULATION FORECASTS
 POPULATION FORECASTS Between 2015 and 2045, the total population is projected to increase by 373,125 residents to reach 2.2 million. Some areas will see major increases, while other areas will see very
ADR 18 l April Regional, County, and Municipal Population Forecasts,
 ADR 18 l April 2012 Regional, County, and Municipal Population s, 0 The Delaware Valley Regional Planning Commission (DVRPC) is an interstate, inter-county, and intercity agency serving the Philadelphia-Camden-Trenton
From Policy to Reality
 From Policy to Reality Updated ^ Model Ordinances for Sustainable Development 2000 Environmental Quality Board 2008 Minnesota Pollution Control Agency Funded by a Minnesota Pollution Control Agency Sustainable
Rule 80. Preservation of Primary Agricultural Soils Revised and approved by the Land Use Panel during its public meeting on January 31, 2006.
 Rule 80. Preservation of Primary Agricultural Soils Revised and approved by the Land Use Panel during its public meeting on January 31, 2006. (A) Purpose. In accordance with 10 V.S.A. Sections 6025(b)
Table of Contents. Appendix...22
 Table Contents 1. Background 3 1.1 Purpose.3 1.2 Data Sources 3 1.3 Data Aggregation...4 1.4 Principles Methodology.. 5 2. Existing Population, Dwelling Units and Employment 6 2.1 Population.6 2.1.1 Distribution
Residential Intensification in Established Neighbourhoods Study (RIENS)
") Residential Intensification in Established Neighbourhoods Study (RIENS) EXECUTIVE SUMMARY In December 2015, the City of Kitchener retained Meridian Planning Consultants to undertake the Residential Intensification
Residential Intensification in Established Neighbourhoods Study (RIENS) EXECUTIVE SUMMARY In December 2015, the City of Kitchener retained Meridian Planning Consultants to undertake the Residential Intensification
Residential Neighborhoods and Housing
 Residential Neighborhoods and Housing 3 GOAL - To protect Greenwich as a predominantly residential community and provide for a variety of housing options The migration of businesses and jobs from New York
Key findings of the study include:
 C I T Y O F C A M B R I D G E Community Development Department IRAM FAROOQ Assistant City Manager for Community Development MEMORANDUM To: Richard Rossi, City Manager From: Iram Farooq, Assistant City
Village WASHINGTON TOWNSHIP MASTER PLAN SYNTHESIS. Page 197
 Village P l a n WASHINGTON TOWNSHIP MASTER PLAN SYNTHESIS Page 197 SECTION 11.0 MASTER PLAN SYNTHESIS INTRODUCTION The proposals presented in the various plans result in a graphic synthesis: The Land Use
REGIONAL. Rental Housing in San Joaquin County
 Lodi 12 EBERHARDT SCHOOL OF BUSINESS Business Forecasting Center in partnership with San Joaquin Council of Governments 99 26 5 205 Tracy 4 Lathrop Stockton 120 Manteca Ripon Escalon REGIONAL analyst april
Appendix A: Guide to Zoning Categories Prince George's County, Maryland
 Appendix A: Guide to Zoning Categories Prince George's County, Maryland RESIDENTIAL ZONES 1 Updated November 2010 R-O-S: Reserved Open Space - Provides for permanent maintenance of certain areas of land
PREPARED FOR: ADI DEVELOPMENT GROUP INC.
 Acronym Urban Design and Planning/Mark Sterling Consulting Inc. 111 Clendenan Avenue, Toronto, Ontario M6P 2W7 URBAN DESIGN BRIEF PROPOSED DEVELOPMENT 4880 VALERA ROAD, CITY OF BURLINGTON PREPARED FOR:
Housing for the Region s Future
 Housing for the Region s Future Executive Summary North Texas is growing, by millions over the next 40 years. Where will they live? What will tomorrow s neighborhoods look like? How will they function
Existing Conditions: Economic Market Assessment
 Existing Conditions: Economic Market Assessment Introduction The US 24/40 Corridor Study examined existing conditions as they related to economic and commercial market assessments, existing land use, and
H o u s i n g N e e d i n E a s t K i n g C o u n t y
 1999 2000 2001 2002 2003 2004 2005 2006 2007 2008 2009 2010 Number of Affordable Units H o u s i n g N e e d i n E a s t K i n g C o u n t y HOUSING AFFORDABILITY Cities planning under the state s Growth
PURCHASE OF DEVELOPMENT RIGHTS AND TRANSFER OF DEVELOPMENT RIGHTS CASE STUDIES
 PURCHASE OF DEVELOPMENT RIGHTS AND TRANSFER OF DEVELOPMENT RIGHTS CASE STUDIES Prepared for Boone County Planning Commission By American Farmland Trust May 4, 2001 Table of Contents Page Number Montgomery
TASK 2 INITIAL REVIEW AND ANALYSIS U.S. 301/GALL BOULEVARD CORRIDOR FORM-BASED CODE
 TASK 2 INITIAL REVIEW AND ANALYSIS U.S. 301/GALL BOULEVARD CORRIDOR FORM-BASED CODE INTRODUCTION Using the framework established by the U.S. 301/Gall Boulevard Corridor Regulating Plan (Regulating Plan),
Affordably- Priced Housing
 Affordably- Priced Housing Can the next generation afford to live in Chester County? Chester County Planning Commission This slide deck is an annotated version of one presented at the Chesco2020 Affordably-Priced
CHAPTER 8: HOUSING. Of these units, 2011 Census statistics indicate that 77% are owned and 23% are rental units.
 CHAPTER 8: HOUSING Port Moody has traditionally been a family oriented community. Based on the 2011 Census, 64% of all census families include children. Overall the number of dwelling units in Port Moody
CHAPTER 2: PEOPLE AND THEIR HOMES
 2 CHAPTER 2: PEOPLE AND THEIR HOMES 1kf guts prep.indd 14 3/2/06 1:13:07 PM DANE COUNTY IS DIVERSE The 426,000 people who live in Dane County 6 are in a word diverse. There are people of all ages and families
Glenmont Sector Plan Staff Draft AFFORDABLE HOUSING ANALYSIS
 Glenmont Sector Plan Staff Draft AFFORDABLE HOUSING ANALYSIS November 1, 2012 Center for Research and Information Systems Montgomery County Planning Department M NCPPC Executive Summary The Glenmont Sector
Farmland and Open Space Preservation Purchase of Development Rights Program Frequently Asked Questions
 Farmland and Open Space Preservation Purchase of Development Rights Program Frequently Asked Questions Why should a community consider farmland preservation programs? Farmland preservation is important
Multifamily Market Commentary September 2016
 Multifamily Market Commentary September 2016 Big Impact from Small Multifamily Properties Multifamily rental units can be found in high-rise structures or in garden-style buildings, but there are a number
Modern Tower Blocks and Apartment Neighbourhoods: Toronto s Urban Asset
 Modern Tower Blocks and Apartment Neighbourhoods: Toronto s Urban Asset Toronto s heritage of modern residential towers is an important built legacy which distinguishes Toronto from other cities. While