For a one-year renewal lease commencing on or after October 1, 2013 and on or before September 30, 2014: 4.0%
|
|
|
- Marylou Patterson
- 6 years ago
- Views:
Transcription
1 EXPLANATORY STATEMENT - APARTMENT ORDER #45 Explanatory Statement and Findings of the Rent Guidelines Board In Relation to Lease Increase Allowances for Apartments and Lofts under the Jurisdiction of the Rent Stabilization Law 1 Summary of Order No. 45 The Rent Guidelines Board (RGB) by Order No. 45 has set the following maximum rent increases for leases subject to renewal on or after October 1, 2013 and on or before September 30, 2014 for apartments under its jurisdiction: For a one-year renewal lease commencing on or after October 1, 2013 and on or before September 30, 2014: 4.0% For a two-year renewal lease commencing on or after October 1, 2013 and on or before September 30, 2014: 7.75% VACANCY ALLOWANCE The vacancy allowance is now determined by a formula set forth in the State Rent Regulation Reform Act of 1997 and in Chapter 97 of the Laws of 2011, not by the Orders of the Rent Guidelines Board. SUBLET ALLOWANCE The increase landlords are allowed to charge when a rent stabilized apartment is sublet by the primary tenant to another tenant on or after October 1, 2013 and on or before September 30, 2014 shall be 10%. ADJUSTMENTS FOR LOFTS For Loft units to which these guidelines are applicable in accordance with Article 7-C of the Multiple Dwelling Law, the Board established the following maximum rent increases for increase periods commencing on or after October 1, 2013 and on or before September 30, No vacancy allowance is included for lofts. 1 Year 2 Years 4.0% 7.75% The guidelines do not apply to hotel, rooming house, and single room occupancy units that are covered by separate Hotel Orders. Any increase for a renewal lease may be collected no more than once during the guideline period governed by Order No This Explanatory Statement explains the actions taken by the Board members on individual points and reflects the general views of those voting in the majority. It is not meant to summarize all the viewpoints expressed. 1
2 SPECIAL GUIDELINE Leases for units subject to rent control on September 30, 2013 that subsequently become vacant and then enter the stabilization system are not subject to the above adjustments. Such newly stabilized rents are subject to review by the State Division of Housing and Community Renewal (DHCR). In order to aid DHCR in this review the Rent Guidelines Board has set a special guideline of whichever is greater: 1. 30% above the maximum base rent, or 2. The Fair Market Rent for existing housing as established by the United States Department of Housing and Urban Development (HUD) for the New York City Primary Metropolitan Statistical Area pursuant to Section 8(c) (1) of the United States Housing Act of 1937 (42 U.S.C. section 1437f [c] [1]) and 24 C.F.R. Part 888, with such Fair Market Rents to be adjusted based upon whether the tenant pays his or her own gas and/or electric charges as part of his or her rent as such gas and/or electric charges are accounted for by the New York City Housing Authority. Such HUD-determined Fair Market Rents will be published in the Federal Register, to take effect on October 1, All rent adjustments lawfully implemented and maintained under previous apartment Orders and included in the base rent in effect on September 30, 2013 shall continue to be included in the base rent for the purpose of computing subsequent rents adjusted pursuant to this Order. BACKGROUND OF ORDER NO. 45 The Rent Guidelines Board is mandated by the Rent Stabilization Law of 1969 (Section (b) of the NYC Administrative Code) to establish annual guidelines for rent adjustments for housing accommodations subject to that law and to the Emergency Tenant Protection Act of In order to establish guidelines the Board must consider, among other things: (1) the economic condition of the residential real estate industry in the affected area including such factors as the prevailing and projected (i) real estate taxes and sewer and water rates, (ii) gross operating and maintenance costs (including insurance rates, governmental fees, cost of fuel and labor costs), (iii) costs and availability of financing (including effective rates of interest), (iv) overall supply of housing accommodations and overall vacancy rates; (2) relevant data from the current and projected cost of living indices for the affected area; (3) such other data as may be made available to it. The Board gathered information on the above topics by means of public meetings and hearings, written submissions by the public, and written reports and memoranda prepared by the Board's staff. The Board calculates rent increase allowances on the basis of cost increases experienced in the past year, its forecasts of cost increases over the next year, its determination of the relevant operating and maintenance cost-to-rent ratio, and other relevant information concerning the state of the residential real estate industry. 2
3 Material Considered by the Board Order No. 45 was issued by the Board following seven public meetings, one public hearing, its review of written submissions provided by the public, and a review of research and memoranda prepared by the Board's staff. Approximately 109 written submissions were received at the Board's offices from many individuals and organizations including public officials, tenants and tenant groups, and owners and owner groups. The Board members were provided with copies of public comments received by the June 17, 2013 deadline. All of the above listed documents were available for public inspection. Open meetings of the Board were held following public notice on March 14, April 4, April 18, April 25, and May 30, On April 30, 2013, the Board adopted proposed rent guidelines for apartments, lofts, and hotels. A public hearing was held on June 13, 2013 pursuant to Section 1043 of the New York City Charter and Section (h) of the New York City Administrative Code. Testimony on the proposed rent adjustments for rent-stabilized apartments and lofts was heard from 10:00 a.m. to 7:50 p.m. The hearing ended when all those who were in attendance who wished to testify did so and there were no additional speakers. Testimony from members of the public speaking at these hearings was added to the public record. The Board heard testimony from approximately 47 apartment tenants and tenant representatives, 24 apartment owners and owner representatives, and 5 public officials. In addition, 6 speakers read into the record written testimony from various public officials. On June 20, 2013 the guidelines set forth in Order No. 45 were adopted. A written transcription and/or audio recording was made of all proceedings. PRESENTATIONS BY RGB STAFF AND HOUSING EXPERTS INVITED BY MEMBERS OF THE BOARD Each year the staff of the New York City Rent Guidelines Board is asked to prepare numerous reports containing various facts and figures relating to conditions within the residential real estate industry. The Board's analysis is supplemented by testimony from industry and tenant representatives, housing experts, and by various articles and reports gathered from professional publications. Listed below are the other experts invited and the dates of the public meetings at which their testimony was presented: Meeting Date / Name March 14, 2013: Affiliation Staff presentation, 2013 Mortgage Survey Report NYC Department of Housing Preservation and Development (HPD) testimony 1. Christopher Gonzalez Assistant Commissioner, Government Affairs and Research April 4, 2013: Staff presentation, 2013 Income and Affordability Study NYU Furman Center for Real Estate and Urban Policy Fact Brief Presentation Sandy s Effects on Housing in NYC 1. Max Weselcouch Data and Research Analyst 3
4 April 18, 2013: Staff presentations 2013 Price Index of Operating Costs 2013 Income and Expense Study April 25, 2013: Apartment Tenants group testimony: 1. Barika Williams Association for Neighborhood and Housing Development 2. Greg Jost University Neighborhood Housing Program 3. Tomas J. Waters Community Service Society 4. Bobbie Sackman Council of Senior Centers and Services of NYC Apartment Owners group testimony: 1. Jack Freund Rent Stabilization Association (RSA) 2. Patrick Siconolfi Community Housing Improvement Program (CHIP) 3. Jimmy Silber Small Property Owners of New York (SPONY) Hotel Tenants group testimony: 1. Larry Wood Goddard Riverside Community Center 2. Daniel L. Parcerisas Goddard Riverside SRO Law Project 3. Brian Sullivan SRO Law Project at MFY Legal Services, Inc. May 30, 2013: Staff presentations 2013 Housing Supply Report Changes to the Rent Stabilized Housing Stock in New York City in 2012 NYS Division of Housing and Community Renewal (DHCR) testimony 1. Woody Pascal Deputy Commissioner for Rent Administration 2. Guy Alba Assistant Commissioner for Research and Analysis 3. Michael Rosenblatt Assistant Commissioner for Rent Administration 4. Michael Berrios Executive Assistant to the Deputy Commissioner SELECTED EXCERPTS FROM ORAL AND WRITTEN TESTIMONY FROM TENANTS AND TENANT GROUPS 2 Comments from tenants and tenant groups included: I have worked for Con Edison for over twenty years. I live in Stuyvesant Town in a rent stabilized apartment. I need to live nearby because I work long, unpredictable shifts, ensuring that I am providing reliable services. This is common practice among many long-term renters with similar occupations (e.g., FDNY, NYPD, etc.). As of now, my rent has grown to 50% of my salary. The next proposed range of increases, to 9.5%, threatens to evict countless middle class renters. Am I to understand that the City of New York is about to grant landlords yet another rent increase? I have not had a salary increase in over seven years. Landlords also have inflation and maintenance costs as well, but they have been given increases whereas working people like myself have not seen any relief at all. Over the last several years, the Rent Guidelines Board has dramatically overestimated operating costs; this overestimation is the direct cause of both higher rents for tenants and higher incomes for landlords. The overestimation of operating costs is evidenced by a growing discrepancy between the two primary methods used to determine operating cost changes: the Price Index of Operating Costs (PIOC) and Department of Finance (DOF) expense data; the PIOC, when compared to DOF data, is far less 2 Sources: Submissions by tenant groups and testimony by tenants. 4
5 accurate. Since 2005, the disparity between the PIOC and DOF data has grown dramatically. On average the PIOC grew 5.4% per year, while DOF data show an average increase in operating costs of only 3.8% per year. The PIOC has overestimated operating cost changes by more than a third each year. Rent stabilization exists in New York City for a reason to keep acceptable and comfortable affordable living for the city s people. Clearly, the system has a number of negative side-effects that inhibit the system s intended goal, most prominently: poor management, bad conditions and rent overcharges. I understand that landlords consider owning real estate property a business but they seem to forget that they are dealing with the lives of human beings and the way human beings live. My landlord owns several buildings, collects rents every month but does not invest any money to the properties they own. SELECTED EXCERPTS FROM ORAL AND WRITTEN TESTIMONY FROM OWNERS AND OWNER GROUPS 3 Comments from owners and owner groups included: This year, the RSA and other owner associations have called for the following rent adjustments: oneyear guideline of 7% or $70, whichever is greater; two-year guideline of 11% or $110 whichever is greater; a 10% sublet allowance; a special guideline for vacated rent controlled apartments of 100% of the MBR plus fuel cost adjustments or the HUD Fair Markets as adjusted for utility costs, whichever is greater. As a building manager I don t understand how we are supposed to provide a good quality of living for our tenants and upkeep maintenance on our properties if water bills continue to spiral wildly out of control like this. Many of us are struggling to maintain the property we have. Real estate assessment rises automatically, recession or no recession, oil prices peak and rise without a limit (tripling cost during the past two years), insurance and water and sewer costs rising with disregard to the real change in value of the building, court expenses rise, bringing expenses up by over 30% per year, and income rises by a meager unrepresentative amount of few percents rent is the only income of a building. Expenses are many and cumulative. Owners need a low rent supplement. Outside core Manhattan legal rents often fail to cover expenses. The biggest expense is payments to New York City at 40% of the budget. Apartments with the lowest rents can t cover this and other mandated expenses. What the RGB may not recognize is that essentially all expenses are mandated and few if any are discretionary. The economic condition of the housing industry is mischaracterized in the RGB Income and Expense Study. By relying on broad measures of net operating income (NOI) and characterizing average NOI in a typical rent stabilized building, these reports fail to capture the reality of a City that really has two housing markets. One market consists of high rent, luxury housing which is quite distinct from the majority of stabilized housing with relatively low rents providing workforce housing primarily in the City s outer boroughs. 3 Sources: Submissions by owner groups and testimony by owners 5
6 SELECTED EXCERPTS FROM ORAL AND WRITTEN TESTIMONY FROM PUBLIC OFFICIALS 4 Comments from public officials included: Compelling justification exists for opposing any rental increase as our City s rental tenants continue to face very tough economic times. New York City s unemployment rate remains at an unacceptable level of nearly 9 percent. This fact is made worse because of an unprecedented loss of rent-regulated apartments Since 1994, there has been a loss of more than 100,000 rent-regulated units in New York City. Given the continuing toll the recent economic recession has taken on average New Yorkers and the steady rent increases the RGB has annually approved, I am dismayed that the RGB is even considering rent increases of up to 6.25% for one year renewals and up to 9.5% for two year lease renewals for rent stabilized apartments. The statistics show that in 2010, the median income of households in rent stabilized units as a whole was only $37,000. Moreover, housing costs constitute a huge percentage of these tenants income. The RGB s own 2013 Income and Affordability Study found that one third of renter households in the City (33.6%) paid 50 percent or more of their household income for gross rent in 2011, the highest ratio in the history of the study. While renters should not be given a free pass, it s important to note the widening disparity between renters and owners needs. For the most recent data from , Net Operating Income for building owners Citywide increased by 5.6% over the previous data, attributing to the seventh consecutive yearly increase in a row. I want to caution the Board from authorizing a severe increase that could make this disparity even worse. If reasons of tenant affordability are not enough to persuade the Rent Guidelines Board to freeze rents this year, I urge the Board to also consider New York City s dwindling affordable housing supply. Since 1994, an estimated 105,242 units of rent stabilized housing have been deregulated in New York City, with some 2,539 units lost in 2012 and an estimated 6,096 units lost in 2011 Other affordable housing programs have exhibited similar losses. The smaller landlords who serve as the public face of [their] arguments represent only a tiny fraction of an industry that is, in actuality, dominated by wealthy landlords and faceless corporations who control the vast majority of properties. Year after year, we re seeing landlords profits skyrocketing even as their tenants are twisting themselves in knots, scrambling to pay all their bills. FINDINGS OF THE RENT GUIDELINES BOARD RENT GUIDELINES BOARD RESEARCH The Rent Guidelines Board based its determination on its consideration of the oral and written testimony noted above, as well as upon its consideration of statistical information prepared by the RGB staff set forth in these findings and the following reports: (1) 2013 Mortgage Survey Report, March 2013, (An evaluation of recent underwriting practices, financial availability and terms, and lending criteria); (2) 2013 Income and Expense Study, April 2013, (Based on income and expense data provided by the Finance Department, the Income and Expense Study measures rents, operating costs and net operating income in rent stabilized buildings); 4 Sources: Submissions by public officials. 6
7 (3) 2013 Income and Affordability Study, April 2013, (Includes employment trends, housing court actions, changes in eligibility requirements and public benefit levels in New York City); (4) 2013 Price Index of Operating Costs, April 2013, (Measures the price change for a market basket of goods and services which are used in the operation and maintenance of stabilized buildings); (5) 2013 Housing Supply Report, May 2013, (Includes new housing construction measured by certificates of occupancy in new buildings and units authorized by new building permits, tax abatement and exemption programs, and cooperative and condominium conversion and construction activities in New York City); and, (6) Changes to the Rent Stabilized Housing Stock in NYC in 2012, May 2013, (A report quantifying all the events that lead to additions to and subtractions from the rent stabilized housing stock). The six reports listed above may be found in their entirety on the RGB s website, nycrgb.org, and are also available at the RGB offices, 51 Chambers St., Suite 202, New York, NY upon request PRICE INDEX OF OPERATING COSTS FOR RENT STABILIZED APARTMENT HOUSES IN NEW YORK CITY The 2013 Price Index of Operating Costs for rent stabilized apartment houses in New York City found a 5.9% increase in costs for the period between March 2012 and March This year, the PIOC for all rent stabilized apartment buildings increased by 5.9%, 3.1 percentage points more than the PIOC percentage change from the year before (2.8% in 2012). Increases occurred in all nine of the PIOC components. The PIOC was driven upward by significant increases in Fuel Oil (20.0%), Insurance Costs (7.1%) and Utilities (6.3%). More moderate increases were seen in Contractor Services (3.3%), Labor Costs (3.0%), Taxes (2.6%) and Administrative Costs (2.4%). The Parts and Supplies and Replacement Costs components, each of which carry very little weight in the PIOC, increased 4.7% and 2.0% respectively. The growth in the Consumer Price Index (CPI) during this same time period was lower than the PIOC, rising 1.9%. The core PIOC, which excludes erratic changes in fuel oil, natural gas, and electricity costs, is useful for analyzing long-term inflationary trends. The core PIOC rose by 3.7% this year and was lower than the overall PIOC due to the exclusion of the costs for fuel oil, which rose 20.0%, and natural gas used for heating. 7
8 Table Percentage Changes in Components of the Price Index of Operating Costs for Rent Stabilized Apartment Houses in New York City 5 Item Expenditure Weights Percentage Weighted Percentage Taxes 29.63% 2.58% 0.76% Labor Costs 12.88% 2.96% 0.38% Fuel Oil 13.16% 20.00% 2.63% Utilities 16.34% 6.33% 1.03% Contractor Services 11.96% 3.27% 0.39% Administrative Costs 7.16% 2.41% 0.17% Insurance Costs 6.82% 7.11% 0.48% Parts & Supplies 1.44% 4.68% 0.07% Replacement Costs 0.61% 2.01% 0.01% All Items 100% % Source: 2013 Price Index of Operating Costs for Rent Stabilized Apartment Houses in New York City. Note: The symbol means change. On April 24, 2013 the staff of the Rent Guidelines Board released a memo to Board members with additional information concerning the 2013 Price Index of Operating Costs. Below is the memo in its entirety: 5 Totals may not add due to weighting and rounding. 8
9 Memorandum To: All Board Members From: Andrew McLaughlin Date: April 24, 2013 Re: 2013 PIOC Follow-up Memo At the April 18 meeting of the RGB, four questions regarding the 2013 Price Index of Operating Costs (PIOC) were asked for which immediate answers could not be provided. Detailed answers follow. Question 1: What is the breakdown of apartment buildings containing rent stabilized units that were built prior to 1947 (Pre-47) and those built in 1947 or later (Post-46)? In order to get a break down of the number of buildings built prior to 1947 and those built in 1947 or later, we used data supplied by the NYC Department of Finance that was used to calculate the Taxes component for the 2013 PIOC. This provided us with a building count and a unit count, both of which are contained in the table below. For a comparative view, we have also provided the number of Pre-47 and Post-46 rent stabilized units reported in the 2011 Housing and Vacancy Survey (HVS). Age of Buildings Buildings Containing Rent Stabilized Apartments 1 Total Number of Units Contained in These Buildings 2 Number of Rent Stabilized Units in the HVS Number Percentage Number Percentage Number Percentage Pre , % 751, % 743, % Post , % 363, % 243, % Total 36, % 1,115, % 986, % 1. There were 45 buildings used in the Tax component calculations where the year built was listed as Unknown. 2. The unit counts from the buildings registered with the NYC Department of Finance include both stabilized and unregulated units. Sources: NYC Department of Finance and the US Census Bureau, 2011 Housing and Vacancy Survey (HVS) Question 2: What was the sample size of buildings used to calculate the PIOC Tax component for the past 10 years? The sample of buildings used to compute the tax price relative (the ratio of current and prior year s prices or costs) for the PIOC is drawn by providing a list of rent stabilized properties registered with DHCR to the NYC Department of Finance. Finance then matches this list against its records to provide data on Page 1 9
10 assessed value, tax exemptions, and taxes. The sample size differs each year for two reasons. First, the DHCR list provided to the Department of Finance changes from year to year. Newly built buildings containing stabilized units are added each year and, similarly, buildings are subtracted if they no longer contain stabilized units. In addition, there are a number of inconsistent filers who may file one year and not the next. Second, the Department of Finance cannot always match the buildings registered with the DHCR to its tax data. If the borough, block and lot number (BBL) differs from list to list, a match cannot not be made. The inability to match the BBLs is often due to data entry error. Below is a table containing the sample sizes used to compute the PIOC tax relative for the passed ten years: Building Sample Sizes Used in Calculating the PIOC Tax Component, Year Sample Size , , , , , , , , , ,442 Source: NYC Rent Guidelines Board Price Indices of Operating Costs, Question 3: Can you provide the component weights for the five apartment indices outlined in Appendix 3 of the 2013 PIOC? The Price Index of Operating Costs (PIOC) measures the price change in a market basket of goods and services used in the operation and maintenance of rent stabilized apartment buildings in New York City. The relative importance, or weight, of the various goods and services in the market basket was determined by a survey that gathered information regarding the expenditure patterns of owners of rent stabilized apartment buildings. This survey concluded that expenditures varied by building age and by the heating system used in the building. As a result, in addition to the all-apartment PIOC, the 2013 PIOC report includes separate indices for buildings constructed before 1947 (pre-1947) and for buildings constructed in 1947 or later (post-1946) as well as gas-heated, oil-heated and master-metered buildings. Although the expenditure weights for all rent stabilized buildings and for each of the five subcategories of buildings differ, the price changes are the same for each of the six indices. The PIOC is made up of nine price/cost components. The amount of importance, or weight, for each of these components differs by building category. For instance, in the Oil Heated Index, which rose 7.3%, the Fuel Oil component accounts for 22.5% of this entire index. Since the Fuel Oil relative was 19.8% in the Oil Heated Index, this significant rise in the Fuel Oil component had a large impact in the overall rise in the Oil Heated Index (7.3%). In contrast, the Fuel Oil component makes up only 1.5% of the Gas Heated Index. Therefore, the 21.0% rise in fuel oil costs witnessed in the Gas Heated Index had little impact in the overall rise in this index of 4.3%. Page 2 10
11 The table below contains the price weights and relatives by building type for the five subcategories of apartment indices. Price Weights and Relatives by Building Type, Apartments, 2013 PIOC Components Master Metered Pre-1947 Post-1946 Gas Heated Oil Heated Bldgs. Weight Relative Weight Relative Weight Relative Weight Relative Weight Relative Taxes % % % % % Labor Costs % % % % % Fuel Oil % % % % % Utilities % % % % % Contractor Services Administrative Costs Insurance Costs Parts and Supplies Replacement Costs % % % % % % % % % % % % % % % % % % % % % % % % % All Items % % % % % Source: NYC Rent Guidelines Board, 2013 Price Index of Operating Costs Question 4: What was the sample size of lofts used in the 2013 PIOC Taxes component relative? There were 45 loft buildings included in the list used to calculate the PIOC Taxes component. Page 3 11
12 LOCAL LAW 63/ INCOME & EXPENSE REVIEW The sample size for the Income and Expense (I&E) Study includes almost 14,700 properties containing nearly 672,900 units. This is the 21 st year that staff has been able to obtain longitudinal data in addition to cross-sectional data. The RGB staff found the following average monthly (per unit) operating and maintenance (O&M) costs in 2012 Real Property Income and Expense (RPIE) statements for the year 2011: Table Income and Expense Study Average Monthly Operating and Maintenance Costs Per Unit Pre '47 Post '46 All Stabilized Total $786 $884 $812 Source: 2013 Income and Expense Study, from 2012 Real Property Income and Expense filings for 2011, NYC Department of Finance. In 1992, the Board benefited from the results of audits conducted on a stratified sample of 46 rent stabilized buildings by the Department of Finance. Audited income and expense (I&E) figures were compared to statements filed by owners. On average the audits showed an 8% over reporting of expenses. The categories, which accounted for nearly all of the expense over reporting, were maintenance, administration, and "miscellaneous." The largest over-reporting was in miscellaneous expenses. If we assume that an audit of this year's I&E data would yield similar findings to the 1992 audit, one would expect the average O&M cost for stabilized buildings to be $746, rather than $812. As a result, the following relationship between operating costs and residential rental income was suggested by the Local Law 63 data: Table 2(a) 2011 Operating Cost to Rent/Income Ratio Adjusted to 1992 Audit O&M Costs 6 Rent O&M to Rent Ratio Income O&M to Income Ratio All stabilized $746 $1, $1, Source: 2013 Income and Expense Study, from 2012 Real Property Income and Expense filings for 2011, NYC Department of Finance. On May 29, 2013 the staff of the Rent Guidelines Board released a memo to Board members with additional information concerning RPIE cost-to-income ratios by decile. Below is the memo in its entirety. (The memo referenced below from last year can be found in the 2012 Apartment Explanatory Statement.) 6 Overall O&M expenses were adjusted according to the findings of an income and expenses audit conducted by the Department of Finance in The unadjusted O&M to Rent ratio would be The unadjusted O&M to Income ratio would be
13 Memo To: Board Members From: Andrew McLaughlin and Brian Hoberman Date: May 29, 2013 Re: Cost-to-Income Ratios by Decile As a follow-up to last year s memo on the same subject, below is the distribution of operating costs in relation to total income in buildings containing rent stabilized units by deciles, This data is broken out by borough and citywide. The data was provided by the NYC Department of Finance and derived from cross-sectional 2011 RPIE data, as referenced in the 2013 Income and Expense Study. The figures for each of the deciles represent the percentage of buildings with cost-to-income ratios at or below those figures. For instance, looking at the 70% decile Queens cell below (highlight 1) means 70% of stabilized buildings in Queens have cost-to-income ratios at or below Another example: Looking at the 80% decile in Brooklyn (highlight 2) shows that 80% of stabilized buildings in Brooklyn have cost-to-income ratios at or below A final example: Looking at the 50% decile Citywide (highlight 3), half of all stabilized buildings Citywide have cost-to-income ratios of 0.68 or less. Cost-to-Income Ratios Deciles Manh Bronx Brooklyn Queens SI Citywide # Bldgs 6,099 3,190 3,407 1, ,669 10% % % % % % % % % % Source: NYC Department of Finance, 2011 RPIE filings 1 (over) 13
14 The findings this year are similar to those found last year (last year s memo is attached). While the data used both last year and this year are cross-sectional, meaning the exact same set of buildings are not compared in both years, we can see that in many decile categories, the findings are the same or very similar. For instance, Citywide deciles are exactly the same in both years among all decile categories except at the 100% level. There is more variation among deciles when examining them on a borough level: For instance, in Manhattan, except for the 100% decile category, no other decile level sees a difference of more than 0.01 between the two years, with ratios generally lower in Similarly, in the Bronx, except for the 100% decile, there is no greater difference than 0.02 in a decile category, although the cost-to-income ratios are generally higher in 2011 than in The largest difference between any decile categories, except the 100% decile, in any of the boroughs, is no greater than
15 FORECASTS OF OPERATING AND MAINTENANCE PRICE INCREASES FOR In order to decide upon the allowable rent increases for two-year leases, the RGB considers price changes for operating costs likely to occur over the next year. In making its forecasts the Board relies on expert assessments of likely price trends for the individual components, the history of changes in prices for the individual components and general economic trends. The Board's projections for are set forth in Table 3, which shows the Board's forecasts for price increases for the various categories of operating and maintenance costs. Table 3 Year-to-Year Percentage Changes in Components of the Price Index of Operating Costs: Actual and Projected Price Index Projected Price Index Taxes 2.6% 2.2% Labor Costs 3.0% 4.0% Fuel Oil 20.0% -6.6% Utilities 6.3% 6.1% Contractor Services 3.3% 3.1% Administrative Costs 2.4% 2.6% Insurance Costs 7.1% 10.4% Parts & Supplies 4.7% 2.1% Replacement Costs 2.0% 1.8% Total (Weighted) 5.9% 2.6% Source: 2013 Price Index of Operating Costs for Rent Stabilized Apartment Houses in New York City, which includes the 2014 PIOC Projection. Overall, the PIOC is expected to grow by 2.6% from 2013 to Costs are predicted to rise in each component except Fuel Oil, where costs are anticipated to decline 6.6%. The largest growth, of 10.4%, is projected to be in the Insurance Costs component. The Utilities component is anticipated to increase 6.1%, while more moderate increases are projected in Labor (4.0%), Administrative Costs (2.6%) and Contractor Services (3.1%). Taxes, the component that carries the most weight in the Index, is projected to increase 2.2%. The Parts and Supplies and Replacement Costs components are expected to rise 2.1% and 1.8%, respectively. The table on this page shows predicted changes in PIOC components for The core PIOC is projected to rise 3.8%, more than the overall projected Apartment PIOC. COMMENSURATE RENT ADJUSTMENT Throughout its history, the Rent Guidelines Board has used a formula, known as the commensurate rent adjustment, to help determine annual rent guidelines for rent stabilized apartments. In essence, the commensurate combines various data concerning operating costs, revenues, and inflation into a single measure indicating how much rents would have to change for net operating income (NOI) in stabilized buildings to remain constant. The different types of commensurate adjustments described below are primarily meant to provide a foundation for discussion concerning prospective guidelines. In its simplest form, the commensurate rent adjustment is the amount of rent change needed to maintain landlords current dollar NOI at a constant level. In other words, the formula provides a set of one- and two-year renewal rent increases or guidelines that will compensate owners for the change in prices measured by the PIOC and keep net operating income whole. 15
16 The first commensurate method is called the Net Revenue approach. While this formula takes into consideration the types of leases actually signed by tenants, it does not adjust landlords NOI for inflation. The Net Revenue formula is presented in two ways: First, adjusting for the mix of lease terms; and Second, adding an assumption for stabilized apartment turnover and the impact of revenue from vacancy increases. Under the Net Revenue formula, a guideline that would preserve NOI in the face of this year s 5.9% increase in the PIOC is 5.0% for a one-year lease and 9.0% for a two-year lease. Using this formula and adding assumptions for the impact of vacancy increases on revenues when apartments experience turnover result in guidelines of 3.25% for one- year leases and 6.25% for two-year leases. The second commensurate method considers the mix of lease terms while adjusting NOI upward to reflect general inflation, keeping both operating and maintenance (O&M) costs and NOI constant. This is commonly called the CPI-Adjusted NOI formula. A guideline that would preserve NOI in the face of the 1.9% increase in the Consumer Price Index and the 5.9% increase in the PIOC is 6.25% for a one-year lease and 9.75% for a two-year lease. Guidelines using this formula and adding the estimated impact of vacancy increases are 4.25% for one-year leases and 7.25% for two-year leases. 7 The traditional commensurate adjustment is the formula that has been in use since the inception of the Rent Guidelines Board. The traditional commensurate yields 4.0% for a one-year lease and 4.9% for a two-year lease. This reflects the increase in operating costs of 5.9% found in the 2013 PIOC and the projection of a 2.6% increase next year. 8 As a means of compensating for cost changes, this traditional commensurate rent adjustment has two major flaws. First, although the formula is supposed to keep landlords current dollar income constant, the formula does not consider the mix of one- and two-year lease renewals. Since only about threefifths of leases are renewed in any given year, with a preponderance of leases having a two-year duration, the formula does not necessarily accurately estimate the amount of income needed to compensate landlords for O&M cost changes. A second flaw of the traditional commensurate formula is that it does not consider the erosion of landlords income by inflation. By maintaining current dollar NOI at a constant level, adherence to the formula may cause profitability to decline over time. However, such degradation is not an inevitable consequence of using the traditional commensurate formula. 9 All of these methods have their limitations. The traditional commensurate formula is artificial and does not consider the impact of lease terms or inflation on landlords income. The Net Revenue formula does not attempt to adjust NOI based on changes in interest rates or deflation of landlord profits. The CPI- Adjusted NOI formula inflates the debt service portion of NOI, even though interest rates have been generally falling, rather than rising, over recent years. Including a consideration of the amount of income owners receive on vacancy assumes that turnover rates are constant across the City. Finally, it is important to note that only the traditional commensurate formula uses the PIOC projection and that this projection is not used in conjunction with or as part of the Net Revenue and CPI-Adjusted NOI formulas. As stated previously, all three formulas attempt to compensate owners 7 The following assumptions were used in the computation of commensurates: (1) the required change in landlord revenue is 67.2% of the 2013 PIOC increase of 5.9%, or 4.0%. The 67.2% figure is the most recent ratio of average operating costs to average income in stabilized buildings; (2) for the CPI-Adjusted NOI commensurate, the increase in revenue due to the impact of inflation on NOI is 32.8% times the latest 12-month increase in the CPI ending February 2013 (1.9%) or 0.62%; (3) these lease terms are only illustrative other combinations of one- and two-year guidelines could produce the adjustment in revenue; (4) assumptions regarding lease renewals and turnover were derived from the 2011 Housing and Vacancy Survey; (5) for the commensurate formulae, including a vacancy assumption, the 8.33% median increase in vacancy leases found in the rent stabilized apartments that reported a vacancy lease in the 2012 apartment registration file from the Division of Housing and Community Renewal was used; and (6) the collectability of these commensurate adjustments are assumed. 8 Calculating the traditional commensurate rent adjustment requires an assumption about next year s PIOC. In this case, the 2.6% PIOC projection for 2014 is used. 9 Whether profits will actually decline depends on the level of inflation, the composition of NOI (i.e., how much is debt service and how much is profit), and changes in tax law and interest rates. 16
17 for the adjustment in their operating and maintenance costs measured each year in the PIOC. The Net Revenue and the CPI-Adjusted NOI formulas attempt to compensate owners for the adjustment in O&M costs by using only the known PIOC change in costs (5.9%). The traditional method differs from the other formulas in that it uses both the PIOC s actual change in costs as well as the projected change in costs (2.6%). If the change in projected costs, which may not be an accurate estimate of owner s costs, is added to the Net Revenue and CPI-Adjusted NOI formulas, the resulting guidelines will likely over- or under- compensate for the change in costs. Each of these formulae may be best thought of as a starting point for deliberations. The other Rent Guidelines Board annual research reports (e.g., the Income and Affordability Report and the Income and Expense Study) and testimony to the Board can be used to modify the various estimates depending on these other considerations. Consideration of Other Factors Before determining the guideline, the Board considered other factors affecting the rent stabilized housing stock and the economics of rental housing. EFFECTIVE RATES OF INTEREST The Board took into account current mortgage interest rates and the availability of financing and refinancing. It reviewed the staff's 2013 Mortgage Survey Report of lending institutions. Table 4 gives the reported rate and points for the past nine years as reported by the mortgage survey. Table Mortgage Survey 10 Average Interest Rates and Points for New and Refinanced Permanent Mortgage Loans New Financing of Permanent Mortgage Loans, Interest Rate and Points Avg. Rates 5.5% 6.3% 6.3% 5.9% 6.5% 6.3% 5.8% 4.6% 4.4% Avg. Points Refinancing of Permanent Mortgage Loans, Interest Rate and Points Avg. Rates 5.5% 6.3% 6.2% 5.8% 6.5% 6.3% 5.7% 4.7% 4.4% Avg. Points Source: Annual Mortgage Survey Reports, RGB. 10 Institutions were asked to provide information on their "typical" loan to rent stabilized buildings. Data for each variable in any particular year and from year to year may be based upon responses from a different number of institutions. 17
18 CONDITION OF THE RENT STABILIZED HOUSING STOCK The Board reviewed the number of units that are moving out of the rental market due to cooperative and condominium conversion. Table 5 Number of Cooperative / Condominium Plans 11 Accepted for Filing, New Construction Conversion Non- Eviction Conversion Eviction Rehabilitation Total Subtotal: HPD Sponsored Plans Source: New York State Attorney General's Office, Real Estate Financing. On June 11, 2013 the staff of the Rent Guidelines Board released a memo to Board members with additional information concerning the 2013 Housing Supply Report. Below is the memo in its entirety: 11 The figures given above for eviction and non-eviction plans include those that are abandoned because an insufficient percentage of units were sold within the 15-month deadline. In addition, some of the eviction plans accepted for filing may have subsequently been amended or resubmitted as non-eviction plans and therefore may be reflected in both categories. HPD sponsored plans are a subset of the total plans. Some numbers revised from prior years. 18
19 Memorandum To: All Board Members From: Danielle Burger Date: June 11, 2013 Re: 2013 Housing Supply Report Follow-up Memo At the May 30, 2013 Housing Supply Report presentation, two questions were asked for which immediate answers could not be provided. Detailed answers follow. Question 1: Of the units newly approved for J-51 benefits in 2012, how many were rental units and how many were owner units? Per the NYC Department of Housing Preservation of Development, of the 45,886 units newly approved for J-51 benefits in 2012, 16,766 (36.5%) were rental units and 29,120 (63.5%) were owner units. Per data from the Department of Finance Annual Report on Tax Expenditures, in FY 2013, approximately 60% of units currently receiving J-51 benefits (almost 550,000 units) are rentals, and 40% are owner. Question 2: Of the units that were reported as being completed in 2012, how many are in 5-unit or more buildings? Per the NYC Department of City Planning, which bases their completions data on Temporary and Final Certificates of Occupancy issued by the Department of Buildings, of the 9,455 units that were completed during 2012, 7,195 (76.1%) were in buildings with 5 units or more. Buildings with 5 or more units represent 17.9% of all buildings completed in 2012 (254 of 1,420 buildings), with an average size of 28.3 units for the City as a whole and 51.1 units in Manhattan. For a breakdown of units by borough, refer to the table below. For comparison purposes, 2011 data is also presented. Units in Bldgs. with Less than 5 Units Units in Bldgs. with 5 Units or More % of Units in Bldgs. With 5 Units or More Total Units Borough! Bronx ,986 1, % 76.2% 3,387 1,413 Brooklyn ,999 3, % 83.5% 4,531 3,611 Manhattan ,129 1, % 97.0% 2,130 1,159 Queens 1, ,689 1, % 71.4% 2,754 2,632 Staten Is % 16.1% 1, Citywide 2,896 2,260 10,915 7, % 76.1% 13,811 9,455 Source: NYC Department of City Planning 19
20 CONSUMER PRICE INDEX The Board reviewed the Consumer Price Index. Table 6 shows the percentage change for the NY- Northeastern NJ Metropolitan area since Table 6 Percentage Changes in the Consumer Price Index for the New York City - Northeastern New Jersey Metropolitan Area, (For "All Urban Consumers") st Quarter Avg % 2.9% 3.8% 0.8% 2.1% 2.3% 2.6% 1.9% Yearly Avg. 3.8% 2.8% 3.9% 0.4% 1.7% 2.8% 2.0% -- Source: U.S. Bureau of Labor Statistics. CALCULATING OF THE CURRENT OPERATING AND MAINTENANCE EXPENSE TO RENT RATIO Each year the Board estimates the current average proportion of the rent roll which owners spend on operating and maintenance costs. This figure is used to ensure that the rent increases granted by the Board compensate owners for the increases in operating and maintenance expenses. This is commonly referred to as the O&M to rent ratio. With current longitudinal income and expense data, staff has constructed an index, using 1989 as a base year. Except for the last three years, this index measures changes in building income and operating expenses as reported in annual income and expense statements. The second and third to last years in the table will reflect actual PIOC increases and projected rent changes. The last year in the table - projecting into the future - will include staff projections for both expenses and rents. This index is labeled as Table 7. However, this index is not without limitations. First, as noted, for the past and coming year the index will continue to rely upon the price index and staff rent and cost projections. Second, while this table looks at the overall relationship between costs and income, it does not measure the specific impact of rent regulation on that relationship st Quarter Average refers to the change of the CPI average of the first three months of one year to the average of the first three months of the following year. Some numbers revised from prior years. 20
21 Table 7 Revised Calculation of Operating and Maintenance Cost Ratio for Rent Stabilized Buildings from 1989 to 2014 Year 13 Average Monthly O & M Per d.u. 14 Average Monthly Income Per d.u. Average O & M to Income Ratio 1989 $370 ($340) $ (.60) 1990 $382 ($351) $ (.62) 1991 $382 ($351) $ (.63) 1992 $395 ($363) $ (.63) 1993 $409 ($376) $ (.63) 1994 $415 ($381) $ (.61) 1995 $425 ($391) $ (.59) 1996 $444 ($408) $ (.60) 1997 $458 ($421) $ (.58) 1998 $459 ($422) $ (.56) 1999 $464 ($426) $ (.55) 2000 $503 ($462) $ (.56) 2001 $531 ($488) $ (.56) 2002 $570 ($524) $ (.57) 2003 $618 ($567) $ (.62) 2004 $654 ($601) $ (.62) 2005 $679 ($624) $ (.65) 2006 $695 ($638) $1, (.63) 2007 $738 ($678) $1, (.62) 2008 $790 ($726) $1, (.64) 2009 $781 ($717) $1, (.63) 2010 $790 ($726) $1, (.62) 2011 $812 ($746) $1, (.62) $835 ($767) $1, (.61) $884 ($812) $1, (.62) $907 ($833) $1, (.61) Source: RGB Income and Expense Studies, , Price Index of Operating Costs , RGB Rent Index for The O&M and income data from 2007 to 2010 has been revised from that reported in previous explanatory statements to reflect actual, rather than estimated, expense and income data. 14 Operating and expense data listed is based upon unaudited filings with the Department of Finance. Audits of 46 buildings conducted in 1992 suggest that expenses may be overstated by 8% on average. See Rent Stabilized Housing in New York City, A Summary of Rent Guidelines Board Research 1992, pages Figures in parentheses are adjusted to reflect these findings. 15 Estimated expense figure includes 2011 expense updated by the PIOC for the period from 3/1/11 through 2/29/12 (2.8%). Income includes the income estimate for 2011 updated by staff estimate based upon renewal guidelines and choice of lease terms for a period from 3/1/11 through 2/29/12 (3.87% - i.e., the 10/1/10 to 9/30/11 rent projection (3.40%) times (.583), plus the 10/1/11 to 9/30/12 rent projection (4.53%) times (.417)). 16 Estimated expense figure includes 2012 expense updated by the PIOC for the period from 3/1/12 through 2/28/13 (5.9%). Income includes the income estimate for 2012 updated by staff estimate based upon renewal guidelines and choice of lease terms for a period from 3/1/12 through 2/28/13 (4.29% - i.e., the 10/1/11 to 9/30/12 rent projection (4.53%) times (.583), plus the 10/1/12 to 9/30/13 rent projection (3.95%) times (.417)). 17 Estimated expense figure includes 2013 expense estimate updated by the staff PIOC projection for the period from 3/1/13 through 2/28/14 (2.6%). Income includes the income estimate for 2013 updated by staff estimate based upon renewal guidelines and choice of lease terms for a period from 3/1/13 through 2/28/14 (4.23% - i.e., the 10/1/12 to 9/30/13 rent projection (3.95%) times (.583), plus the 10/1/13 to 9/30/14 rent projection (4.62%) times (.417)). 21
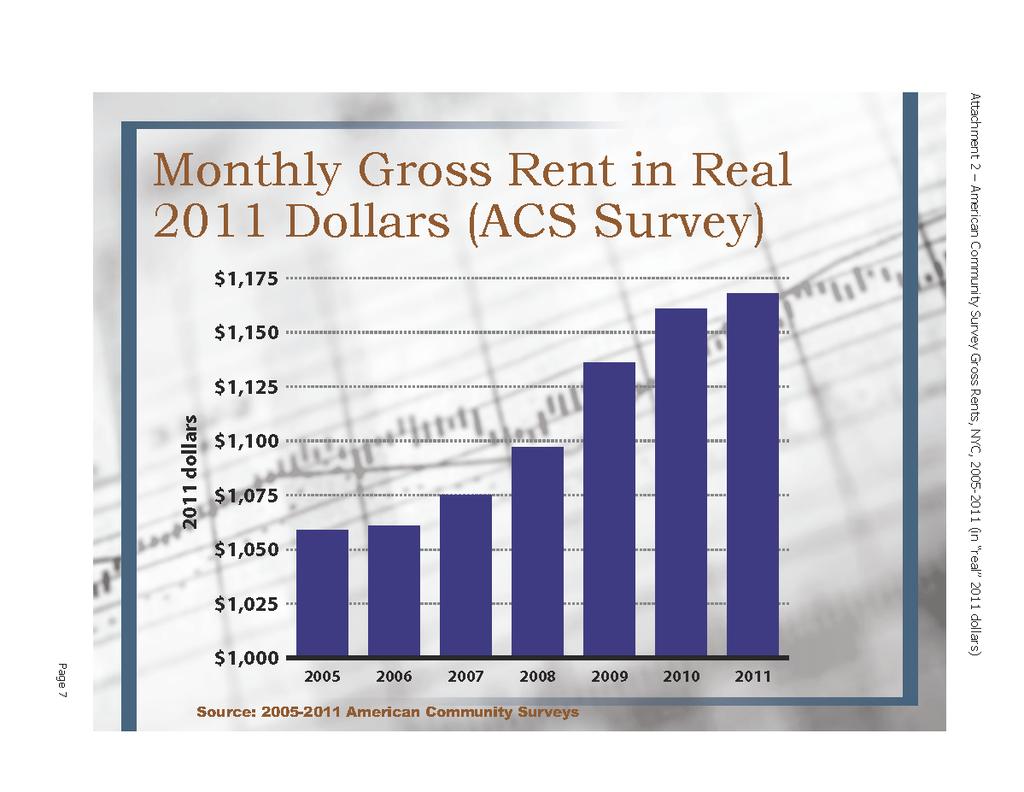
22 CHANGES IN HOUSING AFFORDABILITY Results from the 2011 Housing and Vacancy Survey were released last year, and showed that the vacancy rate for New York City is 3.12%. Approximately 45% of renter households in NYC are rent stabilized, with a vacancy rate of 2.63%. The survey also shows that the median household income in 2010 was $37,000 for rent stabilized tenants, versus $38,447 for all renters. The median gross rent for rent stabilized tenants was also lower than that of all renters, at $1,160 versus $1,204 for all renters. And rent stabilized tenants saw a median gross rent-to-income ratio of 34.9% in 2011, compared to 33.6% for all renters. Looking at New York City s economy during 2012, it showed both strengths and weaknesses as compared with the preceding year. Positive indicators include growing employment levels, which rose for the third consecutive year, increasing 2.1% in Gross City Product also increased for the third consecutive year, rising in real terms by 2.2% in In addition, the rate of inflation also slowed, down to 2.0% from 2.8% in 2011, and housing court non-payment filings fell 1.5%. Negative indicators included a 4.0% increase in evictions, despite the number of non-payment filings in Housing Court declining. In addition, cash assistance levels increased for the fourth consecutive year, increasing by 0.9% between 2011 and The number of Supplemental Nutrition Assistance Program (SNAP) recipients also rose, increasing for the tenth consecutive year, by 0.7% in In addition, homelessness rose over 2011 levels, increasing to an average of more than 43,000 persons a night, a 14.6% increase. Inflation- adjusted wages also decreased 4.5% during the most recent 12- month period (the fourth quarter of 2011 through the third quarter of 2012). And the unemployment rate rose slightly, following a decrease in the prior year, rising 0.2 percentage points, to 9.2%. The most recent numbers, from the fourth quarter of 2012 (as compared to the fourth quarter of 2011), show that homeless levels were up 19.0%, SNAP recipients were up 2.3%, and cash assistance levels were up 1.6%. However, both non-payment housing court filings and calendared court cases fell, by 4.8% and 2.7% respectively, employment levels were up 1.6%, unemployment rates fell by 0.43 percentage points, and real GCP rose by 2.8%. On April 17, 2013 the staff of the Rent Guidelines Board released a memo to Board members with additional information concerning the 2013 Income and Affordability Study. Below is the memo in its entirety: 22
23 23
24 ! 24
25 25
26 26
27 27
28 28
.")
29 B UILDINGS WITH D IFFERENT F UEL AND U TILITY A RRANGEMENTS The Board was also informed of the circumstances of buildings with different fuel and utility arrangements including buildings that are master-metered for electricity and that are heated with gas versus oil (see Table 8). Under some of the Board's Orders in the past, separate adjustments have been established for buildings in certain of these categories where there were indications of drastically different changes in costs in comparison to the generally prevailing fuel and utility arrangements. This year the Board did not make a distinction between guidelines for buildings with different fuel and utility arrangements under Order 45. Table 8 Changes in Price Index of Operating Costs for Apartments in Buildings with Various Heating Arrangements, , and Commensurate Rent Adjustment One-Year Rent Adjustment Price Index Commensurate With Change O&M to Income Ratio of.672 All Dwelling Units 5.9% 3.96% Pre % 4.57% Post % 3.29% Oil Used for Heating 7.3% 4.91% Gas Used for Heating 4.3% 2.89% Master Metered for Electricity 6.0% 4.03% Note: The O&M to Income ratio is from the 2013 Income and Expense Study. Source: RGB's 2013 Price Index of Operating Costs for Rent Stabilized Apartment Houses in New York City. Index Type 29
2013 Apartment & Loft Order #45. June 20, 2013
 NEW YORK CITY RENT GUIDELINES BOARD 2013 Apartment & Loft Order #45 June 20, 2013 Order Number 45 - Apartments and Lofts, rent levels for leases commencing October 1, 2013 through September 30, 2014. NOTICE
NEW YORK CITY RENT GUIDELINES BOARD Apartment & Loft Order #50. June 26, 2018
 NEW YORK CITY RENT GUIDELINES BOARD 2018 Apartment & Loft Order #50 June 26, 2018 Order Number 50 - Apartments and Lofts, rent levels for leases commencing October 1, 2018 through September 30, 2019. NOTICE
NEW YORK CITY RENT GUIDELINES BOARD Hotel Order #47. June 27, 2017
 NEW YORK CITY RENT GUIDELINES BOARD 2017 Hotel Order #47 June 27, 2017 Order Number 47 - Hotels, Rooming Houses, Single Room Occupancy Buildings and Lodging Houses. Rent levels to be effective for leases
Key Findings on the Affordability of Rental Housing from New York City s Housing and Vacancy Survey 2008
 Furman Center for real estate & urban policy New York University school of law n wagner school of public service 110 West 3rd Street, Suite 209, New York, NY 10012 n Tel: (212) 998-6713 n www.furmancenter.org
UPGRADING PRIVATE PROPERTY AT PUBLIC EXPENSE The Rising Cost of J-51
 UPGRADING PRIVATE PROPERTY AT PUBLIC EXPENSE The Rising Cost of J-51 POLICY BRIEF By Tom Waters and Victor Bach June 2012 The Community Service Society of New York (CSS) draws on a 168-year history of
Subsidized. Housing. in 2017
 FACT BRIEF DECEMBER 2018 NYCHA s State Outsized of Role In New Housing York New City s York s Poorest Households Subsidized Housing Public housing is a critical part of the affordable housing landscape
The State of Renters & Their Homes
 FORECLOSURES FINDING #14 The number of pre-foreclosure notices issued to one- to four-unit properties and condominiums in 2015 fell from the previous year. Pre-foreclosure notices for one- to four-unit
NINE FACTS NEW YORKERS SHOULD KNOW ABOUT RENT REGULATION
 NINE FACTS NEW YORKERS SHOULD KNOW ABOUT RENT REGULATION July 2009 Citizens Budget Commission Since 1993 New York City s rent regulations have moved toward deregulation. However, there is a possibility
Young-Adult Housing Demand Continues to Slide, But Young Homeowners Experience Vastly Improved Affordability
 Young-Adult Housing Demand Continues to Slide, But Young Homeowners Experience Vastly Improved Affordability September 3, 14 The bad news is that household formation and homeownership among young adults
Subject: Housing and Cost Estimates for the 421-a Extended Affordability Benefits Program
 THE CITY OF NEW YORK INDEPENDENT BUDGET OFFICE 110 WILLIAM STREET, 14 TH FLOOR NEW YORK, NEW YORK 10038 (212) 442-0632 FAX (212) 442-0350 EMAIL: iboenews@ibo.nyc.ny.us http://www.ibo.nyc.ny.us To: George
820 First Street, NE, Suite 510, Washington, DC Tel: Fax:
 820 First Street, NE, Suite 510, Washington, DC 20002 Tel: 202-408-1080 Fax: 202-408-1056 center@cbpp.org www.cbpp.org March 16, 2004 HUD S RELIANCE ON RENT TRENDS FOR HIGH-END APARTMENTS TO CRITICIZE
LIMITED-SCOPE PERFORMANCE AUDIT REPORT
 LIMITED-SCOPE PERFORMANCE AUDIT REPORT Agricultural Land Valuation: Evaluating the Potential Impact of Changing How Agricultural Land is Valued in the State AUDIT ABSTRACT State law requires the value
in 2017 State of New York City s Subsidized Housing Funding for this report and for CoreData.nyc was provided by the New York City Council.
 FACT BRIEF JUNE 2018 State of New York City s Subsidized Housing in 2017 Funding for this report and for CoreData.nyc was provided by the New York City Council. State of New York City s Subsidized Housing
The Impact of Market Rate Vacancy Increases Eleven-Year Report
 The Impact of Market Rate Vacancy Increases Eleven-Year Report January 1, 1999 - December 31, 2009 Santa Monica Rent Control Board April 2010 TABLE OF CONTENTS Summary 1 Vacancy Decontrol s Effects on
The cost of increasing social and affordable housing supply in New South Wales
 The cost of increasing social and affordable housing supply in New South Wales Prepared for Shelter NSW Date December 2014 Prepared by Emilio Ferrer 0412 2512 701 eferrer@sphere.com.au 1 Contents 1 Background
One Host, One Home: New York City (February 2017 Update)
") One Host, One Home: New York City (February 2017 Update) Key Figures About Airbnb s NYC Community Today, we re releasing updated information about the Airbnb community in New York City. This covers the
One Host, One Home: New York City (February 2017 Update) Key Figures About Airbnb s NYC Community Today, we re releasing updated information about the Airbnb community in New York City. This covers the
Wi n t e r 2008 In this issue: Housing Market Update Affordable Housing Update Special Focus: Tracking Subsidized Housing
 www.neighborhoodinfodc.org District of Columbia Housing Monitor Wi n t e r 2008 In this issue: Housing Market Update Affordable Housing Update Special Focus: Tracking Subsidized Housing In the Spotlight
BUSI 330 Suggested Answers to Review and Discussion Questions: Lesson 10
 BUSI 330 Suggested Answers to Review and Discussion Questions: Lesson 10 1. The client should give you a copy of their income and expense statements for the last 3 years showing their rental income by
The Impact of Market Rate Vacancy Increases Eight-Year Report
 The Impact of Market Rate Vacancy Increases Eight-Year Report January 1, 1999 - December 31, 2006 Santa Monica Rent Control Board March 2007 TABLE OF CONTENTS Summary 1 Units Rented at Market Rates Rates
New York State Division of Housing and Community Renewal Office of Rent Administration
 Advisory Opinion 87-2 New York State Division of Housing and Community Renewal Office of Rent Administration New York City Rent Stabilization Code Advisory Opinion 87-2 (June 1, 1987) This Advisory Opinion
TABLE OF CONTENTS TABLE OF FIGURES
 PREPARED FOR THE CITY OF BEVERLY HILLS RENT STABILIZATION ANALYSIS DRAFT DATA BRIEF JULY 26, 2018 TABLE OF CONTENTS TABLE OF FIGURES TABLE OF CONTENTS INTRODUCTION... 3 RSO BUILDING STOCK CHARACTERISTICS...
Definitions & Data on Rent Stabilization in New York City
 1 Definitions & Data on Rent Stabilization in New York City 2 Rent Stabilization in New York Buildings Subject to Rent Stabilization Involuntary: Buildings with six or more units built before 1974. ~857,000
Research Report #6-07 LEGISLATIVE REVENUE OFFICE.
 HOUSING AFFORDABILITY IN OREGON Research Report #6-07 LEGISLATIVE REVENUE OFFICE http://www.leg.state.or.us/comm/lro/home.htm STATE OF OREGON LEGISLATIVE REVENUE OFFICE H-197 State Capitol Building Salem,
Vacancies at the Clinton Towers Mitchell-Lama Housing Development New York City Department of Housing Preservation and Development
 New York State Office of the State Comptroller Thomas P. DiNapoli Division of State Government Accountability Vacancies at the Clinton Towers Mitchell-Lama Housing Development New York City Department
Affordable NEW YORK. Housing Program. A Briefing Memo April 27, 2017 SEIDEN & SCHEIN, P.C. ATTORNEYS AT LAW
 Affordable NEW YORK Housing Program A Briefing Memo April 27, 2017 SEIDEN & SCHEIN, P.C. ATTORNEYS AT LAW 570 Lexington Avenue New York, New York 10022 T: (212) 935-1400 F: (212) 593-4545 W: www.seidenschein.com
Trends in Affordable Home Ownership in Calgary
 Trends in Affordable Home Ownership in Calgary 2006 July www.calgary.ca Call 3-1-1 PUBLISHING INFORMATION TITLE: AUTHOR: STATUS: TRENDS IN AFFORDABLE HOME OWNERSHIP CORPORATE ECONOMICS FINAL PRINTING DATE:
Affordably- Priced Housing
 Affordably- Priced Housing Can the next generation afford to live in Chester County? Chester County Planning Commission This slide deck is an annotated version of one presented at the Chesco2020 Affordably-Priced
Housing Price Forecasts. Illinois and Chicago PMSA, December 2015
 Housing Price Forecasts Illinois and Chicago PMSA, December 2015 Presented To Illinois Association of Realtors From R E A L Regional Economics Applications Laboratory, Institute of Government and Public
City of New York OFFICE OF THE COMPTROLLER. Scott M. Stringer COMPTROLLER AUDIT AND SPECIAL REPORTS
 City of New York OFFICE OF THE COMPTROLLER Scott M. Stringer COMPTROLLER AUDIT AND SPECIAL REPORTS Marjorie Landa Deputy Comptroller for Audit Audit Report on the Tax Classification of Real Property in
APPENDIX A. Market Study Standards and Requirements
 APPENDIX A Market Study Standards and Requirements Section 42(m)(1)(A)(iii) of the IRS Code and Section IV(A)(2) of the 2018 Qualified Allocation Plan (QAP) require market studies for all low-income housing
CHAPTER 7 HOUSING. Housing May
 CHAPTER 7 HOUSING Housing has been identified as an important or very important topic to be discussed within the master plan by 74% of the survey respondents in Shelburne and 65% of the respondents in
Estimating National Levels of Home Improvement and Repair Spending by Rental Property Owners
 Joint Center for Housing Studies Harvard University Estimating National Levels of Home Improvement and Repair Spending by Rental Property Owners Abbe Will October 2010 N10-2 2010 by Abbe Will. All rights
Briefing Book. State of the Housing Market Update San Francisco Mayor s Office of Housing and Community Development
 Briefing Book State of the Housing Market Update 2014 San Francisco Mayor s Office of Housing and Community Development August 2014 Table of Contents Project Background 2 Household Income Background and
Approve the first reading of proposed Ordinance No and set it over for second reading and adoption.
 DATE: SUBJECT: PROPOSED ORDINANCE NO. 1368 AN ORDINANCE OF THE CITY OF PALMDALE, CALIFORNIA, AMENDING CHAPTER 5.44 OF THE PALMDALE MUNICIPAL CODE RELATIVE TO MOBILE HOME SPACE RENT CONTROL ISSUING DEPARTMENT:
Chapter 12 Changes Since This is just a brief and cursory comparison. More analysis will be done at a later date.
 Chapter 12 Changes Since 1986 This approach to Fiscal Analysis was first done in 1986 for the City of Anoka. It was the first of its kind and was recognized by the National Science Foundation (NSF). Geographic
SJC Comprehensive Plan Update Housing Needs Assessment Briefing. County Council: October 16, 2017 Planning Commission: October 20, 2017
 SJC Comprehensive Plan Update 2036 Housing Needs Assessment Briefing County Council: October 16, 2017 Planning Commission: October 20, 2017 Overview GMA Housing Element Background Demographics Employment
Housing as an Investment Greater Toronto Area
 Housing as an Investment Greater Toronto Area Completed by: Will Dunning Inc. For: Trinity Diversified North America Limited February 2009 Housing as an Investment Greater Toronto Area Overview We are
City and County of San Francisco
 City and County of San Francisco Office of the Controller - Office of Economic Analysis Residential Rent Ordinances: Economic Report File Nos. 090278 and 090279 May 18, 2009 City and County of San Francisco
Affordable Housing Bonus Program. Public Questions and Answers - #2. January 26, 2016
 Affordable Housing Bonus Program Public Questions and Answers - #2 January 26, 2016 The following questions about the Affordable Housing Bonus Program were submitted by the public to the Planning Department
Technical Description of the Freddie Mac House Price Index
 Technical Description of the Freddie Mac House Price Index 1. Introduction Freddie Mac publishes the monthly index values of the Freddie Mac House Price Index (FMHPI SM ) each quarter. Index values are
Before the Minnesota Public Utilities Commission State of Minnesota. Docket No. E002/GR Exhibit (LMC-1) Property Taxes
 Property Taxes") Direct Testimony and Schedules Leanna M. Chapman Before the Minnesota Public Utilities Commission State of Minnesota In the Matter of the Application of Northern States Power Company for Authority to Increase
Direct Testimony and Schedules Leanna M. Chapman Before the Minnesota Public Utilities Commission State of Minnesota In the Matter of the Application of Northern States Power Company for Authority to Increase
White Oak Science Gateway Master Plan Staff Draft AFFORDABLE HOUSING ANALYSIS. March 8, 2013
 White Oak Science Gateway Master Plan Staff Draft AFFORDABLE HOUSING ANALYSIS March 8, 2013 Executive Summary The Draft White Oak Science Gateway (WOSG) Master Plan encourages development of higher density,
Rent Stabilization, Vacancy Decontrol and Reinvestment in Rental Property in Berkeley, California
 Rent Stabilization, Vacancy Decontrol and Reinvestment in Rental Property in Berkeley, California REVISED FINAL REPORT July 16, 2012 Jay Kelekian, Executive Director Stephen Barton, Ph.D., Project Manager
U.S. Department of Housing and Urban Development Community Planning and Development
 U.S. Department of Housing and Urban Development Community Planning and Development Special Attention of: Notice: CPD 98-1 All Secretary's Representatives All State/Area Coordinators Issued: January 22,
Ontario Rental Market Study:
 Ontario Rental Market Study: Renovation Investment and the Role of Vacancy Decontrol October 2017 Prepared for the Federation of Rental-housing Providers of Ontario by URBANATION Inc. Page 1 of 11 TABLE
COMPARISON OF THE LONG-TERM COST OF SHELTER ALLOWANCES AND NON-PROFIT HOUSING
 COMPARISON OF THE LONG-TERM COST OF SHELTER ALLOWANCES AND NON-PROFIT HOUSING Prepared for The Fair Rental Policy Organization of Ontario By Clayton Research Associates Limited October, 1993 EXECUTIVE
NYU Furman Center / Citi Report on Homeownership & Opportunity in New York City
 NYU Furman Center / Citi Report on Homeownership & Opportunity in New York City August 5, 2016 Authors Mark Willis (Principal Investigator) Maxwell Austensen Shannon Moriarty Stephanie Rosoff Traci Sanders
AN ECONOMIC, FISCAL AND CAPITAL ASSET IMPACT ANALYSIS OF THIRTEEN PROPOSED NEW DEVELOPMENTS ON THE TOWN OF DENTON, MARYLAND.
 AN ECONOMIC, FISCAL AND CAPITAL ASSET IMPACT ANALYSIS OF THIRTEEN PROPOSED NEW DEVELOPMENTS ON THE TOWN OF DENTON, MARYLAND Prepared for The Denton Town Council Denton, Maryland by Dean D. Bellas, Ph.D.
Instructions for Operation and Maintenance and Essential Services Certification
 New York State Division of Housing and Community Renewal Office of Rent Administration Web Site: www.nyshcr.org MBR Section Gertz Plaza 92-31 Union Hall Street Jamaica, NY 11433 (718)739-6400 Instructions
RENTAL MARKET REPORT. Manitoba Highlights* Highlight Box. Housing market intelligence you can count on
 H o u s i n g M a r k e t I n f o r m a t i o n RENTAL MARKET REPORT Manitoba Highlights* C a n a d a M o r t g a g e a n d H o u s i n g C o r p o r a t i o n Date Released: Spring 2011 Figure 1 Winnipeg
Housing Element Amendment. Borough of High Bridge
 Housing Element Amendment Borough of High Bridge Hunterdon County New Jersey September, 2004 Prepared for: The Borough of High Bridge 71 Main Street High Bridge, N.J. 08829 Prepared by: Art Bernard, P.P.
Housing Price Forecasts. Illinois and Chicago PMSA, March 2016
 Housing Price Forecasts Illinois and Chicago PMSA, March 2016 Presented To Illinois Association of Realtors From R E A L Regional Economics Applications Laboratory, Institute of Government and Public Affairs
Median Income and Median Home Price
 Homeownership Remains Unaffordable; Rental Affordability Showing Signs of Improvement Richard E. Taylor, Research Manager at MaineHousing MaineHousing has released the 217 Maine Homeownership and Rental
Housing Price Forecasts. Illinois and Chicago PMSA, January 2018
 Housing Price Forecasts Illinois and Chicago PMSA, January 2018 Presented To Illinois Realtors From R E A L Regional Economics Applications Laboratory, Institute of Government and Public Affairs University
Housing Price Forecasts. Illinois and Chicago PMSA, March 2018
 Housing Price Forecasts Illinois and Chicago PMSA, March 2018 Presented To Illinois Realtors From R E A L Regional Economics Applications Laboratory, Institute of Government and Public Affairs University
Housing Price Forecasts. Illinois and Chicago PMSA, May 2018
 Housing Price Forecasts Illinois and Chicago PMSA, May 2018 Presented To Illinois Realtors From R E A L Regional Economics Applications Laboratory, Institute of Government and Public Affairs University
M A N H A T T A N 69 THE FURMAN CENTER FOR REAL ESTATE & URBAN POLICY. Financial District Greenwich Village/Soho
 M A N H A T T A N Page Financial District 301 72 Greenwich Village/Soho 302 73 Lower East Side/Chinatown 303 74 Clinton/Chelsea 304 75 69 THE FURMAN CENTER FOR REAL ESTATE & URBAN POLICY Midtown 305 76
One Host, One Home: New York City (April 2018 Update)
") One Host, One Home: New York City (April 2018 Update) Key Figures About Airbnb s NYC Community Today, we re releasing updated information about the Airbnb community in New York City. This covers the time
One Host, One Home: New York City (April 2018 Update) Key Figures About Airbnb s NYC Community Today, we re releasing updated information about the Airbnb community in New York City. This covers the time
SUBJECT: INTERIM APARTMENT RENT ORDINANCE RELATED TO TEMPORARY ALLOWABLE RENT INCREASES AND COST PASS- THROUGH PROVISIONS
 COUNCIL AGENDA: 5/10/16 ITEM: 4.5 CITY OF C: ^2 SAN JOSE CAPITAL OF SILICON VALLEY TO: HONORABLE MAYOR AND CITY COUNCIL Memorandum FROM: Jacky Morales-Ferrand SUBJECT: SEE BELOW DATE: Approved Date ^fen/he
City Center Market-Rate Housing Study
 City Center Market-Rate Housing Study OVERVIEW The City of Bellingham, with the assistance of students from Western Washington University, conducted a study of market-rate rental housing during April and
ECONOMIC CURRENTS. Vol. 3, Issue 1. THE SOUTH FLORIDA ECONOMIC QUARTERLY Introduction
 ECONOMIC CURRENTS THE SOUTH FLORIDA ECONOMIC QUARTERLY Introduction Economic Currents provides an overview of the South Florida regional economy. The report contains current employment, economic and real
H o u s i n g N e e d i n E a s t K i n g C o u n t y
 1999 2000 2001 2002 2003 2004 2005 2006 2007 2008 2009 2010 Number of Affordable Units H o u s i n g N e e d i n E a s t K i n g C o u n t y HOUSING AFFORDABILITY Cities planning under the state s Growth
Post-Katrina housing affordability challenges continue in 2008, worsening among Orleans Parish very low income renters
 Post-Katrina housing affordability challenges continue in 2008, worsening among Orleans Parish very low income renters Based on 2004, 2007 and 2008 American Community Survey data from the U.S. Census Bureau
HUTS Data Exchanges Outside Agencies
 HUTS Data Exchanges Outside Agencies The following is a list of the data exchanges with outside agencies that exist for HUTS data and a brief description of the purpose of each. DHCR extracts information
NYC Independent Budget Office Dec 18, 2017
 Evaluation of Commercial Revitalization and Commercial Expansion Tax Expenditure Programs Prepared for New York City Council Finance Committee Pursuant to Local Law 18 NYC Independent Budget Office Dec
Housing Vouchers versus Housing Production: Assessing Long-Term Costs
 Housing Policy Debate Volume 9, Issue 2 355 Fannie Mae Foundation 1998. All Rights Reserved. Housing Vouchers versus Housing Production: Assessing Long-Term Costs Kirk McClure University of Kansas Abstract
CONSUMER CONFIDENCE AND REAL ESTATE MARKET PERFORMANCE GO HAND-IN-HAND
 CONSUMER CONFIDENCE AND REAL ESTATE MARKET PERFORMANCE GO HAND-IN-HAND The job market, mortgage interest rates and the migration balance are often considered to be the main determinants of real estate
Status of HUD-Insured (or Held) Multifamily Rental Housing in Final Report. Executive Summary. Contract: HC-5964 Task Order #7
 Multifamily Rental Housing in Final Report. Executive Summary. Contract: HC-5964 Task Order #7") Status of HUD-Insured (or Held) Multifamily Rental Housing in 1995 Final Report Executive Summary Cambridge, MA Lexington, MA Hadley, MA Bethesda, MD Washington, DC Chicago, IL Cairo, Egypt Johannesburg,
Status of HUD-Insured (or Held) Multifamily Rental Housing in 1995 Final Report Executive Summary Cambridge, MA Lexington, MA Hadley, MA Bethesda, MD Washington, DC Chicago, IL Cairo, Egypt Johannesburg,
The developers guide to Affordable Housing NY Program AKA the 421-a tax exemption
 The developers guide to Affordable Housing NY Program AKA the 421-a tax exemption Introduction In April 2017, New York enacted a new version of the Real Property Tax Law 421-a known as the Affordable Housing
FY General Revenue Forecast Presentation
 FY 2015-2019 General Revenue Forecast Presentation Steven A. Solomon Director of Finance February 18, 2014 Overview Current Economic Outlook National State Local FY 2014 2nd Quarter Revenue Update Five
Following is an example of an income and expense benchmark worksheet:
 After analyzing income and expense information and establishing typical rents and expenses, apply benchmarks and base standards to the reappraisal area. Following is an example of an income and expense
Mass Appraisal of Income-Producing Properties
 Chapter 10 Mass Appraisal of Income-Producing Properties Whether valuing income-producing property or residential property, you can use similar information and methods for collecting and analyzing data
City of Lonsdale Section Table of Contents
 City of Lonsdale City of Lonsdale Section Table of Contents Page Introduction Demographic Data Overview Population Estimates and Trends Population Projections Population by Age Household Estimates and
Housing Price Forecasts. Illinois and Chicago PMSA, September 2016
 Housing Price Forecasts Illinois and Chicago PMSA, September 2016 Presented To Illinois Realtors From R E A L Regional Economics Applications Laboratory, Institute of Government and Public Affairs University
Housing Affordability in Lexington, Kentucky
 University of Kentucky UKnowledge CBER Research Report Center for Business and Economic Research 6-29-2009 Housing Affordability in Lexington, Kentucky Christopher Jepsen University of Kentucky, chris.jepsen@uky.edu
Housing Price Forecasts. Illinois and Chicago PMSA, July 2016
 Housing Price Forecasts Illinois and Chicago PMSA, July 2016 Presented To Illinois Association of Realtors From R E A L Regional Economics Applications Laboratory, Institute of Government and Public Affairs
The Impact of Market Rate Vacancy Increases One Year Report
 The Impact of Market Rate Vacancy Increases One Year Report January 1, 1999- December 31, 1999 Santa Monica Rent Control Board TABLE OF CONTENTS Summary 2 Market Rent Increases 1/1/99-12/31/99 4 Rates
Housing Price Forecasts. Illinois and Chicago PMSA, October 2014
 Housing Price Forecasts Illinois and Chicago PMSA, October 2014 Presented To Illinois Association of Realtors From R E A L Regional Economics Applications Laboratory, Institute of Government and Public
Planning and Development Department Building and Development Permit Summary Report
 Planning and Development Department 21 Building and Development Permit Summary Report February 22, 21 2 21 Building and Development Permit Summary Table of Contents Introduction... 3 Building Permits...
Housing Needs in Burlington s Downtown & Waterfront Areas
 Housing Needs in s Downtown & Waterfront Areas Researched and written by Vermont Housing Finance Agency for the City of Planning & Zoning Department 10/31/2011 Contents Introduction... 2 Executive Summary...
REGIONAL. Rental Housing in San Joaquin County
 Lodi 12 EBERHARDT SCHOOL OF BUSINESS Business Forecasting Center in partnership with San Joaquin Council of Governments 99 26 5 205 Tracy 4 Lathrop Stockton 120 Manteca Ripon Escalon REGIONAL analyst april
Housing Price Forecasts. Illinois and Chicago PMSA, April 2018
 Housing Price Forecasts Illinois and Chicago PMSA, April 2018 Presented To Illinois Realtors From R E A L Regional Economics Applications Laboratory, Institute of Government and Public Affairs University
Understanding the Cost to Provide Community Services in the Town of Holland, La Crosse County, Wisconsin
 Understanding the Cost to Provide Community Services in the Town of Holland, La Crosse County, Wisconsin Rebecca Roberts Land Use Specialist Center for Land Use Education and Karl Green Community Development
One Host, One Home: New York City (January 2018 Update)
") One Host, One Home: New York City (January 2018 Update) Key Figures About Airbnb s NYC Community Today, we re releasing updated information about the Airbnb community in New York City. This covers the
One Host, One Home: New York City (January 2018 Update) Key Figures About Airbnb s NYC Community Today, we re releasing updated information about the Airbnb community in New York City. This covers the
Glenmont Sector Plan Staff Draft AFFORDABLE HOUSING ANALYSIS
 Glenmont Sector Plan Staff Draft AFFORDABLE HOUSING ANALYSIS November 1, 2012 Center for Research and Information Systems Montgomery County Planning Department M NCPPC Executive Summary The Glenmont Sector
City Commission Policy Administration and Implementation of the Inclusionary Housing Ordinance
 City Commission Policy 1103 - Administration and Implementation of the Inclusionary Housing Ordinance DEPARTMENTS: Economic & Community Development Department; Planning Department; Growth Management Department;
RENTAL MARKET REPORT. Manitoba Highlights* Highlights. Housing market intelligence you can count on
 H o u s i n g M a r k e t I n f o r m a t i o n RENTAL MARKET REPORT Highlights* C a n a d a M o r t g a g e a n d H o u s i n g C o r p o r a t i o n Date Released: Spring 2012 Figure 1 Winnipeg CMA Brandon
Identifying Troubled NYCHA Developments in Brooklyn. Cost Considerations for Rehabilitating Troubled NYCHA Brooklyn Developments.
 Memorandum To: George Sweeting From: Sarah Stefanski Date: November 26, 2018 Subject: Cost Comparison of Rehabilitation vs. Reconstruction of Troubled NYCHA Units in Brooklyn IBO compared the cost of rehabilitating
CHAPTER 2: HOUSING. 2.1 Introduction. 2.2 Existing Housing Characteristics
 CHAPTER 2: HOUSING 2.1 Introduction Housing Characteristics are related to the social and economic conditions of a community s residents and are an important element of a comprehensive plan. Information
Memo. DATE: 20 September 2018 City Planning Commission John Rahaim, Director of Planning RE: HOUSING BALANCE REPORT No. 7 1 July June 2018
 DATE: 20 September 2018 TO: FROM: City Planning Commission John Rahaim, Director of Planning RE: HOUSING BALANCE REPORT No. 7 1 July 2008 30 June 2018 STAFF CONTACT: Teresa Ojeda, 415 558 6251 SUMMARY
How Did Foreclosures Affect Property Values in Georgia School Districts?
 Tulane Economics Working Paper Series How Did Foreclosures Affect Property Values in Georgia School Districts? James Alm Department of Economics Tulane University New Orleans, LA jalm@tulane.edu Robert
Public Review Draft. January 2007
 Lee County, Florida SUPPORT STUDY: AFFORDABLE HOUSING METHODOLOGY January 2007 Public Review Draft Submitted by: CLARION ASSOCIATES, LLC 1526 East Franklin Street, Suite 102 Chapel Hill, NC 27514 (919)
Volume Title: Well Worth Saving: How the New Deal Safeguarded Home Ownership
 This PDF is a selection from a published volume from the National Bureau of Economic Research Volume Title: Well Worth Saving: How the New Deal Safeguarded Home Ownership Volume Author/Editor: Price V.
City Position on Amendments to O. Reg. 516/06 under the Residential Tenancies Act
 REPORT FOR ACTION City Position on Amendments to O. Reg. 516/06 under the Residential Tenancies Act Date: October 31, 2017 To: City Council From: General Manager, Shelter, Support and Housing Administration
THE APPRAISAL OF REAL ESTATE 3 RD CANADIAN EDITION BUSI 330
 THE APPRAISAL OF REAL ESTATE 3 RD CANADIAN EDITION BUSI 330 REVIEW NOTES by CHUCK DUNN CHAPTER 20 Copyright 2010 by the Real Estate Division and Chuck Dunn. All rights reserved CHAPTER 20 - THE INCOME
State of Renters and Their Homes
 State of Renters and Their Homes As rents rose and renters incomes remained stagnant from to, many New Yorkers continued to face heavy rent burdens. In, roughly 30 percent of the city s renter households
THE TREND OF REAL ESTATE TAXATION IN KANSAS, 1910 TO 1942¹
 THE TREND OF REAL ESTATE TAXATION IN KANSAS, 1910 TO 1942¹ HAROLD HOWE². INTRODUCTION The purpose of this study is to show the trends of taxes on farm and city real estate in Kansas from 1910 to 1942 and
GENERAL ASSESSMENT DEFINITIONS
 21st Century Appraisals, Inc. GENERAL ASSESSMENT DEFINITIONS Ad Valorem tax. A tax levied in proportion to the value of the thing(s) being taxed. Exclusive of exemptions, use-value assessment laws, and
Housing Price Forecasts. Illinois and Chicago PMSA, August 2016
 Housing Price Forecasts Illinois and Chicago PMSA, August 2016 Presented To Illinois Association of Realtors From R E A L Regional Economics Applications Laboratory, Institute of Government and Public
Real Estate & REIT Modeling: Quiz Questions Module 1 Accounting, Overview & Key Metrics
 Real Estate & REIT Modeling: Quiz Questions Module 1 Accounting, Overview & Key Metrics 1. How are REITs different from normal companies? a. Unlike normal companies, REITs are not required to pay income