CITY OF VANCOUVER ADMINISTRATIVE REPORT
|
|
|
- Nathan Small
- 6 years ago
- Views:
Transcription

1 CITY OF VANCOUVER ADMINISTRATIVE REPORT Report Date: June 26, 2007 Author: Paul Raynor Ben Johnson Phone No.: /7542 RTS No.: VanRIMS No.: Meeting Date: July 12, 2007 TO: FROM: SUBJECT: Standing Committee on City Services and Budgets Director of Housing Centre 2007 Survey of Low-Income Housing in the Downtown Core INFORMATION The General Manager of Community Services submits this report for INFORMATION. COUNCIL POLICY Council policy is to maintain, upgrade, and increase the stock of low-income housing in the Downtown Core. Council has instructed the Housing Centre to monitor the low-income stock in the area on a regular basis. PURPOSE The purpose of this report is to inform Council of the results of the 2007 Survey of Low- Income Housing in the Downtown Core, detailed in the report attached as Appendix A (limited distribution on file at the City Clerk s Office and available on the City s web site).
2 2007 Survey of Low-Income Housing in the Downtown Core 2 BACKGROUND In October 1989, Council adopted the objective of... maintaining, upgrading, and increasing the existing stock of core-need housing in the Downtown. In May 1991, when dealing with housing strategies for Downtown South, Council instructed the Housing Centre to monitor lowincome housing in Downtown South on a periodic basis. Council also confirmed their policy of one-to-one replacement of single-room occupancy (SRO) units in Downtown South. In October 2001, Council confirmed the housing objective to maintain and expand housing opportunities with priority being given to families with children, SRO residents, and the mentally ill, physically disabled, and others at risk of homelessness. In October 2003, Council enacted the Single Room Accommodation (SRA) By-law to control the conversion and demolition of SRO housing. In June 2005, Council approved the Homeless Action Plan, including the recommendation to continue to monitor rent increases in SROs every two years and report back to Council. In October 2005, Council approved the Downtown Eastside Housing Plan that included the objective of one-for-one replacement for the SRO stock in the Downtown Eastside. The attached report is the eighth Housing Centre report monitoring change in the stock of low-income housing in the Downtown Core; an area extending from Burrard Street to Clark Drive, and from the waterfront south to Terminal Avenue and False Creek. Since 1992, the Housing Centre completed a biennial survey of the SRO stock and reported on change in the stock. This report presents the results of the May 2007 survey of SRO housing, and brings together information from other sources on Special Needs Residential Facilities (SNRFs) and non-market housing. SRO housing is the cheapest form of rental housing provided by the market for people who have few other choices. Typically, a SRO unit consists of one room about 10 x 10 feet, with shared bathrooms and minimal, if any, cooking facilities. Even though rents are relatively low, most SRO occupants pay substantially more than half their income for housing. Although SRO units are small and rarely achieve more than basic physical quality standards, the City s policy is to retain SRO stock until more adequate housing is available. While most SRO units are low-income housing by default, non-market units are low-income housing by design. Non-market housing is usually subsidized by senior governments to accommodate core-need households, at rents fixed at either 30 percent of income or the shelter component of BC Employment and Assistance. SNRFs provide housing combined with services to those with special needs - the frail elderly, those with physical, psychological, or substance abuse problems, and those needing emergency shelter. These groups often have low incomes as well. DISCUSSION 2007 Low-Income Stock As of June 1, 2007, there were 14,086 low-income units in the Downtown Core. Forty-two (42) percent of the units are SROs, 47 percent are non-market, and SNRFs account for the remaining 10 percent.
3 2007 Survey of Low-Income Housing in the Downtown Core 3 Recent Change in the Number of Low-Income Units Between June 2005 and June 2007, the changes in the overall stock of low-income housing in the Downtown Core were as follows: The SRO stock declined by 183 units (3 percent) with 275 units lost and 92 gained; Almost all of the SRO gains came from the re-opening of closed SROs; Almost thirty percent of the SRO losses (81 units) were associated with voluntary closures. Closures by the City for failing to maintain buildings to standard were the second largest source of loss (57 units); Two new non-market projects were completed, increasing the non-market stock by 131 units (2 percent); The SNRF stock increased by 12 units, with one project changing location (and increasing its capacity) and another project reducing its capacity; SNRF and non-market gains were not enough to offset SRO losses, and the total stock declined by 40 units (-0.3 percent), compared to an increase of 371 units over the previous survey period ( ); and The Downtown South was the only sub-area to experience a net increase in stock. Not all non-market projects can be considered to be SRO replacement units. If non-market units targeted for families and SNRF units are excluded, the total singles stock in the Downtown Core decreased by -52 units between June 2005 and June Looking over a longer period, non-market additions since January 1991 have been sufficient to offset the 24 percent reduction in the SRO stock and to increase the total singles stock by 95 units (1 percent). Change in the Low-Income Stock, Downtown Core, Period SROs SNRFs Non-Market Total Total Low- Income Stock Non-Market Singles Total Singles Stock (SROs & Non-Market Singles) 2005*- 2007* * -1, ,446 +1,142 +1, * -1, ,577 +1,102 +1, * June 2005 & June 2007 SRO replacement housing involves not only the total number of units, but also their quality and cost. One way of monitoring this is to look at the change in the stock that is financially accessible to singles on social assistance by adding together the singles non-market stock to the number of SRO units renting at, or below, the maximum shelter rate. Between the 1992 and 2005 surveys, this lowest income stock declined by almost one-third - non-market completions were outpaced by SRO stock losses and rent increases. This downward trend was reversed between 2005 and 2007, largely as the result of this year s increase in maximum shelter component of BC Employment and Assistance (for singles, this increased from $325 to $375 a month). In June 2007, the lowest income stock was back to just under 9,000 units, compared to an estimated 9,100 units in 1992.
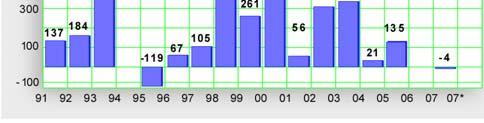
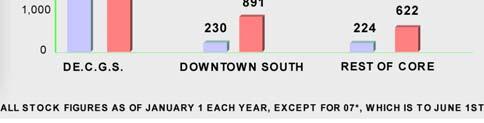
4 2007 Survey of Low-Income Housing in the Downtown Core 4 SRO Vacancy Rates and Rents The overall SRO vacancy rate in May 2007 was 2 percent a major change from the 10 percent vacancy rates in 2005 and Vacancy rates ranged from 3 percent in the Downtown Eastside, Chinatown Gastown, Strathcona (DE.C.G.S.) area, excluding Victory Square), to 0 percent in the rest of the Downtown Core. Two of the factors behind this decline were the Outreach Pilot Project that has helped several hundred street homeless move into SROs, and increasing rents and low vacancy rates in the conventional rental stock. A second major change found in the 2007 survey was that SRO rents had increased significantly, facilitated by the increase in social assistance shelter rates. The average monthly rent for SRO units in the Downtown Core was $389, ranging from $382 in the Downtown Eastside (excluding Victory Square) to $453 in the rest of the Core. Between June 2005 and June 2007, average SRO rents increased by 7.8 percent, compared to 3.1 percent in the previous survey period. By June 2007, 60 percent of units were renting at or below the new shelter rate of $375, compared to 19 percent of SRO units rented at or below $325 a month (the previous shelter rate) in Future Non-Market Completions and SRO Replacement The question of whether the non-market gains will continue to offset future SRO losses depends on both the production of non-market housing and the rate of SRO loss. a) Non-Market Stock In response to SRO losses in the 1990s, the Province and the City stepped up the production of non-market housing in the Downtown Core. The bulge created by these projects was largely completed by the end of 2003, and relatively few non-market units have been completed since then. Earlier this year, however, the Province acquired nine SRO buildings and one market-rental apartment building in the Downtown Core. These are currently being run as market SROs, but decisions on sponsors and renovations are expected later this year. These buildings could add as many as 595 units to the non-market stock this year (although there will be no net gain in the total low-income stock). There are also eleven other non-market projects under construction or in the approval pipeline, with 752 units. Eight of these are new buildings, and three are conversions of existing buildings. Seven projects have free land leases from the City, and one of the new buildings is receiving funding only from the City the Passlin Hotel project. Altogether, these projects will increase the singles non-market stock in the Downtown Core by 1,268 units (23 percent) by the end of The net addition to the nonmarket stock will be less if any of the current non-market projects are removed from stock. b) SROs and Total Stock The rate of change in the SRO stock has been volatile over the last 16 years, with two peak loss years in 1996 and 1997 accounting for a third of the loss over the period. It is not possible to forecast future losses as these will depend on changes in the real estate market, owners decisions, City by-law enforcement, and Council decisions on SRA permits. If SRO units continue to be lost at the average rates since 1991 (85 units a year) and allowing for the conversion of the Province s buildings, scheduled singles non-market projects would be more than sufficient to offset SRO losses. The stock of SRO and non-market singles housing in December 2010 would be around 700 units, or 6 percent higher than in 1991.
5 2007 Survey of Low-Income Housing in the Downtown Core 5 c) Variation by Area There would be some shifts between areas though, as over two-thirds of the singles nonmarket completions will be in the Downtown Eastside area. Assuming that SRO loss rates continue, the Downtown Eastside s low-income stock would increase by 11 percent over January 1991 levels. In Downtown South, the stock would be 2 percent lower than in 1991, and the stock in rest of the Downtown Core would be 29 percent lower. CONCLUSION The total SRO and singles non-market stock declined slightly between June 2005 and 2007, the first decline since the survey period. On the positive side is a large shift in the proportion of the stock affordable to those on social assistance, despite increased rents, and a significant increase in non-market units in the pipeline. These are largely the result of two actions by the Province, the need for which had been identified in previous surveys, the City s Homeless Action Plan, and the Downtown Eastside Housing Plan. The Province increased the shelter component of social assistance for the first time since 1991, and it increased funding for non-market housing, acquiring ten existing buildings and committing funds for the development of two of the sites that the City had set aside for non-market housing. The new shelter rate is still below the 1991 rate in real dollars, and most of the new non-market units are converted SROs, but the Province s actions are a good start. Increasing SRO rent levels and the dramatic decline in the SRO vacancy rates are a concern, as they are indicators of increased demand pressure on a limited stock of low-income housing. And if the real estate market were to continue as it has, redevelopment and conversion pressures on the SRO stock will increase. FINANCIAL IMPLICATIONS There are no financial implications. * * * * *

6 2007 SURVEY OF LOW-INCOME HOUSING IN THE DOWNTOWN CORE HOUSING CENTRE COMMUNITY SERVICES GROUP JULY 2007
7
8 Table of Contents HIGHLIGHTS Introduction Scope and Methodology Definitions and Coverage SROs and SRAs Data Sources Physical Stock Changes Changes in Rents & Clientele Overall Stock and Change Total Stock Change Since Unit Change and SRO Replacement SRO Replacement and Rents SROs Stock Change Since Length of Rentals Vacancy Rates Rental Rates Future Change Non-Market Housing Stock Change Since Non-Market Housing in Process City Funding SNRFs Stock Change Appendix A: Rooming Houses and Residential Hotels, Operating in June Appendix B: Non-Market Housing, June Appendix C: Special Needs Residential Facilities, June 2007 * Appendix D: Alphabetical Listing of Rooming Houses & Residential Hotels Appendix E: SRO Changes Appendix F: Data Tables BIBLIOGRAPHY... 57
9
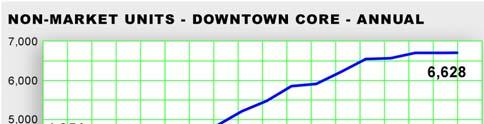
10 2007 Survey of Low-Income Housing in the Downtown Core Page 1 HIGHLIGHTS The Downtown Core has 14,086 low-income units: In June 2007, the Downtown Core contained an estimated 6,628 non-market units, 5,985 single room occupancy (SRO) units, and 1,473 special needs residential facility (SNRF) units. The total low-income stock decreased by 0.3% since June 2005: Between June 2005 and June 2007, the total stock of low-income housing in the Downtown Core decreased slightly, by 40 units. The SRO stock decreased by 183 units (3%), SNRF units increased by 12 units (0.8%), and the net increase in non-market housing was 131 units (2%), with the completion of two new projects. Two of the three sub-areas experienced a net decrease in their low-income stock over the period. SRO replacement stock offsets SRO losses since 1991: Not all non-market units can be considered to be replacement SRO housing. Excluding family non-market housing and SNRF units, there were 52 fewer low-income units in June 2007 than in June 2005 and 95 units (0.8%) more than the stock in January Total non-market housing will probably increase by 20% by December 2010: There are twenty one projects under construction or planned for the Downtown Core as of June 2007 that would increase the non-market stock by 1,347 units over the next three and a half years. The net increase in singles non-market housing would be 1,268 units (23%), assuming that no non-market projects close over the period. Fifty-four percent of those units will be from conversions of twelve existing SROs and one apartment building. Future SRO replacement units will probably maintain the low-income stock: The question of whether these non-market additions will be enough to maintain the stock at or above 1991 levels depends on the future rate of SRO loss. Assuming that the rate of SRO losses continued at the average rate since 1991 (85 units a year) and allowing for closures and re-openings in 2007, scheduled singles non-market completions would more than offset SRO losses. By December 2010, the total stock of SRO and singles non-market housing would be 660 units higher than in The distribution of the stock would change. The Downtown Eastside Chinatown Gastown Strathcona (DE.C.G.S.) area would see more singles completions than SRO losses, so there would be an 11% increase in the low-income stock. The Downtown South would have 50 fewer units in December 2010 than in 1991 and the rest of the Downtown Core would have 290 fewer units. City owns or has leased land for half the stock of non-market units: The City owns and operates 8% of the non-market units in the Downtown Core. Another 45% have been developed on land acquired by the City and leased to non-market sponsors. Seven of the twenty one projects currently in process are on land provided by the City at no charge.
11 Page Survey of Low-Income Housing in the Downtown Core Almost two-thirds of the SRO rooms rent for $375 a month or less: Earlier this year, the maximum BC Employment and Assistance shelter allowance was increased from $325 to $375 a month. The survey found that 60% of units were renting for $375 or less, compared to 19% renting at or below the old shelter rate in Rents are increasing: Average SRO rents over the last two years rose by almost 8%, compared to 3% between 2003 and The average monthly rent for a SRO unit in June 2007 was $389, compared to $361 in Average monthly rents vary from $382 in the DE.C.G.S (excluding Victory Square) to $453 in the rest of the Core. Vacancy rate unusually low: The overall SRO vacancy rate in June 2007 was 2% - significantly lower than the 10% vacancy rate in Previous surveys from 1992 to 2005 found overall Core vacancy rates in the 10% to 14% range. SNRFs: The Downtown Core has 19 special needs residential facilities, with just under 1,500 beds. The stock has remained relatively stable since June Most new SNRF projects have been replacements for older facilities, but the stock has increased by 415 year-round beds since 1991.
 buildings are rooming houses and residential hotels containing small single rooms, usually about ten by ten feet in size.")

12 2007 Survey of Low-Income Housing in the Downtown Core Page 3 1. Introduction Figure 1: THE DOWNTOWN CORE AREA Single-room occupancy (SRO) buildings are rooming houses and residential hotels containing small single rooms, usually about ten by ten feet in size. Residents share common bathrooms and sometimes cooking facilities. These SRO units represent the most basic and the lowest cost housing provided by the private market - very little other market housing is available in the same price range. Because the stock generates relatively small income streams, it is also vulnerable to disinvestment and to redevelopment and conversion to higher paying uses. Stock losses are problematic - most of those living in SROs have low to very low incomes and cannot afford better accommodation. Unless they can get into non-market housing, many SRO residents face a choice between living in SROs or on the street. For other SRO residents, renting in the conventional rental market would mean spending most of their income on shelter and transportation. Historically, the Downtown Core (Figure 1) has had the largest concentration of SRO units in the city. Before the 1970s, SRO housing was also widely distributed through other inner-city neighbourhoods such as the West End and Kitsilano. Redevelopment has removed much of the stock in those areas. The Downtown Core has itself experienced major redevelopment over the last 15 years, with its population increasing by 140% since Over threequarters of that increase is related to redevelopment of the Downtown South, False Creek North, and City Gate areas. Although redevelopment and conversion have reduced the area s SRO stock, the Core remains the last concentration of low-rent market housing for low-income single people. The Downtown Core s low-income housing has been of public concern for over 50 years. In the 1940s and 1950s, the focus was on the poor quality of the housing and the effects of substandard housing on the health of its inhabitants and the economic health of adjacent areas, particularly the central business district. 1 These concerns gave rise to the large-scale urban renewal projects of the 1950s and 1960s. By the early 1970s, conditions had changed - the first urban renewal schemes had been implemented, Federal funding for urban clearance projects had disappeared, and the Downtown office boom had begun. Concern shifted to 1 See Marsh (1950), Wade (1993), and Vancouver, City, Planning Dept (1981) retaining and upgrading the remaining SRO stock 2 and to replacing it with more livable non-market housing units. This remains the focus of concern today. The City and other agencies have monitored the SRO stock since the early 1970s. Differences in the areas surveyed, the types of buildings included, and the definitions of uses and rooms made those surveys difficult to compare. To provide a consistent and accurate picture of change, in 1991 the City began a series of comprehensive surveys of SRO stock levels, rents, and vacancy rates. These surveys have been repeated every two years, and this is the eighth report on the low-income housing stock. The report uses past surveys and other data to examine the lowincome stock at the beginning of June 2007 and the changes in the stock since Change over the period is covered in appendices. 2 The tension between the goals of adequate and affordable housing is noted in Appendix E. If revenue streams are static and costs are rising, attempts to increase safety and quality can lead to less affordable housing, through rent increases or closures.


 is based on a City By-law and includes market SROs, nonmarket buildings that have SRO units, and self-contained units that are less than 320 sq.ft. in size.")
13 Page Survey of Low-Income Housing in the Downtown Core Three types of housing are covered in this report: Privately owned single-room occupancy (SRO) buildings containing small single rooms, with tenants usually sharing bathroom facilities and occasionally cooking facilities; Non-market or social housing is usually funded through senior government programs and targeted for lower income groups. Residents of many of these units are income-tested, paying 30% of their income on rent. In the Downtown Core, much of the nonmarket housing has been built to replace SRO units and some consists of SRO buildings that have been converted to non-market housing; and Special needs residential facilities (SNRFs) are usually funded by senior governments and are targeted for groups with special needs, such as the physically or mentally challenged. In addition to providing shelter, these facilities provide specialized care services to their residents. The survey does not cover market dwelling units units that are self-contained and for sale or rent at market rates. The terms SRO and SRA are not synonymous. As explained in section 2.2, the term Single Room Accommodation (SRA) is based on a City By-law and includes market SROs, nonmarket buildings that have SRO units, and self-contained units that are less than 320 sq.ft. in size. The survey covers the physical stock of housing and not who lives in SROs. Over the last 15 years, there have been four studies of SRO residents. 3 This year, the City, BC Housing and the Vancouver Agreement will be funding a demographic survey of the residents of SROs and non-market housing in the Downtown Eastside. The results will be available late this year. Listings of the individual buildings that compose the stock are provided in Appendices A, B, and C. Appendix D provides a listing by name of SRO buildings, including all those that have been removed from stock over the last thirty-five years. Appendix E provides an overview of SRO changes in the period, and Appendix F provides data tables of stock and change by sub-area. In this report, the Downtown Core has been divided into three sub-areas as shown in the map below. The DE.C.G.S. area (Downtown Eastside/Chinatown/Gastown/Strathcona) is the area used for community monitoring and policy planning purposes. 4 The section on SRO vacancy rates and rents also splits out data for Victory Square (one of the seven DE.C.G.S. sub-areas), as this area has its own policy plan. 5 Figure 2: DOWNTOWN CORE SUB-AREAS The second section of this report provides more detailed descriptions of the housing covered by the survey, and reviews data sources, definitions, and methodology. Section 3 provides an overview of the low-income stock and change. Subsequent sections provide more detailed information on SROs, non-market housing, and SNRFs. 3 The Downtown Core Housing Project: A Community Self-Portrait, Oct 2000, Main & Hastings Society & TRAC; & L. Butt SRO Hotel Residents of Downtown Vancouver, 1991; Hotel Residents of Downtown South, 1991; and Residents of Victory Square, See 2005/06 Downtown Eastside Community Monitoring Report, 10 th edition, City Planning Dept. 5 See Victory Square Policy Plan, Central Area Planning, 2005
 housing is defined as privately owned buildings containing three or more rented single-room occupancy units.")


14 2007 Survey of Low-Income Housing in the Downtown Core Page 5 2. Scope and Methodology 2.1 Definitions and Coverage For the purpose of this report, single room occupancy (SRO) housing is defined as privately owned buildings containing three or more rented single-room occupancy units. The SRO stock is usually divided into residential hotels, which have a license for a pub or lounge, and rooming houses, which are not licensed and have considerably fewer units on average. A typical SRO unit consists of one room about ten by ten feet, with no private bathroom. Residents share common bathrooms and sometimes cooking facilities. SRO units without cooking facilities are called sleeping units; those with cooking facilities (a fridge, stove/hot plate, and sink) but no three-piece bathroom are housekeeping units. Some SRO buildings have self-contained units and/or units with two rooms, as well as single-room units. In this report double rooms are included as part of the SRO stock, but self-contained units are excluded with one exception. Where a SRO building has been converted into self-contained units without major increases in room size, the units remain part of the stock. The Lotus Hotel renovations, for example, added 3-piece bathrooms in all units, but the Lotus remains in the inventory. With few exceptions, SRO residents have low to very low incomes and cannot afford anything better. The minimum market rent tends to be set by the shelter component of BC Employment and Assistance, which is now $375 per month. Even at this level, SRO tenants typically pay 60% or more of their income for their rooms. The distinction between tourist and SRO residential hotels is not clear-cut. Most tourist hotels can be distinguished by the physical quality of their rooms, their higher cost, and renting only on a daily basis. However, the lowest quality budget tourist hotels can be hard to distinguish from the highest quality residential hotels. Seasonal changes are also problematic - rooms may be let daily to tourists in the summer, reverting to weekly or monthly rentals in the winter. Hotels may also have a mix of tourist and residential rooms. While hotels that serve tourists exclusively are excluded from the survey, mixed hotels are included and all their rooms are counted in the inventory. If the building has been converted to entirely tourist use since 1991 and is now going back to some monthly rentals, only the monthly rentals are included in the survey. In recent years, there has also been an increase in hostel or backpacker accommodation aimed at the lowest end of the tourist market younger tourists willing to share rooms. Hostels usually have two or more beds per room, sometimes as bunk beds. When a hostel has rooms rented monthly to single individuals, only those rooms are included in the survey. Again, the distinction between tourist and residential use is not always clear. In some cases, people with no other permanent residence are renting beds in shared rooms on a monthly basis - and paying the welfare shelter rate for each bed. SRO housing is low-income housing by default; non-market housing is usually purpose-built for lower and moderateincome groups and funded under senior government housing programs. Sponsors of non-market housing projects enter into operating agreements with senior governments or housing agreements with the City. These agreements specify how the housing will be operated, who can live in them, the ongoing subsidies that will be provided to the project, and the rents that tenants will pay. The proportion of non-market units actually occupied by the lowest income or core-need households varies depending on the program under which the projects were funded.


 or that have land leases from the City requiring some or all of the units to be rented at lower-than-market rents are treated")


 are funded by senior governments and provide self-contained units or, more commonly, shared accommodation.")
15 Page Survey of Low-Income Housing in the Downtown Core report, all emergency shelters are also defined as SNRFs, although the Zoning and Development By-law defines them as social service centres. Generally, SNRFs provide housing for a range of income groups - resident selection is based on medical and social factors, rather than on income. However, many of the SNRFs provide shelter for SRO residents, and the line between SNRF units and other types of housing is blurred. For example, the Union Gospel Mission and Triage on Powell have both non-market housing and SNRF beds. Other non-profit projects have been developed or acquired without funding from Federal/Provincial housing programs. Those projects that are owned by the City (such as the Old Continental) or that have land leases from the City requiring some or all of the units to be rented at lower-than-market rents are treated as non-market units. Projects owned by non-profit societies, such as Central City Mission s Abbott Mansions and Cosmopolitan Hotel, are treated as SROs rather than non-market housing, as their ongoing role as non-profit housing is not guaranteed by legal agreements. Most of the city s nonmarket housing consists of self-contained units, but some SRO buildings in the Downtown Core are operated as non-market housing. For example, the Granville Residence and the Gresham were market SROs before being bought by the City and renovated to re-open as non-market housing. Conversions of SRO buildings to non-market housing may involve relatively little renovation or substantial renovations that create larger, selfcontained units. Special need residential facilities (SNRFs) are funded by senior governments and provide self-contained units or, more commonly, shared accommodation. The major difference between SNRFs and non-market housing is that SNRFs provide support services and/or medical care for those who cannot live independently. For the purpose of this In January 2004, the Zoning & Development By-law was changed to move seniors congregate housing (in which services such as 24-hour emergency response, meals, housekeeping, and assistance with bathing/mobility are provided) from being a SNRF use to being a residential use (seniors supportive or assisted housing). As the approved use of buildings built before 2004 remains unchanged, they remain as SNRFs in this report. 2.2 SROs and SRAs In October 2003, Council enacted the Single Room Accommodation (SRA) By-law to regulate the conversion and demolition of single room accommodation in the Downtown Core. Under the By-law, the conversion or demolition of a building with designated SRA rooms must be approved by Council. In deciding whether or not to approve a SRA permit, Council must consider the accommodation available to the tenants affected, the general supply of low-cost accommodation in the Downtown Core, the condition of the building, and the need to replace or improve SRAs. Council may attach conditions to a permit, including a fee of $15,000 per room 6 to be used for replacement housing. The buildings initially designated as SRAs by the By-law included all the rooming houses and residential hotels in the Downtown Core, together with all non-market housing with rooms or studio units less than 320 sq. ft. The By-law included buildings and rooms that had been closed due to fire or other reasons, as these rooms could re-open as SRAs. Properties thought to have been converted to other uses before By-law enactment were also included (the owners of such buildings could apply to Council to exempt these rooms - most have now been exempted and removed from the SRA list). So the term SRA unit is more encompassing and inclusive than SRO unit, as the former includes nonmarket units and small self-contained units. 6 Increased from $5,000 in June 2007
16 2007 Survey of Low-Income Housing in the Downtown Core Page Data Sources The non-market housing data used in this report comes from a Housing Centre inventory covering all non-market housing projects in the city. Information on SNRFs as defined by the Zoning and Development By-law comes from a Social Planning inventory. Information on the SRO stock has been assembled from a variety of sources. Interviews with building managers during May 2007 provided information on occupied and vacant units, rental terms, and rental rates. In the 2007 survey, we were unable to obtain information from the managers of six buildings with 113 units (2% of all units). For buildings where contact could not be made, unit information was derived from previous surveys and City records, and the buildings are excluded from vacancy rate and rent figures. Where the survey indicated a change in the number of units in a SRO, the records for that building were checked to establish whether there had been a real change or whether the figures were more accurate information. If no reason for a change could be established, we have assumed that the previous figure was in error and corrected the current and old stock figures. Consequently, the figures in this report may differ slightly from those previously published. 2.4 Physical Stock Changes Changes in the SRO stock can occur through: Redevelopment - many rooming houses generate low returns, are on land zoned for more intensive use, and are vulnerable to redevelopment as the real-estate market changes ; Closure The City s Fire, Building, Standards of Maintenance, and Health By-laws require the physical condition of SRO units to meet specified levels. If buildings do not comply, the City can order their closure. Units can be temporarily removed from the stock while the owner renovates the building, or upgrading costs may lead the operator to close some or all the SRO operation on a long-term basis. Units may also be closed voluntarily by owners for various reasons, without any regulatory pressure from the City; Fire - this has been one of the major causes of SRO loss, affecting both operating buildings and those that have been closed; and Renovations/conversions - units can be temporarily removed because of renovation or permanently removed if there is a change of use. The objective of the survey is to capture all sources of physical change, including those associated with renovations, conversions to other uses, closures, and demolitions. For example, where an SRO is acquired and operated as a non-market housing project, this is treated as both a SRO loss and a non-market gain. If the building subsequently closes and re-opens as an SRO (as happened with the New World Hotel), it is treated as a non-market loss and a SRO gain. In terms of timing, a loss in the SRO stock is treated as occurring when the rooms are closed, rather than when they are physically removed from the stock. For example, the Richards Rooms (520 Richards) closed in 1994 and is treated as a 1994 loss, although not demolished until If a closed building re-opens, it is treated as an addition back to the stock. The stock figures at any point in time are based on the number of units being rented or available for residential rental. Units that are being used for other purposes or that have been withdrawn from the rental stock are classified as closed (as long as they could physically be re-opened for residential rental) and are excluded from the stock figures. If the conversion to other uses precludes them from reopening, the buildings are no longer classified as SROs. The Hotel Strathcona, for example, was closed in 1974 but remained on the inventory as a closed SRO until 2007, when work began on conversion to condominiums.


17 Page Survey of Low-Income Housing in the Downtown Core 2.5 Changes in Rents & Clientele Other changes in the stock can occur without any change in the number of rooms available for rent. Two of the most important of this kind of change are changes in rents and changes in clientele/tenant selection. SRO rents have been increasing, partly as a reflection of increased costs and partly as a result of demand from students and single low-wage service workers. Increasing rents and low vacancy rates in the conventional marketrental stock, and the increasing number of public and private educational facilities downtown, have increased the attractiveness of SROs for those groups, as a way of reducing transportation and shelter expenses. SROs that have been physically upgraded and that have restrictive tenant selection are more attractive to foreign and Canadian students and the working poor. The issue of SROs that will only rent to certain groups became significant in terms of numbers in the survey period. Chinese benevolent societies have always restricted rentals to elderly Cantonese-speaking tenants, but over the last few years some SROs have begun marketing themselves as studentonly housing. 7 Other SROs may not rent to those with problems related to addiction. stock that those with the lowest incomes (social assistance) could afford. While homelessness and increasing rents are major concerns, they are not the only concerns. Even with the rent increases over the last ten years, the SRO stock remains the lowest-cost market-rental stock in the city. It continues to serve those with low-incomes, including the working poor, who cannot afford to rent in the conventional market-rental sector. In a market economy, each income group gets the housing that higher income groups do not want. Students, lowwage service workers, and seniors all have low incomes, but their incomes are sufficient to outbid non-senior singles who are on social assistance. This is not surprising as until this year, social assistance rates had been frozen for 15 years. Even with the increase announced this year, in constant dollars the new rate is still 15% lower than 1991 shelter component of social assistance. Using rents to define the low-income stock would ignore the needs of other low-income groups, and it could misdirect policy discussion by focusing on stock change - even though the factors that have been affecting affordability are largely related to income and macro-economic changes. 9 The City has some powers to regulate the physical aspects of the low-income stock, but it does not have the power to regulate rents, to determine which residents can occupy buildings, or to significantly affect real estate cycles. Municipalities cannot hope to influence housing supply (through either regulation or public investment) on a scale sufficient to make up for frozen income assistance rates, nor can they take on the Province s responsibility to provide adequate income assistance and affordable housing. The Downtown Low-Income Survey covers price changes, and to a lesser extent changes in tenant selection, as characteristics of the low-income stock - it does not use them to define the stock. This has been criticized by one group as an error that renders the survey results inaccurate. 8 This would be correct if the survey s focus was only on the 7 In two cases (The Belmont and The Creekside), the buildings had been shut for almost 30 years before being re-opened as student housing. 8 Pivot Legal Aid Society, 2006a & 2006b 9 Changes in the real estate and labour markets over the last five years have severely reduced the affordability of all the ownership and rental stock in the Lower Mainland and BC. It is also worth noting that accurate rent data is the hardest element to collect in the survey. In the past, the survey has focused on average rents and the number of rooms renting for $325 or less. While there is a time series going back to 1991 for those two elements, the time series on individual room rents goes back only a few years.


18 2007 Survey of Low-Income Housing in the Downtown Core Page 9 3. Overall Stock and Change Figure 4: LOW-INCOME HOUSING BY SUB-AREA, JUNE Total Stock As of June 2007, the Downtown Core contained an estimated 14,086 SRO, non-market, and SNRF units. About 42% of the units are SROs, 47% are non-market units, and the remaining 10% are SNRF units. The rest of the area s housing stock (about 17,700 units, based on the 2006 Census) consists of either self-contained market-rental or owner-occupied dwelling units. Table 1: DOWNTOWN CORE LOW-INCOME STOCK, JUNE 2007 Most of the Downtown Core s low-income units are in the DE.C.G.S., which has 79% of all units. Another 12% of the units are in the Downtown South sub-area, and the remaining 9% are in the rest of the Downtown Core. The different types of low-income housing are not evenly distributed among the areas, and the mix of low-income units in the sub-areas differs, as shown in Figure 4. Figure 3: DOWNTOWN CORE LOW-INCOME STOCK, JUNE Change Since 1991 Between June 2005 and June 2007, the stock of lowincome housing in the Downtown Core fell by 40 units, or -0.3%, compared to a gain of 371 units (2.7%) over the previous two-year period. The low-income stock in the DE.C.G.S. and the rest of the Downtown Core fell by 0.4% and 5.4% respectively. The Downtown South low-income stock increased by 4.8%. Table 2: LOW-INCOME STOCK, JUNE 2005 JUNE 2007


 is in the DE.C.G.S. sub-area. Both were completed in 2005.")


19 Page Survey of Low-Income Housing in the Downtown Core The net loss in the SRO stock over the period was 183 units compared to 246 in the previous survey period. Twentynine percent of the SRO losses were the result of voluntary closures by the owners, and another 20% were closures required by the City for by-law violations. The next largest source of losses (42 units) was partial conversions to hostel use. Almost of the SRO gains came from the re-opening of four closed SROs. Two non-market projects were completed with a total of 135 units, slightly lower than the 166 units completed in the previous survey period. One project was the City-owned Granville Residence in Downtown South; the other project (the Smith-Yuen Apartments) is in the DE.C.G.S. sub-area. Both were completed in The only other change was a loss of four units in the Grace Mansion project. The SNRF stock had a net increase of 12 units, compared to an increase of 272 units in the previous survey period. Between January 1991 and June 2007, the total low-income stock in the Downtown Core increased by 1,102 units or 8.5%, with only the Downtown South experiencing a decrease (-5.6%). 3.3 Unit Change and SRO Replacement Not all of the non-market housing in the Downtown Core can be considered replacement SRO housing. Almost all SRO residents are single, so excluding family units produces a more appropriate measure of SRO replacement housing. SNRF units have also been excluded as resident selection is based mainly on factors other than income and some of the units are beds rather than rooms. Adjusted to exclude SNRFs and family non-market housing, the loss in low-income housing between June 2005 and June 2007 increases from -40 to -52 units. The net change in units over the longer period from January 1991 to June 2007 shifts from a gain of 1,102 units to a gain of 95 units. The stock increased only in the DE.C.G.S., falling slightly in the Downtown South and by almost one-third in the rest of the Downtown Core (left-hand side of Figure 5). Looking at change since 1970 (the right-hand side of Figure 5), the total net loss in the stock has averaged about 60 units a year the combined SRO and singles non-market stock declined by 2,300 units (17%) between January 1970 and June Figure 5: SRO & SINGLES NON-MARKET HOUSING, DOWNTOWN CORE, JANUARY JUNE 2007

 between June 2007 and December 2010")

.")

, increasing the stock by a total of 1,360 units by December 2010 (column C).")

 Putting the two together (column E), non-market")
20 2007 Survey of Low-Income Housing in the Downtown Core Page 11 About 950 of the SRO units lost since 1970 were lost because they were converted to non-market housing. The rooms in converted SRO buildings may not differ in size from those in the market sector, but management and maintenance should be at least as good as the best SRO buildings, their rents are subsidized, and they are less likely to be subject to redevelopment. If current non-market projects proceed as assumed, 10 the singles non-market stock in the Downtown Core will increase by an estimated 1,268 units (23%) between June 2007 and December 2010 (Figure 6). Six hundred and eighty-four units will be completed this year 87% of these are in the buildings acquired by the Province in April One hundred and thirty-five units are scheduled to be completed in 2008, 249 units in 2009, and 200 in In total, over half the units will be in converted SRO buildings. conversion of the Province s recently acquired SROs (see section 4.6). For subsequent years, the average rates of change since 1990 have been used. This yields a potential loss of another 660 units by the end of 2010 (column D). Figure 6: SRO REPLACEMENT, JANUARY 1991 DECEMBER 2010 In addition to these scheduled non-market completions, there is also the possibility of non-market losses over the next three years, on either a temporary or permanent basis. As of mid June, there were no closures scheduled and none are incorporated into the figures. Table 3: SRO REPLACEMENT, JANUARY 1991 DECEMBER 2010 For the Downtown Core as a whole, the singles non-market units in the pipeline (column A in Table 3) will add to the small net gain in stock between 1991 and 2007 (column B), increasing the stock by a total of 1,360 units by December 2010 (column C). Whether this will be sufficient to offset future SRO losses over this period depends on the rate at which SROs continue to be lost. For 2007, SRO losses have been estimated using actual change to June 1, past change, anticipated re-openings, and 10 In anticipating non-market gains, we have assumed that decisions on operators and any renovations of the nine SRO and one market-rental buildings acquired by the Province in April will occur later this year and that all the SRO rooms will be converted to non-market (although there will inevitably be some room losses and temporary closures; the number depending on the extent of renovations) Putting the two together (column E), non-market completions would more than offset SRO losses, increasing the total SRO and singles non-market stock by 700 units (6%). Looking at SRO replacement by sub-area, 70% of singles non-market completions will be in the DE.C.G.S. If the area continues to lose SROs at the same rate as in the past, the total stock by the end of 2010 would be 960 units (11%) more than in In Downtown South the non-market singles units under construction will be more than sufficient to offset the losses over the period, but potential SRO losses would produce a 30-unit (2%) decline in the area s low-income


21 Page Survey of Low-Income Housing in the Downtown Core stock relative to 1991 levels. In the rest of the Core, the low-income stock declined between 1991 and June Scheduled additions will not offset that loss, and any more SRO losses will take the stock further below 1991 levels. 3.4 SRO Replacement and Rents SRO replacement involves not only the total number of units, but also their quality and cost. In the SRO stock, increases in rents coupled with static incomes can price the stock beyond the reach of their former occupants. In the non-market stock, rents are either tied to income or to the shelter component of social assistance, and so are usually affordable. 11 Even where non-market units are neither new nor self-contained, better management should improve the quality and safety of the accommodation. Between the 2005 and 2007 surveys, the lowest income stock increased by 41%; an increase almost entirely the result of increased shelter rates. Between the 1992 and 2007 surveys, the increase in the shelter rate and increases in non-market housing have kept the number of units renting at or below the shelter rate almost stable, with numbers declining by 2%. To look at change in the low-income stock that is financially accessible to singles on social assistance, for each of the surveys we have taken the singles non-market stock and added the number of units renting at or below the shelter rate of social assistance (any known student housing falling within that category has been excluded). Between the 1992 and 2005 surveys, the lowest income stock declined by almost one-third, from 9,100 to 6,350 units. Although 1,800 non-market singles units were added, more than twice as many SRO units were either removed from stock or had rent increases that brought rents above the shelter component of social assistance. Figure 7: SINGLES STOCK RENTING AT OR BELOW SHELTER RATE 11 Affordable housing is commonly defined as housing that costs a household less than 30% of its income. Provincial social assistance is not predicated on this definition. To meet the affordability standard, a single person on social assistance would have to be able to rent a unit for $183 a month or less.


22 2007 Survey of Low-Income Housing in the Downtown Core Page SROs Table 4: OPERATING RESIDENTIAL HOTEL & ROOMING HOUSE STOCK, JUNE Stock As of June 2007, the Downtown Core contained 138 operating residential hotels and rooming houses, with 5,985 SRO units available for rent. An additional 20 SROs had been closed and had not been converted or redeveloped to other uses. 12 Eighty-three percent of the open units are in the DE.C.G.S, the Downtown South has 11%, and the rest of the Downtown Core has 6%. Appendix A provides a list of SROs operating in June 2007, sorted by sub-area and address. Closed SRO buildings are listed at the end of that appendix. Appendix D provides a list of past and present SROs sorted by name, including their previous names. Overall, about 32% of SRO units in the Downtown Core are provided by residential hotels (SRO buildings licensed for a pub or lounge on the premises). This proportion ranges from 31% of the units in Downtown South and the DE.C.G.S. to 39% in the rest of the Downtown Core. Figure 8: LOCATION OF SRO BUILDINGS, JUNE There were 740 SRO units either in these closed buildings or that were unavailable for residential rental in operating SROs. These units are excluded from the statistics in this report.
.")


 in the DE.C.G.S., 8 units (1.2%) in Downtown South, and 62 units (15.1%) in the rest of the Core.")


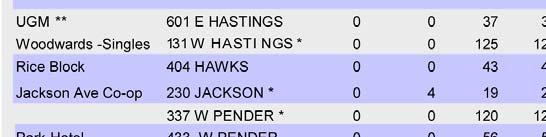
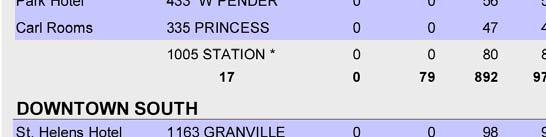
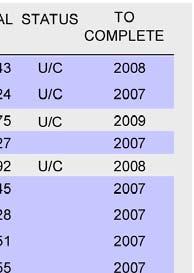
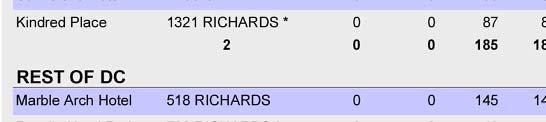
23 Page Survey of Low-Income Housing in the Downtown Core 4.2 Change Since 1991 Between June 2005 and June 2007, 275 SRO units were lost and 92 units gained, for net loss of 183 units (3%). Table 5 provides details on changes involving more than five units. Almost all the SRO gains were associated with the reopening of four SROs that had been partly or completely closed. Fifty percent of the SRO losses were associated with closures 81 units voluntarily closed by owners and 57 units closed by the City for failure to comply with City by-laws. Another 42 units were lost as a result of partial conversions to hostel use. Thirty-one units were lost as a result of fire, 38 units were closed for renovations, and 8 units have closed in anticipation of redevelopment. The net loss in SRO units between June 2005 and June 2007 has been in both the rooming house and residential hotel stock, with a net loss of two residential hotels and 72 rooming house units. Overall, the stock declined by 113 units (2.3%) in the DE.C.G.S., 8 units (1.2%) in Downtown South, and 62 units (15.1%) in the rest of the Core. Table 5: MAJOR SRO CHANGES, JUNE 2005 JUNE 2007 (Changes involving more than five units) DE.C.G.S. ADDRESS NET CHANGE COSY CORNER INN 412 COLUMBIA 7 Re-opened JAY ROOMS 172 E CORDOVA -8 All rooms now closed by owner THE VIVIAN 512 E CORDOVA -24 Closed - fire damage. To re-open in June as non-market housing SEREENA'S PLACE 143 DUNLEVY 58 Re-opened P ACIFIC HOTEL 208 E GEORGIA -12 Rooms being closed by owner CARL ROOMS 575 E HASTINGS -32 Some rooms closed for renovations BURNS BLOCK 18 W HASTINGS -18 Closed by City order 420 HAWKS -7 Fire VETS ROOMS 311 MAIN 9 Re-opened DOWNTOWN BACKPACKERS 927 MAIN -12 More rooms used as hostel OLD AMERICAN * 928 MAIN -37 Closed by owner IVANHOE HOTEL 1038 MAIN -15 More rooms used as hostel PENDER HOTEL 31 W PENDER -36 Closed by owner LUCKY LODGE 134 POWELL 6 PHOENIX APTS 566 POWELL 12 Re-opened DOWNTOWN SOUTH HOMER APTS 335 SMITHE -8 Rooms being closed by owner - condo redevelopment project REST OF DOWNTOWN CORE PICADILLY HOTEL * 622 W PENDER -39 Closed by City order MARBLE ARCH 518 RICHARDS -8 Some rooms closed for renovations HOTEL ST CLAIR 577 RICHARDS -15 More rooms used as hostel *Residentialhotels
24 2007 Survey of Low-Income Housing in the Downtown Core Page 15 Figure 9: CHANGE IN SRO UNITS, JANUARY JUNE 2007 Figure 9 shows the change in the SRO stock since 1991 (for change back to 1970 and time series for the sub-area, see Appendices E and F). Over the past sixteen years, the SRO stock has decreased by 1,890 units, or about 1.5% a year - from just under 8,000 units to the current 5,985 units. The sub-area with the highest rate of loss was the Downtown South, where the stock has fallen by half. The rate of loss was significantly higher in 1997 and in 1998 than during the rest of the decade. Since 1991, the most significant source of loss of SRO units was the conversion of SROs to budget hotels, accounting for 40% of the net loss in units. Conversion to non-market housing was the second most important source of SRO loss, accounting for 15% of losses, almost all in the DE.C.G.S. (the converted units re-appear as non-market gains). Figure 10: NET LOSSES IN SROs, JAN JUNE 2007 Another 162 units have been lost as the net result of the enforcement of City by-laws (Building, Fire, and Health), and 147 units were lost as the result of fires. In the 1990s, relatively few SRO units have been lost to redevelopment and 30% of those losses were to develop new non-market housing. 4.3 Length of Rentals Almost all rooming houses and many residential hotels designate rooms for monthly rentals only. The proportion of rooms rented monthly varies according to demand and seasonal fluctuations in the tourist trade and employment opportunities. Usually, the number rented by the month is highest during the winter months and lowest in the summer, when the tourist season is more lucrative and some regular residents have left the area for seasonal work. 13 Overall, 2% of the Downtown Core SRO stock is rented daily and 98% monthly. The area with the highest proportion of daily rentals (9%) is the Downtown South. Establishing change over time in rental terms is difficult because of differences in survey procedures and coverage. However, the overall proportion of monthly rentals increased from around 85% in 1992 to 96% in This was partly the result of weekly rental or mixed tourist/residential buildings being converted to either all-tourist use (and so excluded from the inventory) or to all monthly rentals. Conversion to and from hostel/backpacker use was a third factor accounting for another 12% of the units (92% of the losses associated with conversions to hotel and hostel were in the DE.C.G.S and Downtown South, accounting for 45% and 66% of their respective total net losses). 13 The SRA By-Law allows up to 10% of SRA rooms to be rented to temporary guests. In June 2007, the By-Law was changed to require operators to identify the specific rooms, if any, that may be rented to tourists.

 accounted for a third of the vacant units.")

25 Page Survey of Low-Income Housing in the Downtown Core 4.4 Vacancy Rates In the survey, managers are asked to indicate the total units vacant, with no distinction made between those rented on a daily/weekly basis and those rented monthly. Combined with significant variations in maintenance, management, and rents, this makes it difficult to compare the vacancy rates for SROs with those for the conventional apartment stock. Vacant SRO units tend to be concentrated in a few buildings. In 2007, four buildings (with 9% of the Core s SRO units) accounted for a third of the vacant units. In the 129 buildings surveyed, 135 units were vacant, giving a vacancy rate of 2.3%. Vacancy rates ranged from 0% in the rest of the Downtown Core to 2.6% in the DE.C.G.S., excluding Victory Square. Table 6: VACANCY RATES (%) - DOWNTOWN CORE SROs Sub-Area Victory Square Rest of DE.C.G.S Downtown South Rest of Core TOTAL The overall vacancy rate for the Downtown Core in May 2007 was a quarter of the vacancy rate in May Combined with the declining base, this means that the number of vacant units has decreased substantially since 1992, when 900 units were vacant. Looking back to 1970 (noting that the surveys over the period cannot be compared directly as there are major differences in the stock, areas, selection techniques, and definitions), there is a downward trend in vacancy rates. Even allowing for the downward trend, this year s vacancy rate is much lower than would have been projected. One reason for the low vacancy rate in 2007 is the Outreach Pilot Project, a City/Province partnership initiated in October This project takes street homeless from the sidewalk and helps moves them into SROs on the same day. This project is continuing, and has helped move over 500 people into SROs, with a retention rate of about 75%. Low vacancy rates and rising rents in the conventional rental market may also be displacing demand into the SRO market. 4.5 Rental Rates With few exceptions, SRO residents cannot afford better accommodation. As single people on social assistance are the major market for SRO units, rents tends to be set by the shelter component of BC Employment and Assistance any rent payments above this must come out of their basic allowance. From 1991 to April 2007, the maximum shelter payment was fixed at $325 per month for an individual. This was increased to $375 in April For single employable persons, the basic allowance was also increased from $185 to $235 per month (about $8 a day). In previous reports, the proportion of units with a monthly rent of $325 or less was reported, calculated using all the rooms for which rent data was collected. By June 2007, 7% of the SRO stock was renting for $325 a month or less, compared to 19% in 2005 and to 72% in The largest absolute decline was between 2001 and 2003 (49% to 27%). Figure 11: INDICATIVE SRO VACANCY RATES


26 2007 Survey of Low-Income Housing in the Downtown Core Page 17 Figure 12: PERCENT OF ROOMS AT $325 OR LESS, , & AT $375 PER MONTH OR LESS, JUNE 2007 UNITS RENTING FOR $325 A MONTH OR LESS, UNITS RENTING FOR $375 A MONTH OR LESS, JUNE % 90% 80% 70% 60% 50% 40% 30% 20% 10% 72% $325 $ SURVEY Y EAR As the shelter component of social assistance is now $375, this is the rent level that will be reported in future surveys. In June 2007, 60% of the units in the Core were renting for $375 or less. Downtown South was the sub-area with the smallest proportion of units renting for $375 or less. CORE VICTORY SQUARE DOWNT OWN SOUT H REST OF DE.C.G.S. REST OF CORE SUB-AREA Table 7: AVERAGE RENTAL RATES, JUNE 2007 Table 7 shows the average monthly rents for each sub-area. The average for the Core is $389, ranging from $382 in the rest of the DE.C.G.S. to $453 in the rest of the Core. In the conventional market-rental sector, average rents for West End studio and one-bedroom apartments were $768 and $948 respectively (CMHC s Rental Market Report, October 2006). In the city, only 110 studio units were renting for less than $400 a month, with 440 renting for less than $500. Average SRO rents increased by 7.8% over the last two years. This is more than double the rent increase of the previous survey period, and the first time in six years that SRO rents have increased faster than rents in the Figure 13: CHANGES IN SRO MONTHLY RENTS AVERAGE RENTS ( ) AND RENT DISTRIBUTIONS ( )


 now require Council approval under the SRA By-law, but buildings can close and re-open without")
27 Page Survey of Low-Income Housing in the Downtown Core conventional market-rental sector. According to CMHC data for October 2004 and 2006, the rents of studio and one-bedroom dwelling units in the West End increased by 6.8% and 5.1% respectively. Figure 14: INCREASES IN MONTHLY SRO RENTS 2001 JUNE 2007 One hundred and nineteen SRO buildings have rent data that can be directly compared between the 2005 and 2007 surveys (Figure 14). Overall, 19% of the units in these buildings saw a decrease or no change in their rents. Twenty-six percent of the units had rent increases of up to 5% per month, and more than a quarter had rent increases over 10%. Compared to the previous two-year periods, a much lower proportion of units had stable rents and a much higher proportion had large rent increases. This reflects building operators taking advantage of increased social assistance shelter rates to increase rents, and demand from non-traditional SRO residents. 4.6 Future Change The rate of change in the SRO stock since 1991 has been volatile, with two years accounting for one-third of the loss over the period. If the Downtown Core were to continue to loose SRO units at the average rate since 1990, about 85 units a year would be lost. This is computed excluding conversions to non-market housing and using average percentage rates of change for each area. For 2007, we have assumed that the net change in the SRO stock will be a gain of 40 units (110 units lost and 150 reopened), plus the loss of the units converted to nonmarket housing, for a total loss of 460 units. For subsequent years, the average rates of loss have been used. Actual SRO losses could be substantially higher or lower, depending on factors such as market conditions, by-law enforcement, and Council decisions on SRA permits. Permanent changes to the SRO stock (redevelopment and conversions affecting the number of SRA units) now require Council approval under the SRA By-law, but buildings can close and re-open without SRA permits. During the rest of 2007, there are 150 units that will probably re-open (see the second section of Appendix A). It is not possible to estimate the number that might close, but there is at least one SRO (Homer Apartments) where units that become vacant are not being re-rented, in anticipation of Council approval of a SRA permit and permits for redevelopment. There are several other projects in the development pipeline that would involve the closure and removal of SROs. In addition, there are the nine SROs acquired by the Province in April. As of June, these were still operating as market SROs with 500 open rooms. In anticipating SRO losses, we have assumed that decisions on operators and any renovations of these buildings will occur later this year.


 account for almost half the non-market single-room units.")

28 2007 Survey of Low-Income Housing in the Downtown Core Page Stock 5. Non-Market Housing As of June 2007, the Downtown Core had 6,628 nonmarket housing units, accounting for 31% of the city s stock of non-market housing. Seventy-eight percent of the Downtown Core's non-market units are in the DE.C.G.S. and 13% are in the Downtown South. Appendix B lists the individual non-market projects, sorted by sub-area. Table 8: OCCUPIED NON-MARKET HOUSING, JUNE 2007 Residential Units Area Projects Total Rooms Studio 1-Bed 2+Bed DE.C.G.S. 72 5,115 1,159 1,720 1, Downtown South Rest of Core TOTAL 91 6,628 1,306 2,214 1,852 1,256 REST OF CITY 14, ,633 4,207 3,470 In the rest of the city, all but a handful of non-market units are self-contained dwelling units. In the Downtown Core, one in five non-market units are SRO-type rooms. The Core also has a higher proportion of studio/bachelor units (33% of the stock) than the rest of the city (24%). Almost 900 of the Downtown Core s non-market units have been created through conversions of market-rental SROs and apartment buildings. Converted SROs (such as the Sunrise, Washington, and Europe Hotels) account for almost half the non-market single-room units. The rest of the rooms in non-market projects were purpose-built; mainly in the 1970s and early 1980s (see Appendix E). The high proportion of small units in the Downtown Core reflects the clientele for whom the housing is targeted - single individuals in deep core need. As Table 9 shows, less than one in five units in the Downtown Core are targeted for families with children, and most of these are in Strathcona or False Creek North. In the rest of the city, almost half the non-market housing is for families. Thirtyeight percent of the Downtown Core units are targeted for seniors and the remaining 44% are targeted for other groups (mainly singles, including the mentally or physically disabled). Figure 15: LOCATION OF OCCUPIED NON-MARKET PROJECTS, JUNE 2007


. About 23% of the increase was in units for families.")


29 Page Survey of Low-Income Housing in the Downtown Core Table 9: NON-MARKET STOCK BY TYPE, JUNE 2007 Seniors Families Other Area Units % Units % Units % DE.C.G.S. 2,016 39% % 2,292 45% Downtown South % 0 0% % Rest of Core % % 34 5% TOTAL CORE 2,524 38% 1,242 19% 2,862 43% Since January 1991, the total stock of non-market housing in the Downtown Core has increased by 2,577 units or 64% (Figure 16 and Appendix F, Table F2). About 23% of the increase was in units for families. There was an increase of 1,985 units that could be considered to be potential SRO replacement units. Just over half of the net increase in the city s non-market housing over the period was in the Downtown Core. REST OF CITY 5,645 38% 7,086 47% % 5.2 Change Since 1991 Between June 2005 and June 2007, two nonmarket projects with 135 units were completed in the Downtown Core. One of these projects was the Granville Residence, a SRO hotel that the City bought in The 100 SRO units in the building were converted into 83 dwelling units. Funding for the purchase and renovation costs came from development cost levies, with no senior government funding. Table 10: NON-MARKET CHANGE, JUNE 2005 JUNE 2007 Name Address Total Seniors Families Other DE.C.G.S. Smith-Yuen Apts 475 E Hastings * Grace Mansion 596 E Hastings DOWNTOWN SOUTH Granville Residence 1261 Granville * TOTAL * City-owned sites One other new project was completed over the period - the Smith-Yuen Apartments. The only other change was the conversion of Grace Mansion from a seniors to a supportive housing project, owned and operated by the Salvation Army, with a loss of four units. The net increase in the stock was 131 units (1.9%), all of which are targeted for single people, including street youth and those at risk of homelessness. This compares to an increase of 345 units over the previous survey period. 5.3 Non-Market Housing in Process At the beginning of June, there were seven non-market projects under construction in the Downtown Core (Table 11), with a total of 428 units. Four of these involve new buildings, and three are conversions of existing buildings. Four other new construction projects with 324 units are in development pipeline. In addition, there are ten buildings that the Province bought earlier this year (nine SROs and one market-rental building) with a total of 595 units. As of June, these buildings were still operating as market SROs with 500 open SRO units. Selection of non-profit operators and decisions on renovations will probably occur later this year. Assuming that the conversion of the province s buildings proceeds this year with no unit loss associated with renovations, and assuming no non-market closures, units will be completed this year, 135 units in 2008, 324 units in 2009, and 200 units in The non-market stock in the Downtown Core would increase by 20% over the next three years. Ninety-four percent of these units can be considered to be SRO replacement units. 14 As of mid June, there were no closures scheduled and so none are included into the figures on non-market change to 2010.


30 2007 Survey of Low-Income Housing in the Downtown Core Page 21 Figure 16: CHANGE IN NON-MARKET STOCK Table 11: NON-MARKET HOUSING IN PROCESS, JUNE 2007


")
31 Page Survey of Low-Income Housing in the Downtown Core 5.4 City Funding The City provides assistance for non-market housing in a variety of ways. As of June 2007, the City of Vancouver owned and operated 8% of the non-market units in the Downtown Core. An additional 45% of the occupied nonmarket units are on land acquired by the City and leased to non-market sponsors. Two-thirds of the nineteen projects completed since 1999 are on land owned by the City. Of the twenty-one projects currently in process, seven projects with 45% of the units have free land leases from the City, and another project is being funded entirely by the City. The latter is the 46-unit Passlin Hotel project, which is part of the larger L Hermitage condo project. That project involved the redevelopment of the Passlin SRO, and the developer is providing the City with a turn-key building in return for development permission, additional density, and funding from Downtown South DCLs. The total City contribution was $5.8 million in bonus density and DCLs. In addition to the projects currently in the pipeline, at mid- June 2007 the City owned seven sites (including the recently acquired Drake Hotel) designated for non-market housing (mainly for singles). The City also has options to purchase seven other sites for family and non-family units (see Figure 17). These sites are waiting for senior government funding. Figure 17: NON-MARKET PROJECTS IN PROCESS & SITES RESERVED FOR NON-MARKET HOUSING, JUNE 2007

 with a capacity of 1,473 beds, representing about a")


 that replaced the shelter at 108 W Hastings.")
32 2007 Survey of Low-Income Housing in the Downtown Core Page Stock 6. SNRFs As of June 2007, the Downtown Core had 19 special needs residential facilities (SNRFs) with a capacity of 1,473 beds, representing about a fifth of all SNRF beds in the city. These facilities are listed in Appendix C. Just over two-thirds of the Downtown Core s SNRF units are in the DE.C.G.S. The Downtown South and the rest of the Downtown Core each have two projects, accounting for 7% and 24% of the units respectively. In terms of clientele, some of the units are for those requiring emergency shelter, some are for people with psychological or substance abuse problems, and the others provide intermediate or personal care for the elderly. 6.2 Change One new facility opened in the Downtown Core in the period from June 2005 to June the Salvation Army s Beacon shelter (138 E Cordova) that replaced the shelter at 108 W Hastings. The only other change was a loss of 13 beds at Belkin House as a result of renovations. For the Downtown Core as a whole, the number of SNRF beds increased by 12 units over the period. Figure 18: SNRFs (INCLUDING SHELTERS) IN THE DOWNTOWN CORE, JUNE 2007


; and Triage replaced its old facility")


.")
, the three-year program provided capital and other funding for")
33 Page Survey of Low-Income Housing in the Downtown Core Figure 19: CHANGE IN SNRF UNITS, JANUARY 1991 JUNE 2007 Since January 1991, the SNRF stock in the Downtown Core has increased by 415 year-round beds, 15 an increase of 39%, most of which occurred between 2001 and Only the Downtown South has seen a decrease in units. review process the proposed Union Gospel Mission project at 601 E Hastings has shelter beds and SRF units, as well as transitional housing. If approved, the project would be completed by In addition to the increased number of beds, there have also been new facilities replacing existing facilities the old Victory House on Powell Street was replaced by the new building at 353 E Cordova; the new Central City Lodge at 415 West Pender was a replacement for its old building at 233 Abbott (now converted to condos); and Triage replaced its old facility at 906 Main with a new building on Powell, sharing the site with the Windchimes non-market project. These three facilities represent a significant upgrading of almost 20% of the SNRF beds in the area, but produced no net change in total units. At the beginning of June 2007, there were two projects that should add to the Downtown Core s SNRF stock this year a 16-bed increase at Vancouver Harbour Light and 12 beds as part of the conversion of the West Inn to the Onsite Residence. One new SNRF project is in the development 15 Since 2001, temporary emergency shelter beds (open between November and April) have also been provided, as part of the Greater Vancouver region s cold wet weather strategy. These have been mostly funded through the Supporting Communities Partnership Initiative (SCPI). In response to the increase of homelessness in Canada s major cities, the Federal government set up SCPI in Operating through Human Resources Development Canada (HRDC), the three-year program provided capital and other funding for services and shelter for the homeless - about $24 million for the Vancouver region. The program was extended for three more years, and replaced in 2007 with the Homeless Partnership Initiative, with $8 million a year for the region. SCPI/HPI projects require 50% funding from other partners.
34 2007 Survey of Low-Income Housing in the Downtown Core Page 25 APPENDICES
35 Page Survey of Low-Income Housing in the Downtown Core Appendix A: Rooming Houses and Residential Hotels, Operating in June 2007 The first section of this appendix covers SROS that were operating (renting rooms as permanent residential accommodation) as of June 1, 2007; the second section lists SROs that were entirely closed or being used for other purposes, but that could reopen as SROs. Units identified as closed are those units not available for residential rental. SROs that have been demolished or converted to other uses are listed only in Appendix D DWELLINGS SRO UNITS NAME ADDRESS OPEN CLOSED CLOSED OPEN A) OPEN SRO BUILDINGS 2001 PUB SEATS DE.C.G.S. WINTER'S RESIDENCE 203 ABBOTT 92 DOMINION HOTEL 210 ABBOTT METROPOLE HOTEL 320 ABBOTT ABBOTT MANSIONS 404 ABBOTT 72 LOTUS HOTEL 455 ABBOTT ALEXANDER COURT 90 ALEXANDER 9 44 ROSS HOUSE 313 ALEXANDER 17 7 SEAVIEW APARTMENTS 362 ALEXANDER 36 DECKER RESIDENCE 504 ALEXANDER 1 37 PHOENIX APARTMENTS 514 ALEXANDER 18 LAUREL APARTMENTS 610 ALEXANDER 42 STAR BEACH HAVEN 658 ALEXANDER 19 TRIPLE SIX 666 ALEXANDER 7 4 DANNY'S INN/ROOMS 317 CAMBIE 18 MEVILLE ROOMS 322 CAMBIE 9 CAMBIE HOUSE 340 CAMBIE ST. ELMO HOTEL/ROOMS 429 CAMPBELL 2 18 GLORY HOTEL 204 CARRALL 42 WEST HOTEL 488 CARRALL NEW COLUMBIA HOTEL 303 COLUMBIA YIN PING BENEVOLENT SOC. 414 COLUMBIA 14 COSY CORNER INN 412 COLUMBIA 7 WONDER ROOMS 50 E CORDOVA 39 CORDOVA'S RESIDENCE 56 E CORDOVA 1 34 UNITED ROOMS 139 E CORDOVA 44 HILDON HOTEL 50 W CORDOVA TRAVELLER'S HOTEL 57 W CORDOVA 59 SEREENA'S PLACE 143 DUNLEVY 58 PACIFIC HOTEL 208 E GEORGIA E GEORGIA 14 ARNO ROOMS 291 E GEORGIA 34 Appendix A: Downtown Core SROs June 2007, Sorted by Area & Address
36 2007 Survey of Low-Income Housing in the Downtown Core Page 27 DWELLINGS SRO UNITS NAME ADDRESS OPEN CLOSED CLOSED OPEN CATHAY LODGE 533 E GEORGIA PUB SEATS 630 E GEORGIA 5 6 GEORGIA ROOMS 634 E GEORGIA E GEORGIA 2 3 DODSON ROOMS 25 E HASTINGS SHALDON HOTEL 52 E HASTINGS 55 HASTINGS ROOMS 103 E HASTINGS 16 BRANDIZ HOTEL 122 E HASTINGS BALMORAL HOTEL 159 E HASTINGS REGENT HOTEL 160 E HASTINGS ROOSEVELT HOTEL 166 E HASTINGS 45 EMPRESS HOTEL 235 E HASTINGS TOI SHAN BENEVOLENT 237 E HASTINGS 33 BELMONT STUDENT RESIDENCE 241 E HASTINGS 17 MT EVEREST ROOMS 244 E HASTINGS 25 AFTON HOTEL / ROOMS 249 E HASTINGS 38 SAVOY HOTEL 258 E HASTINGS WALTON HOTEL 261 E HASTINGS 50 SUNWEST HOTEL 341 E HASTINGS 25 HAZELWOOD HOTEL 344 E HASTINGS HOLBORN HOTEL 367 E HASTINGS 35 ORWELL HOTEL 456 E HASTINGS 55 PATRICK ANTHONY RESIDENCE 561 E HASTINGS 2 67 CARL ROOMS 575 E HASTINGS SHAMROCK HOTEL 635 E HASTINGS 28 ASTORIA HOTEL 769 E HASTINGS WOODBINE HOTEL 786 E HASTINGS E HASTINGS 7 VERNON APARTMENTS 1168 E HASTINGS 32 ST. CLAIR NO E HASTINGS 3 27 BEACON HOTEL 9 W HASTINGS 44 COSMOPOLITAN HOTEL 31 W HASTINGS 40 CHELSEA INN 33 W HASTINGS 32 PALACE HOTEL 35 W HASTINGS GRAND UNION HOTEL 74 W HASTINGS ARGYLE HOTEL/ARGYLE HOUSE 106 W HASTINGS 43 GOLDEN CROWN HOTEL 116 W HASTINGS 28 RICE BLOCK 404 HAWKS 6 37 HEATLEY APARTMENTS 405 HEATLEY 16 INTERNATIONAL INN 120 JACKSON 2 21 B.C. ROOMS 306 JACKSON 1 36 KEEFER ROOMS 222 KEEFER 45 Appendix A: Downtown Core SROs June 2007, Sorted by Area & Address
37 Page Survey of Low-Income Housing in the Downtown Core DWELLINGS SRO UNITS NAME ADDRESS OPEN CLOSED CLOSED OPEN LUNG JEN BENEVOLENT 240 KEEFER PUB SEATS 542 KEEFER 6 KEEFER LODGE 558 KEEFER KEEFER KEEFER 13 MAIN HOTEL/ROOMS (A) 117 MAIN 28 NO. 5 ORANGE 205 MAIN JUBILEE ROOMS 235 MAIN 78 VET'S ROOMS 311 MAIN 9 PACIFIC ROOMS 507 MAIN MAIN 7 CREEKSIDE STUDENTS RESIDENCES 796 MAIN 22 COBALT HOTEL 917 MAIN THORNTON PARK HOTEL 956 MAIN 22 STATION HOTEL 1012 MAIN 32 IVANHOE HOTEL 1038 MAIN NEW SUN AH HOTEL 100 E PENDER 36 CHINESE FREEMASONS 116 E PENDER ASIA HOTEL 139 E PENDER 35 MAY WAH HOTEL 258 E PENDER 120 LEW MAO WAY TONG ASSOC. 349 E PENDER 9 WOO'S ASSOCIATION 359 E PENDER 9 PENDER LODGE 431 E PENDER ARLINGTON ROOMS 577 E PENDER 29 PENDER RESIDENCE 832 E PENDER 3 17 ARCO HOTEL 83 W PENDER 63 SILVER/AVALON HOTEL 165 W PENDER 86 PARK HOTEL APARTMENTS 429 W PENDER 56 GRAND TRUNK ROOMS 55 POWELL 5 20 HAMPTON HOTEL 124 POWELL 46 LUCKY LODGE 134 POWELL 54 YORK ROOMS 259 POWELL 34 LION HOTEL 324 POWELL 76 KING ROOMS 326 POWELL 3 33 CENTENNIAL ROOMS 346 POWELL 13 TAMURA HOUSE 390 POWELL 110 MING SUNG READING ROOMS 439 POWELL 8 POWELL ROOMS 556 POWELL 22 PHOENIX APTS 566 POWELL 12 HAMPTON ROOMS 568 POWELL 1 16 PRINCESS ROOMS 215 PRINCESS 2 43 HARBOUR ROOMS 230 PRINCESS 13 Appendix A: Downtown Core SROs June 2007, Sorted by Area & Address
38 2007 Survey of Low-Income Housing in the Downtown Core Page 29 DWELLINGS SRO UNITS NAME ADDRESS OPEN CLOSED CLOSED OPEN HING MEE SOCIETY 553 PRIOR PUB SEATS LOW YOUNG COURT 406 UNION 1 14 LUCKY ROOMS 468 UNION 2 21 GASTOWN HOTEL 110 WATER 91 COLONIAL RESIDENCE 122 WATER SUBTOTAL ,992 DOWNTOWN SOUTH 803 DRAKE 1 10 SIESTA ROOMS 936 GRANVILLE 3 66 REGAL HOTEL 1046 GRANVILLE 82 VOGUE HOTEL 1060 GRANVILLE 79 HOTEL CLIFTON 1125 GRANVILLE 74 ST. HELEN'S HOTEL 1161 GRANVILLE YALE HOTEL 1300 GRANVILLE CECIL HOTEL 1336 GRANVILLE MURRAY HOTEL 1119 HORNBY CANADIAN HOTEL 1203 SEYMOUR SMITHE HOMER APARTMENTS 337 SMITHE SUBTOTAL REST OF DOWNTOWN CORE DUNSMUIR INTERNL VILLAGE 500 DUNSMUIR 167 DEL MAR HOTEL 553 HAMILTON 30 MARBLE ARCH HOTEL 518 RICHARDS HOTEL ST CLAIR 577 RICHARDS SUBTOTAL TOTAL ,985 B) CLOSED SRO BUILDINGS NAME ADDRESS CLOSED SRO UNITS YEAR CLOSED STATUS DE.C.G.S RAINIER HOTEL 309 CARRALL Being renovated - to re-open this summer (48 units) EVERGREEN ROOMS 333 COLUMBIA Being renovated to re-open with 36 units JAY ROOMS 172 E CORDOVA ONSITE (ex WEST HOTEL) 137 E HASTINGS To re-open this summer PATRICIA HOTEL 403 E HASTINGS 195 Budget tourist hotel CANADIAN NORTH STAR 5 W HASTINGS BURNS BLOCK 18 W HASTINGS PENDER HOTEL 31 W PENDER HARBOURFRONT HOSTEL 209 HEATLEY JACKSON ROOMS 322 JACKSON Appendix A: Downtown Core SROs June 2007, Sorted by Area & Address
39 Page Survey of Low-Income Housing in the Downtown Core B) CLOSED SRO BUILDINGS NAME ADDRESS CLOSED SRO UNITS YEAR CLOSED STATUS BOULDER ROOMS 9 W CORDOVA DE approved in 2007 to convert to condos OLD AMERICAN HOTEL 928 MAIN E PENDER MARR HOTEL 403 POWELL Renovations complete but not yet re-opened DRAKE HOTEL 606 POWELL To re-open this year TOON WO FUNG ROOMS 71 E HASTINGS E HASTINGS UNION Renovations underway UNIVERSAL ROOMS 41 E HASTINGS DOWNTOWN SOUTH STATE HOTEL 876 GRANVILLE REST OF DOWNTOWN CORE PICADILLY HOTEL 622 W PENDER Appendix A: Downtown Core SROs June 2007, Sorted by Area & Address
40 2007 Survey of Low-Income Housing in the Downtown Core Page 31 Appendix B: Non-Market Housing, June 2007 NAME ADDRESS TOTAL UNIT TYPE UNIT SIZE YEAR UNITS SENIOR FAMILY OTHER ROOMS BACH 1BD 2+BD BUILT DE.C.G.S. Alexander Residence 58 ALEXANDER *# Four Sisters Co-op 118 ALEXANDER * Alexander House 176 ALEXANDER The Edge 275 ALEXANDER * Veterans Memorial Manor 320 ALEXANDER * Jim Green Residence 415 ALEXANDER * Jeffrey Ross Residence 510 ALEXANDER * DERA Co-op 638 ALEXANDER * Maria Gomez Place 590 ALEXANDER * Stamp's Place 512 CAMPBELL Chinatown Lions Manor - Ph I 830 CAMPBELL Chinatown Lions Manor- Ph II 830 CAMPBELL Dart Coon Club 490 COLUMBIA Central Residence 42 E CORDOVA Bridge Housing 100 E CORDOVA James McCready Residence 129 E CORDOVA Golden Age Court 145 E CORDOVA St. James Place 340 E CORDOVA Cordova House 368 E CORDOVA Hugh Bird Residence 420 E CORDOVA * Mavis McMullen Place 430 E CORDOVA * Oppenheimer Lodge 450 E CORDOVA # Antoinette Lodge 535 E CORDOVA # Union Gospel Mission 616 E CORDOVA Stanley/New Fountain 35 W CORDOVA * Lore Krill Co-op 65 W CORDOVA * Roddan Lodge 124 DUNLEVY *# Chinese United Church Lodge 430 DUNLEVY Lore Krill Co-op 239 E GEORGIA Happy Manor 551 E GEORGIA W.A. Street Homes 837 E GEORGIA A * Tellier Tower 16 E HASTINGS Appendix B: Non-Market HoUsing in the Downtown Core, Listed by Area
41 Page Survey of Low-Income Housing in the Downtown Core NAME ADDRESS TOTAL UNIT TYPE UNIT SIZE YEAR UNITS SENIOR FAMILY OTHER ROOMS BACH 1BD 2+BD BUILT The Oasis 40 E HASTINGS Sunrise Hotel 101 E HASTINGS Washington Hotel 177 E HASTINGS Smith-Yuen Apartments 501 E HASTINGS * Bill Hennessy Place 501 E HASTINGS * YWCA Crabtree Corner 533 E HASTINGS * Jennie Pentland Place 540 E HASTINGS * Grace Mansion 596 E HASTINGS Shon Yee Place 628 E HASTINGS New Portland Hotel 20 W HASTINGS * Regal Place Hotel 144 W HASTINGS Union Gospel Project 361 HEATLEY * MacLean Park-Phase I 705 JACKSON Chau Luen Tower 325 KEEFER MacLean Park-Extension 350 KEEFER Chinatown Lions Manor II 102 MAIN Ford Building 375 MAIN Bruce Eriksen Place 380 MAIN * China Villa 300 E PENDER Mau Dan Gardens Co-op 400 E PENDER * Lesya Ukrainka Manor 827 E PENDER Rose Garden Co-op 853 E PENDER J. C. Leman Building 27 W PENDER * CBA Manor 32 W PENDER * Pendera 133 W PENDER Europe Hotel 43 POWELL Columbia House 101 POWELL Shiloh House 245 POWELL Cecilia House 315 POWELL * Florence Apartments 329 POWELL * Santiago Lodge 333 POWELL * Sakura-So 376 POWELL Somerville Place 377 POWELL Bridget Moran Place 668 POWELL * Windchimes Apartments 707 POWELL * Princess Place 321 PRINCESS Appendix B: Non-Market HoUsing in the Downtown Core, Listed by Area
42 2007 Survey of Low-Income Housing in the Downtown Core Page 33 NAME ADDRESS TOTAL UNIT TYPE UNIT SIZE YEAR UNITS SENIOR FAMILY OTHER ROOMS BACH 1BD 2+BD BUILT Chinese Freemason's Manor 750 PRIOR Solheim Place 249 UNION Strathcona Co-op 730 UNION Bantleman Court 600 VERNON * SUBTOTAL 5,115 2, ,292 1,159 1,720 1, DOWNTOWN SOUTH Helmcken House 1090 GRANVILLE * Granville Residence 1261 GRANVILLE * Candela Place 1265 GRANVILLE * Old Continental 1390 GRANVILLE *# Jubilee House 508 HELMCKEN * Brookland Court 540 HELMCKEN B'Nai B'Rith Manor 1260 HOWE The Wellspring 415 NELSON * New Continental 1067 SEYMOUR *# Seymour Place 1221 SEYMOUR * Gresham 716 SMITHE *# SUBTOTAL REST OF DOWNTOWN CORE Yaletown Mews 201 ALVIN NAROD * Bridgeview Place 238 DAVIE * Granville House 1515 GRANVILLE Station Park II 1129 MAIN * Station Park I 1189 MAIN * Roundhouse Co-op 1267 MARINASIDE * City Gate Co-op 188 MILROSS* Quayside Family Housing 1010 PACIFIC * SUBTOTAL TOTAL DOWNTOWN CORE 6,628 2,524 1,242 2,862 1,306 2,214 1,832 1,256 * On land leased from the City of Vancouver # Operated by the City of Vancouver A The W.A. Street Homes project consists of seven scattered duplex buildings. Only one address is shown. With SRA designated rooms Appendix B: Non-Market HoUsing in the Downtown Core, Listed by Area
43 Page Survey of Low-Income Housing in the Downtown Core Appendix C: Special Needs Residential Facilities, June 2007 * NAME ADDRESS Number of beds DE.C.G.S. LOOKOUT SHELTER/HAZELTON RESIDENCE 346 ALEXANDER 80 SUCCESS 555 CARRALL 98 VANCOUVER HARBOUR LIGHT 119 E CORDOVA 86 THE HAVEN 128 E CORDOVA 40 THE BEACON 138 E CORDOVA 60 COOPER PLACE 306 E CORDOVA 72 VICTORY HOUSE 353 E CORDOVA** 47 UNION GOSPEL MISSION 616 E CORDOVA 25 CHINESE MENNONITE HOME 485 DUNLEVY 32 CHINESE MENNONITE 333 E PENDER 66 COVENANT HOUSE (VANCITY PLACE) 326 W PENDER ** 44 CENTRAL CITY LODGE 415 W PENDER ** 122 POWELL PLACE 329 POWELL ** 36 TRIAGE EMERGENCY SHELTER 707 POWELL** 28 VILLA CATHAY CARE HOME 970 UNION ** 188 SUBTOTAL 15 1,024 DOWNTOWN SOUTH CATHOLIC CHARITIES MEN'S HOSTEL 150 ROBSON 80 COVENANT HOUSE 1280 SEYMOUR 22 SUBTOTAL REST OF DOWNTOWN CORE YALETOWN HOUSE 1099 CAMBIE 130 BELKIN HOUSE 555 HOMER 217 SUBTOTAL TOTAL IN DOWNTOWN CORE 19 1,473 * Shelters or beds that are open November to March each year as part of the Cold-Wet Weather Strategy are not included (e.g. the 50 beds at the Anchor of Hope, 134 E Cordova). For the purpose of this report, all year-round emergency shelters are also defined as SNRFs, although under the Zoning and Development By-law they may be defined as social service centres. ** On land leased from the City Appendix c: SNRFs in the Downtown Core, Listed by Area
44 2007 Survey of Low-Income Housing in the Downtown Core Page 35 Appendix D: Alphabetical Listing of Rooming Houses & Residential Hotels This appendix is a cross-reference list of named SROs, sorted by name. Where a building has changed its name, the current or most recent name is indicated in the COMMENTS column. If the building has been demolished or converted, this is also noted in the comments. While this listing includes all of the named buildings that have been residential hotels and rooming houses within the Downtown Core in the period, it also includes some buildings that: were/are tourist hotels or all self-contained dwelling units, but appear on previous inventory lists; are outside the Downtown Core, but again sometimes appear on old inventories (these are indicated by an asterix after the name); and were demolished or converted prior to NAME COMMENT ADDRESS ABBOTSFORD HOTEL See DAYS INN 921 W PENDER ABBOTT HOUSE See CENTRAL CITY MISSION 233 ABBOTT ABBOTT MANSIONS 404 ABBOTT ACME ROOMS DEMOLISHED 753 POWELL ADORA COURT See LUCKY ROOMS 468 UNION AFTON HOTEL / ROOMS 249 E HASTINGS AH CHEW HOTEL/ROOMS See ASIA HOTEL 139 E PENDER ALBANY ROOMS See REGAL HOTEL 1046 GRANVILLE ALCAZAR HOTEL TOURIST HOTEL- DEMOLISHED 337 DUNSMUIR ALESIA HOTEL See PHOENIX HOTEL 237 E HASTINGS ALEX ROOMS CONVERTED TO DWELLING UNITS 662 ALEXANDER ALEXANDER RESIDENCE 58 ALEXANDER ALEXANDER Court of Revision 90 ALEXANDER ALEXANDER ROOMS See SEAVIEW APARTMENTS 362 ALEXANDER ALHAMBRA HOTEL CONVERTED TO COMMERCIAL USES 8 WATER ALLEN ROOMS / HOTEL CONVERTED TO RETAIL/OFFICES 810 GRANVILLE ALMER HOTEL DEMOLISHED 610 W CORDOVA ALTER ROOMS DEMOLISHED 620 POWELL ALVIN ROOMS See CORDOVA S RESIDENCE 56 E CORDOVA AMBASSADOR HOTEL (A) 1212 GRANVILLE AMBASSADOR HOTEL (B) DEMOLISHED 773 SEYMOUR AMERICA ROOMS DEMOLISHED 226 POWELL AMERICAN HOTEL See OLD AMERICAN HOTEL 928 MAIN ANCHOR HOTEL See WALTON ROOMS 90 ALEXANDER ANDREW HOTEL/ROOMS DEMOLISHED 952 HORNBY ANGELES ROOMS See DOWNTOWN BACKPACKERS HOSTEL 927 MAIN ANGELUS HOTEL DEMOLISHED 790 DUNSMUIR ANYOX ROOMS See WALMAR ROOMS 67 E HASTINGS ARCO HOTEL / ROOMS 83 W PENDER Appendix D: Alphabetical Listing of Residential Hotels and Rooming Houses
45 Page Survey of Low-Income Housing in the Downtown Core NAME COMMENT ADDRESS ARGYLE HOTEL/HOUSE 106 W HASTINGS ARLINGTON HOTEL / ROOMS (A) 575 E PENDER ARLINGTON ROOMS (B) CONVERTED TO RETAIL/OFFICES 304 W CORDOVA ARNOLD APARTMENTS DWELLING UNITS 1130 GRANVILLE ARISTOCRAT See ARISTOCRATIC ROOMS 634 MAIN ARISTOCRATIC HOTEL / ROOMS DEMOLISHED 634 MAIN ARNO HOTEL / ROOMS 291 E GEORGIA ASIA HOTEL 139 E PENDER ASTOR HOTEL See ASTORIA HOTEL (B) 151 W HASTINGS ASTORIA HOTEL (A) 769 E HASTINGS ASTORIA HOTEL (B) DEMOLISHED 151 W HASTINGS ATLANTIC HOTEL DEMOLISHED 77 W CORDOVA AUSTIN HOTEL CONVERTED TO TOURIST - See RAMADA INN 1221 GRANVILLE AVALON HOTEL / ROOMS See SILVER/AVALON HOTEL 165 W PENDER B.C. ROOMS 306 JACKSON BALMORAL HOTEL 159 E HASTINGS BARRON HOTEL CONVERTED TO TOURIST - See NELSON PLACE HOTEL 1006 GRANVILLE BAY HOTEL DEMOLISHED 621 SEYMOUR BEACON HOTEL / ROOMS 7 W HASTINGS BEECHMONT ROOMS See HAMILTON HOTEL 519 HAMILTON BELLEVILLE ROOMS See WALTON HOTEL 261 E HASTINGS BELMONT HOTEL (A) CONVERTED TO TOURIST - See NELSON PLACE HOTEL 1006 GRANVILLE BELMONT HOTEL / ROOMS (B) See BELMONT STUDENT RESIDENCE 241 E HASTINGS BELMONT STUDENT RESIDENCE 241 E HASTINGS BENGE ROOMS See MIDTOWN HOTEL 914 W PENDER BLACKFRIAR ROOMS DEMOLISHED 1004 MAIN BLACKSTONE HOTEL See HOTEL CALIFORNIAA 1176 GRANVILLE BODEGA HOTEL See FRASER HOTEL 227 CARRALL BON ACCORD DEMOLISHED 1235 HORNBY BONANZA ROOMS DEMOLISHED 980 MAIN BOULDER ROOMS CONVERTED TO CONDOS 1 W CORDOVA BRANDIZ HOTEL 122 E HASTINGS BRAZIL HOTEL See WALTON HOTEL 261 E HASTINGS BROADWAY HOTEL / ROOMS See HASTINGS ROOMS 103 E HASTINGS BROOKLAND COURT DWELLING UNITS - CONVERTED TO NON-MARKET 540 HELMCKEN BURLEITH ROOMS DEMOLISHED 431 E GEORGIA BURNS BLOCK 18 W HASTINGS BURRARD HOTEL (A) DEMOLISHED 712 RICHARDS BURRARD HOTEL (B) See CHURCHILL HOTEL 311 HOMER BURRARD ROOMS See LIBRARY LODGE 804 BURRARD BUTLER HOTEL / ROOMS See GASTOWN HOTEL 110 WATER BYRNE BLOCK See ALHAMBRA HOTEL 8 WATER C & N BACKPACKERS HOSTEL CONVERTED TO HOSTEL 927 MAIN CADILLAC ROOMS See WONDER ROOMS 50 E CORDOVA CAMBIE HOTEL/ ROOMS (A) CONVERTED TO OFFICE & RETAIL 160 CAMBIE Appendix D: Alphabetical Listing of Residential Hotels and Rooming Houses
46 2007 Survey of Low-Income Housing in the Downtown Core Page 37 NAME COMMENT ADDRESS CAMBIE HOTEL (B) See THE CAMBIE INTERNATIONAL HOSTEL 314 CAMBIE CAMBIE HOUSE 340 CAMBIE CAMP LODGE HOTEL DEMOLISHED 578 ALEXANDER CANADA HOTEL / ROOMS CONVERTED TO OFFICES 331 MAIN CANADIAN HOTEL 1203 SEYMOUR CANADIAN NORTH STAR 5 W HASTINGS CANSINO HOTEL/ROOMS CONVERTED TO RETAIL 24 W CORDOVA CAPITOL ROOMS DEMOLISHED 619 ROBSON CARL ROOMS 575 E HASTINGS CARLTON HOTEL See CAMBIE HOTEL (B) 314 CAMBIE CASCADE ROOMS See LUCKY LODGE 134 POWELL CASTLE HOTEL DEMOLISHED 750 GRANVILLE CATHAY LODGE 533 E GEORGIA CECIL HOTEL 1336 GRANVILLE CENTENNIAL HOTEL/HOUSE See CENTENNIAL ROOMS 346 POWELL CENTENNIAL ROOMS 346 POWELL CENTRAL CITY MISSION SNRF - CONVERTED TO CONDOS 233 ABBOTT CENTRAL HOTEL CONVERTED TO NON-MARKET See CENTRAL RESIDENCE 44 E CORDOVA CENTRAL ROOMS See MODERN HOTEL 249 E GEORGIA CHEE JONG BUI SUI ROOMS DEMOLISHED 609 MAIN CHELSEA INN 33 W HASTINGS CHINA VILLA APTS CONVERTED TO NON-RESIDENTIAL 313 E PENDER CHINESE BENEVOLENT ASSOC BLDG CONVERTED TO NON-RESIDENTIAL 104 E PENDER CHINESE NATIONALIST LEAGUE CONVERTED TO NON-RESIDENTIAL 529 GORE CHINESE THEATRE ROOMS DEMOLISHED 545 COLUMBIA CHINESE UNITED CHURCH DEMOLISHED 430 DUNLEVY CHOCK ON ROOMS DEMOLISHED 359 E PENDER CHURCHILL HOTEL DEMOLISHED 311 HOMER CLARENCE HOTEL CONVERTED TO HOSTEL - See SEYMOUR/CAMBIE HOSTEL 515 SEYMOUR CLARENDON HOTEL See OLD AMERICAN HOTEL 928 MAIN CLARKE HOTEL / ROOMS CONVERTED TO DWELLING UNITS 1155 GRANVILLE CLIFTON HOTEL / ROOMS See HOTEL CLIFTON 1125 GRANVILLE CLINTON APARTMENTS DEMOLISHED 1287 RICHARDS COBALT HOTEL 917 MAIN COLONIAL HOTEL / ROOMS See COLONIAL RESIDENCE 122 WATER COLONIAL RESIDENCE 122 WATER COLUMBIA BLOCK See TUNG AH ROOMS 101 E PENDER COLUMBIA HOTEL See NEW COLUMBIA HOTEL 303 COLUMBIA COLUMBIA ROOMS CONVERTED TO OFFICES & DWELLING UNIT 223 MAIN COMFORT INN DOWNTOWN TOURIST HOTEL 1006 GRANVILLE COMMERCIAL HOTEL See STADIUM HOTEL 340 CAMBIE COMMODORE HOTEL DEMOLISHED 889 SEYMOUR CONTINENTAL HOTEL CONVERTED TO NON-MARKET See OLD CONTINENTAL 1390 GRANVILLE CORONA HOTEL See AMBASSADOR HOTEL (A) 1212 GRANVILLE CORDOVA LODGE DEMOLISHED 146 E CORDOVA Appendix D: Alphabetical Listing of Residential Hotels and Rooming Houses
47 Page Survey of Low-Income Housing in the Downtown Core NAME COMMENT ADDRESS CORDOVA S RESIDENCE 56 E CORDOVA CORDOVA ROOMS See CORDOVA S RESIDENCE 56 E CORDOVA COSMOPOLITAN HOTEL 31 W HASTINGS COSY CORNER INN 412 COLUMBIA CREEKSIDE RESIDENCES 796 MAIN CROWN HOTEL (A) DEMOLISHED 1036 GRANVILLE CROWN HOTEL (B) See CANSINO HOTEL 24 W CORDOVA CUOMO / CUOMO'S ROOMS See THE VIVIAN 512 E CORDOVA DANNY'S INN 317 CAMBIE DANNY'S ROOMS See DANNY S INN 317 CAMBIE DAYS INN DOWNTOWN VANCOUVER TOURIST HOTEL 921 W PENDER DECKER RESIDENCE 504 ALEXANDER DEL MAR HOTEL 553 HAMILTON DEL MAR ROOMS See ROSE GARDEN APTS 853 E PENDER DE LUXE APTS DEMOLISHED 426 E HASTINGS DEVON ROOMS CONVERTED 306 ABBOTT DICK ROOMS See WING LOCK HOTEL 431 E PENDER DICKINSON APTS 630 E GEORGIA DODSON ROOMS 25 E HASTINGS DOMINO HOTEL See CROWN HOTEL 1036 GRANVILLE DOMINION HOTEL 210 ABBOTT DOWNTOWN BACKPACKERS HOSTEL See C & N BACKPACKERS HOSTEL 927 MAIN DRAKE HOTEL (A) 606 POWELL DRAKE HOTEL (B) See JOHNSON BLOCK 536 DRAKE DREXEL HOTEL/ROOMS See CANADIAN NORTH STAR 5 W HASTINGS DRIARD HOTEL * DEMOLISHED 1027 W PENDER DUFFERIN ROOMS * DEMOLISHED 121 E 2ND DUNLEVY HOTEL / ROOMS See NEW WINGS HOTEL 143 DUNLEVY DUNSMUIR HOTEL See DUNSMUIR INTERNATIONAL VILLAGE 500 DUNSMUIR DUNSMUIR HOUSE See DUNSMUIR INTERNATIONAL VILLAGE 500 DUNSMUIR DUNSMUIR INTERNATIONAL VILLAGE 500 DUNSMUIR EAGLE APTS DEMOLISHED 734 KEEFER EAST HOTEL CONVERTED TO DWELLING UNITS 445 GORE EDELWEISS HOTEL See GLORY ROOMS 204 CARRALL EDINBURGH ROOMS DEMOLISHED 327 E GEORGIA EDMONTON ROOMS See UNIVERSAL ROOMS (B) 41 E HASTINGS EDWARDS APTS DWELLING UNITS 1245 E PENDER EGREMONT ROOMS DEMOLISHED 500 BURRARD ELCHO / ELSHO APTS DWELLING UNITS - DEMOLISHED 845 DAVIE EL CID HOTEL See STADIUM HOTEL 340 CAMBIE ELMORE HOTEL DEMOLISHED 349 E GEORGIA EMPRESS HOTEL 235 E HASTINGS EMPRESS ROOMS CONVERTED TO DWELLING UNITS 440 RICHARDS EMPIRE HOTEL See BRANDIZ HOTEL 122 E HASTINGS EUROPE HOTEL CONVERTED TO NON-MARKET 43 POWELL Appendix D: Alphabetical Listing of Residential Hotels and Rooming Houses
48 2007 Survey of Low-Income Housing in the Downtown Core Page 39 NAME COMMENT ADDRESS EUROPE HOTEL ANNEX CONVERTED TO NON-MARKET See EUROPE HOTEL 47 POWELL EUREKA APARTMENTS See PRINCESS ROOMS 215 PRINCESS EVERGREEN ROOMS CLOSED 333 COLUMBIA FAN TOWER APTS CONVERTED TO DWELLING UNITS 296 KEEFER FERRARA COURT DWELLING UNITS CONVERTED TO NON-MARKET 504 E HASTINGS FERRY HOTEL / ROOMS CONVERTED TO NON-MARKET See ALEXANDER RESIDENCE 58 ALEXANDER FEY TOY ROOMS See SHAKESPEARE ROOMS 224 E GEORGIA FLINT APTS / RESIDENCE * 1516 POWELL FORD HOTEL See SIESTA HOTEL 936 GRANVILLE FOUR-STAR ROOMS See CREEKSIDE RESIDENCE 207 UNION FOX'S APTS DEMOLISHED 873 E HASTINGS FRANCIS FAYE HOTEL See PATRICK ANTHONY RESIDENCE 561 E HASTINGS FRASER HOTEL CONVERTED TO CONDOS 227 CARRALL FRISCO HOTEL See ALHAMBRA HOTEL 8 WATER GARDEN HOTEL / ROOMS See MAY WAH HOTEL 258 E PENDER GASTOWN HOSTEL See CAMBIE HOUSE 340 CAMBIE GASTOWN HOTEL 110 WATER GASTOWN INN See CAMBIE HOTEL 314 CAMBIE GASTOWN LODGE See SILVER LODGE 176 POWELL GEE S ROYAL ROOMS CONSOLIDATED WITH NZ ROOMS See JUBILEE ROOMS 237 MAIN GEORGE ROOMS DEMOLISHED 207 E GEORGIA GEORGIA ROOMS 634 E GEORGIA GLEN APTS DEMOLISHED 1036 E HASTINGS GLENAIRD HOTEL CONVERTED TO HOSTEL See SAMESUN BACKPACKERS 1018 GRANVILLE GLENHOLME APARTMENTS DWELLING UNITS - CONVERTED TO OFFICES 1241 HOMER GLOBAL VILLAGE BACKPACKERS See SAMESUN BACKPACKERS 1018 GRANVILLE GLORY HOTEL 204 CARRALL GOLDEN CROWN HOTEL 116 W HASTINGS GOLDEN STAR ROOMS 234 POWELL GRAND HOTEL DEMOLISHED 24 WATER GRAND ROOMS See AMERICA ROOMS 226 POWELL GRAND TRUNK HOSTEL 55 POWELL GRAND TRUNK ROOMS See GRAND TRUNK HOSTEL 55 POWELL GRAND UNION HOTEL 74 W HASTINGS GRANDVIEW HOTEL DEMOLISHED 618 W CORDOVA GRANVILLE HOTEL 1261 GRANVILLE GRANVILLE ROOMS CONVERTED TO DWELLING UNITS 1129 GRANVILLE GRAYCOURT HOTEL See ROOSEVELT HOTEL 166 E HASTINGS GRESHAM HOTEL CONVERTED TO NON-MARKET 716 SMITHE GUS ROOMS See WALMAR ROOMS 67 E HASTINGS HADDON HOTEL See DRAKE HOTEL (A) 606 POWELL HAM APARTMENTS See PENDER RESIDENCE 832 E PENDER HAMILTON HOTEL DEMOLISHED 519 HAMILTON HAMPTON HOTEL 124 POWELL HAMPTON ROOMS 568 POWELL Appendix D: Alphabetical Listing of Residential Hotels and Rooming Houses
49 Page Survey of Low-Income Housing in the Downtown Core NAME COMMENT ADDRESS HARBOUR ROOMS 230 PRINCESS HARBOURFRONT HOSTEL CLOSED 209 HEATLEY HARRISON BLOCK See REX ROOMS 1190 E HASTINGS HARTNEY APARTMENTS See NEW BACKPACKERS HOTEL 347 W PENDER HASTINGS ROOMS 103 E HASTINGS HAZELWOOD HOTEL 344 E HASTINGS HEATLEY APARTMENTS / BLOCK 405 HEATLEY HEATLEY ROOMS See HARBOURFRONT HOSTEL 209 HEATLEY HENLEY HOTEL/ROOMS DEMOLISHED 915 GRANVILLE HERITAGE HOUSE HOTEL See LOTUS HOTEL 455 ABBOTT HI-VANCOUVER CENTRAL TOURIST (HOSTEL) 1025 GRANVILLE HILDON HOTEL 50 W CORDOVA HIP LUN ROOMS DEMOLISHED 257 KEEFER HOLBORN HOTEL / ROOMS 367 E HASTINGS HOLLYWOOD APTS DWELLING UNITS - CONVERTED TO TOURIST HOTEL 1111 SEYMOUR HOMER APARTMENTS 337 SMITHE HOMER HOUSE DEMOLISHED 862 HOMER HOMER ROOMS See THE VICTORIAN HOTEL) 514 HOMER HORNBY HOTEL / ROOMS DEMOLISHED 536 HORNBY HORNBY MANSIONS See HORNBY HOTEL 536 HORNBY HOTEL CALIFORNIA CONVERTED TO TOURIST -See HOWARD JOHNSON HOTEL 1176 GRANVILLE HOTEL CLIFTON 1125 GRANVILLE HOTEL DAKOTA See COMFORT INN DOWNTOWN 1006 GRANVILLE HOTEL FORTUNA See CROWN HOTEL (A) 1036 GRANVILLE HOTEL LINDEN TOURIST HOTEL 1176 GRANVILLE HOTEL MARTINIQUE See HOTEL CALIFORNIA 1176 GRANVILLE HOTEL PACIFIC See GEORGIA ROOMS 634 E GEORGIA HOTEL ROBERTSON See PLAZA HOTEL 806 RICHARDS HOTEL ST CLAIR PARTLY CONVERTED TO HOSTEL 577 RICHARDS HOTEL WASHINGTON CONVERTED TO NON-MARKET 177 E HASTINGS HOWARD JOHNSON HOTEL TOURIST HOTEL 1176 GRANVILLE HO YUEN ROOMS See COSY CORNER INN 412 COLUMBIA HUDSON HOTEL See AMBASSADOR HOTEL (B) 1212 GRANVILLE HUET APARTMENTS See SMILEY'S ROOMS 512 E CORDOVA IMPERIAL HOTEL See MARR HOTEL 403 POWELL INVERMAY LODGE/ROOMS See JOLLY TAXPAYER 828 W HASTINGS INTERNATIONAL INN / ROOMS 120 JACKSON IRIS APTS See SHAMROCK ROOMS (B) 813 HORNBY IVANHOE HOTEL 1038 MAIN JACKSON ROOMS 322 JACKSON JADE APARTMENTS See KEEFER LODGE 558 KEEFER JAY ROOMS 172 E CORDOVA JOHNSON BLOCK DEMOLISHED 536 DRAKE JOHNSTON & HOWE BLOCK DEMOLISHED 723 W GEORGIA JOLLY TAXPAYER HOTEL CONVERTED TO TOURIST HOTEL 828 W HASTINGS Appendix D: Alphabetical Listing of Residential Hotels and Rooming Houses
50 2007 Survey of Low-Income Housing in the Downtown Core Page 41 NAME COMMENT ADDRESS JUBILEE ROOMS 235 MAIN JUNG HAM ROOMS See HAM APARTMENTS 832 E PENDER KEEFER LODGE 558 KEEFER KEEFER ROOMS 222 KEEFER KENT HOTEL / ROOMS DEMOLSHED 782 GRANVILLE KENWORTH ROOMS See ROSS HOUSE 313 ALEXANDER KING ED / EDWARD APARTMENTS DEMOLISHED 420 E HASTINGS KING ROOMS 326 POWELL KINGS CASTLE HOTEL See CASTLE HOTEL 750 GRANVILLE KINGS HOTEL/ROOMS See SPINNING WHEEL INN 210 CARRALL KINGSLEY HOTEL DEMOLISHED 522 RICHARDS KINGSTON HOTEL CONVERTED TO TOURIST HOTEL 757 RICHARDS LAMONA ROOMS DEMOLISHED 504 W PENDER LANDON HOTEL See SIESTA HOTEL 936 GRANVILLE LANNING APTS DEMOLISHED 318 MAIN LAUREL APARTMENTS 610 ALEXANDER LEAF ROOMS See WING LOCK HOTEL 431 E PENDER LEE APARTMENTS DEMOLISHED 430 E CORDOVA LEE'S CABINS DEMOLISHED 265 UNION LE KIU HOTEL See MAY WAH HOTEL 258 E PENDER LELAND HOTEL / ROOMS See STUART HOTEL 925 GRANVILLE LE SANDS HOTEL See ST. HELEN'S HOTEL 1161 GRANVILLE LIBRARY LODGE / ROOMS DEMOLISHED 804 BURRARD LITTLE HAVEN DEMOLISHED 204 GLEN LION HOTEL / ROOMS 316 POWELL LONDON HOTEL See PACIFIC HOTEL 208 E GEORGIA LONE STAR HOTEL See PORTLAND HOTEL 412 CARRALL LOTUS HOTEL 455 ABBOTT LOYAL HOTEL See SAVOY HOTEL 258 E PENDER LOW YOUNG COURT 404 UNION LUCKY LODGE 134 POWELL LUCKY ROOMS 468 UNION LUKAS HOTEL See FLINT RESIDENCE 1516 POWELL LUNG JEN BENEVOLENT (A) 240 KEEFER LUNG JEN BENEVOLENT (B) DEMOLISHED 232 MAIN MAC'S ROOMS/MACK'S ROOMS ROOMS ON 2ND FLOOR DEMOLISHED 30 E HASTINGS MAIN HOTEL / ROOMS (A) 117 MAIN MAIN HOTEL (B) See VANPORT HOTEL 645 MAIN MALL HAVEN HOTEL See SIESTA HOTEL 936 GRANVILLE MANITOBA HOTEL See HILDON HOTEL 50 W CORDOVA MANOR ROOMS DEMOLISHED 609 W PENDER MAPLE HOTEL See HOTEL WASHINGTON 177 E HASTINGS MAPONAKI ROOMS DEMOLISHED 231 UNION MARBLE ARCH 518 RICHARDS MARBLE ROOMS CONVERTED TO COMMERCIAL 107 W CORDOVA Appendix D: Alphabetical Listing of Residential Hotels and Rooming Houses
51 Page Survey of Low-Income Housing in the Downtown Core NAME COMMENT ADDRESS MARINE ROOMS CONVERTED TO DWELLING UNIT 356 POWELL MARLBORO HOTEL DEMOLISHED 635 GRANVILLE MARR HOTEL 403 POWELL MARSHALL HOTEL DEMOLISHED 569 HAMILTON MARTIN HOTEL See HOTEL CALIFORNIA 1176 GRANVILLE MAYFAIR HOTEL (A) TOURIST HOTEL 835 HORNBY MAYFAIR HOTEL (B) DEMOLISHED 215 E CORDOVA MAYO HOTEL / ROOMS CONVERTED TO RETAIL & OFFICES 545 MAIN MAY WAH HOTEL 258 E PENDER MELBOURNE HOTEL See NO. 5 ORANGE 205 MAIN MELVILLE LODGE / ROOMS 322 CAMBIE METROPOLE HOTEL 320 ABBOTT MIDTOWN HOTEL DEMOLISHED 914 W PENDER MIMI HOTEL / ROOMS See LUCKY LODGE 134 POWELL MING SUNG READING ROOMS (A) DEMOLISHED 268 POWELL MING SUNG READING ROOMS (B) 439 POWELL MODERN HOTEL/ROOMS CONVERTED TO DWELLING UNITS 249 E GEORGIA MONTGOMERY APT. HOTEL See PARK HOTEL APARTMENTS 429 W PENDER MORGAN ROOMS See MT EVEREST ROOMS 244 E HASTINGS MORRIS HOTEL DEMOLISHED 658 W CORDOVA MOUNT EVEREST ROOMS 244 E HASTINGS MURRAY HOTEL 1119 HORNBY MUTUAL BLOCK See DANNY'S INN 317 CAMBIE NELSON PLACE HOTEL See COMFORT INN DOWNTOWN 1006 GRANVILLE NEW BACKPACKERS HOSTEL HOSTEL 347 W PENDER NEW BRAZIL HOTEL See WALTON HOTEL 261 E HASTINGS NEW CENTRAL HOTEL CONVERTED TO NON-MARKET See CENTRAL RESIDENCE 44 E CORDOVA NEW COLUMBIA HOTEL 303 COLUMBIA NEW DODSON HOTEL See DODSON ROOMS 25 E HASTINGS NEW EMPIRE HOTEL See BRANDIZ HOTEL 122 E HASTINGS NEW FOUNTAIN HOTEL CONVERTED TO NON-MARKET See STANLEY/NEW FOUNTAIN 45 W CORDOVA NEW MODERN HOTEL See MODERN HOTEL 249 E GEORGIA NEW MORGAN ROOMS See MOUNT EVEREST ROOMS 244 E HASTINGS NEW STAR ROOMS See THORNTON PARK HOTEL 956 MAIN NEW SUN AH ROOMS 100 E PENDER NEW SUNRISE HOTEL / ROOMS CONVERTED TO DWELLING UNITS 255 E GEORGIA NEW WINGS HOTEL See SEREENA'S PLACE 143 DUNLEVY NEW WORLD HOTEL See TAMURA HOUSE 390 POWELL NEW ZEALAND ROOMS CONSOLIDATED WITH ROYAL ROOMS - See JUBILEE ROOMS 235 MAIN NEWPORT HOTEL See GRANVILLE HOTEL 1261 GRANVILLE NEWTON LODGE/ROOMS See SILVER LODGE 176 POWELL NIAGARA HOTEL CONVERTED TO TOURIST -See RAMADA DOWNTOWN 435 W PENDER NO. 5 ORANGE 205 MAIN NORFOLK HOTEL / ROOMS See STATE HOTEL 876 GRANVILLE NORLAND ROOMS See TOON WO FUNG ROOMS 73 E HASTINGS Appendix D: Alphabetical Listing of Residential Hotels and Rooming Houses
52 2007 Survey of Low-Income Housing in the Downtown Core Page 43 NAME COMMENT ADDRESS OAKLAND ROOMS See BLACKFRIAR ROOMS 1002 MAIN OCEAN ROOMS See TRIPLE SIX 666 ALEXANDER OCEAN VIEW ROOMS DEMOLISHED 760 POWELL OHIO ROOMS DEMOLISHED 245 POWELL OHORI GENICHI ROOMS See CARL ROOMS 575 E HASTINGS OLAND ROOMS CONVERTED TO RETAIL/FASHION SCHOOL 247 ABBOTT OLD AMERICAN HOTEL 928 MAIN OLIVER ROOMS / HOTEL CONVERTED TO NON-MARKET See CENTRAL RESIDENCE 48 E CORDOVA OLYMPIA APTS/HOTEL/ROOMS See SUNWEST HOTEL 341 E HASTINGS OLYMPIC APARTMENTS DWELLING UNITS - DEMOLISHED 406 E HASTINGS OLYMPIC HOTEL See SUNWEST HOTEL 341 E HASTINGS ONSITE 137 E HASTINGS ONTARIO ROOMS * 1610 FRANKLIN ORANGE HALL APTS DWELLING UNITS CONVERTED TO NON-MARKET 341 GORE ORANGE ROOMS DEMOLISHED 252 POWELL ORIENT THEATRE See CHINESE THEATRE ROOMS 545 COLUMBIA ORILLIA APARTMENTS See CAPITOL ROOMS 619 ROBSON ORR ROOMS DEMOLISHED 788 POWELL ORWELL HOTEL / ROOMS 456 E HASTINGS PACIFIC HOTEL 208 E GEORGIA PAC ROOMS See PACIFIC ROOMS (B) 66 W CORDOVA PACIFIC HOSTEL SNRF - DEMOLISHED 535 HOMER PACIFIC ROOMS (A) 507 MAIN PACIFIC ROOMS (B) DEMOLISHED 66 W CORDOVA PADDY'S ROOMS See RAINIER HOTEL 309 CARRALL PALACE HOTEL 35 W HASTINGS PALMS HOTEL DEMOLISHED 873 GRANVILLE PARKDALE APARTMENTS CONVERTED TO DWELLING UNITS 824 JACKSON PARK HOTEL See STATION HOTEL 1012 MAIN PARK HOTEL APARTMENTS 429 W PENDER PARKWAY HOTEL * DEMOLISHED 1119 W PENDER PARK ROOMS See MING SUNG READING ROOMS 439 POWELL PASSLIN HOTEL / ROOMS 746 RICHARDS PATRICIA HOTEL 403 E HASTINGS PATRICK ANTHONY RESIDENCE 561 E HASTINGS PENDER HOTEL 31 W PENDER PENDER LODGE 431 E PENDER PENDER PLACE HOTEL See PICADLLY HOTEL 620 W PENDER PENDER RESIDENCE 832 E PENDER PENDER ROOMS DEMOLISHED 820 W PENDER PENNSYLVANIA HOTEL See PORTLAND HOTEL 412 CARRALL PHOENIX APTS 566 POWELL PHOENIX HOTEL See TOI SHAN BENEVOLENT ASSOCIATION 237 E HASTINGS PHOENIX ROOMS 514 ALEXANDER PICADILLY HOTEL 622 W PENDER Appendix D: Alphabetical Listing of Residential Hotels and Rooming Houses
53 Page Survey of Low-Income Housing in the Downtown Core NAME COMMENT ADDRESS PICADILLY ROOMS See PICADLLY HOTEL 622 W PENDER PINE CRANE VILLA See PENDER LODGE 431 E PENDER PINE ROOMS DEMOLISHED 207 GORE PLAZA HOTEL DEMOLISHED 806 RICHARDS PORTLAND HOTEL CONVERTED TO NON-MARKET 412 CARRALL POWELL HOTEL/LODGE/ROOMS See LUCKY LODGE 134 POWELL POWELL ROOMS 556 POWELL POWELL STREET LODGE See LUCKY LODGE 134 POWELL PRINCE HENRY HOTEL/ROOMS See HENLEY ROOMS 915 GRANVILLE PRINCESS LODGE See PRINCESS ROOMS (A) 215 PRINCESS PRINCESS ROOMS (A) 215 PRINCESS PRINCESS ROOMS (B) See EVERGREEN ROOMS 333 COLUMBIA PRIOR APTS / ROOMS DEMOLISHED 638 PRIOR QUEENS HOTEL / ROOMS DEMOLISHED 206 MAIN RAMADA DOWNTOWN HOTEL TOURIST HOTEL 435 W PENDER RAMADA INN & SUITES TOURIST HOTEL 1221 GRANVILLE RANCHO HOTEL CONVERTED TO SNRF - NOW DEMOLISHED 119 E CORDOVA RAINBOW/LONE STAR HOTELS See PORTLAND HOTEL 412 CARRALL RAINIER HOTEL CLOSED 309 CARRALL REGAL APTS / ROOMS See ARNOLD APARTMENTS 1130 GRANVILLE REGAL HOTEL 1046 GRANVILLE REGAL PLACE HOTEL CONVERTED TO NON-MARKET 144 W HASTINGS REGENT HOTEL 160 E HASTINGS REX ROOMS See ST CLAIR E HASTINGS RHODESIA APTS / ROOMS DEMOLISHED 904 DAVIE RIALTO HOTEL / ROOMS DEMOLISHED 1140 GRANVILLE RICE BLOCK 404 HAWKS RICHARDS ROOMS DEMOLISHED 520 RICHARDS RICHMOND HOTEL / ROOMS CONVERTED TO NON-MARKET See SAKURA-SO HOTEL 374 POWELL ROBSON HOTEL / LODGE * CONVERTED TO DWELLING UNITS 1028 ROBSON ROGER HOTEL See PORTLAND HOTEL 412 CARRALL ROOSEVELT HOTEL 166 E HASTINGS ROSE APARTMENTS See STAR BEACH HAVEN 658 ALEXANDER ROSEBERRY HOUSE 909 RICHARDS ROSEBUD HOTEL See RICE BLOCK 404 HAWKS ROSE GARDEN APARTMENT DEMOLISHED 853 E PENDER ROSS HOUSE 313 ALEXANDER ROYAL HOTEL CONVERTED TO HOSTEL -See HI-VANCOUVER CENTRAL 1025 GRANVILLE ROYAL MANOR INN * See ONTARIO ROOMS 1610 FRANKLIN ROYAL ROOMS See GEE S ROYAL ROOMS 237 MAIN SAKURA-SO HOTEL NON-MARKET 374 POWELL SAMESUN BACKPACKERS TOURIST (HOSTEL) 1018 GRANVILLE SAMMYS ROOMS See PACIFIC ROOMS 507 MAIN SAVOY HOTEL 258 E HASTINGS SEAVIEW APARTMENTS 362 ALEXANDER Appendix D: Alphabetical Listing of Residential Hotels and Rooming Houses
54 2007 Survey of Low-Income Housing in the Downtown Core Page 45 NAME COMMENT ADDRESS SECORD HOTEL See MARR HOTEL 403 POWELL SEREENA'S PLACE 143 DUNLEVY SENATOR HOTEL See AMBASSADOR HOTEL (A) 1212 GRANVILLE SEYMOUR/CAMBIE HOSTEL TOURIST (HOSTEL) 515 SEYMOUR SHAKESPEARE ROOMS DWELLING UNITS 224 E GEORGIA SHALDON HOTEL 52 E HASTINGS SHAMROCK HOTEL / ROOMS (A) 635 E HASTINGS SHAMROCK ROOMS (B) DEMOLISHED 813 HORNBY SHASTA ROOMS See HASTINGS ROOMS 103 E HASTINGS SIESTA HOTEL See SIESTA ROOMS 936 GRANVILLE SIESTA ROOMS 936 GRANVILLE SILVER/AVALON HOTEL 165 W PENDER SILVER HOTEL / ROOMS See SILVER/AVALON HOTEL 175 W PENDER SILVER LODGE DEMOLISHED 176 POWELL SKYLIGHT HOTEL See PHOENIX HOTEL 237 E HASTINGS SMILEY'S ROOMS See THE VIVIAN 512 E CORDOVA SONNY ROOMS / HOTEL See DOWNTOWN BACKPACKERS HOSTEL 927 MAIN SPINNING WHEEL INN CONVERTED TO CONDOS 210 CARRALL ST CLAIR NO E HASTINGS ST. CLAIR HOTEL See HOTEL ST. CLAIR 577 RICHARDS ST. ELMO HOTEL / ROOMS 429 CAMPBELL ST. FRANCIS HOTEL DEMOLISHED 309 SEYMOUR ST. HELEN'S HOTEL 1161 GRANVILLE ST. JAMES HOTEL / ROOMS See SHALDON HOTEL 52 E HASTINGS ST. KINGS ROOMS See SUN AH ROOMS 242 POWELL ST. LUKES HOME / ROOMS CONVERTED TO DWELLING UNITS 309 E CORDOVA ST. VINCENTS HOME See ROSE GARDEN APTS 853 E PENDER STADIUM HOTEL See STADIUM INN 340 CAMBIE STADIUM INN See GASTOWN HOSTEL 340 CAMBIE STANLEY HOTEL CONVERTED TO NON-MARKET See STANLEY/NEW FOUNTAIN 21 W CORDOVA STANLEY/NEW FOUNTAIN NON-MARKET 21 W CORDOVA STAR BEACH HAVEN 658 ALEXANDER STAR ROOMS (A) See ARLINGTON ROOMS (B) 575 E PENDER STAR ROOMS (B) See GOLDEN STAR ROOMS 234 POWELL STAR ROOMS (C) See THORNTON PARK HOTEL 956 MAIN STATE HOTEL 876 GRANVILLE STATION HOTEL 1012 MAIN STIRLING HOTEL DEMOLISHED 175 W CORDOVA STRAND HOTEL / ROOMS (A) See COSMOPOLITAN HOTEL 31 W HASTINGS STRAND HOTEL (B) DEMOLISHED 624 W HASTINGS STRATFORD HOTEL See FAN TOWER APARTMENTS 296 KEEFER STRATHCONA HOTEL CONVERTED TO CONDOS 53 W HASTINGS STUART HOTEL CONVERTED TO COMMERCIAL 925 GRANVILLE SUN AH HOTEL / ROOMS (A) See NEW SUN AH ROOMS 100 E PENDER SUN AH ROOMS (B) DEMOLISHED 242 POWELL Appendix D: Alphabetical Listing of Residential Hotels and Rooming Houses
55 Page Survey of Low-Income Housing in the Downtown Core NAME COMMENT ADDRESS SUN DO ROOMS DEMOLISHED 208 UNION SUNLIGHT HOTEL See SUNWEST HOTEL 341 E HASTINGS SUNLITE ROOMS See SUN AH ROOMS (B) 242 POWELL SUNRISE HOTEL CONVERTED TO NON-MARKET 101 E HASTINGS SUN SUN ROOMS CONVERTED 210 KEEFER SUNWEST HOTEL 341 E HASTINGS SYDNEY HOTEL See MAY WAH HOTEL 258 E PENDER TAMURA HOUSE 390 POWELL TAVERN ROOMS CONVERTED TO DWELLING UNITS 214 CARRALL TEMPLE ROOMS CONVERTED TO OFFICES & LATER DEMOLISHED 515 W PENDER TERMINUS HOTEL / ROOMS DEMOLISHED 30 WATER TESLIN LODGE See HARBOURFRONT HOSTEL 209 HEATLEY THE AMERICAN HOTEL See OLD AMERICAN HOTEL 928 MAIN THE BROADWAY See SUNRISE HOTEL 101 E HASTINGS THE CAMBIE INTERNATIONAL HOSTEL CONVERTED TO HOSTEL 314 CAMBIE THE GATEWAY HOTEL See RAMADA INN & SUITES 1221 GRANVILLE THE IRVING See SUNRISE HOTEL 101 E HASTINGS THE HASTINGS See WASHINGTON HOTEL 177 E HASTINGS THE VICTORIAN HOTEL CONVERTED TO TOURIST HOTEL 514 HOMER THE VIVIAN CONVERTED TO NON-MARKET HOUSING 512 E CORDOVA THORTON PARK HOTEL 956 MAIN THREE STAR ROOMS See FOUR STAR ROOMS 207 UNION TOI SHAN BENEVOLENT 237 E HASTINGS TOON WO FUNG ROOMS 71 E HASTINGS TOTEM HOTEL See GRANVILLE HOTEL 1261 GRANVILLE TRAVELLER'S HOTEL 57 W CORDOVA TREMONT HOTEL See GLORY HOTEL 204 CARRALL TRIPLE SIX 666 ALEXANDER TUNG AH ROOMS CONVERTED TO NON-MARKET See DART COON CLUB 101 E PENDER UNION ROOMS See WELCOME HOSTEL 406 UNION UNITED HOTEL See GLORY HOTEL 204 CARRALL UNITED ROOMS 139 E CORDOVA UNIVERSAL HOTEL / ROOMS (A) See SEAVIEW APARTMENTS 362 ALEXANDER UNIVERSAL ROOMS (B) 41 E HASTINGS VANCOUVER DOWNTOWN INN See OLD AMERICAN HOTEL 928 MAIN VANPORT HOTEL DEMOLISHED 645 MAIN VEILE HOTEL See CHELSEA INN 33 W HASTINGS VERNON APARTMENTS 1168 E HASTINGS VETS ROOMS 311 MAIN VICTOR ROOMS See BLACKFRIAR ROOMS 1002 MAIN VICTORIA BLOCK See VICTORIA ROOMS 514 HOMER VICTORIA HOUSE / ROOMS See THE VICTORIAN HOTEL 514 HOMER VICTORY ANNEX See SEAVIEW APARTMENTS 362 ALEXANDER VICTORY HOTEL / ROOMS CONVERTED TO SNRF - See VICTORY HOUSE 391 POWELL VICTORY HOUSE DEMOLISHED 391 POWELL Appendix D: Alphabetical Listing of Residential Hotels and Rooming Houses
56 2007 Survey of Low-Income Housing in the Downtown Core Page 47 NAME COMMENT ADDRESS VOGUE HOTEL 1060 GRANVILLE WALMAR ROOMS 67 E HASTINGS WALTON HOTEL 261 E HASTINGS WALTON ROOMS See ALEXANDER RESIDENCE 90 ALEXANDER WARREN HOTEL See GOLDEN CROWN HOTEL 116 W HASTINGS WATERLOO ROOMS DEMOLISHED 966 MAIN WELCOME HOSTEL See LOW YOUNG COURT 406 UNION WESTERN SPORTS HOTEL See WEST INN 137 E HASTINGS WEST HOTEL 488 CARRALL WEST INN See ONSITE 137 E HASTINGS WICKLOW APTS / HOTEL See FLINT RESIDENCE 1516 POWELL WILSON APTS DEMOLISHED 771 POWELL WINDSOR HOTEL See PENDER ROOMS 820 W PENDER WINGATE HOTEL See PENDER HOTEL 31 W PENDER WING LOCK HOTEL See PINE CRANE VILLA 431 E PENDER WINGS HOTEL / ROOMS See NEW WINGS HOTEL 143 DUNLEVY WINTER'S HOTEL See WINTER S RESIDENCE 203 ABBOTT WINTER'S RESIDENCE 203 ABBOTT WONDER HOTEL / ROOMS 50 E CORDOVA WOODBINE HOTEL 786 E HASTINGS WORLD HOTEL DEMOLISHED 176 E PENDER YALE HOTEL 1300 GRANVILLE YALE ROOMS DEMOLISHED 925 W PENDER YALTA ROOMS DEMOLISHED 639 MAIN YIN PING BENEVOLENT SOC. (A) DEMOLISHED 320 E PENDER YIN PING BENEVOLENT SOC. (B) 414 COLUMBIA YORK HOTEL DEMOLISHED 790 HOWE YORK ROOMS 259 POWELL * = OUTSIDE DOWNTOWN CORE AREA Appendix D: Alphabetical Listing of Residential Hotels and Rooming Houses


, the Block 42 portion of the Pacific Centre (C), and the Robson Courthouse project (D")


, and the Fire Hall")


57 Page Survey of Low-Income Housing in the Downtown Core Appendix E: SRO Changes ANNUAL PERCENT CHANGE IN THE SRO STOCK The heavy losses of SRO units in the first half of the 1970s reflect several factors. Three of the most important involved City and other government actions - urban renewal projects, revised City codes and stronger enforcement of those codes, and the conversion of SROs to non-market housing. entire blocks - the Court at 220 Main (See map - A), the east end of the Georgia Viaduct (B), the Block 42 portion of the Pacific Centre (C), and the Robson Courthouse project (D although this was mostly cleared in the 1960s). These projects accounted for 600, or about one quarter, of the units lost in the 1970 to 1974 period. At same time that these projects were proceeding, the City was also acting to improve conditions in the skid row area. In January 1973, City Council established the Skid Row Housing Committee, with the task of turning the Downtown Eastside/Gastown area into a safe and healthy community. Between 1973 and 1976, Council took a number of actions to upgrade the area. Some of the actions related to improving services in the area. The Carnegie Centre, the multi-use centre (now the Evelyn Saller Centre), and the Fire Hall #2 renovation were approved in this period. More significant in terms of SRO housing were two other sets of actions. While most of the demolitions associated with the urban renewal projects occurred in 1960s, there were four projects that were partially or wholly implemented in the early 1970s. All four projects involved the clearance of The first set of actions was to increase the standards in regulatory by-laws and to enforce them more strictly. The Lodging House and Standards of Maintenance By-Laws establish guidelines and minimum standards for cleanliness, tenant service, maintenance, and management of SROs - ranging from minimum unit size, natural light requirements, Appendix D: Alphabetical Listing of Residential Hotels and Rooming Houses
Housing and Homelessness. City of Vancouver September 2010
 Housing and Homelessness City of Vancouver September 2010 1 Table of Contents Overview Key Housing Issues Homelessness Rental Housing Affordable Home Ownership Key Considerations 2 OVERVIEW 3 Overview
CITY OF VANCOUVER ADMINISTRATIVE REPORT
 CITY OF VANCOUVER ADMINISTRATIVE REPORT Report Date: April 26, 2005 Author: Daniel Naundorf Phone No.: 604.871.6198 RTS No.: 05009 CC File No.: 4657 Meeting Date: May 10, 2005 TO: FROM: SUBJECT: Vancouver
Single Room Accommodation Permit for Star Beach Haven (658 Alexander Street)
") ADMINISTRATIVE REPORT Report Date: January 26, 2016 Contact: Mukhtar Latif Contact No.: 604.871.6939 RTS No.: 11290 VanRIMS No.: 08-2000-20 Meeting Date: February 23, 2016 TO: FROM: SUBJECT: Vancouver
ADMINISTRATIVE REPORT Report Date: January 26, 2016 Contact: Mukhtar Latif Contact No.: 604.871.6939 RTS No.: 11290 VanRIMS No.: 08-2000-20 Meeting Date: February 23, 2016 TO: FROM: SUBJECT: Vancouver
General Manager of Arts, Culture and Community Services
 ADMINISTRATIVE REPORT Report Date: July 10, 2018 Contact: Sandra Singh Contact No.: 604.871.6858 RTS No.: 12694 VanRIMS No.: 08-2000-20 Meeting Date: July 24, 2018 TO: FROM: SUBJECT: Vancouver City Council
2015 Report on Homelessness and Related Actions on SROs. Presentation to City Council. July 7, 2015
 2015 Report on Homelessness and Related Actions on SROs Presentation to City Council July 7, 2015 Overview of 2015 Homeless Count 2 Homeless Count 2015 Standard methodology Date: March 24, 2015 2014 Comparators:
Single Room Accommodation Permit for Canadian North Star (5 West Hastings Street)
") ADMINISTRATIVE REPORT Report Date: December, 04 Contact: Jim De Hoop Contact No.: 604.873.7479 RTS No.: 07 VanRIMS No.: 08-000-0 Meeting Date: December 6, 04 TO: FROM: SUBJECT: Vancouver City Council General
ADMINISTRATIVE REPORT Report Date: December, 04 Contact: Jim De Hoop Contact No.: 604.873.7479 RTS No.: 07 VanRIMS No.: 08-000-0 Meeting Date: December 6, 04 TO: FROM: SUBJECT: Vancouver City Council General
The Impact of Market Rate Vacancy Increases Eleven-Year Report
 The Impact of Market Rate Vacancy Increases Eleven-Year Report January 1, 1999 - December 31, 2009 Santa Monica Rent Control Board April 2010 TABLE OF CONTENTS Summary 1 Vacancy Decontrol s Effects on
Status of HUD-Insured (or Held) Multifamily Rental Housing in Final Report. Executive Summary. Contract: HC-5964 Task Order #7
 Multifamily Rental Housing in Final Report. Executive Summary. Contract: HC-5964 Task Order #7") Status of HUD-Insured (or Held) Multifamily Rental Housing in 1995 Final Report Executive Summary Cambridge, MA Lexington, MA Hadley, MA Bethesda, MD Washington, DC Chicago, IL Cairo, Egypt Johannesburg,
Status of HUD-Insured (or Held) Multifamily Rental Housing in 1995 Final Report Executive Summary Cambridge, MA Lexington, MA Hadley, MA Bethesda, MD Washington, DC Chicago, IL Cairo, Egypt Johannesburg,
Document under Separate Cover Refer to LPS State of Housing
 Document under Separate Cover Refer to LPS5-17 216 State of Housing Contents Housing in Halton 1 Overview The Housing Continuum Halton s Housing Model 3 216 Income & Housing Costs 216 Indicator of Housing
ADMINISTRATIVE REPORT
 A4(a) ADMINISTRATIVE REPORT Report Date: November 29, 2010 Contact: Brenda Prosken Contact No.: 604.871.6858 RTS No.: 08922 VanRIMS No.: 08-2000-20 Meeting Date: January 18, 2011 TO: FROM: SUBJECT: Vancouver
CITY OF VANCOUVER ADMINISTRATIVE REPORT
 A11 CITY OF VANCOUVER ADMINISTRATIVE REPORT Report Date: September 28, 2006 Author: Cameron Gray Phone No.: 604.873.7207 RTS No.: 06245 VanRIMS No.: 11-2200-21 Meeting Date: October 17, 2006 TO: FROM:
Companion Document Statement of Need
 Start with Home Tri-Cities Homelessness & Housing Task Group Companion Document Statement of Need Renewing Riverview Part A: Rental Housing Affordability & Need Analysis The charts, tables and text in
TRI-CITIES ANNUAL HOUSING AFFORDABILITY REPORT
 TRI-CITIES ANNUAL HOUSING AFFORDABILITY REPORT April 2013 Section 1: Housing Affordability Indicators Subject Page 1. Household Income 2 2. Housing Price Index 3 3. Affordable Incomes Ownership 4 4. Purpose-Built
Addressing the Impact of Housing for Virginia s Economy
 Addressing the Impact of Housing for Virginia s Economy A REPORT FOR VIRGINIA S HOUSING POLICY ADVISORY COUNCIL NOVEMBER 2017 Appendix Report 2: Housing the Commonwealth's Future Workforce 2014-2024 Jeannette
Comparing the Stock Market and Iowa Land Values: A Question of Timing Michael Duffy ISU Department of Economics
 Comparing the Stock Market and Iowa Land Values: A Question of Timing Michael Duffy ISU Department of Economics This paper is an update of earlier versions. The purpose of the paper is to examine the question;
San Francisco HOUSING INVENTORY
 2008 San Francisco HOUSING INVENTORY San Francisco Planning Department April 2009 1 2 3 4 1 888 Seventh Street - 227 units including 170 off-site inclusionary affordable housing units; new construction
Non-Profit Co-operative Housing: Working to Safeguard Canada s Affordable Housing Stock for Present and Future Generations
 Co-operative Housing Federation of Canada s submission to the 2009 Pre-Budget Consultations Non-Profit Co-operative Housing: Working to Safeguard Canada s Affordable Housing Stock for Present and Future
ARLA Members Survey of the Private Rented Sector
 Prepared for The Association of Residential Letting Agents ARLA Members Survey of the Private Rented Sector Second Quarter 2014 Prepared by: O M Carey Jones 5 Henshaw Lane Yeadon Leeds LS19 7RW June, 2014
Subject. Date: 2016/10/25. Originator s file: CD.06.AFF. Chair and Members of Planning and Development Committee
 Date: 2016/10/25 Originator s file: To: Chair and Members of Planning and Development Committee CD.06.AFF From: Edward R. Sajecki, Commissioner of Planning and Building Meeting date: 2016/11/14 Subject
2015 Spring Market trends report
 2015 Spring Market trends Report National Summary Low inventory in Vancouver and Toronto continue to drive prices as buyers find themselves in competition over the low supply of single-family homes. The
THAT Council receives for information the Report from the Planner II dated April 25, 2016 with respect to the annual Housing Report update.
 Report to Council Date: April 25, 2016 File: 1200-40 To: From: Subject: City Manager Laura Bentley, Planner II, Policy & Planning Annual Housing Report Update Recommendation: THAT Council receives for
ADMINISTRATIVE REPORT
 ADMINISTRATIVE REPORT Report Date: July 13, 2015 Contact: Abi Bond Contact No.: 604.871.7760 RTS No.: 11044 VanRIMS No.: 08-2000-20 Meeting Date: July 21, 2015 TO: FROM: SUBJECT: Vancouver City Council
Table of Contents. Appendix...22
 Table Contents 1. Background 3 1.1 Purpose.3 1.2 Data Sources 3 1.3 Data Aggregation...4 1.4 Principles Methodology.. 5 2. Existing Population, Dwelling Units and Employment 6 2.1 Population.6 2.1.1 Distribution
Powell River. Courtenay. Port Alberni Parksville. Vancouver Nanaimo. Duncan. Avg. Rent
 Housing Market Information RENTAL MARKET REPORT Highlights 1 Canada Mortgage and Housing Corpor ation Date Released: 2016 The overall vacancy rate *... INCREASED to 1.3 % The average rent is *... $ 1,099
The Impact of The Ellis Act. January 1, 2005 December 31, 2005
 The Impact of The Ellis Act January 1, 2005 December 31, 2005 Santa Monica Rent Control Board March 2006 IMPACT OF THE ELLIS ACT The Ellis Act allows landlords to go out of the rental business, evict tenants,
City Center Market-Rate Housing Study
 City Center Market-Rate Housing Study OVERVIEW The City of Bellingham, with the assistance of students from Western Washington University, conducted a study of market-rate rental housing during April and
Housing Needs Survey Report. Arlesey
 Housing Needs Survey Report Arlesey August 2015 Completed by Bedfordshire Rural Communities Charity This report is the joint property of Central Bedfordshire Council and Arlesey Parish Council. For further
Research report Tenancy sustainment in Scotland
 Research report Tenancy sustainment in Scotland From the Shelter policy library October 2009 www.shelter.org.uk 2009 Shelter. All rights reserved. This document is only for your personal, non-commercial
Trends in Affordable Home Ownership in Calgary
 Trends in Affordable Home Ownership in Calgary 2006 July www.calgary.ca Call 3-1-1 PUBLISHING INFORMATION TITLE: AUTHOR: STATUS: TRENDS IN AFFORDABLE HOME OWNERSHIP CORPORATE ECONOMICS FINAL PRINTING DATE:
Housing Characteristics
 CHAPTER 7 HOUSING The housing component of the comprehensive plan is intended to provide an analysis of housing conditions and need. This component contains a discussion of McCall s 1990 housing inventory
The Impact of Market Rate Vacancy Increases Eight-Year Report
 The Impact of Market Rate Vacancy Increases Eight-Year Report January 1, 1999 - December 31, 2006 Santa Monica Rent Control Board March 2007 TABLE OF CONTENTS Summary 1 Units Rented at Market Rates Rates
ental market report CMHC s Fall survey of rental hous Average vacancy rate in ³ N regina 2002 IN THIS Regina slips from 2001 level ISSUE
 r ental market report Canada Mortgage and Housing Corporation Average vacancy rate in IN THIS Regina slips from 2001 level ISSUE Average vacancy rate slips... 1 CMHC s Fall survey of rental hous ing found
COMPARISON OF THE LONG-TERM COST OF SHELTER ALLOWANCES AND NON-PROFIT HOUSING
 COMPARISON OF THE LONG-TERM COST OF SHELTER ALLOWANCES AND NON-PROFIT HOUSING Prepared for The Fair Rental Policy Organization of Ontario By Clayton Research Associates Limited October, 1993 EXECUTIVE
Rental Housing Strategy Study # 1
 Rental Housing Strategy Study # 1 Submitted to: City of Vancouver by: Will Dunning Inc November 2009 Table of Contents Table of Contents... 1 Part 1 Summary and Conclusions... 2 Introduction... 2 Housing
Housing Needs in Burlington s Downtown & Waterfront Areas
 Housing Needs in s Downtown & Waterfront Areas Researched and written by Vermont Housing Finance Agency for the City of Planning & Zoning Department 10/31/2011 Contents Introduction... 2 Executive Summary...
NINE FACTS NEW YORKERS SHOULD KNOW ABOUT RENT REGULATION
 NINE FACTS NEW YORKERS SHOULD KNOW ABOUT RENT REGULATION July 2009 Citizens Budget Commission Since 1993 New York City s rent regulations have moved toward deregulation. However, there is a possibility
H o u s i n g N e e d i n E a s t K i n g C o u n t y
 1999 2000 2001 2002 2003 2004 2005 2006 2007 2008 2009 2010 Number of Affordable Units H o u s i n g N e e d i n E a s t K i n g C o u n t y HOUSING AFFORDABILITY Cities planning under the state s Growth
Housing Issues Report Shoreline Towers Inc. Proposal 2313 & 2323 Lake Shore Boulevard West. Prepared by PMG Planning Consultants November 18, 2014
 Housing Issues Report Shoreline Towers Inc. Proposal 2313 & 2323 Lake Shore Boulevard West Prepared by PMG Planning Consultants November 18, 2014 PMG Planning Consultants Toronto, Canada M6A 1Y7 Tel. (416)
things to consider if you are selling your house
 things to consider if you are selling your house KEEPINGCURRENTMATTERS.COM WINTER 2012 EDITION PAGE TABLE OF CONTENTS 1 3 5 7 9 House Prices: Where They Will Be in the Spring Understanding the Impact OF
City of St. Petersburg, Florida Consolidated Plan. Priority Needs
 City of St. Petersburg, Florida 2000-2005 Consolidated Plan Priority Needs Permanent supportive housing and services for homeless and special needs populations. The Pinellas County Continuum of Care 2000
2014 Plan of Conservation and Development
 The Town of Hebron Section 1 2014 Plan of Conservation and Development Community Profile Introduction (Final: 8/29/13) The Community Profile section of the Plan of Conservation and Development is intended
New affordable housing production hits record low in 2014
 1 Falling Further Behind: Housing Production in the Twin Cities Region December 2015 Key findings Only a small percentage of added housing units were affordable to households with low and moderate incomes.
RENTAL MARKET REPORT. Manitoba Highlights* Highlight Box. Housing market intelligence you can count on
 H o u s i n g M a r k e t I n f o r m a t i o n RENTAL MARKET REPORT Manitoba Highlights* C a n a d a M o r t g a g e a n d H o u s i n g C o r p o r a t i o n Date Released: Spring 2011 Figure 1 Winnipeg
Key Findings. For more information, please or call
 Mid-year update Rendering: LMN Architects The Downtown Seattle Association publishes two development guides each year to measure development activity taking place within downtown Seattle. The first, published
Housing & Homelessness Strategy Targets Report Card. Presentation to City Council February 12, 2013
 Housing & Homelessness Strategy Targets 2012-2014 2012 Report Card Presentation to City Council February 12, 2013 Recent Headlines 2 Recent Headlines 3 Recent Headlines 4 Council Goals 1. End Street Homelessness
ARLA Survey of Residential Investment Landlords
 Prepared for The Association of Residential Letting Agents & the ARLA Group of Buy to Let Mortgage Lenders ARLA Survey of Residential Investment Landlords March 2010 Prepared by O M Carey Jones 5 Henshaw
Table of Contents. Title Page # Title Page # List of Tables ii 6.7 Rental Market - Townhome and Apart ment Rents
 RESIDENTIAL MONITORING REPORT 2013 Table of Contents Title Page # Title Page # List of Tables ii 6.7 Rental Market - Townhome and Apart ment Rents 21 List of Figures iii 7.0 Other Housing Demands and Trends
Housing Vancouver Strategy
 Housing Vancouver Strategy Presentation To City Council November 28, 2017 Housing Affordability - A City on the Edge 1 ecstaticist The Challenges Are Many and Complex 2 We Need to Do More to Keep Vancouver
POLICY BRIEFING. ! Housing and Poverty - the role of landlords JRF research report
 Housing and Poverty - the role of landlords JRF research report Sheila Camp, LGIU Associate 27 October 2015 Summary The Joseph Rowntree Foundation (JRF) published a report in June 2015 "Housing and Poverty",
Universal Periodic Review Canada
 Universal Periodic Review Canada Individual submission on behalf of: The Wellesley Institute Submitted by: Michael Shapcott, Director of Community Engagement The Wellesley Institute, 45 Charles Street
ental Market report Vacancy Rate Up Slightly Vacancy Rate Edges Higher in 2004 Charlottetown CA CHARLOTTETOWN Canada Mortgage and Housing Corporation
 4.8% r ental Market report Vacancy Rate Up Slightly CHARLOTTETOWN Canada Mortgage and Housing Corporation Volume 6 Edition 1 October 2004 www.cmhc.ca Vacancy Rate Edges Higher in 2004 The vacancy rate
Return to Iowa farmland versus S&P 500
 Economics Working Papers (2002 2016) Economics 3-5-2012 Return to Iowa farmland versus S&P 500 Michael Duffy Iowa State University, mduffy@iastate.edu Follow this and additional works at: http://lib.dr.iastate.edu/econ_las_workingpapers
CHAPTER 2: HOUSING. 2.1 Introduction. 2.2 Existing Housing Characteristics
 CHAPTER 2: HOUSING 2.1 Introduction Housing Characteristics are related to the social and economic conditions of a community s residents and are an important element of a comprehensive plan. Information
City of Mitchell RENTAL HOUSING UPDATE
 City of Mitchell RENTAL HOUSING UPDATE March 2015 An updated examination of rental housing market conditions in the Mitchell area Community Partners Research, Inc. 10865 32 nd Street North Lake Elmo, MN
RENTAL MARKET REPORT. Manitoba Highlights* Highlights. Housing market intelligence you can count on
 H o u s i n g M a r k e t I n f o r m a t i o n RENTAL MARKET REPORT Highlights* C a n a d a M o r t g a g e a n d H o u s i n g C o r p o r a t i o n Date Released: Spring 2012 Figure 1 Winnipeg CMA Brandon
HOUSING MARKET OUTLOOK
 HOUSING MARKET INFORMATION HOUSING MARKET OUTLOOK Ottawa 1 C A N A D A M O R T G A G E A N D H O U S I N G C O R P O R A T I O N Date Released: Fall 2017 Figure 1 10,000 8,000 6,000 4,000 2,000 0 Ottawa
SJC Comprehensive Plan Update Housing Needs Assessment Briefing. County Council: October 16, 2017 Planning Commission: October 20, 2017
 SJC Comprehensive Plan Update 2036 Housing Needs Assessment Briefing County Council: October 16, 2017 Planning Commission: October 20, 2017 Overview GMA Housing Element Background Demographics Employment
The Corcoran Report 4Q16 MANHATTAN
 The Corcoran Report 4Q16 MANHATTAN Contents Fourth Quarter 2016 4/7 12/23 3 Overview 8 9 10 Market Wide 11 Luxury 24 2 Sales / Days on Market 3 Inventory / Months of Supply 4 5 Market Share Resale Co-ops
City of Exeter Housing Element
 D. Housing Stock Characteristics Government Code Section 65583(a) requires an analysis and documentation of household characteristics, including level of payment compared to ability to pay, housing characteristics,
June 12, 2014 Housing Data: Statistics and Trends
 June 12, 214 Housing Data: Statistics and Trends This presentation was provided to the Mayor s Housing Commission on June 12, 214 and provided to Council on June 23, 214 along with a report summarizing
Rental Market report. British Columbia Highlights* Highlights. Housing market intelligence you can count on
 H o u s i n g M a r k e t I n f o r m a t i o n Rental Market report Highlights* C a n a d a M o r t g a g e a n d H o u s i n g C o r p o r a t i o n Date Released: Spring 2012 Figure 1 Figure 2 Vancouver
The Planning & Development Department and the Legal Services Division recommends that Council:
 CORPORATE REPORT NO: R066 COUNCIL DATE: April 9, 2018 REGULAR COUNCIL TO: Mayor & Council DATE: April 5, 2018 FROM: SUBJECT: General Manager, Planning & Development City Solicitor Surrey Affordable Housing
November An updated analysis of the overall housing needs of the City of Aberdeen. Prepared by: Community Partners Research, Inc.
 City of Aberdeen HOUSING STUDY UPDATE November 2010 An updated analysis of the overall housing needs of the City of Aberdeen Prepared by: Community Partners Research, Inc. nd 10865 32 Street North Lake
Housing Indicators in Tennessee
 Housing Indicators in l l l By Joe Speer, Megan Morgeson, Bettie Teasley and Ceagus Clark Introduction Looking at general housing-related indicators across the state of, substantial variation emerges but
How Does the City Grow?
 This bulletin summarizes information from the City of Toronto s Land Use Information System II, providing an overview of the development projects received by the City Planning Division between January
Chapter 12 Changes Since This is just a brief and cursory comparison. More analysis will be done at a later date.
 Chapter 12 Changes Since 1986 This approach to Fiscal Analysis was first done in 1986 for the City of Anoka. It was the first of its kind and was recognized by the National Science Foundation (NSF). Geographic
Rent Stabilization, Vacancy Decontrol and Reinvestment in Rental Property in Berkeley, California
 Rent Stabilization, Vacancy Decontrol and Reinvestment in Rental Property in Berkeley, California REVISED FINAL REPORT July 16, 2012 Jay Kelekian, Executive Director Stephen Barton, Ph.D., Project Manager
CITY CLERK. Consolidated Clause in Policy and Finance Committee Report 7, which was considered by City Council on July 19, 20, 21 and 26, 2005.
 CITY CLERK Consolidated Clause in Report 7, which was considered by City Council on July 19, 20, 21 and 26, 2005. 3 Regent Park Revitalization - Financial Strategy (Ward 28) City Council on July 19, 20,
General Manager, Planning, Urban Design and Sustainability in consultation with the Director of Legal Services
 POLICY REPORT DEVELOPMENT AND BUILDING Report Date: December 12, 2017 Contact: Anita Molaro Contact No.: 604.871.6479 RTS No.: 12322 VanRIMS No.: 08-2000-20 Meeting Date: January 16, 2018 TO: FROM: SUBJECT:
A Tale of Two Canadas
 Centre for Urban and Community Studies Research Bulletin #2 August 2001 A Tale of Two Canadas Homeowners Getting Richer, Renters Getting Poorer Income and Wealth Trends in Toronto, Montreal and Vancouver,
New Opportunities in Rental Housing Financing
 CHRA CONGRESS SESSIONS SERIES 2017 New Opportunities in Rental Housing Financing With thanks to BC Housing for their generous support for this initiative May 2017 CANADIAN HOUSING AND RENEWAL ASSOCIATION
City of Lonsdale Section Table of Contents
 City of Lonsdale City of Lonsdale Section Table of Contents Page Introduction Demographic Data Overview Population Estimates and Trends Population Projections Population by Age Household Estimates and
2012 Profile of Home Buyers and Sellers New Jersey Report
 Prepared for: New Jersey Association of REALTORS Prepared by: Research Division December 2012 Table of Contents Introduction... 2 Highlights... 4 Conclusion... 7 Report Prepared by: Jessica Lautz 202-383-1155
Rents Up, Occupancy Steady
 Rents Up, Steady Kansas City s apartment market closed 2014 with a significant increase in rents compared to the prior year. The average per-square-foot rent was $0.88. At the end of 2013 it had been $0.85.
2017 SAN FRANCISCO HOUSING INVENTORY
 2017 SAN FRANCISCO HOUSING INVENTORY 2018 San Francisco Planning Department 1650 Mission Street, Suite 400 San Francisco, CA 94103-3114 www.sfplanning.org Front Cover: 588 Mission Bay Boulevard North (Five
ARLA Members Survey of the Private Rented Sector
 Prepared for The Association of Residential Letting Agents & the ARLA Group of Buy to Let Mortgage Lenders ARLA Members Survey of the Private Rented Sector Fourth Quarter 2010 Prepared by: O M Carey Jones
1. Introduction. 2. Policy Context
 APPENDIX A Memorandum of Understanding between BC Housing Management Commission (BC Housing) and the City of Vancouver (the City) regarding the development of City-owned sites for social and supportive
CITY OF VANCOUVER ADMINISTRATIVE REPORT
 CITY OF VANCOUVER ADMINISTRATIVE REPORT A6 Report Date: August 27, 2007 Author: Cameron Gray Phone No.: 604.873.7207 RTS No.: 06937 VanRIMS No.: Meeting Date: October 2, 2007 TO: FROM: SUBJECT: Vancouver
General Manager of Planning, Urban Design, and Sustainability, in consultation with the Director of Legal Services
 POLICY REPORT DEVELOPMENT AND BUILDING Report Date: September 27, 2016 Contact: Anita Molaro Contact No.: 604.871.6479 RTS No.: 11685 VanRIMS No.: 08-2000-20 Meeting Date: October 18, 2016 TO: FROM: SUBJECT:
The Impact of Market Rate Vacancy Increases One Year Report
 The Impact of Market Rate Vacancy Increases One Year Report January 1, 1999- December 31, 1999 Santa Monica Rent Control Board TABLE OF CONTENTS Summary 2 Market Rent Increases 1/1/99-12/31/99 4 Rates
ECONOMIC CURRENTS. Vol. 4, Issue 3. THE Introduction SOUTH FLORIDA ECONOMIC QUARTERLY
 ECONOMIC CURRENTS THE Introduction SOUTH FLORIDA ECONOMIC QUARTERLY Vol. 4, Issue 3 Economic Currents provides an overview of the South Florida regional economy. The report presents current employment,
Winnipeg and Manitoba Housing Data
 Winnipeg and Manitoba Housing Data Compiled by Josh Brandon Researcher, Housing and Community Development Canadian Centre for Policy Alternatives- Manitoba January 17, 2014 Core Housing Need... 2 Renting
HOUSING ALLOCATIONS SCHEME (Scheme of Letting Priorities)
") HOUSING ALLOCATIONS SCHEME (Scheme of Letting Priorities) Housing Allocations Scheme (Scheme of Letting Priorities) Section 1. Introduction 1.1 Introduction 1.2 Housing Areas 1.3 Transfer Applications
HOUSING ALLOCATIONS SCHEME (Scheme of Letting Priorities) Housing Allocations Scheme (Scheme of Letting Priorities) Section 1. Introduction 1.1 Introduction 1.2 Housing Areas 1.3 Transfer Applications
MISSISSIPPI GULF COAST APARTMENT SURVEY
 MISSISSIPPI GULF COAST APARTMENT SURVEY PREPARED FOR AND COORDINATED BY GULF REGIONAL PLANNING COMMISSION 1232 PASS ROAD TELEPHONE (228) 864-1167 GULFPORT MISSISSIPPI 39507 PREPARED BY W. S. LOPER AND
bae urban economics 2017 Apartment Vacancy and Rental Rate Survey Presented on behalf of UC Davis Student Housing and Dining Services
 bae urban economics 2017 Apartment Vacancy and Rental Rate Survey Presented on behalf of UC Davis Student Housing and Dining Services Overview The annual Apartment Vacancy and Rental Rate Survey collects
CONTENTS. Executive Summary 1. Southern Nevada Economic Situation 2 Household Sector 5 Tourism & Hospitality Industry
 CONTENTS Executive Summary 1 Southern Nevada Economic Situation 2 Household Sector 5 Tourism & Hospitality Industry Residential Trends 7 Existing Home Sales 11 Property Management Market 12 Foreclosure
2015 Housing Report. kelowna.ca. April Water Street Kelowna, BC V1Y 1J4 TEL FAX
 2015 Housing Report April 2016 1435 Water Street Kelowna, BC V1Y 1J4 TEL 250 469-8610 FAX 250 862-3349 ask@kelowna.ca kelowna.ca TABLE OF CONTENTS Introduction... 1 Housing Starts... 1 Ownership Housing
2015 First Quarter Market Report
 2015 First Quarter Market Report CAAR Member Copy Expanded Edition Charlottesville Area First Quarter 2015 Highlights: Median sales price for the region was up 5.1% over Q1-2014, rising from $244,250 to
Affordable Housing Policy. Economics 312 Martin Farnham
 Affordable Housing Policy Economics 312 Martin Farnham Introduction Housing affordability is a significant problem in Canada (especially in Victoria) There are tens of thousands of homeless in Canada Many
CITY OF HAMILTON PLANNING AND ECONOMIC DEVELOPMENT DEPARTMENT Economic Development Division
 CITY OF HAMILTON PLANNING AND ECONOMIC DEVELOPMENT DEPARTMENT Economic Development Division TO: Mayor and Members General Issues Committee COMMITTEE DATE: January 18, 2017 SUBJECT/REPORT NO: WARD(S) AFFECTED:
Building Consents Issued: June 2013
 Building Consents Issued: June 2013 Embargoed until 10:45am 30 July 2013 Key facts In June 2013, building consents were issued for: 1,487 new dwellings, including apartments 160 apartments, including 39
An overview of the real estate market the Fisher-DiPasquale-Wheaton model
 An overview of the real estate market the Fisher-DiPasquale-Wheaton model 13 January 2011 1 Real Estate Market What is real estate? How big is the real estate sector? How does the market for the use of
Social rents policy: choices and trade-offs
 Social rents policy: choices and trade-offs 5 November 2015 Social rent policy: choices and trade-offs Stuart Adam, Daniel Chandler, Andrew Hood and Robert Joyce Policy background and trade-offs Robert
Briefing: Rent reductions
 First issued 22 December 2015 Revised and reissued 5 February 2016 Further revised 29 March 2016 Briefing: Rent reductions Supporting implementation Summary of key points: This briefing sets out how Housing
San Francisco Planning Department April 2008
 2007 San Francisco HOUSING INVENTORY San Francisco Planning Department April 2008 1 2 3 4 1 Buena Vista Terrace, 1250 Haight St. - 40 affordable units, senior housing; conversion of historic church 2 Crescent
MISSISSIPPI GULF COAST APARTMENT SURVEY
 MISSISSIPPI GULF COAST APARTMENT SURVEY PREPARED FOR GULF REGIONAL PLANNING COMMISSION 1635 POPPS FERRY ROAD, SUITE G TELEPHONE (228) 864-1167 BILOXI, MISSISSIPPI 39532 PREPARED BY W. S. LOPER AND ASSOCIATES
CITI HABITATS. Manhattan Residential Sales Market Report
 Manhattan Residential Sales Market Report Contents 4/7 12/17 3 8 9 10 Market Wide 4 Sales / Days on Market 5 / Months of Supply 6 7 Market Share Resale Co-ops Resale Condos New Developments 11 Luxury Neighborhoods
Re: Grand Jury Report No. 1707, Homelessness in the Cities by the Contra Costa Grand Jury
 CITY OF SAN PABLO City Council Grand Jury Attn: Foreperson Jim Mellander P.O. Box 431 Martinez, CA 94553 (also by email to ctadmin@contracosta.courts.ca.gov) Re: Grand Jury Report No. 1707, Homelessness
2006 Census Housing Series: Issue 9 Inuit Households in Canada
 December 2010 Socio-economic Series 10-019 2006 Census Series: Issue 9 Inuit in Canada introduction This Research Highlight examines the housing conditions of Inuit 1 in Canada using data from the 2006
Federal Budget Pre-budget Submission: How best to use money for housing to stimulate the economy
 Federal Budget 2016-2017 Pre-budget Submission: How best to use money for housing to stimulate the economy February 2, 2016 John Dickie President Canadian Federation of Apartment Associations 640 1600