Investor Presentation First Half Results
|
|
|
- Dominic May
- 6 years ago
- Views:
Transcription
1 Investor Presentation 2011 First Half Results 1
2 Disclaimer This document has been prepared by ANF Immobilier SA ( ANF Immobilier ) solely for the use of presentations made to investorsor analysts. ANF Immobilier makes no representations or warranties that the information contained herein is accurate, correct or complete. The information set out herein is provided as of the date of the presentation and ANF Immobilier is under no obligation to keep current the information contained in this presentation. However, this information is subject to completion and/or revision and ANF Immobilier has the right to change the content hereof, in its sole discretion, at any time without prior notice. This document may contain information regarding current or future transactions as well as pro forma information to show ANF Immobilier as it would be after said transactions have been completed. These forward-looking statements are provided for information purposes only and are not guarantees of future performance. No information provided on this document constitutes, or should be used or considered as, an offer to sell or a solicitation of any offer to buy the securities or services of ANF Immobilier or any other issuer in any jurisdiction whatsoever. Sept


3 Image 3
4 H Figures, Strategy Strength Demonstration Significant Gross Rental Income growth +12.3% portfolio like-for-like +23.4% city-center like-for-like * Impact of Printemps litigation Court fixed annual rents at 2.1M (vs 0.4M) Printemps paid 9.1M one-off including rents, overdue rents & interests Recurring cash-flow +15.2% Recurring EBITDA margin 81.5% EPRA Net Asset Value= 40.5 per share Appraisal= 1,607M +2% FY 2011 guidance: +15% like-for-like rental growth for city-center properties likely to be overtaken Long term guidance reiterated 4
5 H Figures, Strategy Strength Demonstration M Reported Change 2011/2010 Reported * Reported H1 reported l-f-l H1 H1 Gross Rental Income % 35.9% B&B % 0.7% Marseille Lyon % 69.6% Recurring GRI % 12.3% EBITDA % % margin 85% % 78% Recurring EBITDA % % margin 82% % 78% Cash Flow % Recurring Cash Flow % RCF ( per share) % Average # of shares Capex Change in fair value (incl KG on disp) Net Income M Reported Reported Reported 30/06/ /12/ /06/2010 Real Estate portfolio 1,607 1,573 1,542 B&B Marseille Lyon 1,108 1,081 1,054 Net Debt EPRA NAV ( per share) EPRA Triple Net NAV ( per share) LTV 30% 29% 31% 5
6 Balanced Assets Mix Able to Seize Growth in Resiliant Location % H1 recurring GRI ANF Portfolio Market Environment Hotels 16.7M 45% 168 hotel properties accross France Typical location around highways Budget hotel average room rate 45.5 Fixed indexed long term leases (2019) Trends : B&B remains a very solid budget hotel chain in France with growth in RevPar and occupancy cost ratio of 20% Index : Q % Retail 10.0M 27% Residential 5.1M 14% Offices 4.8M 13% 62,000sqm in Haussmann ground floor building located in Lyon & Marseille citycenter Average size: 150sqm 129,000sqm in Haussmannbuilding located in Lyon & Marseille city-center Average size: 67sqm 54,000sqm in Haussmannbuilding located in Lyon & Marseille city-center Average size: 170sqm (Haussmann) 9,000 sqm in New buildings (Marseille) Lyon: Rue de la République one of the most attractive retail street outside Paris Prime rent above 2,500/sqm Marseille : Rue de la République on a growth path with prime rent /sqm Lyon: Strong demand and sustain turnover leading to rents increase above 12.0/sqm* Marseille : Base rent stable at 11.0/sqm* despite new supply from vacancies Furnished apartment at 20-25/sqm* * Per month Lyon: Little supply giving price power to ANF Prime rent at 250/sqm Marseille : Short of delivery in the medium term No vacancy Other rents = 0.4M (car parks, ) 6
7 Strong Revenue Growth Balanced Over the Portfolio Assets City-center +23.4% like-for-like Active asset management Efficiency of residential vacancy reduction and retail renegotiation (reversion potential) 34.0 Hotels 16.3 Marseille 2.1 Hotels: +0.7% like-for-like Lyon 9.0 Long term secured stream of rents providing high visibility Lyon M Chge Retail % Resid % Offices 2.1-1% Other 0.1 NA One-off P 7.8 NA % Hotels 0.2 Recurring 45.2 Hotels 16.5 Lyon Lyon 8.2 Marseille 9.5 Marseille M Chge Retail % Resid % Offices 2.7 * 78% Recurring Other 1.0 NA % * Includes full impact of Fauchier delivery Marseille 11.6 H Marseille Lyon Hotels H
8 Printemps Litigation A Major Step in a Long Run Value Creation Development Printemps lease - 0.4M -expired in June 2006 Printemps occupied 10,000sqm on Lyon, Place de la République Court to fix the renewal rents as both parties unable to find an agreement 9.1M one-off paid by Printemps Type Rents Amount 7.8M 0.9M Overdue rents from June 2006 to December 2010 Non recuring Jan 2011 Jun 2011 Rents Interest 0.4M Interest for the overdue period New rent fixed at 2.1M value June 2006 Court followed experts values at 450/sqm for weighted retail area No appeal by Printemps 9.1M 8
9 Image 9

10 Solid Valuation Appraisal = 1,607M City-Center Value Growth Over 4% like-for-like Appraisal = 1,607M Limited cap rate compression on the Citycenter portfolio: bps 5-10bps cap rate compression on hotels portfolio : average cap rate = 6.58% (vs. 6.68%) 1,600 1,400 1,200 1, Marseille 233 Lyon Marseille 275 Lyon Marseille 409 Lyon 248 1,392 B&B 460 Marseille 581 Lyon 351 1,543 B&B 466 Marseille 627 Lyon 450 1,504 B&B 474 Marseille 613 Lyon 417 1,573 B&B 492 Marseille 646 Lyon 435 1,607 B&B 499 Marseille 655 Dec 04 Dec 05 Dec 06 Dec 07 Dec 08 Dec 09 Dec 10 Jun 11 Lyon 453 ( M) 30/06/ /12/2010 Var Lyon % Marseille % City-center properties % Undergoing Development % City-center Portfolio 1,108 1,081 3% Hotels Portfolio % ANF Immobilier 1,607 1,573 2% Undergoing Development, no change in perimeter Restructuring: TAT, Plot 20 Dames, Pavillon Vacon, Rive Neuve New construction: Rabatau, Plot 34, Desbief Fauchier, Forbin and Plot 25 as city-center properties 10
11 Comfortable financing structure One of the Lowest Geared Company in Sector Loan-to-Value= 30% 70M Cash (as end of August 2011) Net financial debt = 489.1M (as 30/06/11) Cash & equivalent = 34.4M (as 30/06/11) Conservative strategy Financing balanced between available types of debt Sources of debt mixed of local and global banks Debt sources breakdown ( M) Leasing 4 51M available financing 3 credit facilities available from 3 different French banks 2011 & 2012 investment program financing secured No refinancing until % of credit lines fully hedged by plain vanilla swaps Cost of debt = 4.38% Unsecured (corporate) 268 Secured (mortgage) 251 Outlook Current pipeline financed with debt Internal discipline not to exceed 40% LTV (covenant =50%) 11
12 EPRA Net Asset Value = 40.5/share (excluding fair value of hedging instruments NAV Jun 10 NAV Dec 10 Dividend NAV Dec 10 post div Cap Increase Cash Flow FV Properties NAV Jun 11 (per share) 30/06/10 31/12/10 30/06/11 Chg 6 m Chg 12 m EPRA NAV % 5.2% EPRA NNNAV % 7.3% 12
13 Enlarged Free Float Drives Significant More Stock Liquidity Free float of ANF increased to 34% from 26% ( 61M) ANF Immobilier shareholding structure Liquidity increase : 2.8x more at August (vs. same period) EPRA Liquidity rule* matched since February > objective inclusion in EPRA Index for March 2012 CEPAC + BPCE 5% CNP Generali 5% 5% Free float 34% Volume moving average over same period (2011 & 2010) 30,000 Eurazeo 51% Number of shares 27,771,170 25,000 20,000 MA Vol 2011 MA Vol x more 15,000 10,000 5,000-6-May 11-May 16-May 21-May 26-May 31-May 5-Jun 10-Jun 15-Jun 20-Jun 25-Jun 30-Jun 5-Jul 10-Jul 15-Jul 20-Jul 25-Jul 30-Jul 4-Aug * EPRA Inclusion Liquidity Rule - Median daily turnover trading per month at least 0.05% of free float (rounded at 40% for ANF) - Test must pass at least 10 of the 12 months prior review - Liquidity tested on an annual basis in March. 13
14 Triple Source of Growth to Enhance Returns Strategy - Reducing vacancy in Marseille residential Innovative Asset Management - Capturing significant reversion potential - Expending product range Securedpipeline of investment - Restructuration of low yielding properties - Value creation on unexploited land bank in Marseille Opportunistic asset rotation - Disposal of matured properties block or unit in Lyon & Marseille - Potential new investments outside Rue de la République Cash Flow Accretive Strategy Over Medium Term 14
15 A Unique Property Investment Model Key Highlights The Two Most Dynamic Regional Cities A Diversified Asset Mix % of value % of rental income Eurazeo s SIIC subsidiary 850M market cap 1.6bn property portfolio B&B 31% Marseille 41% Hotels 45% Retail 27% Residential 13% Lyon 28% Other 2% Offices 13% 4 Pillars of Growth 1. Lyon 2. Marseille 3. B&B 4. Developments 80,000 sqm 453M portfolio Office, retail & residential 165,000 sqm 655M portfolio Office, retail & residential 168 hotels throughout France 499M portfolio 110,000 sqmof land reserves in Marseille & Lyon Yield on cost > 8% A Superior Rental Income Growth( M) : +59% like-for-like +55% CAGR : 10% like-for-like E 15
16 Marseille Residential Vacancy Reduction a Value Creation Catalyst Total vacancy (technical + historical) (sqm) S1 S2 S3 S5 Marseille Areas as 31/12/2010 Total 48,348 23,586 13,126 12,808 97, global occupancy (exc. Tech & hist) 87% 44% 62% 61% 70% Vacant as 31/12/10 Total 6,110 13,227 5,052 5,034 29,423 Vacant as 31/12/11 Total 3,600 9,927 2,052 3,034 18,613 35,000 30,000 25,000 20,000 15,000 10,000 Objectives for 2011: Reduction of 11,000sqm 29,423 1,000 1,500 1,600 1,700 3,000 2,000 Disposal Rental Vacant 18,623 Estimated vacancy at end 2011 = 18,600sqm Segment 1: no historical vacancy Segment 2: Launch of work in 2013 & sales Segment 3: Launch of work for sale in 2012 Segment 5: Sale New rental initiative to increase yield Flat sharing apartment Furnished apartment 3.0M new rents potential for medium term Full year run rate potential at a target rent of 11.5/sqm per month Excluding technical vacancy and disposal Base assumptions Vacant disposal= 4,600sqm New rent per month= 11.5/sqm Technical vacancy= 6% 5,000-31/12/2010 Segment 1 Segment 2 Segment 3 Segment 5 31/12/
17 City-center Portfolio: Significant Potential for Reversion Additional 7.6M Annual Rental Income in the Near Term +80% rental upside on standard leases maturing before 2013 = + 6.6M Marseille Lyon Area (sqm) Current ( /sqm) Target ( /sqm) Potential ( M) Area (sqm) Current ( /sqm) Target ( /sqm) Potential ( M) Retail 8, , Office 5, , Residential 26, * 11.00* 1.4 6, * 11.50* 0.1 * Rentsper month Total Marseille 2.9 Total Lyon 3.7 Potential rental upside on Loi 1948 regulated leases = + 1.0M Flat-rent lease regime subject to old regulation protective for the tenant in place 12,670 sqm average passing rent 4.21/sqm per month 17
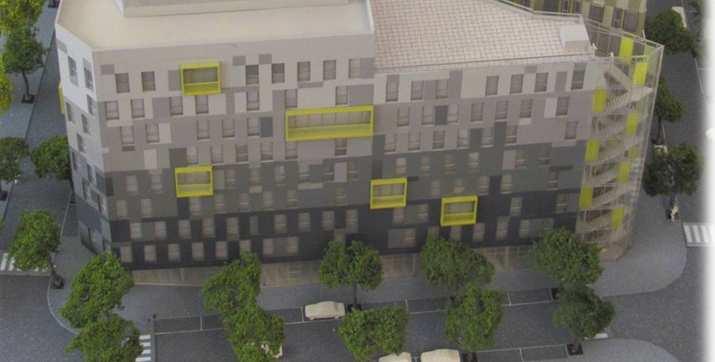
18 Example of Innovative Asset Management Plot 17 Creation of student furnished apartments Plot 17 refurbishment: Creation of student furnished apartments Tranche 1 (2010): From family apartments (29) to students apartments (80) Apartments before slicing(29) Student Apartments(80) Areas 2,846sqm Less-448sqm for common areas 2,398sqm Residential rents 418,000 12/sqm 595,000 20/sqm All-in Capex Private & common areas, façade 4.7M 5.5M Yield-on-cost 6.6% 9% Tranche 2 (2011): Follow-on with demand - objective 80 units 53 units undergoing (1,638sqm) 27 units (1,138sqm) currently occupied to be refurbished when vacant Tranche 2 In 2011 Objective * Includes retail GRI Gross Rental Income* out of Residential 619,000 20/m² 811,000 20/sqm All-in Capex Private & common areas, facade 4.5M 6,7M Yield-on-cost 11% 12% Strong demand from students, further furnished apartment creations in Plot 20 (100 to 120 units) 18
19 19
20 Example of Innovative Asset Management Mansardes Creation of prime apartments in attics Mansardes: Creation of new apartments in attics Tranche Total Year Surface (sqm) 1,404 2,128 1,757 1,236 6,525 Nb appart. (#) Rents ( ) 229, , , ,963 1,148,514 Rents ( /sqm/month) Yield-on-Cost privatif 12% 11% 12% 15% 12% 20


21 Example of Innovative Asset Management Mansardes Creation of prime apartments in attics 21
22 A Secured Pipeline of Investment with an Attractive Minimum Yield-on-Cost of 8% Restructuring New construction 6 restructuring developments on existing built assets Status Undergoing Development Pavillon-vacon Plot 25 Mansardes Launched 2012 Rive Neuve Plot 20 Dames Long term TAT 5 new construction developments on ANF lands Status Delivered Fauchier Forbin Launched 2011 Plot 34 Launched 2012 Rabateau Launched 2013 Desbief Development Development secured by major tenants Retail leases signed before works No start without costs & tenants secured 22

23 Image 23
24 Opportunistic Disposals Disposals booked& undergoing (excl. dev sale) Disposals booked(signed) Year Areas (sqm) Value Disp. Price Gain , M 47.5 M 5% , M 29.7 M 4% Residential unit sale 13/15/17 rue des Archers (Lyon 2 e ) 30 units for 2,130sqm Average Sale Price Vacant Renovated 5,375/sqm Average Sale Price without renovation 4,223/sqm , M 35.6 M 5% Disposals secured (agreement) Year Areas (sqm) Value Disp. Price Gain ,793 m² 7.9M 9.6M 22% Undergoing disposals Areas (sqm) Value m² 38,9M Pavillon Vacon(Marseille) 27 Pavillon : 9 units sold ; average price 3,700/sqm 50/54 Vacon : 13 units one sale 7 secured ; average price 3,953/sqm 30/35 Pavillon : 13 units one sale 4 options ; average price 4,018/sqm Secured Disposal Evolution ( M) To be Completed Disposal above appraisal Booked 30 Strong demand for residential Undergoing 24


25 Image 25


26 Image 26
27 Triple Source of Growth to Enhance Returns Restructuring & Developments Lead to a Secured Rent Forecast 2011 Rental Income +8% & +15% on city-center portfolio Increase of +55% in like-for-like rental income + 38M additional rents to be negotiated within 3 to 4 years Millions Capex to completion M Properties Development Lyon Marseille Total To be launched 6 Undergoing 6 Delivered 3 90 To be launched 9 80 Loi 48 1 Lyon 3 Undergoing Marseille 3 Marseille 4 Fauchier& Forbin delivered 92 in 2010, full impact in Rents Vacancy Reversion Restructuring New construction Target 27
28 Strong Investment Case Superior Platform for Growth and Returns Performance on delivery Confidence Solid financial structure Stock rewriting Strong results at 2011 H FY Rents objective likely to be overtaken Few impact of uncertainties on ANF Immobilier Medium term guidance reiterated Limited use of debt & cash available No refinancing before 2014 Liquidity improved Free float enlarged 28
29 Appendices 29
30 Strong Investment Case Superior Platform for Growth and Returns Guidance 2011 FY Recurring GRI 73.2M City-center +15% like-for-like 6 An experienced management team with a superior track record Innovative asset management on existing properties Value creation oriented development strategy Medium Term FY GRI 107M 5 An attractive & steadily growing dividend policy Current dividend yield= 5.0% dividend growth CAGR =6.4% 3 4 A best in class financing position providing flexibility to seize opportunity as they rise 30% LTV one of the lowest in sector No debt repayment due until 2014 A secured, visible and high yielding development pipeline fueled by opportunistic capital recycling strategy Reaping the Benefits of Past Restructuring Efforts 2 A resilient cash flow stream provided by hotels 168 mature hotels thouroughfrance leased back to B&B on long & indexed leases 1 A diversified high quality city-center portfolio with superior growth potential Presence in the 2 most dynamic French regional cities Substantial reversionary potential and vacation management opportunities 30
31 History Before 2002 In 2002 In 2004 In 2005 SCHP and partners SCHP & partners SCHP & partners SCHP & partners Rue Impériale de Lyon Sté Immobilière Marseillaise Rue Impériale Eurazeo Real estate Eurazeo Eurazeo Subsidiary Subsidiary Eurazeo Subsidiary Subsidiary Subsidiary Subsidiary Subsidiary Subsidiary ANF Immobilier Subsidiary Subsidiary Subsidiary The companies Rue Impérialede Lyon and SociétéImmobilièreMarseillaise were holding companies for the investment companies Eurafrance and Gaz&Eaux Income from investments was much greater than that from real estate which was then used as capital gains provision After restructuring its capital, Eurazeo inherited real estate assets from its parent companies and decided to manage them through a dedicated subsidiary, ANF Immobilier 31
32 Summarized Financial Statements ( M) H H Change H Gross rental income % 32.3 Recurring gross rental income % 32.3 Net operating expenses % -2.6 Administrative expenses % -4.4 EBITDA % 25.3 Recurring EBITDA % 25.3 Financial expenses % -7.7 Cash flow % 17.5 Recurring cash flow % 17.5 Change in fair value Other items Net income Interest cover ratio Cash flow per share ( ) % 0.7 Recurring cash flow per share ( ) % 0.7 Average number of shares (million)* /06/ /12/2010 Change 31/12/2009 Real estate portfolio 1, , % 1,504.8 Net financial debt % Other items % NAV 1, , % 1,061.1 Fair value hedge % Deferred taxes NNNAV 1, , % 1,031.4 Loan to value ratio (%) NAV per share ( ) % 38.9 NNNAV per share ( ) % 37.8 Period end number of shares (million)* * Number of shares adjusted for bonus issue of 1 share for every 20 held in
33 Indexing Applicable on the lease renewal date Indexes released ICC ILC IRL Q , Q , Q , Q , Q , Q , Q Annual Change +3.05% +2.25% +1.73% Source: INSEE ILC: publication of the implementing degree on November Calculated by the INSEE using three indexes: 1) retail price index (accounting for 50%); 2) construction index (for 25%) 3) the turnover index for retail trade (for 25%) Choice of lessor or tenant for the indexing of retail leases on either construction index or commercial rent index 33
34 Appraisal as June 30, ,600 1,400 1,200 1, Marseille 233 Lyon % 444 Marseille 275 Lyon % 657 Marseille 409 Lyon % Hors B&B 1,392 B&B 460 Marseille 581 Lyon % Hors B&B 1,543 B&B 466 Marseille 627 Lyon ,5% 1,504 B&B 474 Marseille 613 Lyon % +3,2% + 5% 1,573 B&B 492 Marseille 646 Lyon % +1,4% + 1% 1,607 B&B 499 Marseille 655 Dec 04 Dec 05 Dec 06 Dec 07 Dec 08 Dec 09 Dec 10 Jun 11-2% -7% +7,7% + 4% + 4% +9,5% +4,0% +4,3% Lyon 453 Like-for-like 34

35 Yield Applied to ANF Immobilier Portfolio valuation as June MARSEILLE Fourchette Juin 2011 Fourchette Dec 2010 Fourchette Juin 2010 Fourchette Dec 2009 Fourchette Juin 2009 Fourchette Dec 2008 Bureaux 6.6% 7.7% 6.6% 7.7% 6.9% 7.8% 7.20% 8.00% 7.20% 8.00% 6.65% 7.45% Commerces 5.8% 7.8% 5.8% 7.8% 5.8% 7.8% 6.00% 8.00% 5.85% 8.00% 5.75% 7.70% Habitation 4.5% 5.4% 4.5% 5.5% 4.8% 5.5% 4.80% 5.60% 4.50% 5.60% 4.00% 5.05% Loi % 5.2% 2.4% 5.2% 2.4% 4.9% 2.40% 5.30% 2.15% 5.30% 2.15% 4.80% LYON Fourchette Juin 2011 Fourchette Dec 2010 Fourchette Juin 2010 Fourchette Dec 2009 Fourchette Juin 2009 Fourchette Dec 2008 Bureaux 6.6% 7.2% 6.6% 7.2% 6.7% 7.3% 6.90% 7.70% 6.90% 7.70% 6.25% 7.20% Commerces 5.3% 6.1% 5.4% 6.4% 5.6% 6.4% 5.75% 6.40% 5.75% 7.45% 5.45% 6.90% Habitation 4.5% 4.9% 4.5% 4.9% 4.8% 5.0% 4.80% 5.20% 4.50% 5.20% 4.00% 4.65% Loi % 4.7% 2.4% 4.7% 2.4% 4.8% 2.40% 4.95% 2.15% 4.95% 2.15% 4.40% 35
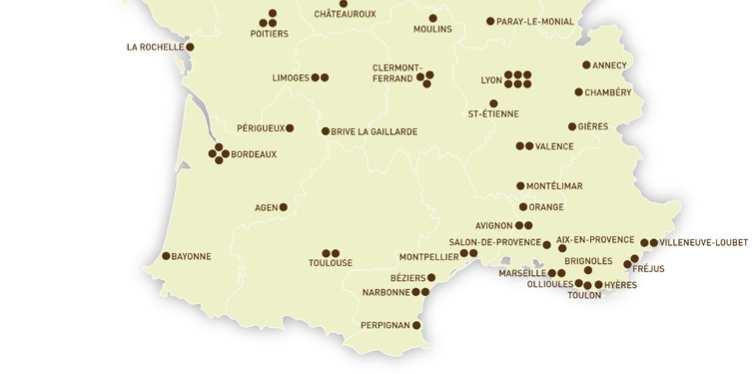
36 New Investment to Recycle Capital at Better Yield A 100M pipeline of new investmentswithan expectedreturn of 7% Focus on French domestic market, in regional major cities Selection criteria Infrastructure & communications Proactive local development policy Density of the economic Demography 36
 with a central position to main European cities Headquarters of several international major companies Rue de la République rue")
37 Lyon, France 2nd Capital Lyon 2 nd richest city after Paris and 2 nd student city in France Capital of province Industrial background UNESCO World Heritage site A strong regional influence Two millennia of urban settlement Dense transport network (air, rail, road) with a central position to main European cities Headquarters of several international major companies Rue de la République rue de la re Main shopping street of Lyon and most frequented one Served by metro, bus and tramway Pedestrian on 2/3 New developments Confluence Hotel Dieu 37


38 Marseille on the Move Centre Bourse 2012 Vieux-Port to be half pedestrian in 2013 Hôtel Intercontinental
39 Marseille, the New French Metropolis Marseille : a new growth dynamic 2nd city in France by number of inhabitants 850,000 (INSEE) Positive in-flow of inhabitants Unemployment reduced since st Mediterraneanharbor, 1st Frenchharbor, 4th European harbor Enterprises creation over the last 5 years Rue de la République City heart of Marseille Link between Vieux-Port and Euroméditerranée New transport services Public installations fully renovated Public investments: Euroméditerranée and Marseille European Capital of Culture 500,000 tourists for 2008; 1,000,000 tourists expected for 2011 Hotels room capacity in constant rise: new hotels under development European Capital of Culture in 2013 Public budget 98M on 4 years (excl capex) Investments 1Bn Renovation of the city Cultural conversion of unused land-banks 39

 - 3 hours to Paris: 22 millions passengers a year Brussels in 3 hours, London 7 hours Major motorway intersection: 3 hours to Lyon, 5 hours to Milan or")
40 Marseille on the Move Towards 2013! Marseilles Provence: 2 nd French metropolis 2 million inhabitants 850,000 in Marseille Positive net balance since ,000 jobs unemployment stable at 11% 155,000 establishments, including 700 foreign companies Exceptional accessibility The leading French port: 2 million passengers, 96 million tons of freight International airport: 7 million passengers, 51% international) serving 76 cities 26 countries High-speed train link (TGV) - 3 hours to Paris: 22 millions passengers a year Brussels in 3 hours, London 7 hours Major motorway intersection: 3 hours to Lyon, 5 hours to Milan or Barcelona Industry, innovation, services: a wealth of expertise Aeronautical: world leader for helicopter manufacture Micro-electronics: leading area in France and in southern Europe Telecom: French telecoms hub Multimedia: leading media pole in Southern Europe Chemistry-petro-chemistry: 30% of French refinery capacity Food-processing: biggest industrial employer in France Logistics - transport: multi-model hub in France: air-railsea-river-road 40
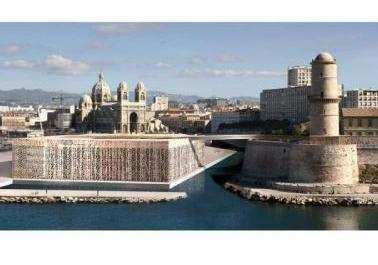
41 ANF Immobilier at the heart of Euroméditerranée Euroméditerranée: a structuring business district 7 billion public and private investments 2nd financial services centre in France Biggest number of telecom infrastructures in Southern Europe A reference site for international trade Around Rue de la République Vieux-Port to be half pedestrian in 2013 Development of the Intercontinental Hôtel Dieu Renovation of the Centre Bourse shopping centre B 2012: World Water Forum 180 countries represented 2013: European Capital of Culture 1 billion invested in around forty projects 10 million visitors expected 6 million currently 2016: Soccer European cup Project involving the Vélodrome stadium around 100,000sqm, offices, retail outlets and residential units 2.5 billion of public and private investments 41
42 Lyon: Intense Business Activity Portfolio key indicators as at 31 December 2010 Overview of letting transactions over 2010 Offices Retail Residential Total Project Area 27,000 sqm 22,000 sqm 31,000 sqm 80,000 sqm 36,500 sqm Number of units Occupancy rate* 98% 98% 85%** 2010 rents( M) Other = *Excluding technical vacancy ** Includes the vacancy associated with the Mansardes and TAT development project Offices Retail Residential Total New leases signed 1,058 sqm 543 sqm 9,096 sqm 10,697 sqm Leases renewed 323 sqm 759 sqm 636 sqm 1,718 sqm Average rent on new and renewed leases 227 / sqmp.a. (+3% vs. 2009) 1,479 /sqm p.a. 13/sqm p.m. (+6% vs. 2009) 2010 leasing highlights: Desigual (retail) on 240 sqm at 2,674/sqm (vs. 514/sqm previous tenant) Orange (retail) on 303 sqm at 2,145/sqm (vs. 604/sqm previous tenant) No variable rent 42
43 Marseille: Intense Business Activity Portfolio key indicators as at 31 December 2010 Offices Retail Residential Total Project Area 27,000 sqm 40,000 sqm 98,000 sqm 165,000 sqm 93,000 sqm Number of units ,524 Occupancy rate* 84%** 88% 76% 80% 2010 rents( M) Other = *Excluding technical vacancy ** Includes vacancy for restructuring Overview of letting transactions over 2010 Offices Retail Residential Total New leases signed 3,212 sqm 3,444 sqm 14,598 sqm 21,254 sqm Leases renewed 147 sqm 1,040 sqm 2,868 sqm 4,055 sqm Average rent on new and renewed leases 167/sqm p.a. (+8% vs. 2009) 435/sqm p.a. 13/sqm p.m. (+8% vs. 2009) 2010 leasing highlights Rip Curl (retail) on 316 sqm at 506/sqm base rent Calzedonia (retail) on 85 sqm at 553/sqm base rent Variable rent for retail c.9-10% of tenant turnover in (vs. 6-8% in ) 43


44 168 B&B Hotels 12,124 rooms 44
 2010 EBIDTA= 33.6M (+9.")
45 B&B Key indicators Strong demand for quality budget rooms 2010 Occupancy= 73.35% (+1.05pts) Average rate= (+3.3%) RevPar= (+4.8%) Operationnal profitability (France) 2010 Revenues= 163.6M (+6.8%) 2010 EBIDTA= 33.6M (+9.5%) Acquisition on July 2007 Acquisition of the premises of 159 B&B hotels located all over France Cost of the transaction: 471M, including transfer taxes Triple net fixed and indexed (ILC) leases for 12 years firm, renewable twice for 12 years Sustainable rents Occupancy cost ratio=20% Main considerations Complementarities between a recurring income stream (B&B) and value creation on the assets Significant increase in the size of ANF Quality of hotel locations: 94% of sites deemed very good or good by Jones Lang LaSalle Hotels Potential renegotiation at end of lease term and indexation more favourable than ILC 45
46 Lyon: Intense Business Activity Prime retail rent to 2,600/sqm near Place Bellecour Latest market rent evidence Retail : 2,200 2,600/sqm Offices : /sqm Residential: 11 13/sqm (month) Latest market rent evidence Retail : 600 1,000/sqm Offices : /sqm Residential: 11 13/sqm (month) ANF Immobilier Assets 46
47 Marseille: Intense Business Activity New retailers show attractiveness ANF Immobilier Assets Latest market rent evidence Retail : /sqm Offices : /sqm Residential : 11 13/sqm (month) Dames Mazenod Plot 25 Forbin Public Car Park 800 spaces Fauchier Desbief Trinquet Malaval Segment 1 Segment 2 Segment 3 47
48 Summary of Development Pipeline Development Location Description Financial Timing Forbin Marseille - Place de la Joliette New construction of a 125 hotel room rent to B&B Capex = 6M Delivered Q Full impact in FY 2011 revenues Fauchier Marseille République area New construction of residential (6,500sqm fully sold) offices (13,000sqm) rent to City of Marseille Rive Neuve Marseille - Vieux-Port Restructuring of 3,200sqm offices on the HQE certified PavillonVacon Marseille - Place Charles de Gaulle Restructuring of 8,000sqmwith 3,000 sqm retail & 5,000 sqm residential (sale on progress) Capex = 23M (offices) GRI= 0.7M GRI= 1.7M retail Delivered Q Full impact in FY 2011 revenues 24 mths works Expected delivery Q Retail: delivered & rent Plot 20 Dames Marseille - Boulevard des Dames Restructuring of 10,000sqmof residential & retail GRI= 1.3M 12 mths works Expected delivery Q Plot 25 Marseille - Place de la Joliette Restructuring of 3,000sqmof retail & 82 apartments at Place de la Joliette (Marseille) Mansardes Lyon Rue de la République Restructuring of 5,100sqmat top floor building allowing creation of 119 apartments Rabatau Marseille Prado area New construction of 3,900sqmoffices building HQE certified Plot 34 Marseille Euroméditerranée New construction of 26,000sqmoffices, hotel, residential block TAT Lyon Place de la République Restructuring of 10,000sqmof retail & residential in connection with Printemps renewal GRI= 2.5M Monthly rent at 14.5/sqm GRI= 0.6M GRI= 4.0M GRI= 7.0M Works under progress Expected delivery Q Works under progress Expected delivery Q mths works Expected delivery Q Works under progress Expected delivery mths works subject to negotiation with Printemps Desbief Marseille - Place de la Joliette New construction of 21,000sqmoffices building GRI= 5.3M 30 mths works 48


49 Marseille European Capital of Culture 2013 A major advantage for ANF Immobilier E C I G B F A H ANF Immobilier developments A. Trinquet F. Dames B. Fauchier G. Plot 25 C. Forbin H. Pavillon Vacon D. Rive Neuve I. Desbief E. Plot 34 D 6 million of tourists in
 Office rental income = 2.")
50 Development Delivered in 2010: Yield-on-Cost Above 8% New development Fauchier Office buildings 13,000sqm (4,000sqm sold) Delivery occurred in October 2010, one month ahead of schedule Investment funded by the Calyon credit facility (Euribor + 50bp) Office rental income = 2.1 M leased to the City of Marseilles (DGUH) Global investment = 23M (excluding VEFA (sale before completion) and residential units) Forbin Hotel B&B with 125 rooms Delivery occurred in October 2010, one month ahead of schedule Additional work on request from the lessor: Funding secured by the Martin Maurel mortgage (Euribor + 120bp) Rental income = 0.6M; Global investment = 6M Restructuring From 4,336sqm to 17,200sqm Fauchier Attic apartments Segment A Renovation 5,100sqm of residential units created (119#) 2,000sqm already delivered - project completed in 2012 Investment funded by the Calyon credit facility (Euribor + 50bp) Rental income = 0.9 M; Global investment = 15M From 870sqm to 2,975sqm Forbin Plot 17 Segment 2 Buildings République Conversion into small residential units (1,700sqm) Work started in Q1 and completed in July Within 2 months, lease of 81 residential units Investment = 10M - Yield-on-Cost = 9.40% 50


")
 Green building Investment = 9M Plot 25: signature of the")
 Investment = 20M Dames Plot 34")
51 Development : Targeted Yield Above 8% Start-up in 2011 Start-up in 2012 New building Euromed plot 34 Office space, hotel, residential units and retail areas covering 26,000sqm 30 months' work (start Q2 2011) Investment = 57M New building Rabatau Offices 3,900sqm 13 months' work (start S1 2012) Green building Investment = 7M Restructuring Dames Building used for retail and housing, 6,500m² 12 months' work (start Q4 2011) Investment = 19M Rive Neuve Mixed use building, 3,200sqm 24 months' work (start S1 2012) Green building Investment = 9M Plot 25: signature of the McDonalds lease Prime building with retail, office space and housing, 7,000sqm 12 months' work (start S1 2011) Investment = 20M Dames Plot 34 Plot 25 Rabateau Rive Neuve 51


52 Development to be launched in 2013: Targeted Yield Above 8% New building Restructuring Desbief Offices 20,000sqm 30 months' work (start S2 2013) Investment = 60M TAT Restructuring a full plot, 31,000sqm 30 months' work Printemps dispute Start of work? Investment = 78M Desbief TAT 52
53 Restructuring Lyon: TAT (31,000 sqm) Estimated lease income: 7M ANF Immobilier property 12,350 sqm Surface area created 3,300 sqm Surface area acquired 7,915 sqm ANF Immobilier 23,566 sqm Printemps 6,500 sqm Still to acquire 900 sqm i.e. 2.9% of the entire project Suggested project Printemps lease Today Tomorrow Bat A 5,500 sqm Bat B 4,500 sqm 10,000 sqm? Rents 450,000 2,800, /sqm Buildings occupied by Printemps 53
54 Leases Maturity Marseille Sqm 25,000 20,000 15,000 10,000 5,000 - < > Offices Retail Residential 54
55 Leases Maturity Lyon Sqm 9,000 8,000 7,000 6,000 5,000 4,000 3,000 2,000 1,000 - < > Offices Retail Residential 55
56 Stock price January-August 2011 /share ,000 Volume ,000 80,000 70,000 60, , Volumes ANF EPRA SBF 250 CAC 40 40,000 30,000 20,000 10,
57 Significant Increase in Distribution Dividend per share= 1.54 Yield above 5%* Increase in distribution Dividend per share +8% Total distribution +13% Distribution= 42.3M, above SIIC requirements ( 9.5M) Requirements from rental activity= 4.5M Requirement from disposal= 5.0M 2011 Distribution +13% * Based on average share price at 31/12/
58 ANF Immobilier, Social Responsibility Corporate Social Responsibility Integrated into ANF Immobilier Practices Sustainable development in the development pipeline ANF Immobilier among first companies to be granted BBC label (low consumption building) in renovation New developments at High Quality Environment standards Process of evaluating day-to-day change for all employees in regards of sustainable developments A transparent company governance Company with Executive board and Supervisory board Board committees (audit, properties, compensation) Full Registration Document filled since 2007 Ethic code signed by all employees A motivating and ambitious HR policy Profit sharing agreement for all employees Shareholder and senior staff interest aligned Broaden social aids Supplementary retirement plan for all employees Community involvement with non-for-profit organizations to help young form difficult suburbs 58
59 Compensation Scheme Historic 2006 Free share plan Maximum number of share attributed 2007 Stock Stock Stock Stock Bruno Keller 24, ,478 56,966 62,108 80,000 84,283 Xavier de Lacoste Lareymondie 13,246 70,999 25,534 37,105 38,500 40,632 Brigitte Perinetti 2,109 11,962 2,834 3,483 4,000 - Ghislaine Seguin ,787 8,500 9,060 Executive Board 39, ,439 85, , , ,975 Staff 17,647 87,505 22,708 27,270 27,500 32,945 Total 57, , , , , ,920 Strike price not adjusted 59
60 Corporate Governance Half of Supervisory Board Independant Alain Lemaire* (vice-président) Philippe Audouin Sébastien Bazin* Bruno Bonnel* Jean-Luc Bret Fabrice de Gaudemar Supervisory Board (12) Patrick Sayer, President Executive Board (3) Bruno Keller, Chairman Xavier de Lacoste Lareymondie, COO Ghislaine Seguin Eric Le Gentil* Philippe Monnier* Jean-Pierre Richardson Isabelle Xoual* Théodore Zarifi Audit Committee Philippe Audouin, Théodore Zarifi, Eric Le Gentil* Remuneration and Selection Committee Philippe Monnier*, Sébastien Bazin*, Isabelle Xoual* Property Committee Patrick Sayer, Sébastien Bazin*, Jean-Luc Bret, Philippe Monnier* Headcount ANF Immobiilier 57 Management 5 Property mgmt 13 Development 16 Accounting 15 Support 8 * Independant 60
61 About ANF Immobilier ANF Immobilier owns and manages a real-estate portfolio of 1.6 billion euros in the city centres of Lyon and Marseilles as well as a portfolio of 168 hotel properties in France, all operated by the B&B chain It is a real estate company with SIIC status, targeting residential and third party property rentals with significant operations in Lyon and Marseille city centres Listed on Eurolist B of NYSE EuronextParis, ANF Immobilier is part of the Eurazeo group. Financial Calendar 2011 Q3 Revenue November 1, FY Results March 15, Q1 Revenue May 10, H1 Results August 28, 2012 Investor Relations Contact investorrelations@anf-immobilier.com Research on ANF Immobilier Exane: Valerie Guezi HSBC: Stéphanie Dossmann Invest Securities: Benoit Faure-Jarrosson, Paul Arkwright Tradition Securites: Laetitia d'eprémesnil Kepler: Samuel Henry-Diesbach Aurel BGC: Julien Guez ANF shares ISIN code: FR Bloomberg/Reuters: ANF FP, ANF.pa Listed on Euronext Eurolist B Indices: SBF 250, CAC All Shares, IEIF SIIC France 27,771,170 shares in circulation Statutory threshold declarations 1% 61


62 62
Investor Presentation First Half Results
 Investor Presentation 2010 First Half Results 1 Disclaimer This document has been prepared by ANF Immobilier SA ( ANF Immobilier ) solely for the use of presentations made to investors or analysts. ANF
ANF Immobilier. Analyst Meeting 4/3/2015
 Image 1 ANF Immobilier Analyst Meeting 4/3/2015 2 10 years of ANF Immobilier 04 March 2015 3 Transformation 4 Total Shareholder Return 2005-2015 65 1,09 55 45 0,80 1,86 1,18 1,24 1,36 1,45 1,54 1,69 3,06
Analyst Presentation 12 February 2018
 Analyst Presentation 12 February 2018 Disclaimer This presentation is not an offer or an invitation to sell or exchange securities, or a recommendation to subscribe, buy or sell ANF Immobilier securities.
2018 Half-Year Results Ongoing developments to prepare for the future
 Press Release 2018/07/20 2018 Half-Year Results Ongoing developments to prepare for the future The Board of Directors of Société de la Tour Eiffel, which met on 20 July 2018, approved the financial statements
Half-year financial report 2010
 ANF Immobilier Half-year financial report 2010 First half 2010 results: Follow-on strong growth in rents and cash flow Rents up 7.2% on a like-for-like basis EBITDA margin improves by 2.3 points to 80.6%
2017 Annual Results Construction of solid and sustainable cash flow continues
 Press Release 2018/03/07 2017 Annual Results Construction of solid and sustainable cash flow continues The Board of Directors of the Société de la Tour Eiffel, meeting on 7 March 2018, approved the annual
FIRST HALF 2011 RESULTS
 Paris, August 31, 2011 FIRST HALF 2011 RESULTS Rents up 33%, +12% on a like-for-like basis, ahead of forecasts 15% increase in recurring cash flow EPRA NAV = 40.5 per share Debt ratio of 30% - cash flow
2016 FULL-YEAR RESULTS WEBCAST 21 FEBRUARY 2017
 FULL-YEAR RESULTS WEBCAST 21 FEBRUARY 2017 DISCLAIMER The information contained in this document has not been independently verified. No representation, warranty or undertaking, express or implied, is
2016 Annual Results Strong growth in earnings
 Press Release 08/03/2017 2016 Annual Results Strong growth in earnings The Board of Directors of the Société de la Tour Eiffel met on 8 March 2017, chaired by Hubert Rodarie, and approved the financial
Results H September 9, 2009
 Results H1 2009 September 9, 2009 1 Strategy for the crisis Fair value: analysis and impacts The group s companies Analysis of H1 2009 accounts Affine on the stock exchange 2 STRATEGY FOR THE CRISIS Simplifying
H RESULTS 10 AUGUST 2018 TLG IMMOBILIEN AG H RESULTS
 TLG IMMOBILIEN AG H1 2018 RESULTS DISCLAIMER This presentation includes statements, estimates, opinions and projections with respect to anticipated future performance of TLG IMMOBILIEN ("Forward-Looking
Q RESULTS 15 MAY 2018 TLG IMMOBILIEN AG Q RESULTS
 TLG IMMOBILIEN AG Q 208 RESULTS DISCLAIMER This presentation includes statements, estimates, opinions and projections with respect to anticipated future performance of TLG IMMOBILIEN ("Forward-Looking
AUDIOCAST PRESENTATION H1/2018
 AUDIOCAST PRESENTATION H1/2018 IRREPLACEABLE AND MULTI-FUNCTIONAL ASSETS IN GROWING CATCHMENTS 2 WE CONTINUE OUR TRANSFORMATION JOURNEY 2011 H1/2018 GOAL 2022 41 # OF SHOPPING # OF SHOPPING 78 30 CENTRES
ATRIUM Q RESULTS ANALYST AND INVESTOR CALL. 18 May 2016
 ATRIUM Q1 2016 RESULTS ANALYST AND INVESTOR CALL 18 May 2016 KEY EVENTS IN 2016 YTD OPERATIONAL PERFORMANCE Core Markets¹: NRI increased 1.2% to 36.3m; LFL NRI remained stable at 31.4m Russia continues
2014 half-year results. 23 rd July 2014
 23 rd July 2014 Main achievements first half 2014 Stated 2014 objectives Achievements to date New acquisitions One agreement contracted for a 8,300 m² office building in the southern inner rim of Paris
2017 FULL YEAR 16 FEBRUARY 2018
 FULL YEAR RESULTS 16 FEBRUARY 2018 : Delivering in line with strategy 1.1 billion invested Asset acquisitions 610m Development capex 414m Land acquisitions 92m 525 million disposals Asset sales 432m Land
January - September 2011 results
 January - September 2011 results 14 November 2011 Highlights 9M 2011 RESULTS Commercial Property business continues showing a recurrent income giving the company stability and solidity, representing 95%
2018 HALF-YEAR RESULTS
 2018 HALF-YEAR RESULTS WEBCAST 25 JULY 2018 Disclaimer The information contained in this document has not been independently verified. No representation, warranty or undertaking, express or implied, is
ICADE REVENUE UP +8.4% IN Q1 2018
 PRESS RELEASE Issy-les-Moulineaux, April 27, 208 ICADE REVENUE UP +8.4% IN Q 208 Commercial Property Investment: o Rental income up by as much as +5,8% to 99.0 million o Financial occupancy rate at 92.4%
HALF-YEAR RESULTS. Presentation of 31 July 2013
 HALF-YEAR RESULTS 2013 Presentation of 31 July 2013 AFFINE KEY TAKEAWAYS EPRA Earnings down due to disposals (-) Rental income down as a consequence of 2012 disposals (-) Negative global result from associates
Q BUSINESS ACTIVITY AND REVENUE WEBCAST 25 APRIL 2017
 BUSINESS ACTIVITY AND REVENUE WEBCAST 25 APRIL 2017 DISCLAIMER The information contained in this document has not been independently verified. No representation, warranty or undertaking, express or implied,
AUDIOCAST PRESENTATION Q1/2018
 19.4.2018 AUDIOCAST PRESENTATION Q1/2018 HIGHLIGHTS Q1/2018 EPRA EARNINGS PER SHARE EUR 0.041 -Divestments in 2017 and weaker currencies impacted EPRA EPS -Efficient cost management with administrative
Investor Presentation. First Quarter 2015
 Investor Presentation First Quarter 2015 1 CAUTIONARY STATEMENTS Today s session and our answers to questions contain statements that constitute forward-looking statements about expected future events
M A R C H 22,
 MARCH 22, 2017 1 01 2 ADO THE PURE-PLAY BERLIN RESIDENTIAL SPECIALIST Investment highlights 1 2 3 4 Berlin residential pure play with a 2.3bn quality portfolio Efficient, fully integrated and scalable
26 February 2013 FIRST HALF RESULTS PRESENTATION
 26 February 2013 FIRST HALF RESULTS PRESENTATION Investment highlights Proven track record of consistent earnings growth and meeting targets Strategically located and diverse residential portfolio Urban
Investor Update Q results. Maëlys Castella October 22, 2015
 Investor Update Q3 2015 results Maëlys Castella October 22, 2015 Agenda Highlights Operational review Financial review Conclusion Questions 2 Q3 2015; Another quarter of improved performance Revenue million
Rental income, EUR million Like-for-like growth in rental income, percent
 Akelius Residential Property AB (publ) interim report January to June summary Apr Jun Apr Jun Jan Jun Jan Jun Jan Dec Rental income, EUR million 115 113 233 229 469 Like-for-like growth in rental income,
HALF-YEAR FINANCIAL REPORT JUNE 30, 2011
 HALF-YEAR FINANCIAL REPORT JUNE 30, 2011 SUMMARY I HALF-YEAR FINANCIAL REPORT JUNE 30, 2011 1 Management report 2 Related party transactions 4 Declaration by management 4 II CONSOLIDATED FINANCIAL STATEMENTS
Strong progress for Property Management
 Strong progress for Property Management Interim report January-June 2016 Stockholm, 18 August 2016 Anders Nissen, CEO Liia Nõu, CFO Forward-looking statements PANDOX EXCELLENCE IN HOTEL OWNERSHIP & OPERATIONS
Sponda Financial Results Q4 and FY February 2017
 Sponda Financial Results Q4 and FY 2016 3 February 2017 1. 2. 3. 4. Highlights for the Period Kari Inkinen Portfolio Development Pia Arrhenius Financials Niklas Nylander Business Environment and Business
Interim statement from the Board of Directors for the first quarter of 2015
 Regulated information - under embargo until 05/05/2015, 8 a.m. Antwerp, 5 May 2015 Interim statement from the Board of Directors Acquisition of a modern logistics site of approximately 52.000 m² in a prime
ICADE 1 ST QUARTER 2015 ACTIVITY
 PRESS RELEASE Paris, 5 May 2015 ICADE 1 ST QUARTER 2015 ACTIVITY 1. PROPERTY INVESTMENT DIVISION 1.1. Rental business Asset classes Financial occupancy rate 31/03/2015 31/12/2014 Average lease terms (as
DREAM GLOBAL ANNOUNCES FOURTH QUARTER RESULTS, 24% ANNUAL NET ASSET VALUE GROWTH AND OVER 6% FOURTH QUARTER COMPARATIVE NOI GROWTH
 DREAM GLOBAL ANNOUNCES FOURTH QUARTER RESULTS, 24% ANNUAL NET ASSET VALUE GROWTH AND OVER 6% FOURTH QUARTER COMPARATIVE NOI GROWTH TORONTO, FEBRUARY 20, 2019 DREAM GLOBAL REIT (TSX:DRG.UN, FRA:DRG) (or
Interim presentation. 13 July, Anders Nissen, CEO Liia Nõu, CFO
 Interim presentation 13 July, 2018 Anders Nissen, CEO Liia Nõu, CFO Profitable growth 20% R12M Return on equity 2 1 2 3 Profitable acquisitions in new large markets Continued strong development in Brussels
INTERIM FINANCIAL STATEMENTS. for the period ended on March,
 INTERIM FINANCIAL STATEMENTS for the period ended on March, 31 2015 INDEX 1. Key aspects 5 2. Consolidated profit & loss account 9 3. Consolidated balance sheet 11 4. EPRA metrics 14 5. Significant events
FY 2015 Results TLG IMMOBILIEN AG March FY 2015 Results Presentation
 FY 2015 Results TLG IMMOBILIEN AG March 2016 DISCLAIMER This presentation includes statements, estimates, opinions and projections with respect to anticipated future performance of TLG IMMOBILIEN ("Forward-Looking
2013 annual results. 19 th March 2014
 19 th March 2014 Main achievements 2013 Stated 2013 objectives Achieved Securing rental income Pre-letting Montrouge - 6 years - 1.8m New leases / extensions Total amount: 9.2m Asset disposals ( 200m over
2015 ANNUAL RESULTS WEBCAST 16 FEBRUARY 2016
 ANNUAL RESULTS WEBCAST 16 FEBRUARY 2016 DISCLAIMER The information contained in this document has not been independently verified. No representation, warranty or undertaking, express or implied, is made
Rental income, EUR million Like-for-like growth in rental income, percent
 Akelius Residential Property AB (publ) year-end report January to December summary Oct Dec Oct Dec Jan Dec Jan Dec Rental income, EUR million 129 124 482 469 Like-for-like growth in rental income, percent
Rental income, EUR million Like-for-like growth in rental income, percent
 Akelius Residential Property AB (publ) interim report January to September summary Jul Sep Jul Sep Jan Sep Jan Sep Jan Dec Rental income, EUR million 120 116 353 345 469 Like-for-like growth in rental
This document does not constitute an offer to sell or an invitation or solicitation of an offer to subscribe for or purchase any securities, and
 This document has been prepared by Atrium (the Company ). This document is not to be reproduced nor distributed, in whole or in part, by any person other than the Company. The Company takes no responsibility
2013 Half Year Results
 2013 Half Year Results 31 July 2013 Geopost, Enfield An active and successful period Strong operational performance Lettings up 30% Good momentum in development pipeline Further cost savings achieved Portfolio
Good underlying growth
 Good underlying growth Interim report January-March 2016 Stockholm, 3 May 2016 Anders Nissen, CEO Liia Nõu, CFO Agenda Introduction Financial review Market and business Q&A Anders Nissen Liia Nõu Anders
Q EPRA KEY METRICS
 Q1 EPRA KEY METRICS EPRA KEY METRICS The European Public Real Estate Association (EPRA) is a not-for-profit association based in Brussels that represents the interests of both listed real estate companies
MANAGING HIGH VALUE ADDED PROCESSES GLOBALLY. MID TERM FINANCIAL REPORT JUNE 30 th 2017
 1 MANAGING HIGH VALUE ADDED PROCESSES GLOBALLY MID TERM FINANCIAL REPORT JUNE 30 th 2017 DISCLAIMER 2 This document has been prepared by CIE Automotive, S.A. ("CIE Automotive"), and is for information
Rental income, SEK million 1,016 1,040 3,051 3,095 4,109 Growth in rental income comparable properties, percent
 Akelius Residential Property AB (publ) interim report January to September summary Jul Sep Jul Sep Jan Sep Jan Sep Jan Dec Rental income, SEK million 1,016 1,040 3,051 3,095 4,109 Growth in rental income
Corporate Presentation 4 th Quarter 2018 Financial Results
 Corporate Presentation 4 th Quarter 2018 Financial Results 17 January 2019 Important Notice This presentation is for information only and does not constitute an invitation or offer to acquire, purchase
Interim statement by the board of directors on the first quarter of 2018
 Regulated information - under embargo until 03/05/2018, 6 p.m. Antwerp, 3 May 2018 on the first quarter of 2018 Third logistics site in the Netherlands: agreement signed for the purchase of the site and
PROPOSED ACQUISITION OF 107 EUNOS AVENUE 3, SINGAPORE
 SABANA SHARI AH COMPLIANT INDUSTRIAL REAL ESTATE INVESTMENT TRUST (a real estate investment trust constituted on 29 October 2010 under the laws of the Republic of Singapore) 1. INTRODUCTION PROPOSED ACQUISITION
Rental income, EUR million** Like-for-like growth in rental income, percent Net operating income, EUR million
 Akelius Residential Property AB (publ) interim report January to March summary* Jan Mar Jan Mar Jan Dec Rental income, EUR million** 119 116 469 Like-for-like growth in rental income, percent 3.7 5.4 5.1
Interim report presentation
 Interim report presentation 10 November, 2017 Anders Nissen, CEO Liia Nõu, CFO Forward-looking statements This presentation contains forwardlooking statements. Such statements are subject to risks and
Opportunities and Hurdles for Investors in Light Industrial Properties
 Opportunities and Hurdles for Investors in Light Industrial Properties Experiences from the German Market Tom de Witte CFRO Geneba Properties NV Sommerconferenz Darmstadt, 7 July 2016 15.07.16 Contents
Interim presentation. 24 April, Anders Nissen, CEO Liia Nõu, CFO
 Interim presentation 24 April, 2018 Anders Nissen, CEO Liia Nõu, CFO A stable earnings development 21% Return on equity 2 1 2 3 Profitable acquisitions Positive effects from product development A seasonally
NBG PANGAEA REIC April 2017
 NBG PANGAEA REIC April 2017 Disclaimer This presentation has been prepared by NBG PANGAEA Real Estate Investment Company (former MIG Real Estate REIC or the Company) solely for information purposes and
Dream Global REIT 2018 Fourth Quarter 1
 EPRA Metrics The annual EPRA BPR Awards aim to recognize and commend upon the efforts of property companies that have successfully adopted the EPRA BPR Guidelines. Based on the assessment performed by
Great Elm Capital Group, Inc. An Introduction to the Fort Myers Transaction & GEC s Real Estate Strategy
 Great Elm Capital Group, Inc. An Introduction to the Fort Myers Transaction & GEC s Real Estate Strategy March 6, 2018 2018 Great Elm Capital Group, Inc. Disclaimer Statements in this presentation that
For personal use only
 US RESIDENTIAL FUND Investor Update April 2017 Disclaimer This Presentation is not a prospectus, product disclosure statement or other offering document under Australian law, including the Corporations
FINANCIAL YEAR 2012 RESULTS
 FINANCIAL YEAR 2012 RESULTS 31 January 2013 Contents Financial Highlights FY 2012 Portfolio Update KLCA & Cyberjaya Office Market Outlook Klang Valley & Penang Retail Market Outlook Conclusion 2 Important
NRE: Creating Value for Shareholders. March 13, 2018
 NRE: Creating Value for Shareholders March 13, 2018 Forward Looking Statement This presentation may contain certain forward-looking statements within the meaning of the Private Securities Litigation Reform
2012 HALF-YEAR RESULTS 3-DIMENSIONAL REAL ESTATE
 3-DIMENSIONAL REAL ESTATE www.altareacogedim.com CONTENTS 1. Introduction 2. Residential 3. Offices 4. Retail 5. Finance 6. Outlook 2 INTRODUCTION 3 H1 2012 RESULTS Like-for-like SALES 728 m +50% +23%
First Sponsor Group Limited Investor Presentation 24 July 2015
 First Sponsor Group Limited Investor Presentation 24 July 2015 The initial public offering of the Company s shares was sponsored by DBS Bank Ltd., who assumes no responsibility for the contents of this
SUNTEC REIT FINANCIAL RESULTS. For the 2 nd Quarter and Half Year ended 30 June 2017
 SUNTEC REIT FINANCIAL RESULTS For the 2 nd Quarter and Half Year ended 30 June 2017 26 July 2017 Agenda 03 2Q 17 Highlights 05 Financial Highlights 18 Office Portfolio Performance 25 Retail Portfolio Performance
FY18/12 Q2 PRESENTATION
 FY18/12 Q2 PRESENTATION RENESAS ELECTRONICS CORPORATION JULY 31, 2018 2018 Renesas Electronics Corporation. All rights reserved. FINANCIAL TARGETS AND STRATEGY Long-term Financial Targets *1 (Starting
Rental income, SEK million 1,071 1,014 4,122 4,109 Growth in rental income comparable properties, percent
 Akelius Residential Property AB (publ) year-end report January to December summary Oct Dec Oct Dec Jan Dec Jan Dec Rental income, SEK million 1,071 1,014 4,122 4,109 Growth in rental income comparable
MANAGING HIGH VALUE ADDED PROCESSES GLOBALLY. MID TERM FINANCIAL REPORT SEPTEMBER 30 th 2017
 1 MANAGING HIGH VALUE ADDED PROCESSES GLOBALLY MID TERM FINANCIAL REPORT SEPTEMBER 30 th 2017 DISCLAIMER 2 This document has been prepared by CIE Automotive, S.A. ("CIE Automotive"), and is for information
Strong management team
 Strong management team Stable & transparent REIT framework Solid operational performance Top quality shareholder base High quality property portfolio 1 A strong management team Unprecedented learning curve
Douja Promotion Groupe Addoha. An African leader of Real Estate Development
 Douja Promotion Groupe Addoha An African leader of Real Estate Development Summary I II III IV V Addoha Group: Strong fundamentals & a clear focus Development in Morocco Development in Africa Key highlights
Investor Presentation Second Quarter 2006
 Investor Presentation Second Quarter 2006 2006 Highlights (Six months to June 30, 2006) Revenues up 10.2% from accretive acquisitions Net Operating Income up 10.9% NOI margin increases Stabilized portfolio
Transit-Oriented Development Specialized Real Estate Services
 COLLIERS INTERNATIONAL Transit-Oriented Development Specialized Real Estate Services Accelerating success. Colliers International transit-oriented development GROUP P. 1 2 transit-oriented development
Investor Presentation Shaw and Partners - Emerging Leaders Conference
 Investor Presentation Shaw and Partners - Emerging Leaders Conference Your Community Developer 31 May 2017 1 AVJennings at a glance 2 ON AFFORDABLE HOUSING IN URBAN GROWTH CORRIDORS STRONG BALANCE SHEET
ATRIUM COMPANY PRESENTATION
 ATRIUM COMPANY PRESENTATION THE LEADING OWNER & MANAGER OF CENTRAL EASTERN EUROPEAN SHOPPING CENTRES May 2017 / Based on 2016 full-year results ATRIUM LEADING OWNER & MANAGER OF CEE SHOPPING CENTRES Strong
Invincible Investment Corporation Follow on Acquisition and Disposition
 Invincible Investment Corporation Follow on Acquisition and Disposition TSE Code : 8963 July 25, 2017 Deal Summary Portfolio rebalance, acquiring new addition of Hotel MyStays Gotanda Station at a 7.3%
DEMIRE Deutsche Mittelstand Real Estate AG Conference Call 1H 2018 Results
 DEMIRE Deutsche Mittelstand Real Estate AG Conference Call 1H 2018 Results 16 Disclaimer This document is for informational purposes only. This document is not intended to form the basis of any investment
SMARTCENTRES REIT ANNUAL GENERAL MEETING Smart Today Smart Tomorrow. May 16, 2018
 REIT Smart Today Smart Tomorrow May 16, 2018 FORWARD LOOKING STATEMENTS SmartCentres wishes to remind all participants at this meeting that the presentations which follow contain certain forward-looking
Ascott Residence Trust A Leading Global Serviced Residence REIT
 Ascott Residence Trust A Leading Global Serviced Residence REIT Acquisition of a Second Property in New York, United States of America 1 14 March 2016 Disclaimer IMPORTANT NOTICE The value of units in
Preliminary Results Presentation
 Preliminary Results Presentation Year to 30 June 2008 Tuesday 9 September 2008 Alan Bowkett Chairman Chairman s Introduction Early recognition, by management team of industry issues Adjustment in strategy
Rate Case Dismissal & Asset Exchange July 24, 2017
 Rate Case Dismissal & Asset Exchange July 24, 2017 Safe Harbor Forward Looking Statements This presentation contains forward-looking statements about the business, financial performance, contracts, leases
INVESTOR PRESENTATION. September 2011
 INVESTOR PRESENTATION September 2011 Disclaimer This document does not constitute or form part of and should not be construed as, an offer to sell or issue or the solicitation of an offer to buy or acquire
Q BUSINESS ACTIVITY AND REVENUE WEBCAST 25 APRIL 2018
 BUSINESS ACTIVITY AND REVENUE WEBCAST 25 APRIL 2018 DISCLAIMER The information contained in this document has not been independently verified. No representation, warranty or undertaking, express or implied,
2014 ANNUAL REPORT TRANSFORMATION
 2014 ANNUAL REPORT TRANSFORMATION 01 Profile SUMMARY - 02 Message from Alain Lemaire, Chairman of the Supervisory Board 04 Interview with Bruno Keller and Renaud Haberkorn 08 Our major successes in 2014
Akiş REIT 2Q18 Performance Presentation August 2018
 Akiş REIT 2Q18 Performance Presentation August 2018 1 Breaking News New Investment Project The project is located in the uprising Aldgate region (London) which is 20-25 min away from central London The
NBG PANGAEA REIC September 2016
 NBG PANGAEA REIC September 2016 Disclaimer This presentation has been prepared by NBG PANGAEA Real Estate Investment Company (former MIG Real Estate REIC or the Company) solely for information purposes
Corporate Presentation 3 rd Quarter 2017 Financial Results
 Corporate Presentation 3 rd Quarter 2017 Financial Results 17 November 2017 Important Notice This presentation is for information only and does not constitute an invitation or offer to acquire, purchase
Second Quarter 2008 Results
 Second Quarter 2008 Results Earnings Release and Supplemental Financial Information Investor Relations Contact: Julia Freitas ri@gafisa.com.br 1 Overview of 2Q08 Results - Wilson Amaral, CEO Financial
America s Parking REIT
 * America s Parking REIT November 2017 1 *Name change assuming the closing of the merger between MVP REIT, Inc. and MVP REIT II, Inc. Disclaimers Cautionary Note on Forward-looking Statements This presentation
Extraordinary General Meeting 19 June 2012 ARA-CWT Trust Management (Cache) Limited KNOWING. BELIEVING. DELIVERING
 Limited KNOWING. BELIEVING. DELIVERING") Extraordinary General Meeting 19 June 2012 ARA-CWT Trust Management (Cache) Limited Important Notice This presentation does not constitute an offer, invitation or solicitation of securities in Singapore
Extraordinary General Meeting 19 June 2012 ARA-CWT Trust Management (Cache) Limited Important Notice This presentation does not constitute an offer, invitation or solicitation of securities in Singapore
HALF YEAR RESULTS H Asset rotation and vacancy reduction driving operating performance. Vacancy rate of 16.6% (down 1.8% versus year-end 2017)
") HALF YEAR RESULTS H1 2018 Asset rotation and vacancy reduction driving operating performance Vacancy rate of 16.6% (down 1.8% versus year-end 2017) EPRA NAV of 38.44 per share (up 5% versus year-end 2017)
HALF YEAR RESULTS H1 2018 Asset rotation and vacancy reduction driving operating performance Vacancy rate of 16.6% (down 1.8% versus year-end 2017) EPRA NAV of 38.44 per share (up 5% versus year-end 2017)
LAPACO PAPER PRODUCTS LTD.
 LAPACO PAPER PRODUCTS LTD. 5200 J.A. Bombardier Street Longueuil, Quebec TABLE OF CONTENTS Section Photographs & Location Maps 1 Project Summary 2 The Location 3 Lapaco Paper Products Ltd. 4 Investment
Interim Results for the six months ended 30 June 2012
 Interim Results for the six months ended 30 June 2012 Disclaimer This document has been prepared by ARA Asset Management (Prosperity) Limited, in its capacity as the manager ( REIT Manager ) of Prosperity
FIRST INDUSTRIAL REALTY TRUST REPORTS FIRST QUARTER 2018 RESULTS
 First Industrial Realty Trust, Inc. 311 South Wacker Drive Suite 3900 Chicago, IL 60606 312/344-4300 FAX: 312/922-9851 MEDIA RELEASE FIRST INDUSTRIAL REALTY TRUST REPORTS FIRST QUARTER 2018 RESULTS Occupancy
Presentation for REITs Symposium 2016
 Presentation for REITs Symposium 2016 4 June 2016 Important Notice This presentation shall be read in conjunction with OUE Commercial REIT s Financial Results announcement for 1Q 2016 dated 10 May 2016.
Acquisition of Wilkie Edge. Extraordinary General Meeting 23 November 2007
 Acquisition of Wilkie Edge Extraordinary General Meeting 23 November 2007 Important Notice THIS PRESENTATION IS AVAILABLE ONLY TO PERSONS WHO ARE NON-U.S. PERSONS, PERSONS WITH ADDRESSES OUTSIDE THE U.S.
ALE Property Group. Annual General Meeting 13 November Breakfast Creek Hotel, Brisbane, QLD 1
 ALE Property Group Annual General Meeting 13 November 2018 Breakfast Creek Hotel, Brisbane, QLD 1 Contents Highlights FY18 Results Properties and Development Updates Capital Management FY19 Outlook Attractive
2018 Q3: TENANTS FIRST Putting the needs of our tenants at the centre of everything we do. 26 October 2018
 2018 Q3: TENANTS FIRST Putting the needs of our tenants at the centre of everything we do 26 October 2018 CONTENT 1 HIGHLIGHTS AND KEY FIGURES 2 NEW NAME 3 MARKET OVERVIEW 4 GENERAL COMPANY OVERVIEW 7
ALE Property Group. 31 December 2017 Half Year Results. The Breakfast Creek Hotel, Brisbane, QLD
 ALE Property Group 31 December 2017 Half Year Results The Breakfast Creek Hotel, Brisbane, QLD 1 Contents Highlights December 17 Half Year Results Pub Property Portfolio Capital Management FY18 Outlook
FY2012 RESULTS PRESENTATION
 FY2012 RESULTS PRESENTATION 21 August 2012 INVESTMENT HIGHLIGHTS Proven track record of consistent earnings growth and meeting targets Strategically located and diverse residential portfolio Urban and
MTR Corporation Interim Results. 7 August 2007
 MTR Corporation 2007 Interim Results 7 August 2007 2007/8/7 Page 1 Results highlights and business overview Mr. CK Chow, CEO 2007/8/7 Page 2 First half 2007 achievements Merger Key legislative process
9M 2018 Results. 13 th November 2018
 9M 2018 Results 13 th November 2018 AGENDA 01 02 03 04 9M 2018 Highlights 9M 2018 Financial Results Business Performance Closing Remarks 2 01 9M 2018 Highlights 3 Lar España maintains its path of strong
FRASERS LOGISTICS & INDUSTRIAL TRUST PROPOSED DIVESTMENT OF 80 HARTLEY STREET IN THE STATE OF NEW SOUTH WALES, AUSTRALIA
 SGX-ST ANNOUNCEMENT For immediate release FRASERS LOGISTICS & INDUSTRIAL TRUST (a real estate investment trust constituted on 30 November 2015 under the laws of the Republic of Singapore) PROPOSED DIVESTMENT