ROBYG Group Financial results Q1 2018
|
|
|
- Jessie Berry
- 5 years ago
- Views:
Transcription


1 ROBYG Group Financial results Q Warsaw, June 5th 2018


2 HIGHTLIGHTS HIGHLIGHTS Q * Including amounts kept on individual escrow accounts and in Mutual Funds. 2
3 Agenda I. Summary II. Presales and revenue s perspective III. Financial results IV. Plans of ROBYG Group V. Appendices 3

4 Summary Q
, - M series (PLN 20 million), - N series (PLN 17.3 million), - O series (PLN 26 million), - P series (PLN 60 million), - R series (PLN 12.9 million), - P series (PLN 46.7 million).")
5 ROBYG Group- material investments and financial activities Q1 2018* FINANCING NEW PLOTS Bonds: Redemption of PLN million: - K1 series (PLN 38.9 million), - L series (PLN 1.5 million), - M series (PLN 20 million), - N series (PLN 17.3 million), - O series (PLN 26 million), - P series (PLN 60 million), - R series (PLN 12.9 million), - P series (PLN 46.7 million). Issuance of PLN 300 million: - PA series (PLN 300 million). Bank loans: Total new facilities: PLN 50.0 million: ROBYG Finance: - revolving loan (with the limit of PLN 50 million). Total investment app. PLN million with the potential for construction of app units. PLN 82.0 million (plot areaapp. 6.3 ha)- purchase agreements of the shares in the entity owns the plots on Ursus district in Warsaw with the potential for construction of app units. PLN 18.6 million (plot areaapp. 1.4 ha)- purchase agreements of the shares in the entity owns the plots on Wrzeszcz district in Gdańsk with the potential for construction of app. 400 units. * The specification includes also the transactions performed after 31 March 2018 till the date of the presentation (marked in blue). 5
6 Agenda I. Summary II. Presales and revenue s perspective III. Financial results IV. Plans of ROBYG Group V. Appendices 6


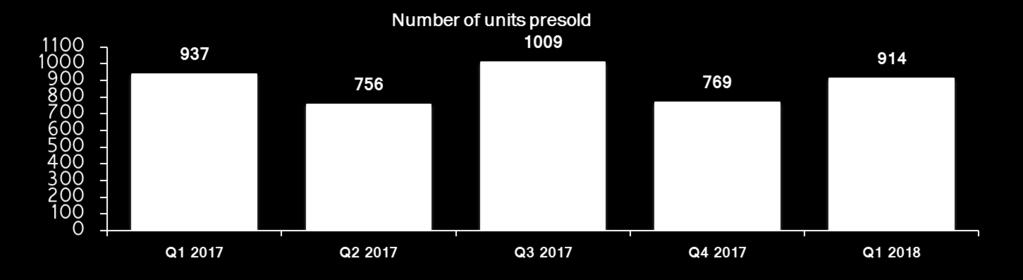
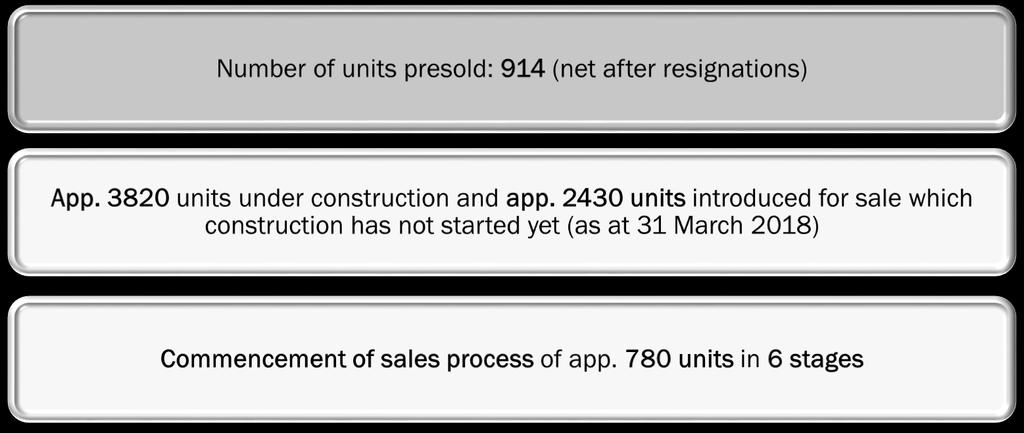
7 ROBYG Group number of presold units Presold units in Q units (+19% Q/Q) 17% Target: % 22% 10% 9% 56% 7


8 ROBYG Group Presale structure Q Presold units in Q units (+19% Q/Q) 8

9 ROBYG Group units on offer FINISHED GOODS ON OFFER: 4% 9
10 Number of units to be completed in and also (contracted) until 31 March 2018 () number of contracted units Total Green Mokotów, Apartamenty Villa Nobile (all: 51%) - Warsaw 786 (778) 266 (212) 190 (112) 456 (324) Młody Wilanów, Osiedle Życzliwa Praga (all: 100%) Warsaw 75 (75) 93 (68) 93 (68) Lawendowe Wzgórza/Stacja Nowy Gdańsk (100%)- Gdansk 459 (457) 381 (372) 296 (231) 677 (603) Słoneczna Morena, MoreNova (all: 100%) Gdansk 193 (186) 736 (613) 115 (102) 851 (715) Zajezdnia Wrzeszcz, Mila Baltica (all 100%)- Gdansk 358 (357) 237 (213) 482 (308) 719 (521) Osiedle Kameralne, Osiedle Kameralne II (all: 100%) - Warsaw 40 (35) 112 (106) 112 (106) Young City 2, Stacja Nowy Ursus (all:51%)- Warsaw 389 (374) 465 (359) 558 (237) (596) Nowa Letnica, Nadmotławie Estates (all: 100%) - Gdansk 586 (559) 542 (176) 1128 (735) Forum Wola, Ogrody Wilanów (all: 100%) - Warsaw 161 (128) 298 (243) 459 (371) Percentages in brackets indicate Group s share in the project. * Completed in prior years but not recognised till **In 2018 the Group is planning to start the construction of additional units to be completed in (2 262) (2 562) (1 477) (4 039) * +312 (266) - ** (2 528) (2 562) (1 477) (4 039) -506 (422) +506 (422) (422) 2 106(2 106) (2 984) (1 477) (4 461) 10
11 Number of units to be completed in 2018* Project City Total no. of units to be completed in 2018 On offer or 31 Mar 2018 Out of which: Not introduced to 31 Mar 2018 Osiedle Kameralne II Warsaw Forum Wola Warsaw Green Mokotów Warsaw Stacja Nowy Ursus Warsaw Young City II Warsaw Lawendowe Wzgórze/ Stacja Nowy Gdańsk Gdańsk Słoneczna Morena Gdańsk Nowa Letnica Gdańsk MoreNova Gdańsk Zajezdnia Wrzeszcz Gdańsk Total 2,944 2,944 - * Estimation of the planned investments may change. 11
12 Number of units to be completed in 2019* Project City Total no. of units to be completed in 2019 On offer or 31 Mar 2018 Out of which: Not introduced to 31 Mar 2018 Forum Wola Warsaw Green Mokotów Warsaw Ogrody Wilanów Warsaw Osiedle Życzliwa Praga Warsaw City Sfera Warsaw Young City 2 Warsaw Young City 3 Warsaw Stacja Nowy Ursus Warsaw Lawendowe Wzgórze/ Stacja Nowy Gdańsk Gdańsk MoreNova Gdańsk Nowa Letnica Gdańsk Zajezdnia Wrzeszcz Gdańsk Nadmotławie Gdańsk Jagodno Wrocław Total 3,123 2, * Estimation of the planned investments may change. 12
13 Agenda I. Summary II. Presales and revenue s perspective III. Financial results IV. Plans of ROBYG Group V. Appendices 13
14 LIQUIDITY POSITION Net debt ratio_1* = 0.38 * Net debt ratio= net debt ** / equity ** Net debt = interest bearing liabilities intercompany loans cash and cash equivalents amounts kept on individual escrow accounts up to PLN 50 million Net debt ratio_2* = 0.30 * Net debt ratio= net debt ** / equity ** Net debt = interest bearing liabilities intercompany loans cash and cash equivalents amounts kept on individual escrow accounts and mutual funds Amount to be collected from clients* = PLN million * Calculated based on the signed agreements with clients. 14
15 Estimated financial results* (PLN thousands) Q Q Change Revenues % Cost of sales ( ) (56 324) 177.3% Gross profit on sales % Post-tax share of the profit or loss of JV (50) N/A Selling and marketing expenses (8 374) (7 059) 18.6% Administrative expenses (10 187) (7 622) 33.7% Other incl. transaction fee (10 704) 389 N/A Operating profit % Finance income (6.7%) Finance costs (4 488) (3 267) 37.4% Profit before tax % Income tax expense (6 619) (914) 624.2% Net profit % Net profit attributable to equity holders of the parent % Gross profit margin on sales 29.0% 18.9% Net profit margin 11.3% 1.4% * ROBYG S.A. Group has not published financial statements for 3 months ended 31 March Moreover the financial statements were not audited. In addition, the Group has adopted IFRS 15 as of 1 January 2018 using the modified retrospective method with the cumulative effect of initial application of IFRS 15 recognized as at 1 January 2018 without restating the comparatives. 15
16 Historical financial results Statement of Comprehensive Income (PLN thousands) Revenues Cost of sales ( ) ( ) ( ) ( ) Gross profit on sales Post-tax share of the profit or loss of JV Selling and marketing expenses (29 352) (21 992) (16 262) (13 780) Administrative expenses (33 250) (31 368) (28 014) (25 364) Other (2 519) (4 249) 260 Operating profit Finance income Finance costs (10 391) (14 336) (16 169) (17 059) Profit before tax Income tax expense (33 882) (13 219) (5 515) Net profit Net profit attributable to equity holders of the parent Gross profit margin on sales 26.5% 22.5% 16.0% 17.8% Net profit margin 18.4% 20.1% 17.0% 11.4% 16
17 Estimated financial condition* (PLN thousands) Q Change Q Total assets, including: % Non-current assets, including: % Investment properties and investment properties under construction % Land designated for development (7.1%) Investments in joint ventures (0.8%) Inventories % Trade and other receivables (24.9%) Amounts kept on individual escrow accounts and Mutual Funds (1.9%) Cash and cash equivalents % Equity (6.0%) Total liabilities, including: % LT interest bearing liabilities % Current interest bearing liabilities % Advances received from clients % * ROBYG S.A. Group has not published financial statements for 3 months ended 31 March Moreover the financial statements were not audited. In addition, the Group has adopted IFRS 15 as of 1 January 2018 using the modified retrospective method with the cumulative effect of initial application of IFRS 15 recognized as at 1 January 2018 without restating the comparatives. 17
18 Debt financing* (nominal value and maturity of bank credit facilities and bonds) as at March 31th, 2018 <1 year 1-2 years 2-3 years 3-4 years 4-5 years Total BANK CREDIT FACILITIES* million million million 0.00 million 0.00 million million BONDS million million million million TOTAL million million million million million million * Including the nominal value of lease payments relating to sale and leaseback transaction of the office building 18
19 Agenda I. Summary II. Presales and revenue s perspective III. Financial results IV. Plans of ROBYG Group V. Appendices 19


20 Strategic goals Sales of app units in 2018 Start of activities in Wroclaw Maintain the level of the land bank 20
 * Units which presale has already begun (as at 31")

21 Land bank* Total land bank units units on offer = units ROBYG has also land in WROCŁAW approximately for 300 units (the sale has not started yet) * Units which presale has already begun (as at 31 March 2018) not included. In addition, the Group has signed the purchase agreement of the plots with the total area of app. 2.7 ha located in Gdańsk, Wrzeszcz district. The Group hasn t had defined the investment planes for the plots. 21

22 Agenda I. Summary II. Presales and revenue s perspective III. Financial results IV. Plans of ROBYG Group V. Appendices 22


23 ROBYG - Team Oscar Kazanelson Chairman of the Supervisory Board Zbigniew Wojciech Okoński President of the Board Eyal Keltsh Vice-President of the Board, COO Artur Ceglarz Vice-President of the Board, CFO 23


24 Description of investments- completed (1) Nowa Rezydencja Królowej Marysieńki District: Wilanów No. of stages: units thousand sqm Q Completion date: Q Szczęśliwy Dom District: Ochota No. of stages: units 18.1 thousand sqm Q Completion date: Q Osiedle Zdrowa District: Wilanów No. of stages: units 57.0 thousand sqm Q Completion date: Q


25 Description of investments- completed (2) City Apartments District: Żoliborz No. of stages: units 88.0 thousand sqm Q Completion date: Q Osiedle Królewskie District: Wilanów No. of stages: units 38.0 thousand sqm Q Completion date: Q Park Wola Residence District: Wola No. of stages: units 16.9 thousand sqm Q Completion date: Q


26 Description of investments- completed (3) Modern Żoliborz District: Żoliborz No. of stages: units 7.9 thousand sqm Q Completion date: Q Albatross Towers City: Gdańsk District: Przymorze No. of stages: units 42.6 thousand sqm Q Completion date: Q Królewski Park District: Wilanów No. of stages: units 27.6 thousand sqm Q Completion date: Q


27 Description of investments- completed (4) Young City District: Bemowo No. of stages: units 65.2 thousand sqm Q Completion date: Q Młody Wilanów District: Wilanów No. of stages: units 12.8 thousand sqm Q Completion date: Q Mila Baltica City: Gdańsk District: Zaspa No. of stages: units 14.9 thousand sqm Q Completion date: Q

28 Description of investments- completed (5) Apartamenty Villa Nobile District: Wilanów No. of stages: units 39.1 thousand sqm Q Completion date: Q

 app. 175.")

29 Description of investments- under construction (1) Lawendowe Wzgórza/ Stacja Nowy Gdańsk City: Gdańsk District: Jasień No. of stages: app. 40 Stages completed: 18 Stages under construction*: 7 Słoneczna Morena City: Gdańsk District: Piecki-Migowo No. of stages: app. 23 Stages completed: 18 Stages under construction*: 4 Osiedle Kameralne District: Bemowo No. of stages: 5 Stages completed: 3 app units (completed: 1704 units) app thousand sqm Q Planned completion date: Q app units (completed: 1474 units) app thousand sqm Q Planned completion date: Q *Including stages in presale which construction has not begun yet (as at 31 March 2018). app. 550 units (completed: 283 units) app thousand sqm Q Planned completion date: Q
 app. 17.")
 app. 43.3 thousand sqm Stacja Nowy Ursus District: Ursus No.")

30 Description of investments- under construction (2) Osiedle Kameralne II District: Bemowo No. of stages: 3 Stages completed: 1 Stages under construction*: 1 app. 350 units (completed: 161 units) app thousand sqm Green Mokotów District: Mokotów No. of stages:10 Stages completed: 2 Stages under construction*: 6 app. 680 units (completed: 149 units) app thousand sqm Stacja Nowy Ursus District: Ursus No. of stages: 5 Stages completed: 2 Stages under construction*: 3 app units (completed: 389 units) app thousand sqm Q Planned completion date: Q Q Planned completion date: Q *Including stages in presale which construction has not begun yet (as at 31 March 2018). Q Planned completion date: Q

 app. 25.")

31 Description of investments- under construction (3) MoreNova City: Gdańsk District: Piecki-Migowo No. of stages: 3 Stages completed: 1 Stages under construction*: 2 Zajezdnia Wrzeszcz City: Gdańsk District: Wrzeszcz No. of stages: 10 Stages completed: 1 Stages under construction*: 3 Nowa Letnica City: Gdańsk District: Letnica No. of stages: 13 Stages under construction*: 7 app. 520 units (completed: 177 units) app thousand sqm Q Planned completion date: Q app units (completed: 206 units) app thousand sqm Q Planned completion date: Q *Including stages in presale which construction has not begun yet (as at 31 March 2018). app units app thousand sqm Q Planned completion date: Q


32 Description of investments- under construction (4) Forum Wola District: Wola No. of stages: 4 Stages under construction*: 3 app. 890 units app thousand sqm Young City 2 District: Bemowo No. of stages: 4 Stages under construction*: 4 app. 600 units app thousand sqm Q Planned completion date: Q Q Planned completion date: Q *Including stages in presale which construction has not begun yet (as at 31 March 2018). 32


33 Description of investmentson offer which construction has not started Ogrody Wilanów District: Wilanów No. of stages: 3 Stages in presale: 2 app. 230 units app thousand sqm Q Planned completion date: Q Osiedle Życzliwa Praga District: Tarchomin No. of stages: 9 Stages in presale: 2 app. 700 units app thousand sqm Q Planned completion date: Q Nadmotławie Estate City: Gdańsk District: Śródmieście No. of stages: 12 Stages in presale: 2 app units app thousand sqm Q Planned completion date: Q

34 Ownership structure Bricks Acquisition Limited 100% As at the date of this presentation, Bricks Acquisition Limited holds 100% of the ROBYG S.A. shares. Goldman Sachs Group, Inc. is indirectly the majority owner of Bricks Acquisition Limited. 34
 419 11 00 Q1 2018 * Including amounts kept on individual escrow accounts and in Mutual")
35 HIGHTLIGHTS Please contact us: Investor Relations ROBYG SA tel. (22) Q * Including amounts kept on individual escrow accounts and in Mutual Funds. 35
ROBYG Group Financial results 2017
 ROBYG Group Financial results 2017 Warsaw, March 14th 2018 HIGHTLIGHTS HIGHLIGHTS 2017 * Including amounts kept on individual escrow accounts and in Mutual Funds. 2 Agenda I. Summary II. Presales and revenue
ROBYG Group Presale results 2017 Financial results Q
 ROBYG Group Presale results 2017 Financial results Q1-3 2017 Warsaw, January 17th 2018 HIGHTLIGHTS HIGHLIGHTS 2017 Q1-3 2017 * Including amounts kept on individual escrow accounts and in Mutual Funds.
ROBYG Group Financial results H1 2017
 ROBYG Group Financial results H1 2017 Warsaw, August 24th 2017 HIGHTLIGHTS HIGHLIGHTS H1 2017 * Including amounts kept on individual escrow accounts and in Mutual Funds. 2 Agenda I. Summary II. Presales
ROBYG Group Financial results Q
 ROBYG Group Financial results Q1-3 2017 Warsaw, November 16th 2017 HIGHTLIGHTS HIGHLIGHTS Q1-3 2017 * Including amounts kept on individual escrow accounts and in Mutual Funds. 2 Agenda I. Summary II. Presales
ROBYG Group Financial results 2016
 ROBYG Group Financial results 2016 Warsaw, March 16th 2017 HIGHTLIGHTS HIGHLIGHTS 2016 * Assuming the continuation of the proportional consolidation for JV projects, ** Including amounts kept on individual
ROBYG Group Financial results H1 2016
 ROBYG Group Financial results H1 2016 Warsaw, August 25th 2016 HIGHTLIGHTS HIGHLIGHTS H1 2016 * Assuming the continuation of the proportional consolidation for JV projects, ** Including amounts kept on
ROBYG Group Financial results Q1 2016
 ROBYG Group Financial results Q1 2016 Warsaw, May 12th 2016 HIGHTLIGHTS HIGHLIGHTS Highlights Q1 2016 * Assuming the continuation of the proportional consolidation for JV projects, ** Including amounts
ROBYG Group Presale results Q Financial results Q
 ROBYG Group Presale results Q1-3 2015 Financial results Q1-2 2015 Warsaw, October 13th 2015 HIGHTLIGHTS HIGHLIGHTS Sale results Q1-3 2015 Highlights Q1-2 2015 * Assuming the continuation of the proportional
ROBYG Group Financial results H Presale results Q
 ROBYG Group Financial results H1 2014 Presale results Q1-3 2014 Warsaw, October 17th 2014 HIGHTLIGHTS HIGHLIGHTS Presale results Q1-3 2014 Highlights H1 2014 * Including the transactions performed till
ROBYG Group Financial results: Warsaw, March 20th 2014
 ROBYG Group Financial results: 2013 Warsaw, March 20th 2014 HIGHTLIGHTS 2013 HIGHLIGHTS 2 Agenda I. Summary II. Sales and hand-overs III. Financial results IV. Plans of ROBYG Group V. Appendices 3 ROBYG
ROBYG Group Financial and presale results H Warsaw, August 21st 2014
 ROBYG Group Financial and presale results H1 2014 Warsaw, August 21st 2014 HIGHTLIGHTS HIGHLIGHTS H1 2014 * Including the transactions performed till the date of the presentation ** Including revenues
GRUPA ROBYG. Presentation. Warsaw, April 16 th 2013
 GRUPA ROBYG Presentation Warsaw, April 16 th 2013 Agenda I. Summary II. Sales and hand-overs III. Financial results IV. Plans of ROBYG Group V. Appendices 2 Summary Number of units contracted in 1Q 2013:
ROBYG Group. Presentation. Warsaw, July16 th 2013
 ROBYG Group Presentation Warsaw, July16 th 2013 Agenda I. Summary II. Sales and hand-overs III. Financial results IV. Plans of ROBYG Group V. Appendices 2 Summary 1-2Q 2013 Number of units contracted:
HI 2013 FINANCIAL RESULTS
 Warsaw, September 11th 2013 INVESTOR PRESENTATION HI 2013 FINANCIAL RESULTS POLNORD SA CAPITAL GROUP DISCLAIMER This report has been prepared solely for information purposes and is not intended to incite
WE BUILD BEYOND EXPECTATIONS
 WE BUILD BEYOND EXPECTATIONS SUMMARY OF RESULTS FOR I - IV QUARTERS OF 2017 INTRODUCTION Financial results (PLN million) 865,8 800 700 Revenues Net profit Dividend 210 600 500 506,8 171,2 137 160 400 300
QI 2014 FINANCIAL RESULTS
 Warsaw, May 28 th 2014 INVESTOR PRESENTATION QI 2014 FINANCIAL RESULTS POLNORD SA CAPITAL GROUP DISCLAIMER This report has been prepared solely for information purposes and is not intended to incite to
FADESA POLNORD POLSKA (FPP) 09 May 2014 SP (ENG) PL. FPP review IQ14
 09 May 2014 SP (ENG) PL. FPP review IQ14") FADESA POLNORD POLSKA (FPP) 09 May 2014 SP (ENG) PL FPP review IQ14 1 Central lake in FPP Ostoja-Wilanów, Warsaw. December 2013. 2 FPP. The Firm. FADESA POLNORD POLSKA (FPP). FPP is a real estate developer
FADESA POLNORD POLSKA (FPP) 09 May 2014 SP (ENG) PL FPP review IQ14 1 Central lake in FPP Ostoja-Wilanów, Warsaw. December 2013. 2 FPP. The Firm. FADESA POLNORD POLSKA (FPP). FPP is a real estate developer
Q F I N A N C I A L R E S U L T S
 Q 3 2 0 1 7 F I N A N C I A L R E S U L T S AGENDA 1 Q3 2017 in brief 2 Destinations 3 Business segments 4 Recent acquisitions 5 Echo values 6 Financial highlights 7 Appendix 2 MANAGEMENT BOARD Maciej
FADESA POLNORD POLSKA (FPP) 15 November 2018 SP (ENG) PL. FPP Review 3Q18
 15 November 2018 SP (ENG) PL. FPP Review 3Q18") FADESA POLNORD POLSKA (FPP) 15 November 2018 SP (ENG) PL FPP Review 3Q18 1 FPP in Warsaw (park area in Ostoja-Wilanów, Warsaw, October 2017). 2 FPP. The Firm FADESA POLNORD POLSKA (FPP). Promotions: FPP
FADESA POLNORD POLSKA (FPP) 15 November 2018 SP (ENG) PL FPP Review 3Q18 1 FPP in Warsaw (park area in Ostoja-Wilanów, Warsaw, October 2017). 2 FPP. The Firm FADESA POLNORD POLSKA (FPP). Promotions: FPP
FADESA POLNORD POLSKA (FPP)
") FADESA POLNORD POLSKA (FPP) 22 July 2014 SP (ENG) PL FPP review II4 1 Internal courtyard, building C4, Ostoja-Wilanów, Warsaw., FPP, May 2014. 2 FPP. The Firm FADESA POLNORD POLSKA (FPP). FPP is a real
FADESA POLNORD POLSKA (FPP) 22 July 2014 SP (ENG) PL FPP review II4 1 Internal courtyard, building C4, Ostoja-Wilanów, Warsaw., FPP, May 2014. 2 FPP. The Firm FADESA POLNORD POLSKA (FPP). FPP is a real
FADESA POLNORD POLSKA (FPP) 07 August 2015 SP (ENG) PL. FPP review IH yearsof FPP
 07 August 2015 SP (ENG) PL. FPP review IH yearsof FPP") FADESA POLNORD POLSKA (FPP) 07 August 2015 SP (ENG) PL FPP review IH15 10 yearsof FPP 1 Private park in Ostoja-Wilanów, Warsaw. 2 FPP. The Firm FADESA POLNORD POLSKA (FPP). FPP is a real estate developer
FADESA POLNORD POLSKA (FPP) 07 August 2015 SP (ENG) PL FPP review IH15 10 yearsof FPP 1 Private park in Ostoja-Wilanów, Warsaw. 2 FPP. The Firm FADESA POLNORD POLSKA (FPP). FPP is a real estate developer
FADESA POLNORD POLSKA (FPP) 18 April 2018 SP (ENG) PL. FPP Review 1Q18
 18 April 2018 SP (ENG) PL. FPP Review 1Q18") FADESA POLNORD POLSKA (FPP) 18 April 2018 SP (ENG) PL FPP Review 1Q18 1 FPP in Wroclaw (Apartamenty Innova). January 2018. 2 FPP. The Firm FADESA POLNORD POLSKA (FPP). Promotions: FPP is a real estate
FADESA POLNORD POLSKA (FPP) 18 April 2018 SP (ENG) PL FPP Review 1Q18 1 FPP in Wroclaw (Apartamenty Innova). January 2018. 2 FPP. The Firm FADESA POLNORD POLSKA (FPP). Promotions: FPP is a real estate
Vantage Development S.A. CC Group Small & MidCap Conference 5th Edition. 26 March 2015
 Vantage Development S.A. CC Group Small & MidCap Conference 5th Edition 26 March 2015 2014 The best year in the history of Vantage Development 2014 Financial results Record revenues of PLN 61.8 million
LAND FOR MULTI-FAMILY RESIDENTIAL DEVELOPMENT ANALYSIS OF AVERAGE PRICES AND SHARE IN THE VALUE OF A DEVELOPMENT PROJECT
 LAND ANALYSIS OF AVERAGE PRICES AND SHARE IN THE VALUE OF A PROJECT June 2018 Table of content INTRODUCTION SUMMARY OF THE SITUATION ON THE LAND MARKET WARSAW page 3 page 4 page 7 CRACOW TRI-CITY WROCLAW
Disclaimer. This presentation may not be directly or indirectly distributed to or within the United States of America, Australia, Canada or Japan.
 Investor Presentation (addressing 2016 results) 4 th of August 2016 Disclaimer This presentation does not constitute or form any part of any offer or invitation or inducement to sell or issue, or any solicitation
Business Combinations
 Business Combinations Indian Accounting Standard (Ind AS) 103 Business Combinations Contents Paragraphs OBJECTIVE 1 SCOPE 2 IDENTIFYING A BUSINESS COMBINATION 3 THE ACQUISITION METHOD 4 53 Identifying
Disclaimer. This presentation may not be directly or indirectly distributed to or within the United States of America, Australia, Canada or Japan.
 Investor Presentation (addressing results) 6 th of March 2013 Disclaimer This presentation does not constitute or form any part of any offer or invitation or inducement to sell or issue, or any solicitation
ANALYSIS OF TRANSACTION PRICES AND FORECASTS FOR THE RESIDENTIAL MARKET IN POLAND - PRIMARY AND SECONDARY MARKETS WARSAW, MARCH 2016
 2016 ANALYSIS OF TRANSACTION PRICES AND FORECASTS FOR THE RESIDENTIAL MARKET IN POLAND - PRIMARY AND SECONDARY MARKETS WARSAW, MARCH 2016 Introduction Dear Readers, We have the pleasure of presenting the
UNITED STATES SECURITIES AND EXCHANGE COMMISSION Washington, D.C FORM 10-Q
 UNITED STATES SECURITIES AND EXCHANGE COMMISSION Washington, D.C. 20549 FORM 10-Q ý QUARTERLY REPORT PURSUANT TO SECTION 13 OR 15(d) OF THE SECURITIES EXCHANGE ACT OF 1934 For the Quarterly Period Ended
The entity that obtains control of the acquiree. The business or businesses that the acquirer obtains control of in a business combination.
 IFRS 3 IFRS 3 Business Combination INTRODUCTION Background DEFINITIONS Business combination Business Acquisition date Acquirer Acquiree IFRS 3 Business Combinations outlines the accounting when an acquirer
AUDIOCAST PRESENTATION Q1/2018
 19.4.2018 AUDIOCAST PRESENTATION Q1/2018 HIGHLIGHTS Q1/2018 EPRA EARNINGS PER SHARE EUR 0.041 -Divestments in 2017 and weaker currencies impacted EPRA EPS -Efficient cost management with administrative
Financial Results for the 2nd Quarter of FY November 8, 2017 NTT Urban Development Corporation
 Financial Results for the 2nd Quarter of FY 2017 November 8, 2017 NTT Urban Development Corporation Financial Results for the 2nd Quarter of FY 2017 Operating revenue and operating income were 72.7 billion
EN Official Journal of the European Union L 320/373
 29.11.2008 EN Official Journal of the European Union L 320/373 INTERNATIONAL FINANCIAL REPORTING STANDARD 3 Business combinations OBJECTIVE 1 The objective of this IFRS is to specify the financial reporting
Achieved record annual revenues of $110.0 million for 2018, representing an increase of 5.8%
 Clipper Realty Inc. Announces Fourth Quarter and Full-Year 2018 Results Reports Record Annual Revenues, Record Annual Income from Operations and Record Quarterly and Annual Adjusted Funds from Operations
INVESTOR PRESENTATION MAY 2013
 INVESTOR PRESENTATION MAY 2013 Forward-Looking Statements This presentation includes forward-looking statements. These statements are subject to a number of risks, uncertainties and other factors that
Embargoed until 07.00am 24 th September 2007
 Atlas Estates Limited ( Atlas / Company / Group ) INTERIM RESULTS FOR THE SIX MONTHS TO 30 JUNE 2007 ATLAS ESTATES DELIVERS A 13.3 PER CENT INCREASE IN NAV PER SHARE IN THE FIRST HALF Embargoed until 07.00am
Applying IFRS. Presentation and disclosure requirements of IFRS 16 Leases. November 2018
 Applying IFRS Presentation and disclosure requirements of IFRS 16 Leases November 2018 Contents 1. Overview 2 2. What is changing from current IFRS? 4 2.1 Presentation 4 2.2 Lessee disclosures 5 3. Presentation
2016 FULL-YEAR RESULTS WEBCAST 21 FEBRUARY 2017
 FULL-YEAR RESULTS WEBCAST 21 FEBRUARY 2017 DISCLAIMER The information contained in this document has not been independently verified. No representation, warranty or undertaking, express or implied, is
COUSINS PROPERTIES INCORPORATED SAME PROPERTY GROWTH Second Quarter 2010 Compared to First Quarter 2010 (in thousands, except percentages)
") SAME PROPERTY GROWTH Second Quarter 2010 Compared to First Quarter 2010 (in thousands, except percentages) Same Property Non-Same All Properties Office Retail Total Q1 2010 Q2 2010 % Change Q1 2010 Q2
SAME PROPERTY GROWTH Second Quarter 2010 Compared to First Quarter 2010 (in thousands, except percentages) Same Property Non-Same All Properties Office Retail Total Q1 2010 Q2 2010 % Change Q1 2010 Q2
Q RESULTS 28 NOVEMBER
 Q3 2016 RESULTS 28 NOVEMBER 2016 1 CONTENTS 1 2 Key highlights Q3 & 9M 2016 Portfolio overview 3 Projects in development and pipeline 4 Operations and financials 2 1 KEY HIGHLIGHTS Q3 & 9M 2016 Portfolio
IFRS 16 Leases supplement
 IFRS 16 Leases supplement Guide to annual financial statements IFRS December 2017 kpmg.com/ifrs Contents About this supplement 1 About IFRS 16 3 The Group s lease portfolio 6 Part I Modified retrospective
International Financial Reporting Standards (IFRS)
") FACT SHEET September 2011 IAS 31 Interests in joint ventures (This fact sheet is based on the standard as at 1 January 2011.) Important note: This fact sheet is based on the requirements of the International
FACT SHEET September 2011 IAS 31 Interests in joint ventures (This fact sheet is based on the standard as at 1 January 2011.) Important note: This fact sheet is based on the requirements of the International
Rental income, SEK million 1,071 1,014 4,122 4,109 Growth in rental income comparable properties, percent
 Akelius Residential Property AB (publ) year-end report January to December summary Oct Dec Oct Dec Jan Dec Jan Dec Rental income, SEK million 1,071 1,014 4,122 4,109 Growth in rental income comparable
Rental income, SEK million 1,016 1,040 3,051 3,095 4,109 Growth in rental income comparable properties, percent
 Akelius Residential Property AB (publ) interim report January to September summary Jul Sep Jul Sep Jan Sep Jan Sep Jan Dec Rental income, SEK million 1,016 1,040 3,051 3,095 4,109 Growth in rental income
Green Brick Partners. Fourth Quarter 2015 Investor Call Presentation. March 10, 2016
 Green Brick Partners Fourth Quarter 2015 Investor Call Presentation March 10, 2016 Forward-looking statements This presentation and the oral statements made by representatives of the Company during the
AUDIOCAST PRESENTATION H1/2018
 AUDIOCAST PRESENTATION H1/2018 IRREPLACEABLE AND MULTI-FUNCTIONAL ASSETS IN GROWING CATCHMENTS 2 WE CONTINUE OUR TRANSFORMATION JOURNEY 2011 H1/2018 GOAL 2022 41 # OF SHOPPING # OF SHOPPING 78 30 CENTRES
National Real Estate Company. Earnings Presentation Q1 FY2014
 National Real Estate Company (Kuwait KSE: NRE) Earnings Presentation Q1 FY2014 May 28, 2014 1 Agenda 1. NREC Overview 3 2. Q1 FY2014 Summary 4 3. Financial Performance 5 4. Key Financial Ratios 7 5. Quarterly
2018 HALF-YEAR RESULTS
 2018 HALF-YEAR RESULTS WEBCAST 25 JULY 2018 Disclaimer The information contained in this document has not been independently verified. No representation, warranty or undertaking, express or implied, is
ICADE REVENUE UP +8.4% IN Q1 2018
 PRESS RELEASE Issy-les-Moulineaux, April 27, 208 ICADE REVENUE UP +8.4% IN Q 208 Commercial Property Investment: o Rental income up by as much as +5,8% to 99.0 million o Financial occupancy rate at 92.4%
Consolidated financial results for 2015
 Consolidated financial results for 2015 Presentation Warsaw, March 16, 2016 PARTICIPANTS OF TODAY S MEETING President of the Management Board Vice-President of the Management Board Deputy Director of the
Accounting and Auditing Update. Staci L. Brogan, CPA, Shareholder Patricia R. Giudici, CPA, Senior Manager Schneider Downs & Co. Inc.
 Accounting and Auditing Update Staci L. Brogan, CPA, Shareholder Patricia R. Giudici, CPA, Senior Manager Schneider Downs & Co. Inc. Agenda Overview of the standard setting agenda Revenue recognition Lease
Highwoods Reports Second Quarter 2018 Results
 FOR IMMEDIATE RELEASE Ref: 18-14 Contact: Brendan Maiorana Senior Vice President, Finance and Investor Relations 919-431-1529 Highwoods Reports Second Quarter 2018 Results $0.49 Net Income per Share $0.87
Nasdaq Copenhagen Nikolaj Plads 6 DK-1067 Copenhagen K Frederikssund, 20 October 2016 COMPANY ANNOUNCEMENT No 39/16
 Nasdaq Copenhagen Nikolaj Plads 6 DK-1067 Copenhagen K Frederikssund, 20 October 2016 No 39/16 INFORMATION TO THE SHAREHOLDERS OF CEMAT A/S BEFORE THE EXTRAORDINARY GENERAL MEETING TO BE HELD ON 24 OCTOBER
Accounting for revenue is changing
 Accounting for revenue is changing What s the impact on housebuilders? March 2017 The new revenue standard effective from 1 January 2018 is likely to affect the way you account for revenue. But it is more
FACTS MISUNDERSTANDINGS. HOC Staff Report: HOCs Support For Westbard Memorialization SUPPORT FOR MEMORIALIZATION.
 HOC Staff Report: HOCs Support For Westbard Memorialization Serving Montgomery County s most vulnerable residents is at the center of HOC s work. In keeping with its mission to provide affordable housing
2014 Operating and Financial Highlights
 FINANCIAL HIGHLIGHTS > 2014 Operating and Financial Highlights Operating Results Executed 203 leasing transactions representing approximately 2.8 million square feet, the highest gross leasing volume in
Rental income, EUR million** Like-for-like growth in rental income, percent Net operating income, EUR million
 Akelius Residential Property AB (publ) interim report January to March summary* Jan Mar Jan Mar Jan Dec Rental income, EUR million** 119 116 469 Like-for-like growth in rental income, percent 3.7 5.4 5.1
1. The title of the Articles of Association of BGŻ S.A. with the current wording:
 SCHEDULE 3 TO THE MERGER PLAN Draft amendments to the Articles of Association of BGŻ S.A. In relation to the planned merger of Bank Gospodarki Żywnościowej S.A. ( BGŻ S.A. ) and BNP Paribas Bank Polska
Real estate development significant growth driver Company profile and business model High-quality Investment Portfolio
 STRATEGY Over three decades of continual development, CA Immo has become distinctly competitive and secured an excellent market position in Central Europe. By letting, managing and developing high quality
ALLIED PROPERTIES REAL ESTATE INVESTMENT TRUST. Financial Statements. Year Ended December 31, 2004
 ALLIED PROPERTIES REAL ESTATE INVESTMENT TRUST Financial Statements Year Ended December 31, 2004 Auditors' Report To the Unitholders of Allied Properties Real Estate Investment Trust We have audited the
1. On page 2 of the Prospectus the Section is renamed to Historical Financial Information.
 The following amendments to the Prospectus are made by this Supplement: 1. On page 2 of the Prospectus the Section 4.14.1 is renamed to Historical Financial Information. 2. On page 4 of the Prospectus
CONSOLIDATED FINANCIAL STATEMENTS
 CONSOLIDATED FINANCIAL STATEMENTS Dundee Real Estate Investment Trust Consolidated Balance Sheets (unaudited) June 30, December 31, (in thousands of dollars) Note 2004 2003 Assets Rental properties 3,4
Highwoods Reports Third Quarter 2017 Results
 FOR IMMEDIATE RELEASE Ref: 17-20 Contact: Brendan Maiorana Senior Vice President, Finance and Investor Relations 919-431-1529 Highwoods Reports Third Quarter 2017 Results $0.55 Net Income per Share $0.86
BTS Group Holdings PCL
 16 October 2014 Disclaimer Investment involves risk. Prospective should understand the characteristics of Securities and study information about BTS Group Holdings Public Company Limited (the Company )
Rental income, EUR million Like-for-like growth in rental income, percent
 Akelius Residential Property AB (publ) year-end report January to December summary Oct Dec Oct Dec Jan Dec Jan Dec Rental income, EUR million 129 124 482 469 Like-for-like growth in rental income, percent
ONTARIO INTERNATIONAL AIRPORT AUTHORITY
 ONTARIO INTERNATIONAL AIRPORT AUTHORITY COMMISSION AGENDA REGULAR MEETING APRIL 23, 2019 AT 3:00 P.M. Ontario International Airport Administration Offices 1923 E. Avion Street, Room 100, Ontario, CA 91761
ATRIUM Q RESULTS ANALYST AND INVESTOR CALL. 18 May 2016
 ATRIUM Q1 2016 RESULTS ANALYST AND INVESTOR CALL 18 May 2016 KEY EVENTS IN 2016 YTD OPERATIONAL PERFORMANCE Core Markets¹: NRI increased 1.2% to 36.3m; LFL NRI remained stable at 31.4m Russia continues
Highwoods Reports Third Quarter 2018 Results
 FOR IMMEDIATE RELEASE Ref: 18-18 Contact: Brendan Maiorana Senior Vice President, Finance and Investor Relations 919-431-1529 Highwoods Reports Third Quarter 2018 Results $0.32 Net Income per Share $0.86
Q RESULTS AND OUTLOOK. Warsaw, 11th September 2018
 Q2 2018 RESULTS AND OUTLOOK Warsaw, 11th September 2018 Disclaimer Neither this presentation (the Presentation ), nor any copy of it, nor the information contained herein is being issued or may be distributed
Report on 2018 Second Quarter Operating and Financial Results
 Report on 2018 Second Quarter Operating and Financial Results Forward-Looking Statements This press release includes "forward-looking statements." These statements are subject to a number of risks, uncertainties
STAG INDUSTRIAL ANNOUNCES SECOND QUARTER 2018 RESULTS
 STAG INDUSTRIAL ANNOUNCES SECOND QUARTER 2018 RESULTS Boston, MA July 31, 2018 - STAG Industrial, Inc. (the Company ) (NYSE:STAG), today announced its financial and operating results for the quarter ended
First Sponsor Group Limited Investor Presentation 24 July 2015
 First Sponsor Group Limited Investor Presentation 24 July 2015 The initial public offering of the Company s shares was sponsored by DBS Bank Ltd., who assumes no responsibility for the contents of this
Board of Directors' Report on the Corporation's State of Affairs
 Board of Directors' Report on the Corporation's State of Affairs Brack Capital Properties NV (hereinafter: "the Company") hereby submits the Board of Directors' report for a period of six months ending
Real Estate Principles Chapter 17 Quiz
 Real Estate Principles Chapter 17 Quiz 1. A property manager's budget for the property will typically include which of the following operating expenses? A. Reserves for replacement of built-ins B. Depreciation
IFRS 3 Business Combinations
 IFRS 3 Business Combinations 0 Objectives Define a business combination under IFRS 3 (Revised 2008) Describe the steps in applying the acquisition method Explain the recognition and measurement principles
Business Combinations IFRS 3
 CA Sandesh Mundra Business Combinations IFRS 3 For many men, the acquisition of wealth does not end their troubles, it only changes them. - Lucius Annaeus Seneca Lets get some of the basics correct.. We
$450,000 $63,425 $33, % PURCHASE PRICE NET OPERATING INCOME ANNUAL CASH FLOW CAP RATE
 Executive Summary Key Property Metrics $450,000 $63,425 $33,431 14.1% PURCHASE PRICE NET OPERATING INCOME ANNUAL CASH FLOW CAP RATE $60,000 $50,000 $40,000 $30,000 Annual Cash Flow Maintenance & Repairs,
Interim statement from the Board of Directors for the first quarter of 2015
 Regulated information - under embargo until 05/05/2015, 8 a.m. Antwerp, 5 May 2015 Interim statement from the Board of Directors Acquisition of a modern logistics site of approximately 52.000 m² in a prime
Business Combinations
 International Financial Reporting Standard 3 Business Combinations This version was issued in January 2008. Its effective date is 1 July 2009. It includes amendments resulting from IFRSs issued up to 31
Brixmor Residual Holding LLC and Subsidiaries Years Ended December 31, 2013 and 2012 With Report of Independent Auditors
 C ONSOLIDATED F INANCIAL S TATEMENTS Brixmor Residual Holding LLC and Subsidiaries Years Ended December 31, 2013 and 2012 With Report of Independent Auditors Ernst & Young LLP 1403-1211259 Consolidated
ALLIED PROPERTIES REAL ESTATE INVESTMENT TRUST. Financial Statements. For the Period Ended March 31, 2004
 Financial Statements For the Period Ended March 31, 2004 BALANCE SHEET At March 31, 2004 INDEX Page Balance Sheet 1 Statement of Unitholders' Equity 2 Statement of Earnings 3 Statement of Cash Flows 4
PRESENTATION RESULTS Q Aldar Q Results
 Q1 2018 RESULTS PRESENTATION DISCLAIMER This disclaimer governs the use of this presentation. You must not rely on the information in the presentations and alternatively we recommend you to seek advice
Fantasia Holdings Group Announces 2010 Interim Results
 Fantasia Holdings Group Announces 2010 Interim Results Urban complexes fuel sales growth Total revenue and net profit increase 42.8% and 74.5% respectively In the first half of 2010, total sales and net
Leases: Overview of the new guidance
 Leases: Overview of the new guidance Prepared by: Richard Stuart, Partner, National Professional Standards Group, RSM US LLP richard.stuart@rsmus.com, +1 203 905 5027 March 2, 2016 Introduction On February
International GAAP Holdings Limited Model financial statements for the year ended 31 December 2017 (With early adoption of IFRS 16)
") International GAAP Holdings Limited Model financial statements for the year ended 31 December 2017 (With early adoption of IFRS 16) Appendix 1: Early application of IFRS 16 Leases Introduction This Appendix
International GAAP Holdings Limited Model financial statements for the year ended 31 December 2017 (With early adoption of IFRS 16) Appendix 1: Early application of IFRS 16 Leases Introduction This Appendix
PROPOSED DISPOSAL OF MYANMAR INFRASTRUCTURE GROUP PTE. LTD.
 SINGAPORE MYANMAR INVESTCO LIMITED (Registration No. 200505764Z) (Incorporated in Singapore) PROPOSED DISPOSAL OF MYANMAR INFRASTRUCTURE GROUP PTE. LTD. 1. INTRODUCTION The Board of Directors (the Board
Extra Space Storage Inc. Reports 2018 Fourth Quarter and Year-End Results
 Extra Space Storage Inc. Reports 2018 Fourth Quarter and Year-End Results February 20, 2019 SALT LAKE CITY, Feb. 20, 2019 /PRNewswire/ -- Extra Space Storage Inc. (NYSE: EXR) (the "Company"), a leading
Rental income, EUR million Like-for-like growth in rental income, percent
 Akelius Residential Property AB (publ) interim report January to June summary Apr Jun Apr Jun Jan Jun Jan Jun Jan Dec Rental income, EUR million 115 113 233 229 469 Like-for-like growth in rental income,
In depth A look at current financial reporting issues
 In depth A look at current financial reporting issues February 2015 No. INT2015-06 IFRS 11, Joint arrangements Implementation issues considered by the IFRS Interpretations Committee What are the implications?
GREEN BRICK PARTNERS INVESTOR CONFERENCE PRESENTATION NOVEMBER 2017
 GREEN BRICK PARTNERS INVESTOR CONFERENCE PRESENTATION NOVEMBER 2017 1 FORWARD LOOKING STATEMENTS This presentation and the oral statements made by representatives of the Company during the course of this
Investor. Investment Service Centre. Listed Companies Information. YANGTZEKIANG<00294> - Results Announcement
 Investor Investment Service Centre Listed Companies Information YANGTZEKIANG - Results Announcement Yangtzekiang Garment Limited announced on 16/12/2005: (stock code: 00294 ) Year end date: 31/03/2006
Rental income, EUR million Like-for-like growth in rental income, percent
 Akelius Residential Property AB (publ) interim report January to September summary Jul Sep Jul Sep Jan Sep Jan Sep Jan Dec Rental income, EUR million 120 116 353 345 469 Like-for-like growth in rental
The most significant events in H1 2014
 1 2013-06-26 Contents The most significant events in H1 2014 Factors influencing the Company's activity in H1 2014 Sales of flats in H1 2014 Selected consolidated financial data for H1 2014 Selected consolidated
Definitions. CPI is a lease in which base rent is adjusted based on changes in a consumer price index.
 Annualized Rental Income is rental revenue under our leases on Operating Properties on a straight-line basis, which includes the effect of rent escalations and any tenant concessions, such as free rent,
RESULTS PRESENTATION for the year ended 28 February 2017
 RESULTS PRESENTATION for the year ended 28 February 2017 AGENDA INTRODUCTION HIGHLIGHTS OPERATIONAL OVERVIEW FINANCIAL OVERVIEW LOOKING FORWARD ANNEXURE 2 INTRODUCTION Founded in 1996 Listed on the JSE
IAG Conference Accounting Update Emerging issues in the public sector 20 November 2014 Michael Crowe Yannick Maurice
 www.pwc.com.au IAG Conference Accounting Update Emerging issues in the public sector 20 November 2014 Michael Crowe Yannick Maurice Agenda Introduction Key topics o Fair value o PPP Projects Refinancing
Annual Report 2016/17. Illustration: Amerika Have, residential units Copenhagen, Denmark
 Annual Report 2016/17 Illustration: Amerika Have, residential units Copenhagen, Denmark Contents 1. Group results for 2016/17 Financial highlights and key ratios Segment results Handed-over projects High
Ind AS 115 Impact on the real estate sector and construction companies
 01 Ind AS 115 Impact on the real estate sector and construction companies This article aims to: Highlight key areas of impact of Ind AS 115 on the real estate sector and construction companies. Summary
Estancia Logistik AB (publ) Quarterly Report. April - June 2015
 Quarterly Report. April - June 2015") Estancia Logistik AB (publ) Quarterly Report April - June 2015 QUARTERLY REPORT Q2 2015 Optimizing Management April - June 2015 Quarter Rental income amounted to MSEK 40 (43). Operating profit totaled
Estancia Logistik AB (publ) Quarterly Report April - June 2015 QUARTERLY REPORT Q2 2015 Optimizing Management April - June 2015 Quarter Rental income amounted to MSEK 40 (43). Operating profit totaled
Clipper Realty Inc. Announces Third Quarter 2018 Results Reports Record Revenues, Income From Operations and Adjusted Funds From Operations
 Clipper Realty Inc. Announces Third Quarter 2018 Results Reports Record Revenues, Income From Operations and Adjusted Funds From Operations NEW YORK, November 1, 2018 /Business Wire/ -- Clipper Realty