EFFECTS OF MIXED-INCOME, MULTI-FAMILY RENTAL HOUSING DEVELOPMENTS ON SINGLE-FAMILY HOUSING VALUES
|
|
|
- Nigel Lawson
- 5 years ago
- Views:
Transcription
1 HOUSING AFFORDABILITY INITIATIVE EFFECTS OF MIXED-INCOME, MULTI-FAMILY RENTAL HOUSING DEVELOPMENTS ON SINGLE-FAMILY HOUSING VALUES HENRY O. POLLAKOWSKI DAVID RITCHAY ZOE WEINROBE APRIL 2005 CENTER FOR REAL ESTATE MASSACHUSETTS INSTITUTE OF TECHNOLOGY 77 MASSACHUSETTS AVENUE BUILDING W CAMBRIDGE, MA 02139
2 ACKNOWLEDGMENTS We would like to thank the Housing Affordability Initiative at the MIT Center for Real Estate, Mass Housing, and Joe Mullins for financial support. We also thank Lynn Fisher, David Geltner, Andrew Jakabovics, Langley C. Keyes, and W. Tod McGrath for helpful suggestions and comments. Karl Chip Case, Aaron Gornstein, and Clark Ziegler provided useful comments on an earlier version. We are, however, solely responsible for the contents.
3 CONTENTS EXECUTIVE SUMMARY I CHAPTER 1: INTRODUCTION 1 CHAPTER 2: CASE STUDIES: METHODOLOGY AND DESCRIPTION 9 CHAPTER 3: QUANTITATIVE METHODOLOGY 33 CHAPTER 4: FINDINGS 45 APPENDIX 55
4
5 EXECUTIVE SUMMARY D o mixed-income, high-density rental developments negatively impact nearby single- family property values? This question has been at the core of the controversies surrounding mixed-income housing in suburban Boston communities. Chapter 40B, enacted through the Comprehensive Permit Law and Anti-Snob Zoning Act, is a Massachusetts statute that enables developers to obtain state-authorized comprehensive permits in municipalities that are not in compliance with state affordability criteria: If less than ten percent of a municipality s housing stock is defined as affordable, developers with comprehensive permits can build developments that override local zoning regulations. Because zoning rules are viewed by some as regulatory mechanisms that protect property values by controlling local land use, the ability of developers to circumvent such regulations has given rise to fears that the values of homes surrounding these mixed-income, multi-family developments will decline. These fears are considered one of the strongest motives for residents opposition to proposed 40B developments. But are such fears justified by the facts? We designed a rigorous research methodology to examine the impact over time of introducing a large-scale, mixed-income, multi-family rental development into a neighborhood of single-family houses. We developed strict selection criteria that identified seven 40B developments located in six communities in the Boston metropolitan area Littleton, Mansfield, Norwood, Randolph, Wilmington, and Woburn. These case studies represent some of the most dense and controversial Chapter 40B developments in Greater Boston, in other words, a suburban homeowner s worst nightmare. After selecting the cases, we conservatively established impact areas, taking care to include only the single-family homes mostly likely to be affected by each respective 40B development. Our process for identifying impact areas essentially restricted the boundaries to abutters and immediate neighbors of each of the seven developments. The purpose of establishing such impact areas was to objectively measure single-family home price changes over time as 40B developments were i
6 announced, approved, constructed, occupied, and integrated into the resident communities. We then examined the relationship between the large-scale, high-density, mixed-income rental developments and single-family home values. Using hedonic modeling to create comparative house price indexes for each impact area and an appropriate control area (the remainder of the host community) determined how home values had changed over time within the impact and control areas. As will be demonstrated in the report, the results in all seven case study towns lead us to conclude that the introduction of large-scale, high-density mixed-income rental developments in single-family neighborhoods does not affect the value of surrounding homes. The fear of potential asset-value loss among suburban homeowners is misplaced. CASE SELECTION Our methodology was designed to ensure that our study would identify any relationship between the introduction of a large rental development and single-family house prices. First, we chose to limit our selection to projects within the Greater Boston region. Second, the projects were required to have received their comprehensive permit and have been fully developed between the mid-1980s and Third, we limited the selection to multi-family, mixed-income rental developments. Last, we generally selected larger developments that were very dissimilar in size, bulk, form, and density from the surrounding community. Our hypothesis was that these types of developments would be the most likely to impact the values of neighboring single-family houses. Two of the most controversial 40B projects in the study, Olde Derby Village and Kimball Court, are shown below (Figure 1). Given that we wished to test whether these projects would adversely impact neighboring property values, it was necessary to construct detailed maps of the projects and their surroundings. For this step, we built digital maps that identified streets, rivers, open space, zoning, and land use designations. We analyzed these maps using Geographic Information Systems (GIS) technology to assure that the developments were not located at the edge of the town and were sited in residential neighborhoods. Additionally, we evaluated the siting of potential projects using aerial photographs in order to obtain a better sense of the degree to which projects were integrated into residential neighborhoods. The results of this analysis were striking: We found the overwhelming majority of potential case studies were either sited at the edges of towns or cut off from the nearest 6

7 community by large amounts of open space, interstate highways, rail corridors, or industrial and manufacturing uses. This step considerably reduced the number of potential case studies appropriate for more rigorous analysis. Finally, we made site visits to each of the remaining potential projects. This exercise was instrumental in determining whether a project was actually integrated with the community. We also met with planners, building inspectors, assessors, and GIS specialists in order to obtain a better sense of the neighborhood context for each of the developments. SELECTED SITES The selection process identified seven projects that are, in most cases, larger and denser than the typical 40B development. Our intention in choosing large multi-family rental projects was to find developments with the highest likelihood of creating negative impacts on the surrounding neighborhood. It could be argued that the projects selected as case studies are the types of developments that suburbanites fear most. If there were ever a development that would cause a negative impact on surrounding property values, it would be one of the large, dense developments examined in this study. Figure 1. Two Controversial 40B Projects Olde Derby Village, Norwood (top) and Kimball Court, Woburn (bottom) iii

8 Essex Figure 2. Towns with Study Sites As can be seen Study Sites Merrimac Newburyport Haverhill West Newbury Groveland by Figure 2, the seven developments in the study are dispersed throughout the Townsend Dracut Lawrence Andover Ipswich Rockport greater Boston metropolitan Groton Ayer Littleton Harvard Boxborough Acton Stow Bolton Maynard Lowell Billerica WilminNgortthoRenading Bedford WoburnWakefield Burlington Winchester Stoneham Melrose Malden Medford Arlington Everett Belmont Somerville Cambridge Watertown Nahant Revere Winthrop Manchester Marblehead area. Woburn is bisected by Route 125/Interstate Swampscott 95 northwest of Boston. Wilmington borders Woburn to Southborough Boston Hull the north along I-93. Littleton Hopkinton Dover Westwood Braintree Norwood Randolph Canton Holbrook Norwell is further northwest of the city at the junction of Route 2 and Mendon Sharon Abington Whitman I-495. Norwood and Randolph Easton Mansfield West Bridgewater East Bridgewater are south of Boston along Norton Bridgewater the southern section of I-128. NECTA Boundary Taunton Middleborough Carver Plymouth ± Study Sites Miles Lakeville southwest edge of the region at the junction of I-95 and I Table 1 details the characteristics of each project including its location, developer, size, the number and percentage of affordable units, density, year permitted and completed, and comprehensive permit approval body. IMPACT AREA DESIGNATION The impact area for each case study is intended to represent the neighborhood within which the development is located. The single-family houses within this designation are the homes that can most likely be expected to be impacted by a large, dense development. For properties to be included in the impact area they must be either (1) direct abutters, (2) part of a contiguous network of streets radiating from the site, (3) in the direct line-of-sight of the development, or 8
9 (4) adjacent to open space connections, via playing fields and dedicated walking or bike paths.
10 v Table 1. Study Sites Detailed Statistics Development Location Developer Total Units Littleton Green Pond Side at Littleton Affordable Units % Affordable Density (units/ acre) Year Permitted Year Completed Approval Body Littleton Dementian Guschov % Board of Appeals Littleton First Littleton LP/State Street Development % Mediation: ZBA, HAC, Developer Mansfield Mansfield Keith Development % Mediation: Depot I/II ZBA, HAC, Developer Olde Derby Village Norwood Wilson Street Trust % Superior Court Liberty Place Randolph Liberty Place Associates % Board of Appeals Avalon Oaks Wilmington AvalonBay % MA Appeals Court Kimball Court Woburn Joseph Mullins % MA Appeals Apartments Court (I, II, III) Initial permit request initiated by Wilmington Arboretum.


11 These criteria define an area where houses are more likely to be negatively impacted from the development than the municipality at large. Ultimately, impact areas were determined on a case-by-case basis. It would have been inappropriate to apply a generic test such as drawing an arbitrary distance radius around the development capturing all the homes in the area. Our decisions were informed by analyses of zoning and land use maps, aerial photographs, road atlases, and site visits. Most importantly, we held discussions with town planners, building inspectors, tax assessors, GIS specialists, and town managers in order to gain their perspective of neighborhood impact of each development. In almost every case, these discussions reduced the size of our preliminary impact area. This study s careful and conservative treatment of each impact area limited its boundary to just slightly beyond the direct abutters of each development. Figure 3 shows photographs of the impact areas for three of the case studies. The top left, top right, and bottom right photographs were taken from the developments looking out to abutting properties. The bottom left photo was taken from an adjacent street looking into the development from the surrounding neighborhood. As can be seen below, all of these homes have direct sight lines into the developments and the projects are truly embedded in their neighborhoods. The houses deemed to be at the greatest risk of being affected by the mixed-income, multi-family development were included in the defined impact area for each Figure 3. Impact Area Photographs Kimball Court Apartments (Top Left), and Avalon Oaks (Top Right and Bottom) vi 11
12 development. The balance of the single-family houses in each town formed the control group. The few related studies examining the relationship between affordable housing and residential property value that have been conducted in other parts of the US often define their impact areas as contiguous neighborhood areas extending between one-quarter mile and onehalf mile from the site in question. This convention is not readily adaptable to our study or Boston s suburban metropolitan area. The former studies examined much more densely developed neighborhood areas comprised of a continuous urban fabric. In suburban Boston, however, an impact area dissolves quickly due to the large lot sizes and irregular street grids. In addition, previous studies have typically not been longitudinal. That is, they attempt to discern property value effects at a single point in time. Following neighborhood property values over time is a much more powerful tool. HEDONIC METHODOLOGY Our methodology draws from the considerable body of spatial and longitudinal research in urban and housing economics. We used hedonic modeling techniques to create quality-controlled sales price indexes for both the impact area and control area (the remainder of single-family homes in that town). Hedonic modeling is based on the assumption that home buyers assign quantifiable values to the individual characteristics that make up a house (e.g., size, bathrooms, lot size). Our models estimate both the contributions to value of the characteristics of a house and the variations in value that occur over time. This allows us to price a typical house over time. We have isolated time in the equation to see how house prices within the impact areas move as affordable housing developments are announced, built, and occupied. That is, we build and compare house price indexes for the impact and control areas to determine if house prices within the impact areas were affected by the introduction of large, dense rental housing developments. By considering both spatial and longitudinal house price variation, we provide a comprehensive look at the micro-level valuation impacts associated with such development. DATA AND MODEL SPECIFICATION This study used sales transaction data for single-family houses. We obtained records for about 36,000 transactions between 1982 and In order to use transaction data in hedonic
13
14 modeling, the records must contain structural attributes of the house in addition to the sales price and the sale date. All the requisite information is not compiled by one agency in a uniform format. Transaction data including address, sales price, date, buyer, seller, and mortgage amount are collected by the Registries of Deeds in Massachusetts. Records containing information pertaining to property attributes are maintained by local municipal assessors. We purchased data from a third party vender, The Warren Group, to bridge the gap between registries and assessors records. Drawing on the relevant economic literature, and guided by the availability of transaction data for individual houses, appropriate hedonic models were constructed for each case. In particular, thorough analyses of descriptive statistics were undertaken to construct appropriate explanatory variables. The variables we included are all considered to be strong determinants of price. All of our models contain a combination of the following explanatory variables: house size, lot size, number of bedrooms, number of bathrooms, and the year the house was built. Our hedonic models also include explanatory variables to represent time. These allow us to measure the effect of the passage of time, while holding constant the characteristics of the house. 2 For each of our seven cases, separate hedonic equations were constructed and estimated for both the control area and impact area. Using these results, we were able to price a typical house in each group over time. Comparisons of these price paths allowed us to see whether prices in an impact area deviated from those in a control area. ANALYSIS PERIOD Housing markets are very complex and information is absorbed differentially over time. As such, it is difficult to isolate the impact any one event has on sales price. The best way to capture the influence of an event is to observe impact area price paths or trends before, during, and after the event and look for substantial variations from a control path. We created house sales price indexes that begin before comprehensive permit approval and that extend beyond the initial occupancy of the projects. The twenty-year length of this study ( ) provided a continuous time path that included cyclical changes in the larger market. The analysis period for each development is designed to include the years in which the influence of the development was strongest. There are many competing factors affecting 8
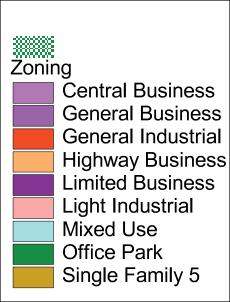
15 sales price of single-family homes, and as time passes after the introduction of a large, dense development, other factors may dilute its influence. The length of each analysis period varies slightly as a function of the development process. Generally, the analysis period is three years long, beginning with comprehensive permit approval and ending the year the project was placed in service. EMPIRICAL RESULTS KIMBALL COURT APARTMENTS, WOBURN For the purposes of this Executive Summary, we will give a thorough description of only one of the case studies, Kimball Court Apartments in Woburn. It is the largest development in our study and it is remarkably different from, and out of scale with, the surrounding neighborhood. As such, we might expect this development to be the most likely to affect single-family house prices. The City of Woburn has seen not one but three phases of the Kimball Court housing development. All phases were permitted using Chapter 40B, and each phase has a separate analysis period. The three analysis periods are not all the same length (differences are related to the construction and development timeline of each phase) but the impact area and the control area are the same for all phases. IMPACT AREA Kimball Court is located on the western edge of Woburn adjacent to the Burlington border. We have only considered the single-family homes in Woburn as part of the impact area. The boundary is rectangular shaped with three definitive edges formed by Burlington to the west, Route 128 to the south, and Main Street on the east. The northern edge is marked where Merrimac Street intersects Main Street and winds west through residential streets to where Pearl Street crosses into Burlington. The Kimball Court impact area is one of the largest in the study, in part because the development is so dominating that its presence radiates deeply into the residential neighborhood. The topography of the impact area slopes from the north and east toward Kimball Court. The grade affords houses close to Main Street and farther north clear site lines of the seven-story buildings. Figure 4 shows an aerial photograph and zoning map of the impact area and surrounding 9

16 Figure 4. Aerial Photograph and Zoning Map: Kimball Court, Woburn neighborhood. The photograph clearly depicts the mismatch between the form and scale of Kimball Court and neighboring single-family homes. Most of the open space adjacent to the development provides a buffer only to Burlington; Woburn residents face a sharp edge with little or no transition. The zoning map reinforces the point that Kimball Court is an island amid a singlefamily district. There are other non-residential uses to the south facing I-95/Route 128, but Kimball Court penetrates into the neighborhood as opposed to remaining on the periphery. SALES PRICE INDEXES Chart 1 shows the house price indexes for the control and impact areas. Both indexes track house price movements over time that are consistent with the Boston area s market experience. House prices rose strongly through the mid-1980 s peaking in late 1988 and Prices generally declined during the early 1990s, but by 1996 the market had turned a corner and house prices rebounded sharply. Both the control area and the impact area followed the experience of the larger Boston market, with both indexes following very similar price paths. In the years after the introduction of each Kimball Court phase, the impact area and control area experienced similar appreciation in sale price for single family homes. Over the 10
17 Index Chart 1. Woburn House Value Indexes Impact Control course of the entire study the compound annual growth rate for sale prices was 7.9% for the control area and 8.1% for the impact area. PHASE I The first phase was permitted in 1985 and completed in The appropriate analysis period using our price indexes begins at the two-year period preceding permitting ( ) and ends with the two-year period following completion. During this Phase I analysis period, the impact area experienced a 13.9 percent annual growth rate, slightly greater than the control area s 11.9 percent rate. (See Chart 2.) This was a turbulent period, with home prices doubling. PHASE II The second phase was permitted in 1989 and completed in The analysis period thus begins with and runs through , the two-year period after completion. For the Phase II analysis period the impact area house values were essentially unchanged (growth rate of 0.6 percent). Over the same time period, house prices in the control area declined slightly, with an annual growth rate of -3.3 percent. House values around Kimball Court were not adversely impacted by the mixed-income, multi-family rental development. xi
18 PHASE III The final phase was permitted in 1999 and completed in Our analysis period, therefore, runs from through 2003, the last year for which data were available. During the Phase III analysis period, the house values in the impact area rose 12.6 percent annually. The trend for the control area was nearly identical, with house values experiencing an average annual appreciation rate of 12.0 percent. Overall, we see that there are no substantive differences between the two price paths. Sale prices for single-family homes in the impact and control areas moved nearly in tandem during the three development phases of Kimball Court. CONCLUSION To answer the question, Do large-scale, high-density mixed-income rental developments negatively impact nearby single-family property values in suburban Boston?, we studied the relationship over time, within 8 separate communities, between single-family house prices directly impacted by such developments and those that were not. Our case selection criteria identified Chart 2. Woburn Annual Growth Rates Woburn Annual Growth Rates Phase I Phase II Phase III to to to 2003 xii
19 some of the worst-case scenarios of multi-family intrusion into a single-family neighborhood. As such, the developments we evaluated should have the greatest likelihood for negatively impacting adjacent residences. Moreover, given the often contentious nature of the comprehensive permit process, wherein fears of property devaulation and radical changes in neighborhood charcter were expressed, it seems readily apparent that many local residents would accept this premise. The empirical analysis for each of the seven cases indicated that the sales price indexes for the impact areas move essentially identically with the price indexes of the control areas before, during, and after the introduction of a 40B development. We find that large, dense, multi-family rental developments made possible by chapter 40B do not negatively impact the sales price of nearby single-family homes. Our findings are transferable to similar developments in towns such as the ones studied. Massachusetts-style mixed-income, multi-family developments need not be feared in terms of property value losses. The 40B developments considered in this study are high quality housing and, when built, represented the top of the local market. Nearly three-quarters of the housing units in our case studies are market rate. These 40B projects are not just affordable housing developments; they are market-rate multi-family rental communities incorporating an affordable component. Our finding of the absence of negative property value effects associated with 40B developments should allay municipalities and homeowners fears with respect to approving highquality projects. Given the severe shortage of affordable housing in the Boston metropolitan area, we hope the results of our research will contribute to increasing the rate at which municipalities are able to come into compliance with Massachusetts s affordable housing laws. xiii
20
21 CHAPTER 1: INTRODUCTION T hisreportaddressesanimportantquestionintheheateddebateconcerning higher-density, mixed-income development in neighborhoods comprised of single-family detached houses: Do multi-family mixed-income rental developments impact nearby single-family property values in suburban Boston communities? The fear of property value loss is often seen as a serious motive for resident opposition to higher-density mixed-income developments; in fact, there has been no research addressing this question for the Boston metropolitan area. Our case studies are drawn from the set of developments made possible by Chapter 40B of the Massachusetts General Law, also known as the Comprehensive Permit Law and Anti-Snob Zoning Act. Chapter 40B is a Massachusetts statute that enables developers to obtain state-authorized comprehensive permits in municipalities that have not yet come in compliance with state affordability criteria. Developments seeking comprehensive permits can override local zoning regulations if (1) less than ten percent of a municipality s housing stock is defined as affordable; and (2) at least 20 or 25 percent of the housing units in the proposed development are affordable. The 20 percent figure applies when the affordable units are open to households earning less than 50 percent of the area median income (AMI), and 25 percent are set aside when the criterion is household income less than 80 percent of the AMI. This study examines the relationship between seven predominantly large-scale, highdensity, multi-family rental 40B developments and single-family house value in six communities in suburban Boston. Comparative house price indexes have been created for each development using hedonic modeling to determine whether home values decreased, stayed the same, or increased over time as the result of the 40B development. No effective differences were found between the home price indexes for the impact and control areas in all seven case studies. Property values of single-family homes adjacent to higher-density developments track values of homes that are not proximate to the high-density developments. The fear of relative decline 1
22 of nearby property values is not consistent with the empirical evidence. The developments considered here were either contentious or highly contentious. These categories relate (1) to the level of opposition the developments faced during the permitting process and (2) which entity granted the final permit decision: the town, Housing Appeals Committee, Superior Court, Appellate Court, or Supreme Judicial Court. These categories are used to show how the 40B process has been framed and re-framed over time. The 40B process can be conceptualized in terms of three stages: 1. Introduction The developer introduces a project to the town. 2. Debate The permitting process negotiations and bargaining between the developer and municipality. 3. Resolution Final permit decision. The three-stage process emerged from our analysis of the highly contentious developments. We found that highly contentious projects often occur when towns are unprepared for new development. They either lack background for judging the costs and benefits to the town of the proposed development, or they simply do not want higher density development. Developers sometimes propose a project that may be larger than appropriate and are met with hostility. The permitting process puts the two parties at odds, setting the stage for a high-stakes, seemingly zero-sum game. In these highly contentious projects, the debate stage, which could be an opportunity for mutual revision of the development program, takes place with little negotiation or bargaining between developers and municipalities. Inevitably, it ends in a permit denial from the town. This denial leads to an extensive third stage with a long, expensive legal process. Fear of a protracted battle gives developers incentive to maximize project density in their initial proposals to compensate for anticipated extra costs, and the failure to resolve the question of density in earlier stages leaves towns with little leverage once the courts render the permit decision. The approach to contentious developments approved as a result of 40B requirements has been reframed over time. Initially, the process was framed in such a way that resulted in a strictly dichotomous solution of receipt or non-receipt of a comprehensive permit. As a result of contentious projects, developers and towns began to re-frame how to proceed with Stage 2 of the 40B process by concluding that they could each have a better end result if they negotiated 2
23 and bargained during the permitting process. In these cases, the municipality ends up making the final permit decision in Stage 3 instead of forcing the developer to appeal the permit through the higher-stakes court system. Non-contentious developments are possible but have been uncommon. In this report, only Littleton Green, a 24-unit age-restricted development, falls into this category. Because of the target population and small size, there was little community opposition to the development. Moreover, from the town s perspective, granting the comprehensive permit without intervention by state-level authorities who often restrict the scope of town behavior provided an opportunity for the town to negotiate for the incorporation of its own needs into the development program. RESEARCH METHODOLOGY This is the first study for Massachusetts of property values effects of multi-family affordable developments. We applied rigorous, state-of-the-art quantitative research methods to explore this issue as fully as possible. We designed the research approach to focus on contentious and highly contentious development; our focus on numerous worst-case scenarios meant choosing developments that many would consider most likely to have negative impacts. The selected 40B mixed-income developments had to be: (1) located within the Boston metropolitan area, (2) permitted between the mid-1980s and 2000, (3) rental apartments, and (4) embedded in single-family residential neighborhood. This process identified a group of developments that are generally both larger and denser than the typical 40B development. It could be argued that most of the case studies are the types of developments that suburbanites fear most: the worst neighbor that one would hope to have. If there were ever projects expected to cause negative impacts on surrounding property values, it would be the large, dense developments examined in this study. A crucial step in building the methodology was to identiy impact areas to use in the empirical analysis. How an impact area is defined is critical to achieving objective results. We carefully and conservatively drew impact area boundaries according to strict criteria, which resulted in impact areas that are almost exclusively abutters of the development. Impact area designation was done on a case by case basis; we did not simply apply a generic formula such as drawing a quarter- or half-mile radius around the development capturing all the homes in the 3
24 area. Our procedure included review of aerial photos, zoning maps, road maps, discussions with municipal officials, and site visits. This study uses hedonic modeling techniques to create comparative sales price indexes for each impact area and its respective control area, defined as the remainder of single-family homes in a town. Implicit in hedonic modeling is the assumption that home buyers assign value to the individual characteristics that make up a house (e.g., size, number of bathrooms). Hedonic modeling is a statistical tool used to estimate the value of these structural attributes. Since home values change over time, our models also estimate effect of time on house value. This is allows us to use the hedonic results to price a typical house over time. We thus built and compared house price indexes for impact and control areas to determine if house prices were affected by the introduction of 40B developments. CHAPTER 40B: A HISTORY, DESCRIPTION AND RESULTS Massachusetts Chapter 40B statute was written in 1969 partly in response to the form and consequence of twentieth-century suburbanization. Chapter 40B was based on a remarkably early recognition by its proponents that exclusionary zoning practices, such as large minimum lot size requirements and bans on multi-family housing, play a significant role in driving up housing costs and causing the dominant spatial pattern of economic and racial segregation found in most metropolitan areas of the United States. 1 The law was intended to stem the tide of widespread income and recial segregation in Massachusetts by giving the state the authority to supercede local (suburban) exclusionary zoning regulations. The 40B statute has two main objectives: housing production and household mobility. The production objective is to increase the supply of both affordable and multi-family housing in Massachusetts. The mobility objective is to provide opportunities for low- and moderate-income (particularly minority low-income) families to move out of the concentrated poverty of the inner city into suburban areas with increased educational and economic opportunities. Specifically, General Law Chapter 40B was enacted to provide expeditious relief from exclusionary local zoning by-laws and practices which might inhibit the construction of low and moderate income housing in the Commonwealth s cities and towns. 2 Pursuant to the statute, a qualified builder wishing to build low or moderate income housing may file with a local board of 4
25 appeals an application for a comprehensive permit instead of filing separate applications with each local agency having jurisdiction over the project. 3 If a local zoning board denies an application for a comprehensive permit, the developer may appeal to the Housing Appeals Committee (HAC), and the HAC will review the decision to determine whether the board s decision is reasonable and consistent with local needs. 4 The local zoning board has the burden of proving that the development will cause health, safety, environmental effects that outweigh the need for low and moderate income housing. If the HAC finds that the decision of the zoning board is not reasonable and consistent with local needs, it can direct the issuance of a comprehensive permit by the board. Chapter 40B is responsible for creating approximately 30,000 housing units to date, nearly 18,000 of which are privately owned rental housing units that are affordable to households earning at or below 80 percent of the AMI. 5 HOUSING TRENDS While the Boston area s population has been increasing, the number of housing units permitted annually in Massachusetts has declined significantly over the past few decades, from an average of 31,000 units per year during the 1970s to only 17,000 per year throughout the 1990s. Population and income growth and declining housing production are partly responsible for the recent major runup in housing prices and rents. Another contributory factor has been the constraints on land use throughout Boston s metropolitan area imposed by large lot single-family zoning in suburban communities. The decline in permitting of multi-family housing is even more striking, dropping from an average of 14,000 per year in the 1970s to 1,300 per year for most of the 1990s. 6 Massachusetts ranked forty-seventh in the country in multi-family housing starts in 2002, in the same league as large rural states such as Wyoming and North Dakota with less than 10 percent of the population of Massachusetts. 7 AFFORDABLE HOUSING TRENDS A thorough assessment of housing affordability is the focus of a related project. 8 It is useful here, however, to note that the vast majority of Boston-area towns and cities have not met the ten percent requirement in the Chapter 40B legislation. (See Table 1.1.) Jurisdictions with low- 5
26 income neighborhoods dominate the above 10% group (Boston, Lawrence, Lowell, Springfield, and Worcester). EXCLUSION AND OPPOSITION Exclusionary zoning and local opposition in suburban communities have significantly hindered both market-rate and affordable multi-family housing production. Massachusetts has a strong tradition of home rule, and municipalities use exclusionary zoning practices such as large lot single-family zoning to effectively close the door to the suburbs for lower- and moderate income families. Chapter 40B has been so contentious because it supercedes the control over the most significantpower suburbs have zoning. Residents resist 40Bdevelopments in their neighborhoods and expend considerable effort to block comprehensive permit applications. The arguments presented in opposition to 40B developments are numerous and often pertain to traffic and congestion, architectural design and contextual sensitivity, property value, municipal budgeting, and environmental impacts. Many believe, however, that most citizen opposition can be distilled to a fear of neighborhood devaluation. Thus, residents are acting in what they believe to be the interest of wealth preservation by protecting the value of their homes the asset that is most often the largest component of their investment portfolios. 10 This study examines whether this self-interest is well founded. Table 1.1 Boston Area Municipalities Subsidized Housing Inventory Boston Metropolitan Area Municipalities Affordable Housing Share Number of Municipalities Percent 0-2.5% 24 15% % 69 45% % 33 21% % 16 10% Above 10% 13 8% Total % Source: MA Dept of Housing and Community Development, Subsidized Housing Inventory, April
27 REPORT ORGANIZATION In the following chapters we present our research methodology and empirically examine the impact of 40B developments on surrounding property values. Chapter 2 describes the case selection process and identification of each impact area. Our treatment of these issues sets this study apart from most previous work. Chapter 3 outlines the theoretical framework for using hedonic modeling and presents the specific econometric methodology used in this study. Chapter 4 presents our empirical findings. We review the results of each case study by discussing the price indexes. Notes 1 Krefetz, Sharon Perlman. The Impact and Evolution of the Massachusetts Comprehensive Permit and Zoning Appeals Act: Thirty Years of Experience with a State Legislative Effort to Overcome Exclusionary Zoning, 22 Western New England Law Review, Stonefield, Sam. Symposium: Affordable Housing in Suburbia: The Importance but Limited Power and Effectiveness of the State Override Tool, 22 Western New England Law Review, Zoning Board of Appeals of Greenfield v. Housing Appeals Committee, Zoning Board of Appeals of Wellesley v. Housing Appeals Committee, Ibid. 6 Heudorfer, Bonnie. The Record on 40B: The Effectiveness of the Massachusetts Affordable Housing Zoning Law. Citizens Housing and Planning Association, June Ibid. 8 Hindman, Matthew. A worthy strategy for affordable housing, The Boston Globe, March 27, Boston Affordability Index forthcoming, May Fischel, William. The Homevoter Hypothesis. Cambridge, MA: Harvard University Press,
28 8
29 CHAPTER 2: CASE STUDIES: METHODOLOGY AND DESCRIPTION T he research methodology employed was designed to maximize the likelihood of finding a negative impact on single-family housing prices from large-scale rental developments. If negative impacts are not found for the cases studied here, it is highly unlikely that they would be found in other cases. CASE SELECTION PROCESS The case selection process began with an examination of developments having used Chapter 40B to obtain zoning relief. The Citizens Housing and Planning Association (CHAPA), in their June 2003 report on the effectiveness of Chapter 40B, assembled a list of all 40B developments, totaling 491 projects. Table 2.1 is a compilation of summary statistics for the complete 40B project list. The mean project size is 58 units with a standard deviation of 60 units; the overwhelming majority of projects are 120 units or less in size. The median of the inventory list is a 37-unit project, and the most common sized project is only eight units. This inventory of projects was broken down by a number of selection criteria to find an appropriate group of cases studies. First, only projects within the Boston metropolitan area 1 were eligible for the study. Second, the projects were required to have received their comprehensive Table 2.1 Summary Statistics: Chapter 40B Developments Total Development Size Mean 58 Median 37 Mode 8 Standard Deviation 60 Range 311 Minimum 1 Maximum 312 Count 491 9
30 permit and have been fully developed between the mid-1980s and This time frame was necessary to satisfy the data requirements for the analysis. 2 Third, we only examined multi- family rental developments, not homeownership, and projects that were mixed income. Fourth, we tried to select larger projects that were very dissimilar in size, bulk, form, and density from the surrounding community. Our intention here was to find developments with a high likelihood of engendering community opposition. We felt that these larger projects that were generally out of scale with surrounding housing would be the most likely to create a perception of negative externalities and subsequent property devaluation. After applying these selection criteria to CHAPA s 40B inventory list, the number of possible projects to examine was significantly reduced. With this shortened list of developments, we then proceeded to identify the projects on GIS maps with data layers of streets, rivers, open space, zoning, and land use designations to assure that the developments were not located at the edge of the town and were sited in residential neighborhoods. Additionally, we used aerial photographs in order to obtain a better sense of whether projects were incorporated in residential neighborhoods or isolated. The results of this analysis were striking (but not surprising to anyone who has closely followed 40B): we found the overwhelming majority of the developments either placed at the edges of towns, or cut off from the community by large amounts of open space, interstate highways, high-tension power lines, rail corridors, and industrial and manufacturing uses. Finally, we made site visits to all the potential projects that remained after the previous analysis was complete. This exercise was instrumental to determining whether or not a project was actually integrated with the community. We also met with planners, building inspectors, assessors, and GIS specialists in order to obtain a better sense of the neighborhood context for Table 2.2 Summary Statistics: Subject Sites Total Development Size Mean 198 Median 193 Mode N/A Standard Deviation 163 Range 501 Minimum 24 Maximum 525 Count 7 10
31 each of the developments. This phase of the case selection process was extremely important in determining the final list of projects for the study. CASE STUDY SITES We successfully identified seven mixed-income, multi-family developments that matched our criteria. Table 2.2 shows a compilation of the summary statistics for these developments. These seven projects have a median size of 193 units, and fall in a range from 24 units to 525 units. The mean size of the projects in the study is 198 units, and there is a large standard deviation of 163 units: our case projects vary substantially in size. The mean, median, standard deviation and range of our sample are all higher than the values for the entire group of 40B developments described above. This stems in part from treating each multi-phase project as a single large development. As can be seen by the map of the study sites (Figure 2.1), the nine developments in the study are dispersed throughout the greater Boston metropolitan area. Woburn is bisected by Route 128/Interstate 95 northwest of Boston. Wilmington lies just north along Interstate 93. Littleton is further northwest of the city at the junction of routes 2 and 495. Norwood and Randolph are south of Boston along the southern section of Route 128. Finally, Mansfield is southwest of the city at the junction of Interstates 95 and 495. Table 2.3 presents the characteristics of the individual developments including their location, developer, total size, the number and percentage of affordable units, density, year permitted and completed, comprehensive permit approval body, and category of opposition. IMPACT AREA DESIGNATION The impact area for each case study is intended to represent the neighborhood within which the development is located. The single-family houses within the impact area boundary are the ones that can realistically be expected to be directly impacted by the development. Impact areas are designed to incorporate a continuous network of roads and social interaction while taking into account barriers such as geographic features and major infrastructure, zoning, and local political divisions such as school districts. A specific set of criteria were used to identify impact areas. For properties to be included in the impact area they must satisfy one of the following: (1) be direct 11

32 Essex Figure 2.1 Map of Study Sites Study Sites Merrimac Haverhill Newburyport West Newbury Groveland Lawrence Ipswich Townsend Groton Dracut Lowell Andover Rockport Ayer Harvard Littleton Boxborough Acton Stow Bolton Maynard Billerica WilminNgortthoRenading Bedford Woburn Wakefield Burlington Winchester Stoneham Melrose Malden Beverly Swampscott Arlington Medford Nahant Everett Revere Belmont Somerville Cambridge Winthrop Watertown Manchester Marblehead Southborough Boston Hull Hopkinton Dover Westwood Braintree Norwood Randolph Canton Holbrook Norwell Mendon Sharon Abington Whitman Easton Mansfield East Bridgewater West Bridgewater Norton Bridgewater Taunton Middleborough NECTA Boundary Carver Plymouth ± Study Sites Miles Lakeville abutters; (2) be part of a contiguous road network of primary and secondary streets radiating from 12
33 the development site; (3) have a visual connection and direct line-of-sight to the development; 13
34 13 Table 2.3 Study Sites Detailed Statistics Development Location Developer Total Units Littleton Green Pond Side at Littleton Affordable Units % Affordable Density (units/ acre) Year Permitted Year Completed Approval Body Littleton Dementian Guschov % Board of Appeals Littleton First Littleton LP/State Street Development % Mediation: ZBA, HAC, Developer Mansfield Mansfield Keith Development % Mediation: Depot I/II ZBA, HAC, Developer Olde Derby Village Norwood Wilson Street Trust % Superior Court Liberty Place Randolph Liberty Place Associates % Board of Appeals Avalon Oaks Wilmington AvalonBay % MA Appeals Court Kimball Court Woburn Joseph Mullins % MA Appeals Apartments Court (I, II, III) Initial permit request initiated by Wilmington Arboretum.
35


36 or (4) be adjacent to open space connections, via playing fields and dedicated walking or bike paths. These criteria define an area where all neighbors potentially experience a perception of an imposing new higher-density development. Ultimately, impact areas were determined on a case-by-case basis. It would have been highly inappropriate to apply a generic test such as drawing an arbitrary distance radius around the development capturing all the homes in the area. Our decisions were informed by analyses of GIS maps, zoning, aerial photographs, road atlases, and site visits. Most importantly, we held discussions with local municipal officials such as planners, building inspectors, tax assessors, GIS specialists, and town managers in order to gain their perspective of neighborhood impact by each 40B development. In almost every case these discussions reduced the size of our preliminary impact area. This study s careful and conservative treatment of the impact area limited its boundary to slightly beyond the direct abutters of each development. Figure 2.2 shows photographs of the impact areas for three of the case studies. As can be seen in the photographs, all of these homes have direct site lines to the developments and the projects are wholly embedded in single-family home neighborhoods. Studies examining the relationship between affordable housing and residential property Figure 2.2 Impact Area Photographs Top L- View from Kimball Court Apartments, Top R View from Avalon Oaks, Bottom R- Avalon Oaks, looking out on neighborhood 14
37 value that have been conducted elsewhere in the U.S. define the impact areas as contiguous neighborhood fabrics ranging from 500 feet to one-half mile from the site in question. 3 These definitions are not readily adaptable to our study. These previous studies examined much more densely developed neighborhood areas. Urban neighborhood boundaries are rarely clearly delineated, as locations several blocks from a subject site may still maintain strong visual sight lines and social connections to the site. Well-connected urban neighborhoods allow the relative feeling of proximity to extend farther away from an impact site than in suburban Boston, where impact areas dissolve quickly due to large-lot zoning and irregular street patterns. CONTROL AREAS This study defines the control area as the municipality in which the development is located. All but one development examined in this study are located in municipalities organized as towns with a public-meeting form of government. The strong allegiance to home rule and the marked differences in the range and quality of public services provided by each municipality imply that houses are not always close substitutes among municipalities. WOBURN Woburn is the densest community in the study with 1.9 housing units per acre. It also has one of the highest rates of renter-occupied housing, 39 percent of the overall housing stock. In addition to Woburn having the lowest median income (approximately $55,000) of the studied communities, it also has one of the lowest percentages of subsidized affordable housing, accounting for only 5.7 percent of the city s total housing stock. Kimball Court is located on the western edge of Woburn adjacent to the Burlington border, as indicated in Figure 2.3. We only consider the single-family homes located in Woburn as the impact area. The boundary is rectangular with three clear edges formed by Burlington to the west, Route 128 to the south and Main Street on the east. The northern edge is marked where Merrimac Street intersects Main Street and winds west through residential streets to where Pearl Street crosses into Burlington. The Kimball Court impact area is one of the largest in the study, in part because the development is so dominating that its presence radiates deeply into the residential neighborhood. In fact, the Boston Business Journal lists Kimball Court as the sixth 15


38 Figure
39 largest apartment complex in Massachusetts, with 525 units in the first three phases. Figure 2.3 shows an aerial photograph and zoning map of the impact area and surrounding neighborhood. Most of the open space adjacent to the development provides a buffer only to Burlington; Woburn residents face a sharp boundary with little or no transition. The topography of the impact area slopes from the north and east toward Kimball Court. The grade affords houses close to Main Street and farther north clear site lines of the seven-story buildings. The photographs clearly depict the mismatch between the form and scale of Kimball Court and neighboring singlefamily homes. The zoning map reinforces the point that Kimball Court is an island amid a singlefamily district. There are other non-residential uses to the south facing I-95/Route 128, but Kimball Court penetrates into the neighborhood as opposed to remaining on the periphery. Kimball Court s density is units per acre, by far the densest development in the study and over ten times more dense than Woburn s average density of 1.9 units per acre. This was likely the cause of some resident opposition. In the case of Kimball Court, there was significant resistance to the development from the beginning. Kimball Court s developer, Joseph Mullins, properly filed a complete application for a comprehensive permit on October 6, The Woburn Zoning Board of Appeals (ZBA) issued a denial of the comprehensive permit on December 14, 1983, after having failed to hold a public hearing within 30 days of receipt of the application and inadequately advertising the December meeting at which a vote was held. The board based its decision to deny the permit based on its inconsistency with local needs and that the proposed development would have an adverse effect on the health and safety, not the occupants of the proposed housing but the residents in general. 4 Additional concerns cited by the ZBA were drainage, flooding, inadequate water pressure, and that the access road to the site was unsafe. In short, the board believed that the development would have a deleterious effect on the health and safety of town residents. In October of 1984, the Superior Court decided in favor of granting the permit to Kimball Court primarily because the Woburn Board of Appeals failed to act within the statutory time period. According to a previous court decision, the Chapter 40B was enacted to provide expeditious relief from exclusionary local zoning by-laws and practices which might inhibit construction of low and moderate income housing in the Commonwealth s cities and towns. 5 [Authors emphasis] 17
40 Additionally, the Superior Court found that proper notice was not given for the public hearing; the notices were late and were not posted in the appropriate locations. Proper notice is designed to promote the general welfare of the community and give citizens the chance to voice questions, concerns, or support for projects. The ruling stated that the decision granting of the permit to Kimball Court was not based on a technicality of the statute, but a legislative and jurisdictional policy that citizens in the town are entitled to notice and the opportunity to be heard and that this policy [would] be strictly enforced. On May 24, 1985, the Massachusetts Appeals Court affirmed the decision of the Superior Court and in doing so ordered the issuance of the comprehensive permit for Kimball Court Apartments. Subsequently, the second and third phases of the Kimball Court apartments were both approved by the Woburn Board of Appeals, in 1989 and 1999 respectively, without significant opposition. LITTLETON This study evaluates two 40B developments located in the town of Littleton. Each development has an independent impact area. The two developments received comprehensive permit approval in successive years. The analysis periods for the two impact areas overlap, and in an effort to better isolate the influences of the two 40B developments a single control area is used. The control area includes all single-family homes in the town of Littleton minus the homes in the two impact areas. Figure 2.4 shows the extents of both impact areas. Pond Side and Littleton Green are located relatively close to one another, but not close enough to be considered part of the same residential neighborhood. In addition to distance, they are separated by I-495. Both developments are surrounded by single-family residences: Littleton Green is embedded in relatively dense, contiguous neighborhood, and Pond Side is in the middle of a looser, diffuse residential area. Littleton Green is a 24-unit, 100-percent affordable elderly housing development made up of three buildings with eight one-bedroom units per building. Pond Side is larger, with 90 units. Although 90 units is still relatively small, Littleton s entire housing supply is only slightly more than 3,000 units. Pond Side alone therefore represented a 3 percent increase in Littleton s housing stock. The impact area surrounding the Littleton Green development is compact and shaped like a square. The development is situated close to the center of the impact area and the majority of 18


41 Figure
Fact Sheet on Chapter 40B The State s Affordable Housing Zoning Law
 Fact Sheet on Chapter 40B The State s Affordable Housing Zoning Law Prepared by Citizens Housing and Planning Association October 2009 What is Chapter 40B? Chapter 40B is a state statute, which enables
MONTHLY MARKET INSIGHTS REPORT
 MONTHLY MARKET INSIGHTS REPORT Detached Single-Family Homes SEPTEMBER 217 The 1,1 homes sold in September 217 was the seventh highest sales total for the month, and was a 5. percent decrease in sales volume
MONTHLY MARKET INSIGHTS REPORT
 MONTHLY MARKET INSIGHTS REPORT Detached Single-Family Homes JUNE 218 The 1,822 homes sold in June 218was the fifth highest sales total for the month and was a 6.2 percent decrease from the record June
RESIDENTIAL MARKET ANALYSIS
 RESIDENTIAL MARKET ANALYSIS CLANCY TERRY RMLS Student Fellow Master of Real Estate Development Candidate Oregon and national housing markets both demonstrated shifting trends in the first quarter of 2015
MONTHLY MARKET INSIGHT REPORT
 MONTHLY MARKET INSIGHT REPORT AUGUST 218 Detached Single-Family Homes The 1,679 homes sold in August 218 was the fourth highest sales total for the month and was a 3.3 percent increase in sales volume
MONTHLY MARKET INSIGHT REPORT
 Detached Single-Family Homes DECEMBER 217 The 1,27 homes sold in December 217 was the seventh highest sales total for the month and was a 9.7 percent decrease in sales volume from the 1,137 homes sold
MONTHLY MARKET INSIGHT REPORT
 Detached Single-Family Homes FEBRUARY 218 The 481 homes sold in February 218 was the twelfth highest sales volume for the month and was a 5.5 percent decrease from the 59 homes sold in February 217. This
MONTHLY MARKET INSIGHTS REPORT
 MONTHLY MARKET INSIGHTS REPORT Detached Single-Family Homes OCTOBER 217 The 1,11 homes sold in October 217 was the fourth highest sales total for the month and was a 14.3 percent increase in sales volume
Hennepin County Economic Analysis Executive Summary
 Hennepin County Economic Analysis Executive Summary Embrace Open Space commissioned an economic study of home values in Hennepin County to quantify the financial impact of proximity to open spaces on the
COMPARISON OF THE LONG-TERM COST OF SHELTER ALLOWANCES AND NON-PROFIT HOUSING
 COMPARISON OF THE LONG-TERM COST OF SHELTER ALLOWANCES AND NON-PROFIT HOUSING Prepared for The Fair Rental Policy Organization of Ontario By Clayton Research Associates Limited October, 1993 EXECUTIVE
Volume Title: Well Worth Saving: How the New Deal Safeguarded Home Ownership
 This PDF is a selection from a published volume from the National Bureau of Economic Research Volume Title: Well Worth Saving: How the New Deal Safeguarded Home Ownership Volume Author/Editor: Price V.
The Impact of Scattered Site Public Housing on Residential Property Values
 The Impact of Scattered Site Public Housing on Residential Property Values a study prepared by Vivian Puryear Department of Sociology University of North Carolina at Charlotte and John G. Hayes, Ph.D.
Table of Contents. Appendix...22
 Table Contents 1. Background 3 1.1 Purpose.3 1.2 Data Sources 3 1.3 Data Aggregation...4 1.4 Principles Methodology.. 5 2. Existing Population, Dwelling Units and Employment 6 2.1 Population.6 2.1.1 Distribution
To achieve growth, property development, redevelopment and an improved tax base in the cities and boroughs in the Lehigh Valley.
 Most growth in property valuation is in townships. Between 1991 and 2004, the assessed valuation of the townships in the Lehigh Valley increased by more than $2.8 billion, an increase of 41%. At the same
MONTHLY MARKET INSIGHT REPORT
 MONTHLY MARKET INSIGHT REPORT Detached Single-Family Homes JULY 218 The 1,651 homes sold in July 218 was the fifth highest sales total for the month and was a 5.7 percent increase from the July 217 sales
MONTHLY MARKET INSIGHT REPORT
 Detached Single-Family Homes JANUARY 219 The 77 homes sold in January 219 was the tenth highest sales volume for the month and was a 11 percent decrease from the 794 homes sold in January 218. The median
INCLUSIONARY ZONING GUIDELINES FOR CITIES & TOWNS. Prepared for the Massachusetts Housing Partnership Fund By Edith M. Netter, Esq.
 INCLUSIONARY ZONING GUIDELINES FOR CITIES & TOWNS Prepared for the Massachusetts Housing Partnership Fund By Edith M. Netter, Esq. September 2000 Massachusetts Housing Partnership Fund Two Oliver Street
Housing Affordability Research and Resources
 Housing Affordability Research and Resources An Analysis of Inclusionary Zoning and Alternatives University of Maryland National Center for Smart Growth Research and Education Abt Associates Shipman &
CHAPTER 7 HOUSING. Housing May
 CHAPTER 7 HOUSING Housing has been identified as an important or very important topic to be discussed within the master plan by 74% of the survey respondents in Shelburne and 65% of the respondents in
Northgate Mall s Effect on Surrounding Property Values
 James Seago Economics 345 Urban Economics Durham Paper Monday, March 24 th 2013 Northgate Mall s Effect on Surrounding Property Values I. Introduction & Motivation Over the course of the last few decades
Metro Boston Perfect Fit Parking Initiative
 Metro Boston Perfect Fit Parking Initiative Phase 1 Technical Memo Report by the Metropolitan Area Planning Council February 2017 1 About MAPC The Metropolitan Area Planning Council (MAPC) is the regional
While the United States experienced its larg
 Jamie Davenport The Effect of Demand and Supply factors on the Affordability of Housing Jamie Davenport 44 I. Introduction While the United States experienced its larg est period of economic growth in
Estimating National Levels of Home Improvement and Repair Spending by Rental Property Owners
 Joint Center for Housing Studies Harvard University Estimating National Levels of Home Improvement and Repair Spending by Rental Property Owners Abbe Will October 2010 N10-2 2010 by Abbe Will. All rights
IMPACT OF PROPOSED ROLL BACK OF AD VALOREM TAX REVENUES ON FLORIDA S COUNTIES
 IMPACT OF PROPOSED ROLL BACK OF AD VALOREM TAX REVENUES ON FLORIDA S COUNTIES Prepared for Florida Association of Counties 100 South Monroe Street Tallahassee, Florida 32301 Prepared by Fishkind & Associates,
Oil & Gas Lease Auctions: An Economic Perspective
 Oil & Gas Lease Auctions: An Economic Perspective March 15, 2010 Presented by: The Florida Legislature Office of Economic and Demographic Research 850.487.1402 http://edr.state.fl.us Bidding for Oil &
Document under Separate Cover Refer to LPS State of Housing
 Document under Separate Cover Refer to LPS5-17 216 State of Housing Contents Housing in Halton 1 Overview The Housing Continuum Halton s Housing Model 3 216 Income & Housing Costs 216 Indicator of Housing
THE EFFECT OF PROXIMITY TO PUBLIC TRANSIT ON PROPERTY VALUES
 THE EFFECT OF PROXIMITY TO PUBLIC TRANSIT ON PROPERTY VALUES Public transit networks are essential to the functioning of a city. When purchasing a property, some buyers will try to get as close as possible
How Did Foreclosures Affect Property Values in Georgia School Districts?
 Tulane Economics Working Paper Series How Did Foreclosures Affect Property Values in Georgia School Districts? James Alm Department of Economics Tulane University New Orleans, LA jalm@tulane.edu Robert
NINE FACTS NEW YORKERS SHOULD KNOW ABOUT RENT REGULATION
 NINE FACTS NEW YORKERS SHOULD KNOW ABOUT RENT REGULATION July 2009 Citizens Budget Commission Since 1993 New York City s rent regulations have moved toward deregulation. However, there is a possibility
Misconceptions about Across-the-Fence Methodology
 Misconceptions about Across-the-Fence Methodology BY JOHN SCHMICK Across-the-fence methodology (ATF) is an appraisal tool frequently used in valuation assignments where the subject is part of railroad
BUILD-OUT ANALYSIS GRANTHAM, NEW HAMPSHIRE
 BUILD-OUT ANALYSIS GRANTHAM, NEW HAMPSHIRE A Determination of the Maximum Amount of Future Residential Development Possible Under Current Land Use Regulations Prepared for the Town of Grantham by Upper
Effects of Zoning on Residential Option Value. Jonathan C. Young RESEARCH PAPER
 Effects of Zoning on Residential Option Value By Jonathan C. Young RESEARCH PAPER 2004-12 Jonathan C. Young Department of Economics West Virginia University Business and Economics BOX 41 Morgantown, WV
Trends in Affordable Home Ownership in Calgary
 Trends in Affordable Home Ownership in Calgary 2006 July www.calgary.ca Call 3-1-1 PUBLISHING INFORMATION TITLE: AUTHOR: STATUS: TRENDS IN AFFORDABLE HOME OWNERSHIP CORPORATE ECONOMICS FINAL PRINTING DATE:
An Assessment of Current House Price Developments in Germany 1
 An Assessment of Current House Price Developments in Germany 1 Florian Kajuth 2 Thomas A. Knetsch² Nicolas Pinkwart² Deutsche Bundesbank 1 Introduction House prices in Germany did not experience a noticeable
Ontario Rental Market Study:
 Ontario Rental Market Study: Renovation Investment and the Role of Vacancy Decontrol October 2017 Prepared for the Federation of Rental-housing Providers of Ontario by URBANATION Inc. Page 1 of 11 TABLE
HOUSING AFFORDABILITY
 HOUSING AFFORDABILITY (RENTAL) 2016 A study for the Perth metropolitan area Research and analysis conducted by: In association with industry experts: And supported by: Contents 1. Introduction...3 2. Executive
How to Read a Real Estate Appraisal Report
 How to Read a Real Estate Appraisal Report Much of the private, corporate and public wealth of the world consists of real estate. The magnitude of this fundamental resource creates a need for informed
Voluntary or Mandatory Inclusionary Housing? Production, Predictability, and Enforcement
 Voluntary or Mandatory Inclusionary Housing? Production, Predictability, and Enforcement November 2003 Business and Professional People for the Public Interest 25 E. Washington, Suite 1515 Chicago, IL
Chapter 40B Permitting and Litigation
 Chapter 40B Permitting and Litigation A report by the Housing Affordability Initiative June 2007 Lynn Fisher, Assistant Professor of Real Estate The Housing Affordability Initiative represents a long-term
Memo to the Planning Commission JULY 12TH, 2018
 Memo to the Planning Commission JULY 12TH, 2018 Topic: California State Senate Bill 828 and State Assembly Bill 1771 Staff Contacts: Joshua Switzky, Land Use & Housing Program Manager, Citywide Division
Land Use. Land Use Categories. Chart 5.1. Nepeuskun Existing Land Use Inventory. Overview
 Land Use State Comprehensive Planning Requirements for this Chapter A compilation of objectives, policies, goals, maps and programs to guide the future development and redevelopment of public and private
8Land Use. The Land Use Plan consists of the following elements:
 8Land Use 1. Introduction The Land Use Plan consists of the following elements: 1. Introduction 2. Existing Conditions 3. Opportunities for Redevelopment 4. Land Use Projections 5. Future Land Use Policies
Affordable Housing Case Studies: Massachusetts & Maryland
 The Bay State Old Line State Affordable Housing Case Studies: Massachusetts & Maryland Martin A. Bierbaum, Ph.D.-J.D. Growth & Infrastructure Conference Bradenton, Florida November 2014 Guiding Questions
State and Metropolitan Administration of Section 8: Current Models and Potential Resources. Final Report. Executive Summary
 State and Metropolitan Administration of Section 8: Current Models and Potential Resources Final Report Cambridge, MA Lexington, MA Hadley, MA Bethesda, MD Washington, DC Chicago, IL Cairo, Egypt Johannesburg,
Zoning Analysis. 2.0 Residential Use. 1.0 Introduction
 Zoning Analysis 1.0 Introduction For zoning to be an effective community development tool, it must recognize the unique land use characteristics of the various portions of the community. The Lawrence Zoning
Settlement Pattern & Form with service costs analysis Preliminary Report
 Settlement Pattern & Form with service costs analysis Preliminary Report Prepared for Regional Planning Halifax Regional Municipality by Financial Services, HRM May 15, 2004 TABLE OF CONTENTS INTRODUCTION...
The Positive Externalities of Historic District Designation
 The Park Place Economist Volume 12 Issue 1 Article 16 2004 The Positive Externalities of Historic District Designation '05 Illinois Wesleyan University Recommended Citation Romero '05, Ana Maria (2004)
Relationship of age and market value of office buildings in Tirana City
 Relationship of age and market value of office buildings in Tirana City Phd. Elfrida SHEHU Polytechnic University of Tirana Civil Engineering Department of Civil Engineering Faculty Tirana, Albania elfridaal@yahoo.com
Residential Capacity Estimate
 Residential Capacity Estimate Montgomery County Department of Park & Planning Research & Technology Center January 2005 Current plans allow 75,000 more housing units. by Matthew Greene, Research Planner
INCENTIVE POLICY FOR AFFORDABLE HOUSING
 INCENTIVE POLICY FOR AFFORDABLE HOUSING PREPARED BY: CITY OF FLAGSTAFF S HOUSING SECTION COMMUNITY DEVELOPMENT DIVISION OCTOBER 2009 2 1 1 W e s t A s p e n A v e. t e l e p h o n e : 9 2 8. 7 7 9. 7 6
FINAL REPORT AN ANALYSIS OF SECONDARY ROAD MAINTENANCE PAYMENTS TO HENRICO AND ARLINGTON COUNTIES WITH THE DECEMBER 2001 UPDATE
 FINAL REPORT AN ANALYSIS OF SECONDARY ROAD MAINTENANCE PAYMENTS TO HENRICO AND ARLINGTON COUNTIES WITH THE DECEMBER 2001 UPDATE Robert A. Hanson, P.E. Senior Research Scientist Cherie A. Kyte Senior Research
Rough Proportionality and the City of Austin. Prepared for the Austin Bar Association 2016 Land Development Seminar (9/30/16)
") Rough Proportionality and the City of Austin Prepared for the Austin Bar Association 2016 Land Development Seminar (9/30/16) Dan Hennessey, PE Vice President, Director of Transportation/Traffic BIG RED
Rough Proportionality and the City of Austin Prepared for the Austin Bar Association 2016 Land Development Seminar (9/30/16) Dan Hennessey, PE Vice President, Director of Transportation/Traffic BIG RED
REAL ESTATE MARKET OVERVIEW 1 st Half of 2015
 REAL ESTATE MARKET OVERVIEW 1 st Half of 2015 With Comparisons to the 2 nd Half of 2014 September 4, 2015 Prepared for: First Bank of Wyoming Prepared by: Ken Markert, AICP MMI Planning 2319 Davidson Ave.
UNDERSTANDING DEVELOPER S DECISION- MAKING IN THE REGION OF WATERLOO
 UNDERSTANDING DEVELOPER S DECISION- MAKING IN THE REGION OF WATERLOO SUMMARY OF RESULTS J. Tran PURPOSE OF RESEARCH To analyze the behaviours and decision-making of developers in the Region of Waterloo
Prepared For: Pennsylvania Utility Law Project (PULP) Harry Geller, Executive Director Harrisburg, Pennsylvania
 Harry Geller, Executive Director Harrisburg, Pennsylvania") THE CONTRIBUTION OF UTILITY BILLS TO THE UNAFFORDABILITY OF LOW-INCOME RENTAL HOUSING IN PENNSYLVANIA June 2009 Prepared For: Pennsylvania Utility Law Project (PULP) Harry Geller, Executive Director Harrisburg,
THE CONTRIBUTION OF UTILITY BILLS TO THE UNAFFORDABILITY OF LOW-INCOME RENTAL HOUSING IN PENNSYLVANIA June 2009 Prepared For: Pennsylvania Utility Law Project (PULP) Harry Geller, Executive Director Harrisburg,
SUBJECT: Report Number PDC Acquisition of 20 Single Family Residences from the Housing Authority of Portland EXECUTIVE SUMMARY
 DATE: May 28, 2008 TO: FROM: Board of Commissioners Bruce A. Warner, Executive Director SUBJECT: Report Number 08-69 PDC Acquisition of 20 Single Family Residences from the Housing Authority of Portland
MONTGOMERY COUNTY RENTAL HOUSING STUDY. NEIGHBORHOOD ASSESSMENT June 2016
 MONTGOMERY COUNTY RENTAL HOUSING STUDY NEIGHBORHOOD ASSESSMENT June 2016 AGENDA Model Neighborhood Presentation Neighborhood Discussion Timeline Discussion Next Steps 2 WORK COMPLETED Socioeconomic Analysis
A project of Neighborhood Projects for Community Revitalization At the Center for Urban and Regional Affairs (CURA) University of Minnesota
 University of Minnesota") Affordable Housing Siting Opportunities in Minneapolis October 2008 Rachel C. Robinson, Author With assistance from Joel Larson A project of Neighborhood Projects for Community Revitalization At the Center
Affordable Housing Siting Opportunities in Minneapolis October 2008 Rachel C. Robinson, Author With assistance from Joel Larson A project of Neighborhood Projects for Community Revitalization At the Center
The purpose of the appraisal was to determine the value of this six that is located in the Town of St. Mary s.
 The purpose of the appraisal was to determine the value of this six that is located in the Town of St. Mary s. The subject property was originally acquired by Michael and Bonnie Etta Mattiussi in August
BARNSTABLE COUNTY HOME CONSORTIUM UNDERWRITING ANALYSIS OF FUNDING REQUEST
 BARNSTABLE COUNTY HOME CONSORTIUM UNDERWRITING ANALYSIS OF FUNDING REQUEST APPLICANT/SPONSOR: Dakota Partners PROJECT NAME/ADDRESS: Village Green- Phase II 770 Independence Drive- Hyannis HOME $ REQUESTED:
Filling the Gaps: Active, Accessible, Diverse. Affordable and other housing markets in Johannesburg: September, 2012 DRAFT FOR REVIEW
 Affordable Land and Housing Data Centre Understanding the dynamics that shape the affordable land and housing market in South Africa. Filling the Gaps: Affordable and other housing markets in Johannesburg:
Shaping Our Future. Return-on-Investment Study. June 2017
 Shaping Our Future Return-on-Investment Study A June 2017 PURPOSE AND CONTEXT The 10-county Upstate Region is growing, and is projected to welcome more than 300,000 new residents by 2040 to reach a total
PURPOSE OF STUDY. physical and social environments, as well as our political and economic institutions. As a commodity,
 PURPOSE OF STUDY Housing is one of the most important elements in our lives and our communities. Providing shelter and links to neighborhoods and larger communities, housing plays an essential part in
ISSUES OF EFFICIENCY IN PUBLIC REAL ESTATE RESOURCES MANAGEMENT
 Alina Zrobek-Rozanska (MSC) Prof. Ryszard Zrobek University of Warmia and Mazury in Olsztyn, Poland rzrobek@uwm.edu.pl alina.zrobek@uwm.edu.pl ISSUES OF EFFICIENCY IN PUBLIC REAL ESTATE RESOURCES MANAGEMENT
RESIDENTIAL MARKET ANALYSIS
 RESIDENTIAL MARKET ANALYSIS RMLS Student Fellow Master of Real Estate Development Candidate Many of the single family housing trends in the second quarter of 2017 bounced upwards following a continuation
Viability and the Planning System: The Relationship between Economic Viability Testing, Land Values and Affordable Housing in London
 Viability and the Planning System: The Relationship between Economic Viability Testing, Land Values and Affordable Housing in London Executive Summary & Key Findings A changed planning environment in which
City of Puyallup. Parks Impact Fee Study
 City of Puyallup Parks Impact Fee Study August 23, 2005 Prepared by Financial Consulting Solutions Group, Inc. 8201 164 th Avenue NE, Suite 300 Redmond, WA 98052 tel: (425) 867-1802 fax: (425) 867-1937
86 years in the making Caspar G Haas 1922 Sales Prices as a Basis for Estimating Farmland Value
 2 Our Journey Begins 86 years in the making Caspar G Haas 1922 Sales Prices as a Basis for Estimating Farmland Value Starting at the beginning. Mass Appraisal and Single Property Appraisal Appraisal
Characteristics of Recent Home Buyers
 Characteristics of Recent Home Buyers Special Studies, February 1, 2019 By Carmel Ford Economics and Housing Policy National Association of Home Builders Introduction To analyze home buyers NAHB uses the
Agenda Re~oort PUBLIC HEARING: PROPOSED ADJUSTMENTS TO INCLUSIONARY IN-LIEU FEE RATES
 Agenda Re~oort August 27, 2018 TO: Honorable Mayor and City Council THROUGH: Finance Committee FROM: SUBJECT: William K. Huang, Director of Housing and Career Services PUBLIC HEARING: PROPOSED ADJUSTMENTS
Profile of International Home Buyers in Florida
 Profile of International Home Buyers in Florida Research Division National Association of REALTORS 2009 Prepared for the Florida Association of REALTORS 2009 National Association of REALTORS Profile of
TOD and Equity. TOD Working Group. James Carras Carras Community Investment, Inc. August 7, 2015
 TOD and Equity TOD Working Group James Carras Carras Community Investment, Inc. August 7, 2015 What is Equitable TOD? Equity is fair and just inclusion. Equitable TOD is the precept that investments in
CHAPTER 3. HOUSING AND ECONOMIC DEVELOPMENT
 CHAPTER 3. HOUSING AND ECONOMIC DEVELOPMENT This chapter analyzes the housing and economic development trends within the community. Analysis of state equalized value trends is useful in estimating investment
Hedonic Pricing Model Open Space and Residential Property Values
 Hedonic Pricing Model Open Space and Residential Property Values Open Space vs. Urban Sprawl Zhe Zhao As the American urban population decentralizes, economic growth has resulted in loss of open space.
METHODOLOGY GUIDE VALUING LANDS IN TRANSITION IN ONTARIO. Valuation Date: January 1, 2016
 METHODOLOGY GUIDE VALUING LANDS IN TRANSITION IN ONTARIO Valuation Date: January 1, 2016 August 2017 August 22, 2017 The Municipal Property Assessment Corporation (MPAC) is responsible for accurately assessing
HOUSING & RESIDENTIAL AREAS
 CHAPTER 10: HOUSING & RESIDENTIAL AREAS OVERVIEW With almost 90% of Ridgefield zoned for residential uses, the patterns and form of residential development can greatly affect Ridgefield s character. This
Re-sales Analyses - Lansink and MPAC
 Appendix G Re-sales Analyses - Lansink and MPAC Introduction Lansink Appraisal and Consulting released case studies on the impact of proximity to industrial wind turbines (IWTs) on sale prices for properties
Geographic Variations in Resale Housing Values Within a Metropolitan Area: An Example from Suburban Phoenix, Arizona
 INTRODUCTION Geographic Variations in Resale Housing Values Within a Metropolitan Area: An Example from Suburban Phoenix, Arizona Diane Whalley and William J. Lowell-Britt The average cost of single family
Status of HUD-Insured (or Held) Multifamily Rental Housing in Final Report. Executive Summary. Contract: HC-5964 Task Order #7
 Multifamily Rental Housing in Final Report. Executive Summary. Contract: HC-5964 Task Order #7") Status of HUD-Insured (or Held) Multifamily Rental Housing in 1995 Final Report Executive Summary Cambridge, MA Lexington, MA Hadley, MA Bethesda, MD Washington, DC Chicago, IL Cairo, Egypt Johannesburg,
Status of HUD-Insured (or Held) Multifamily Rental Housing in 1995 Final Report Executive Summary Cambridge, MA Lexington, MA Hadley, MA Bethesda, MD Washington, DC Chicago, IL Cairo, Egypt Johannesburg,
Extending the Right to Buy
 Memorandum for the House of Commons Committee of Public Accounts Department for Communities and Local Government Extending the Right to Buy MARCH 2016 4 Key facts Extending the Right to Buy Key facts 1.8m
Affordable Housing. Gentrification, with a white picket fence? Suburban neighborhood change in Montgomery County
 Affordable Housing Gentrification, with a white picket fence? Suburban neighborhood change in Montgomery County Nicholas Finio, M.C.P. PhD Candidate, Urban and Regional Planning UMD College Park National
New affordable housing production hits record low in 2014
 1 Falling Further Behind: Housing Production in the Twin Cities Region December 2015 Key findings Only a small percentage of added housing units were affordable to households with low and moderate incomes.
How Many Brownfields Does California Have? by Corynn Brodsky. Where are all the brownfields? This question is posed frequently by environmental
 How Many Brownfields Does California Have? by Corynn Brodsky Where are all the brownfields? This question is posed frequently by environmental regulators, city planners, and academics alike, as they attempt
HOUSING ELEMENT Inventory Analysis
 HOUSING ELEMENT Inventory Analysis 2.100 INVENTORY Age of Housing Stock Table 2.25 shows when Plantation's housing stock was constructed. The latest available data with this kind of breakdown is 2010.
Deerfield Township Multi-Unit Housing Analysis. Prepared For Deerfield Township
 Deerfield Township Multi-Unit Housing Analysis Prepared For Deerfield Township September 2015 Deerfield Township Multi-Unit Housing Analysis TABLE OF CONTENTS EXECUTIVE SUMMARY 1 PURPOSE 3 LITERATURE REVIEW
Detroit Neighborhood Housing Markets
 Detroit Neighborhood Housing Markets Market Study 2016 In 2016, Capital Impact s Detroit Program worked with local and national experts to determine the residential market demand across income levels for
Key Findings on the Affordability of Rental Housing from New York City s Housing and Vacancy Survey 2008
 Furman Center for real estate & urban policy New York University school of law n wagner school of public service 110 West 3rd Street, Suite 209, New York, NY 10012 n Tel: (212) 998-6713 n www.furmancenter.org
NATIONAL ASSOCIATION OF REALTORS. National Center for Real Estate Research
 NATIONAL ASSOCIATION OF REALTORS National Center for Real Estate Research COMMUNITY ACCEPTANCE OF AFFORDABLE HOUSING C. Theodore Koebel Robert E. Lang Karen A. Danielsen Center for Housing Research and
Census Tract Data Analysis
 Data Analysis Study Area: s within the City of Evansville, Indiana Prepared For Mr. Kelley Coures City of Evansville Department of Metropolitan Development 1 NW MLK Jr. Boulevard Evansville, Indiana 47708
A Guide to Developing an Inclusionary Housing Program
 Richard Drdla Associates affordable housing consultants inc A Guide to Developing an Inclusionary Housing Program Developed for: Acorn Institute Canada Sept 2010 Acknowledgment This guide was prepared
Promoting informed debate around infill housing in Australian cities
 Promoting informed debate around infill housing in Australian cities 1 SGS has long been interested in promoting infill housing in Australian cities. This support reflects the recognised net benefits infill
The Impact of Using. Market-Value to Replacement-Cost. Ratios on Housing Insurance in Toledo Neighborhoods
 The Impact of Using Market-Value to Replacement-Cost Ratios on Housing Insurance in Toledo Neighborhoods February 12, 1999 Urban Affairs Center The University of Toledo Toledo, OH 43606-3390 Prepared by
HOUSINGSPOTLIGHT. The Shrinking Supply of Affordable Housing
 HOUSINGSPOTLIGHT National Low Income Housing Coalition Volume 2, Issue 1 February 2012 The Shrinking Supply of Affordable Housing One way to measure the affordable housing problem in the U.S. is to compare
Housing as an Investment Greater Toronto Area
 Housing as an Investment Greater Toronto Area Completed by: Will Dunning Inc. For: Trinity Diversified North America Limited February 2009 Housing as an Investment Greater Toronto Area Overview We are
Exploring Shared Ownership Markets outside London and the South East
 Exploring Shared Ownership Markets outside London and the South East Executive Summary (January 2019) Shared ownership homes are found in all English regions but are geographically concentrated in London
MIDWAY CITY Municipal Code
 MIDWAY CITY Municipal Code TITLE 9 ANNEXATION CHAPTER 9.01 PURPOSE CHAPTER 9.02 GENERAL REQUIREMENTS CHAPTER 9.03 PROPERTY OWNER INITIATION OF ANNEXATION CHAPTER 9.04 PROCEDURES FOR CONSIDERATION OF PETITION
CHAPTER 4: MODERATE INCOME HOUSING ELEMENT
 The Utah Municipal Code, -9a-()(a)(iii) requires that all cities adopt a Plan for Moderate Income Housing as part of their General Plan. Section -9a-() of the Utah Municipal Code, outlines that this Plan
Appendix D HOUSING WORK GROUP REPORT JULY 10, 2002
 Appendix D HOUSING WORK GROUP REPORT JULY 10, 2002 Work Group Assignment At the 20/20 forum in April 2001, the community expressed a need for housing policies which will protect both the Town s social
The Honourable Peter Milczyn Minister of Housing/Minister Responsible for the Poverty Reduction Strategy College Park, 17th Floor
 February 2, 2018 Sent via e-mail: Bill.Mauro@ontario.ca Peter.Milczyn@ontario.ca The Honourable Bill Mauro Minister of Municipal Affairs College Park, 17th Floor 777 Bay Street Toronto, Ontario M5G 2E5
City of Lonsdale Section Table of Contents
 City of Lonsdale City of Lonsdale Section Table of Contents Page Introduction Demographic Data Overview Population Estimates and Trends Population Projections Population by Age Household Estimates and