Summary Appraisal Report
|
|
|
- Eunice McGee
- 6 years ago
- Views:
Transcription


1 SWC SR 776 (McCall Road) and Gulfstream Boulevard Port Charlotte, Charlotte County, Florida CBRE File No TA-0080 Client Reference No. KEYE Summary Appraisal Report Prepared for: Alan G. Kipnis Attorney at Law ARNSTEIN & LEHR, LLP 200 E. Las Olas Boulevard, Suite 1700 Ft. Lauderdale, Florida VALUATION & ADVISORY SERVICES
2 VALUATION & ADVISORY SERVICES 101 E. Kennedy Boulevard, Suite 3140 Tampa, FL, T (813) F (813) March 25, Alan G. Kipnis Attorney at Law ARNSTEIN & LEHR, LLP 200 E. Las Olas Boulevard, Suite 1700 Ft. Lauderdale, Florida RE: Appraisal of Crown Plaza Land SWC SR 776 (McCall Road) and Gulfstream Boulevard Port Charlotte, Charlotte County, Florida CBRE File No TA-0080 Client Reference No KEYE Dear Mr. Kipnis: At your request and authorization, CB Richard Ellis (CBRE) has prepared an appraisal of the market value of the referenced property. Our analysis is presented in the following Summary Appraisal Report. The subject consists of four improved parcels within the Crown Plaza Shopping Center Development developed in 2007/08, located at the southwest corner of McCall Road (SR 776) and Gulfstream Boulevard, Port Charlotte, Charlotte County, Florida. The subject's four parcels include a acre anchor/neighborhood retail center pad, a 1.09 acre corner outparcel (Lot 2), a 1.47 acre interior outparcel (Lot 4), a 1.12 acre interior outparcel (Lot 5), totaling acres. The acre anchor/neighborhood parcel includes a retention area servicing the western half of the Crown Plaza Shopping Center, including an outparcel not included as part of the subject. The center is anchored by an existing Home Depot and features two improved outparcels improved with a Burger King and Englewood Bank. In total, the center consists of acres. The subject is more fully described, legally and physically, within the enclosed report. Based on the analysis contained in the following report, the market value of the subject is concluded as follows: MARKET VALUE CONCLUSION Appraisal Premise Interest Appraised Date of Value Value Conclusions As Is - Main Parcel Fee Simple Estate March 3, 2010 $2,720,000 As Is - Outparcel Lot 2 Fee Simple Estate March 3, 2010 $540,000 As Is - Outparcel Lot 4 Fee Simple Estate March 3, 2010 $540,000 As Is - Outparcel Lot 5 Fee Simple Estate March 3, 2010 $410,000 Compiled by CBRE
3 Alan G. Kipnis March 25, 2010 Page 2 Data, information, and calculations leading to the value conclusion are incorporated in the report following this letter. The report, in its entirety, including all assumptions and limiting conditions, is an integral part of, and inseparable from, this letter. The following appraisal sets forth the most pertinent data gathered, the techniques employed, and the reasoning leading to the opinion of value. The analyses, opinions and conclusions were developed based on, and this report has been prepared in conformance with, our interpretation of the guidelines and recommendations set forth in the Uniform Standards of Professional Appraisal Practice (USPAP), the requirements of the Code of Professional Ethics and Standards of Professional Appraisal Practice of the Appraisal Institute, the Financial Institutions Reform, Recovery, and Enforcement Act of 1989 (FIRREA) and Title XI Regulations. The report is for the sole use of the client; however, client may provide only complete, final copies of the appraisal report in its entirety (but not component parts) to third parties who shall review such reports in connection with loan underwriting or securitization efforts. Appraiser is not required to explain or testify as to appraisal results other than to respond to the client for routine and customary questions. Please note that our consent to allow an appraisal report prepared by CBRE or portions of such report, to become part of or be referenced in any public offering, the granting of such consent will be at our sole discretion and, if given, will be on condition that we will be provided with an Indemnification Agreement and/or Non-Reliance letter, in a form and content satisfactory to us, by a party satisfactory to us. We do consent to your submission of the reports to rating agencies, loan participants or your auditors in its entirety (but not component parts) without the need to provide us with an Indemnification Agreement and/or Non-Reliance letter. CBRE hereby expressly granted to Client the right to copy this report and distribute it to other parties in the transaction for which this report has been prepared, including employees of Client, other lenders in the transaction, and the borrower, if any. It has been a pleasure to assist you in this assignment. If you have any questions concerning the analysis, or if CBRE can be of further service, please contact us. Respectfully submitted, CBRE - VALUATION & ADVISORY SERVICES Jerry P. Gisclair II, MAI John R. Fabian III, MAI Director Southeast/Florida Managing Director St. Cert. Gen. REA RZ2379 St. Cert. Gen. REA RZ 2855 Phone: Phone: (813) Fax: Fax: (813) jerry.gisclair@cbre.com john.fabian@cbre.com
4 CERTIFICATION OF THE APPRAISAL CERTIFICATION OF THE APPRAISAL We certify to the best of our knowledge and belief: 1. The statements of fact contained in this report are true and correct. 2. The reported analyses, opinions, and conclusions are limited only by the reported assumptions and limiting conditions and are our personal, impartial and unbiased professional analyses, opinions, and conclusions. 3. We have no present or prospective interest in or bias with respect to the property that is the subject of this report and have no personal interest in or bias with respect to the parties involved with this assignment. 4. Our engagement in this assignment was not contingent upon developing or reporting predetermined results. 5. Our compensation for completing this assignment is not contingent upon the development or reporting of a predetermined value or direction in value that favors the cause of the client, the amount of the value opinion, the attainment of a stipulated result, or the occurrence of a subsequent event directly related to the intended use of this appraisal. 6. This appraisal assignment was not based upon a requested minimum valuation, a specific valuation, or the approval of a loan. 7. Our analyses, opinions, and conclusions were developed, and this report has been prepared, in conformity with the Uniform Standards of Professional Appraisal Practice, as well as the requirements of the State of Florida. 8. The reported analyses, opinions, and conclusions were developed, and this report has been prepared, in conformity with the requirements of the Code of Professional Ethics and the Standards of Professional Appraisal Practice of the Appraisal Institute, which include the Uniform Standards of Professional Appraisal Practice. 9. The use of this report is subject to the requirements of the Appraisal Institute relating to review by its duly authorized representatives. 10. As of the date of this report, Jerry Gisclair, MAI and John Fabian, MAI have completed the continuing education program of the Appraisal Institute. 11. Jerry Gisclair, MAI has and John Fabian, MAI has not made a personal inspection of the property that is the subject of this report. 12. No one provided significant real property appraisal assistance to the persons signing this report. 13. Valuation & Advisory Services operates as an independent economic entity within CBRE. Although employees of other CBRE divisions may be contacted as a part of our routine market research investigations, absolute client confidentiality and privacy are maintained at all times with regard to this assignment without conflict of interest. 14. Jerry P. Gisclair II, MAI and John R. Fabian III, MAI have previously provided real estate valuation services on this property in the three years prior to accepting this assignment and have disclosed our prior engagement to the client. Jerry P. Gisclair II, MAI John R. Fabian III, MAI St. Cert. Gen. REA RZ2379 St. Cert. Gen. REA RZ 2855 i

5 SUBJECT PHOTOGRAPHS SUBJECT PHOTOGRAPHS AERIAL VIEW ii

6 SUBJECT PHOTOGRAPHS TYPICAL VIEW OF THE SUBJECT S MAIN PARCEL TYPICAL VIEW OF NEIGHBORING HOME DEPOT iii

7 SUBJECT PHOTOGRAPHS VIEW OF SUBJECT INFRASTRUCTURE VIEW OF SUBJECT INFRASTRUCTURE iv
8 SUBJECT PHOTOGRAPHS VIEW OF SUBJECT OUTPARCEL LOTS 4 & 5 VIEW OF SUBJECT OUTPARCEL LOT 2 v
 STREET")
9 SUBJECT PHOTOGRAPHS VIEW OF SUBJECT S RETENTION AREA WESTERLY VIEW OF SUBJECT S MCCALL ROAD (SR 776) STREET FRONTAGE vi
10 SUBJECT PHOTOGRAPHS VIEW OF SUBJECT S GULFSTREAM BOULEVARD FRONTAGE WESTERLY VIEW OF NEIGHBORING ENGLEWOOD BANK OUTPARCEL vii
11 SUMMARY OF SALIENT FACTS SUMMARY OF SALIENT FACTS Property Name Location Address Crown Plaza Land SWC SR 776 (McCall Road) and Gulfstream Boulevard, Port Charlotte, Charlotte County, Florida Address Assessor s Parcel Number 6572 Kevitt Blvd McCall Road McCall Road McCall Road Highest and Best Use As Vacant Property Rights Appraised Date of Inspection Land Area (Main Parcel) 6572 Kevitt Blvd Land Fee Simple Estate March 3, AC 474,002 SF Land Area (Outparcels) 3.68 AC 160,101 SF Lot 2 West McCall Road 1.09 AC 47,522 SF Lot 4 West McCall Road 1.47 AC 63,917 SF Lot 5 West McCall Road 1.12 AC 48,674 SF Improvements Property Type Land (Retail/Commercial) Year Developed 2007 Condition Major Tenants Home Depot (Shadow anchor) Estimated Exposure Time Financial Indicators Discount Rate Good 122,000 SF 12 Months 12.50% CONCLUDED MARKET VALUE Appraisal Premise Interest Appraised Date of Value Value As Is - Main Parcel Fee Simple Estate March 3, 2010 $2,720,000 As Is - Outparcel Lot 2 Fee Simple Estate March 3, 2010 $540,000 As Is - Outparcel Lot 4 Fee Simple Estate March 3, 2010 $540,000 As Is - Outparcel Lot 5 Fee Simple Estate March 3, 2010 $410,000 Compiled by CBRE viii
12 SUMMARY OF SALIENT FACTS EXTRAORDINARY ASSUMPTIONS & HYPOTHETICAL CONDITIONS We were provided site surveys, but not a current legal description or Title report. We assume the surveys provided accurately reflect the subject s and no constraints on Title exist to limit its marketability. ix
13 TABLE OF CONTENTS TABLE OF CONTENTS CERTIFICATION OF THE APPRAISAL...i SUBJECT PHOTOGRAPHS...ii SUMMARY OF SALIENT FACTS... viii TABLE OF CONTENTS... x INTRODUCTION... 1 AREA ANALYSIS... 4 NEIGHBORHOOD ANALYSIS MARKET ANALYSIS SITE ANALYSIS HIGHEST AND BEST USE APPRAISAL METHODOLOGY LAND VALUE (MAIN PARCEL) OUTPARCEL LAND VALUES RECONCILIATION OF VALUE ASSUMPTIONS AND LIMITING CONDITIONS ADDENDA A Glossary of Terms B Land Sale Data Sheets Commercial Parcel Sales C Land Sale Data Sheets Commercial Parcel Listings D Land Sale Data Sheets OutParcel Sales E Land Sale Data Sheets OutParcel Listings F Subject Surveys G Précis METRO Report - Economy.com, Inc. H Client Engagement Letter I Qualifications x
14 INTRODUCTION INTRODUCTION Property Identification: Location: Crown Plaza Land SWC SR 776 (McCall Road) and Gulfstream Boulevard, Port Charlotte, Florida Assessor s Parcel Number: 6572 Kevitt Blvd McCall Road McCall Road McCall Road Property History: Current Owner: Current Asking Price: Crown Gateway LLC see per parcel listing below 6572 Kevitt Blvd $8,722, McCall Road 1.09 $750, McCall Road 1.47 $800,000 Previous Parcel Sales/Contracts: McCall Road (Home Depot) $4,000,000 May McCall Road (Burger King) 0.79 $740,000 Oct McCall Road (Dollar General Contract) 1.15 $400,000 Contract McCall Road (5th/3rd) 1.26 $1,500,000 Aug-07 Other Sales - Past 3 Years: Property Rights Appraised: Date of Value: Date of Inspection: Date of Report: None Fee Simple Estate March 3, 2010 March 3, 2010 March 25, 2010 Intended Use & User of Report: To aid Arnstein & Lehr, LLP in Asset Monitoring and Finance Decisions Special Appraisal Instructions: Exposure Time Information: None noted Range Average Comparable Sales Data: 3-15 Months 12.0 Months Korpacz Strip Shopping Center 2-18 Months 9.6 Months Local Market Professionals: 6-18 Months 12.0 Months Estimated Exposure Time: Estimated Marketing Time: 12 Months 12 Months The subject parcels have been marketed since development. The parcel sales and contracts that have occurred are presented above. As well, we identified listings of the remaining subject parcels on LoopNet with the list prices presented above. These parcels have been listed at these asking prices for an extended period. Our conclusion reflects a significantly lower value indication relative to the list prices attributable to the main parcel appearing to be substantially overstated. While the outparcel list prices are more consistent with our concluded pricing, our analysis accounts for anticipated holding period and related cost. The Dollar General Parcel (Lot 5) was recently under contract for $400,000; however, Dollar General has been slow to proceed and at this point the contract is on indefinite hold. Our concluded value was geenrally consistent with the prior contract price after consideration of the 1
15 INTRODUCTION discounts we would expect to procure a sell within a typical marketing time and exposure period. It is our opinion the buyer (a partnership including an active mortgage broker) recognizes the seller s present financial distress, and under market conditions where the seller was not under duress, we would expect to see a slightly higher contract price, as reflected in our value conclusion. PURPOSE OF THE APPRAISAL The purpose of this appraisal is to estimate the market value of the subject property. The current economic definition of market value agreed upon by agencies that regulate federal financial institutions in the U.S. (and used herein) is as follows: The most probable price which a property should bring in a competitive and open market under all conditions requisite to a fair sale, the buyer and seller each acting prudently and knowledgeably, and assuming the price is not affected by undue stimulus. Implicit in this definition is the consummation of a sale as of a specified date and the passing of title from seller to buyer under conditions whereby: 1. buyer and seller are typically motivated; 2. both parties are well informed or well advised, and acting in what they consider their own best interests; 3. a reasonable time is allowed for exposure in the open market; 4. payment is made in terms of cash in U.S. dollars or in terms of financial arrangements comparable thereto; and 5. the price represents the normal consideration for the property sold unaffected by special or creative financing or sales concessions granted by anyone associated with the sale. 1 TERMS AND DEFINITIONS The Glossary of Terms in the addenda provides definitions for additional terms that are, and may be used in this appraisal. SCOPE OF WORK The scope of the assignment relates to the extent and manner in which research is conducted, data is gathered and analysis is applied, all based upon the following problem-identifying factors stated elsewhere in this report: Client Intended use Intended user Type of opinion Effective date of opinion 1 Office of Comptroller of the Currency (OCC), 12 CFR Part 34, Subpart C Appraisals, (g); Office of Thrift Supervision (OTS), 12 CFR (g); Appraisal Institute, The Dictionary of Real Estate Appraisal, 4 th ed. (Chicago: Appraisal Institute, 2002), This is also compatible with the RTC, FDIC, FRS and NCUA definitions of market value as well as the example referenced in the Uniform Standards of Professional Appraisal Practice (USPAP). 2
16 INTRODUCTION Relevant characteristics about the subject Assignment conditions This appraisal of the subject has been presented in the form of a Summary Report, which is intended to comply with the reporting requirements set forth under Standards Rule 2-2(b) of the USPAP. That is, this report incorporates a summary of all information significant to the solution of the appraisal problem. It also includes summary descriptions of the subject and the market for the subject type. Extent to Which the Property is Identified CBRE collected the relevant information about the subject from the owner (or representatives), public records and through an inspection of the subject. The property was legally identified through its postal address, assessor s records, and provided surveys. Although requested, a legal description and title report was not provided. Economic characteristics of the subject were identified via an analysis of comparable sales, listing, and contracts in the market area. Extent to Which the Property is Inspected CBRE inspected the subject, as well as its surrounding environs on the effective date of appraisal. Type and Extent of the Data Researched CBRE reviewed the micro and/or macro market environments with respect to physical and economic factors relevant to the valuation process. This process included interviews with regional and/or local market participants, including George Trujillo, Richard Kingan, Scott Robertson, Terry Salzman, Tom Strauss, Duke Sullivan, Sage Andress, Ron Strothers, David Greenberg, Jerry Filipowski, Allen Greer, Steve Gant, John McQueen, Ron McGuire, Bruce Prebble, Felicia Hamilton, Michael Mogerman, Dave Conn, and others, along with available published data, and other various resources. CBRE also conducted regional and/or local research with respect to applicable tax data, zoning requirements, flood zone status, demographics and comparable listing, sale and contract information. Type and Extent of Analysis Applied CBRE analyzed the data gathered through the use of appropriate and accepted appraisal methodology to arrive at a probable value indication via each applicable approach to value. Approaches to value used included the Sales Comparison Approach. The steps required to complete each approach are discussed in the methodology section. CBRE then correlated and reconciled the results into a reasonable and defensible value conclusion, as defined herein. A reasonable exposure time and marketing time associated with the value estimate presented has also been concluded. SPECIAL APPRAISAL INSTRUCTIONS There have been no special appraisal instructions for this assignment. 3


17 AREA ANALYSIS AREA ANALYSIS 4
18 AREA ANALYSIS ECONOMY.COM Moody s Economy.com provides the following Punta Gorda, FL metro area economic summary as of November The full Moody s Economy.com report is presented in the Addenda. PUNTA GORDA, FL - ECONOMIC ANALYSIS Indicators Gross Metro Product (C$B) % Change Total Employment (000) % Change Unemployment Rate Personal Income Growth Population (000) Single-Family Permits 1, , , , , , ,514.3 Multifamily Permits , , , Existing-Home Price ($Ths) Mortgage Originations ($Mil) 1, , , , , , , , Net Migration (000) Personal Bankruptcies , , , ,163.7 Source: Moody's Economy.com RECENT PERFORMANCE The severity of Punta Gorda's recession is moderating. The housing market is improving, and the contraction in consumer-related industries is slowing. House price and construction employment declines are moderating, and homebuilding has steadied. Leisure/hospitality and retail services have also improved, even though the consumer base has been battered by the recession. The improvement in some of the hardest-hit industries has not been sufficient to keep the unemployment rate from soaring to 12.6% in October, 1.4 percentage points higher than the state average. Moreover, the unemployment rate understates labor market slack, since discouraged workers are suspending their job search until conditions improve. HOUSING Punta Gorda's housing market will improve in the coming quarters, as the severe housing market downturn is coming to an end. The large bubble and ensuing correction have pummeled the metro area's economy. However, falling inventory is allowing house price declines to slow and building to stabilize. Nonetheless, the damage is done: House prices have fallen 56% peak to current while only falling 30% nationally. Though expected to improve in the near term, the housing market will remain a drag on consumer industries, as household wealth and consumer spending have been battered by substantial house price declines and rising mortgage delinquencies. Longer term, housing demand will be strong as retiree migration drives above-average population growth. 5
19 AREA ANALYSIS REGIONAL HOUSING MARKET New housing construction had increased more rapidly than population growth through 2007, reflecting the second home nature of the area, whereby many home owners do not establish permanent residency in the State. More recently this trend has changed, although it is anticipated Florida will remain a sought after second home market and will experienced a rebound in new home construction as economic conditions improve in the coming 3-5 years. However, residential demand does not track well with in-migration and population growth, as a significant component of demand derived of non-residents The US Housing Trends are indicating a large improvement compared to 2008 in housing sales volume. The volume for 2009 is ahead of 2008 in total and particularly units. This is significant considering the price decline in housing over that past year, with home prices off in excess of 20-30%, meaning it takes times as many transactions to result in the same total volume of sales that occurred in Given that volume is exceeding 2008, this indicates transaction volume has increased to the magnitude of 20-30% over 2008 levels and appears that supply is being reduced to levels, which at the end of 2009 may indicate a more significant recovery in the housing market than the general public is presently recognizing. US EXISTING HOMES SALES VOLUME Year U.S. South U.S. South Inventory Mos. Supply ,478,000 2,563,000 * * 3,450, ,652,000 2,235,000 * * 3,974, ,913,000 1,865,000 * * 3,700, p 5,156,000 1,913,000 * * 3,289, Seasonally Adjusted Annual Rate Not Seasonally Adjusted 2008 Dec 4,740,000 1,740, , ,000 3,700, Jan 4,490,000 1,640, ,000 96,000 3,611, Feb 4,710,000 1,740, , ,000 3,798, Mar 4,550,000 1,710, , ,000 3,648, Apr 4,660,000 1,740, , ,000 3,937, May 4,720,000 1,740, , ,000 3,851, Jun 4,890,000 1,820, , ,000 3,811, Jul 5,240,000 1,950, , ,000 4,062, Aug 5,090,000 1,890, , ,000 3,924, Sept 5,540,000 2,040, , ,000 3,710, Oct 6,090,000 2,280, , ,000 3,565, Nov r 6,540,000 2,400, , ,000 3,521, Dec p 5,450,000 2,010, , ,000 3,289, vs. last month: -16.7% -16.3% -12.1% -9.1% -6.6% 10.8% vs. last year: 15.0% 15.5% 14.7% 15.1% -11.1% -23.4% Source: 2009 National Association of REALTORS 6
20 AREA ANALYSIS Florida General Market Trends Presented below is the Existing Home Sales Volume, followed by Florida Metro Area Existing Home Sales Prices. US & FLORIDA EXISTING HOME SALES VOLUME State III 2008.IV 2009.I 2009.II r 2009.III p Qtr. Yr (Seasonally Adjusted Annual Rate, 000s % Change % Change % Change United States 6,478 5,652 4,913 5,007 4,740 4,583 4,757 5, % 5.9% -15.0% Northeast 1,086 1, % 6.9% -18.5% Midwest 1,483 1,327 1,129 1,143 1,060 1,030 1,063 1, % 5.2% -17.5% South 2,563 2,235 1,865 1,857 1,740 1,697 1,767 1, % 5.9% -19.8% West 1,346 1,084 1,070 1,140 1,170 1,160 1,130 1, % 4.6% -1.3% FLORIDA % 36.8% -9.1% Not Available r Revised p Preliminary Note: States' columns will not add up to national/regional totals due to independent samples. Source: 2009 National Association of REALTORS For Florida, Existing Home Sales Volume decreased by 9.1% from 2007 to 2008; however, Sales Volume increased from 2Q09 to 3Q09 by 7.9% and from 3Q08 to 3Q09 by 36.8%, reflecting that the market has stabilizing and is improving over the low point of 2Q08-3Q08. Sales volume has surpassed 2007/08 metrics, but is below the 3-4 years prior peak housing market years. This double digit quarterly improvement trend is a similar pattern around the Country with exception to the West region, which is dominated by California, Nevada, and Arizona, but is also realizing more significant improvement over their low point in 2007/08. FLORIDA METRO AREA EXISTING SF HOME SALES PRICES Metropolitan Area III 2008.IV 2009.I 2009.II r 2009.III p %Chya %Change %Change (Not Seasonally Adjusted, 000s) 3Q09-2Q U.S % 2.1% -9.8% NE % -0.5% -5.8% MW % 2.6% -6.8% SO % 0.9% -5.3% WE % 4.6% -19.4% Cape Coral-Fort Myers, FL % 16.7% -39.5% Deltona-Daytona Beach-Ormond Beach, FL % -0.4% -14.7% Gainesville, FL % -3.6% -10.7% Jacksonville, FL % -4.6% -7.7% Miami-Fort Lauderdale-Miami Beach, FL % 4.6% -22.0% Ocala, FL % -6.8% -16.5% Orlando, FL % 5.8% -20.1% Palm Bay-Melbourne-Titusville, FL % 5.2% -21.2% Pensacola-Ferry Pass-Brent, FL % 2.6% -6.0% Sarasota-Bradenton-Venice, FL % 5.3% -22.6% Tallahassee, FL % -2.6% 0.2% Tampa-St.Petersburg-Clearwater, FL % -2.5% -19.5% *All areas are metropolitan statistical areas (MSA) as defined by the US Office of Management and Budget as of They include the named central city and surrounding areas. Not Available p Preliminary r Revised Source: 2009 National Association of REALTORS For the South, Existing Home Sales Prices decreased by 5.3% from 2007 to 2008, the lowest percentage in the country; while the Cape Coral-Ft. Myers and Sarasota-Bradenton-Venice Areas experienced a decrease of 39.5% and 22.6% year over year respectively, along with a 3Q09 to 7
21 AREA ANALYSIS 3Q08 decrease of 40.0% and 22.0%. However, between 2Q09 to 3Q09 the Cape Coral-Ft. Myers and Sarasota-Bradenton-Venice Areas experienced an increase of 16.7% and 5.3% respectively, indicating that these area s Existing Home Prices are past the stabilizing stage of this current home market cycle. It remains to be seen whether this is a short or long-term trend; however, the 3Q09 data indicates a predominant improvement trend amongst many Florida Metro areas compared to prior years of contraction extending back to late FLORIDA METRO AREA CONDO SALES PRICES Metropolitan Area III 2008.IV 2009.I 2009.II 2009.III %Chya %Change %Change Apartment Condo-Coops (Not Seasonally Adjusted, 000s) 3Q09-2Q U.S % 0.8% -7.3% NE % 0.5% -1.4% MW % -0.4% -3.6% SO % 1.5% -9.9% WE % 1.7% -17.0% Cape Coral-Fort Myers, FL % 0.8% -20.7% Jacksonville, FL % -16.5% -13.6% Miami-Fort Lauderdale-Miami Beach, FL % -3.1% -39.8% Palm Bay-Melbourne-Titusville, FL % -17.0% -21.0% Sarasota-Bradenton-Venice, FL % 5.6% -16.0% Tampa-St. Petersburg-Clearwater, FL % -3.6% -16.5% *All areas are metropolitan statistical areas (MSA) as defined by the US Office of Management and Budget as of They include the named central city and surrounding areas. Not Available p Preliminary r Revised Source: 2009 National Association of REALTORS For the South, Existing Condominium Sales Prices decreased by 9.9% from 2007 to 2008; while the Cape Coral-Ft. Myers and Sarasota-Bradenton-Venice Areas experienced a decrease of 20.7% and 16.0% between 2007 and 2008 respectively, along with a 3Q09 to 3Q08 decrease of 36.0% and 43.1%.However, from the 2Q09 to the 3Q09 the Cape Coral-Ft. Myers and Sarasota-Bradenton- Venice Areas experienced an increase of 0.8% and 5.6% respectively, indicating a modest recovery trend to the areas Existing Condominium Prices. The subject land is located in north Charlotte County, which is adjacent to south Sarasota County, and is influenced more by growth of new housing in the south Sarasota area than new housing in the north Charlotte area. Therefore, included below are residential housing trends for the Sarasota County Area. While these trends show that the overall sales volume for single family houses was up in 2009 compared to 2008, this increase in sales volume is not large enough to spurn economic growth for the area, which relies on new housing sales and housing construction for economic sustainability. Single family sales prices continued to decline in the first half of 2009, but have since leveled off. Also, listings and inventory are down compared to 2008, which shows that sellers have taken a large number of for-sale single-family houses off the market. Condominium sales volumes are also up compared to 2008 levels, but not by a large enough amount to cause new condo construction in the area. Condo listings and inventory have also decreased, showing the trend of owners taking their condo properties off the market. 8
22 AREA ANALYSIS RESIDENTIAL MARKET STATISTICS - SARASOTA COUNTY Total Single Family & Condo Single Family Condominium No. of No. of Pending No. of Inventory Median Sale Sale Vs. List No. of No. of Pending No. of Inventory Sale Vs. List Avg No. of No. of Pending No. of Sale Vs. Inventory Median Sale List Price %- Avg Date Listings Sales Sales (Mos) $ Price %-age Listings Sales Sales (Mos) Median Sale $ Price %-age DOM Listings Sales Sales (Mos) $ age DOM ,998 $327, % 4,140 $341, % 126 1,858 $295, % ,557 $311, % 3,677 $301, % 150 1,880 $330, % 195 Jan-08 14, $277, % 8, $265, % 158 5, $303, % 182 Feb-08 14, $268, % 8, $285, % 160 5, $230, % 219 Mar-08 14, $256, % 8, $266, % 152 5, $235, % 181 Apr-08 15, $282, % 9, $285, % 166 5, $277, % 189 May-08 14, $305, % 9, $274, % 164 5, $367, % 214 Jun-08 13, $256, % 9, $250, % 159 4, $275, % 178 Jul-08 13, $257, % 8, $250, % 158 4, $275, % 236 Aug-08 8, $240, % 6, $226, % 179 2, $295, % 221 Sep-08 9, $199, % 6, $201, % 160 2, $190, % 198 Oct-08 8, $202, % 6, $172, % 164 2, $349, % 215 Nov-08 9, $174, % 6, $170, % 149 2, $195, % 193 Dec-08 8, $190, % 6, $175, % 159 2, $255, % ,834 7,231 5, $247, % 95,173 5,556 4, $236, % ,661 1,675 1, $277, % 200 Jan-09 8, $165, % 6, $149, % 152 2, $220, % 177 Feb-09 8, $156, % 6, $142, % 166 2, $198, % 154 Mar-09 8, $156, % 6, $152, % 160 2, $166, % 186 Apr-09 8, $166, % 5, $160, % 173 2, $182, % 206 May-09 7, $161, % 5, $155, % 195 2, $181, % 203 Jun-09 7, $205, % 4, $190, % 162 2, $250, % 224 Jul-09 6, $191, % 4, $185, % 208 2, $212, % 225 Aug-09 6, $184, % 3, $155, % 179 2, $285, % 230 Sep-09 6, $164, % 3, $165, % 174 2, $162, % 208 Oct-09 6, $169, % 3, $151, % 186 2, $220, % 250 Nov-09 6, $167, % 3, $162, % 179 2, $178, % 236 Dec-09 6, $178, % 3, $170, % 194 2, $199, % ,363 9,696 6, $173, % 57,594 7,326 4, $163, % ,769 2,370 1, $203, % Year Change -40% 34% 15% -36% -30% 0.8% -39% 32% 15% -44% -31% 0.9% 10% -40.1% 41.5% 14.5% -44.9% -26.7% 0.4% 4.1% 2-Year Change 12% -44% 0.3% 25% -46% 1.2% 19% -13% -39% -2% 7% Date of Survey Mar-10 Source: Sarasota Association of REALTORS 9
23 AREA ANALYSIS In Sarasota County, the single family housing sales volume increased 13% between 2008 and 2009; which is a strong increase year over year, but is not large enough to start new housing construction in the area and jump-start economic growth. Listings and inventory have decreased 65% and 45% respectively, showing the large number of owners taking their single-family homes off the market. Average single family house prices have decreased 45% from 2008 and 109% from 2007; however, most of the declines were in the first half of 2009 and have since stabilized. In Sarasota County, the condo sales volume increased 29% between 2008 and 2009; which is also a strong increase year over year, but is not large enough to start new housing construction in the area and jump-start economic growth. Listings and inventory have decreased 67% and 81% respectively, showing the large number of owners taking their condos off the market. Average condo prices have decreased 37% from 2008 and 46% from 2007; however, most of the declines were in the first half of 2009 and have since stabilized. Interestingly, we ve analyzed the major West Markets and identified a similar pattern in Median Home Prices, and in many cases even more dramatic price contraction. However, this is consistent with the view that Florida and California/Arizona led the way into this housing market decline and are expected to lead the way out. It appears that volume has stabilized, and is improving, as pricing has adjusted to current buying power and affordability index. In general, the single family market appears to be responding more favorably. This is likely due in part to more extended litigation time frames for failed condominium projects combined with agency lending constraints on many condominium projects that have owner occupant levels below 50%, which was changed to 70% in early More recently, Fannie Mae has produced a list of approved condominium projects within Florida that they can lend on. We expect the condominium market to lag the single family market in recovery until end unit lending becomes more readily available. RETIREES PUG's warm climate and relative affordability compared with neighboring metro areas will continue to entice retirees with tight budgets. The financial market fallout has had major consequences for the metro area's older consumer base, but the turnaround in financial markets will allow consumers with a large portion of their income tied to retiree accounts to breathe a sigh of relief. Retirees are already very important to PUG's economy; they make up nearly twice the share of the population as they do nationally. The share of retirees will grow as the large baby boomer generation reaches retirement age. Healthcare will be one of the main beneficiaries of this migration trend. Its expansion will shield the metro area somewhat from business cycle volatility. 10
24 AREA ANALYSIS INDUSTRIAL DIVERSITY Despite its high exposure to the retiree population and healthcare, PUG's economy is surprisingly diverse compared with metro areas of similar size. Moreover, the metro area's industrial diversity index has been rising steadily for nearly 30 years. Though this trend is likely over, the significant increase in the metro area's industrial diversity is thanks to a shift from public sector employment to consumer and healthcare industries. A diverse industry structure will aid the metro area, as the weight of recovery will not rest on any particular industry. In addition, businesses and residents that are seeking a diverse set of opportunities and a stable economic base will be attracted to the area. ECONOMY.COM CONCLUSION Punta Gorda's economy will contract into next year. Conditions will improve as the housing market rebounds and impediments to consumer spending slowly abate. Risks remain weighted to the downside, however, as numerous obstacles potentially stand in the way of healthier consumers, including a more protracted labor market contraction, more severe house price declines, and financial market weakness. Longer term, the metro area will benefit from the influx of retirees that are drawn to the metro area's attractive quality of life. However, the in-migration of retirees will also keep the economy highly dependent on consumer services. CONCLUSION Specific to the subject, we do not expect demand for new retail to experience a lift until some period of residential growth has allowed existing supply to be absorbed and retail users to substantiate new investment. As such, we anticipate new demand will lag the housing recovery by a 12 to 18 month time frame. 11


25 NEIGHBORHOOD ANALYSIS NEIGHBORHOOD ANALYSIS 12

26 NEIGHBORHOOD ANALYSIS LOCATION The subject is in the city of Port Charlotte and is considered a suburban location. The city of Port Charlotte is situated in southwest Charlotte County, about 10 miles west of central Port Charlotte and Punta Gorda, which has been in the process of a renewal and town center redevelopment period. As well, the subject is approximately 35 miles south of the Sarasota Central Business District BOUNDARIES The neighborhood boundaries are detailed as follows: 13
27 NEIGHBORHOOD ANALYSIS North: South: East: West: LAND USE Myakka River Rotunda Charlotte Harbor Lemon Bay/Englewood Land uses within the subject neighborhood consist primarily of residential improvements dating to the original platted development of the Rotunda/Port Charlotte, dating back to the 1960 s. Presently, the area consist of primarily single family homes built throughout the area, but the lots are approximately 40-50% improved, with numerous vacant lots available for future construction. The area experienced a period of growth most recently with the housing growth period, and is presently exhibiting signs of near-term housing growth, with prices and sales volume beginning to show positive numbers compared to previous quarters. More dense development is situated to the west in the town of Englewood, a fishing village community bordered to the west by barrier islands and to the south by Gasparilla Island and Boca Grande/Charlotte Harbor. The Gulf Cove neighborhoods located near the McCall Road/SR 771 interchange are more established and feature a higher level of build out. The Rotunda Community is known for its four golf courses, including the Long Marsh, The Palms, The Hills, and The Links. Directly to the west of the subject is a driving range and lighted golf course known as Duffy s Golf Center. The two most prominent retail developments in the area include a Publix anchored retail center approximately one mile east and a Wal-Mart anchored center approximately five miles west. The Publix anchored center is located at the interchange of McCall Road (SR 776) and SR 771, which extends to Boca Grande. This center s in-line space was approximately 80 percent occupied on our inspection. The Wal-Mart Center is situated at the entry to the Oyster Creek Golf Community. In general, smaller free standing retail and service space along the McCall Road and SR 771 corridor exhibited high levels of vacancy, with some centers exhibiting 100% vacancy, particularly those situated along SR 771. The majority of the single-family residential development within a three mile radius of the subject may be described as tract homes in the $100,000 to $300,000 price range. According to information obtained from Claritas, over 86% of the homes built within a three-mile radius of the subject were constructed since 1980, with over 30% constructed since The average home value within a three-mile radius is about $155,483. GROWTH PATTERNS Growth patterns have generally been along the primary corridors proximate to the primary interchanges. However, the majority of new growth has been more proximate to Port Charlotte s core 14
28 NEIGHBORHOOD ANALYSIS near Murdock Circle, and extending north toward Interstate 75 and east along US 41. Murdock Circle features the area s largest Hospital System, the Charlotte Town Center Mall, various community and neighborhood retail centers, office improvements, and various supporting improvements. To the east along Tamiami Trail/US 41, redevelopment is underway with projects such as the frontage road redevelopment along the south side of Tamiami Trail, and then extending into Punta Gorda, where revitalization of the downtown has resulted in a town center renewal. The majority of new growth immediate proximate to the subject is residential based and for the time being is minimal. This is anticipated to improve along with improvements in the housing market, which should stimulate secondary forms of demand and growth such as retail and service oriented space demand. The subject neighborhood is best characterized as a coastal village/retirement based community. ACCESS Primary access to the subject area is provided by Interstate Highway 75, a six-lane north-south corridor extending from Miami Northward through Atlanta and up the Central Atlantic region. Extending from Interstate 75 are numerous southerly and westerly routes, including River Road, Toledo Blade Road, Veterans Boulevard, and King s Highway, that extend to Tamiami Trail (US Hwy 41) and throughout the Port Charlotte market. Specific to the subject s immediate area, McCall Road/El Jobean Road (SR 776), extends south from Tamiami Trail/Murdock Circle in a southwesterly direction, providing access to Englewood, before redirecting north and turning into Englewood Road before reconnecting with Tamiami Trail in Venice. This is a four-lane, median divided corridor that directly accesses the subject. Additionally roads servicing the area include SR 771 extending from McCall Road to the east in a southward direction to Boca Grande, as well as Placido Road to the west also extending southward from McCall Road to Boca Grande. The nearest regional Airport is the Southwest Florida International Airport located in Ft. Myers, approximately 40 miles southeast of the subject neighborhood, providing access to most major airline hubs. DEMOGRAPHICS Selected neighborhood demographics in a one-, three-, and five-mile radius from the subject are shown in the following table: 15
29 NEIGHBORHOOD ANALYSIS SELECTED NEIGHBORHOOD DEMOGRAPHICS Mccall Boulevard Port Charlotte, FL Population 2014 Population 1,408 16,198 32, Population 1,331 14,435 28, Population 1,211 11,443 23, Population 1,058 7,156 15,263 Annual Growth % 2.33% 2.21% Annual Growth % 2.61% 2.45% Annual Growth % 4.81% 4.30% Households 2014 Households 595 7,194 15, Households 564 6,359 13, Households 511 4,907 10, Households 436 2,945 6,666 Annual Growth % 2.50% 2.37% Annual Growth % 2.92% 2.71% Annual Growth % 5.24% 4.68% Income 2009 Median HH Inc $42,108 $48,948 $48, Estimated Average Household Income $50,247 $58,361 $59, Estimated Per Capita Income $21,962 $25,675 $27,809 Age 25+ College Graduates ,091 2,799 Age 25+ Percent College Graduates % 10.2% 12.4% Source: CBRE CONCLUSION As indicated above, the three (3) mile population is relatively low at 15,432, while average income is at or slightly above average. Population growth has been consistent with statewide levels, and in general this area remains somewhat sparsely developed. Looking forward, growth is anticipated to slow compared to prior years, limiting demand for new retail construction. However, the subject s corridor is one of the primary access routes extending to Englewood and south to Boca Grande. As such, its population capture is higher than comparable locations where retail development is more commensurate with density. While we anticipate retail growth will not improve significantly until residential growth and demand has improved, we anticipate demand to improve in the coming 2-3 year time frame, lagging the anticipated housing recovery. The subject s demand will be substantially influenced by housing demand growth, as its low density location will likely delay market entry by key national retailers that would be target tenants to expand into the subject, particularly the anchor space pad. As well, an alternative use of this site for in-line retail development will be encumbered by a challenging debt market until demand can fully support feasible development. 16
30 MARKET ANALYSIS MARKET ANALYSIS The market analysis forms a basis for assessing market area boundaries, supply and demand factors, and indications of financial feasibility. Primary data sources utilized for this analysis includes the Fourth Quarter 2009 MetroTrend Futures Report, published by Reis, Inc.; the Fourth Quarter 2009 CoStar Office Report, published by CoStar Group; CBRE s in-house Database and MIX Program; and various national studies such as the Korpacz Real Estate Investor Survey, published by PriceWaterhouseCooper; RealtyRates.com, published by Robert G. Watts; and Retail Capital Trends Monthly, published by Real Capital Analytics. The subject is in the Charlotte County market and is considered to be Class A/B in investment characteristics, while it is viewed as being in a tertiary location resulting in a higher discount for its exposure to contractions in demand and low barrier of entry for new supply. The existing property is shadow anchored by Home Depot; however, there is limited demand for added in-line space presently, as existing neighborhood centers with strong anchor draws are exhibiting high levels of tenant turnover and higher vacancy levels than experienced in prior years. The most likely user for the subject s main parcel would be a consumer goods provider or grocer; although it is likely there are numerous preferred locations in areas of more dense development and near-term anticipated growth that retailers would likely seek given limited resources prior to expanding into the subject property. With respect to the outparcels, likely users would include restaurants, smaller consumer goods retailers, or auto supply/service oriented users. The subject s primary area of influence is the Rotunda/Englewood markets and primarily draws from the immediate 3-5 mile radius. According to the Urban Land Institute (ULI) (in Dollars & Cents of Shopping Centers), the following retail property definitions may be applicable towards the subject: A shopping center is defined as a group of commercial establishments planned, developed, owned, and managed as a unit related in location, size, and type of shops to the trade area it serves. It provides on-site parking relating to the types and sizes of its stores. In terms of types of specific shopping centers, the subject is best described by the following: In addition to the convenience goods and personal services offered by the neighborhood center, a community center provides a wider range of soft lines (wearing apparel for men, women and children) and hard lines (hardware and appliances). The community center makes merchandise available in a greater variety of sizes, styles, colors and prices. Many centers are built around a junior department store, variety store, super drugstore or discount department store as the major tenant, in addition to a supermarket. Although a community center does not have a full-line department store, it may have a strong specialty store or stores. Its typical size is about 150,000 square feet of gross leasable area, but in practice, it may range from 100,000 to 500,000 or more square feet. Centers that fit the general profile of a community center but contain more than 250,000 square feet are classified as super 17
31 MARKET ANALYSIS community centers. In extreme cases, these centers contain more than 1,000,000 square feet. As a result, the community center is the most difficult to estimate for size and pulling power. DEMOGRAPHIC ANALYSIS Demand for additional retail property is a direct function of population change and household income. Retail properties are products of a clearly definable demand relating directly to population shifts and income patterns. Housing, Population and Household Formation The following table illustrates the population and household changes for the subject neighborhood with primary focus on the 3- to 5-mile radius radius. POPULATION AND HOUSEHOLD PROJECTIONS Population 2014 Population 1,408 16,198 32, Population 1,331 14,435 28, Population 1,211 11,443 23, Population 1,058 7,156 15,263 Annual Growth % 2.33% 2.21% Annual Growth % 2.61% 2.45% Annual Growth % 4.81% 4.30% Households 2014 Households 595 7,194 15, Households 564 6,359 13, Households 511 4,907 10, Households 436 2,945 6,666 Annual Growth % 2.50% 2.37% Annual Growth % 2.92% 2.71% Annual Growth % 5.24% 4.68% Source: CBRE As shown, the subject s neighborhood is experiencing moderate population and household growth, although its present population and household density is somewhat low, with an average of less than one person per acre on a three-mile radius, and nearly one person per two acres on a one-mile radius, with an average of nearly one home per five acres on a one mile radius and one home per 2.5 acres on a three-mile radius. This is well below the State average and results in a limited demand for retail space in the area. The most likely user for the subject s main parcel would be a consumer goods provider or grocer; while the most likely users of the outparcels would include restaurants, smaller consumer goods retailers, or auto supply/service oriented users. 18
32 MARKET ANALYSIS Income Distributions Household income available for expenditure on consumer items is a primary factor in determining the retail supply and demand levels in a given market area. In the case of this study, a projection of household income identifies (in gross terms) the market from which the subject submarket draws. The following table illustrates estimated household income distribution for the subject neighborhood. HOUSEHOLD INCOME DISTRIBUTION Households by Income Distribution Less than $15K 10.64% 8.00% 8.90% $15K - $25K 11.17% 10.98% 11.90% $25K - $35K 17.91% 13.40% 13.31% $35K - $50K 19.86% 18.87% 17.58% $50K - $75K 20.57% 25.11% 23.86% $75K - $100K 10.11% 12.44% 12.14% $100K - $150K 9.04% 7.88% 8.37% $150K - $250K 0.53% 2.55% 2.78% $250K - $500K 0.00% 0.64% 0.90% $500K or more 0.00% 0.14% 0.24% Source: CBRE As indicated, income levels are well distributed, but somewhat low, with incomes primarily below $75,000. However, this may be somewhat misleading, as a significant component of the area population is retirees whose stated income levels make up a substantial portion of their disposable income. The following table illustrates the median and average household income levels for the subject neighborhood. HOUSEHOLD INCOME LEVELS Income 2009 Median HH Inc $42,108 $48,948 $48, Estimated Average Household Income $50,247 $58,361 $59, Estimated Per Capita Income $21,962 $25,675 $27,809 Source: CBRE An analysis of the income data indicates that the submarket is generally comprised of middle income economic cohort groups. Retail Sales Volumes The following table illustrates retail sales for the subject s market area at given radii intervals from the subject. 19
33 MARKET ANALYSIS RETAIL EXPENDITURES ($000's) SUBJECT'S SUBMARKET Mile Mile Mile Product Sample %/Yr %/Yr %/Yr All Retail Stores 13,570 18, % 166, , % 344, , % Grocery Stores 2,628 3, % 31,005 44, % 64,271 91, % Eating Places 1,037 2, % 12,476 26, % 25,706 55, % Drinking Places % % % Health and Personal Care Stores 1,327 1, % 15,782 24, % 34,661 53, % Building Material & Garden Equipment & Supplies % 5,365 7, % 11,501 16, % Hardware Stores % % 1,355 1, % Lawn & Garden Equipment & Supplies Dealers % 788 1, % 1,672 2, % Furniture Stores % 3,041 4, % 6,468 9, % Other Home Furnishing Stores % 2,238 3, % 4,800 7, % Household Appliance Stores % 788 1, % 1,662 2, % Radio/TV/Other Electronics Stores % 2,401 3, % 4,970 7, % Department Stores (Excluding Leased) 1,151 1, % 14,184 20, % 29,320 42, % Clothing and Clothing Accessory Stores 772 1, % 9,811 13, % 19,540 27, % Shoe Stores % 1,327 1, % 2,532 3, % General Merchandise Stores 2,370 3, % 28,849 41, % 59,819 85, % Warehouse Clubs and Superstores 1,235 1, % 14,873 21, % 30,931 43, % Full Service Restaurants % 4,240 8, % 8,894 18, % Fast Food Restaurants % 3,588 7, % 7,145 14, % Jewelry Stores % 2,375 3, % 5,135 8, % Book Stores % 1,036 1, % 2,101 2, % Gift, Novelty, and Souvenir Shops % % 1,234 1, % Florists % 1,916 2, % 4,128 5, % Hobby, Toy, and Game Shops % 1,042 1, % 2,141 2, % Sporting Goods Stores % 1,374 1, % 2,760 3, % Camera/Photographic Supply Stores % % % Luggage and Leather Goods Stores % % % Sew/Needlework/Piece Goods Stores % % % Convenience Stores % 1,743 2, % 3,560 4, % Home Centers % 2,461 3, % 5,261 7, % Nursery and Garden Centers % % 1,499 2, % Computer and Software Stores % 961 1, % 1,994 2, % Clothing Accessory Stores % % % Auto Dealers 1,984 2, % 25,868 38, % 51,251 76, % Automotive Part, Accessories & Tire Stores % 1,748 2, % 3,593 4, % Gasoline Stations with Convenience Stores 1,113 1, % 13,269 22, % 27,021 45, % Gasoline Stations without Convenience Stores % 3,492 6, % 7,140 13, % Electronic Shopping and Mail Order % 7,579 11, % 16,071 23, % Total Accommodation and Food Services 1,422 2, % 17,527 35, % 36,531 74, % Source: CBRE As noted, demand for most retail products is expected to increase over the next five years. The annual rate of increase ranges from 7% to 9%, with Health & Personal Care, Fast Food, Eateries, and Gas Stations indicating the largest demand increases. Conversely, those retail products expected to experience the lowest level of growth in demand are Camera/Photographic Supply Stores, Auto Parts, and Sew/Needlework. However, there are no items that are projected to have negative growth to date. Outlook Based on this analysis, the immediate area surrounding the subject is projected to experience moderate growth relative to households and population, while retail expenditures are projected to expand along with household formation and population growth. However, given the low density 20
34 MARKET ANALYSIS nature of the subject market, expansion by retailers into this location will likely be done with trepidation until a pattern of increased household growth is clearly observed. A key component to improved retail expenditures would be if the housing market improves sooner than anticipated. To date, sales volume in terms of the number of properties selling (particularly single family homes), has improved, but at the expense of home pricing. Collectively, the total sales volume is down considerably from levels. While some data lends evidence that a recovery has begun to take shape, there are varying opinions and little consensus on when there will be improvement in pricing and the trickle down to follow in home improvement investment and ultimately new construction and the positive economic impact to the supporting market. In reviewing the housing market data presented in the area analysis, it appears that inventory declined significantly YTD, while sales transactions haven increased considerably from 2007 and 2008, indicating we re potentially in a cycle of recovery. It is too early to determine whether this trend is a short or longer term trend and we probably won t know the answer until the recovery has come and gone. However, looking forward and judging by the present lack of new retail expansion, it is our opinion a buyer of the subject would anticipate the prospect of an 18-month holding period for the site at minimum before residential activity and corresponding retail demand exhibit signs of a clear pattern of growth. MARKET OVERVIEW Market Summary Market statistics for the overall Southwest Florida Retail market and the subject s submarket are shown in the following table: OVERALL RETAIL MARKET Existing Inventory Vacancy YTD Under Const Quoted Market # Bldgs Total GLA Direct SF Total SF Vac % YTD Net Abs. Deliveries SF Rates Charlotte County 719 9,795, , , % -120,479 59,182 6,801 $14.66 Collier County 1,575 23,163,360 2,016,238 2,116, % 23, , ,565 $20.39 Lee County 3,007 44,188,355 4,184,041 4,413, % -1,119, , ,215 $14.73 Totals 5,301 77,147,164 6,812,055 7,149, % -1,217,423 1,411, ,581 $16.31 Source: CoStar Q As reported by CoStar, the Southwest Florida Retail Market currently consists of 5,301 properties with 77,147,164 square feet of inventory. The market is broken into sixteen submarkets. The submarkets with the highest overall vacancies are Bonita Springs, Lely, and Cape Coral, which also experienced the greatest levels of growth in the past five years amongst the region. Net absorption in 4Q 2009 for the overall market was -1,217,423 square feet, including the addition of 1,411,316 square feet, with Cape Coral, City of Ft. Myers, and South Ft Myers/San Carlos exhibiting the greatest negative net absorption. To compare on a relative scale, this market s negative net absorption is 400,000 square feet less negative than Tampa-St. Pete-Clearwater MSA (-1,600,000 SF), and its deliveries are 800,000 SF less than the Tampa MSA which is 2.70 times larger than the Southwest Florida market in terms of retail space constructed. 21
35 MARKET ANALYSIS Average quoted rental rates in the Southwest Florida Retail market primarily average $16.31, with Collier County rates being higher due to higher permitting/approval constraints, limited available land, and higher impact fees, limited supply and increasing rents. As of the 4 th Quarter 2009, a total of 1,411,316 square feet in deliveries occurred, which has slowed considerably from the 2008 deliveries of approximately 3.2M square feet of space completed in the market. There is an additional 565,581 square feet in projects still under construction and planned for completion in the first half of This is a significant reduction from the 1.24M square feet of space delivered in the first half of As a result of added inventory at a time when retail demand has been contracting, the region has experienced an increase in vacancy as illustrated in the chart below. As shown below vacancies in the Southwest Florida Retail Market have been steadily increasing over the course of the last two years, with Power Centers and Shopping Centers having incurred the brunt of market s increase in vacancy levels. This same upward trend in vacancy correlates with the upward trend experienced in new deliveries of inventory over the same time frame. 22
36 MARKET ANALYSIS OVERALL RETAIL STATISTICS Existing Inventory Vacancy Net Deliveries UC Inventory Quoted Period # Bldgs Total GLA Direct SF Total SF Vac % Absorption # Bldgs Net RBA # Bldgs Total RBA Rates q 5,023 67,495,810 1,860,962 1,921, % , ,058,482 $ q 5,042 67,959,810 1,902,554 1,950, % 435, , ,727,224 $ q 5,066 68,450,916 1,715,306 1,764, % 676, , ,423,708 $ q 5,090 69,559,362 1,726,712 1,773, % 1,099, ,108, ,677,294 $ q 5,129 71,004,408 1,977,568 1,986, % 1,231, ,484, ,957,838 $ q 5,145 71,219,681 2,067,956 2,083, % 124, , ,403,153 $ q 5,163 72,013,536 2,347,834 2,367, % 509, , ,348,157 $ q 5,178 72,536,669 2,578,566 2,626, % 264, , ,314,804 $ q 5,205 73,452,135 3,446,163 3,500, % 40, , ,505,405 $ q 5,220 74,198,685 3,785,936 3,945, % 302, , ,198,772 $ q 5,240 75,369,936 4,193,744 4,297, % 818, ,171, ,548,043 $ q 5,257 75,735,848 4,311,856 4,520, % 143, , ,451,158 $ q 5,278 76,717,343 4,993,258 5,243, % 258, , ,597 $ q 5,293 76,975,808 5,397,735 5,700, % -199, , ,158 $ q 5,299 77,060,532 6,318,717 6,621, % -835, , ,213 $ q 5,301 77,147,164 6,812,055 7,149, % -441, , ,581 $ Year Change 44 1,411,316 2,500,199 2,628, % -584, ,777, ,577 -$ Year Change 211 7,587,802 5,085,343 5,375, % 3,317, ,795, ,111,713 -$2.94 Source: CoStar Q Absorption in the overall market has been positive for all but three quarters over the last three years, with the 2009 loss in absorption coming entirely from the second quarter of 2009 to the fourth quarter of Much of the space that is absorbed is considered to reflect pre-leasing prior to the start of construction. Select retail centers in well established locations have indicated a re-tenanting trend as non-performing tenants have been displaced by the present market and those tenants who previously were unable to enter select centers are now finding available space. In either case, deliveries are declining as under construction inventory has declined from a peak of 3.4 million square feet in 3 rd Qtr to 565,581 square feet in 3Q09. Average quoted rates are down to $16.31 per square foot, from their peak of $20.41 per square foot in 1 st Qtr. 2008, and falling well below rates of 3 years prior. Also, it should be noted that many market participants have commented on the significant reductions off quoted rents in arriving at contracted rental rates on recently executed leases. Construction/Deliveries Presented below is a chart illustrating new construction activity in the area as of Mid-Year CONSTRUCTION ACTIVITY Under Construction Inventory Average Building Size Market # Bldgs Total GLA Preleased SF Preleased % All Existing U/C Collier County 6 344, , % 14,707 57,427 Lee County 8 214, , % 14,695 26,777 Charlotte County 1 6,801 6, % 13,624 6,801 Totals , , % 14,553 37,705 Source: CoStar Q Presently, there are only 15 properties under construction, down from 40 as of 4 th Quarter Currently there is 565,581 square feet under construction, of which approximately 84.80% (479,348 square feet) is pre-leased, compared to 1.45 million square feet under construction as of 4Q08. 23

37 MARKET ANALYSIS Most of these properties represent smaller, in-fill location developments and neighborhood retail centers which are commonly categorizes as Shopping Centers. This reflects a significant reduction relative to 2008 deliveries. The chart below illustrates the region s historical deliveries, reflecting the high growth period experienced in the mid-90 s and subsequent period of minimal new deliveries from 2002 through The present market is contracting, with vacancies increasing rental rates contracting, and deleveraging impacting investment trends. For the Southwest Florida Market, a significant level of growth has occurred since 1995 in residential and retail, with a peak level of growth from 2005 through While the Florida markets experienced varying levels of growth in the past 3-4 years, Southwest Florida s retail supply was 1.5 to 2x its long term average, which is significantly higher than most developed markets. As a result, the area experienced a higher level of overbuilding in anticipation of future residential growth that has not yet materialized. While the contraction the market is currently experiencing does not presently have a recovery time in sight, the area is expected to remain one of Florida s growth markets once recovery ensues looking forward. At present, it appears the market will require 2-3 years of growth without significant added supply to reach its longterm average of deliveries and a point of equilibrium. Fortunately, the development activity has responded accordingly and new construction levels have contracted significantly. Most of the 2008 deliveries noted above are located in Collier and Lee Counties, with limited new supply added to the Charlotte County market in Of those added, some of the notable deliveries include: Mercato, a 300,000-square foot Lifestyle retail center in the North Naples submarket; a 161,639 square foot retail center located in the Collier County Submarket; Village Shoppes at Health Park, a 113,000-square foot retail center in the South Ft. Myers submarket; and an 80,000 square foot portion of The Brooks in the Bonita Springs submarket. The following chart breaks down the deliveries by project size as of the 4 th Qtr. 2009: 24
38 MARKET ANALYSIS RECENT DELIVERIES BY PROJECT SIZE Building Size # Bldgs Total GLA SF Leased % Leased Avg. Rate Single-Tenant Multi-Tenant < 50,000 SF , , % $ , ,875 50,000 SF - 99,999 SF 4 273, , % $ , ,000 SF - 249,999 SF 3 375, , % $ , ,000 SF - 499,999 SF 1 300, , % $ ,000 >= 500,000 SF % $ Source: CoStar Q Overall, the Southwest Florida Retail Construction Market continues to contract in response to the slowing economy. As a result, the remaining under construction pipeline has decreased and largely represents legacy projects originated in The general consensus amongst market participants and brokers is that retail development will continue to slow in the coming year until stability in occupancies and rental rates is identified along with a clear and identifiable improvement in the housing market. A secondary factor will be anticipation and the extent construction costs and land values continue to decline such that development feasibility returns. At present, raw material costs for steel, concrete, aluminum, and labor have all decreased 20-30% in the past year, and while many market participants realize the change in cost, they still have not decreased to a level sufficient to proceed with new construction. As a result, there is not likely to be any meaningful inventory additions for months at the earliest. SUBMARKET TRENDS CHARLOTTE COUNTY SUBMARKET The Charlotte County submarket consists of 9,795,449 square feet of space, with a current vacancy rate of 6.30%, an increase from 5.60% in the Third Quarter, 2009 and 4.50% in the Fourth Quarter, Average quoted rental rates are $14.66 per square foot, which from a face rent standpoint is about $1.00 per square foot less than 1 st quarter 2009 and However, the reported face rate versus negotiated rate is significantly different per interviews amongst active brokers and market participants. Overall, the data reflects a decrease from the peak of slightly over $18.50 in First Quarter, 2007, with the Second Quarter, 2007 reflecting the first significant downward step in rents since the upward movement experienced over the prior 2-3 years. The subject s submarket reported a net absorption of negative 72,550 square feet for the 4 th Qtr. 2009, the fifth period of net negative absorption in 6 quarters and the 6 th period of negative absorption in the past eight (8) quarters. However, during this same period, inventory was only increased by approximately 85,000 square feet, or less than 1.0%. Presently, there is only 6,801 square feet in space additions to this market being reported as under construction. However, it should be noted site work for Charlotte Commons (over 250,000 square feet) began in the 3 rd Quarter 2009 and is currently marketing its outparcels, while there remains significant available, entitled land for new development available. In addition, Cocoplum Village represents a 90,000 square feet Publix anchored (55,000 SF) retail center that is under construction in Northport just north of the Sarasota-Charlotte County line that has an impact on the northern Charlotte County market 25
39 MARKET ANALYSIS area. Fortunately, the limited new construction identified in the market s pipeline should limit further increases in vacancies primarily to normal turnover and redevelopment, whereas oversupply due to new inventory should begin to abate in the coming months. The following analysis provides submarket specific detail regarding existing inventory, vacancy levels, absorption, new deliveries, absorption, under construction inventory, and average quoted rental rates within the Charlotte County Submarket. As illustrated in the chart above, vacancy was at its lowest for the past 3 years in the 2 nd quarter of Since that time, the vacancy rate has trended upward, albeit at a much lower incline compared to the MSA as a whole, with the most noted increase occurring in mid-year 2008/early 2009 as vacancy increased to 4-4.5%, much of which was due to new construction. There is currently limited new construction in this submarket, which will give excess supply a chance to be absorbed. As well, given the low vacancy, we d expect a market recovery to be more in step with a housing market recovery without as significant a lag period as further excesses in supply is absorbed. Quoted rental rates have been decreasing over the past two years, while negotiated lease rates are reportedly below quoted rates. 26

40 MARKET ANALYSIS As illustrated below, while rental rates have declined, they are still above 2006 levels. CHARLOTTE COUNTY SUBMARKET Existing Inventory Vacancy Deliveries UC Inventory Quoted Period # Bldgs Total GLA Total SF Vac % Net Absorpotion # Bldgs Net RBA # Bldgs Total RBA Rates q 690 9,355, , % , ,236 $ q 690 9,353, , % 60, , ,503 $ q 692 9,398, , % 62, , ,035 $ q 696 9,425, , % 42, , ,040 $ q 701 9,553, , % 129, , ,217 $ q 707 9,659, , % 132, , ,124 $ q 708 9,662, , % -46, , ,124 $ q 711 9,709, , % 21, , ,500 $ q 712 9,715, , % -42, , ,500 $ q 713 9,723, , % -79, , ,900 $ q 713 9,723, , % 11, ,082 $ q 714 9,736, , % -16, , ,182 $ q 717 9,761, , % -24, , ,000 $ q 717 9,761, , % -47, ,801 $ q 719 9,795, , % 23, , ,801 $ q 719 9,795, , % -72, ,801 $ Year Change 5 59, , % -56, , ,381 -$ Year Change , , % 32, , ,239 -$3.88 Source: CoStar Q Absorption has been negative in the past year which is primarily attributable to newly added space that is taking a longer time frame to lease up than anticipated. Quoted rental rates have decreased slightly despite the slowdown in supply. As well, negotiated rates are reportedly below quoted rates per interviews with most leasing brokers. National Personal Income Overview To provide an indication of the overall state of the national economy, we have included the following write-up from TortoWheaton which provides an overview of the relationship between personal income and expenditures. 27

41 MARKET ANALYSIS As shown, expenditures have continued to improve, albeit at a slower rate than in previous months. Disposable income fell in January, reflecting expenditures due to tax payments in the beginning of the year, not a reversal of discretionary spending habits. Personal consumption continued at the same pace as previous months, showing that the national economic recovery is still months away. Yet to be known is how much disposable income is influenced by stimulus money rather than real employment and wage earning ability, which may ultimately be the cause of the gap in disposable personal income and retail expenditures. Going forward, it is likely consumers will continue to spend discretely until confidence in employment, housing, and economic stability return. Ultimately, retailers whose goods are based on discretionary spending are likely to be more impacted than those whose goods are more functional and by necessity. Per TortoWheaton, Data released: The Bureau of Economic Analysis's latest release for January personal income and outlays confirmed that the year began with continuing recovery in income and consumption. While data for income levels in the second half of 2009 were revised downward, from the middle of the year onward, income still moved in an upward trend. Personal income in January 2010 was 1.1% higher than it was a year earlier, but wages and salaries were 1% lower. January was the fourth consecutive month of increasing salaries, suggesting that the labor market, with an unemployment rate just below 10%, is stabilizing enough to cause some wage increases for currently employed workers. Consumption grew by 0.5% in January, the fourth consecutive month of increase. January was also the first time since April 2008 that the annual consumption growth was higher than the growth in disposable personal income (see graph), which caused the savings rate to drop from 4.2% to 3.2%. 28

42 MARKET ANALYSIS This drop was due more to sharply higher tax payments for the month, which caused disposable income to fall by an annualized 5%, than it was to a reversal of recent "careful spending" habits by consumers. The Bureau of Economic Analysis reports that the federal non-withheld taxes (payments of estimated taxes, plus final settlements, less refunds) caused the January personal current taxes to rise by $52.5 billion, based on projections of higher final settlements and lower refunds in In the coming months however, the gap between consumption and disposable income will continue to narrow again as the recovery continues in both income and consumption and consumers continue to spend carefully.. INVESTMENT MARKET TRENDS Investment sales nationally reached their peak in 2007, with a staggering $438 Billion in US Core Commercial Real Estate transacting, of which $75 Billion consisted of Retail properties. However, 2008 marked a significant change in transaction volume for all asset classes. 29
43 MARKET ANALYSIS Volume in Billions $30 portfolio one off $25 $20 $15 $10 $5 $0 Ltd-Svc Htl NNN Retail Flex Ind Full-Svc Htl Mid/High Strip Ctr -rise Apt Retail Warehouse SuburbanGarden Office Apt CBD Office 0% -20% -50% -64% -67% -76% -55% -74% -60% -75% -40% -60% -86% -87% -80% Change in Volume '08 vs '07-100% As illustrated below, transaction volume increased from 2003 through 2007, but 2008 and YTD 2009 reflected a clear change in this trend with a decline in Core Commercial transactions of all property types. Cap rates continue to trend upward for all property types, while price per square foot also continues to decrease. 30


44 MARKET ANALYSIS Real Capital Analytics 2009 Year in Review-Distressed Property By the end of 2009, nearly $200 billion in commercial real estate had become distressed, of which $17 billion was resolved. At the beginning of 2009, many predicted a flood of distressed assets coming to market and hundreds of billions of dollars was raised to target these supposedly imminent opportunities. However most of these investors have found the inventory of distressed opportunities wanting. This is because a confluence of factors has alleviated the pressure on lenders to liquidate, and as a result, an increasing portion of distressed situations are being restructured. Below are two charts depicting the cumulative volume of distressed assets in the market and the monthly additions of distressed properties in Real Capital Analytics has created a Restructured/Extension classification in their troubled-asset methodology. This classification captures properties where ownership or debt terms have changed but may not have resolved the cause of distress. On the debt side, the most common type of restructuring is to extend the maturity date, although interest rate, loan balance and/or other terms can be modified. A restructuring of ownership, such as when a mezzanine lender steps into the equity position or the lender exchanges debt for equity also typically signifies unresolved trouble. However, the classification will not include properties that have gone back to the 1st mortgage holder via foreclosure. Real Capital Analytics 2009 Year in Review-Retail Diagnostics In Q4, the retail sector recorded its highest quarterly volume since Q2 08 with $5.5 billion of significant property sales; that was nearly half of the $11.6 billion of retail property sales in all of Two significant portfolios accounted for $3.5 billion of the Q4 total and represented the first significant portfolio activity since Consequently, the sector posted its first year-over-year increase in sales in more than two years; however, individual property sales were flat compared to Q3 and were still down compared to a year earlier. 31


45 MARKET ANALYSIS The two major portfolio trades in Q4 signal that another wave of consolidation of retail property ownership by public REITs has begun; REITs, now enjoying better access to capital than most other real estate investors, are preparing to be big buyers in For the year, a total of $11.6 billion, or 883 significant retail properties changed hands, excluding foreclosures and other non-market transfers. That marked a 44% decline over 2008 volume and a 56% drop in the number of properties sold. While portfolio transactions and some entity M&A have returned in the retail sector, trading of individual properties is only slightly improved, but both the number of properties sold and the average property size have started to trend up again. It is important to remember that volume remains at very depressed levels. Not only is it dwarfed by volume achieved at the peak in 2007, it has also been overwhelmed by a much greater number of properties offered for sale. This trend reversed in Q4 as closings exceeded offerings, but seasonally, that is typically the case at year-end. In addition, the sales volume over the past year pales in comparison to the volume of retail properties falling into default, foreclosure or bankruptcy. A year ago, the market was anticipating a huge wave of distressed assets to hit in 2009, but relatively few have sales have happened, especially in the retail sector. Distressed sales accounted for less than 10% of all retail sales in Q4, well below that averaged for other property types. 32


46 MARKET ANALYSIS So far in this cycle, a total of $42.9 billion retail properties have become distressed of which only $1.6 billion has been resolved, the lowest among all property types. Lenders are opting to extend or restructure mortgages and are generally avoiding foreclosure. Even upon taking title to an asset, many lenders are still waiting for an improved market before attempting to sell. Prices continued to deteriorate throughout 2009 and cap rates have been on a steady climb for 10 consecutive quarters, rising 75 bps in 2009 to an average now above 8.0%. The Moody s/real CPPI registered an 18% decline in retail prices in the first three quarters of 2009 and a 25% decline from the peak, both materially better than for other property types. But the sector has seen the fewest amount of distressed sales that would weigh down prices. In a positive sign, the most recent release of Moody s/real CPPI for all property types posted the first positive return in November after more than a year of consecutive monthly declines. Generally, retail prices have returned to pre-bubble levels approximating prices in In addition, the spread between cap rates and the 10-year Treasury has also returned to levels last experienced in the recession earlier in the decade. This spread, an approximate measure of risk, narrowed to as low as 150 bps in 2007, but has averaged above 500 bps recently. 33
47 MARKET ANALYSIS Florida Retail Investment Activity The Area retail sector over the trailing twelve months has experienced a decrease in transaction volume much like the broader US Market, with sales volume contracting from the 2Q07 peak to the 1Q09 low. As well, pricing has begun to come under pressure, although the sales closed thus far do not fully recognize the increases in capitalization rates being reported by market participants. The chart above also illustrates the composition of buyers and sellers, indicating the high level of Private in State Investors and Owner Users in the Tampa retail market. This is of note given the pressure these owners are under due to recent economic shifts and the need for liquidity. As indicated, these two participants represent a large percentage of the seller pool, placing downward pressure on the market. The table below provides a summary of significant retail transactions over 150,000 square feet in the state of Florida since January 2008: SUMMARY OF FLORIDA RETAIL SALES (over 150,000) Transaction Year GLA Adjusted Price NOI Name Type Date Built (SF) Sale Price 1 Per SF 1 Occ. Per SF OAR Fountains of Miramar, Miramar, FL Airpark Plaza, Miami, FL Mission Bay Plaza, Boca Raton, FL Altamonte Town Center, Altamonte Springs, FL Promenade at Naples Centre, Naples, FL Coral Walk, Cape Coral, FL Winter Haven Citi Centre, Winter Haven, Park Street Center, St. Petersburg, FL Shoppes at Jupiter, Jupiter, FL Winter Garden Village, Winter Garden, FL Ormond Towne Square, Ormond Beach, FL Sale Jan ,405 $39,500,000 $ % $ % Sale Feb ,091 $37,000,000 $ % $ % Sale Feb ,866 $74,000,000 $ % $ % Sale Mar ,775 $48,300,000 $ % $ % Sale May ,966 $48,535,900 $ % $ % Sale Jun ,612 $29,223,249 $ % $ % Sale Jun ,705 $20,000,000 $ % $ % Contract Jul ,408 $30,500,000 $ % $ % Sale Aug ,931 $41,106,861 $ % $ % Sale Oct ,293 $180,400,000 $ % $ % Sale Jan ,043 $22,000,000 $ % $ % 1 Transaction amount adjusted for cash equivalency and/or deferred maintenance (where applicable) Compiled by CBRE As indicated, there has been a recent upward trend in capitalization rates as of the 1 st Qtr Also, brokers are observing an increase in distressed assets available on the market and competing as available investment alternatives to those wishing to exit their property in a normal, orderly manner. The capitalization and price shift is due to both the changing economic trends impacting occupancy 34
48 MARKET ANALYSIS and rental rates along with the de-leveraging being experienced in the market, with LTV levels declining and Debt Coverage Ratios increasing. Furthermore, buyers are not willing to acquire a property as willingly on anticipated revenue, and unsecured income is being written down to market rates and discounted more heavily to account for risk and market volatility. Collectively, these factors are placing downward pressure on values relative to most observed in The low sales volumes reflect the diverging views amongst buyers and sellers. However, the offerings have begun to increase, which may be a reflection that sellers with shorter investment horizons are becoming more anxious, particularly if a near-term balloon on their loan exists. The key for most transactions that have been successful has been to recognize the adjustment to revenue potential and underwrite based on current capital cost and availability. CHANGES AMONG RETAILERS According to Shopping Centers Today, published by the International Council of Shopping Centers (ICSC), consumers, retailers and landlords continue to face transformative challenges. The following is excerpted from a current article noting conditions and current influences on the retail the marketplace. Personal spending accounts for about 70% of the $13.8 trillion of U.S. gross domestic product. And as the global financial crisis so amply illustrates, U.S. shoppers free-spending ways, whether in the form of subprime mortgages or maxed-out credit cards, support a huge chunk of the global economy as well. The willingness of shoppers to keep spending despite a litany of jolting events the dot-com crash at the start of this decade, the Enron meltdown, the 9/11 attacks, the Iraq War and Hurricane Katrina, to name a few has astonished several economists and moved some, at times, to describe these spenders in near-heroic terms. Nowadays, though, things appear to have changed. Signs of the struggle include record levels of personal debt, rising unemployment, crumbling home values, spiking bankruptcies, and sharply higher default rates on mortgages, credit card bills and car and student loans, says Howard Davidowitz, chairman of Davidowitz & Associates, a New York City-based retail consulting and investment banking firm. So the question facing developers and retailers today is, how best to cater to this consumer in a new era of thrift? Even before the Wall Street meltdown and global panic captured headlines this fall, an upheaval in shopper attitudes and behavior was under way, some say. A survey of about 1,000 shoppers conducted this summer by BrainReserve, a New York City-based trend-forecasting firm, points to a metamorphosis of the go-go brand of American consumerism that was the dominant paradigm for a decade. While we struggle through these difficult times, major trends are gathering momentum that promise to move society in new directions, wrote Faith Popcorn, BrainReserve s CEO. The report shows that 84% of those surveyed are inclined to buy less stuff and are making fewer shopping trips even as they cut spending on everything from foodstuffs to luxuries. Some 72% 35
49 MARKET ANALYSIS of respondents reported wanting to reduce clutter in their lives. Popcorn interprets these responses as a rejection of lifestyles based on debt and conspicuous consumption. Whether, as Popcorn suggests, this really does mark something more than a temporary shift in shopper attitudes remains to be seen. But for sure, this fall s meltdown, frequently described as the worst financial crisis since the Great Depression, kicked this economic angst into a higher gear. Whether shoppers stayed home as a direct result of the cavalcade of bank collapses is an open question, but the data are suggestive, says Dan Natale, vice president of North American sales at ShopperTrak, a Chicago-based provider of retail traffic counts. Between August 31st and September 20th, we saw a 9.2% falloff of all retail traffic, Natale said. In that same 21-day period, we had Freddie Mac and Fannie Mae, Lehman Brothers and AIG [fail]. It shook people s confidence. Over the next 10-day period, in which banking behemoth Washington Mutual went belly-up and Congress rejected the initial $700 billion Wall Street rescue package, retail traffic dipped by 10.5%, Natale says. When the Dow crashed by 778 points on September 29, retail traffic was off 12% from a year before. Anxiety about these events might explain why The Conference Board s consumer confidence index fell to 38 in October, the lowest level the index ever recorded. Its previous low was 43.2, set in December (The Conference Board began tracking this data in 1967.) So Americans are changing their shopping tactics to save money, at least for the time being. Many are cutting back on unnecessary purchases or switching to cheaper brands and stores. We have seen a widening gap between discretionary and nondiscretionary retail, said Kenneth Perkins, president of Retail Metrics, a Swampscott, Mass.-based research firm. People are trying to go to [retailers] where they can stretch their dollar, especially with this complete unraveling of the financial system and the freeze-up of credit. Discount stores have been outperforming specialty retailers and department stores, Perkins says. Even luxury chains, long considered safe harbors because of their well-heeled customers ample discretionary income, are suffering, he says. Indeed, less affluent shoppers no longer venture into a Saks or a Neiman Marcus to indulge themselves with so-called aspirational purchases, says Scott Hoyt, senior director of consumer economics at Moody s Economy.com, based in West Chester, Pennsylvania. And those chains core shoppers, many of whom work in the finance industry and have enjoyed eye-popping annual bonuses for years, are feeling the pinch, he says. What is going on in the financial markets is hitting high-end consumers, Hoyt said. Next year is going to be particularly tough for the luxury sector because all evidence points to a major reduction in bonus payouts. For example, the New York state budget division projects a 43% decline in bonuses paid in the state. Hit by the one-two punch of the credit freeze and slowing sales, the rapidly contracting retail universe will keep right on shrinking for the foreseeable future, Perkins predicts. Little wonder that those firms that help retailers get rid of excess space expect to stay busy. Just in the last year, we have seen bankruptcies at CompUSA, Linens n Things, Steve & Barry s, Fortunoff, 36
50 MARKET ANALYSIS Goodies, Sharper Image the list is long, and it includes names familiar to all Americans, said Michael J. Burden, a principal at Lake Success, New York-based Excess Space Retail Services. We ve seen an abundance of healthy retailers close stores due to underperformance, and all retailers are slowing their expansion plans. But retailers and mall owners are anything but helpless in the face of this gloomy economic outlook. They can, like their shoppers, act to better their odds, Burden says. Smart retailers now are taking advantage of landlords comparatively weaker hand to win favorable terms as they renegotiate leases and renewals. They also are moving into markets and shopping centers where the entry barriers once seemed insurmountable, he says. Lower-end retailers are now able to enter markets, shopping centers and certain other real estate they never were able to obtain before, Burden said. They aren t just taking advantage of the economy. They re also making themselves strong to avoid becoming victims of the economy. In this volatile economic environment, seeing into the future is no easy task, of course. But most prognosticators do agree that a long struggle lies ahead for the consumer-driven U.S. economy. Overall, according to ICSC reporting, the retail market will result in healthier retail businesses in the long term, with some continued fallout among retailers in the short term. CONSUMER SENTIMENT SURVEY The Index of Consumer Sentiment summarizes data collected through surveys of consumers conducted by Reuters and the University of Michigan. The Surveys are conducted monthly and reflect consumer attitudes and expectations about the U.S. economy, providing a gauge of consumer anticipation of changes in the economic environment. One part of the surveys, the Index of Consumer Expectations, is a component of the U.S. Index of Leading Economic Indicators. The U.S. Index focuses on three areas: how consumers view prospects for their own financial situation, how they view prospects for the general economy over the near term, and their view of prospects for the economy over the long term. 37

51 MARKET ANALYSIS Consumer confidence continued to increase in January, but is near the record low levels recorded in the early 1990 s. The good news is that the free fall in confidence has ended. The bad news is that consumers expect their financial situation to remain dismal for the rest of 2009, according to Richard Curtin, the Director of the Reuters/University of Michigan Surveys of Consumers. Consumers reported the largest two-month gain in confidence in the government s economic policies, although consumers were still slightly more likely to rate economic policies unfavorably than favorably. Importantly, the stimulus package was expected by consumers to be more effective in aiding the general economy than in improving their own financial situation. Overall, consumers remained intent on increasing their saving and reserve funds even at the cost of not taking advantage of the deeply discounted prices that are now available. The Index of Consumer Sentiment was 74.4 in the January 2010 survey, up from 72.5 in December and 67.4 in November, and above the 59.8 recorded in May 2008 the second positive year-to-year change since mid A psychological sign that the cyclical bottom has been reached is when the base of comparison used by people shifts from the prior peak to the recent trough. Compared with the state of the economy six months ago, consumers have indeed regained a good measure of confidence. Compared with the prior peak, however, consumer confidence remains at relatively low levels. 38

52 MARKET ANALYSIS Barriers to Entry The primary barrier to entry in the subject submarket is the time to get approvals/entitlements for new development land, cost of construction, and off-site costs including impact fees and concurrency costs where infrastructure is lacking. Otherwise, there are no real physical barriers in terms of lack of available land in the area. The newest project being added to the market includes Charlotte Commons, a mixed use retail and office property located in the northwest quadrant of Veterans Boulevard and Peachland Road, in Port Charlotte near the King s Highway/Interstate 75 interchange. The most current plans for this development are presented below. Initial site clearing is presently underway. SUBJECT TRENDS AND PROJECTIONS Subject s Historical Trends The subject center consists of a Home Depot anchor along with two outparcels occupied by Englewood Bank and Burger King, while a third outparcel was recently under contract by a Dollar General operator that was previously anticipating a 2010 opening date and has since been placed on hold. Since construction, the subject owner s/leasing representatives have pursued various big box users and concepts from Target to Wal-Mart Neighborhood Stores, along with several outparcel users. As well, they have proposed various retail strip center improvements on the larger building pad situated directly west of Home Depot. To date, the developer has been unable to identify a viable use for the main building pad. 39
53 MARKET ANALYSIS Retail Land Trends Over the past two years, numerous planned developments have stalled, resulting in a number of available development sites that are presently offered for sale. Since 2008, very few retail land sales have occurred of sites larger than outparcel uses, although a number have been listed. In general, feedback amongst market participants generally indicate that asking prices for well located retail properties with all approvals, SWFWMD approvals et al, are in the $200,000 to $450,000 per acre range, although most indicated pricing to procure a sale based on prospective buyer feedback is closer to the range of $200,000 to $300,000 per acre, and lower in some instances. Presented below is a table of current commercial tract listings. SUMMARY OF COMPARABLE RETAIL LAND LISTINGS Transaction Adjusted Sale Size Size Price Site Name Property Location Type Date Proposed Use Price 1 (Acres) (SF) Per SF Harbour Square Plaza SWQ of Cochran & Veterans Boulevard, Port Charlotte, FL North Port Tamiami Trail, Commercial land North Port, FL Riverwood PD Site W/S El Jobean Willow Bend Rd, Port Charlotte, FL Harbour Square SWQ of Cochran & Veterans Plaza Boulevard, Port Charlotte, FL Heritage Harbour 8265 Heritage Green Way, Site Bradenton, FL Commercial Land SEQ of Toledo Blade & Woodhaven, North Port, FL Veterans Commons NWQ Veterans Blvd & Cochran Site Blvd, Port Charlotte, FL McCall Road Tract Gulfstream Blvd. SEQ of SR 776 & Gulfstream Blvd., Englewood, FL Wal-Mart NEQ of I-75 and Kings Highway, SuperCenter Pad Port Charlotte, FL McCall Road Tract SWQ McCall Rd (SR 776) & Winchester Blvd, Englewood, FL Charlotte Commons W/S Veterans Blvd, N/O Peachland Blvd, Port Charlotte, FL Listing Mar-10 Unfinished Retail Bldg Pad $4,115, ,998 $5.74 Listing Jan-10 Retail Site $2,600, ,232 $5.80 Listing Mar-10 Retail Site $2,950, ,614 $6.03 Listing Mar-10 Unfinished $1,650, ,452 $6.86 Retail Bldg Pad Listing Mar-10 Retail Site $5,500, ,840 $9.02 Listing Jan-10 Unfinished $3,995, ,165 $9.18 Retail Bldg Pad Listing Mar-10 Retail Site $5,000, ,432 $9.41 Listing Mar-10 Retail Site $1,639, ,786 $10.01 Listing Mar-10 Unfinished Retail Bldg Pad $2,400, ,266 $11.36 Listing Mar-10 Commercial $2,650, ,427 $12.96 Site Listing Mar-10 Office Bldg Pad $3,500, ,898 $ Transaction amount adjusted for cash equivalency and/or development costs (where applicable) Compiled by CBRE Absorption Considering interviews with market participants, recent construction trends, and the anticipated time frame to reach the area s long-term annual delivery trend previously presented, it is our opinion a prudent investor would anticipate a 18-month holding period for appropriate priced land to procure a sale assuming normal market exposure. Based on the presented data analysis, we have employed a 18-month holding period to our conclusion of market value of the subject parcels given our discussions amongst brokers and our observations in the immediate submarket. 40
54 MARKET ANALYSIS Conclusion Based on the foregoing analysis, CBRE s conclusion of the subject s retail market is demand is likely to be related to a housing market recovery. While we are observing what appears to be the start of a sustainable recovery, our analysis of retail supply, demand, and historical construction trends, resulted in our opinion that the subject site will require a 18-month holding period prior to user demand increasing. As such, as prudent buyer of the subject would factor this holding cost and time into their purchase price decision. With respect to the subject in particular, we believe the subject s supporting density is somewhat low and while it benefits from exposure along McCall Road, demand for this location is likely to be trepid until clearly identifiable growth patterns emerge. Looking forward, the area is projected to experience a modest level of growth, such that retail demand should begin to stabilize in the coming 18-month period in advance of new construction. 41

55 SITE ANALYSIS SUBJECT SURVEY Outparcel Lot 4 Outparcel Lot 2 Outparcel Lot 5 Main Parcel 42
56 SITE ANALYSIS SITE ANALYSIS The following chart summarizes the salient characteristics of the subject site. SITE SUMMARY AND ANALYSIS Physical Description Center Total Site Area Acres 1,370,205 Sq. Ft. Total Subject Site Area Acres 634,103 Sq. Ft. Main Parcel Site Area (Vacant Anchor site) Acres 474,002 Sq. Ft. Primary Road Frontage McCall Blvd. 634 Feet Secondary Road Frontage Kevitt Boulevard appr. 980 Feet Outparcel 1 (Lot 2) 1.09 Acres 47,503 Sq. Ft. Primary Road Frontage McCall Blvd. 206 Feet Secondary Road Frontage Kevitt Boulevard 230 Feet Outparcel 3 (Lot 4 West) 1.47 Acres 63,917 Sq. Ft. Primary Road Frontage McCall Blvd. 278 Feet Secondary Road Frontage Kevitt Boulevard 230 Feet Outparcel 4 (Lot 5 West) 1.12 Acres 48,674 Sq. Ft. Primary Road Frontage McCall Blvd. 212 Feet Secondary Road Frontage Kevitt Boulevard 230 Feet Surplus Land Area None Shape Topography Mostly Rectangular Level Primary Traffic Counts (24 hrs.) McCall Blvd (SR 776) 31,000 (2008) Secondary Traffic Counts (24 hrs.) Gulfstream Blvd Zoning District Flood Map Panel No. & Date CG, Commercial General 12015C0211F 5-May-03 Flood Zone Zone X Adjacent Land Uses Commercial and residential uses Comparative Analysis Access Visibility Functional Utility Traffic Volume Adequacy of Utilities Landscaping Drainage Utilities Water Sewer Natural Gas Electricity Telephone Mass Transit Good Good Average Average Average Average Assumed adequate Provider Charlotte County Utilities Charlotte County Utilities TECO Florida Power & Light Embarq, Comcast, Vonage, AT&T Dial a Ride Rating Adequacy Yes Yes Yes Yes Yes No Other Yes No Unknown Detrimental Easements X Encroachments X Deed Restrictions X Reciprocal Parking Rights X Common Ingress/Egress X Source: Various sources compiled by CBRE 43


57 SITE ANALYSIS FLOOD MAP Subject MAIN PARCEL TAX MAP 44
58 SITE ANALYSIS CORNER OUTPARCEL TAX MAP LOT 2 INTERIOR OUTPARCEL TAX MAP LOT 4 45
59 SITE ANALYSIS INTERIOR OUTPARCEL TAX MAP LOT 5 COMMENTS The site is complete of all infrastructure and there are no known constraints on its development to its potential highest and best use. Presented below is a development plan proposed by the subject developer to accommodate approximately 70,000 square feet on the main parcel, including a Wal- Mart Neighborhood market in Spring, 2009, that did not proceed. While a center this size is not likely supported by the low density of the subject market considering current vacancy of in-line space at the nearby Publix anchored Gulf Cove Center, it s noteworthy that the subject site s density is largely constrained by parking ratio and demand rather than developable square footage per zoning. 46

60 SITE ANALYSIS Outparcel Lot 4 Outparcel Lot 2 Outparcel Lot 5 Main Parcel CONDITION ANALYSIS Our inspection of the property indicated no items of deferred maintenance. ZONING The following chart summarizes the subject s zoning requirements. 47
61 SITE ANALYSIS ZONING SUMMARY Current Zoning CG, Commercial General Legally Conforming Yes Uses Permitted Customary and traditional condust of trade, retail sales and commerce uses serving neighborhoods and community needs Zoning Change Not likely Category Zoning Requirement Minimum Lot Size 12,000 Sq. Ft. Minimum Lot Width 100 Feet Maximum Height 60 Feet Minimum Setbacks Front Yard 25 Feet Street Side Yard 20 Feet Interior Side Yard 0 Feet Rear Yard 10 Feet to lot, 25 Feet to road Maximum Bldg. Coverage 50% Parking Requirements 4 spaces / 1,000 SF of Bldg. Subject's Actual Parking 5 spaces / 1,000 SF of Bldg. Source: Charlotte County Planning & Zoning Dept. TAX ASSESSMENT DATA The following summarizes the subject s market value, assessed value, and taxes, and does not include any furniture, fixtures and equipment. AD VALOREM TAX INFORMATION Assessor's Market Value Pro Forma Kevitt Blvd $2,498,023 $1,531, McCall Road 1,102, , McCall Road 1,162, , , ,917 Subtotal $5,648,801 $3,452,517 $3,452,517 Assessed 100% 100% 100% $5,648,801 $3,452,517 $3,452,517 General Tax Rate (per $1,000 A.V.) General Tax: $85,276 $52,120 $52,120 Special Assessments: 3,553 3,553 3,553 Effective Tax Rate (per $1,000 A.V.) Total Taxes less 4% Early Payment $85,276 $55,674 $55,674 Source: Charlotte County Assessor's Office 48
62 SITE ANALYSIS Based on the foregoing, the total taxes for the subject have been estimated as $55,674 for the base year of our analysis, based upon an assessed value of $3,452,517. This is below the historical assessment; however, is considered a realistic scenario due to contraction on land values experienced across the region. The individual parcel assessments and corresponding taxes have been employed in our holding cost analysis. For purposes of this analysis CBRE assumes any outstanding property tax liability has been paid and that all taxes are current. Our review of Tax Collector records indicates there are no outstanding unpaid taxes on the subject, although we were not provided a Title report to confirm no outstanding tax liability exist. If the subject sold for the value estimate in this report, a reassessment at that value could occur. The consequences of this reassessment have been considered in the appropriate valuation sections. CONCLUSION The horizontal site improvements are considered to be in good overall condition and are considered to be functional for the location in regard to improvement design, layout, and accessibility. Overall, there are no known factors that could be considered to adversely impact the marketability of the subject. Despite the present market conditions, the site is well designed and its lay out is consistent with its most likely highest and best use. 49
63 HIGHEST AND BEST USE HIGHEST AND BEST USE In appraisal practice, the concept of highest and best use represents the premise upon which value is based. The four criteria the highest and best use must meet are: legal permissibility; physical possibility; financial feasibility; and maximum profitability. Highest and best use analysis involves assessing the subject both as if vacant and as improved. AS VACANT The property is zoned for retail use and is of sufficient size to accommodate various types of development. The immediate area includes various retail land uses. Considering the surrounding land uses, location attributes, legal restrictions and other factors, it is our opinion that a retail oriented use would be reasonable and appropriate. Therefore, it is our opinion that the highest and best use would be for retail-related use, time and circumstances warranting. AS IMPROVED As improved, the subject involves retail-oriented facility. The current use is legally permissible and physically possible. The improvements continue to contribute value to the property and based on our analysis, the existing use is financially feasible. Therefore, it is our opinion that the highest and best use of the subject, as improved, is for continued retail related use with anticipation of a holding period for future development until market conditions improve. 50
64 APPRAISAL METHODOLOGY APPRAISAL METHODOLOGY In appraisal practice, an approach to value is included or omitted based on its applicability to the property type being valued and the quality and quantity of information available. COST APPROACH The cost approach is based upon the proposition that the informed purchaser would pay no more for the subject than the cost to produce a substitute property with equivalent utility. This approach is particularly applicable when the property being appraised involves relatively new improvements that represent the highest and best use of the land, or when it is improved with relatively unique or specialized improvements for which there exist few sales or leases of comparable properties. SALES COMPARISON APPROACH The sales comparison approach utilizes sales of comparable properties, adjusted for differences, to indicate a value for the subject. Valuation is typically accomplished using physical units of comparison such as price per square foot, price per unit, price per floor, etc., or economic units of comparison such as gross rent multiplier. Adjustments are applied to the physical units of comparison derived from the comparable sale. The unit of comparison chosen for the subject is then used to yield a total value. Economic units of comparison are not adjusted, but rather analyzed as to relevant differences, with the final estimate derived based on the general comparisons. INCOME CAPITALIZATION APPROACH The income capitalization approach reflects the subject s income-producing capabilities. This approach is based on the assumption that value is created by the expectation of benefits to be derived in the future. Specifically estimated is the amount an investor would be willing to pay to receive an income stream plus reversion value from a property over a period of time. The two common valuation techniques associated with the income capitalization approach are direct capitalization and the discounted cash flow (DCF) analysis. METHODOLOGY APPLICABLE TO THE SUBJECT In valuing the subject, only the sales comparison approach was applicable and has been used. 51
 Transaction Adjusted Sale Size Price Per Price No.")
65 LAND VALUE (MAIN PARCEL) LAND VALUE (MAIN PARCEL) The following map and table summarize the comparable data used in the valuation of the subject site. A detailed description of each transaction is included in the addenda. SUMMARY OF COMPARABLE LAND SALES (MAIN PARCEL) Transaction Adjusted Sale Size Price Per Price No. Property Location Type Date Proposed Use Price 1 (SF) Acre Per SF NE Pine Island Road, Cape Coral, FL Center Road, Venice, FL Toledo Blade Road SEC Toledo Blade Rd & El Jobean Rd, Port Charlotte, FL Hancock Bridge Parkway, North Ft Myers, FL E SR 70, Bradenton, FL 6 S/S Central Sarasota Pkwy, Sarasota, FL 7 SWQ of Cochran & Veterans Blvd., Port Charlotte, FL Sale Dec-09 Future Retail/Office Site $2,200, ,688 $148,649 $3.41 Sale Dec-09 HD Supply $700, ,202 $197,740 $4.54 Sale Jun-09 Racetrac Toledo Blade $1,550, ,657 $410,053 $9.41 Sale Apr-09 Future Retail Site $742, ,776 $128,460 $2.95 Sale Nov-08 Sale Aug-08 Wal-Mart SuperCenter Lowe's Home Center $11,650, ,990 $512,088 $11.76 $14,739, ,280 $1,133,769 $26.03 Sale Jun-07 Kohl's Store $8,770, ,987 $506,690 $11.63 Subject SWC SR 776 (McCall Road) and Gulfstream Boulevard, Port Charlotte, Florida Land , Transaction amount adjusted for cash equivalency and/or development costs (where applicable) Compiled by CBRE 52
66 LAND VALUE (MAIN PARCEL) COMPARABLE SALES ANALYSIS Comparable Sale No. 1 was the purchase of a gross acre/14.8 net acre site purchased for future retail development. This parcel is situated along the north side of NE Pine Island Road, just east of Pondella Road, a prominent interchange in Cape Coral. In comparison to the subject, it was inferior with respect to size and existing site improvements at the time of purchase. Overall, this sale was considered inferior in comparison to the subject and warranted upward adjustment to its value indication. Comparable Sale No. 2 was the purchase of a 3.54 acre site for construction of a HD Supply Distribution Center. This parcel is situated along the north side of Center Road, midway between Tamiami Trail (US Hwy 41) and US 41 Bypass South, in a heavily retailed location. In comparison to the subject, it was superior with respect to size and location, while inferior with respect to lack of corner situs, frontage, zoning, and site improvements at the time of purchase. Overall, this sale was considered inferior in comparison to the subject and warranted upward adjustment to its value indication. Comparable Sale No. 3 was the purchase of a 3.78 acre site for construction of a Race Trac Petroleum. This parcel is situated at the southeast corner of El Jobean Road and Toledo Blade Boulevard, in Port Charlotte. In comparison to the subject, it was superior with respect to size, corner situs, and location, while inferior with respect to site improvements at the time of purchase. Overall, this sale was considered superior in comparison to the subject and warranted downward adjustment to its value indication. Comparable Sale No. 4 was the purchase of a 5.78 acre site purchased for future retail development. This parcel is situated at the northeast quadrant of Hancock Bridge Parkway and Palm Avenue, just west of North Cleveland Avenue (US Highway 41), in North Ft. Myers. In comparison to the subject, it was superior with respect to size, while inferior with respect to existing site improvements at the time of purchase. Overall, this sale was considered inferior in comparison to the subject and warranted upward adjustment to its value indication. Comparable Sale No. 5 was the purchase of a acre site for construction of a Wal-Mart Supercenter. This parcel is situated at the southeast quadrant of S.R. 70 and Interstate 75, near the entry to the Lakewood Ranch Community, in Bradenton. In comparison to the subject, it was superior with respect to corner situs, frontage, and location, while inferior with respect to site size and site improvements at the time of purchase. Overall, this sale was considered superior in comparison to the subject and warranted downward adjustment to its value indication. Comparable Sale No. 6 was the purchase of a 20 gross acre/13.0 net acre site for construction of a Lowe s Home Center. This parcel is situated along the south side of Sarasota Parkway, just east of 53
67 LAND VALUE (MAIN PARCEL) Tamiami Trail (US Hwy 41), near the entry to the Palmer Ranch Community, in Sarasota. In comparison to the subject, it was superior with respect to location and site improvements provided to the buyer, while inferior with respect to corner situs and frontage. Overall, this sale was considered superior in comparison to the subject and warranted downward adjustment to its value indication. Comparable Sale No. 7 was the purchase of a acre site for construction of a Kohl s anchored center. This parcel is situated at the southwest quadrant of Veterans Boulevard and Cochran Road, near the Murdock Circle trade area, in Port Charlotte. In comparison to the subject, it was superior with respect to location, while inferior with respect to site size, and site improvements at the time of purchase. Overall, this sale was considered generally similar in comparison to the subject and warranted no adjustment to its value indication. SUMMARY OF ADJUSTMENTS Based on our comparative analysis, the following chart summarizes the adjustments warranted to each comparable. LAND SALES ADJUSTMENT GRID Comparable Number Subject Transaction Type Sale Sale Sale Sale Sale Sale Sale --- Transaction Date Dec-09 Dec-09 Jun-09 Apr-09 Nov-08 Aug-08 Jun Proposed Use Future HD Supply Racetrac Future Retail Wal-Mart Lowe's Home Kohl's Store Land Retail/Office Toledo Blade Site SuperCenter Center Actual Sale Price $2,200,000 $700,000 $1,550,000 $742,500 $11,650,000 $14,739,000 $8,770, Adjusted Sale Price 1 $2,200,000 $700,000 $1,550,000 $742,500 $11,650,000 $14,739,000 $8,770, Size (Acres) Size (SF) 644, , , , , , , ,002 Price Per Acre $148,649 $197,740 $410,053 $128,460 $512,088 $1,133,769 $506, Price Per SF $3.41 $4.54 $9.41 $2.95 $11.76 $26.03 $ Price Per Unit --- Price ($ PSF) $3.41 $4.54 $9.41 $2.95 $11.76 $26.03 $11.63 Property Rights Conveyed = = = = = = = Financing Terms 1 = = = = = = = Conditions of Sale = = = = = = = Market Conditions (Time) 0% 0% -11% -14% -20% -24% -41% Subtotal $3.41 $4.54 $8.38 $2.54 $9.40 $19.78 $6.86 Size Inferior Superior Superior Superior Inferior = Inferior Shape = = = = = = = Corner = Inferior Superior = Superior Inferior = Frontage = Inferior = = Superior = = Topography = = = = = Inferior = Location = Superior Superior = Superior Superior Superior Zoning/Density = Inferior = = = = = Utilities = = = = = = = Site Improvements Inferior Inferior Inferior Inferior Inferior Superior Inferior Total Comparison Inferior Inferior Superior Inferior Superior Superior Similar Value Indication for Subject >$3.41 >$4.54 <$8.38 >$2.54 <$9.40 <$19.78 =$ Transaction amount adjusted for cash equivalency and/or development costs (where applicable) Compiled by CBRE 54
68 LAND VALUE (MAIN PARCEL) ANALYSIS Based on the preceding analysis, a value indication between $4.50 and $9.00 PSF was most supported by the comparable sales, as four of the seven sales indicated a range of values from $4.54 to less than $9.40 PSF, with the 2009 sales indicating a range from $2.54 to $8.38 PSF. In addition, we have considered the following active listings: SUMMARY OF COMPARABLE RETAIL LAND LISTINGS Transaction Adjusted Sale Size Size Price Site Name Property Location Type Date Proposed Use Price 1 (Acres) (SF) Per SF Harbour Square Plaza SWQ of Cochran & Veterans Boulevard, Port Charlotte, FL North Port Tamiami Trail, Commercial land North Port, FL Riverwood PD Site W/S El Jobean Willow Bend Rd, Port Charlotte, FL Harbour Square SWQ of Cochran & Veterans Plaza Boulevard, Port Charlotte, FL Heritage Harbour 8265 Heritage Green Way, Site Bradenton, FL Commercial Land SEQ of Toledo Blade & Woodhaven, North Port, FL Veterans Commons NWQ Veterans Blvd & Cochran Site Blvd, Port Charlotte, FL McCall Road Tract Gulfstream Blvd. SEQ of SR 776 & Gulfstream Blvd., Englewood, FL Wal-Mart NEQ of I-75 and Kings Highway, SuperCenter Pad Port Charlotte, FL McCall Road Tract SWQ McCall Rd (SR 776) & Winchester Blvd, Englewood, FL Charlotte Commons W/S Veterans Blvd, N/O Peachland Blvd, Port Charlotte, FL Listing Mar-10 Unfinished Retail Bldg Pad $4,115, ,998 $5.74 Listing Jan-10 Retail Site $2,600, ,232 $5.80 Listing Mar-10 Retail Site $2,950, ,614 $6.03 Listing Mar-10 Unfinished $1,650, ,452 $6.86 Retail Bldg Pad Listing Mar-10 Retail Site $5,500, ,840 $9.02 Listing Jan-10 Unfinished $3,995, ,165 $9.18 Retail Bldg Pad Listing Mar-10 Retail Site $5,000, ,432 $9.41 Listing Mar-10 Retail Site $1,639, ,786 $10.01 Listing Mar-10 Unfinished Retail Bldg Pad $2,400, ,266 $11.36 Listing Mar-10 Commercial $2,650, ,427 $12.96 Site Listing Mar-10 Office Bldg Pad $3,500, ,898 $ Transaction amount adjusted for cash equivalency and/or development costs (where applicable) Compiled by CBRE The active listings indicated available commercial sites priced from $5.74 to $15.63 PSF, with eight of the eleven sites available at pricing from $5.74 to $10.01 PSF, recognizing the smaller sized parcels primarily represent those listed above $10.00 PSF. As well, it s important to note most of these listings reflect sites that are not as improved as the subject site. Based on the foregoing analysis, we have concluded to a value indication of $7.50 PSF for the subject s main parcel. Holding Cost Analysis Given the anticipated absorption period estimated in the market analysis, we ve accounted for holding cost in the form of real estate taxes and lawn maintenance, as well as an appropriate discount rate to account for the opportunity cost of capital, to arrive at a value indication to a would be purchaser. 55
69 LAND VALUE (MAIN PARCEL) The Real Estate Taxes reflect 18 months of anticipated holding cost on the site prior to the sale year, based on the Tax analysis previously presented. The landscaping cost assumes a cost of $200 per cutting, twice per month, for the holding period. Discount Rate Analysis The results of the most recent Investor Surveys published by CBRE, Korpacz, and RealtyRates.com, are summarized in the following chart. DISCOUNT RATES Investment Type Rate Range Average CBRE Community Centers Class A 7.75% % 8.97% Class B 9.00% % 10.07% Class C 9.25% % 10.65% CBRE Neighborhood Centers Class A 7.75% % 8.81% Class B 8.50% % 9.40% Class C 9.50% % 10.25% Korpacz 1Q10 Strip Shopping Center National Data 7.50% % 9.58% Korpacz Development Land, 2Q09 (Most Recent) National Data 21.00% % 20.08% RealtyRates.com Developer Survey, 1Q10 National Land 10.41% % 23.28% Florida Retail Land 14.76% % 25.37% CBRE Estimate 12.50% Source: CBRE National Investor Survey & Korpacz Real Estate Investor Survey The discount rates above represent indicated rates for existing retail properties and retail development land. The higher discount rates attributable to development land accounts for market and construction risk, and also represents assets with multiple parcels likely having a much more extended holding period and risk, such as Charlotte Commons that is presently under construction. In the case of the subject, the construction risk is no longer a significant factor and the market risk is more readily identifiable given the presence of active listings and recent sales. Therefore, a discount rate at the lower aspect of the range indicated by surveys of land investors and slightly above those indicated for improved centers was considered appropriate. CONCLUSION Based on the foregoing, we ve concluded to the following estimate of market value for the subject. 56
70 LAND VALUE (MAIN PARCEL) CONCLUDED LAND VALUE (MAIN PARCEL) $ PSF Subject SF Total $7.00 x 474,002 = $3,318,014 Estimated Marketing Time 18 Months Holding Cost Taxes ($37,033) Landscaping ($5,400) Net Sale Procedes $3,280,981 Discounted Present 12.5% $2,722,668 Indicated Value: $2,720,000 PSF Land $5.74 Compiled by CBRE The subject s value indication prior to discounting for holding period/cost equates to $47 to $55 PSF for a 60K to 70K square foot improvement, and $39 to $45 PSF after adjustment for holding cost/time. As well, the indication after considering holding cost is more consistent with the most recent sales prices that reflect the intent of buyers to hold the sites for an extended period prior to development demand improves. Considering reported costs of new big box and in-line space construction, development would approach feasibility at this price level, further lending support to our value conclusion. 57

71 OUTPARCEL LAND VALUE OUTPARCEL LAND VALUES The following map and table summarizes the comparable data used in the valuation of the subject s three vacant outparcel sites. A detailed description of each transaction is included in the addenda. SUMMARY OF COMPARABLE LAND SALES (OUTPARCELS) Outparcel Transaction Actual Sale Size Price Per Price N Property Name Property Location Orientation Type Date Proposed U Price (SF) Acre Per SF 1 Cocoplum Racetrac Tamiami Trail N/S Tamiami Trail S. Cranberry, North Port, FL Corner Sale Jan-10 Retail/C-Store $1,300,000 93,228 $607,420 $ Sumter Crossing Outparcel 3 Dollar Crown Plaza 4 Daniels Crossing Outparcel 5 Price Crossing Burger King 6 Steak N' Sumter Crossing 6000 Salford Blvd., North Port, FL S. McCall Road (SR 776), Englewood, FL W/S Six Mile Cypress Pwy, S/O Daniels Pwy, Ft. Myers, FL 1071 S. Toledo Blade Boulevard W/S Toledo Blade, S/O Price Blvd, North Port, FL 4450 Sumter Crossing Dr. SWC Tamiami TL & Sumter Crossing Blvd., North Port, FL 7 CVS Site Jetport Commerce Pwy SEC Daniels Pwy & Jetport Commerce Pwy, Ft. Myers, FL Corner Contract Dec-09 Retail/Office $1,200,000 82,764 $631,579 $14.50 Corner Contract Sep-09 Dollar General Corner Sale Jul-09 Retail/Office Development $400,000 48,674 $357,974 $8.22 $900,000 64,469 $608,108 $13.96 Interior Sale Jun-09 Burger King $800,000 37,807 $921,765 $21.16 Corner Sale May-09 Restaurant $1,167,500 43,803 $1,160,998 $26.65 Corner Sale Apr-09 CVS $2,900,000 97,755 $1,292,278 $29.67 Subject SWC SR 776 (McCall Road) and Gulfstream Boulevard, Port Charlotte, Florida Interior & Corner Outparcels , Transaction amount adjusted for cash equivalency and/or development costs (where applicable) Compiled by CBRE 58
72 OUTPARCEL LAND VALUE COMPARABLE SALES ANALYSIS LOT 2 OUTPARCEL Comparable Sale No. 1 was the contract of a 2.14 acre outparcel to the Cocoplum Village Retail Center, in North Port. It was purchased for construction of a RaceTrac Petroleum. This parcel is situated on corner parcel at the northwest corner of Tamiami Trail (US Hwy 41) and Cornelius/Cranberry Road. In comparison to the subject, it was superior with respect to roadway frontage and location, while inferior with respect to site size. Overall, this comparable was considered superior in comparison to the subject and warranted downward adjustment to its value indication. Comparable Sale No. 2 was the contract of a 1.90 acre outparcel to the Sumter Crossing Retail Center, in North Port. It was purchased for construction of a office oriented use. This parcel is situated on corner parcel at the southeast corner of Tamiami Trail (US Hwy 41) and Salford Boulevard, at the entry to Sumter Crossing. In comparison to the subject, it was superior with respect to roadway frontage and location, while inferior with respect to site size. Overall, this comparable was considered superior in comparison to the subject and warranted downward adjustment to its value indication. Comparable Sale No. 3 was the contract of a 1.12 acre outparcel to the Crown Plaza Shopping Center, in Port Charlotte. It was purchased for construction of a Dollar General store. This parcel is situated on an interior outparcel facing McCall Road and is accessible via interior road system of the retail center. In comparison to the subject, it was inferior with respect to corner situs and frontage, while similar in most other respects to the subject, as it represents a contracts of an outparcel within 59
73 OUTPARCEL LAND VALUE the subject center. Overall, this comparable was considered inferior in comparison to the subject and warranted upward adjustment to its value indication. Comparable Sale No. 4 was the sale of a 1.48 acre outparcel purchased for retail/office development. This parcel is situated on a corner outparcel facing Six Mile Cypress Parkway, adjacent to the Minnesota Twins Spring Training Facility, Gulf Coast Hospital, and Daniels Crossing Shopping Center in Ft. Myers. It is accessible via an interior road. In comparison to the subject, it was inferior with respect to supporting anchor tenants, although the location has numerous traffic generators, while its location is superior to the subject. Overall, this comparable was considered similar in comparison to the subject and warranted no net adjustment to its value indication. Comparable Sale No. 5 was the contract of a 0.87 acre outparcel to the Price Crossing Shopping Center in North Port. It was purchased for construction of a Burger King restaurant. This parcel is situated on an interior outparcel facing Toledo Blade Boulevard and is accessible via interior road system of the retail center. In comparison to the subject, it was inferior with respect to corner situs, while superior with respect to site size and location. Overall, this comparable was considered superior in comparison to the subject and warranted downward net adjustment to its value indication. Comparable Sale No. 6 was the sale of a 1.01 acre outparcel to the Sumter Crossing Shopping Center in North Port. It was purchased for construction of a Steak N Shake restaurant. This parcel is situated on a corner outparcel facing Tamiami Trail and Sumter Crossing Drive, and is accessible via Adair Drive bordering the site along its southern border. In comparison to the subject, it was superior with respect to frontage and location. Overall, this comparable was considered superior in comparison to the subject and warranted downward adjustment to its value indication. Comparable Sale No. 7 was the contract of a 1.46 acre corner parcel in Port Charlotte. It was purchased for construction of a CVS Drug Store. This parcel is situated on a corner facing Tamiami Trail and Harborview Road, and is accessible via both roads. In comparison to the subject, it was superior with respect to corner situs due to the prominence of the corner, while also superior with respect to frontage and location; however, it was inferior with respect to site size. Overall, this comparable was considered superior in comparison to the subject and warranted downward adjustment to its value indication. SUMMARY OF ADJUSTMENTS Based on our comparative analysis, the following chart summarizes the adjustments warranted to each comparable. 60
74 OUTPARCEL LAND VALUE LAND SALES ADJUSTMENT GRID (LOT 2 OUTPARCEL) Comparable Number Subject Transaction Type Sale Contract Contract Sale Sale Sale Sale --- Transaction Date Jan-10 Dec-09 Sep-09 Jul-09 Jun-09 May-09 Apr Proposed Use Retail/C-Store Retail/Office Dollar Retail/Office Burger King Restaurant CVS Outparcels General Development Orientation Corner Corner Corner Corner Interior Corner Corner Corner Actual Sale Price $1,300,000 $1,200,000 $400,000 $900,000 $800,000 $1,167,500 $2,900, Adjusted Sale Price 1 $1,300,000 $1,200,000 $400,000 $900,000 $800,000 $1,167,500 $2,900, Size (Acres) Size (SF) 93,228 82,764 48,674 64,469 37,807 43,803 97,755 47,522 Price Per Acre $607,420 $631,579 $357,974 $608,108 $921,765 $1,160,998 $1,292, Price Per SF $13.94 $14.50 $8.22 $13.96 $21.16 $26.65 $ Price Per Unit --- Price ($ PSF) $13.94 $14.50 $8.22 $13.96 $21.16 $26.65 $29.67 Property Rights Conveyed = = = = = = = Financing Terms 1 = = = = = = = Conditions of Sale = = = = = = = Market Conditions 0% 0% 0% -10% -11% -13% -14% Subtotal $13.94 $14.50 $8.22 $12.56 $18.83 $23.19 $25.51 Size Inferior Inferior = = Superior = Inferior Shape = = = = = = = Corner = = Inferior = Inferior = Superior Roadway Frontage Superior Superior Inferior = = Superior Superior Topography = = = = = = = Location Superior Superior = Superior Superior Superior Superior Zoning/Density = = = = = = = Anchor Tenants = = = Inferior = = = Utilities = = = = = = = Total Comparison Superior Superior Inferior Similar Superior Superior Superior Value Indication for Subject <$13.94 <$14.50 >$8.22 =$12.56 <$18.83 <$23.19 <$ Transaction amount adjusted for cash equivalency and/or development costs (where applicable) Compiled by CBRE ANALYSIS Based on the preceding analysis, a value indication between $12.56 and $18.83 PSF was most supported by the comparable sales, with four of the seven sales indicating a range of values from $12.56 to less than $18.83 PSF. In addition, we have considered the following active outparcel listings: 61
75 OUTPARCEL LAND VALUE SUMMARY OF COMPARABLE OUTPARCEL/CORNER SITE LISTINGS Outparcel Transaction Actual Sale Size Size Price No. Center Location Property Location Orientation Type Date Proposed Use Price (Acres) (SF) Per SF 1 Charlotte Commons 2 Wal-Mart SuperCenter 3 Charlotte Commons 4 Charlotte Commons SWQ of Cochran & Veterans Boulevard, Port Charlotte, FL Murdock Circle E/S Murdock, N/O Tamiami Trail, Port Charlotte, FL NWQ of Veterans & Peachland Blvd, Port Charlotte, FL NWQ of Veterans & Peachland Blvd, Port Charlotte, FL 5 Crown Plaza McCall Road (SR 776), Englewood, FL 6 Crown Plaza McCall Road (SR 776), Englewood, FL 7 Harbor Square Plaza 8 Peachland Promenade 9 Wal-Mart SuperCenter 10 Wal-Mart SuperCenter SWQ of Cochran & Veterans Boulevard, Port Charlotte, FL Peachland Blvd, Port Charlotte, FL 555 Kings Hwy NEQ of I-75 and Kings Highway, Port Charlotte, FL 355 Kings Hwy NEQ of I-75 and Kings Highway, Port Charlotte, FL 11 Winn Dixie McCall 6440 Sunnybrook Blvd, Road Port Charlotte, FL Corner Listing Mar-10 Retail Outparcel Interior Listing Mar-10 Retail/Restaura nt Corner Listing Mar-10 Retail Outparcel Interior Listing Mar-10 Retail Outparcel $1,065, ,174 $23.06 $995, ,669 $22.27 $800, ,511 $19.75 $800, ,155 $22.13 Corner Listing Mar-10 Dollar General $750, ,522 $15.78 Interior Listing Mar-10 Dollar General $800, ,917 $12.52 Corner Listing Mar-10 Retail Outparcel Corner Listing Mar-10 Retail Outparcel Corner Listing Mar-10 Retail Outparcel $1,080, ,045 $22.96 $985, ,382 $23.80 $1,050, ,223 $21.33 Interior Listing Mar-10 Restaurant $900, ,272 $17.22 Corner Listing Mar-10 Retail Outparcel $525, ,616 $ Transaction amount adjusted for cash equivalency and/or development costs (where applicable) Compiled by CBRE The active listings indicated available outparcel sites priced from $17.22 to $23.80 PSF, which reflects a general decrease from six months prior where pricing was more concentrated in the $20-25 PSF range. As well, we note the lack of any procured sales amongst these comparables recently at or near their asking price and the decrease in the asking price of Land Comparable No. 10 to $17.22 PSF from near $22.00 PSF. Further, discussions amongst brokers indicated very little interest at the present asking prices and what interest that has been experienced has been at price levels well below asking price. We ve also considered this parcels current list price of $750,000, or $15.78 PSF, which appears reasonable relative to asking rates of other corner parcels, but is high relative to recent closed sales and current contracts, particularly when recognizing the anticipated holding period, holding cost, and appropriate discounting. Based on the foregoing analysis, we have concluded to a value indication of $14.00 PSF for the subject s Outparcel Lot 2. Holding Cost & Discount Rate Analysis We ve employed the same holding cost and discount rate analysis as the main parcel given the anticipated absorption/holding period estimated in the market analysis, and accounted for holding 62
76 OUTPARCEL LAND VALUE cost in the form of real estate taxes and lawn maintenance, as well as an appropriate discount rate to account for the opportunity cost of capital, to arrive at a value indication to a would be purchaser. The only significant difference is we ve estimated a lower cost for lawn maintenance of $100 per mowing, or $2,400 per year. The tax estimate is specific to this parcel s current assessment, while the same discount factor was employed. CONCLUSION Based on the foregoing, we ve concluded to the following estimate of market value for the subject. CONCLUDED OUTPARCEL LAND VALUE (LOT 2) $ PSF Subject SF Total $14.00 x 47,522 = $665,308 Indicated Value: $665,308 Estimated Marketing Time 18 Months Holding Cost Taxes ($16,268) Landscaping ($2,700) Net Sale Procedes $649,040 Discounted Present 12.5% $538,595 Rounded: $540,000 Compiled by CBRE 63
77 OUTPARCEL LAND VALUE COMPARABLE SALES ANALYSIS LOT 4 OUTPARCEL Comparable Sale No. 1 was the contract of a 2.14 acre outparcel to the Cocoplum Village Retail Center, in North Port. It was purchased for construction of a RaceTrac Petroleum. This parcel is situated on corner parcel at the northwest corner of Tamiami Trail (US Hwy 41) and Cornelius/Cranberry Road. In comparison to the subject, it was superior with respect to corner situs, roadway frontage and location, while inferior with respect to site size. Overall, this comparable was considered superior in comparison to the subject and warranted downward adjustment to its value indication. Comparable Sale No. 2 was the contract of a 1.90 acre outparcel to the Sumter Crossing Retail Center, in North Port. It was purchased for construction of a office oriented use. This parcel is situated on corner parcel at the southeast corner of Tamiami Trail (US Hwy 41) and Salford Boulevard, at the entry to Sumter Crossing. In comparison to the subject, it was superior with respect to corner situs, roadway frontage and location. Overall, this comparable was considered superior in comparison to the subject and warranted downward adjustment to its value indication. Comparable Sale No. 3 was the contract of a 1.12 acre outparcel to the Crown Plaza Shopping Center, in Port Charlotte. It was purchased for construction of a Dollar General store. This parcel is situated on an interior outparcel facing McCall Road and is accessible via interior road system of the retail center. In comparison to the subject, it was similar in most other respects to the subject, as it represents a contracts of an outparcel within the subject center. Overall, this comparable was 64
78 OUTPARCEL LAND VALUE considered inferior in comparison to the subject and warranted upward adjustment to its value indication. Comparable Sale No. 4 was the sale of a 1.48 acre outparcel purchased for retail/office development. This parcel is situated on a corner outparcel facing Six Mile Cypress Parkway, adjacent to the Minnesota Twins Spring Training Facility, Gulf Coast Hospital, and Daniels Crossing Shopping Center in Ft. Myers. It is accessible via an interior road. In comparison to the subject, it was inferior with respect to supporting anchor tenants, although the location has numerous traffic generators and was deemed superior with respect to its corner situs and location relative to the subject. Overall, this comparable was considered superior in comparison to the subject and warranted a downward adjustment to its value indication. Comparable Sale No. 5 was the contract of a 0.87 acre outparcel to the Price Crossing Shopping Center in North Port. It was purchased for construction of a Burger King restaurant. This parcel is situated on an interior outparcel facing Toledo Blade Boulevard and is accessible via interior road system of the retail center. In comparison to the subject, it was superior with respect to location. Overall, this comparable was considered superior in comparison to the subject and warranted downward adjustment to its value indication. Comparable Sale No. 6 was the sale of a 1.01 acre outparcel to the Sumter Crossing Shopping Center in North Port. It was purchased for construction of a Steak N Shake restaurant. This parcel is situated on a corner outparcel facing Tamiami Trail and Sumter Crossing Drive, and is accessible via Adair Drive bordering the site along its southern border. In comparison to the subject, it was superior with respect to corner situs, frontage, and location. Overall, this comparable was considered superior in comparison to the subject and warranted downward adjustment to its value indication. Comparable Sale No. 7 was the contract of a 1.46 acre corner parcel in Port Charlotte. It was purchased for construction of a CVS Drug Store. This parcel is situated on a corner facing Tamiami Trail and Harborview Road, and is accessible via both roads. In comparison to the subject, it was superior with respect to corner situs, frontage, and location. Overall, this comparable was considered superior in comparison to the subject and warranted downward adjustment to its value indication. SUMMARY OF ADJUSTMENTS Based on our comparative analysis, the following chart summarizes the adjustments warranted to each comparable. 65
79 OUTPARCEL LAND VALUE LAND SALES ADJUSTMENT GRID (LOT 4 OUTPARCEL) Comparable Number Subject Transaction Type Sale Contract Contract Sale Sale Sale Sale --- Transaction Date Jan-10 Dec-09 Sep-09 Jul-09 Jun-09 May-09 Apr Proposed Use Retail/C-Store Retail/Office Dollar Retail/Office Burger King Restaurant CVS Outparcels General Development Orientation Corner Corner Corner Corner Interior Corner Corner Actual Sale Price $1,300,000 $1,200,000 $400,000 $900,000 $800,000 $1,167,500 $2,900, Adjusted Sale Price 1 $1,300,000 $1,200,000 $400,000 $900,000 $800,000 $1,167,500 $2,900, Size (Acres) Size (SF) 93,228 82,764 48,674 64,469 37,807 43,803 97,755 63,917 Price Per Acre $607,420 $631,579 $357,974 $608,108 $921,765 $1,160,998 $1,292, Price Per SF $13.94 $14.50 $8.22 $13.96 $21.16 $26.65 $ Price Per Unit --- Price ($ PSF) $13.94 $14.50 $8.22 $13.96 $21.16 $26.65 $29.67 Property Rights Conveyed = = = = = = = Financing Terms 1 = = = = = = = Conditions of Sale = = = = = = = Market Conditions 0% 0% 0% -10% -11% -13% -14% Subtotal $13.94 $14.50 $8.22 $12.56 $18.83 $23.19 $25.51 Size Inferior = = = Superior = Inferior Shape = = = = = = = Corner Superior Superior = Superior = Superior Superior Roadway Frontage Superior Superior = = = Superior Superior Topography = = = = = = = Location Superior Superior = Superior Superior Superior Superior Zoning/Density = = = = = = = Anchor Tenants = = = Inferior = = = Utilities = = = = = = = Total Comparison Superior Superior Similar Superior Superior Superior Superior Value Indication for Subject <$13.94 <$14.50 =$8.22 <$12.56 <$18.83 <$23.19 <$ Transaction amount adjusted for cash equivalency and/or development costs (where applicable) Compiled by CBRE ANALYSIS Based on the preceding analysis, a value indication between $12.56 and $18.83 PSF was most supported by the comparable sales, with four of the seven sales indicating a range of values from $12.56 to less than $18.83 PSF. In addition, we ve given consideration toward Comparable No. 3, which reflects a current contract on the neighboring parcel, recognizing the seller is somewhat distressed and the sale is net of our anticipated holding period to procure a sale. In addition, we have considered the following active outparcel listings: 66
80 OUTPARCEL LAND VALUE SUMMARY OF COMPARABLE OUTPARCEL/CORNER SITE LISTINGS Outparcel Transaction Actual Sale Size Size Price No. Center Location Property Location Orientation Type Date Proposed Use Price (Acres) (SF) Per SF 1 Charlotte Commons 2 Wal-Mart SuperCenter 3 Charlotte Commons 4 Charlotte Commons SWQ of Cochran & Veterans Boulevard, Port Charlotte, FL Murdock Circle E/S Murdock, N/O Tamiami Trail, Port Charlotte, FL NWQ of Veterans & Peachland Blvd, Port Charlotte, FL NWQ of Veterans & Peachland Blvd, Port Charlotte, FL 5 Crown Plaza McCall Road (SR 776), Englewood, FL 6 Crown Plaza McCall Road (SR 776), Englewood, FL 7 Harbor Square Plaza 8 Peachland Promenade 9 Wal-Mart SuperCenter 10 Wal-Mart SuperCenter SWQ of Cochran & Veterans Boulevard, Port Charlotte, FL Peachland Blvd, Port Charlotte, FL 555 Kings Hwy NEQ of I-75 and Kings Highway, Port Charlotte, FL 355 Kings Hwy NEQ of I-75 and Kings Highway, Port Charlotte, FL 11 Winn Dixie McCall 6440 Sunnybrook Blvd, Road Port Charlotte, FL Corner Listing Mar-10 Retail Outparcel Interior Listing Mar-10 Retail/Restaura nt Corner Listing Mar-10 Retail Outparcel Interior Listing Mar-10 Retail Outparcel $1,065, ,174 $23.06 $995, ,669 $22.27 $800, ,511 $19.75 $800, ,155 $22.13 Corner Listing Mar-10 Dollar General $750, ,522 $15.78 Interior Listing Mar-10 Dollar General $800, ,917 $12.52 Corner Listing Mar-10 Retail Outparcel Corner Listing Mar-10 Retail Outparcel Corner Listing Mar-10 Retail Outparcel $1,080, ,045 $22.96 $985, ,382 $23.80 $1,050, ,223 $21.33 Interior Listing Mar-10 Restaurant $900, ,272 $17.22 Corner Listing Mar-10 Retail Outparcel $525, ,616 $ Transaction amount adjusted for cash equivalency and/or development costs (where applicable) Compiled by CBRE The active listings indicated available outparcel sites priced from $17.22 to $23.80 PSF, which reflects a general decrease from six months prior where pricing was more concentrated in the $20-25 PSF range. As well, we note the lack of any procured sales amongst these comparables recently at or near their asking price and the decrease in the asking price of Land Comparable No. 10 to $17.22 PSF from near $22.00 PSF. Further, discussions amongst brokers indicated very little interest at the present asking prices and what interest that has been experienced has been at price levels well below asking price. We ve also considered this parcels current list price of $800,000, or $12.52 PSF, which in our opinion appears to be at the upper aspect of the range for this parcel given its physical characteristics while also recognizing the extended holding period, holding cost, and appropriate discounting. Based on the foregoing analysis, we have concluded to a value indication of $10.50 PSF for the subject s Outparcel Lot 4 parcel. Holding Cost & Discount Rate Analysis We ve employed the same holding cost and discount rate analysis as the main parcel given the anticipated absorption/holding period estimated in the market analysis, and accounted for holding 67
81 OUTPARCEL LAND VALUE cost in the form of real estate taxes and lawn maintenance, as well as an appropriate discount rate to account for the opportunity cost of capital, to arrive at a value indication to a would be purchaser. The only significant difference is we ve estimated a lower cost for lawn maintenance of $100 per mowing, or $2,400 per year. The tax estimate is specific to this parcel s current assessment, while the same discount factor was employed. CONCLUSION Based on the foregoing, we ve concluded to the following estimate of market value for the subject: CONCLUDED OUTPARCEL LAND VALUE (LOT 4) $ PSF Subject SF Total $10.50 x 63,917 = $671,129 Indicated Value: $671,129 Estimated Marketing Time 18 Months Holding Cost Taxes ($17,149) Landscaping ($2,700) Net Sale Procedes $653,979 Discounted Present 12.5% $542,694 Rounded: $540,000 Compiled by CBRE 68

82 OUTPARCEL LAND VALUE COMPARABLE SALES ANALYSIS LOT 5 OUTPARCEL We ve also considered this parcels rent contract price of $400,000, or $8.22 PSF, which in our opinion appears to be the lower aspect of the range for this parcel given its physical characteristics while also recognizing the extended holding period, holding cost, and appropriate discounting. Based on the foregoing analysis, we have concluded to a value indication of $10.50 PSF for the subject s Outparcel Lot 5 parcel. Holding Cost & Discount Rate Analysis We ve employed the same holding cost and discount rate analysis as the main parcel given the anticipated absorption/holding period estimated in the market analysis, and accounted for holding cost in the form of real estate taxes and lawn maintenance, as well as an appropriate discount rate to account for the opportunity cost of capital, to arrive at a value indication to a would be purchaser. The only significant difference is we ve estimated a lower cost for lawn maintenance of $100 per mowing, or $2,400 per year. The tax estimate is specific to this parcel s current assessment, while the same discount factor was employed. CONCLUSION Based on the foregoing, we ve concluded to the following estimate of market value for the subject: 69
83 OUTPARCEL LAND VALUE CONCLUDED OUTPARCEL LAND VALUE (LOT 5) $ PSF Subject SF Total $10.50 x 48,674 = $511,077 Indicated Value: $511,077 Estimated Marketing Time 18 Months Holding Cost Taxes ($13,060) Landscaping ($2,700) Net Sale Procedes $498,017 Discounted Present 12.5% $413,271 Rounded: $410,000 Compiled by CBRE 70
84 RECONCILIATION OF VALUE RECONCILIATION OF VALUE The value indications from the approaches to value are summarized as follows: SUMMARY OF VALUE CONCLUSIONS As Is on March 3, 2010 Land Value - Main Parcel $2,720,000 Land Value - Outparcel Lot 2 $540,000 Land Value - Outparcel Lot 4 $540,000 Land Value - Outparcel Lot 5 $410,000 Compiled by CBRE In valuing the subject, the Sales Comparison Approach is considered most reliable when sufficient sales and listing activity is available to support the actions of buyers and sellers in the market. There was sufficient market activity to support our value conclusions. When necessary, the Cost and Income Capitalization Approaches to value can be employed to derive a residual lot value. However, in the case of the subject, there were ample sales available such that this method would not have provided a more valid conclusion. Based on the foregoing, the market value of the subject has been concluded as follows: MARKET VALUE CONCLUSION Appraisal Premise Interest Appraised Date of Value Value Conclusions As Is - Main Parcel Fee Simple Estate March 3, 2010 $2,720,000 As Is - Outparcel Lot 2 Fee Simple Estate March 3, 2010 $540,000 As Is - Outparcel Lot 4 Fee Simple Estate March 3, 2010 $540,000 As Is - Outparcel Lot 5 Fee Simple Estate March 3, 2010 $410,000 Compiled by CBRE 71
85 ASSUMPTIONS AND LIMITING CONDITIONS ASSUMPTIONS AND LIMITING CONDITIONS 1. Unless otherwise specifically noted in the body of the report, it is assumed that title to the property or properties appraised is clear and marketable and that there are no recorded or unrecorded matters or exceptions to title that would adversely affect marketability or value. CBRE is not aware of any title defects nor has it been advised of any unless such is specifically noted in the report. CBRE, however, has not examined title and makes no representations relative to the condition thereof. Documents dealing with liens, encumbrances, easements, deed restrictions, clouds and other conditions that may affect the quality of title have not been reviewed. Insurance against financial loss resulting in claims that may arise out of defects in the subject s title should be sought from a qualified title company that issues or insures title to real property. 2. Unless otherwise specifically noted in the body of this report, it is assumed: that the existing improvements on the property or properties being appraised are structurally sound, seismically safe and code conforming; that all building systems (mechanical/electrical, HVAC, elevator, plumbing, etc.) are in good working order with no major deferred maintenance or repair required; that the roof and exterior are in good condition and free from intrusion by the elements; that the property or properties have been engineered in such a manner that the improvements, as currently constituted, conform to all applicable local, state, and federal building codes and ordinances. CBRE professionals are not engineers and are not competent to judge matters of an engineering nature. CBRE has not retained independent structural, mechanical, electrical, or civil engineers in connection with this appraisal and, therefore, makes no representations relative to the condition of improvements. Unless otherwise specifically noted in the body of the report: no problems were brought to the attention of CBRE by ownership or management; CBRE inspected less than 100% of the entire interior and exterior portions of the improvements; and CBRE was not furnished any engineering studies by the owners or by the party requesting this appraisal. If questions in these areas are critical to the decision process of the reader, the advice of competent engineering consultants should be obtained and relied upon. It is specifically assumed that any knowledgeable and prudent purchaser would, as a precondition to closing a sale, obtain a satisfactory engineering report relative to the structural integrity of the property and the integrity of building systems. Structural problems and/or building system problems may not be visually detectable. If engineering consultants retained should report negative factors of a material nature, or if such are later discovered, relative to the condition of improvements, such information could have a substantial negative impact on the conclusions reported in this appraisal. Accordingly, if negative findings are reported by engineering consultants, CBRE reserves the right to amend the appraisal conclusions reported herein. 3. Unless otherwise stated in this report, the existence of hazardous material, which may or may not be present on the property was not observed by the appraisers. CBRE has no knowledge of the existence of such materials on or in the property. CBRE, however, is not qualified to detect such substances. The presence of substances such as asbestos, urea formaldehyde foam insulation, contaminated groundwater or other potentially hazardous materials may affect the value of the property. The value estimate is predicated on the assumption that there is no such material on or in the property that would cause a loss in value. No responsibility is assumed for any such conditions, or for any expertise or engineering knowledge required to discover them. The client is urged to retain an expert in this field, if desired. We have inspected, as thoroughly as possible by observation, the land; however, it was impossible to personally inspect conditions beneath the soil. Therefore, no representation is made as to these matters unless specifically considered in the appraisal. 4. All furnishings, equipment and business operations, except as specifically stated and typically considered as part of real property, have been disregarded with only real property being considered in the report unless otherwise stated. Any existing or proposed improvements, on or off-site, as well as any alterations or repairs considered, are assumed to be completed in a workmanlike manner according to standard practices based upon the information submitted to CBRE This report may be subject to amendment upon re-inspection of the subject subsequent to repairs, modifications, alterations and completed new construction. Any estimate of Market Value is as of the date indicated; based upon the information, conditions and projected levels of operation. 5. It is assumed that all factual data furnished by the client, property owner, owner s representative, or persons designated by the client or owner to supply said data are accurate and correct unless otherwise specifically noted in the appraisal report. Unless otherwise specifically noted in the appraisal report, CBRE has no reason to believe that any of the data furnished contain any material error. Information and data referred to in this paragraph include, without being limited to, numerical street addresses, lot and block numbers, Assessor s Parcel Numbers, land dimensions, square footage area of the land, dimensions of the improvements, gross building areas, net rentable areas, usable areas, unit count, room count, rent schedules, income data, historical operating expenses, budgets, and related data. Any material error in any of the above data could have a substantial impact on the conclusions reported. Thus, CBRE reserves the right to amend conclusions reported if made aware of any such error. Accordingly, the client-addressee should carefully review 72
86 ASSUMPTIONS AND LIMITING CONDITIONS all assumptions, data, relevant calculations, and conclusions within 30 days after the date of delivery of this report and should immediately notify CBRE of any questions or errors. 6. The date of value to which any of the conclusions and opinions expressed in this report apply, is set forth in the Letter of Transmittal. Further, that the dollar amount of any value opinion herein rendered is based upon the purchasing power of the American Dollar on that date. This appraisal is based on market conditions existing as of the date of this appraisal. Under the terms of the engagement, we will have no obligation to revise this report to reflect events or conditions which occur subsequent to the date of the appraisal. However, CBRE will be available to discuss the necessity for revision resulting from changes in economic or market factors affecting the subject. 7. CBRE assumes no private deed restrictions, limiting the use of the subject in any way. 8. Unless otherwise noted in the body of the report, it is assumed that there are no mineral deposit or subsurface rights of value involved in this appraisal, whether they be gas, liquid, or solid. Nor are the rights associated with extraction or exploration of such elements considered unless otherwise stated in this appraisal report. Unless otherwise stated it is also assumed that there are no air or development rights of value that may be transferred. 9. CBRE is not aware of any contemplated public initiatives, governmental development controls, or rent controls that would significantly affect the value of the subject. 10. The estimate of Market Value, which may be defined within the body of this report, is subject to change with market fluctuations over time. Market value is highly related to exposure, time promotion effort, terms, motivation, and conclusions surrounding the offering. The value estimate(s) consider the productivity and relative attractiveness of the property, both physically and economically, on the open market. 11. Any cash flows included in the analysis are forecasts of estimated future operating characteristics are predicated on the information and assumptions contained within the report. Any projections of income, expenses and economic conditions utilized in this report are not predictions of the future. Rather, they are estimates of current market expectations of future income and expenses. The achievement of the financial projections will be affected by fluctuating economic conditions and is dependent upon other future occurrences that cannot be assured. Actual results may vary from the projections considered herein. CBRE does not warrant these forecasts will occur. Projections may be affected by circumstances beyond the current realm of knowledge or control of CBRE 12. Unless specifically set forth in the body of the report, nothing contained herein shall be construed to represent any direct or indirect recommendation of CBRE to buy, sell, or hold the properties at the value stated. Such decisions involve substantial investment strategy questions and must be specifically addressed in consultation form. 13. Also, unless otherwise noted in the body of this report, it is assumed that no changes in the present zoning ordinances or regulations governing use, density, or shape are being considered. The property is appraised assuming that all required licenses, certificates of occupancy, consents, or other legislative or administrative authority from any local, state, nor national government or private entity or organization have been or can be obtained or renewed for any use on which the value estimates contained in this report is based, unless otherwise stated. 14. This study may not be duplicated in whole or in part without the specific written consent of CBRE nor may this report or copies hereof be transmitted to third parties without said consent, which consent CBRE reserves the right to deny. Exempt from this restriction is duplication for the internal use of the client-addressee and/or transmission to attorneys, accountants, or advisors of the client-addressee. Also exempt from this restriction is transmission of the report to any court, governmental authority, or regulatory agency having jurisdiction over the party/parties for whom this appraisal was prepared, provided that this report and/or its contents shall not be published, in whole or in part, in any public document without the express written consent of CBRE which consent CBRE reserves the right to deny. Finally, this report shall not be advertised to the public or otherwise used to induce a third party to purchase the property or to make a sale or offer for sale of any security, as such terms are defined and used in the Securities Act of 1933, as amended. Any third party, not covered by the exemptions herein, who may possess this report, is advised that they should rely on their own independently secured advice for any decision in connection with this property. CBRE shall have no accountability or responsibility to any such third party. 15. Any value estimate provided in the report applies to the entire property, and any pro ration or division of the title into fractional interests will invalidate the value estimate, unless such pro ration or division of interests has been set forth in the report. 16. The distribution of the total valuation in this report between land and improvements applies only under the existing program of utilization. Component values for land and/or buildings are not intended to be used in conjunction with any other property or appraisal and are invalid if so used. 73
87 ASSUMPTIONS AND LIMITING CONDITIONS 17. The maps, plats, sketches, graphs, photographs and exhibits included in this report are for illustration purposes only and are to be utilized only to assist in visualizing matters discussed within this report. Except as specifically stated, data relative to size or area of the subject and comparable properties has been obtained from sources deemed accurate and reliable. None of the exhibits are to be removed, reproduced, or used apart from this report. 18. No opinion is intended to be expressed on matters which may require legal expertise or specialized investigation or knowledge beyond that customarily employed by real estate appraisers. Values and opinions expressed presume that environmental and other governmental restrictions/conditions by applicable agencies have been met, including but not limited to seismic hazards, flight patterns, decibel levels/noise envelopes, fire hazards, hillside ordinances, density, allowable uses, building codes, permits, licenses, etc. No survey, engineering study or architectural analysis has been made known to CBRE unless otherwise stated within the body of this report. If the Consultant has not been supplied with a termite inspection, survey or occupancy permit, no responsibility or representation is assumed or made for any costs associated with obtaining same or for any deficiencies discovered before or after they are obtained. No representation or warranty is made concerning obtaining these items. CBRE assumes no responsibility for any costs or consequences arising due to the need, or the lack of need, for flood hazard insurance. An agent for the Federal Flood Insurance Program should be contacted to determine the actual need for Flood Hazard Insurance. 19. Acceptance and/or use of this report constitutes full acceptance of the Contingent and Limiting Conditions and special assumptions set forth in this report. It is the responsibility of the Client, or client s designees, to read in full, comprehend and thus become aware of the aforementioned contingencies and limiting conditions. Neither the Appraiser nor CBRE assumes responsibility for any situation arising out of the Client s failure to become familiar with and understand the same. The Client is advised to retain experts in areas that fall outside the scope of the real estate appraisal/consulting profession if so desired. 20. CBRE assumes that the subject analyzed herein will be under prudent and competent management and ownership; neither inefficient or super-efficient. 21. It is assumed that there is full compliance with all applicable federal, state, and local environmental regulations and laws unless noncompliance is stated, defined and considered in the appraisal report. 22. No survey of the boundaries of the property was undertaken. All areas and dimensions furnished are presumed to be correct. It is further assumed that no encroachments to the realty exist. 23. The Americans with Disabilities Act (ADA) became effective January 26, Notwithstanding any discussion of possible readily achievable barrier removal construction items in this report, CBRE has not made a specific compliance survey and analysis of this property to determine whether it is in conformance with the various detailed requirements of the ADA. It is possible that a compliance survey of the property together with a detailed analysis of the requirements of the ADA could reveal that the property is not in compliance with one or more of the requirements of the ADA. If so, this fact could have a negative effect on the value estimated herein. Since CBRE has no specific information relating to this issue, nor is CBRE qualified to make such an assessment, the effect of any possible non-compliance with the requirements of the ADA was not considered in estimating the value of the subject. 24. Client shall not indemnify Appraiser or hold Appraiser harmless unless and only to the extent that the Client misrepresents, distorts, or provides incomplete or inaccurate appraisal results to others, which acts of the Client approximately result in damage to Appraiser. Notwithstanding the foregoing, Appraiser shall have no obligation under this Section with respect to any loss that is caused solely by the active negligence or willful misconduct of a Client and is not contributed to by any act or omission (including any failure to perform any duty imposed by law) by Appraiser. Client shall indemnify and hold Appraiser harmless from any claims, expenses, judgments or other items or costs arising as a result of the Client's failure or the failure of any of the Client's agents to provide a complete copy of the appraisal report to any third party. In the event of any litigation between the parties, the prevailing party to such litigation shall be entitled to recover, from the other, reasonable attorney fees and costs. 25. The report is for the sole use of the client; however, client may provide only complete, final copies of the appraisal report in its entirety (but not component parts) to third parties who shall review such reports in connection with loan underwriting or securitization efforts. Appraiser is not required to explain or testify as to appraisal results other than to respond to the client for routine and customary questions. Please note that our consent to allow an appraisal report prepared by CBRE or portions of such report, to become part of or be referenced in any public offering, the granting of such consent will be at our sole discretion and, if given, will be on condition that we will be provided with an Indemnification Agreement and/or Non-Reliance letter, in a form and content satisfactory to us, by a party satisfactory to us. We do consent to your submission of the reports to rating agencies, loan participants or your auditors in its entirety (but not component parts) without the need to provide us with an Indemnification Agreement and/or Non-Reliance letter. 74
88 ASSUMPTIONS AND LIMITING CONDITIONS 26. As part of the client s requested scope of work, an estimate of insurable value is provided herein. CBRE has followed traditional appraisal standards to develop a reasonable calculation based upon industry practices and industry accepted publications such as the Marshal Valuation Service handbook. The methodology employed is a derivation of the cost approach which is primarily used as an academic exercise to help support the market value estimate and therefore is not reliable for Insurable Value estimates. Actual construction costs and related estimates can vary greatly from this estimate. This analysis should not be relied upon to determine proper insurance coverage which can only be properly estimated by consultants considered experts in cost estimation and insurance underwriting. It is provided to aid the client/reader/user as part of their overall decision making process and no representations or warranties are made by CBRE regarding the accuracy of this estimate and it is strongly recommend that other sources be utilized to develop any estimate of insurable value. 75
89 ADDENDA
90 ADDENDUM A GLOSSARY OF TERMS
91 assessed value Assessed value applies in ad valorem taxation and refers to the value of a property according to the tax rolls. Assessed value may not conform to market value, but it is usually calculated in relation to a market value base. cash equivalency The procedure in which the sale prices of comparable properties sold with atypical financing are adjusted to reflect typical market terms. contract rent The actual rental income specified in a lease. disposition value The most probable price which a specified interest in real property is likely to bring under all of the following conditions: 1) Consummation of a sale will occur within a limited future marketing period specified by the client; 2) The actual market conditions currently prevailing are those to which the appraised property interest is subject; 3) The buyer and seller is each acting prudently and knowledgeably; 4) The seller is under compulsion to sell; 5) The buyer is typically motivated; 6) Both parties are acting in what they consider their best interests; 7) An adequate marketing effort will be made in the limited time allowed for the completion of a sale; 8) Payment will be made in cash in U.S. dollars or in terms of financial arrangements comparable thereto; and 9) The price represents the normal consideration for the property sold, unaffected by special or creative financing or sales concessions granted by anyone associated with the sale. effective rent The rental rate net of financial concessions such as periods of no rent during the lease term; may be calculated on a discounted basis, reflecting the time value of money, or on a simple, straight-line basis. excess land In regard to an improved site, the land not needed to serve or support the existing improvement. In regard to a vacant site or a site considered as though vacant, the land not needed to accommodate the site s primary highest and best use. Such land may be separated from the larger site and have its own highest and best use, or it may allow for future expansion of the existing or anticipated improvement. See also surplus land. extraordinary assumption An assumption directly related to a specific assignment, which, if found to be false, could alter the appraiser s opinions or conclusions. Extraordinary assumptions presume as fact otherwise uncertain information about physical, legal, or economic characteristics of the subject property; or about conditions external to the property such as market conditions or trends; or about the integrity of data used in an analysis. See also hypothetical condition. fee simple estate Absolute ownership unencumbered by any other interest or estate, subject only to the limitations imposed by the governmental powers of taxation, eminent domain, police power, and escheat. floor area ratio (FAR) The relationship between the above-ground floor area of a building, as described by the building code, and the area of the plot on which it stands; in planning and zoning, often expressed as a decimal, e.g., a ratio of 2.0 indicates that the permissible floor area of a building is twice the total land area; also called building-to-land ratio. full service lease A lease in which rent covers all operating expenses. Typically, full service leases are combined with an expense stop, the expense level covered by the contract lease payment. Increases in expenses above the expense stop level are passed through to the tenant and are known as expense passthroughs. going concern value Going concern value is the value of a proven property operation. It includes the incremental value associated with the business concern, which is distinct from the value of the real estate only. Going concern value includes an intangible enhancement of the value of an operating business enterprise which is produced by the assemblage of the land, building, labor, equipment, and marketing operation. This process creates an economically viable business that is expected to continue. Going concern value refers to the total value of a property, including both real property and intangible personal property attributed to the business value. gross building area (GBA) The total floor area of a building, including below-grade space but excluding unenclosed areas, measured from the exterior of the walls. Gross building area for office buildings is computed by measuring to the outside finished surface of permanent outer building walls without any deductions. All enclosed floors of the building including basements, mechanical equipment floors, penthouses, and the like are included in the measurement. Parking spaces and parking garages are excluded. hypothetical condition That which is contrary to what exists but is supposed for the purpose of analysis. Hypothetical conditions assume conditions contrary to known facts about physical, legal, or economic characteristics of the subject property; or about conditions external to the property, such as market conditions or trends; or about the integrity of data used in an analysis. See also extraordinary assumption. insurable value Insurable Value is based on the replacement and/or reproduction cost of physical items that are subject to loss from hazards. Insurable value is that portion of the value of an asset or asset group that is
92 acknowledged or recognized under the provisions of an applicable loss insurance policy. This value is often controlled by state law and varies from state to state. investment value Investment value is the value of an investment to a particular investor based on his or her investment requirements. In contrast to market value, investment value is value to an individual, not value in the marketplace. Investment value reflects the subjective relationship between a particular investor and a given investment. When measured in dollars, investment value is the price an investor would pay for an investment in light of its perceived capacity to satisfy his or her desires, needs, or investment goals. To estimate investment value, specific investment criteria must be known. Criteria to evaluate a real estate investment are not necessarily set down by the individual investor; they may be established by an expert on real estate and its value, that is, an appraiser. leased fee See leased fee estate leased fee estate An ownership interest held by a landlord with the right of use and occupancy conveyed by lease to others. The rights of the lessor (the leased fee owner) and the leased fee are specified by contract terms contained within the lease. leasehold See leasehold estate leasehold estate The interest held by the lessee (the tenant or renter) through a lease conveying the rights of use and occupancy for a stated term under certain conditions. liquidation value The most probable price which a specified interest in real property is likely to bring under all of the following conditions: 1) Consummation of a sale will occur within a severely limited future marketing period specified by the client; 2) The actual market conditions currently prevailing are those to which the appraised property interest is subject; 3) The buyer is acting prudently and knowledgeably; 4) The seller is under extreme compulsion to sell; 5) The buyer is typically motivated; 6) The buyer is acting in what he or she considers his or her best interests; 7) A limited marketing effort and time will be allowed for the completion of a sale; 8) Payment will be made in cash in U.S. dollars or in terms of financial arrangements comparable thereto; and 9) The price represents the normal consideration for the property sold, unaffected by special or creative financing or sales concessions granted by anyone associated with the sale. market rent The most probable rent that a property should bring in a competitive and open market reflecting all conditions and restrictions of the specified lease agreement including term, rental adjustment and revaluation, permitted uses, use restrictions, and expense obligations; the lessee and lessor each acting prudently and knowledgeably, and assuming consummation of a lease contract as of a specified date and the passing of the leasehold from lessor to lessee under conditions whereby: 1) lessee and lessor are typically motivated; 2) both parties are well informed or well advised, and acting in what they consider their best interests; 3) a reasonable time is allowed for exposure in the open market; 4) the rent payment is made in terms of cash in U.S. dollars and is expressed as an amount per time period consistent with the payment schedule of the lease contract; and 5) the rental amount represents the normal consideration for the property leased unaffected by special fees or concessions granted by anyone associated with the transaction. market value Market value is one of the central concepts of the appraisal practice. Market value is differentiated from other types of value in that it is created by the collective patterns of the market. Market value means the most probable price which a property should bring in a competitive and open market under all conditions requisite to a fair sale, the buyer and seller each acting prudently and knowledgeably, and assuming the price is not affected by undue stimulus. Implicit in this definition is the consummation of a sale as of a specified date and the passing of title from seller to buyer under conditions whereby: 1) A reasonable time is allowed for exposure in the open market; 2) Both parties are well informed or well advised, and acting in what they consider their own best interests; 3) Buyer and seller are typically motivated; 4) Payment is made in terms of cash in U.S. dollars or in terms of financial arrangements comparable thereto; and 5) The price represents the normal consideration for the property sold unaffected by special or creative financing or sales concessions granted by anyone associated with the sale. marketing period The time it takes an interest in real property to sell on the market subsequent to the date of an appraisal. net lease Lease in which all or some of the operating expenses are paid directly by the tenant. The landlord never takes possession of the expense payment. In a Triple Net Lease all operating expenses are the responsibility of the tenant, including property taxes, insurance, interior maintenance, and other miscellaneous expenses. However, management fees and exterior maintenance are often the responsibility of the lessor in a triple net lease. A modified net lease is one in which some expenses are paid separately by the tenant and some are included in the rent. net rentable area (NRA) 1) The area on which rent is computed. 2) The Rentable Area of a floor shall be
93 computed by measuring to the inside finished surface of the dominant portion of the permanent outer building walls, excluding any major vertical penetrations of the floor. No deductions shall be made for columns and projections necessary to the building. Include space such as mechanical room, janitorial room, restrooms, and lobby of the floor. * occupancy rate The relationship or ratio between the income received from the rented units in a property and the income that would be received if all the units were occupied. prospective value opinion A forecast of the value expected at a specified future date. A prospective value opinion is most frequently sought in connection with real estate projects that are proposed, under construction, or under conversion to a new us, or those that have not achieved sellout or a stabilized level of long-term occupancy at the time the appraisal report is written. reasonable exposure time The estimated length of time the property interest being appraised would have been offered on the market prior to the hypothetical consummation of a sale at market value on the effective date of the appraisal; a retrospective opinion based upon an analysis of past events assuming a competitive and open market. rent See full service lease net lease market rent contract, coupon, face, or nominal rent effective rent completes the interior finish, which can include wall, ceiling, and floor finishes; mechanical systems, interior electric, and plumbing. Typically these are long-term leases with tenants paying all or most property expenses. surplus land Land not necessary to support the highest and best use of the existing improvement but, because of physical limitations, building placement, or neighborhood norms, cannot be sold off separately. Such land may or may not contribute positively to value and may or may not accommodate future expansion of an existing or anticipated improvement. See also excess land. usable area 1) The area actually used by individual tenants. 2) The Usable Area of an office building is computed by measuring to the finished surface of the office side of corridor and other permanent walls, to the center of partitions that separate the office from adjoining usable areas, and to the inside finished surface of the dominant portion of the permanent outer building walls. Excludes areas such as mechanical rooms, janitorial room, restrooms, lobby, and any major vertical penetrations of a multi-tenant floor. * use value Use value is a concept based on the productivity of an economic good. Use value is the value a specific property has for a specific use. Use value focuses on the value the real estate contributes to the enterprise of which it is a part, without regard to the property s highest and best use or the monetary amount that might be realized upon its sale. value indication An opinion of value derived through application of the appraisal process. shell rent The typical rent paid for retail, office, or industrial tenant space based on minimal shell interior finishes (called plain vanilla finish in some areas). Usually the landlord delivers the main building shell space or some minimum level of interior build-out, and the tenant The Appraisal of Real Estate, Twelfth Edition, Appraisal Institute, The Dictionary of Real Estate Appraisal, Fourth Edition, Appraisal Institute, * 2000 BOMA Experience Exchange Report, Income/Expense Analysis for Office Buildings (Building Owners and Managers Association, 2000) Statement on Appraisal Standard No. 6, Appraisal Standards Board of The Appraisal Foundation, September 16, 1993, revised June 15, Office of Comptroller of the Currency (OCC), 12 CFR Part 34, Subpart C Appraisals, (g); Office of Thrift Supervision (OTS), 12 CFR (g); Appraisal Institute, The Dictionary of Real Estate Appraisal, 4 th ed. (Chicago: Appraisal Institute, 2002), This is also compatible with the RTC, FDIC, FRS and NCUA definitions of market value as well as the example referenced in the Uniform Standards of Professional Appraisal Practice (USPAP).
94 ADDENDUM B LAND SALE DATA SHEETS COMMERCIAL PARCEL SALES

95 Pine Island Road Commercial Parcel RETAIL/COMMERCIAL LAND SALE No. 1 Location Data Location: County: Assessor's Parcel No: Atlas Ref: Physical Data Type: Land Area: Acres: Square Feet: Topography: Shape: Utilities: Zoning: Allowable Bldg Area: Floor Area Ratio: No. of units: Max FAR: Frontage: 2015 NE Pine Island Road Cape Coral,FL Lee C Retail/Commercial Gross Usable , ,688 Level, At Street Grade Irregular All Available Corridor 90, Pine Island Road; NE 10th Terrace Sale Data Transaction Type: Date: Marketing Time: Grantor: Grantee: Document No.: Sale Price: Financing: Cash Eq.Price: Onsite/Offsite Costs: Adj. Sale Price: Verification: Sale 12/2009 NAP Eastpoint, LLC Eastpoint Stimuli, LLC $2,200,000 Cash to Seller $2,200,000 $0 $2,200,000 Steven Krieg - S.L. Krieg Realty, Inc Analysis Use At Sale: Proposed Use or Dev. Price Per Acre: Price Per SF of Land: Price Per Unit: Price Per SF of Bldg: Vacant Land Commercial $148,648 $3.41 $24.44 Comments This site is located on the north side of NE Pine Island Road, just east of Pondella Road in Cape Coral, Florida. The site totals acres with 2.52 acres of wetlands. This site had a water retention pond in place, was cleared, grated, and fully entitled for 90,000 square feet of retail at the time of sale. The selling broker indicated that the site was acquired for future development, although it would be held until the market improves. The broker also indicated that he felt the site was sold below its market value due to its location along a popular commercial corridor within the market, as well as due to the amount of site work and entitlements which were in place at the time of sale.

96 HD Supply Site Venice INDUSTRIAL LAND SALE No. 2 Location Data Location: County: Assessor's Parcel No: Atlas Ref: Physical Data Type: Land Area: Acres: Square Feet: 100 Center Road Venice,FL Sarasota Industrial Gross Usable , ,202 Sale Data Transaction Type: Date: Marketing Time: Grantor: Grantee: Document No.: Sale Price: Financing: Cash Eq.Price: Onsite/Offsite Costs: Adj. Sale Price: Verification: Sale 12/ months Home Depot, Inc. Brians Land Company $700,000 Cash to Seller $700,000 $0 $700,000 Jarib Rodriguez, Broker Topography: Shape: Utilities: Zoning: Allowable Bldg Area: Floor Area Ratio: No. of units: Max FAR: Frontage: Level, At Street Grade Rectangular All available ILW Zoning/MEC Land Use 47, N/S Center Road (281'); Analysis Use At Sale: Proposed Use or Dev. Price Per Acre: Price Per SF of Land: Price Per Unit: Price Per SF of Bldg: Dated Warehouse Improvements Industrial/Distribution $197,740 $4.54 $14.88 Comments The property is located along the north side of Center Road, midway between Tamiami Trial (US Hwy 41) and US 41 Bypass South, in Venice, proximate to industrial and retail development. The site was previously improved with 47,055 SF of warehouse in multiple buildings that were to be demolished and constributed no value to the site. The site is zoned ILW (Industrial Light Weight), while its future land use is MEC (Major Employment Center). Center Road is relatively well traveled with traffic counts of 11,462 AADT. The site was previously listed at $975K.

97 Racetrac Toledo Blade RETAIL/COMMERCIAL LAND SALE No. 3 Location Data Location: County: Assessor's Parcel No: Atlas Ref: Physical Data Type: Land Area: Acres: Square Feet: Topography: Shape: Utilities: Zoning: Allowable Bldg Area: Floor Area Ratio: No. of units: Max FAR: Frontage: Toledo Blade Road Port Charlotte,FL Charlotte et al Retail/Commercial Gross Usable , ,657 Level, At Street Grade Rectangular All Available CG, Commercial General S/S El Jobean Rd (appr. 525'); N/S Cedar Wood (400') Sale Data Transaction Type: Date: Marketing Time: Grantor: Grantee: Document No.: Sale Price: Financing: Cash Eq.Price: Onsite/Offsite Costs: Adj. Sale Price: Verification: Sale 6/ months N&S Investment Properties, LLC Racetrac Petroleum, Inc. 3396/1807 $1,550,000 Cash to Seller $1,550,000 $0 $1,550,000 Thomas Strauss, Landqwest & Ron Struthers, CBRE Analysis Use At Sale: Proposed Use or Dev. Price Per Acre: Price Per SF of Land: Price Per Unit: Price Per SF of Bldg: Raw Land Racetrac $410,052 $9.41 Comments This is a recent acquisition of a site for construction of Racetrac Gas station at the southeast corner of El Jobean Road and Toledo Blade Boulevard, and is bordered to the south by Cedarwood Street.. This purchase included eleven parcels, inculde Lots and lots 1-4. This location is just west of Murdock Circle and proximate to east bound traffic from the Englewood beaches area to the west, and is in close proximately to the Port Charlotte Town Center (mall). In general, this area is the core of retail development and activity for the Port Charlotte market. The site is accessible via a lighted interchange.

98 Hancock Bridge Parkway Retail Site SPEC-HOLDING LAND SALE No. 4 Location Data Location: County: Assessor's Parcel No: Atlas Ref: Physical Data Type: Land Area: Acres: Square Feet: Topography: Shape: Utilities: Zoning: Allowable Bldg Area: Floor Area Ratio: No. of units: Max FAR: Frontage: 3473 Hancock Bridge Parkway North Ft Myers,FL Lee Spec-Holding Gross Usable , ,776 Level, At Street Grade Irregular All Available C-1 Hancock Bridge Parkway; Sale Data Transaction Type: Date: Marketing Time: Grantor: Grantee: Document No.: Sale Price: Financing: Cash Eq.Price: Onsite/Offsite Costs: Adj. Sale Price: Verification: Sale 4/2009 Fullenkamp Strayhorn Properties, Michael & Carol Jugan $742,500 Cash to Seller $742,500 $0 $742,500 Dennis Fullenkamp - Dennis J. Fullenkamp Realty, Inc. - Analysis Use At Sale: Proposed Use or Dev. Price Per Acre: Price Per SF of Land: Price Per Unit: Price Per SF of Bldg: Vacant Land Commercial $128,460 $2.95 Comments This vacant site is located on the north side of Hancock Bridge Parkway, just west of North Cleveland Avenue in North Fort Myers, Florida. This site was sold in April of 2009 for $2.95 per square foot. The grantee representative we spoke with indicated that their motivation to sell was due to money issues; this asset was available and was therefore sold. The property was acquired by speculators who have since placed the property for sale with Tim Lewis of First Capital Realty, Inc. ( ). The property is currently listed for sale at $1,531,570 or $6.08 per square foot.

99 Wal-Mart Site RETAIL/COMMERCIAL LAND SALE No. 5 Location Data Location: County: Assessor's Parcel No: Atlas Ref: Physical Data Type: Land Area: Acres: Square Feet: Topography: Shape: Utilities: Zoning: Allowable Bldg Area: Floor Area Ratio: 8498 E SR 70 Bradenton,FL Manatee Retail/Commercial Gross Usable , ,990 Generally Level Irregular All Available PUDMU 227, No. of units: Max FAR: Frontage: I-75; SR 70 Sale Data Transaction Type: Date: Marketing Time: Grantor: Grantee: Document No.: Sale Price: Financing: Cash Eq.Price: Onsite/Offsite Costs: Adj. Sale Price: Verification: Sale 11/2008 Casvak River Club, LLC Wal-Mart Stores East, LP 2280/6495 $11,650,000 Cash to Seller $11,650,000 $0 $11,650,000 Gary Larson, Wal-Mart (479) Analysis Use At Sale: Proposed Use or Dev. Price Per Acre: Price Per SF of Land: Price Per Unit: Price Per SF of Bldg: Vacant and wooded Supercenter $512,087 $11.76 $51.28 Comments This sale included the primary land component of a larger land tract located at the southeast quadrant of State Road 70 and Interstate 75. The parent land tract is approved for development of 325,000 square feet, of which 227,194 square feet of development rights were transferred in this sale. Wal-Mart will develop a Supercenter on this acre parcel, and the seller will develop the remaining land area with complimentary retail stores. While negotiations were ongoing since February 2007, with the price negotiated down slightly just before the closing in November Therefore, the price was considered consistent with retail land values at the time of the transfer. Manatee County has not yet assigned the acre Wal-Mart parcel its own parcel number.

100 Lowe's Home Center Site RETAIL/COMMERCIAL LAND SALE No. 6 Location Data Location: County: Assessor's Parcel No: Atlas Ref: Physical Data Type: Land Area: Acres: Square Feet: Topography: Shape: Utilities: Zoning: Allowable Bldg Area: Floor Area Ratio: No. of units: Max FAR: Frontage: S/S Central Sarasota Pkwy Sarasota,FL Sarasota Retail/Commercial Gross Usable , ,280 Level, At Street Grade Rectangular All to Site RE-1 152, feet - Central Sarasota Pky; Sale Data Transaction Type: Date: Marketing Time: Grantor: Grantee: Document No.: Sale Price: Financing: Cash Eq.Price: Onsite/Offsite Costs: Adj. Sale Price: Verification: Sale 8/ months Quorn Hounds Inc Lowes Home Centers Inc $14,739,000 Cash to Seller $14,739,000 $0 $14,739,000 Hull Storey Gibson Companies LLC - Kendal Jones Analysis Use At Sale: Proposed Use or Dev. Price Per Acre: Price Per SF of Land: Price Per Unit: Price Per SF of Bldg: Vacant Retail $1,133,769 $26.03 $96.93 Comments Quorn Hounds, Inc sold the 20-acre lot located on Central Sarasota Parkway to Lowes Home Centers, Inc on August 4, 2008 for $14,739,000. Kendall Jones of Hull Storey Retail Group represented the buyer in the deal while the seller did not use brokerage. Lowes is going to build a 124,051 sf LEED-certified home center with a 28,000 garden center on this parcel. The southern most 7 acres, located south of the stream that runs through this parcel, is projected to be made into a park. The construction is planned to begin February '09 and will be completed by July '09.

101 Kohl's Shopping Center RETAIL/COMMERCIAL LAND SALE No. 7 Location Data Location: County: Assessor's Parcel No: Atlas Ref: Physical Data Type: Land Area: Acres: Square Feet: Topography: Shape: Utilities: Zoning: Allowable Bldg Area: Floor Area Ratio: No. of units: Max FAR: Frontage: SWQ of Cochran & Veterans Blvd. Port Charlotte,FL Charlotte , 6005 Retail/Commercial Gross Usable , ,987 Generally Level Rectangular All available CG, Commercial General Cochran Boulevard; Sale Data Transaction Type: Date: Marketing Time: Grantor: Grantee: Document No.: Sale Price: Financing: Cash Eq.Price: Onsite/Offsite Costs: Adj. Sale Price: Verification: Sale 6/ months Mango Development Group, Inc, Harbor Square Plaza, LLC 3182/1242 $8,770,400 Cash to Seller $8,770,400 $0 $8,770,400 Eddie Morton w/mango Development & Duke Sullivan Analysis Use At Sale: Proposed Use or Dev. Price Per Acre: Price Per SF of Land: Price Per Unit: Price Per SF of Bldg: Vacant Retail $506,690 $11.63 Comments This site was purchased for the development of a 134,373 S.F. Kohl's anchored shopping center and three outparcels, collectively known as Harbor Square Plaza. Kohl's ground leases 7.86± acres and constructed their own store while the remaining part of the center consists of a 20,087 S.F. PetsMart store (attached to Kohl's building) and 18,000 S.F. of detached local space is located on an outparcel. The three remaining outparcels contain between 1.07± acres and 1.36± acres, all fronting Cochran Boulevard. Note that approximately 1.879± acres of the overall tract will be a portion of a 3.62± detention pond that will be shared with adjacent parcels.
102 ADDENDUM C LAND SALE DATA SHEETS COMMERCIAL PARCEL LISTINGS
103 Harbor Square Plaza Building Pad - Cochran RETAIL/COMMERCIAL LAND SALE No. 1 Location Data Location: County: Assessor's Parcel No: Atlas Ref: Physical Data Type: Land Area: Acres: Square Feet: SWQ of Cochran & Veterans Port Charlotte,FL Charlotte Retail/Commercial Gross Usable , ,998 Sale Data Transaction Type: Date: Marketing Time: Grantor: Grantee: Document No.: Sale Price: Financing: Cash Eq.Price: Onsite/Offsite Costs: Adj. Sale Price: Verification: Listing 3/ months Mango Development Group $4,115,000 Cash to Seller $4,115,000 $0 $4,115,000 Duke Sullivan Topography: Shape: Utilities: Zoning: Allowable Bldg Area: Floor Area Ratio: No. of units: Max FAR: Frontage: Level, At Street Grade Irregular All Available CG, Commercial General W/S Cochran Boulevard exposure; Analysis Use At Sale: Proposed Use or Dev. Price Per Acre: Price Per SF of Land: Price Per Unit: Price Per SF of Bldg: Vacant Retail Building Pads Retail Building Pads $250,000 $5.74 Comments This represents a listing for one of two building pads located at the signlized corner of Cochran Boulevard and the access road into Harbor Square Plaza, a 134,373 S.F. Kohl's and PetSmart anchored shopping center that opened in April, The pads are not graded, but have access via the existing constructed center, while master retention is in-place. The parcels include a 5.52 acre parcel fronting Veterans Boulevard, and a acre parcel facing Cochran Boulevard. Of the acres, approximately 4.5 acres is encumbered by the master site retention, leaving approximately 16.5 acres of usable land area. The site was previously listed near $450,000 per acre, but has been reduced to near $250K per acre (usable) for the 16.5 acre parcel and $300K per acre for the 5.52 acre parcel facing Veterans Boulevard. The owner of the adjacent property indicated they had offered $150K per acre, but the seller refused their offer. He anticipated they would go into bankruptcy or foreclosure in the coming year.

104 Commercial Land RETAIL/COMMERCIAL LAND SALE No. 2 Location Data Location: County: Assessor's Parcel No: Atlas Ref: Physical Data Type: Land Area: Acres: Square Feet: Topography: Shape: Utilities: Zoning: Allowable Bldg Area: Floor Area Ratio: No. of units: Max FAR: Frontage: Tamiami Trail North Port,FL Sarasota Retail/Commercial Gross Usable , ,232 Generally Level Rectangular All available CG Tamiami Trail; Sale Data Transaction Type: Date: Marketing Time: Grantor: Grantee: Document No.: Sale Price: Financing: Cash Eq.Price: Onsite/Offsite Costs: Adj. Sale Price: Verification: Listing 1/ months FLORIDA COMMUNITY BANK TBD $2,600,000 Cash to Seller $2,600,000 $0 $2,600,000 Fred Kolb W/Coldwell Banker Commercial - Sunstar Analysis Use At Sale: Proposed Use or Dev. Price Per Acre: Price Per SF of Land: Price Per Unit: Price Per SF of Bldg: Vacant Strip center $252,672 $5.80 Comments This comparable is located on the southwest corner of Tamiami Trail and Tuscola Boulevard in North Port, Florida. The property was originally purchased in 2005 for the development of a 100,000 square foot retail/office plaza to be known as North Port Plaza. In September 2009, the property revered back to the lender and the property has been listed for sale since. The broker indicated that the list price was below appraised value in an effort to move the property off of the banks balance sheet.

105 Riverwood PD Commercial Listing RETAIL/COMMERCIAL LAND SALE No. 3 Location Data Location: County: Assessor's Parcel No: Atlas Ref: Physical Data Type: Land Area: Acres: Square Feet: Topography: Shape: Utilities: Zoning: Allowable Bldg Area: Floor Area Ratio: No. of units: Max FAR: Frontage: W/S El Jobean Willow Bend Port Charlotte,FL Charlotte Retail/Commercial Gross Usable , ,614 Level, At Street Grade Rectangular All Available PD El Jobean Blvd (739'); Willow Bend Rd (284') Sale Data Transaction Type: Date: Marketing Time: Grantor: Grantee: Document No.: Sale Price: Financing: Cash Eq.Price: Onsite/Offsite Costs: Adj. Sale Price: Verification: Listing 3/ months MYAKKA COMMERCIAL LAND TBD $2,950,000 Cash to Seller $2,950,000 $0 $2,950,000 Listing, Tom Woodyward ( ) Analysis Use At Sale: Proposed Use or Dev. Price Per Acre: Price Per SF of Land: Price Per Unit: Price Per SF of Bldg: Vacant Land Retail Site $262,455 $6.03 Comments This is a listing for an acres tract situated on the west side of El Jobean Road, south of Willow Bend Road, at the entry to Riverwood Planned Development, a planned development to consist of nearly 3,300 homes, golf course, marina, and related amenities. The site has access to the north from Willow Bean and to the south from Lee Circle, with significant frontage on El Jobean Road (SR 776). The site is zoned CG and approved uses include banks, professional office, medical, retail, ALF, and business related services. The site is tree'd and would require clearing, engineering, and fill prior to development.

106 Harbor Square Plaza Building Pad - Veterans RETAIL/COMMERCIAL LAND SALE No. 4 Location Data Location: County: Assessor's Parcel No: Atlas Ref: Physical Data Type: Land Area: Acres: Square Feet: Topography: Shape: Utilities: Zoning: Allowable Bldg Area: Floor Area Ratio: No. of units: Max FAR: Frontage: SWQ of Cochran & Veterans Port Charlotte,FL Charlotte Retail/Commercial Gross Usable , ,452 Level, At Street Grade Irregular All Available CG, Commercial General S/S Veterans Boulevard (appr. 500'); W/S Cochran Boulevard Sale Data Transaction Type: Date: Marketing Time: Grantor: Grantee: Document No.: Sale Price: Financing: Cash Eq.Price: Onsite/Offsite Costs: Adj. Sale Price: Verification: Listing 3/ months Mango Development Group $1,650,000 Cash to Seller $1,650,000 $0 $1,650,000 Duke Sullivan, listing broker/owner Analysis Use At Sale: Proposed Use or Dev. Price Per Acre: Price Per SF of Land: Price Per Unit: Price Per SF of Bldg: Vacant Retail Building Pads Retail Building Pads $298,913 $6.86 Comments This represents a listing for one of two building pads located at the signlized corner of Cochran Boulevard and the access road into Harbor Square Plaza, a 134,373 S.F. Kohl's and PetSmart anchored shopping center that opened in April, The pads are not graded, but have access via the existing constructed center, while master retention is in-place. The parcels include a 5.52 acre parcel fronting Veterans Boulevard, and a acre parcel facing Cochran Boulevard. Of the acres, approximately 4.5 acres is encumbered by the master site retention, leaving approximately 16.5 acres of usable land area. The site was previously listed near $450,000 per acre, but has been reduced to near $250K per acre (usable) for the 16.5 acre parcel and $300K per acre for the 5.52 acre parcel facing Veterans Boulevard. The owner of the adjacent property indicated they had offered $150K per acre, but the seller refused their offer. He anticipated they would go into bankruptcy or foreclosure in the coming year.

107 Heritage Harbour Retail Land Listing RETAIL/COMMERCIAL LAND SALE No. 5 Location Data Location: County: Assessor's Parcel No: Atlas Ref: Physical Data Type: Land Area: Acres: Square Feet: Topography: Shape: Utilities: Zoning: Allowable Bldg Area: Floor Area Ratio: No. of units: Max FAR: Frontage: 8265 Heritage Green Way Bradenton,FL Manatee Retail/Commercial Gross Usable , ,840 Level, At Street Grade Irregular All Available PUD 115, Heritage Green Way; Sale Data Transaction Type: Date: Marketing Time: Grantor: Grantee: Document No.: Sale Price: Financing: Cash Eq.Price: Onsite/Offsite Costs: Adj. Sale Price: Verification: Listing 3/ months Brownstar Properties LLC N.A $5,500,000 Cash to Seller $5,500,000 $0 $5,500,000 Tom Dyer, Starling Group (941) Analysis Use At Sale: Proposed Use or Dev. Price Per Acre: Price Per SF of Land: Price Per Unit: Price Per SF of Bldg: Vacant Retail $392,857 $9.02 $47.83 Comments This 14-acre parcel is located at the northeast quadrant of State Road 64 and Heritage Green Way and about a half mile east of Interstate 75. It is within the Heritage Harbour PUD, a master planned residential community by Lennar Homes. Starling Group has listed the property for about one year, and prior to their listing, another broker had it listed. According to Tom Dyer with Starling, the property would likely sell at a price ranging from about $4.27 to $4.9 million, or $305,000 ($7.00 PSF) to $350,000 ($8.00 PSF) per acre, which equates to $37.13 to $42.61 PSF.

108 Commercial Land RETAIL/COMMERCIAL LAND SALE No. 7 Location Data Location: County: Assessor's Parcel No: Atlas Ref: Physical Data Type: Land Area: Acres: Square Feet: SEQ of Toledo Blade & Woodhaven North Port,FL Sarasota Retail/Commercial Gross Usable , ,165 Sale Data Transaction Type: Date: Marketing Time: Grantor: Grantee: Document No.: Sale Price: Financing: Cash Eq.Price: Onsite/Offsite Costs: Adj. Sale Price: Verification: Listing 1/ months ATLAS FL I SPE LLC $3,995,000 Cash to Seller $3,995,000 $0 $3,995,000 Confidential Topography: Shape: Utilities: Zoning: Allowable Bldg Area: Floor Area Ratio: No. of units: Max FAR: Frontage: Generally Level Rectangular All available CG, Commercial General Woodhaven Drive; Analysis Use At Sale: Proposed Use or Dev. Price Per Acre: Price Per SF of Land: Price Per Unit: Price Per SF of Bldg: Vacant Mixed Use $399,899 $9.18 Comments The site is located along the south side of Woodhaven Drive, just east of Toledo Blade Boulevard. It has been cleared and graded with retention, water and sewer including an upgraded lift station already on site. Thus, it is essentially a pad ready site.

109 Veterans Commons Site Listing RETAIL/COMMERCIAL LAND SALE No. 8 Location Data Location: County: Assessor's Parcel No: Atlas Ref: Physical Data Type: Land Area: Acres: Square Feet: NWQ Veterans Blvd & Cochran Blvd Port Charlotte,FL Charlotte Retail/Commercial Gross Usable , ,432 Sale Data Transaction Type: Date: Marketing Time: Grantor: Grantee: Document No.: Sale Price: Financing: Cash Eq.Price: Onsite/Offsite Costs: Adj. Sale Price: Verification: Listing 3/ months BMR FUNDING LLC, via TBD $5,000,000 Cash to Seller $5,000,000 $0 $5,000,000 Listing Topography: Shape: Utilities: Zoning: Allowable Bldg Area: Floor Area Ratio: No. of units: Max FAR: Frontage: Level, At Street Grade Irregular All Available CG 153, Veterans Boulevard (532'); Cochran Blvd (300') Analysis Use At Sale: Proposed Use or Dev. Price Per Acre: Price Per SF of Land: Price Per Unit: Price Per SF of Bldg: Vacant Land Retail Site $409,836 $9.41 $32.50 Comments This is a listing for a 12.2 acre parcel situated at the northwest quadrant of Veterans Boulevard and Cochran Boulevard, and was planned for a development to be known as Veterans Commons. The listing is exclusive of the hard corner, which is being marketed seperately. The property was foreclosed on in January, 2009, with the broker indicating they had received three calls on in the last year. The broker indicated the asking price is too high and a more realistic price would be in the $3-3.5M range. The site features frontage on both roadways and is situated at a lighted interchange. The site has been fully designed from an engineering standpoint and has all SWFWMD/DOT and related agency approvals for construction of a 153,847 SF retail center. The parcel is across Veterans Boulevard from a recently completed Kohl's anchored retail center and proximate to Home Depot, but is at the periphery of retail development in the Murdock Circle market. The site also benefits from increased traffic along Veterans Boulevard, as a primary access corridor extending from the King's Highway/I-75 interchange. The 2008 estimated 3-mile population was 39,093, with a median household income of $47,101.

110 McCall Road & Gulfstream Boulevard Parcel RETAIL/COMMERCIAL LAND SALE No. 9 Location Data Location: County: Assessor's Parcel No: Atlas Ref: Physical Data Type: Land Area: Acres: Square Feet: Topography: Shape: Utilities: Zoning: Allowable Bldg Area: Floor Area Ratio: No. of units: Max FAR: Frontage: Gulfstream Blvd. Englewood,FL Charlotte & Retail/Commercial Gross Usable , ,786 Generally Level Rectangular All available RMF-10/Commercial Center FLU S/S of McCall Road (SR 776) (351'); E/S of Gulfstream Boulevard (507') Sale Data Transaction Type: Date: Marketing Time: Grantor: Grantee: Document No.: Sale Price: Financing: Cash Eq.Price: Onsite/Offsite Costs: Adj. Sale Price: Verification: Listing 3/ months Dennis J. Fullenkamp, Trustee $1,639,380 Cash to Seller $1,639,380 $0 $1,639,380 Sage Andress, SunMark Realty ( ) Analysis Use At Sale: Proposed Use or Dev. Price Per Acre: Price Per SF of Land: Price Per Unit: Price Per SF of Bldg: Vacant Retail $436,005 $10.01 Comments This site represents the hard corner of McCall Road (SR 776) and Gulfstream Boulevard, a prominant interchange along McCall Road in the Rotunda area of Englewood. The site is across Gulfstream Road from the existing Crown Gateway retail center, which is anchored by Home Depot and includes Englewood Bank and Burger King on its outparcels. The listing includes a 3.76± acre site that is presently zoned RMF-10, but has a Future Land Use Designation of Commercial Center, which generally dictates use in the area. The site is also bordered to the east by teh Sioux Waterway, which connects to the Rotunda canal system, making the site attractive as a site down restaurant location. The site is in raw condition and would require clearing of low level vegetation, but has all utilities in place. The site has been listed for less than one year with no significant interest. The listing broker indicated the property had been listed for nearly two years and they would entertain a lower offering price.

111 Wal-Mart Supercenter Building Pad RETAIL/COMMERCIAL LAND SALE No. 10 Location Data Location: County: Assessor's Parcel No: Atlas Ref: Physical Data Type: Land Area: Acres: Square Feet: Topography: Shape: Utilities: Zoning: Allowable Bldg Area: Floor Area Ratio: NEQ of I-75 and Kings Highway Port Charlotte,FL Charlotte Retail/Commercial Gross Usable , ,266 Level, At Street Grade Irregular All Available PD, Planned Development No. of units: Max FAR: Frontage: N/S Kings Highway; E/S I-75 Sale Data Transaction Type: Date: Marketing Time: Grantor: Grantee: Document No.: Sale Price: Financing: Cash Eq.Price: Onsite/Offsite Costs: Adj. Sale Price: Verification: Listing 3/ months Wal-Mart Stores tbd $2,400,000 Cash to Seller $2,400,000 $0 $2,400,000 Felicia Hamilton, Wal-Mart Real Estate Manager Analysis Use At Sale: Proposed Use or Dev. Price Per Acre: Price Per SF of Land: Price Per Unit: Price Per SF of Bldg: Vacant Building Pad Retail Building Pad $494,845 $11.36 Comments The comparable is a building site situated northwest of the main parcel within a recently completed 200,000 square foot Wal-Mart Supercenter that is located in the northeast quadrant of I-75 and Kings Highway, Port Charlotte, Charlotte County, Florida. This parcel has liberal deed restrictions, allowing strip retail use, but is situated somewhat behind Wal-Mart, although it has good exposure to I-75, although the north bound exposure faces traffic that has passed the location. The site fronts the master site's protected wetland area and is irregular in shape. The site was reportedly under contract by a retail developer, but the contract was reportedly cancelled last month. The property is located at the northwest corner of Kings Highway and Interstate 75, and its frontage is somewhat encumbered. The site benefits from high traffic counts despite its rural location, with Kings Hwy at 45,000 and I-75 at 98,000 (bi-directional). The 3-mile population is 26,129 with an average HH income of $60,165.

112 Sarasota Commerce Center Site OFFICE LAND SALE No. 11 Location Data Location: County: Assessor's Parcel No: Atlas Ref: Physical Data Type: Land Area: Acres: Square Feet: Topography: Shape: Utilities: Zoning: Allowable Bldg Area: Floor Area Ratio: No. of units: Max FAR: Frontage: 50 Arthur Andersen Pkwy Sarasota,FL Sarasota & Office Gross Usable , ,376 Level, At Street Grade L shape All available ILW; Industrial Light Weight 57, Fruitville Road Exposure; Arthur Andersen Road frontage Sale Data Transaction Type: Date: Marketing Time: Grantor: Grantee: Document No.: Sale Price: Financing: Cash Eq.Price: Onsite/Offsite Costs: Adj. Sale Price: Verification: Listing 3/ months Fruitville Associates $4,500,000 Cash to Seller $4,500,000 $0 $4,500,000 Jay Sori, Owner representative / Analysis Use At Sale: Proposed Use or Dev. Price Per Acre: Price Per SF of Land: Price Per Unit: Price Per SF of Bldg: Vacant Office w/ Retail $507,328 $11.65 $78.95 Comments This listing is located south of Fruitville Road within the Sarasota Commerce Park, and is situated on the west side of Arthur Andersen Boulevard, a previous tenant in the adjacent office buildings. The parcel is bordered to the west by the Sarasota Corner Shopping Center. The zoning allows for up to 129,000 square feet; however, the site it constrained by trip capacity, therefore the owner has had a site plan approved for 42,000 square feet of office with 15,000 SF of retail. The site can only have a limited amount of retail per land use. According to the seller, the site plan is such that future construction of the remaining 69,000 SF of space per zoning could be accomplished if trip capacity was obtained. The existing site plan is shovel ready and could have a permit pulled tomorrow; while the site is improved with horizontal infrastructure, engineering, and off-site retention. The site has been listed at $5,800,000, although the selling broker indicated a price in the $ PSF range would be more realistic, as reflected above.

113 McCall Rd & Winchester Commercial Listing RETAIL/COMMERCIAL LAND SALE No. 12 Location Data Location: County: Assessor's Parcel No: Atlas Ref: Physical Data Type: Land Area: Acres: Square Feet: Topography: Shape: Utilities: Zoning: Allowable Bldg Area: Floor Area Ratio: No. of units: Max FAR: Frontage: SWQ McCall Rd (SR 776) & Englewood,FL Charlotte Retail/Commercial Gross Usable , ,427 Level, At Street Grade Rectangular All Available IL McCall Road (appr. 375'); future Wilmington/Gulfstream Extension Sale Data Transaction Type: Date: Marketing Time: Grantor: Grantee: Document No.: Sale Price: Financing: Cash Eq.Price: Onsite/Offsite Costs: Adj. Sale Price: Verification: Listing 3/ months MMS LLC TBD $2,650,000 Cash to Seller $2,650,000 $0 $2,650,000 David Greenburg, listing broker ( ) Analysis Use At Sale: Proposed Use or Dev. Price Per Acre: Price Per SF of Land: Price Per Unit: Price Per SF of Bldg: Vacant Land Commercial Site $564,670 $12.96 Comments This is a listing for an 5.1 acres parcel situated at the southwest quadrant of McCall Road and Winchester Boulevard, west of Gulfstream Boulevard, and just east of Englewood. The site is approximately 0.25 miles east of a Wal-Mart anchored center and the entry into the Oyster Creek Golf Course. The site is at the planned connector to Winchester Boulevard and Gulfstream Boulevard, which is planned to connect Northport to Placido Road. While the site is zoned IL, it is anticipated by the owner to be used for retail/commercial development. The broker had previously indicated interest in the site, with pricing reported in the $10-12 PSF range; however, roadway construction has been delayed, which has resulted in a reduction in interest recently. The site is cleared and engineered with retention in place at the rear of the property. There is rumors of this site being assembled amongst neighboring parcels for a retail development in the southeast quadrant of McCall Road and the entry to Oyster Creek Golf Community.
114 Charlotte Commons Building Pad (Lot 14) RETAIL/COMMERCIAL LAND SALE No. 13 Location Data Location: County: Assessor's Parcel No: Atlas Ref: Physical Data Type: Land Area: Acres: Square Feet: W/S Veterans Blvd, N/O Peachland Port Charlotte,FL Charlotte TBD Retail/Commercial Gross Usable , ,898 Sale Data Transaction Type: Date: Marketing Time: Grantor: Grantee: Document No.: Sale Price: Financing: Cash Eq.Price: Onsite/Offsite Costs: Adj. Sale Price: Verification: Listing 3/ months Charlotte Commons, LLC TBD $3,500,000 Cash to Seller $3,500,000 $0 $3,500,000 Listing Topography: Shape: Utilities: Zoning: Allowable Bldg Area: Floor Area Ratio: No. of units: Max FAR: Frontage: Level, At Street Grade Irregular All Available PD Veterans Boulevard (appr. 1,100'); Analysis Use At Sale: Proposed Use or Dev. Price Per Acre: Price Per SF of Land: Price Per Unit: Price Per SF of Bldg: Vacant Land Office Building Pad $680,933 $15.63 Comments This is a listing for 5.14 acre parcel situated on the north side of the Charlotte Commons development, that s part of the master planned development. Access will available via the cross easements as well as direct access to this site. The parcel is planned for office improvement and overlooks a large lake. The site also benefits from Interstate 75 exposure. This parcel (Lot 14) faces Veterans Boulevard, the primary roadway supporting the proposed development. Project development did not begin until September, Although not released, the center is anticipated to be occupied by numerous big box tenants. To date, only one outparcel is reportedly under contract to Bank of America.
115 ADDENDUM D LAND SALE DATA SHEETS OUTPARCEL SALES

116 Cocoplum Village - Racetrac RETAIL/COMMERCIAL LAND SALE No. 1 Location Data Location: County: Assessor's Parcel No: Atlas Ref: Physical Data Type: Land Area: Acres: Square Feet: Topography: Shape: Utilities: Zoning: Allowable Bldg Area: Floor Area Ratio: No. of units: Max FAR: Frontage: Tamiami Trail North Port,FL Sarasota Retail/Commercial Gross Usable ,228 93,228 Generally Level Rectangular All available PCD Tamiami Trail (340'); Cranberry/Cornelius (275') Sale Data Transaction Type: Date: Marketing Time: Grantor: Grantee: Document No.: Sale Price: Financing: Cash Eq.Price: Onsite/Offsite Costs: Adj. Sale Price: Verification: Sale 1/ months Dennis Fullenkamp, TTEE Racetrac Petroleum $1,300,000 Cash to Seller $1,300,000 $0 $1,300,000 Tom Strauss, knowledgable third party, Recorded Deed Analysis Use At Sale: Proposed Use or Dev. Price Per Acre: Price Per SF of Land: Price Per Unit: Price Per SF of Bldg: Vacant Retail/C-Store $607,419 $13.94 Comments The site is located at the northwest corner of Tamiami Trail and Cornelius/Cranberry Road, east of the Cocoplum Village retail development in North Port, Florida, and represents an outparcel on the hard corner to the lighted interchange. Cocoplum Village is a Publix anchored retail center under construction planned for a 55,000 SF Publix and 26,000 SF of in-line retail. This outparcel was acquired for development of a Racetrac Petroleum. The AADT along Tamiami Trail is 38,000..
117 Sumter Crossing Outparcel RETAIL/COMMERCIAL LAND SALE No. 2 Location Data Location: County: Assessor's Parcel No: Atlas Ref: Physical Data Type: Land Area: Acres: Square Feet: Topography: Shape: Utilities: Zoning: Allowable Bldg Area: Floor Area Ratio: No. of units: Max FAR: Frontage: 6000 Salford Blvd. North Port,FL Sarasota Retail/Commercial Gross Usable ,764 82,764 Generally Level Rectangular All available PCD Tamiami Trail (316'); Salford Blvd (274') Sale Data Transaction Type: Date: Marketing Time: Grantor: Grantee: Document No.: Sale Price: Financing: Cash Eq.Price: Onsite/Offsite Costs: Adj. Sale Price: Verification: Contract 12/ months North Port Gateway LLC $1,200,000 Cash to Seller $1,200,000 $0 $1,200,000 Jason Sepanski w/florida Commercial Source, LLC Analysis Use At Sale: Proposed Use or Dev. Price Per Acre: Price Per SF of Land: Price Per Unit: Price Per SF of Bldg: Vacant Retail/Office $631,578 $14.50 Comments The site is located at the southeast corner of Tamiami Trail and Salford Boulevard in North Port, Florida, and represents an outparcel to the Sumter Crossing retail center, which is anchored by a Wal-Mart SuperCenter and Home Depot. The site is being purchased for the development of a two-story office bulding. This an out parcel with cross access throughout the center, completed interior roadways, and off-site retention. This represents the last of twelve outparcels at this center. The AADT along Tamiami Trail is 38,000.

118 Crown Plaza Outparcel - Dollar General site RETAIL/COMMERCIAL LAND SALE No. 3 Location Data Location: County: Assessor's Parcel No: Atlas Ref: Physical Data Type: Land Area: Acres: Square Feet: Topography: Shape: Utilities: Zoning: Allowable Bldg Area: Floor Area Ratio: No. of units: Max FAR: Frontage: S. McCall Road (SR 776) Englewood,FL Charlotte Retail/Commercial Gross Usable ,674 48,674 Level, At Street Grade Rectangular All Available CG, Commercial General McCall Road (202'); Sale Data Transaction Type: Date: Marketing Time: Grantor: Grantee: Document No.: Sale Price: Financing: Cash Eq.Price: Onsite/Offsite Costs: Adj. Sale Price: Verification: Contract 9/2009 Crown Gateway, LLC McCall & York Holdings, LLC $400,000 Cash to Seller $400,000 $0 $400,000 Frank Menke ( )/Jason Sepanski ( ) Analysis Use At Sale: Proposed Use or Dev. Price Per Acre: Price Per SF of Land: Price Per Unit: Price Per SF of Bldg: Vacant Outparcel Dollar General $357,973 $8.22 Comments The parcel is under contract for construction of a proposed Dollar General store, and is located along the south side of McCall Road (SR 776), midway between Kevitt Boulevard and Gulfstream Boulevard, and is an outparcel to the Crown Plaza (Crown Gateway) shopping center in Port Charlotte. This parcel is an interior location with parking to the east, followed by Englewood Bank on the hard corner. There is no direct access to this site from McCall Road. The center is anchored by Home Depot and has a vacant building pad for a complimenting anchor or in-line space. The contract was originally entered in February, 2009, was renegotiated, reduced and changed to the interior parcel from the corner parcel. The sale was somewhat motivated by the financial challenges faced by Frank Menke and Gateway Development, who had numerous challenged retail developments in Southwest Florida with significant debt obligations. This deal was not accepted by the courts and has been shelved until the foreclosure is resolved.

119 Daniels Crossing Outparcel RETAIL/COMMERCIAL LAND SALE No. 4 Location Data Location: County: Assessor's Parcel No: Atlas Ref: Physical Data Type: Land Area: Acres: Square Feet: Topography: Shape: Utilities: Zoning: Allowable Bldg Area: Floor Area Ratio: No. of units: Max FAR: Frontage: W/S Six Mile Cypress Pwy, S/O Ft. Myers,FL Lee A.0000 Retail/Commercial Gross Usable ,469 64,469 Level, At Street Grade Rectangular All Available MPD, Mixed Use Planned Dev W/S Six Mile Cypress Parkway (262'); S/S International Center Sale Data Transaction Type: Date: Marketing Time: Grantor: Grantee: Document No.: Sale Price: Financing: Cash Eq.Price: Onsite/Offsite Costs: Adj. Sale Price: Verification: Sale 7/2009 LEE CIRQUE LLC Tucker Holdings of SWFL, LLC $900,000 Cash to Seller $900,000 $0 $900,000 Jim Garinger, CCIM - Colliers Arnold, broker Analysis Use At Sale: Proposed Use or Dev. Price Per Acre: Price Per SF of Land: Price Per Unit: Price Per SF of Bldg: Cleared Retail Site Retail/Office Development $608,108 $13.96 Comments This is a recent acquisition of a site situated along the west side of Six Mile Cypress, south of Daniels Parkway, at the entry into the Daniels Crossing retail center and Portofino Apartments/condominiums, and just north of the Lee County Sports Complex, home to the Minnesota Twins Spring Training. As well, the recently expanded Gulf Coast Hospital to the north and west at the southeast quadrant of Daniels Parkway and Metro Parkway. In general, the area has been a high growth area of Lee County/Ft. Myers. The site has good access and frontage/exposure to a high traffic corridor.

120 Price Crossing - Burger King RETAIL/COMMERCIAL LAND SALE No. 5 Location Data Location: County: Assessor's Parcel No: Atlas Ref: Physical Data Type: Land Area: Acres: Square Feet: 1071 S. Toledo Blade Boulevard North Port,FL Sarasota Retail/Commercial Gross Usable ,807 37,807 Sale Data Transaction Type: Date: Marketing Time: Grantor: Grantee: Document No.: Sale Price: Financing: Cash Eq.Price: Onsite/Offsite Costs: Adj. Sale Price: Verification: Sale 6/2009 Shoppes at Price Crossing Ltd Shaukat Sayed $800,000 Cash to Seller $800,000 $0 $800,000 Appraiser Topography: Shape: Utilities: Zoning: Allowable Bldg Area: Floor Area Ratio: No. of units: Max FAR: Frontage: Level, At Street Grade Rectangular All Available PCD, Planned Commercial Dev. 2, W/S Toledo Blade Boulevard (173'); S/S Price Blvd Exposure (216') Analysis Use At Sale: Proposed Use or Dev. Price Per Acre: Price Per SF of Land: Price Per Unit: Price Per SF of Bldg: Cleared Outparcel Site Burger King $921,765 $21.16 $ Comments This is a contract on an outparcel situated within the Price Crossing retail center, a Publix (46,031 SF) anchored retail center located at the southwest corner of Price Boulevard and Toledo Blade Boulevard. The center also rfeatures tenants such as Buffalo's, Carvel, and varous restaurants. The site was purchased by a local Burger King franchisee. The buyer previously had the site under contract in late 2007/early 2008, as the center was completed, but chose not to close on the acquisition. The buyer/seler re-negotiated the current contract recently, reflecting a 33% reduction in price from the prior contract. The site is fully improved, with all off-site retention and engineering in place. There is no direct access to the site from Toledo Blade or Price, with the site accessible from the center's parking lot/drive. This location represents a growing interchange, with present traffic counts of 19,600 on Toledo Blade Blvd and 10,900 on Price Blvd, with 3-mile average household income of $48,230 and a population of 30,739.

121 Sumter Crossing Outparcel - Steak N' Shake RETAIL/COMMERCIAL LAND SALE No. 6 Location Data Location: County: Assessor's Parcel No: Atlas Ref: Physical Data Type: Land Area: Acres: Square Feet: 4450 Sumter Crossing Dr. North Port,FL Sarasota Retail/Commercial Gross Usable ,803 43,803 Sale Data Transaction Type: Date: Marketing Time: Grantor: Grantee: Document No.: Sale Price: Financing: Cash Eq.Price: Onsite/Offsite Costs: Adj. Sale Price: Verification: Sale 5/ months North Port Gateway, LLC Susan Sandelman TTEE (Alisan $1,167,500 Cash to Seller $1,167,500 $0 $1,167,500 Appraisal Files Topography: Shape: Utilities: Zoning: Allowable Bldg Area: Floor Area Ratio: No. of units: Max FAR: Frontage: Generally Level Rectangular All Available PCD S/S Tamiami Trail (appr. 200'); W/S Sumter Crossing Blvd (appr. 207') Analysis Use At Sale: Proposed Use or Dev. Price Per Acre: Price Per SF of Land: Price Per Unit: Price Per SF of Bldg: Vacant Outparcel Restaurant $1,160,998 $26.65 Comments The site comprises an outparcel located along with south side of Tamiami Trail, on the west side of Sumter Crossing Boulevard, within the Sumter Crossing Shopping Center, anchored by Super Wal-Mart, Home Depot, and Walgreen's, with other noted tenants such as Applebee's and Dunkin Donuts, in North Port, Sarasota County, Florida. This site was purchased for construction of a Steak N' Shake restaurant by an franchisee. The parcel was owned by Steak N' Shake and sold to the franchisee. This an out parcel with cross access throughout the center, completed interior roadways, and off-site retention. This represents one of twelve outparcels at this center, with all but one sold. The AADT along Tamiami Trail is 38,000. The property previously sold to Steak N' Shake in May, 2006, for $825,000.

122 CVS Site RETAIL/COMMERCIAL LAND SALE No. 7 Location Data Location: County: Assessor's Parcel No: Atlas Ref: Physical Data Type: Land Area: Acres: Square Feet: Topography: Shape: Utilities: Zoning: Allowable Bldg Area: Floor Area Ratio: No. of units: Max FAR: Frontage: 4478 Tamiami Trail Port Charlotte,FL Charlotte Retail/Commercial Gross Usable ,389 63,389 Level, At Street Grade Irregular All Available PD 14, N/S Tamiami Trail (appr. 280'); S/S Harborview Road (appr. 450') Sale Data Transaction Type: Date: Marketing Time: Grantor: Grantee: Document No.: Sale Price: Financing: Cash Eq.Price: Onsite/Offsite Costs: Adj. Sale Price: Verification: Sale 12/2008 Dennis M. McDonough (3347/890) Capstone Harborview, LLC (CVS) 3347/890 & 897 $1,591,000 Cash to Seller $1,591,000 $0 $1,591,000 Steve Gant & Lyn Bevis (Re/Max Harbor Realty Broker) Analysis Use At Sale: Proposed Use or Dev. Price Per Acre: Price Per SF of Land: Price Per Unit: Price Per SF of Bldg: Cleared Retail Site CVS $1,093,320 $25.10 $ Comments This is a recent acquisition of a site for construction of a CVS Drug Store at the SEC of Tamiami Trail and Harborview Road in Port Charlotte. In general, the area is experiencing redevelopment, reinvestment, and general regenetrification. The site is accessed via a lighted interchange and is accessible by all directions of traffic. This parcel was previously improved with obsolete retail/service space, that was demo'd and cleared to road grade. The streets and infrastructure were in-place, such that this site functioned much as an outparcel does.
123 ADDENDUM E LAND SALE DATA SHEETS OUTPARCEL LISTINGS

124 Wal-Mart SuperCenter Outparcel RETAIL/COMMERCIAL LAND SALE No. 2 Location Data Location: County: Assessor's Parcel No: Atlas Ref: Physical Data Type: Land Area: Acres: Square Feet: Topography: Shape: Utilities: Zoning: Allowable Bldg Area: Floor Area Ratio: No. of units: Max FAR: Frontage: Murdock Circle Port Charlotte,FL Charlotte Retail/Commercial Gross Usable ,669 44,669 Level, At Street Grade Rectangular All Available CG 4, E/S Murdock Circle; S/S Wal-Mart Center entry Sale Data Transaction Type: Date: Marketing Time: Grantor: Grantee: Document No.: Sale Price: Financing: Cash Eq.Price: Onsite/Offsite Costs: Adj. Sale Price: Verification: Listing 3/ months Wachovia Bank $995,000 Cash to Seller $995,000 $0 $995,000 Rich Kingan, Kingan Realty ( ) Analysis Use At Sale: Proposed Use or Dev. Price Per Acre: Price Per SF of Land: Price Per Unit: Price Per SF of Bldg: branch bank Retail/Restaurant $970,258 $22.27 $ Comments This is a current listing of a retail outparcel to a Wal-Mart SuperCenter that is presently improved with a 4,893 SF gross (3,315 SF under air) branch bank that is being marketed as an outparcel for redevelopment. The site fronts Murdoch Circle less than 1/4 mile north of Tamiami Trail. The site has good access, exposure, and frontage. The asking price was recently reduced from $1.3M to $995K.
125 Charlotte Commons Outparcel Listing - Corner RETAIL/COMMERCIAL LAND SALE No. 3 Location Data Location: County: Assessor's Parcel No: Atlas Ref: Physical Data Type: Land Area: Acres: Square Feet: NWQ of Veterans & Peachland Blvd Port Charlotte,FL Charlotte TBD Retail/Commercial Gross Usable ,511 40,511 Sale Data Transaction Type: Date: Marketing Time: Grantor: Grantee: Document No.: Sale Price: Financing: Cash Eq.Price: Onsite/Offsite Costs: Adj. Sale Price: Verification: Listing 3/ months Charlotte Commons, LLC TBD $800,000 Cash to Seller $800,000 $0 $800,000 Listing Topography: Shape: Utilities: Zoning: Allowable Bldg Area: Floor Area Ratio: No. of units: Max FAR: Frontage: Level, At Street Grade Square All Available PD Peachland Boulevard (200'); Analysis Use At Sale: Proposed Use or Dev. Price Per Acre: Price Per SF of Land: Price Per Unit: Price Per SF of Bldg: Vacant Land Retail Outparcel $860,215 $19.75 Comments This is a listing for an outparcel of a proposed anchored power/shopping center to be known as Charlotte Commons (formerly Peachland Commons). The outparcel will be a pad site inclusive of site work/infrastructure and be located at the non-signalized corner of Veterans Boulevard and a shopping center entrance. This represents Outparcel 10 and is a representation of corner outparcel facing Peachland Boulevard, the secondary roadway supporting the proposed development. Project development did not begin until September, Although not released, the center is anticipated to be occupied by numerous big box tenants. To date, only one outparcel is reportedly under contract to Bank of America.

126 Charlotte Commons Outparcel Listing - Interior RETAIL/COMMERCIAL LAND SALE No. 4 Location Data Location: County: Assessor's Parcel No: Atlas Ref: Physical Data Type: Land Area: Acres: Square Feet: NWQ of Veterans & Peachland Blvd Port Charlotte,FL Charlotte TBD Retail/Commercial Gross Usable ,155 36,155 Sale Data Transaction Type: Date: Marketing Time: Grantor: Grantee: Document No.: Sale Price: Financing: Cash Eq.Price: Onsite/Offsite Costs: Adj. Sale Price: Verification: Listing 3/ months Charlotte Commons, LLC TBD $800,000 Cash to Seller $800,000 $0 $800,000 George Trujillo, Primera Topography: Shape: Utilities: Zoning: Allowable Bldg Area: Floor Area Ratio: No. of units: Max FAR: Frontage: Level, At Street Grade Square All Available PD Peachland Boulevard (210'); Analysis Use At Sale: Proposed Use or Dev. Price Per Acre: Price Per SF of Land: Price Per Unit: Price Per SF of Bldg: Vacant Land Retail Outparcel $963,855 $22.13 Comments This is a listing for an outparcel of a proposed anchored power/shopping center to be known as Charlotte Commons. The outparcel will be a pad site inclusive of site work/infrastructure and be located at the non-signalized corner of Veterans Boulevard and a shopping center entrance. This represents Outparcel 5 and is a representation of an interior outparcel facing Peachland Boulevard, the secondary roadway supporting the proposed development. Project development did not begin until September, Although no specifics have been released, the center is anticipated to be occupied by numerous big box tenants.
 Englewood,FL 33981 Charlotte 412106482002")
127 Crown Plaza Outparcel - Lot 2 RETAIL/COMMERCIAL LAND SALE No. 5 Location Data Location: County: Assessor's Parcel No: Atlas Ref: Physical Data Type: Land Area: Acres: Square Feet: McCall Road (SR 776) Englewood,FL Charlotte Retail/Commercial Gross Usable ,522 47,522 Sale Data Transaction Type: Date: Marketing Time: Grantor: Grantee: Document No.: Sale Price: Financing: Cash Eq.Price: Onsite/Offsite Costs: Adj. Sale Price: Verification: Listing 3/ months Crown Gateway, LLC $750,000 Cash to Seller $750,000 $0 $750,000 Jason Sepanski ( ) Topography: Shape: Utilities: Zoning: Allowable Bldg Area: Floor Area Ratio: No. of units: Max FAR: Frontage: Level, At Street Grade Rectangular All Available CG, Commercial General McCall Road (206'); Kevitt Boulevard (230') Analysis Use At Sale: Proposed Use or Dev. Price Per Acre: Price Per SF of Land: Price Per Unit: Price Per SF of Bldg: Vacant Outparcel Dollar General $687,442 $15.78 Comments The parcel is located along the south side of McCall Road (SR 776) at the southeast corner of Kevitt Boulevard, and is an outparcel to the Crown Plaza (Crown Gateway) shopping center in Englewood. This parcel is a corner location with a Burger King improved parcel to the east, followed by two vacant parcels and Englewood Bank on the hard corner. There is no direct access to this site from McCall Road. The center is anchored by Home Depot and has a vacant building pad for a complimenting anchor or in-line space. The seller was motivated by the financial challenges faced by Frank Menke and Gateway Development, who had numerous challenged retail developments in Southwest Florida with significant debt obligations. The property is reportedly in litigation and any pending deal would warrant approval by the presiding court until the foreclosure is resolved.
 Englewood,FL 33981 Charlotte 412105482001")
128 Crown Plaza Outparcel - Lot 3 RETAIL/COMMERCIAL LAND SALE No. 6 Location Data Location: County: Assessor's Parcel No: Atlas Ref: Physical Data Type: Land Area: Acres: Square Feet: McCall Road (SR 776) Englewood,FL Charlotte Retail/Commercial Gross Usable ,917 63,917 Sale Data Transaction Type: Date: Marketing Time: Grantor: Grantee: Document No.: Sale Price: Financing: Cash Eq.Price: Onsite/Offsite Costs: Adj. Sale Price: Verification: Listing 3/ months Crown Gateway, LLC $800,000 Cash to Seller $800,000 $0 $800,000 Jason Sepanski ( ) Topography: Shape: Utilities: Zoning: Allowable Bldg Area: Floor Area Ratio: No. of units: Max FAR: Frontage: Level, At Street Grade Rectangular All Available CG, Commercial General McCall Road (278'); Analysis Use At Sale: Proposed Use or Dev. Price Per Acre: Price Per SF of Land: Price Per Unit: Price Per SF of Bldg: Vacant Outparcel Dollar General $545,219 $12.52 Comments The parcel is located along the south side of McCall Road (SR 776), midway between Kevitt Boulevard and Gulfstream Boulevard, and is an outparcel to the Crown Plaza (Crown Gateway) shopping center in Englewood. This parcel is an interior location with parking to the east, followed by vacant parcel proposed for improvement with a Dollar General follwed by Englewood Bank on the hard corner. There is no direct access to this site from McCall Road. The center is anchored by Home Depot and has a vacant building pad for a complimenting anchor or in-line space. The seller was motivated by the financial challenges faced by Frank Menke and Gateway Development, who had numerous challenged retail developments in Southwest Florida with significant debt obligations. The property is reportedly in litigation and any pending deal would warrant approval by the presiding court until the foreclosure is resolved.

129 Harbor Square Plaza Outparcel (Lot 2) RETAIL/COMMERCIAL LAND SALE No. 7 Location Data Location: County: Assessor's Parcel No: Atlas Ref: Physical Data Type: Land Area: Acres: Square Feet: Topography: Shape: Utilities: Zoning: Allowable Bldg Area: Floor Area Ratio: No. of units: Max FAR: Frontage: SWQ of Cochran & Veterans Port Charlotte,FL Charlotte p/o Retail/Commercial Gross Usable ,045 47,045 Level, At Street Grade Rectangular All Available CG, Commercial General Cochran Boulevard (175'); Sale Data Transaction Type: Date: Marketing Time: Grantor: Grantee: Document No.: Sale Price: Financing: Cash Eq.Price: Onsite/Offsite Costs: Adj. Sale Price: Verification: Listing 3/ months Harbor Square Plaza, LLC $1,080,000 Cash to Seller $1,080,000 $0 $1,080,000 Duke Sullivan, listing broker/owner Analysis Use At Sale: Proposed Use or Dev. Price Per Acre: Price Per SF of Land: Price Per Unit: Price Per SF of Bldg: Vacant Outparcel Retail Outparcel $1,000,000 $22.96 Comments This represents a listing for Lot 2 of four outparcels located at the signlized corner of Cochran Boulevard and the access road into Harbor Square Plaza, a 134,373 S.F. Kohl's and PetSmart anchored shopping center that opened in April, The outparcel is graded and in pad ready status with off-site retention. The other three outparcels contain 1.07±, 1.36±, and 1.91± acres, with all fronting Cochran Boulevard. This listing was previously with CBRE, but the listing expired after a six month marketing period in The listing broker indicated their current asking price is $1,000,000 per acre, but no contracts were reported for any of the four parcels. Alternatively, he indicated they would lease the parcels at rates of $90K, $100K, $120K, and $160K. The broker indicated most interest reported in the market is presently concentrated along the 41 corridor and they were sitting on the parcels until demand expanded. The hard corner outparcel is occupied by Colonial Bank, that remains open for the time being.

130 Peachland Promenade Outparcel RETAIL/COMMERCIAL LAND SALE No. 8 Location Data Location: County: Assessor's Parcel No: Atlas Ref: Physical Data Type: Land Area: Acres: Square Feet: Peachland Blvd Port Charlotte,FL Charlotte Retail/Commercial Gross Usable ,382 41,382 Sale Data Transaction Type: Date: Marketing Time: Grantor: Grantee: Document No.: Sale Price: Financing: Cash Eq.Price: Onsite/Offsite Costs: Adj. Sale Price: Verification: Listing 3/ months Foxworthy McDonough LLC TBD $985,000 Cash to Seller $985,000 $0 $985,000 Allen Greer, broker Topography: Shape: Utilities: Zoning: Allowable Bldg Area: Floor Area Ratio: No. of units: Max FAR: Frontage: Level, At Street Grade Rectangular All Available PD, Planned Development Peachland Boulevard (appr. 180'); Analysis Use At Sale: Proposed Use or Dev. Price Per Acre: Price Per SF of Land: Price Per Unit: Price Per SF of Bldg: Vacant Outparcel Retail Outparcel $1,036,842 $23.80 Comments This is a vacant outparcel site situated along the south side of Peachland Boulevard within the Peachland Promenade Shopping Center, a Publix anchored retail center situated at the northwest quadrant of King's Highway and Veterans Boulevard, near the interchange of Interstaet 75 and King's Highway, in Port Charlotte, Florida. The site abutts a McDonald's restaurant and is bordered by any entry road into the center. The owner purchased the outparcel in July, 2007 as a speculative land investment for $600,000, and has since been marketing the property. The broker indicated they had received calls since the Charlotte Commons project began moving forward with construction, but had not yet moved forward with any specific contracts.

131 Wal-Mart Supercenter Outparcel (Lot 1) RETAIL/COMMERCIAL LAND SALE No. 9 Location Data Location: County: Assessor's Parcel No: Atlas Ref: Physical Data Type: Land Area: Acres: Square Feet: Topography: Shape: Utilities: Zoning: Allowable Bldg Area: Floor Area Ratio: No. of units: Max FAR: Frontage: 555 Kings Hwy Port Charlotte,FL Charlotte Retail/Commercial Gross Usable ,223 49,223 Level, At Street Grade Rectangular All Available PD, Planned Development N/S Kings Highway (appr. 330'); E/S I-75 (appr. 120') Sale Data Transaction Type: Date: Marketing Time: Grantor: Grantee: Document No.: Sale Price: Financing: Cash Eq.Price: Onsite/Offsite Costs: Adj. Sale Price: Verification: Listing 3/ months Wal-Mart Stores tbd $1,050,000 Cash to Seller $1,050,000 $0 $1,050,000 Felicia Hamilton, Wal-Mart Real Estate Manager Analysis Use At Sale: Proposed Use or Dev. Price Per Acre: Price Per SF of Land: Price Per Unit: Price Per SF of Bldg: Vacant Outparcel Retail Outparcel $929,203 $21.33 Comments The comparable is a pad-site within a recently completed 200,000 square foot Wal-Mart Supercenter that is located in the northeast quadrant of I-75 and Kings Highway, Port Charlotte, Charlotte County, Florida. This property is currently listed for sale for a reported price of $1,050,000; however, it is reported this parcel is under contract for $1,200,000 per Staubach RE broker. This parcel has liberal deed restrictions, allowing strip retail use. The property is located at the northwest corner of Kings Highway and Interstate 75, and its frontage is somewhat encumbered. The site benefits from high traffic counts despite its rural location, with Kings Hwy at 45,000 and I-75 at 98,000 (bi-directional). The 3-mile population is 26,129 with an average HH income of $60,165.

132 Wal-Mart Supercenter Outparcel (Lot 2) RETAIL/COMMERCIAL LAND SALE No. 10 Location Data Location: County: Assessor's Parcel No: Atlas Ref: Physical Data Type: Land Area: Acres: Square Feet: Topography: Shape: Utilities: Zoning: Allowable Bldg Area: Floor Area Ratio: No. of units: Max FAR: Frontage: 355 Kings Hwy Port Charlotte,FL Charlotte Retail/Commercial Gross Usable ,272 52,272 Level, At Street Grade Rectangular All Available PD, Planned Development Kings Highway (appr. 280'); Sale Data Transaction Type: Date: Marketing Time: Grantor: Grantee: Document No.: Sale Price: Financing: Cash Eq.Price: Onsite/Offsite Costs: Adj. Sale Price: Verification: Listing 3/ months CARISCH BROTHERS LIMITED tbd $900,000 Cash to Seller $900,000 $0 $900,000 Gary Tasman & Scott Cushman & Wakefield Analysis Use At Sale: Proposed Use or Dev. Price Per Acre: Price Per SF of Land: Price Per Unit: Price Per SF of Bldg: Vacant Outparcel Restaurant $750,000 $17.22 Comments The comparable is a pad-site within a recently completed 200,000 square foot Wal-Mart Supercenter that is located in the northeast quadrant of I-75 and Kings Highway, Port Charlotte, Charlotte County, Florida. This property is currently listed for sale for a reported price of $900,000. The present owner is an Arby's franchisee. One of the challenges in this asset is it has numerous use restrictions and its most likely tenant is a restaurant user. The property is located along the north side of Kings Highway between the Wal-Mart convenience store and a parcel that has not yet been improved. The corner parcel within this center that allows strip retail construction was reportedly under contract, but has not closed. The site benefits from high traffic counts despite its rural location, with Kings Hwy at 45,000 and I-75 at 98,000 (bi-directional). The 3-mile population is 26,129 with an average HH income of $60,165.

133 Winn Dixie McCall Rd Outparcel Listing RETAIL/COMMERCIAL LAND SALE No. 11 Location Data Location: County: Assessor's Parcel No: Atlas Ref: Physical Data Type: Land Area: Acres: Square Feet: 6440 Sunnybrook Blvd Port Charlotte,FL Charlotte Retail/Commercial Gross Usable ,616 23,616 Sale Data Transaction Type: Date: Marketing Time: Grantor: Grantee: Document No.: Sale Price: Financing: Cash Eq.Price: Onsite/Offsite Costs: Adj. Sale Price: Verification: Listing 3/ months SUNNYBROOK PARTNERS TBD $525,000 Cash to Seller $525,000 $0 $525,000 Glenn Brewer ( ) Topography: Shape: Utilities: Zoning: Allowable Bldg Area: Floor Area Ratio: No. of units: Max FAR: Frontage: Level, At Street Grade Rectangular All Available CG, Commercial General McCall Road (SR 776) - 192'; Sunnybrook Blvd - 123' Analysis Use At Sale: Proposed Use or Dev. Price Per Acre: Price Per SF of Land: Price Per Unit: Price Per SF of Bldg: Vacant Outparcel Retail Outparcel $968,456 $22.23 Comments This is a vacant outparcel site situated at the northeast corner of McCall Road (SR 776) and Sunnbrook Boulevard, at the northern exit to the Rotunda neighborhood, a planned commmunicty home to four golf courses. The center is anchored by Winn Dixie, but is somewhat dated in appearance. As well, Sunnybrook Boulevard does not extend beyond the immediate homes it serves to the north. The site is zoned CG, has cross access and parking easements, as well as off-site retention. The broker indicated they are asking $795,000, but this didn't mean much and their target price is $20 to $24 PSF. The broker indicated they had been marketing the parcel for an extended period and interest was limited.
134 ADDENDUM F SUBJECT SURVEYS
135

136

137
138 ADDENDUM G PRÉCIS METRO REPORT - ECONOMY.COM, INC.
139 PUNTA GORDA EMPLOYMENT GROWTH RANK Best=1 Worst= th 1st quintile st quintile LIFE CYCLE PHASE Growth/Mature VITALITY U.S.= 100% COST OF DOING BUSINESS U.S.= 100% COST OF LIVING U.S.= 100% 116% 93% 105% RELATIVE EMPLOYMENT PERFORMANCE (1994=100) Forecast DataBuffet MSA code: MPUG INDICATORS Gross metro product (C$B) % change Total employment (000) % change Unemployment rate Personal income growth Population (000) ,589 1,953 2,331 2,902 3, Single-family permits ,418 1, ,321 1,792 1, Multifamily permits Existing-home price ($ths) ,330 2,102 1,666 2,461 2,518 1,757 1,356 Mortgage originations ($mil) 1, Net migration (000) Personal bankruptcies 911 1,215 1,362 1,280 1,164 U.S. PUG SHORT TERM STRENGTHS & WEAKNESSES STRENGTHS Low living costs compared with other Gulf Coast metro areas. Strong business investment due to relatively low business costs. WEAKNESSES Housing market exposure has far-reaching effects on the economy. Narrow industrial base with heavy reliance on low-paying retail and services employment. Sharp reversal in demographics, with population now contracting. CURRENT EMPLOYMENT TRENDS Total Construction Manufacturing Trade Trans/Utilities Information Financial Activities Prof & Business Svcs Edu & Health Svcs Leisure & Hospitality Other Services Government W FORECAST RISKS LONG TERM OCTOBER 2009 % change yr ago, 3-mo MA X RISK-ADJUSTED RETURN, % UPSIDE Low-cost environment helps to attract businesses, boosting economic activity. DOWNSIDE Consumer spending faces greater setbacks than expected, resulting in larger contraction in oversize consumer industries. The housing market downturn is longer than expected, leading to an increasing number of foreclosures. Recent Performance. The severity of Punta Gorda s recession is moderating. The housing market is improving, and the contraction in consumer-related industries is slowing. House price and construction employment declines are moderating, and homebuilding has steadied. Leisure/hospitality and retail services have also improved, even though the consumer base has been battered by the recession. The improvement in some of the hardest-hit industries has not been sufficient to keep the unemployment rate from soaring to 12.6% in October, 1.4 percentage points higher than the state average. Moreover, the unemployment rate understates labor market slack, since discouraged workers are suspending their job search until conditions improve. Housing. PUG s housing market will improve in the coming quarters, as the severe housing market downturn is coming to an end. The large bubble and ensuing correction have pummeled the metro area s economy. However, falling inventory is allowing house price declines to slow and building to stabilize. Nonetheless, the damage is done: House prices have fallen 56% peak to current while only falling 30% nationally. Though expected to improve in the near term, the housing market will remain a drag on consumer industries, as household wealth and consumer spending have been battered by substantial house price declines and rising mortgage delinquencies. Longer term, housing demand will be strong as retiree migration drives aboveaverage population growth. Retirees. PUG s warm climate and relative affordability compared with neighboring metro areas will continue to entice retirees with tight budgets. The financial market fallout has had major consequences for the metro area s older consumer base, but the turnaround in financial markets will allow consumers with a large portion of their income tied to retiree accounts to breathe a sigh of relief. ANALYSIS Retirees are already very important to PUG s economy; they make up nearly twice the share of the population as they do nationally. The share of retirees will grow as the large baby boomer generation reaches retirement age. Healthcare will be one of the main beneficiaries of this migration trend. Its expansion will shield the metro area somewhat from business cycle volatility. Industrial diversity. Despite its high exposure to the retiree population and healthcare, PUG s economy is surprisingly diverse compared with metro areas of similar size. Moreover, the metro area s industrial diversity index has been rising steadily for nearly 30 years. Though this trend is likely over, the significant increase in the metro area s industrial diversity is thanks to a shift from public sector employment to consumer and healthcare industries. A diverse industry structure will aid the metro area, as the weight of recovery will not rest on any particular industry. In addition, businesses and residents that are seeking a diverse set of opportunities and a stable economic base will be attracted to the area. Punta Gorda s economy will contract into next year. Conditions will improve as the housing market rebounds and impediments to consumer spending slowly abate. Risks remain weighted to the downside, however, as numerous obstacles potentially stand in the way of healthier consumers, including a more protracted labor market contraction, more severe house price declines, and financial market weakness. Longer term, the metro area will benefit from the influx of retirees that are drawn to the metro area s attractive quality of life. However, the in-migration of retirees will also keep the economy highly dependent on consumer services. Jason Kunkel November 2009 Moody s Economy.com help@economy.com Précis METRO November 2009
140 TOP EMPLOYERS Wal-Mart Stores, Inc. 1,273 Peace River Medical 1,048 Publix Supermarkets, Inc. 1,043 Charlotte Regional Medical Center 830 Fawcett Memorial Hospital 664 The Home Depot, Inc. 536 Charlotte Correctional Institute 426 Sun Coast Media Group, Inc. 322 GMRI, Inc. 275 Winn Dixie, Inc. 267 Prestige Readymix Management 224 Family Home Health Services 223 Harbour Health Center 223 Charlotte Harbor Healthcare 217 HQM of Port Charlotte LLC 216 Palm Auto Group 216 Dr. GoodRoof, Inc. 195 Burnt Store Marina and Country Club 171 Charlotte County Family YMCA 155 Cracker Barrel 145 Source: Charlotte County Economic Development Council, Inc., May 2006 PUBLIC Federal 300 State 933 Local 5, EMPLOYMENT & INDUSTRY INDUSTRIAL DIVERSITY EMPLOYMENT VOLATILITY Due to U.S. fluctuations Relative to U.S. COMPARATIVE EMPLOYMENT AND INCOME Sector % of Total Employment Average Annual Earnings Construction Manufacturing Durable Nondurable Transportation/Utilities Wholesale Trade Retail Trade Information Financial Activities Prof. and Bus. Services Educ. and Health Services Leisure and Hosp. Services Other Services Government Not due to U.S. Most Diverse (U.S.) Least Diverse Due to U.S. Sources: Percent of total employment Moody s Economy.com & BLS, 2008; Average annual earnings BEA, % 80% 60% 40% 20% 0% PUG FL U.S. 8.8% 6.6% 5.3% 1.7% 4.8% 9.8% 80.9% 67.3% 63.1% 19.1% 32.7% 36.9% 1.6% 3.1% 3.7% 1.8% 4.5% 4.4% 20.4% 12.7% 11.2% 1.4% 2.0% 2.2% 5.3% 6.8% 5.9% 7.9% 14.8% 13.0% 19.5% 13.5% 13.8% 12.0% 12.1% 9.8% 4.6% 4.4% 4.0% 14.8% 14.5% 16.4% % PUG 100 U.S. PUG FL U.S. $35,589 $48,524 $52,869 $37,184 $60,325 $68,860 nd $62,825 $70,136 nd $55,222 $66,651 $24,579 $48,856 $57,176 $42,203 $67,567 $72,229 $25,018 $30,760 $30,169 $35,387 $71,040 $85,435 $16,055 $38,628 $51,702 $30,179 $44,359 $56,434 $44,380 $46,047 $45,677 $17,258 $26,676 $23,049 $22,070 $27,500 $32,271 $53,730 $61,759 $60,777 MIGRATION FLOWS INTO PUNTA GORDA, FL NUMBER OF MIGRANTS Bradenton, FL 2,182 Cape Coral, FL 733 Tampa, FL 319 Miami, FL 217 Orlando, FL 187 Fort Lauderdale, FL 172 Naples, FL 159 New York, NY 137 West Palm Beach, FL 98 Nassau, NY 96 Total In-migration 9,849 FROM PUNTA GORDA, FL Bradenton, FL 2,088 Cape Coral, FL 523 Tampa, FL 351 Orlando, FL 218 Miami, FL 124 Fort Lauderdale, FL 104 Lakeland, FL 80 Naples, FL 76 Providence, RI 60 Gainesville, FL 57 Total Out-migration 8,806 Net Migration 1,043 1,500 1, ,000-1,500-2,000 Net Migration, PUG Domestic -1, , Foreign Total -1, , Sources: IRS (top), 2008; Census Bureau, 2008 HOUSE PRICES LEADING INDUSTRIES PER CAPITA INCOME 350 NAICS INDUSTRY EMPLOYEES (000) GVSL State & Local Government Full-Service Restaurants General Medical and Surgical Hospitals Offi ces of Physicians Grocery Stores Nursing Care Facilities Other General Merchandise Stores Limited-Service Eating Places Department Stores ,978 39,204 39, Building Equipment Contractors Foundation, Structure & Bldg. Ext. Contract Services to Buildings and Dwellings Building Material and Supplies Dealers 0.8 PUG U.S Depository Credit Intermediation 0.8 Source: FHFA, 1987Q1=100, NSA 7139 Other Amusement and Recreation Industries 0.7 PUG FL U.S. High-tech employment 0.5 CREDIT QUALITY As % of total employment 1.2 MOODY S RATING COUNTY Sources: BLS, Moody s Economy.com, 2008 Source: Bureau of Economic Analysis, 2007 Aa3 Moody s Economy.com help@economy.com Précis METRO November 2009
141 PUNTA GORDA Labor Market Losses Abating as Housing Market Improves......But Will Be Weak Into Next Year Thanks Largely to Services 4 Leis./hosp. Source: Moody s Economy.com 2 0 U.S. Other Educ./health Punta Gorda Florida Manufacturing Government Bus./prof Payroll employment, % change yr ago, 3-mo MA Retail Construction Employment change, ths Depressed Prices and Building Rebalancing Housing Market......And Have Helped Boost Affordability Cape Coral 3.0 Median house price, $ ths (R) 210 Punta Gorda Sarasota Single-family permits, ths (L) West Palm Beach Naples Housing affordability index, % of median-priced house that median income-earning family can afford, 2009Q3 Source: Moody's Economy.com Rising Bankruptcies Will Weigh on Consumer Spending Current Recession Will Be Most Protracted in Memory Bankruptcies per 1,000 households Employment, % change yr ago Sources: BLS, Moody s Economy.com Forecast U.S. Punta Gorda Moody s Economy.com help@economy.com Précis METRO November 2009
142 2009, Moody s Analytics, Inc. and/or its licensors and affiliates (together, Moody s ). All rights reserved. ALL INFORMATION CONTAINED HEREIN IS PROTECTED BY COPYRIGHT LAW AND NONE OF SUCH INFORMATION MAY BE COPIED OR OTHERWISE REPRODUCED, REPACKAGED, FURTHER TRANSMITTED, TRANSFERRED, DISSEMINATED, REDISTRIBUTED OR RESOLD, OR STORED FOR SUBSEQUENT USE FOR ANY PURPOSE, IN WHOLE OR IN PART, IN ANY FORM OR MANNER OR BY ANY MEANS WHATSOEVER, BY ANY PERSON WITHOUT MOODY S PRIOR WRITTEN CONSENT. All information contained herein is obtained by Moody s from sources believed by it to be accurate and reliable. Because of the possibility of human and mechanical error as well as other factors, however, all information contained herein is provided AS IS without warranty of any kind. Under no circumstances shall Moody s have any liability to any person or entity for (a) any loss or damage in whole or in part caused by, resulting from, or relating to, any error (negligent or otherwise) or other circumstance or contingency within or outside the control of Moody s or any of its directors, officers, employees or agents in connection with the procurement, collection, compilation, analysis, interpretation, communication, publication or delivery of any such information, or (b) any direct, indirect, special, consequential, compensatory or incidental damages whatsoever (including without limitation, lost profits), even if Moody s is advised in advance of the possibility of such damages, resulting from the use of or inability to use, any such information. The financial reporting, analysis, projections, observations, and other information contained herein are, and must be construed solely as, statements of opinion and not statements of fact or recommendations to purchase, sell, or hold any securities. NO WARRANTY, EXPRESS OR IMPLIED, AS TO THE ACCURACY, TIMELINESS, COMPLETENESS, MERCHANTABILITY OR FITNESS FOR ANY PARTICULAR PURPOSE OF ANY SUCH OPINION OR INFORMATION IS GIVEN OR MADE BY MOODY S IN ANY FORM OR MANNER WHATSOEVER. Each opinion must be weighed solely as one factor in any investment decision made by or on behalf of any user of the information contained herein, and each such user must accordingly make its own study and evaluation prior to investing. Moody s Economy.com help@economy.com Précis METRO November 2009
143 ADDENDUM H CLIENT ENGAGEMENT LETTER

144
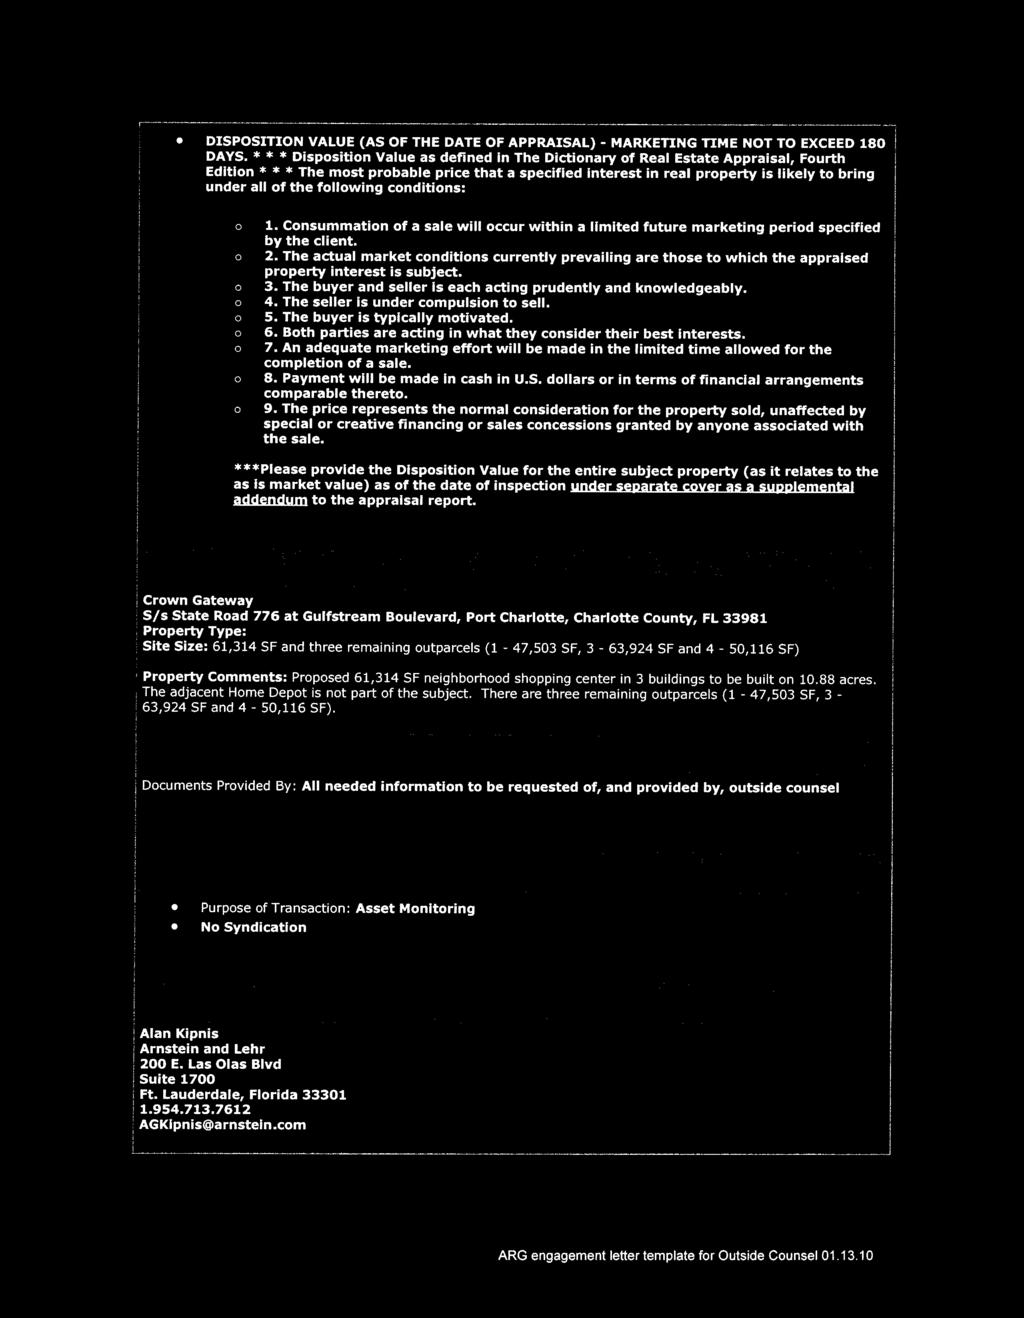
145
Profile of International Home Buyers in Florida
 Profile of International Home Buyers in Florida Research Division National Association of REALTORS 2009 Prepared for the Florida Association of REALTORS 2009 National Association of REALTORS Profile of
ECONOMIC CURRENTS. Vol. 4, Issue 3. THE Introduction SOUTH FLORIDA ECONOMIC QUARTERLY
 ECONOMIC CURRENTS THE Introduction SOUTH FLORIDA ECONOMIC QUARTERLY Vol. 4, Issue 3 Economic Currents provides an overview of the South Florida regional economy. The report presents current employment,
ECONOMIC CURRENTS. Vol. 3, Issue 1. THE SOUTH FLORIDA ECONOMIC QUARTERLY Introduction
 ECONOMIC CURRENTS THE SOUTH FLORIDA ECONOMIC QUARTERLY Introduction Economic Currents provides an overview of the South Florida regional economy. The report contains current employment, economic and real
RESTRICTED APPRAISAL REPORT
 Restricted Use Appraisal Report Thomas J. Schulte & Associates Page #1 RESTRICTED APPRAISAL REPORT SUBJECT ASSIGNMENT Property City: Zip Code: County: Legal Description: Assessor's Parcel #: Tax Year:
APPRAISAL REPORT OF GROSS ACRES/17.72± USABLE ACRES OF VACANT COMMERCIAL LAND
 APPRAISAL REPORT OF 20.22 GROSS ACRES/17.72± USABLE ACRES OF VACANT COMMERCIAL LAND LOCATED AT NORTHWEST CORNER OF LAND O LAKES BOULEVARD & SUNTERRA DRIVE LAND O LAKES, FLORIDA 34638 Job No.: 14-0227 Prepared
To all Appraisers: Brief Overview:
 To all Appraisers: As the appraisal industry continues to change, the demand for alternative valuation solutions grows. That is why is excited to announce the addition of a new product - the Desktop Appraisal
ECONOMIC CURRENTS. Vol. 3, Issue 3 SOUTH FLORIDA ECONOMIC QUARTERLY. Introduction
 ECONOMIC CURRENTS THE Introduction SOUTH FLORIDA ECONOMIC QUARTERLY Economic Currents provides an overview of the South Florida regional economy. The report presents current employment, economic and real
As Of: Prepared For: Prepared By:
 of 216 SW 131st St As Of: 06/11/11 Prepared For: Prime Pacific Bank 2502 196th St SW Lynnwood WA 98036 Prepared By: Cynthia A. Nagle, CREA 922 N Cedar St Tacoma, WA 98406 RESTRICTED APPRAISAL REPORT Restriction
Houston Summer Retail. Office. July 2016 Commercial Markets. Independent Valuations for a Variable World Page 1. Summary Q1 Statistics
 July 2016 Commercial Markets In This Issue Commercial Markets Retail Office Industrial Multifamily Housing Trends Single Family Housing Lot Supply & New Home Data % 10% 8% 6% 4% 2% 0% Retail 2007 Q1 2008
ECONOMIC CURRENTS. Vol. 5 Issue 2 SOUTH FLORIDA ECONOMIC QUARTERLY. Key Findings, 2 nd Quarter, 2015
 ECONOMIC CURRENTS THE Introduction SOUTH FLORIDA ECONOMIC QUARTERLY Economic Currents provides an overview of the South Florida regional economy. The report presents current employment, economic and real
Brad O Connor, Ph.D. Chief Economist FloridaRealtors
 Brad O Connor, Ph.D. Chief Economist FloridaRealtors brado@floridarealtors.org Overall, statewide sales growth has been stagnant since Q4 of 2015 Produced by Florida Realtors Research with data provided
Copyright, 1999, 2002, 2004, Freddie Mac. All Rights Reserved.
 Page 1 of 13 Engineering Requirements/Chapter 12: Appraiser and Appraisal Requirements/12.1: General requirements 12.1: General requirements For all multifamily purchase programs and products, the Seller/Servicer
619 STANDARD 2: REAL PROPERTY APPRAISAL, REPORTING
 619 STANDARD 2: REAL PROPERTY APPRAISAL, REPORTING 620 In reporting the results of a real property appraisal, an appraiser must communicate each analysis, 621 opinion, and conclusion in a manner that is
BADGER Appraisals, LLC
 BADGER Appraisals, LLC PO Box 2222 Appleton, WI 54912 T (920) 687-9000 / F (920) 687-9244 info@badgerappraisals.com www.badgerappraisals.com Appraisal Service Brown * Calumet * Outagamie * Winnebago APPRAISAL
The Florida Housing Market
 Florida International University FIU Digital Commons Economics Research Occasional Paper Series Department of Economics 1-2007 The Florida Housing Market Jorge Salazar-Carrillo Department of Economics,
Housing Price Forecasts. Illinois and Chicago PMSA, October 2014
 Housing Price Forecasts Illinois and Chicago PMSA, October 2014 Presented To Illinois Association of Realtors From R E A L Regional Economics Applications Laboratory, Institute of Government and Public
An Introduction to RPX INTRODUCTION
 An Introduction to RPX INTRODUCTION Radar Logic is a real estate information company based in New York. We convert public residential closing data into information about the state and prospects for the
Appraisal and Market Analysis of Indoor Waterpark Resorts
 Appraisal and Market Analysis of Indoor Waterpark Resorts By David J. Sangree, MAI, CPA, ISHC An appraisal of an indoor waterpark resort is similar to other appraisals in that it is a professional appraiser
Anatomy Of An Appraisal
 Anatomy Of An Appraisal Leslie A. Fields The most important thing to know about an appraisal report is how to review and critique it. Leslie A. Fields a partner with the Law Firm of Faegre & Benson LLP,
Case 9:15-cv DMM Document Entered on FLSD Docket 11/22/2017 Page 1 of 12
 Case 9:15-cv-80946-DMM Document 181-5 Entered on FLSD Docket 11/22/2017 Page 1 of 12 APPRAISAL OF A 1.31 ACRE SITE LOCATED AT: XXX 77th Trl N (long legal description/see page #1) Palm Beach Gardens, FL
Mike Dalton Jr. and Associates. Christina Adams INVOICE NUMBER Mike Dalton Jr. and Associates 8191 Wethersfield Drive. PB125 Germantown, TN 38138
 Mike Dalton Jr. and Associates FROM: INVOICE Christina Adams INVOICE NUMBER Mike Dalton Jr. and Associates 8191 Wethersfield Drive Germantown, TN 38138 DATE 08/14/2016 Telephone Number: (901) 674-0239
BADGER Appraisals, LLC
 BADGER Appraisals, LLC PO Box 2222 Appleton, WI 54912 T (920) 687-9000 / F (920) 687-9244 info@badgerappraisals.com www.badgerappraisals.com Residential Appraisal Service Brown * Calumet * Outagamie *
Existing Conditions: Economic Market Assessment
 Existing Conditions: Economic Market Assessment Introduction The US 24/40 Corridor Study examined existing conditions as they related to economic and commercial market assessments, existing land use, and
The State of the Nation s Housing 2007: A Sneak Peek
 The State of the Nation s Housing 2007: A Sneak Peek Eric Belsky Remodeling Futures Conference April 10, 2007 Do Not Distribute Embargoed Until June 11, 2007 www.jchs.harvard.edu The Homebuilding Correction
How to Read a Real Estate Appraisal Report
 How to Read a Real Estate Appraisal Report Much of the private, corporate and public wealth of the world consists of real estate. The magnitude of this fundamental resource creates a need for informed
LAND APPRAISAL REPORT
 IDENTIFICATION LAND APPRAISAL REPORT Page #1 File No. Borrower None Census Tract * Map Reference 462820011000315 Property Address NWC Gaar and Pleasant View Roads City Richmond County Wayne State IN Zip
Economic Highlights. Payroll Employment Growth by State 1. Durable Goods 2. The Conference Board Consumer Confidence Index 3
 August 26, 2009 Economic Highlights Southeastern Employment Payroll Employment Growth by State 1 Manufacturing Durable Goods 2 Consumer Spending The Conference Board Consumer Confidence Index 3 Real Estate
Dear Valuation Professional
 Dear Valuation Professional First American Mortgage Solutions LLC has a new product offering that we would like you to consider adding to your list of services with us - (Property Assessment Collateral
Exhibit IV. Property Appraisal Report by Intrgra Realty Resources dated 10/3/16
 Exhibit IV. Property Appraisal Report by Intrgra Realty Resources dated 10/3/16 RFP 2018C-01 COMMERCIAL REAL ESTATE SERVICES - FLAGLER CENTER PROPERTY Page 40 of 42 Integra Realty Resources Jacksonville
MULTIFAMILY 2012 MULTI-FAMILY HAMPTON ROADS MARKET REVIEW. Author. Data Analysis. Financial Support. Disclosure. Charles Dalton.
 HAMPTON ROADS MARKET REVIEW MULTIFAMILY Author Data Analysis Financial Support Disclosure Charles Dalton Real Data The E. V. Williams Center for Real Estate and Economic Development (CREED) functions and
Housing Price Forecasts. Illinois and Chicago PMSA, December 2015
 Housing Price Forecasts Illinois and Chicago PMSA, December 2015 Presented To Illinois Association of Realtors From R E A L Regional Economics Applications Laboratory, Institute of Government and Public
U.S. Foreclosure Activity Increases 2 Percent in July Boosted by 6 Percent Increase in Foreclosure Starts
 August 13, 2013 By RealtyTrac Staff U.S. Foreclosure Activity Increases 2 Percent in July Boosted by 6 Percent Increase in Foreclosure Starts Bank Repossessions Up 4 Percent From Previous Month, 29 States
Foreclosures Continue to Bring Home Prices Down * FNC releases Q Update of Market Distress and Foreclosure Discount
 Foreclosures Continue to Bring Home Prices Down * FNC releases Q4 2011 Update of Market Distress and Foreclosure Discount The latest FNC Residential Price Index (RPI), released Monday, indicates that U.S.
Case 9:15-cv DMM Document Entered on FLSD Docket 11/22/2017 Page 1 of 11
 Case 9:15-cv-80946-DMM Document 181-3 Entered on FLSD Docket 11/22/2017 Page 1 of 11 G.F. Lubeck Appraisers, LLC 1250 N. Ocean Drive Riviera Beach, FL 33404 www.lubeckappraisers.com March 01, 2017 James
A Demonstration Appraisal Report. Of a. Located at. Date of Appraisal. Prepared for. Prepared by
 A Demonstration Appraisal Report Of a Located at Date of Appraisal Prepared for Prepared by International Association of Assessing Officers Professional Designation Subcommittee 314 West 10 th Street Kansas
ILLINOIS HOUSING DEVELOPMENT AUTHORITY APPRAISAL SCOPE AND GUIDELINES December 2015
 ILLINOIS HOUSING DEVELOPMENT AUTHORITY APPRAISAL SCOPE AND GUIDELINES December 2015 As part of the Common Application for Multifamily Financing, the Illinois Housing Development Authority (IHDA) requires
The Seattle MD Apartment Market Report
 The Seattle MD Apartment Market Report Volume 16 Issue 2, December 2016 The Nation s Crane Capital Seattle continues to experience an apartment boom which requires constant construction of new units. At
RAINS COUNTY APPRAISAL DISTRICT
 RAINS COUNTY APPRAISAL DISTRICT 2017 MASS APPRAISAL SUMMARY REPORT mass appraisal report 2017 uspap_appr_report RAINS COUNTY APPRAISAL DISTRICT 2017 MASS APPRAISAL SUMMARY REPORT Identification of Subject:
OBSERVATION. TD Economics IS THE AMERICAN HOUSING REBOUND SUSTAINABLE?
 OBSERVATION TD Economics IS THE AMERICAN HOUSING REBOUND SUSTAINABLE? Highlights 2012 was a very good year for the U.S. housing market. Home prices were up almost 8% and housing starts by close to 30%.
U.S. DEPARTMENT OF HUD 04/11/2017 STATE: FLORIDA ADJUSTED HOME INCOME LIMITS
 Cape Coral-Fort Myers, FL MSA 30% LIMITS 12150 13900 15650 17350 18750 20150 21550 22950 VERY LOW INCOME 20300 23200 26100 28950 31300 33600 35900 38250 60% LIMITS 24360 27840 31320 34740 37560 40320 43080
The State of Florida s. Housing Douglas White Florida Housing Data Clearinghouse Shimberg Center University of Florida
 The State of Florida s Housing 2008 Douglas White Florida Housing Data Clearinghouse Shimberg Center University of Florida Jim Martinez Florida Housing Data Clearinghouse Shimberg Center University of
Multi-Family Methodology Analysis
 Multi-Family Methodology 2018 Analysis Assessment Department February, 2018 2018 Multi-Family Assessment Methodology Property assessments in the City of Medicine Hat reflect the fee simple market value
California Housing Market Update. Monthly Sales and Price Statistics September 2018
 California Housing Market Update Monthly Sales and Price Statistics September 2018 Sales Had the Largest Decline since March 2014 California, September 2018 Sales: 382,550 Units, -3.3% YTD, -12.4% YTY
A Demonstration Appraisal Report. Of a. Located at. Date of Appraisal. Prepared for. Prepared by
 A Demonstration Appraisal Report Of a Located at Date of Appraisal Prepared for Prepared by International Association of Assessing Officers Professional Designation Subcommittee 314 W. 10 th Street Kansas
RECOMMENDED METHODOLOGY FOR SUPPLY & DEMAND ANALYSIS FOR BROWARD COUNTY S AFFORDABLE HOUSING MARKET
 RECOMMENDED METHODOLOGY FOR SUPPLY & DEMAND ANALYSIS FOR BROWARD COUNTY S AFFORDABLE HOUSING MARKET PREPARED FOR BROWARD COUNTY 110 NE 3 RD STREET FT. LAUDERDALE, FLORIDA 33301 ATTN: MR. RALPH STONE, EXECUTIVE
Market Overview TAMPA BAY OFFICE THIRD QUARTER
 Market Overview TAMPA BAY OFFICE THIRD QUARTER 29 COLLIERS ARNOLD TAMPA BAY Insights on the Market OFFICE THIRD QUARTER 29 MARKET INDICATORS TAMPA BAY INVENTORY 8,58,612 Sq. Ft. Q3 Q4* OVERALL VACANCY
REAL ESTATE AND THE ECONOMIC OUTLOOK THROUGH 2013:
 1 1 REAL ESTATE AND THE ECONOMIC OUTLOOK THROUGH 2013: Coping With A Different Kind Of Housing Recovery A Presentation To The Commercial Real Estate Education Summit Monrovia, California July 13, 2012
APPRAISAL REPORT. Vacant Commercial Land SW 268 th Street Miami, FL Cruz Appraisals, Inc SW 72 nd Street, Suite 263 Miami, FL 33173
 APPRAISAL REPORT Prepared for Mr Jorge Palomeras Jpal Marketing Corporation Property Appraised Vacant Commercial Land 12711 SW 268 th Street Miami, FL 33032 Date of Valuation October 6, 2017 Prepared by
Monthly Indicators + 7.3% + 6.6% + 8.3% Single-Family Market Overview Condo Market Overview New Listings Pending Sales.
 Monthly Indicators 2018 The three most prominent national market trends for residential real estate are the ongoing lack of abundant inventory, the steadily upward movement of home prices and year-over-year
2013 San Diego Economic Outlook. 29 th Annual Economic Roundtable Marney Cox Chief Economist San Diego Association of Governments January 25, 2013
 213 San Diego Economic Outlook 29 th Annual Economic Roundtable Marney Cox Chief Economist San Diego Association of Governments January 25, 213 US The Problem Slow Economic Growth Gross Domestic Product
California Housing Market Update. Monthly Sales and Price Statistics December 2018
 California Housing Market Update Monthly Sales and Price Statistics December 2018 Sales Reached the Lowest Level since Jan 2015 California, December 2018 Sales: 372,260 Units, -5.2% YTD, -11.6% YTY 700,000
APPRAISAL OF REAL PROPERTY LOCATED AT: FOR: AS OF: BY:
 APPRAISAL OF REAL PROPERTY LOCATED AT: 627/631 NW 14 STREET SEE ADDENDUM FOR COMPLETE LEGAL DESCRIPTION FLORIDA CITY, FL 33034 FOR: 1261 HOMESTEAD ROAD LEHIGH ACRES, FL 33936 AS OF: 10/20/2014 BY: LINDA
The State of Florida s. Housing Douglas White. Florida Housing Data Clearinghouse. Shimberg Center. University of Florida
 The State of Florida s Housing 2007 Douglas White, Florida Housing Data Clearinghouse, Shimberg Center, University of Florida Jim Martinez, Florida Housing Data Clearinghouse, Shimberg Center, University
Pikes Peak area housing Market Statistics (As of: 9/30/2018)
") $156,25 $184, $174,697 $177,2 $21,53 $185,83 $173, $178,29 $172,25 $212,75 $21,95 $226,692 $197,5 $199, $196, $28, $25, $223,95 $216,75 $29,527 $234,9 $218,82 $229,74 $235,518 $231,457 $255, $259,11 $269,98
$156,25 $184, $174,697 $177,2 $21,53 $185,83 $173, $178,29 $172,25 $212,75 $21,95 $226,692 $197,5 $199, $196, $28, $25, $223,95 $216,75 $29,527 $234,9 $218,82 $229,74 $235,518 $231,457 $255, $259,11 $269,98
AAug ugust 2017
 August 17 17 Housing recovery a balancing act Growth in new listings outpaced sales preventing inventory declines City of Calgary, September 1, 17 Sales posted a modest gain in August, but a rise in new
Guide Note 12 Analyzing Market Trends
 Guide Note 12 Analyzing Market Trends Introduction Since the value of a property is equal to the present value of all of the future benefits it brings to its owner, market value is dependent on the expectations
1200 Premier Drive, Suite 140 Chattanooga, TN Each office is independently owned and operated.
 THIS MONTH IN REAL ESTATE K im aulston R REALTOR 1200 Premier Drive, Suite 140 Chattanooga, TN 37421 Each office is independently owned and operated. Cell: 423-316-4022 Office: 423-664-1600 Email: kcraulston@gmail.com
Las Vegas Valley Executive Summary
 ARROYO MARKET SQUARE Las Vegas Valley Executive Summary Retail Market 4th Quarter 2013 THE DISTRICT AT GREEN VALLEY RANCH January 23, 2014 Re: Commercial Real Estate Survey: 4th Quarter, 2013 Dear Reader,
APPRAISAL OF 1117 MONROE STREET, VICKSBURG, MS 39180
 APPRAISAL OF 1117 MONROE STREET, VICKSBURG, MS 39180 CLIENT/INTENDED USER: GLENN TRIPLETT INTENDED USE/USER: TO ASSIST THE CLIENT IN MAKING A PURCHASING DECISION. THIS REPORT IS NOT INTENDED FOR ANY OTHER
RESIDENTIAL APPRAISAL SUMMARY REPORT
 SUBJECT ASSIGNMENT MARKET AREA DESCRIPTION Property City: Zip Code: County: Legal Description: Assessor's Parcel #: Tax Year: R.E. Taxes: $ Special Assessments: $ Borrower (if applicable): Current Owner
2012 Profile of Home Buyers and Sellers New Jersey Report
 Prepared for: New Jersey Association of REALTORS Prepared by: Research Division December 2012 Table of Contents Introduction... 2 Highlights... 4 Conclusion... 7 Report Prepared by: Jessica Lautz 202-383-1155
NATIONAL ASSOCIATION of REALTORS RESEARCH DIVISION. Prepared for Florida REALTORS
 NATIONAL ASSOCIATION of REALTORS RESEARCH DIVISION Prepared for Florida REALTORS NATIONAL ASSOCIATION OF REALTORS RESEARCH DIVISION Page 1 Page 3 Page 4 Page 6 Page 7 Page 8 Page 9 Page 10 Page 11 Page
Housing Bulletin Monthly Report
 August 21 Housing Bulletin Monthly Report 1 C a n a da s P r e li m i n a ry H o u s i n g S ta r t s s l i p i n J u ly Preliminary Housing St arts in Albert a* and Canada* July 28 to July 21 25, Canada
APPRAISAL REPORT OF THE REAL PROPERTY LOCATED AT. Enterprise Rd Dillon, SC Ronnie Gardner. March 1, 2018
 APPRAISAL REPORT OF THE REAL PROPERTY LOCATED AT Dillon, SC 29536 for as of March 1, 2018 by David McLaurin 105 West Harrison Street Dillon, SC 29536 IDENTIFICATION NEIGHBORHOOD SITE MARKET DATA ANALYSIS
STATE OF THE MULTIFAMILY MARKET MACRO VIEW
 STATE OF THE MULTIFAMILY MARKET MACRO VIEW JEANETTE I. RICE, CRE AMERICAS HEAD OF MULTIFAMILY RESEARCH APRIL 19, 2018 Westchester/ Fairfield 2 JEANETTE I. RICE STATE OF U.S. MULTIFAMILY MARKET KEY INVESTMENT
MARKET OUTLOOK FOR SAN MATEO
 MARKET OUTLOOK FOR SAN MATEO Jonathan Smoke Chief Economist August 2, 2016 NATIONAL TRENDS 2 JOB CREATION REBOUNDED IN JUNE 229,000 jobs created by month in 2015; 172,000 average this year Employment and
San Francisco Bay Area to Napa County Housing and Economic Outlook
 San Francisco Bay Area to 019 Napa County Housing and Economic Outlook Bay Area Economic Forecast Summary Presented by Pacific Union International, Inc. and John Burns Real Estate Consulting, LLC On Nov.
Woolbright Development Research Retail Market Overview: Palm Beach
 Retail Market Overview: 2015 FIRST QUARTER Jacksonville The Retail Market Continues a Moderate Recovery; Average Occupancy Levels Stand Flat at 90%, and Average Base Rental Rates At Publix Anchored Centers
VALUE FINDING APPRAISAL REPORT
 RE 90 Rev. 01-2014 VALUE FINDING APPRAISAL REPORT (Compensation not to exceed $65,000) COUNTY John Doe 2880 Lancaster-Newark Rd. (SR 37), Pleasant Twp., 43030 Owner Mailing Address of Owner East side of
REED APPRAISAL COMPANY REAL PROPERTY APPRAISERS AND CONSULTANTS
 REAL PROPERTY APPRAISERS AND CONSULTANTS 100 SOUTH KENTUCKY AVENUE #230 ip.o. BOX 1645 ilakeland, FLORIDA 33802-1645 OFFICE: (863) 688-6718 ifax: (863) 688-5993iEMAIL: stan@reedappraisalco.com TO: Henry
Interagency. Appraisal and Evaluation. Guidelines
 Interagency Appraisal and Evaluation Guidelines (December 2, 2010) Interagency Appraisal and Evaluation Guidelines Table of Contents I. Purpose..............................................................
Cycle Monitor Real Estate Market Cycles Second Quarter 2018 Analysis
 Black Creek Research Cycle Monitor Real Estate Market Cycles Second Quarter 0 Analysis Real Estate Market Cycle analysis of five property types in Metropolitan Statistical Areas (MSAs). Important note:
REAL ESTATE MARKET REVIEW
 MULTIFAMILY 2014 HAMPTON ROADS REAL ESTATE MARKET REVIEW Author Charles Dalton Data Analysis Real Data Financial Support The E.V. Williams Center for Real Estate and Economic Development (CREED) functions
THE ELUSIVE CAP RATE Finding & Supporting Cap Rates in Uncertain Times
 THE ELUSIVE CAP RATE Finding & Supporting Cap Rates in Uncertain Times Presented May 14, 2013 at the New Hampshire Association of Assessing Officers in Concord, NH by Peter F. Korpacz, MAI, CRE, FRICS
SUBJECT: Interagency Appraisal and Evaluation Guidelines
 BOARD OF GOVERNORS OF THE FEDERAL RESERVE SYSTEM WASHINGTON, D. C. 20551 DIVISION OF BANKING SUPERVISION AND REGULATION TO THE OFFICER IN CHARGE OF SUPERVISION AT EACH FEDERAL RESERVE BANK SUBJECT: Interagency
Housing Bulletin Monthly Report
 October 21 1 Housing Bulletin Monthly Report Housing Starts show Slight improvement in September CANADA Housing Starts 2, 15, 1, 5, Sep 8 Oct 8 Nov 8 Dec 8 Preliminary Housing Starts in Alberta and Canada
APPRAISING COMMERCIAL INVESTMENT PROPERTY
 APPRAISING COMMERCIAL INVESTMENT PROPERTY Cydney G. Bender-Reents, MAI President Jared M. Calabrese, MAI Senior Appraiser YOUR HOUSE AS SEEN BY: Yourself Your Lender YOUR HOUSE AS SEEN BY: Your Buyer Your
LUXURY MARKET REPORT. - May
 LUXURY MARKET REPORT - May 2018 - www.luxuryhomeing.com THIS IS YOUR LUXURY MARKET REPORT MAP OF LUXURY RESIDENTIAL MARKETS Welcome to the Luxury Report, your guide to luxury real estate market data and
Residential September 2010
 Residential September 2010 Karl L. Guntermann Fred E. Taylor Professor of Real Estate Adam Nowak Research Associate For the first time since March, house prices turned down slightly in August (-2 percent)
FOR IMMEDIATE RELEASE Contact: David B. Bennett President & CEO Phone:
 FOR IMMEDIATE RELEASE Contact: David B. Bennett President & CEO Phone: 727-216-32 Email: dbennett@tampabayrealtor.com Real Estate Statistics for September 217 September s numbers are out, and it comes
2017 RESIDENTIAL REAL ESTATE MARKET REPORT
 2017 RESIDENTIAL REAL ESTATE MARKET REPORT Published January 26, 2018 Our market reports have been focused on the effects of low inventory on our housing market and for good reason. December 2017 marked
MonthlyStatistics OCTOBER 2018
 MonthlyStatistics OCTOBER 2018 FOR IMMEDIATE RELEASE November 1, 2018 Prices Continue Rising Despite Moderating Sales NANAIMO, BC Sales of single-family homes in October were 11 per cent higher than in
Housing and Mortgage Market Update
 Housing and Mortgage Market Update Views from the Top Frank E. Nothaft Vice President and Chief Economist January 8, 2015 Summary: Housing & Mortgage Market Outlook for 2015 Interest rates expected to
Multi-Family. Acknowledgements. Author. Data Analysis/ Layout. Financial Support. Disclosure. Charles Dalton. Real Data
 Multi-Family Acknowledgements Author Charles Dalton Data Analysis/ Layout Real Data Financial Support Disclosure The E. V. Williams Center for Real Estate and Economic Development (CREED) functions and
FOR IMMEDIATE RELEASE Contact: David B. Bennett President & CEO Phone:
 FOR IMMEDIATE RELEASE Contact: David B. Bennett President & CEO Phone: 727-216-32 Email: dbennett@tampabayrealtor.com Real Estate Statistics for December 217 wrapped up a sizzling 217 with a steady month
Metropolitan Area Statistics
 Metropolitan Area Statistics Apartment Completions 1Q 2011 1Q 2012 % Chg Atlanta - - n/a Boston 133 39-71% Chicago - 20 n/a Cleveland - - n/a Columbus - 272 n/a Dallas-Ft. Worth 604 1,059 75% Denver 328
SUBJECT: Unacceptable Assignment Conditions in Real Property Appraisal Assignments
 1 2 3 4 5 6 7 8 9 10 11 12 13 14 15 16 17 18 19 20 21 22 23 24 25 26 27 28 29 30 31 32 ADVISORY OPINION 19 (AO-19) This communication by the Appraisal Standards Board (ASB) does not establish new standards
San Francisco Bay Area to Santa Clara & San Benito Counties Housing and Economic Outlook
 San Francisco Bay Area to 019 Santa Clara & San Benito Counties Housing and Economic Outlook Bay Area Economic Forecast Summary Presented by Pacific Union International, Inc. and John Burns Real Estate
APPRAISAL OF REAL PROPERTY LOCATED AT: FOR: AS OF: BY:
 APPRAISAL OF REAL PROPERTY LOCATED AT: 489 MEADOWS EDGE COURT DEED BOOK 2896, PAGE 2759 CLEMMONS, NC 27012 FOR: ESTATE OF WILLIAM C. McINTOSH % BAILEY & THOMAS P.O. BOX 52 WINSTON-SALEM, NC 27102 AS OF:
Changing Economic Times. Market Pulse. Dr. Gary Jackson Director, Regional Economic Research Institute Florida Gulf Coast University April 8, 2008
 Changing Economic Times Presented to: Market Pulse Bonita Springs Area Chamber of Commerce Bonita Springs-Estero Association of REALTORS, Inc. Dr. Gary Jackson Director, Regional Economic Research Institute
REQUEST FOR PROPOSAL (RFP) RFP AS. Appraisal Services Valuation of DBHA Properties
 RFP AS. Appraisal Services Valuation of DBHA Properties") REQUEST FOR PROPOSAL (RFP) RFP 2019-01AS Appraisal Services Valuation of DBHA Properties Daytona Beach Housing Authority (DBHA) 211 N Ridgewood Ave Suite 300 Daytona Beach, FL 32114 (386) 253-5653 Terril
REQUEST FOR PROPOSAL (RFP) RFP 2019-01AS Appraisal Services Valuation of DBHA Properties Daytona Beach Housing Authority (DBHA) 211 N Ridgewood Ave Suite 300 Daytona Beach, FL 32114 (386) 253-5653 Terril
Integra Realty Resources Memphis. Appraisal of Real Property
 Integra Realty Resources Memphis Appraisal of Real Property Retail Property 1219 1295 Main Street Southaven, Desoto County, Mississippi 38671 Prepared For: Presidential Bank Effective Date of the Appraisal:
Housing Bulletin Monthly Report
 January 21 1 Housing Bulletin Monthly Report Most new homes built in second half of 29 25, 2, 15, 1, 5, Dec 7 Jan 8 Feb 8 mar 8 apr 8 Alberta s 29 housing starts increased 72.8 per cent over 28, suggesting
FOR IMMEDIATE RELEASE Contact: David B. Bennett President & CEO Phone:
 FOR IMMEDIATE RELEASE Contact: David B. Bennett President & CEO Phone: 727-216-32 Email: dbennett@tampabayrealtor.com Real Estate Statistics for September 216 At this time of year everyone starts to get
Monthly Indicators + 4.8% - 3.5% %
 Monthly Indicators 2015 New Listings were up 45.0 percent for single family/duplex homes but decreased 44.1 percent for townhouse-condo properties. Pending Sales increased 14.3 percent for single family/duplex
METROPOLITAN TRACT PERFORMANCE REPORT For the Quarter Ended December 31, 2006
 F-11 METROPOLITAN TRACT PERFORMANCE REPORT For the Quarter Ended December 31, 2006 Finance, Audit & Facilities Committee March 22, 2006 CONSOLIDATED METROPOLITAN TRACT PROPERTIES Quarterly Summary Quarterly
Interagency Appraisal and
 Interagency Appraisal and Evaluation (IAEG) Workshop Purpose (77456) Supersedes the 1994 Interagency Appraisal & Evaluation Guidelines Address supervisory matters relating to real estate appraisal and
APPRAISAL OF REAL PROPERTY
 Page # 2 APPRAISAL OF REAL PROPERTY LOCATED AT Block 7, Castle Brewer Court, Plat Book 10, Page 18 FOR Sanford Housing Authority 94 Castle Brewer Ct. OPINION OF VALUE 30,000 AS OF 12/14/2012 BY William
Minneapolis St. Paul Residential Real Estate Index
 University of St. Thomas Minneapolis St. Paul Residential Real Estate Index Welcome to the latest edition of the UST Minneapolis St. Paul Residential Real Estate Index. The University of St Thomas Residential
Office of the Comptroller of the Currency Federal Deposit Insurance Corporation Federal Reserve Board Office of Thrift Supervision
 Office of the Comptroller of the Currency Federal Deposit Insurance Corporation Federal Reserve Board Office of Thrift Supervision Purpose Interagency Appraisal and Evaluation Guidelines October 27, 1994