1200 Premier Drive, Suite 140 Chattanooga, TN Each office is independently owned and operated.
|
|
|
- Felicia York
- 6 years ago
- Views:
Transcription
1 THIS MONTH IN REAL ESTATE K im aulston R REALTOR 1200 Premier Drive, Suite 140 Chattanooga, TN Each office is independently owned and operated. Cell: Office: kcraulston@gmail.com Visit my website: CHATTANOOGA AREA MARKET ACTIVITY APRIL 2016 CHATTANOOGA (May 16, 2016) The housing market is being predictable, and that's a good thing. At the beginning of the year, it was anticipated that the prevailing trends of the past year would continue into and through 2016, and that has largely been the case. The number of homes for sale has generally remained lower compared to a year ago, and prices have been steadily rising in desirable communities where homes show well. New Listings in the Chattanooga region decreased 4.5 percent to 1,358. Closed Sales rose by 11/2% to 816 units sold. Pending Sales were up 15.9 percent to 992. Inventory levels shrank 19.9 percent to 3,604 units. Prices were a tad soft. The Median Sales Price decreased 2.1 percent to $148,750. Days on Market was down 22.0 percent to 71 days. Sellers were encouraged as Months Supply of Inventory was down 27.0 percent to 4.6 months. There have been no striking changes to curtail what should be a decent run of home sales over the next several months. Mortgage rates have remained stubbornly and wonderfully low, the unemployment rate has remained at or near 5.0 percent for eight straight months and wages have increased for a great many people. New construction has been slow, and that may be a damper on sales, but the general outlook remains strong. CLOSED SALES - A count of the actual sales that closed in a given month. # units closed May Jun Jul Aug Sep Oct Nov Dec Jan Feb Mar 12 mo MEDIAN SALES PRICE* - Point at which half of the sales sold for more and half sold for less, not accounting for seller concessions, in a given month. Median price [in thousands] $162.9 $155.0 $155.0 $157.0 $151.0 $150.0 $152.0 $150.0 $144.6 $153.8 $147.0 $148.8 $ May Jun Jul Aug Sep Oct Nov Dec Jan Feb Mar 12 mo
2 DAYS ON THE MARKET UNTIL SALE* - Average number of days between when a property is listed and when an offer is accepted in a given month. # Days on market May Jun Jul Aug Sep Oct Nov Dec Jan Feb Mar 12 mo MONTH'S SUPPLY OF INVENTORY - (The inventory of homes for sale at the end of a given month, divided by the average monthly pending sales from the last 12 months.) # months of inventory May Jun Jul Aug Sep Oct Nov Dec Jan Feb Mar 12 mo View full report for more details and all the monthly indicators Or copy and paste link: Annual Report Greater Chattanooga Housing Market Or copy and paste link: Greater Chattanooga Association of REALTORS All Rights Reserved. The Greater Chattanooga Association of REALTORS, the region s premier voice for real estate, is made up of real estate professionals engaged in every aspect of real estate throughout Southeast Tennessee and Northwest Georgia. STATISTICAL AND INFORMATIONAL SOURCES: U.S. Department of the Treasury; Federal Reserve System; Federal Reserve Bank of Atlant; U.S. Department of Labor; U.S. Department of Housing & Urban Development (HUD); State of Tennessee; Hamilton County; City of Chattanooga; MoodysEconomy.com; Raymond James & Associates; The Wall Street Journal; Point2 Technologies; Fannie Mae; Freddie Mac; REUTERS.COM; The Associated Press; MarketVector.com; JohnTucillo.com; Bankrate.com; RealEstateABC.com; The Real Estate Book (rismedia.com); The National Association of REALTORS (REALTOR.ORG); Tennessee Association of REALTORS (TarNet.com); Greater Chattanooga Association of REALTORS MLS (GCAR.net) and other sources deemed reliable but not guaranteed. The opinions expressed in This Month in Real Estate are intended to supplement opinions on real estate expressed by local and national media, local real estate agents and other expert sources. You should not treat any opinion expressed in This Month in Real Estate as a specific inducement to make a particular investment or follow a particular strategy, but only as an expression of opinion. Keller Williams Realty, Inc., does not guarantee and is not responsible for the accuracy or completeness of information, and provides said information without warranties of any kind. All information presented herein is intended and should be used for educational purposes only. Nothing herein should be construed as investment advice. You should always conduct your own research and due diligence and obtain professional advice before making any investment decision. All investments involve some degree of risk. Keller Williams Realty, Inc., will not be liable for any loss or damage caused by your reliance on information contained in This Month in Real Estate.
3 THIS MONTH IN REAL ESTATE K im aulston R REALTOR 1200 Premier Drive, Suite 140 Chattanooga, TN Each office is independently owned and operated. Cell: Office: kcraulston@gmail.com Visit my website: National Housing Statistics il 2016 Existing-Home Sales Rise in il for Second Straight Month WASHINGTON (May 20, 2016) Despite ongoing inventory shortages and faster price growth, existing-home sales sustained their recent momentum and moved higher for the second consecutive month, according to the National Association of Realtors. A surge in sales in the Midwest and a decent increase in the Northeast offset smaller declines in the South and West. Lawrence Yun, NAR chief economist, says il's sales increase signals slowly building momentum for the housing market this spring. "Primarily driven by a convincing jump in the Midwest, where home prices are most affordable, sales activity overall was at a healthy pace last month as very low mortgage rates and modest seasonal inventory gains encouraged more households to search for and close on a home," he said. "Except for in the West where supply shortages and stark price growth are hampering buyers the most sales are meaningfully higher than a year ago in much of the country." Home Sales [in millions] Total existing-home sales, which are completed transactions that include single-family homes, townhomes, condominiums and co-ops, rose 1.7 percent to a seasonally adjusted annual rate of million in il from an upwardly revised million in March. After last month's gain, sales are now up 6.0 percent from il May Jun Jul Aug Sep Oct Nov Dec Jan Feb Mar Single-family home sales inched forward 0.6 percent to a seasonally adjusted annual rate of 4.81 million in il from 4.78 million in March, and are now 6.2 percent higher than the 4.53 million pace a year ago. The median existing singlefamily home price was $233,700 in il, up 6.2 percent from il The share of first-time buyers was 32 percent in il, up from 30 percent both in March and a year ago. First-time buyers in all of 2015 also represented an average of 30 percent. At last week's 2016 REALTORS Legislative Meetings & Trade Expo, U.S. Housing and Urban Development Secretary Julian Castro announced beneficial changes to FHA condo rules, which could help many first-time buyers, are moving forward and are currently at the Office of Management and Budget for review. Existing condominium and co-op sales jumped 10.3 percent to a seasonally adjusted annual rate of 640,000 units in il from 580,000 in March, and are now 4.9 percent above il 2015 (610,000 units). The median existing condo price was $223,300 in il, which is 6.8 percent above a year ago. "Secretary Castro's update that the condo rule changes are in their final stages before implementation received great applause from Realtors both at the forum and throughout the country," said NAR President Tom Salomone. "To ensure that purchasing a condo increasingly becomes a viable and affordable option for first-time buyers, NAR supports the
4 ongoing efforts to eliminate unnecessary barriers holding back condo sales. We hope that progress on this condo rule means we'll see some much-needed changes in the near future." All-cash sales were 24 percent of transactions in il, down from 25 percent in March and unchanged from a year ago. Individual investors, who account for many cash sales, purchased 13 percent of homes in il (matching the lowest share since October 2015), down from 14 percent in both in March and a year ago. Sixty-nine percent of investors paid cash in il. Distressed sales foreclosures and short sales declined for the second straight month to 7 percent in il, down from 8 percent last month and 10 percent a year ago. Five percent of il sales were foreclosures and 2 percent were short sales. Foreclosures sold for an average discount of 17 percent below market value in il (16 percent in March), while short sales were discounted 10 percent (unchanged from March). Home Price [in thousands] The median existing-home price for all housing types in March was $222,700, up 5.7 percent from March 2015 ($210,700). March's price increase marks the 49th consecutive month of year-over-year gains. $ $231.8 $232.5 $228.9 $228.5 $221.7 $218.7 $219.1 $220.0 $ $221.5 $213.7 $212.1 May Jun Jul Aug Sep Oct Nov Dec Jan Feb Mar May Jun Jul Aug Sep Oct Nov Dec Jan Feb Mar Inventory Months Supply The median existing-home price for all housing types in il was $232,500, up 6.3 percent from il 2015 ($218,700). il's price increase marks the 50th consecutive month of year-over-year gains. "Looking ahead, with demand holding steady and supply levels still far from sufficient, the market for entry-level and mid-priced homes will likely continue to be the most competitive heading into the summer months," says Yun Days on Market May May Jun Jun Jul Jul Aug Aug Sep Sep Oct Oct Nov Nov Dec Dec Jan Jan Feb Feb Mar Mar Properties typically stayed on the market for 39 days in il (47 days in March), which is unchanged from a year ago but the shortest duration since June 2015 (34 days). Short sales were on the market the longest at a median of 120 days in il, while foreclosures sold in 51 days and non-distressed homes took 37 days. Forty-five percent of homes sold in il were on the market for less than a month the highest since June 2015 (47 percent) May Jun Jul Aug Sep Oct Nov Dec Jan Feb Mar 4.7

. The average commitment rate for all of 2015 was 3.85 percent. 3.66 3.69 Monthly Average Commitment Rate: Feb 2016 3.61 2.96 2.97 2.")
5 Interest Rates "The temporary relief from mortgage rates currently near three-year lows has helped preserve housing affordability this spring, but there's growing concern a number of buyers will be unable to find homes at affordable prices if wages don't rise and price growth doesn't slow," adds Yun. According to Freddie Mac, the average commitment rate (link is external) for a 30-year, conventional, fixed-rate mortgage fell from 3.69 percent in March to 3.61 percent in il, which is the lowest since May 2013 (3.54 percent). The average commitment rate for all of 2015 was 3.85 percent Monthly Average Commitment Rate: Feb Feb Mar 30 yr fixed 15 yr fixed 5 yr adjustable Source: National Association of Realtors Existing Homes Sales report. The opinions expressed are intended to supplement opinions on real estate expressed by local and national media, local real estate agents and other expert sources. You should not treat any opinion expressed as a specific inducement to make a particular investment or follow a particular strategy, but only as an expression of opinion. Nothing herein should be construed as investment advice. You should always conduct your own research and due diligence and obtain professional advice before making any investment decision. All investments involve some degree of risk. Keller Williams Realty, Inc., will not be liable for any loss or damage caused by your reliance on information contained herein.


6 F E A T U R E D L I S T I N G S. Thinking about buying a home? Might one of these homes be right for you? If so, give me a call and we ll schedule a private tour. If not, I d like to help you find your perfect home. Remember, I can show you any home that s for sale in the area, whether or not it s listed by me or my office. Your perfect home IS out there. I d appreciate the opportunity of helping you find it.


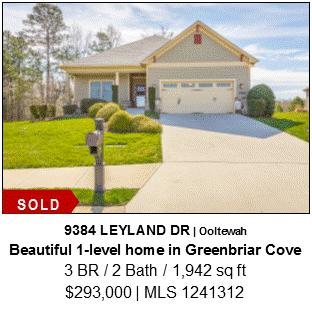
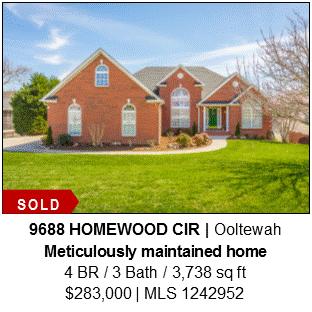
7 F E A T U R E D L I S T I N G S For details, visit my website at Information is deemed reliable but not guaranteed.
Released: June Commentary 2. The Numbers That Drive Real Estate 3. Recent Government Action 9. Topics for Home Buyers, Sellers, and Owners 11
 Released: June 2011 Commentary 2 The Numbers That Drive Real Estate 3 Recent Government Action 9 Topics for Home Buyers, Sellers, and Owners 11 Brought to you by: KW Research Commentary The U.S. housing
Monthly Indicators + 7.3% + 6.6% + 8.3% Single-Family Market Overview Condo Market Overview New Listings Pending Sales.
 Monthly Indicators 2018 The three most prominent national market trends for residential real estate are the ongoing lack of abundant inventory, the steadily upward movement of home prices and year-over-year
Released: May 7, 2010
 Released: May 7, 2010 Commentary 2 The Numbers That Drive Real Estate 3 Recent Government Action 9 Topics for Home Buyers, Sellers, and Owners 11 Brought to you by: KW Research Commentary The economic
Released: February 8, 2011
 Released: February 8, 2011 Commentary 2 The Numbers That Drive Real Estate 3 Recent Government Action 10 Topics for Home Buyers, Sellers, and Owners 13 Brought to you by: KW Research Commentary Gradual
Released: June 7, 2010
 Released: June 7, 2010 Commentary 2 The Numbers That Drive Real Estate 3 Recent Government Action 9 Topics for Home Buyers, Sellers, and Owners 11 Brought to you by: KW Research Commentary The housing
Commentary 2. Released: May The Numbers That Drive Real Estate 3. Special Report 9. Brought to you by: KW Research
 Released: May 2011 Commentary 2 The Numbers That Drive Real Estate 3 Special Report 9 Brought to you by: KW Research Commentary Despite lingering effects from regulatory changes in the mortgage markets,
Monthly Indicators + 4.8% - 3.5% %
 Monthly Indicators 2015 New Listings were up 45.0 percent for single family/duplex homes but decreased 44.1 percent for townhouse-condo properties. Pending Sales increased 14.3 percent for single family/duplex
Monthly Indicators % % - 3.5%
 Monthly Indicators 2017 New Listings were up 6.3 percent for the category but decreased 33.1 percent for the category. Pending Sales increased 5.0 percent for but decreased 1.3 percent for. The Median
Released: April 8, 2011
 Released: April 8, 2011 Commentary 2 The Numbers That Drive Real Estate 3 Special Report 9 Brought to you by: KW Research Commentary The housing market continues on a relatively stable and balanced track.
California Housing Market Update. Monthly Sales and Price Statistics May 2018
 California Housing Market Update Monthly Sales and Price Statistics May 2018 Sales Lost Momentum as Mortgage Rates Continued to Climb California, May 2018 Sales: 409,270 Units, +0.3% YTD, -4.6% YTY 700,000
This Month in Real Estate
 Keller Williams Research This Month in Real Estate Released: September 14, 2009 Commentary. The Numbers That Drive Real Estate Recent Government Action. Research for Buyers and Sellers. 2 4 10 14 1 Green
Housing and Economy Market Trends
 Housing and Economy Market Trends Mainstreet Organization Prices of single-family, detached homes in suburban Chicago increased 12.1 percent in May 2014 compared with the same period a year ago. Overall,
THE OUTLOOK FOR HOUSING IN ILLINOIS
 THE OUTLOOK FOR HOUSING IN ILLINOIS Jonathan Smoke Chief Economist January 25, 2017 NATIONAL TRENDS 2 2000.01 2000.05 2000.09 2001.01 2001.05 2001.09 2002.01 2002.05 2002.09 2003.01 2003.05 2003.09 2004.01
Released: November 2011
 Released: November 2011 Commentary 2 The Numbers That Drive Real Estate 3 This Month in Washington 8 Topics for Home Buyers, Sellers, and Owners 11 Brought to you by: KW Research Commentary While home
Released: September 2011
 Released: September 2011 Commentary 2 The Numbers That Drive Real Estate 3 Special Report 9 Brought to you by: KW Research Commentary The national housing market remains firmly planted in balanced territory.
Released: September 7, 2010
 Released: September 7, 2010 Commentary 2 The Numbers That Drive Real Estate 3 Special Reports 9 Topics for Home Buyers, Sellers, and Owners 11 Brought to you by: KW Research Commentary Canada s housing
Released: August 2011
 Released: August 2011 Commentary 2 The Numbers That Drive Real Estate 3 Special Report 9 Brought to you by: KW Research Commentary The housing market s balanced position remains firm as it transitions
Released: October 2011
 Released: October 2011 Commentary 2 The Numbers That Drive Real Estate 3 Special Report 9 Brought to you by: KW Research Commentary The national housing market remains firmly planted in balanced territory.
This Month in Real Estate
 Keller Williams Research This Month in Real Estate Released: June 11, 2009 Commentary. The Numbers That Drive Real Estate Recent Government Action. Research for Buyers and Sellers. 2 4 10 13 1 Green Shoots
Housing market feels the chill as oversupply continues Feb. 2019
 February 19 19 MONTHLY STATISTICS PACKAGE Housing market feels the chill as oversupply continues 19, March 1, 19 The effects of Calgary s economic climate continue to create weak sales activity and elevated
Baldwin County Condo Report February 2018
 Baldwin County Condo Report February 218 Monthly Indicators Recent Figures Trends Total Condo Sales Current Month February 218 113 vs. Prior Month January 218 11 11.9% vs. Last Year February 217 114 -.9%
Monthly Market Watch for the Prescott Quad City Area. Provided by Keller Williams Check Realty Statistics from August 2012 Prescott MLS
 August 2012 Monthly Market Watch for the Prescott Quad City Area Provided by Keller Williams Check Realty Statistics from August 2012 Prescott MLS Report Overview: This report includes MLS data for the
AAug ugust 2017
 August 17 17 Housing recovery a balancing act Growth in new listings outpaced sales preventing inventory declines City of Calgary, September 1, 17 Sales posted a modest gain in August, but a rise in new
Lake Martin Waterfront Residential Report September 2018
 Lake Martin Waterfront Residential Report September 18 Monthly Indicators Recent Figures Trends Total Residential Sales Current Month September 18 29 Lake Martin Waterfront residential* sales during the
Housing Price Forecasts. Illinois and Chicago PMSA, June 2012
 Housing Price Forecasts Illinois and Chicago PMSA, June 2012 Presented To Illinois Association of REALTORS From R E A L Regional Economics Applications Laboratory, Institute of Government and Public Affairs
MARKET OUTLOOK FOR SAN MATEO
 MARKET OUTLOOK FOR SAN MATEO Jonathan Smoke Chief Economist August 2, 2016 NATIONAL TRENDS 2 JOB CREATION REBOUNDED IN JUNE 229,000 jobs created by month in 2015; 172,000 average this year Employment and
With last month's gain, sales are now up 4.5% from May 2015 and are at their highest annual pace since February 2007.
 JULY 2016 With last month's gain, sales are now up 4.5% from May 2015 and are at their highest annual pace since February 2007. - Lawrence Yun NAR s Chief Economist Now in its seventh year, the US economic
RESIDENTIAL MARKET ANALYSIS
 RESIDENTIAL MARKET ANALYSIS EVAN ABRAMOWITZ RMLS Student Fellow Master of Real Estate Development Graduate Student September existing-home sales declined modestly, but inventory continued to tighten and
Housing Price Forecasts. Illinois and Chicago PMSA, October 2014
 Housing Price Forecasts Illinois and Chicago PMSA, October 2014 Presented To Illinois Association of Realtors From R E A L Regional Economics Applications Laboratory, Institute of Government and Public
New year kicks off with slow sales Jan. 2019
 January 19 19 MONTHLY STATISTICS PACKAGE New year kicks off with slow sales 19, February 1, 19 As economic challenges linger into 19, housing markets remain on a sluggish pace. January sales totalled 8
Monthly Indicators % % %
 Monthly Indicators 2016 Percent changes calculated using year-over-year comparisons. New Listings were down 27.6 percent for single family homes and 41.8 percent for townhouse-condo properties. Pending
A A p p r ril 2017
 April 17 17 Housing market retains momentum in April Citywide prices hold steady as labour market improves City of Calgary, May 1, 17 Calgary s housing market continued to show signs of stability in April.
Monthly Indicators % + 9.7% %
 Monthly Indicators 2016 Percent changes calculated using year-over-year comparisons. New Listings were up 11.1 percent for single family homes and down 30.8 percent for townhouse-condo properties. Pending
MONTHLY STATISTICS PACKAGE. City of Calgary. May creb.com
 MONTHLY STATISTICS PACKAGE City of Calgary May 1 creb.com Housing supply swells in cool spring market MONTHLY STATISTICS PACKAGE City of Calgary May 1 City of Calgary, June 1, 1 Calgary s housing inventory
Monthly Indicators % % - 9.2%
 Monthly Indicators 2016 New Listings were down 1.4 percent for single family/duplex homes and 25.0 percent for townhouse-condo properties. Pending Sales increased 58.3 percent for single family/duplex
2017 RESIDENTIAL REAL ESTATE MARKET REPORT
 2017 RESIDENTIAL REAL ESTATE MARKET REPORT Published January 26, 2018 Our market reports have been focused on the effects of low inventory on our housing market and for good reason. December 2017 marked
S Sep eptember 2016
 September Detached prices stabilize in soft market, October, The segment of Calgary s housing market with the greatest influence on the overall market is showing signs of pricing stability. The detached
Montgomery Residential Report February 2018
 Montgomery Residential Report February 2018 Monthly Indicators Recent Figures Trends Total Home Sales Current Month February 2018 274 vs. Prior Month January 2018 239 14.6% vs. Last Year February 2017
Aug. Aug 2018 ust 2018
 August 18 MONTHLY STATISTICS PACKAGE City of Calgary Unemployment rate slows housing market recovery 18 City of Calgary, September, 18 Easing sales, gains in new listings and elevated inventory levels
Monthly Indicators % % %
 Monthly Indicators 2018 Percent changes calculated using year-over-year comparisons. New Listings were down 12.9 percent for single family homes and 21.3 percent for townhouse-condo properties. Pending
Mobile Residential Sales Report February 2019
 Mobile Residential Sales Report February 2019 Total Residential Sales Current Month February 2019 343 Mobile residential* sales for February '19 totaled 343 units, an increase of 12.1 percent when compared
Baldwin County Condo Report January 2019
 Baldwin County Condo Report January 2019 Total Condo Sales Current Month January 2019 73 vs. Prior Month December 2018 97-24.7% vs. Last Year January 2018 101-27.7% vs. 5-Yr Avg January 14-'18 97-25.1%
Baldwin County Condo Report February 2019
 Baldwin County Condo Report February 2019 Total Condo Sales Current Month February 2019 93 vs. Prior Month January 2019 73 27.4% vs. Last Year February 2018 113-17.7% vs. 5-Yr Avg February 14-'18 120-22.2%
Sep September 2018
 18 September 18 MONTHLY STATISTICS PACKAGE City of Calgary Persistent buyers market continues 18 City of Calgary, October 1, 18 With no change in the economic climate, Calgary s sales activity totaled
Provided by Keller Williams Realty Professional Partners Statistics from September 2010 MLS
 Monthly Market Watch for Maricopa County An overview of what is happening in the Maricopa County real estate market (using September 2010 statistics) Report overview: This report includes MLS data for
Austin-area home prices set August record, outpace household income growth in August 2015
 Austin-area home prices set August record, outpace household income growth in August 2015 Market Reports Austin Board of REALTORS releases real estate statistics for August 2015 AUSTIN, Texas September
Oversupply persists despite improved sales activity for affordable product Mar. 2019
 March 19 MONTHLY STATISTICS PACKAGE Oversupply persists despite improved sales activity for affordable product 19, April 1, 19 March saw a modest decline in city wide sales activity compared to last year.
Economic Highlights. Payroll Employment Growth by State 1. Durable Goods 2. The Conference Board Consumer Confidence Index 3
 August 26, 2009 Economic Highlights Southeastern Employment Payroll Employment Growth by State 1 Manufacturing Durable Goods 2 Consumer Spending The Conference Board Consumer Confidence Index 3 Real Estate
Monthly Indicators + 5.7% % % Market Overview New Listings Pending Sales. Closed Sales. Days on Market Until Sale. Median Sales Price
 Monthly Indicators 2018 The three most prominent national market trends for residential real estate are the ongoing lack of abundant inventory, the steadily upward movement of home prices and year-over-year
California Housing Market Update. Monthly Sales and Price Statistics December 2018
 California Housing Market Update Monthly Sales and Price Statistics December 2018 Sales Reached the Lowest Level since Jan 2015 California, December 2018 Sales: 372,260 Units, -5.2% YTD, -11.6% YTY 700,000
Released: November 2011
 Released: November 2011 Commentary 2 The Numbers That Drive Real Estate 3 Special Report 9 Brought to you by: KW Research Commentary The national housing market remains firmly balanced. Year-to-date sales
2019 Housing Market Forecast. Palos Verdes Peninsula AOR January 8, 2019 Jordan G. Levine Senior Economist
 2019 Housing Market Forecast Palos Verdes Peninsula AOR January 8, 2019 Jordan G. Levine Senior Economist Overview Good News: Economic fundamentals solid Homeownership still the dream Rates might not go
Demand down with net migration
 July 1 Demand down with net migration City of Calgary, August, 1 In step with City census data on declining net migration levels, housing sales activity totaled 1,71 units in July, a 1. per cent decrease
2015 First Quarter Market Report
 2015 First Quarter Market Report CAAR Member Copy Expanded Edition Charlottesville Area First Quarter 2015 Highlights: Median sales price for the region was up 5.1% over Q1-2014, rising from $244,250 to
Monthly Indicators % + 9.4% % Activity Overview New Listings Pending Sales. Closed Sales. Days on Market Until Sale. Median Sales Price
 Monthly Indicators 2017 The number of homes for sale, days on market and months of supply were all down in year-over-year comparisons in a majority of the country for the entirety of 2017, as was housing
Dec December 2018
 December MONTHLY STATISTICS PACKAGE Job market weakness and lending restrictions a common thread in s housing market, January, 19 As oversupply continues in Calgary s housing market, December prices eased
San Francisco Housing Market Update
 San Francisco Housing Market Update California Economic and Housing Market Outlook The national economy maintained a healthy growth rate in the first quarter of 2005 and appeared to be settling in for
Patience required in Calgary's housing market recovery Jul. 2018
 July 18 MONTHLY STATISTICS PACKAGE City of Calgary Patience required in Calgary's housing market recovery 18 City of Calgary, August 1, 18 Recent struggles in the job market, accompanied by yet another
Housing Price Forecasts. Illinois and Chicago PMSA, April 2013
 Housing Price Forecasts Illinois and Chicago PMSA, April 2013 Presented To Illinois Association of Realtors From R E A L Regional Economics Applications Laboratory, Institute of Government and Public Affairs
RESIDENTIAL MARKET ANALYSIS
 RESIDENTIAL MARKET ANALYSIS EVAN ABRAMOWITZ Joseph Bernard Investment Real Estate Oregon Association of Realtors Student Fellow Masters of Real Estate Development Graduate Student National housing market
February 2016 Loudoun County Market Trends Report Contracts and sales activity jump double-digits; Inventories down 15.5 percent
 FOR IMMEDIATE RELEASE Contact: Christine Windle 703-777-2468, cwindle@dullesarea.com Sponsored by: Access National Bank Tom Ciolkosz, (703) 871-1045, tciolkosz@accessnationalbank.com Patty Foster, 703-871-1014,
Monthly Indicators + 3.5% + 2.1% - 9.4% Activity Overview New Listings Pending Sales. Closed Sales. Days on Market Until Sale. Median Sales Price
 Monthly Indicators 217 How long can the residential real estate market go on like this? We are about two years into a national trend of dropping housing supply and increasing median sales prices. There
California Housing Market Update. Monthly Sales and Price Statistics October 2018
 California Housing Market Update Monthly Sales and Price Statistics October 2018 Sales Had the 2 nd Largest Drop in the Last 6 Months California, October 2018 Sales: 397,060 Units, -3.7% YTD, -7.9% YTY
MLS of Greater Cincinnati - Charts for the Month: November 2017
 MLS of Greater Cincinnati - Charts for the Month: November 2017 The following charts provide an overview of what has occurred in the MLS over the past month. Each chart provides a historical trend. The
FOR IMMEDIATE RELEASE Contact: David B. Bennett President & CEO Phone:
 FOR IMMEDIATE RELEASE Contact: David B. Bennett President & CEO Phone: 727-216-32 Email: dbennett@tampabayrealtor.com Real Estate Statistics for December 217 wrapped up a sizzling 217 with a steady month
Housing Price Forecasts. Illinois and Chicago PMSA, December 2015
 Housing Price Forecasts Illinois and Chicago PMSA, December 2015 Presented To Illinois Association of Realtors From R E A L Regional Economics Applications Laboratory, Institute of Government and Public
The Market Watch Monthly Housing Report. Coachella Valley Median Detached Home Price Dec Dec 2016
 The Market Watch Monthly Housing Report Median Price $450,000 Coachella Valley Median Detached Home Price Dec 2002 - Dec 2016 $400,000 $350,000 $300,000 $339,930 $340,000 $250,000 $200,000 $150,000 CV
MONTHS OF SUPPLY AND PRICE CHANGES. Home improvement November marks a rise in sales. MONTHLY STATISTICS PACKAGE City of Calgary. Nov.
 November 17 17 Home improvement November marks a rise in sales. City of Calgary, December 1, 17 The November housing market was spurred by a rise in sales, particularly in the lower price ranges. Sales
Coachella Valley Median Detached Home Price Jan Jan 2017
 The Desert Housing Report Median Price $450,000 Coachella Valley Median Detached Home Price Jan 2002 - Jan 2017 $400,000 $350,000 $300,000 $250,000 $335,000 $340,000 $200,000 $150,000 CV Detached Median
Housing Price Forecasts. Illinois and Chicago PMSA, May 2018
 Housing Price Forecasts Illinois and Chicago PMSA, May 2018 Presented To Illinois Realtors From R E A L Regional Economics Applications Laboratory, Institute of Government and Public Affairs University
Residential Real Estate Market Overview: September 2017 Data
 Residential Real Estate Market Overview: September 2017 Data 2017 Mark A. Melikian Chief Valuation Officer mark.melikian@summitvaluations.com 2800 River Road, Suite 460 The following is a market data summary
Housing Market Cycles
 MEGA AGENT Market Update Gary Keller and Jay Papasan 2 The U.S. Housing Market Keller Williams Realty, Inc. Housing Market Cycles 4 The U.S. Housing Market Housing Market Cycles 5 The U.S. Housing Market
Monthly Indicators + 9.9% - 1.7% % Activity Overview New Listings Pending Sales. Closed Sales. Days on Market Until Sale. Median Sales Price
 Monthly Indicators 2015 All expectations in 2015 are for a healthy and energetic selling season. National stories have been highlighting an increase in new construction sales and pending sales, but national
Housing and Mortgage Market Update
 Housing and Mortgage Market Update Views from the Top Frank E. Nothaft Vice President and Chief Economist January 8, 2015 Summary: Housing & Mortgage Market Outlook for 2015 Interest rates expected to
California Housing Market Update. Monthly Sales and Price Statistics September 2018
 California Housing Market Update Monthly Sales and Price Statistics September 2018 Sales Had the Largest Decline since March 2014 California, September 2018 Sales: 382,550 Units, -3.3% YTD, -12.4% YTY
FOR IMMEDIATE RELEASE Contact: Brenda Morton Dulles Area Association of REALTORS
 FOR IMMEDIATE RELEASE Contact: Brenda Morton 703 777 2468 Dulles Area Association of REALTORS bmorton@dullesarea.com February 2018 Loudoun County Market Trends Report Inventory reaches yet another record
San Francisco Bay Area to Napa County Housing and Economic Outlook
 San Francisco Bay Area to 019 Napa County Housing and Economic Outlook Bay Area Economic Forecast Summary Presented by Pacific Union International, Inc. and John Burns Real Estate Consulting, LLC On Nov.
Weak sales persist in Calgary and beyond Jun. 2018
 June 218 MONTHLY STATISTICS PACKAGE City of Calgary Weak sales persist in Calgary and beyond 218 City of Calgary, July 3, 218 Many Canadian energyrelated municipalities within Alberta and Saskatchewan
Metropolitan Indianapolis Board of REALTORS. Broker/Owner Meeting March 14, 2007
 Metropolitan Indianapolis Board of REALTORS Broker/Owner Meeting March 14, 2007 Tom Renkert Information Services Director MIBOR PropertyLinx 2 Implementation Time Line February 1-28 March 1 June 30 July
nd Quarter Market Report
 2015 2 nd Quarter Market Report The voice of real estate in Central Virginia CAAR Member Copy Expanded Edition Charlottesville Area 2 nd Quarter 2015 Highlights: Closed sales in the Greater Charlottesville
FOR IMMEDIATE RELEASE Contact: Brenda Morton Dulles Area Association of REALTORS
 FOR IMMEDIATE RELEASE Contact: Brenda Morton 703 777 2468 Dulles Area Association of REALTORS bmorton@dullesarea.com August 2018 Loudoun County Market Trends Report Despite persistent low inventory, sales
Monthly Indicators - 6.1% + 6.6% + 4.3% Activity Overview New Listings. Closed Sales Median Sales Price
 Monthly Indicators 2017 The number of homes for sale, days on market and months of supply were all down in year-over-year comparisons in a majority of the country for the entirety of 2017, as was housing
MARKET AREA UPDATE Report as of: 1Q 2Q 3Q 4Q
 MARKET AREA UPDATE Report as of: 1Q 2Q 3Q 4Q Year: 2013 Market Area (City, State): Washington DC Metropolitan Area Provided by (Company / Companies): LONG & FOSTER REAL ESTATE, INC. What are the most significant
FOR IMMEDIATE RELEASE Contact: David B. Bennett President & CEO Phone:
 FOR IMMEDIATE RELEASE Contact: David B. Bennett President & CEO Phone: 727-216-32 Email: dbennett@tampabayrealtor.com Real Estate Statistics for September 217 September s numbers are out, and it comes
Housing Price Forecasts. Illinois and Chicago PMSA, March 2018
 Housing Price Forecasts Illinois and Chicago PMSA, March 2018 Presented To Illinois Realtors From R E A L Regional Economics Applications Laboratory, Institute of Government and Public Affairs University
San Francisco Bay Area to Santa Clara & San Benito Counties Housing and Economic Outlook
 San Francisco Bay Area to 019 Santa Clara & San Benito Counties Housing and Economic Outlook Bay Area Economic Forecast Summary Presented by Pacific Union International, Inc. and John Burns Real Estate
Monthly Indicators % % % Activity Overview New Listings Pending Sales. Closed Sales. Days on Market Until Sale. Median Sales Price
 Monthly Indicators 2017 tends to mark the waning of housing activity ahead of the school year. Not all buyers and sellers have children, but there are enough parents that do not want to uproot their children
Monthly Statistical Reports INDEX
 1 Monthly Statistical Reports INDEX 1. Index Page 2. Monthly Statistical Narrative 4. Month and YTD Sold & Active Single Family Listings 5. Monthly Sales by Price Range and Bedrooms 6. Single Family Sold
STATPAK MARKET IN A MINUTE A SUMMARY OF MARKET CONDITIONS FOR OCTOBER McEnearney.com CONTRACTS URGENCY INDEX INVENTORY INTEREST RATES
 STATPAK LOUDOUN COUNTY NOVEMBER 2018 McEnearney.com MARKET IN A MINUTE A SUMMARY OF MARKET CONDITIONS FOR OCTOBER 2018 Contract activity in October 2018 was down 7.6% from last October and was down in
OCTOBER 2018 Harrisonburg & Rockingham County Real Estate Market Report
 OCTOBER 218 Real Estate Market Report An analysis of real estate activity through September 3, 218 provided courtesy of Scott P. Rogers, Funkhouser Real Estate Group Five Bedroom City Home with Finished
Housing Price Forecasts. Illinois and Chicago PMSA, August 2017
 Housing Price Forecasts Illinois and Chicago PMSA, August 2017 Presented To Illinois Realtors From R E A L Regional Economics Applications Laboratory, Institute of Government and Public Affairs University
Monthly Market Watch for Maricopa County An overview of what is happening in the Maricopa County real estate market
 Monthly Market Watch for Maricopa County An overview of what is happening in the Maricopa County real estate market Provided by Susan Kraemer of Prudential Arizona Properties Report overview: This report
Housing Price Forecasts. Illinois and Chicago PMSA, January 2018
 Housing Price Forecasts Illinois and Chicago PMSA, January 2018 Presented To Illinois Realtors From R E A L Regional Economics Applications Laboratory, Institute of Government and Public Affairs University
FOR IMMEDIATE RELEASE Contact: David B. Bennett President & CEO Phone:
 FOR IMMEDIATE RELEASE Contact: David B. Bennett President & CEO Phone: 727-216-32 Email: dbennett@tampabayrealtor.com Real Estate Statistics for September 216 At this time of year everyone starts to get
Presented to Membership of the Lake Gaston Association. Christine Thompson. June 10, 2014
 Presented to Membership of the Lake Gaston Association Christine Thompson June 10, 2014 About your speaker Christine Thompson Real Estate Sales & Service at Lake Gaston for 13+ years Advanced training
O O ct ct ober 2017
 October Status Quo for Calgary's Housing Market Prices remain similar to last year, but ease in October., November 1, 17 October s housing market conditions closely echoed previous month s trends with
November 2017 Loudoun County Market Trends Report Inventory decline persists as total and new listings are down; Sales growth continues to drop
 FOR IMMEDIATE RELEASE Contact: Brenda Morton 703 777 2468 Dulles Area Association of REALTORS bmorton@dullesarea.com November 2017 Loudoun County Market Trends Report Inventory decline persists as total
California Housing Market Update. Monthly Sales and Price Statistics November 2018
 California Housing Market Update Monthly Sales and Price Statistics November 2018 Home Sales: Largest Decline Since 2014 California, November 2018 Sales: 381,400 Units, -4.6% YTD, -13.4% YTY 700,000 600,000
Monthly Indicators % % - 2.5% Activity Overview New Listings Pending Sales. Closed Sales. Days on Market Until Sale. Median Sales Price
 Monthly Indicators 2019 It is worthwhile to mention the weather when discussing residential real estate for the state of New York for 2019, because this month has turned in some impressively cold and snowy
FEBRUARY 2019 Harrisonburg & Rockingham County Real Estate Market Report
 FEBRUARY 219 Real Estate Market Report An analysis of real estate activity through January 31, 219 provided courtesy of Scott P. Rogers, Funkhouser Real Estate Group Immaculate Brick Highland Park Colonial