2018 ANNUAL AND 4TH QUARTER RESIDENTIAL REAL ESTATE SALES REPORT Westchester, Putnam, Rockland, Orange and Sullivan Counties, New York
|
|
|
- Clarissa Ray
- 5 years ago
- Views:
Transcription
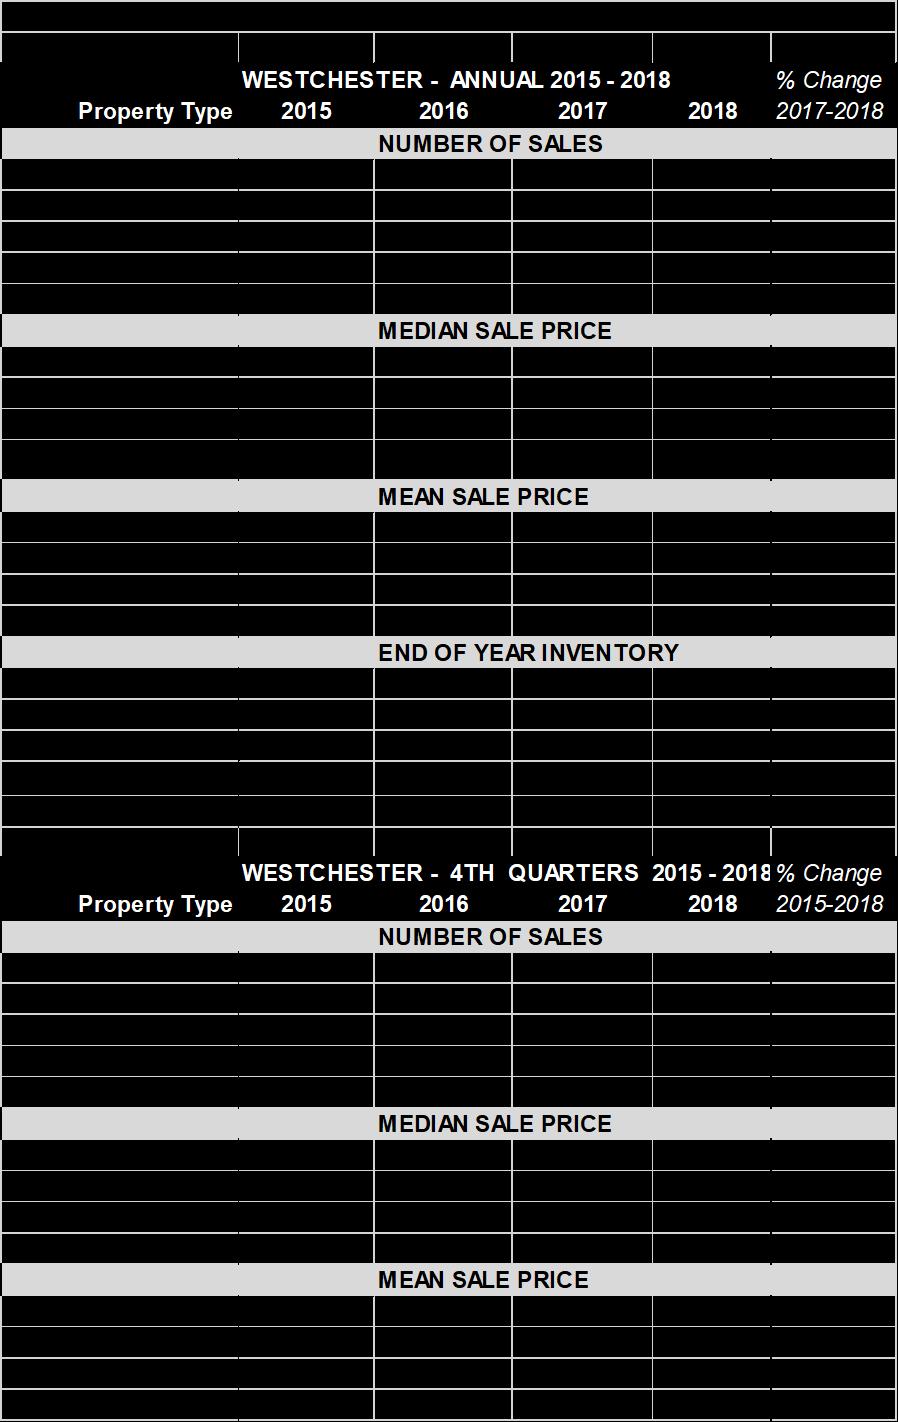
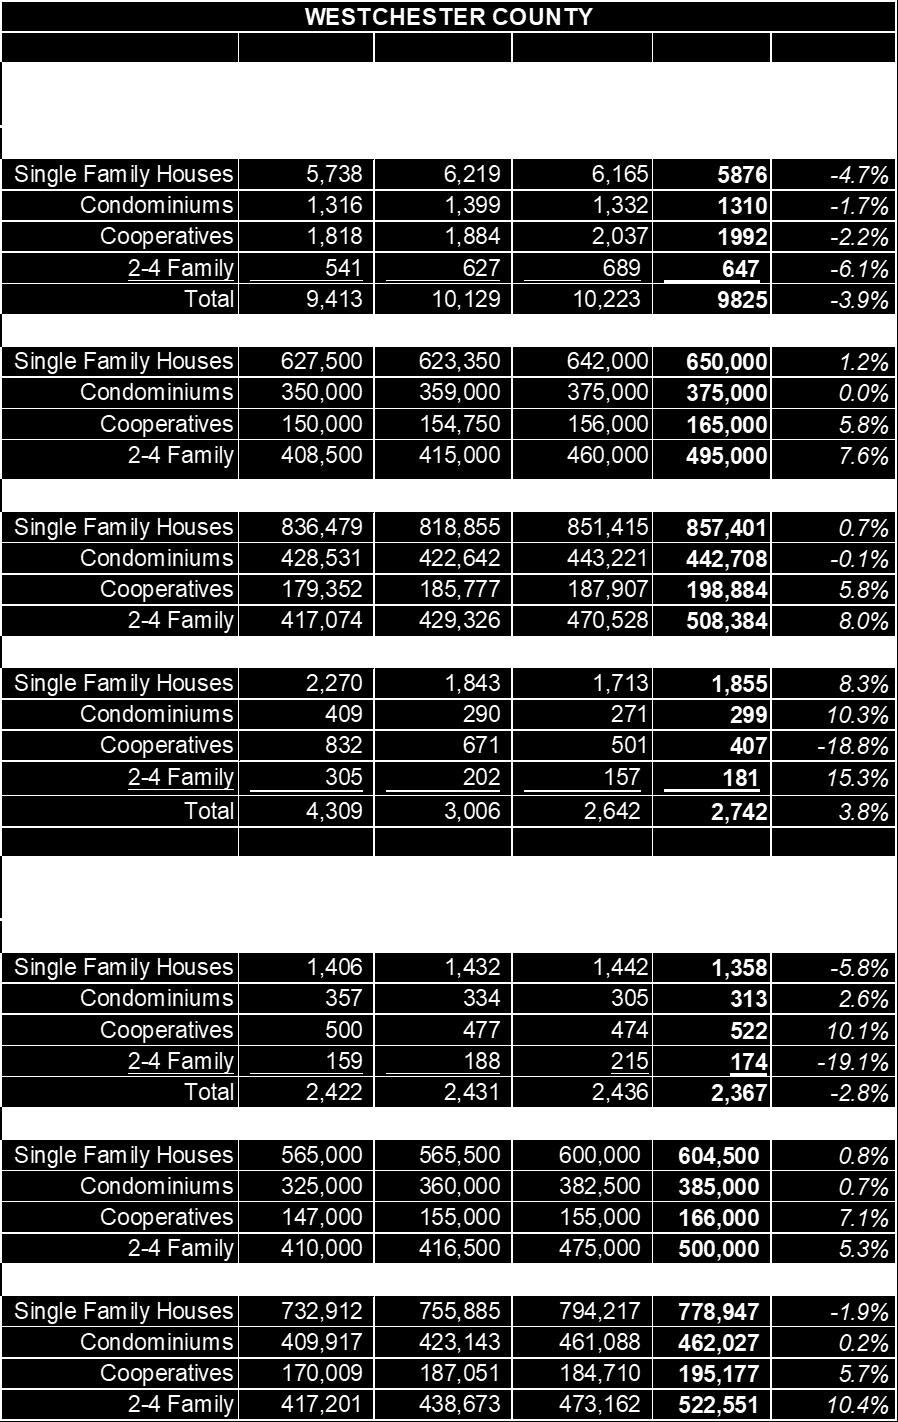
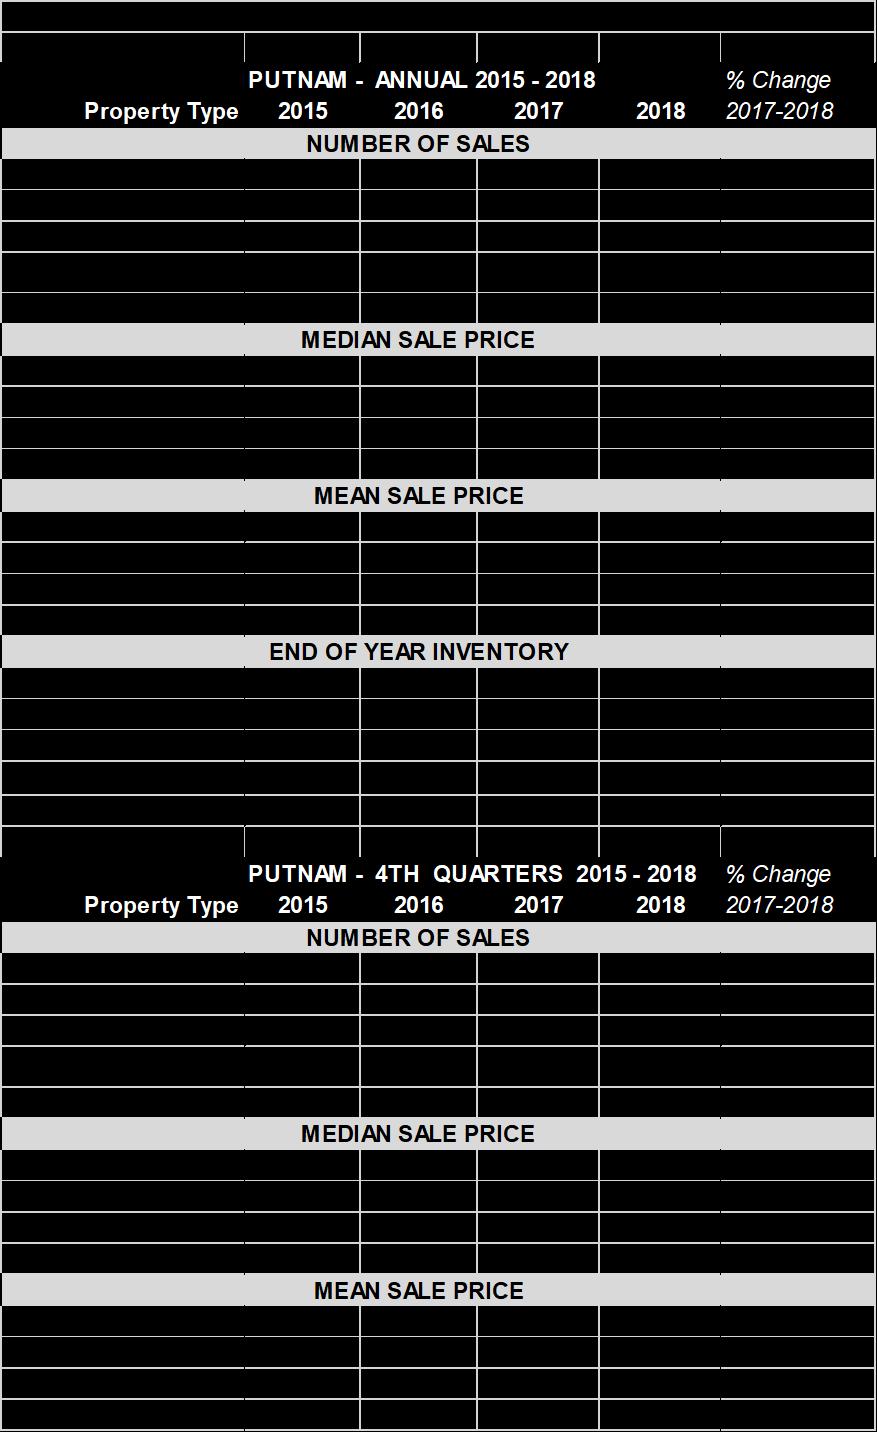
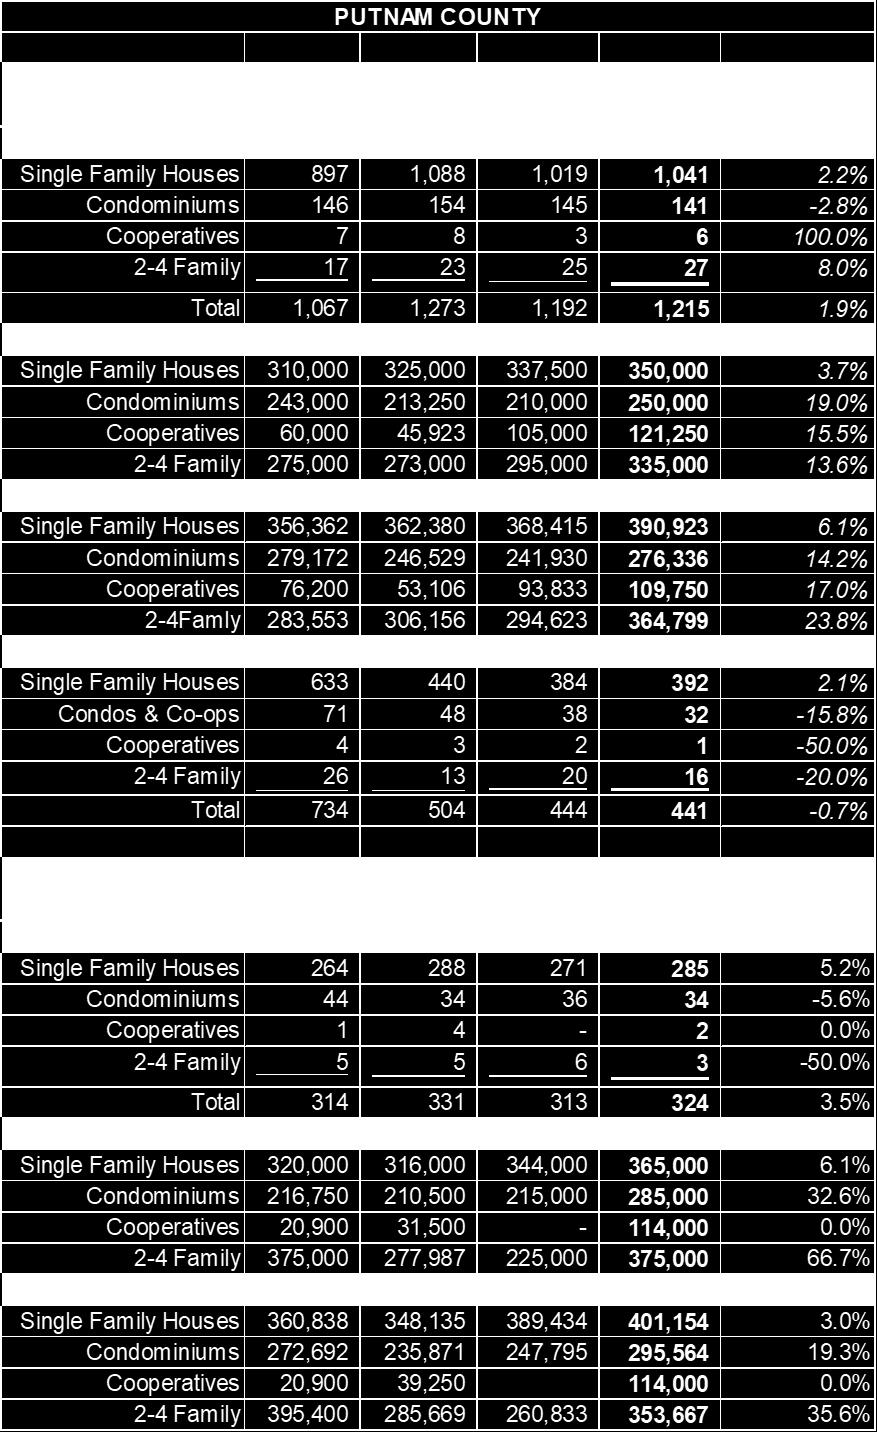
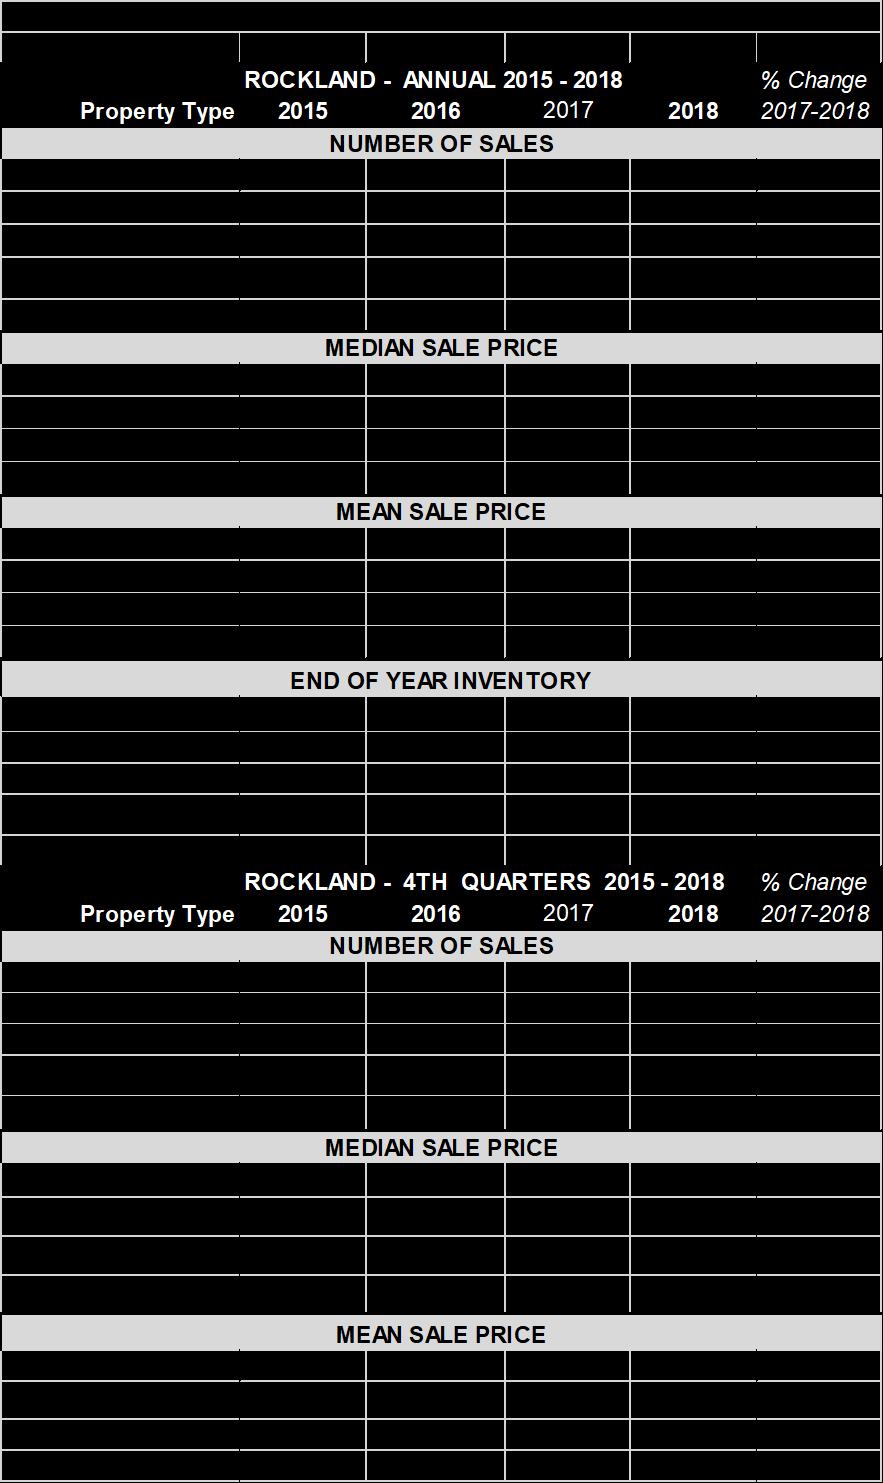
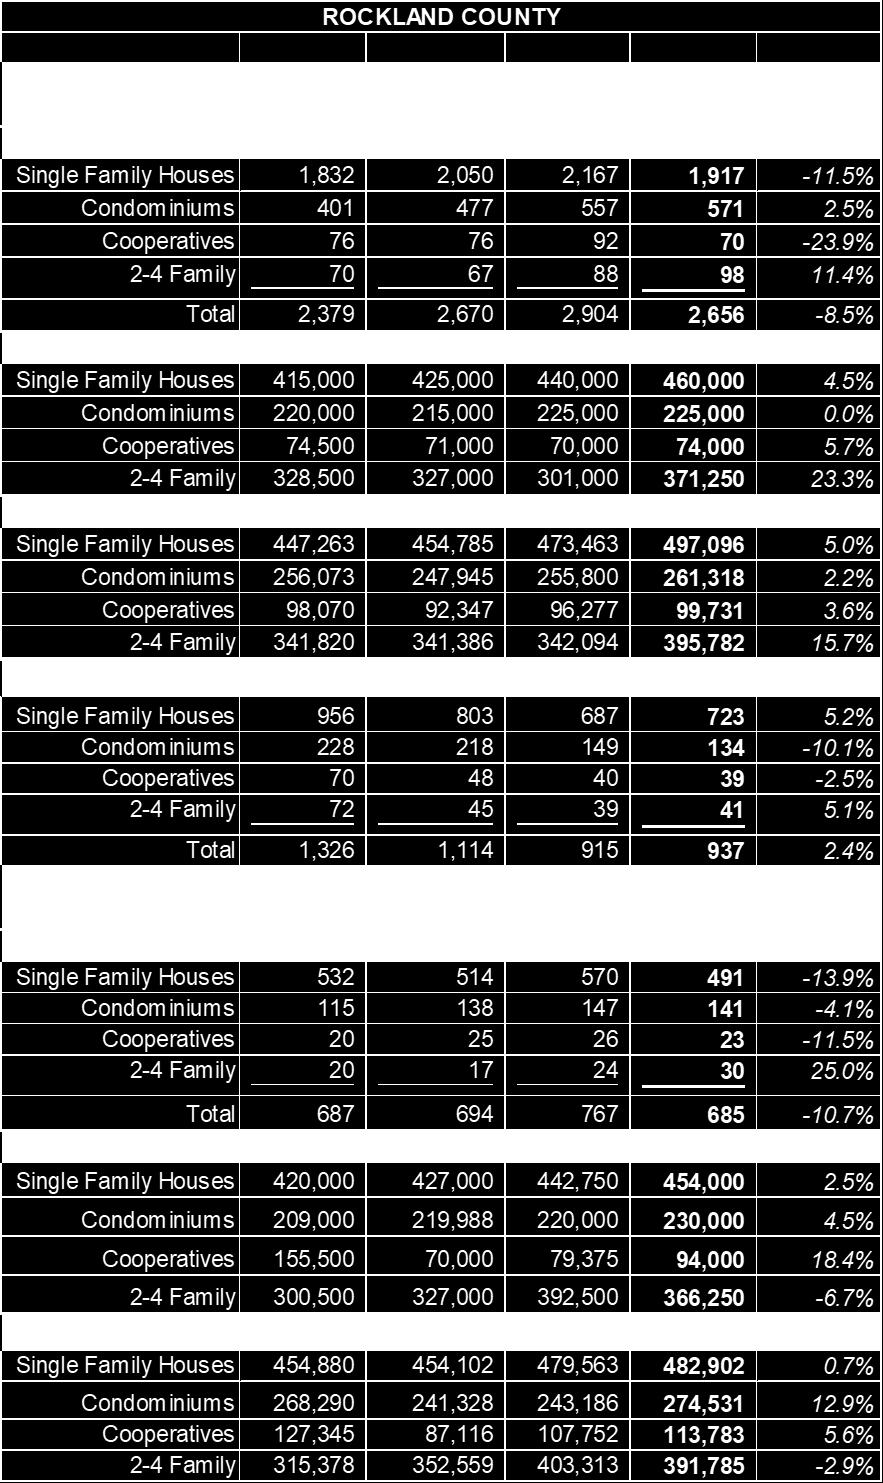
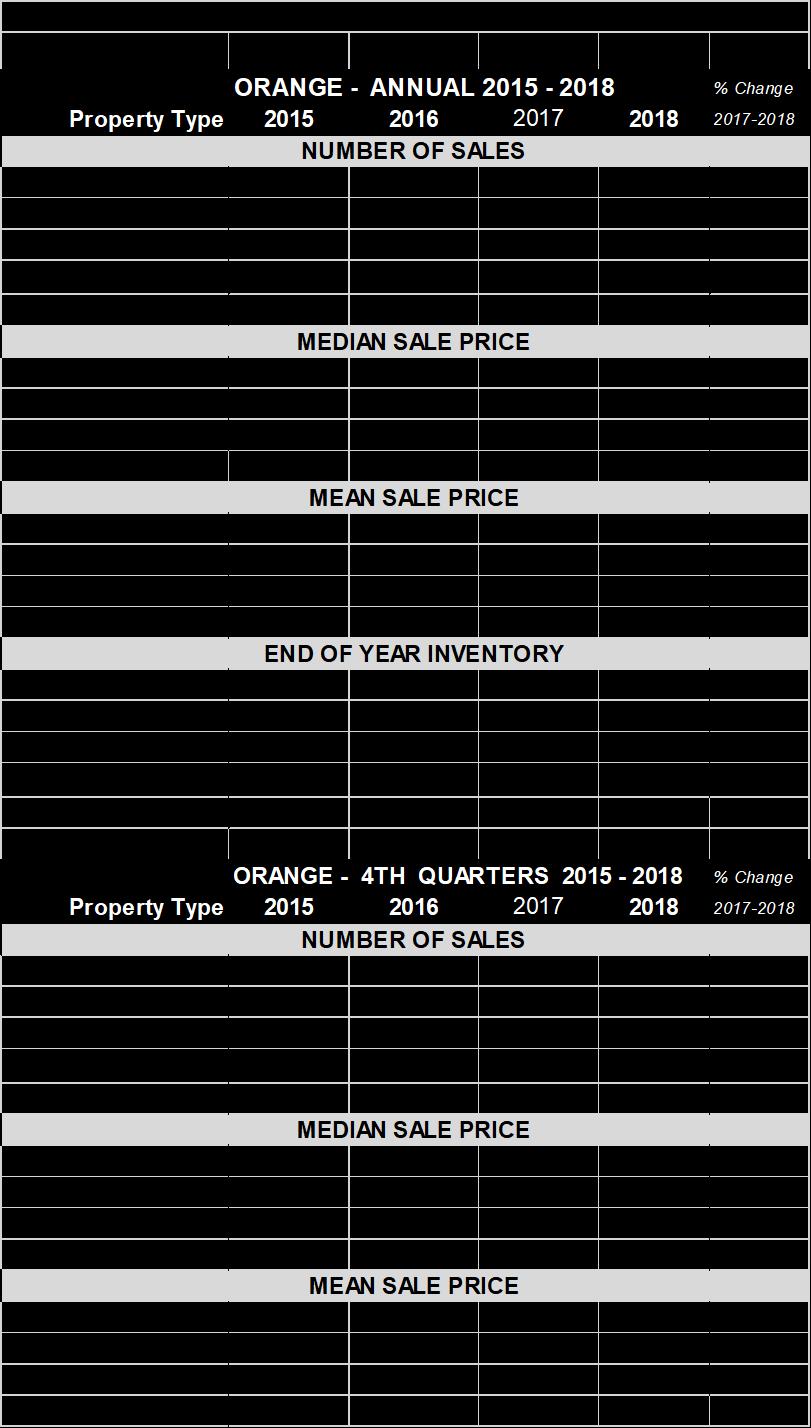
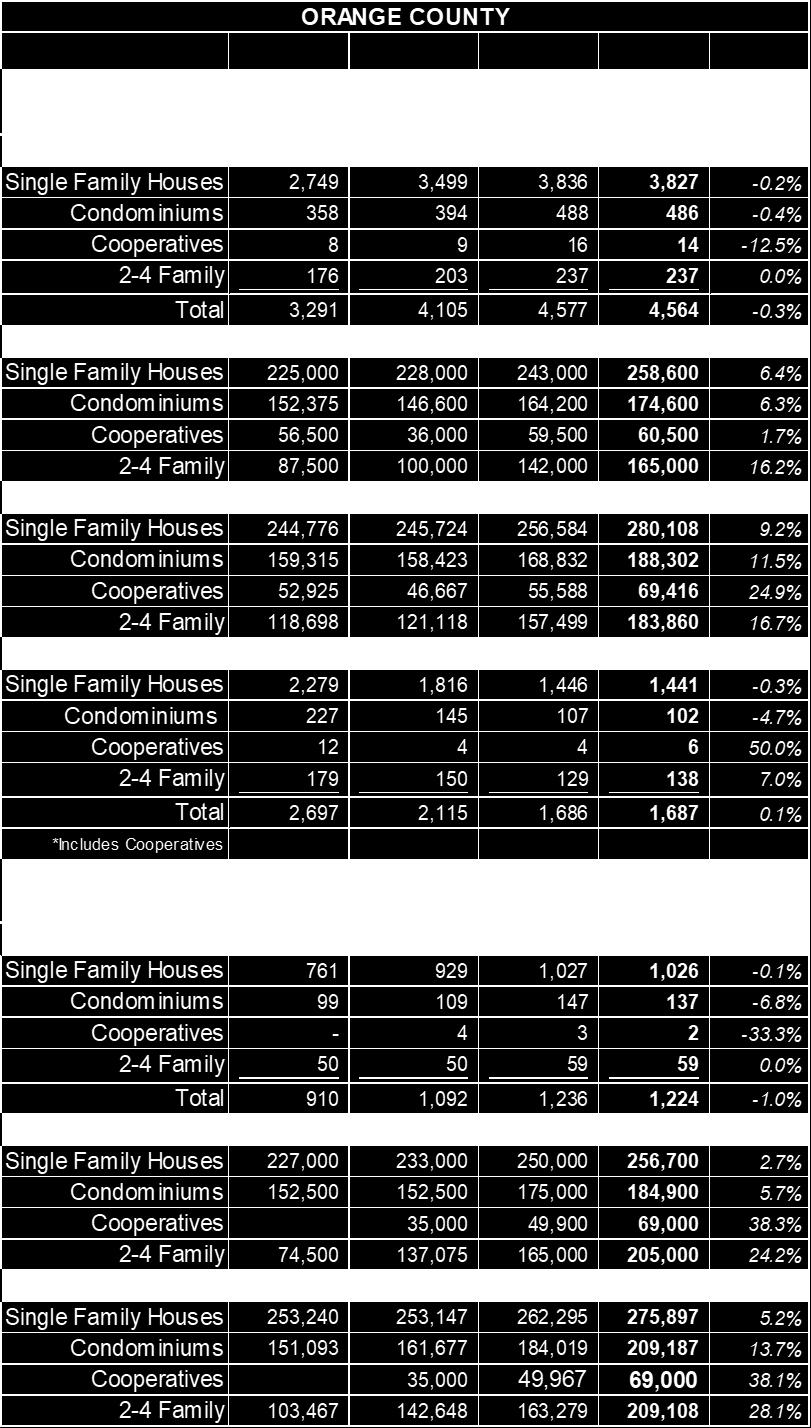
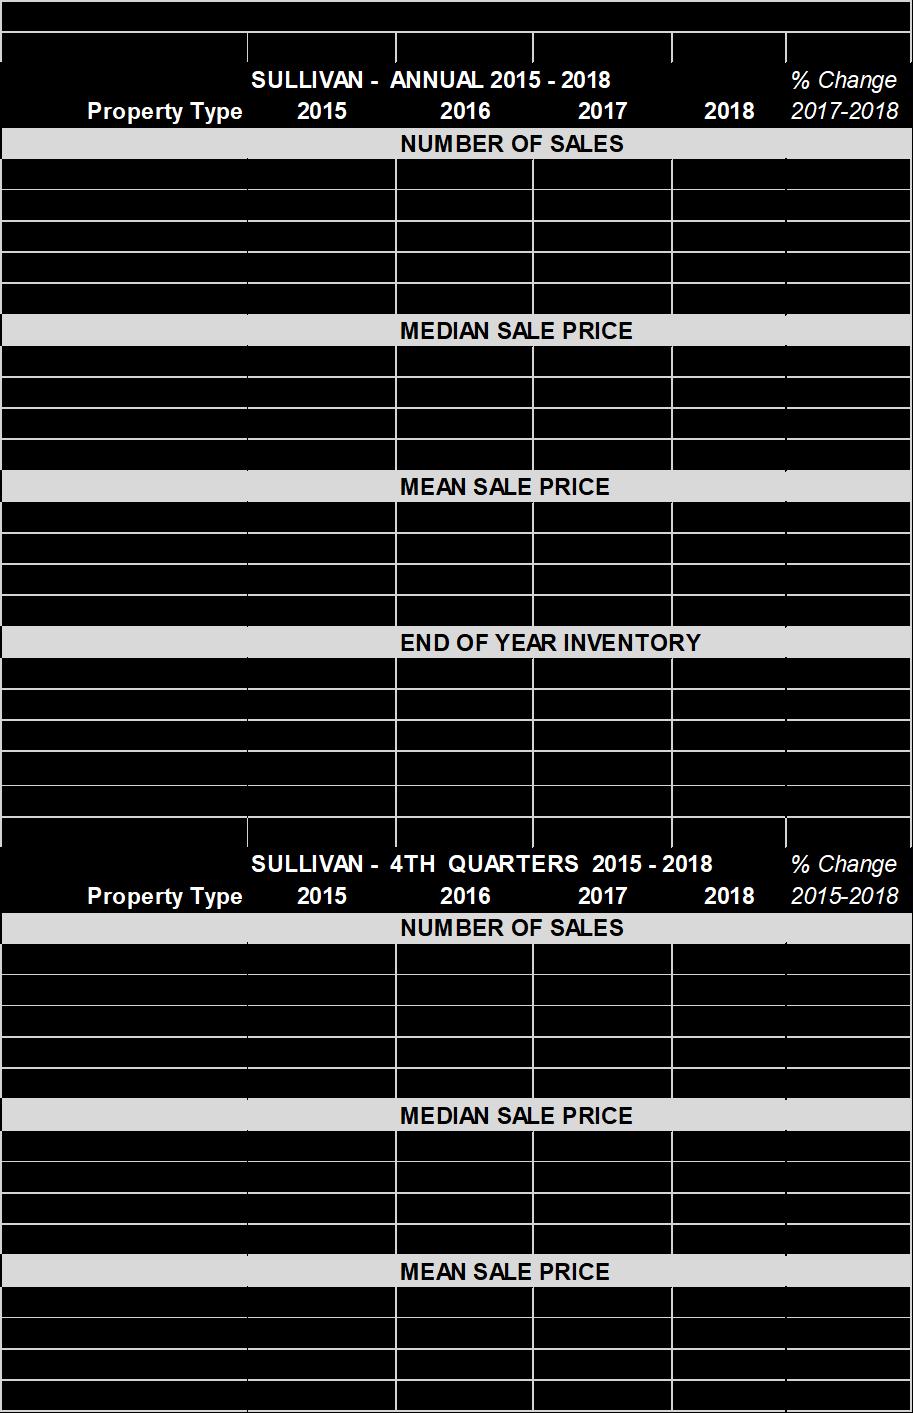
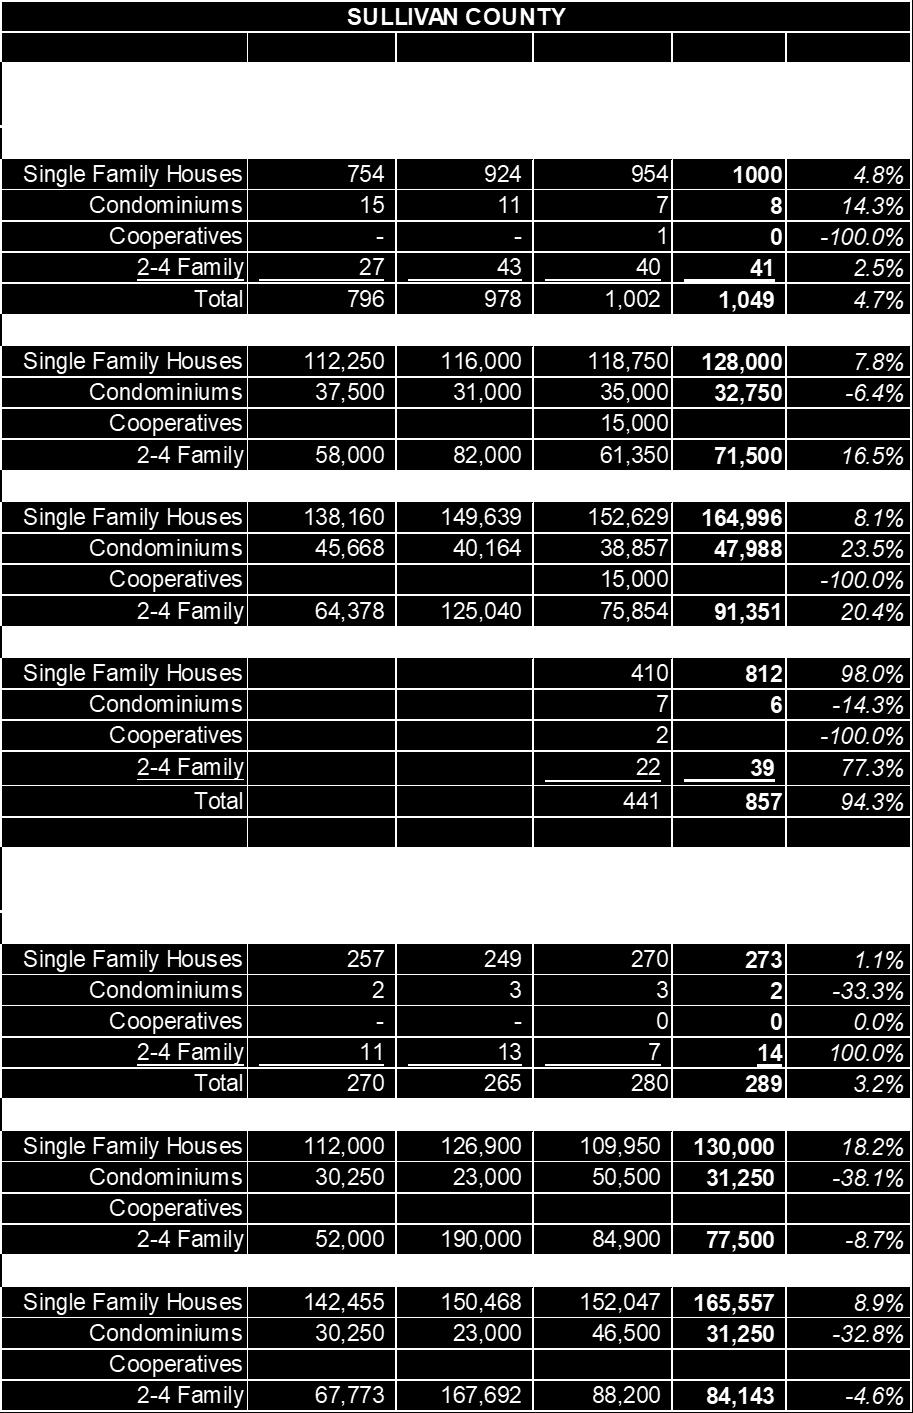
1 January 8, ANNUAL AND 4TH QUARTER RESIDENTIAL REAL ESTATE SALES REPORT Westchester, Putnam, Rockland, Orange and Sullivan Counties, New York While remaining robust, residential sales in some areas of the lower Hudson Valley were slightly lower than the historic highs of the past two years. In 2018 Westchester, Rockland and Orange counties all experienced declines in the number of residential sales as compared to Putnam, Bronx and Sullivan counties, which are also served by the Hudson Gateway Multiple Listing Service, were the exceptions experiencing increases in residential sales of 4.7% in Sullivan, 1.9% in Putnam and 1% in Bronx County. The lower Hudson Valley experienced historically low inventories of single family homes at the beginning of the year, which may have contributed to an initial decline of sales. Rockland County, which experienced an 11.5% drop in sales of single family homes, also saw an increase of 11.4% in sales of 2-4 family homes and an increase of 2.5% in condo sales. Days on market, the number of days from the time a home is listed for sale to the time of a fully executed contract of sale, was significantly lower in all counties. Another indication of healthy demand in the housing market was the increase in sales price in all counties. Westchester County, which had the highest number of single family home sales at 5,876 units, experienced a rise of 1.2% in median price to $650,000, up from $642,000 a year earlier. Orange County, with 3,827 units sold, saw an increase of 6.4% in its median to $258,600 from $243,000 a year earlier. Despite the diminution of units sold in Rockland County, the median sales price rose 4.5% to $460,000 from $440,000 a year earlier. Putnam County, which had a 2.2% increase in unit sales, also had a 3.7% increase in median price rising to $350,000 from $337,500 a year earlier. Hudson Gateway Association of REALTORS One Maple Avenue 9 Coates Drive, Suite 1 2 Medical Park Drive, Suite 17A Hudson Gateway Multiple Listing Service, Inc. White Plains, NY Goshen, NY West Nyack, NY HGAR.com Telephone Telephone Telephone Fax

2 Overall, in 2018, 21,338 residential units were sold in the areas covered by Hudson Gateway Multiple Listing Service. This was a drop of 2.6% from the prior year. Possible headwinds for the housing market for 2019 continue to be the unknown effect of the tax reform law of 2018 which limits the deductibility state and local taxes, and a volatile stock market. However, given the improving inventory numbers, continuing attractive mortgage interest rates, high employment in the region, and a healthy economy it is anticipated that the market will remain vibrant in # # # The Hudson Gateway Multiple Listing Service, Inc. (HGMLS) is a subsidiary of the Hudson Gateway Association of Realtors, Inc. (HGAR). HGMLS s principal service area consists of Westchester, Putnam, Rockland, Orange and Sullivan Counties. It also provides services to Realtors in Bronx, Dutchess, and Ulster Counties. The reported transactions do not include all real estate sales in the area or all sales assisted by the participating offices, but they are fairly reflective of general market activity. HGMLS does not provide data on sub-county areas but persons desiring such data are invited to contact Realtor offices in the desired areas. Prior reports back to 1981 as well as current market information and a directory of Realtor members are available on the Association s Web site, *The median sale price is the mid-point of all reported sales, i.e., half of the properties sold for more than the median price and half for less. The median is relatively unaffected by unusually high or low sales prices. The mean sale price is the arithmetic average, i.e., the sum of all sales prices divided by the number of sales. The mean does reflect the influence of sales at unusually low or high prices. Five tables follow with detailed market data for each county.
3
4
5
6
7
2018 SECOND QUARTER RESIDENTIAL REAL ESTATE SALES REPORT Westchester, Putnam, Rockland and Orange Counties, New York
 July 5, 2018 2018 SECOND QUARTER RESIDENTIAL REAL ESTATE SALES REPORT Westchester, Putnam, Rockland and Orange Counties, New York Second quarter sales figures in the lower Hudson region served by the Hudson
October 10, THIRD QUARTER RESIDENTIAL REAL ESTATE SALES REPORT Westchester, Putnam, Rockland and Orange Counties, New York
 October 10, 2018 2018 THIRD QUARTER RESIDENTIAL REAL ESTATE SALES REPORT Westchester, Putnam, Rockland and Orange Counties, New York Third quarter real estate sales in the lower Hudson Valley remained
October 11, THIRD QUARTER RESIDENTIAL REAL ESTATE SALES REPORT Westchester, Putnam, Rockland and Orange Counties, New York
 October 11, 2017 2017 THIRD QUARTER RESIDENTIAL REAL ESTATE SALES REPORT Westchester, Putnam, Rockland and Orange Counties, New York Real estate sales continued at a brisk pace in the lower Hudson region,
Hudson Valley Home Sales Continue to Increase, But at Lower Rate
 January 11, 2018 Hudson Valley Home Sales Continue to Increase, But at Lower Rate 2017 ANNUAL AND FOURTH QUARTER REAL ESTATE SALES REPORT Westchester, Putnam, Rockland and Orange Counties, New York WHITE
April 11, FIRST QUARTER REAL ESTATE SALES REPORT Westchester, Putnam, Rockland and Orange Counties, New York
 April 11, 2016 2016 FIRST QUARTER REAL ESTATE SALES REPORT Westchester, Putnam, Rockland and Orange Counties, New York Realtors operating in the four-county lower Hudson region served by the Hudson Gateway
2016 ANNUAL AND FOURTH QUARTER REAL ESTATE SALES REPORT Westchester, Putnam, Rockland and Orange Counties, New York
 January 16, 2017 Hudson Valley Posts Strongest Home Sales Since Recession 2016 ANNUAL AND FOURTH QUARTER REAL ESTATE SALES REPORT Westchester, Putnam, Rockland and Orange Counties, New York WHITE PLAINS
HGAR HUDSON GATEWAY ASSOCIATION OF REALTORS, INC.
 HGAR HUDSON GATEWAY ASSOCIATION OF REALTORS, INC. HUDSON GATEWAY ASSOCIATION OF REALTORS, INC. 60 South Broadway, White Plains, New York 10601 914.681.0833 Fax 914.681.6044 www.hgar.com 9 Coates Drive,
HGAR HUDSON GATEWAY ASSOCIATION OF REALTORS, INC.
 HGAR HUDSON GATEWAY ASSOCIATION OF REALTORS, INC. HUDSON GATEWAY ASSOCIATION OF REALTORS, INC. 60 South Broadway, White Plains, New York 10601 914.681.0833 Fax 914.681.6044 www.hgar.com 9 Coates Drive,
HGAR HUDSON GATEWAY ASSOCIATION OF REALTORS, INC.
 09-2 09-3 09-4 10-1 10-2 10-3 10-4 11-1 11-2 11-3 11-4 12-1 12-2 12-3 12-4 13-1 13-2 13-3 13-4 14-1 14-2 Number of Sales HGAR HUDSON GATEWAY ASSOCIATION OF REALTORS, INC. HUDSON GATEWAY ASSOCIATION OF
2011 SECOND QUARTER RESIDENTIAL REAL ESTATE SALES REPORT Westchester and Putnam Counties, New York
 Westchester Putnam Association of REALTORS, Inc. Empire Access Multiple Listing Service, Inc. 60 South Broadway, White Plains, NY 10601 914.681.0833 Fax: 914.681.6044 www.wpar.com Putnam Office: 155 Main
CREATING CONNECTIONS TO HELP YOUR BUSINESS THRIVE
 THE HUDSON GATEWAY ASSOCIATION OF REALTORS CREATING CONNECTIONS TO HELP YOUR BUSINESS THRIVE AFFILIATE MEMBERSHIPS MARKETING EVENT SPONSORSHIPS 2019 REAL ESTATE IN-DEPTH ADVERTISING The Hudson Gateway
Annual Report on the New York State Market FOR RESIDENTIAL REAL ESTATE ACTIVITY IN THE STATE OF NEW YORK
 Annual Report on the New York State Market FOR RESIDENTIAL REAL ESTATE ACTIVITY IN THE STATE OF NEW YORK FOR RESIDENTIAL REAL ESTATE ACTIVITY IN THE STATE OF NEW YORK While the 2017 housing market was
Local Board/Association Presidents, Executive Officers, and NYSAR Regional Vice Presidents
 Memo To: Local Board/Association Presidents, Executive Officers, and NYSAR Regional Vice Presidents From: NYSAR President Christine CJ DelVecchio Date: 5/23/18 Re: April 2018 Housing Market Reports The
ECONOMIC PERSPECTIVES
 February 4, 2019 ECONOMIC PERSPECTIVES EXISTING HOME SALES IN FHLBNY AREA HELD UP BETTER THAN THE NATION, REGION IN 2018 Authored by Brian Jones, FHLBNY Financial Economist HIGHLIGHTS:» Existing home sales
Our High Property Taxes Do Our Assessors Make up the Rules? Real Estate In-Depth November, 2012 By: Edward I. Sumber, Esq.*
 Our High Property Taxes Do Our Assessors Make up the Rules? Real Estate In-Depth November, 2012 By: Edward I. Sumber, Esq.* Approximately two years ago our lower Hudson Valley market was impacted by negative
San Francisco Housing Market Update
 San Francisco Housing Market Update California Economic and Housing Market Outlook The national economy maintained a healthy growth rate in the first quarter of 2005 and appeared to be settling in for
Quarterly Indicators. Q Activity Snapshot + 3.5% + 3.1% % Activity Overview New Listings Pending Sales. Closed Sales.
 Quarterly Indicators Q4-2016 Activity Snapshot Most of 2016 offered the same monthly housing market highlights. The number of homes for sale was drastically down in year-over-year comparisons, along with
Annual Report on the New York State Market FOR RESIDENTIAL REAL ESTATE ACTIVITY IN THE STATE OF NEW YORK
 Annual Report on the New York State Market FOR RESIDENTIAL REAL ESTATE ACTIVITY IN THE STATE OF NEW YORK Annual Report on the New York State Market FOR RESIDENTIAL REAL ESTATE ACTIVITY IN THE STATE OF
Now is a great time to explore your options with Oxford
 Having trouble reading this email? View it in your browser. For best viewing of future emails, please add us to your Safe Senders List or Address Book. October 3, 2017 Now is a great time to explore your
The Corcoran Report 4Q16 MANHATTAN
 The Corcoran Report 4Q16 MANHATTAN Contents Fourth Quarter 2016 4/7 12/23 3 Overview 8 9 10 Market Wide 11 Luxury 24 2 Sales / Days on Market 3 Inventory / Months of Supply 4 5 Market Share Resale Co-ops
HOULIHAN LAWRENCE COMMERCIAL GROUP
 HOULIHAN LAWRENCE COMMERCIAL GROUP TH QUARTER EXECUTIVE SUMMARY FOURTH QUARTER Dear Clients, With behind us and the new year in full swing, we can now reflect, summarize and gain insight from the past
2008 Mid-Year CAAR Market Report Real Estate Market is as Hot as ANWR
 2008 Mid-Year CAAR Market Report Real Estate Market is as Hot as ANWR By Dave Phillips, CEO Charlottesville Area Association of REALTORS Just about everything in life is relative to your perspective. Based
CAAR Market Report 2010 Mid-Year Published by the Charlottesville Area Association of REALTORS
 CAAR Market Report 2010 Mid-Year Published by the Charlottesville Area Association of REALTORS Where Are We Now? The pace of home purchases in the Charlottesville market area showed a significant increase
The Coldwell Banker Carlson Real Estate Market Report
 The Coldwell Banker Carlson Real Estate Market Report 2017 Year-End Stowe Area Report Our 2017 Year-End Market Report uses market-wide data, based on transactions that closed in 2017 in the Multiple Listing
CAAR Market Report 2010 First Quarter Published by the Charlottesville Area Association of REALTORS
 CAAR Market Report 2010 First Quarter Published by the Charlottesville Area Association of REALTORS Where Are We Now? In the first quarter of 2010, the Charlottesville real estate market continued the
Vacancy Inches Higher, Despite Continued Absorption
 Research & Forecast Report GREATER PHOENIX OFFICE 1Q 2017 Vacancy Inches Higher, Despite Continued Absorption Key Takeaways > > Improving conditions in the Greater Phoenix office market took a pause in
Charlottesville Housing Market Report Year-End (Published by the Charlottesville Area Association of REALTORS )
") Charlottesville Housing Market Report - 2009 Year-End (Published by the Charlottesville Area Association of REALTORS ) This Quarterly Market Report is produced by the Charlottesville Area Association of
Charlottesville Housing Market Report - 2009 Year-End (Published by the Charlottesville Area Association of REALTORS ) This Quarterly Market Report is produced by the Charlottesville Area Association of
3Q2017 L O N G ISLAND CITY
 3Q2017 L O N G ISLAND CITY M A R K E T R E P O R T INTRODUCTION L O N G I S L A N D C I T Y S A L E S R E P O R T Q 3 2 0 1 7 : THE SKY IS THE LIMIT Here at Stribling, we are really excited by what s going
INLAND EMPIRE REGIONAL INTELLIGENCE REPORT. School of Business. April 2018
 INLAND EMPIRE REGIONAL INTELLIGENCE REPORT April 2018 Key economic indicators suggest that the Inland Empire s economy will continue to expand throughout the rest of 2018, building upon its recent growth.
MonthlyStatistics MAY 2018
 MonthlyStatistics MAY 2018 FOR IMMEDIATE RELEASE June 1, 2018 Single-Family Benchmark Price Surpasses $500,000 in May NANAIMO, BC The benchmark price of a single-family home in the VIREB area broke the
The Corcoran Report 2Q 2018 MANHATTAN
 The Corcoran Report 2Q 218 MANHATTAN 2Q218 MANHATTAN 2 Overview Closed Sales 3,193-14 YEAR OVER YEAR +26 QUARTER OVER QUARTER Closed sales declined 14 annually versus Second Quarter 217. All product types
L U X U R Y M A R K E T R E P O R T 2 Q
 L U X U R Y M A R K E T R E P O R T 2 Q 2 1 8 The quarterly Luxury Market Report provided by Trump International Realty is a resource compiling pertinent data and analytics to give you a pulse on the current
Local Government Snapshot
 N Minimum Maximum Sum Assessmen t Costs_CY 2009 Valid N 57 NE W YORK STATE OFFICE (listwise) OF THE STATE COMP TROLLER Thomas P. DiNapoli State Comptroller May 2011 Sum LG Class Code 03 60797625 Real property
The Corcoran Report 3Q17 MANHATTAN
 The Corcoran Report 3Q17 MANHATTAN Contents Third Quarter 2017 4/7 12/23 3 Overview 8 9 10 Market Wide 11 Luxury 24 4 Sales / Days on Market 5 Inventory / Months of Supply 6 7 Market Share Resale Co-ops
500 Q Q Q Q Q Q Q Q Q Q Q1-2014
 A QUARTERLY UPDATE ON THE ROLE OF FORECLOSURES IN THE REGION PROVIDED BY THE METROPOLITAN INDIANAPOLIS BOARD OF REALTORS Number of Available for Sale 2,250 2,000 1,750 1,500 1,250 1,000 750 500 Q3-2014
INLAND EMPIRE REGIONAL INTELLIGENCE REPORT
 INLAND EMPIRE REGIONAL INTELLIGENCE REPORT June 2016 EMPLOYMENT After a slow start to 2016, the Inland Empire s labor market returned to form, in recent job figures. Seasonally adjusted nonfarm employment
1Q18 TOWN OF PALM BEACH & BARRIER ISLANDS The Corcoran Report
 1Q18 TOWN OF PALM BEACH & BARRIER ISLANDS The Corcoran Report 353 El Brillo Way web# 5339190 on corcoran.com Town of Palm Beach $6.425M $4.075M 46 +31% -1% +8% $1.018M 125-15% +18% $540K +46% 1Q18 Corcoran
Manhattan Residential. THIRD quarter
 2015 Manhattan Residential MARket Report THIRD quarter Data Highlights Cover Property: halstead.com WEB# 13231035 $995,000 New record median price for Manhattan apartments. Reported sales up 9% from. halstead.com
Housing Price Forecasts. Illinois and Chicago PMSA, January 2018
 Housing Price Forecasts Illinois and Chicago PMSA, January 2018 Presented To Illinois Realtors From R E A L Regional Economics Applications Laboratory, Institute of Government and Public Affairs University
MANHATTAN RESIDENTIAL MARKET REPORT
 2017 FOURTH MANHATTAN RESIDENTIAL MARKET REPORT QUARTER Data Highlights FOURTH QUARTER 2017 Cover Property: halstead.com WEB# 17690202 The average apartment price fell for the second straight quarter,
Yearly Median List Price of Residential Homes For December of Each Year (Prescott Area MLS)
") $350,000 $300,000 $250,000 $200,000 $150,000 $100,000 $50,000 $0 $125,992 $138,821 $161,413 Yearly Median List Price of Residential Homes For December of Each Year (Prescott Area MLS) $173,233 $207,325
$350,000 $300,000 $250,000 $200,000 $150,000 $100,000 $50,000 $0 $125,992 $138,821 $161,413 Yearly Median List Price of Residential Homes For December of Each Year (Prescott Area MLS) $173,233 $207,325
ANALYSIS OF THE CENTRAL VIRGINIA AREA HOUSING MARKET 1st quarter 2013 By Lisa A. Sturtevant, PhD George Mason University Center for Regional Analysis
 ANALYSIS OF THE CENTRAL VIRGINIA AREA HOUSING MARKET 1st quarter By Lisa A. Sturtevant, PhD George Mason University Center for Regional Analysis Economic Overview Key economic factors in the first quarter
rd Quarter Market Report
 2012 3 rd Quarter Market Report The voice of real estate in Central Virginia CAAR Member Copy Expanded Edition Charlottesville Area 3 rd Quarter 2012 Highlights: Overall sales in Greater Charlottesville
MARKET AREA UPDATE Report as of: 1Q 2Q 3Q 4Q
 MARKET AREA UPDATE Report as of: 1Q 2Q 3Q 4Q Year: 2013 Market Area (City, State): Arlington, Virginia Provided by (Company / Companies): McEnearney Associates, Inc. Realtors What are the most significant
FOURTH QUARTER 2009 QUARTERLY MARKET REPORT
 FOURTH QUARTER 2009 QUARTERLY MARKET REPORT Manhattan s and s Average and Median Sale Price While both the average and median sale price for Manhattan apartments fell compared to the fourth quarter of
Advertising Rates Effective January 1, Real Estate
 2018 Advertising Rates Effective January 1, 2018 Real Estate Agate (800) 458-5522 1 Display and Display on classifieds inside NY area (212) 556-1581 / outside NY area (800) 843-3113 The New York Times
Monthly Indicators + 8.8% + 4.3% - 3.6% Market Overview New Listings Pending Sales. Closed Sales. Days on Market Until Sale. Median Sales Price
 Monthly Indicators 2015 The third quarter of 2015 has ticked its last tock with the hands pointing firmly upon a reliable clock of a market. Although noon and 6:30 fluctuations are present even within
The Corcoran Report 4Q 2018 MANHATTAN
 The Corcoran Report 4Q 218 MANHATTAN 4Q218 MANHATTAN 2 Overview Closed Sales 2,797-7 YEAR OVER YEAR -15 QUARTER OVER QUARTER Closed sales declined by 7 annually. Resale co-ops enjoyed a slight increase
Fourth Quarter 2018 Market Report Manhattan Residential
 Market Report Manhattan Residential Data Highlights Cover Property: Halstead.com WEB# 19041474 A pickup in luxury new development closings pushed the average price higher than a year ago. The median apartment
Year to Date (thru June)
") CAAR Market Report 2009 Mid-Year Published by the Charlottesville Area Association of REALTORS Where Are We Now? The pace of home purchases in the Charlottesville area continues to improve from the dismal
CAAR Market Report 2009 Mid-Year Published by the Charlottesville Area Association of REALTORS Where Are We Now? The pace of home purchases in the Charlottesville area continues to improve from the dismal
Q B O S T O N M A R K E T R E P O R T
 Q 3 2 1 7 B O S T O N M A R K E T R E P O R T Introducing the Compass Q3 217 Greater Boston Market Report Page 2 Page 3 Page 5 Page 7 Page 8 Map of Coverage Area Single Family Overview Condo Overview Time
Q SOUTHWEST REGION
 Quarterly Indicators SOUTHWEST REGION Monthly Snapshot Includes the Durango Area Association of REALTORS, Four Corners Board of REALTORS, Pagosa Springs Area Association of REALTORS and the San Luis Valley
The Corcoran Report 4Q17 TOWN OF PALM BEACH & BARRIER ISLANDS
 The Corcoran Report 4Q17 TOWN OF PALM BEACH & BARRIER ISLANDS Town of Palm Beach 19 $8.379M $5.717M 19% 102% 92% 52 $607K $364K -7% WEB# 5301358 on corcoran.com 14% 2017 4Q Corcoran Report Palm Beach In
Monthly Indicators. December Monthly Snapshot - 0.7% + 7.5% - 5.3%
 Monthly Indicators 2014 Monthly Snapshot + 7.5% - 5.3% - 0.7% It was another recovery year in 2014, although not quite to the level of 2013. With a broad pattern of rising prices and stable to improving
TERENCE WALSH - APPRAISER'S QUALIFICATIONS NYS LICENSE #
 TERENCE WALSH - APPRAISER'S QUALIFICATIONS NYS LICENSE # 45000002568 EDUCATION: State University of New York at New Paltz Bachelor of Science Degree in Business 1983 Society of Real Estate Appraisers -
2013 Arizona Housing Market Mid-Year Report
 2013 Arizona Housing Market Mid-Year Report This mid-year market report outlines the latest trends in Arizona real estate. The housing market hit bottom in mid to late 2011, and has been in recovery mode
Monthly Indicators - 5.1% + 3.6% % Market Overview New Listings Pending Sales. Closed Sales. Days on Market Until Sale. Median Sales Price
 Monthly Indicators 2015 In 2015, national residential real estate, by and large, had a good year. Supply and demand were healthy in an environment rife with low interest rates and improved employment.
MANHATTAN RESIDENTIAL MARKET REPORT FIRST QUARTER
 2018 MANHATTAN RESIDENTIAL MARKET REPORT FIRST QUARTER Data Highlights FIRST QUARTER 2018 Cover Property: halstead.com WEB# 18230107 The average price for all apartments fell 8% from a year ago to $1,987,045,
Market Report. Manhattan Q Significant findings in Q3 2009
 ket Report Q3 StreetEasy is pleased to present our Q3 Quarterly Report on the residential market. The bulk of the report is based on approximately 3,300 recorded sales for this quarter as well as over
Multifamily Metro Outlook: New York Spring 2018
 Overview The New York City metro is the nation s largest apartment market with 2.2 million rental units, of which 47 percent are rent-stabilized and 1.2 percent rent-controlled. As anticipated, a glut
Ridgefield. Interpreting the Market. Real Estate Report 2016 Mid Year Review. karlamurtaugh.com
 Ridgefield Real Estate Report 2016 Mid Year Review Interpreting the Market karlamurtaugh.com 203.856.5534 REAL ESTATE REPORT 2016 MID YEAR REVIEW Ridgefield Real Estate 2016 Mid Year Review Sales During
SECOND QUARTER 2013 QUARTERLY MARKET REPORT
 SECOND QUARTER 2013 QUARTERLY MARKET REPORT Manhattan s and s Average and Median Sale Price Manhattan apartment prices averaged just over $1.4 million in the second quarter, 3% less than a year ago. A
PAUL G. WILEY - APPRAISER'S QUALIFICATIONS MEMBERSHIPS AND AFFILIATIONS: State of New York - Certified Real Estate General Appraiser #
 PAUL G. WILEY - APPRAISER'S QUALIFICATIONS MEMBERSHIPS AND AFFILIATIONS: State of New York - Certified Real Estate General Appraiser #46000048291 Mid-Hudson Chapter of the Appraisal Institute Board of
QUARTERLY MARKET REPORT FIRST QUARTER 2013
 QUARTERLY MARKET REPORT FIRST QUARTER 2013 Manhattan s and s Average and Median Sale Price While the average apartment price fell 16% over the past year in Manhattan, the decline was due to the rush of
ESSEX COUNT Y, NEW JERSEY MARKET REPORT THIRD QUARTER
 2017 ESSEX COUNT Y, NEW JERSEY MARKET REPORT THIRD QUARTER Montclair The average sale price reached $786,000, an increase of 5% over prior year. The median sale price also rose ending at $735,000 or 4%
HOUSING OUTLOOK MID-YEAR 2013
 DELTA ASSOCIATES WASHINGTON AREA HOUSING OUTLOOK MID-YEAR 213 MARKET INDICATORS Washington Metro Area At 2 nd Quarter 213 Figure 1 Q2 AVG. SALES PRICE CHANGE VS. Q1 213 *Sales pace at June 213. Pace is
US HOUSING MARKET MIXED; HOME PRICES CONTINUE TO RISE, IMPACTING HOME SALES
 November 4, 2016 US HOUSING MARKET MIXED; HOME PRICES CONTINUE TO RISE, IMPACTING HOME SALES 1) US housing starts in September totaled a seasonally adjusted 1,047,000, down 9.0% month over month and down
ECONOMIC CURRENTS. Vol. 3, Issue 3 SOUTH FLORIDA ECONOMIC QUARTERLY. Introduction
 ECONOMIC CURRENTS THE Introduction SOUTH FLORIDA ECONOMIC QUARTERLY Economic Currents provides an overview of the South Florida regional economy. The report presents current employment, economic and real
Monthly Statistics Package June 2015
 Vancouver Island Real Estate Board Monthly Statistics Package June 2015 FOR IMMEDIATE RELEASE July 2, 2015 Robust Housing Market Shows No Signs of Slowing Down NANAIMO, BC A robust provincial economy and
NANTUCKET REAL ESTATE
 NANTUCKET REAL ESTATE YEAR IN REVIEW 217 Nantucket Real Estate A Comprehensive Analysis by Jen Shalley (58) 228 447 21 Main Street, Nantucket, MA 2 217 Nantucket Real Estate in Photos & Graphics NANTUCKET
nd Quarter Market Report
 2015 2 nd Quarter Market Report The voice of real estate in Central Virginia CAAR Member Copy Expanded Edition Charlottesville Area 2 nd Quarter 2015 Highlights: Closed sales in the Greater Charlottesville
Appendix D HOUSING WORK GROUP REPORT JULY 10, 2002
 Appendix D HOUSING WORK GROUP REPORT JULY 10, 2002 Work Group Assignment At the 20/20 forum in April 2001, the community expressed a need for housing policies which will protect both the Town s social
How Prevailing Wages Can Imperil the Development of Affordable Housing in New York State
 How Prevailing Wages Can Imperil the Development of Affordable Housing in New York State June 2008 TIPPING THE BALANCE How Paying Prevailing Wages Can Imperil the Development of Affordable Housing in New
STATPAK MARKET IN A MINUTE A SUMMARY OF MARKET CONDITIONS FOR JANUARY McEnearney.com CONTRACTS URGENCY INDEX INVENTORY INTEREST RATES
 STATPAK LOUDOUN COUNTY FEBRUARY 2018 McEnearney.com MARKET IN A MINUTE A SUMMARY OF MARKET CONDITIONS FOR JANUARY 2018 Contract activity in January 2018 was down just 2.0% from January 2017, but that is
NANTUCKET REAL ESTATE
 NANTUCKET REAL ESTATE YEAR IN REVIEW 2016 Nantucket Real Estate A Comprehensive Analysis by Jen Shalley (508) 228 4407 21 Main Street, Nantucket, MA 2 2016 NANTUCKET REAL ESTATE IN PHOTOS $19 HIGHEST SALE
REAL ESTATE MARKET OVERVIEW 1 st Half of 2015
 REAL ESTATE MARKET OVERVIEW 1 st Half of 2015 With Comparisons to the 2 nd Half of 2014 September 4, 2015 Prepared for: First Bank of Wyoming Prepared by: Ken Markert, AICP MMI Planning 2319 Davidson Ave.
RESIDENTIAL MARKET ANALYSIS
 11 RESIDENTIAL MARKET ANALYSIS Kyle Smith Portland State University National housing market statistics reflect an increase in value from the prior year, bucking the multi-quarter trend of declining sales
What You Need to Know About the Local Real Estate Market - Q3 2018
 School District Data Multi 60 77 67 6 Multi 6 4 8 4 611 $,00 INVENTORY OF FOR SALE** $47,000 $,000 $0,000 $,000 $678,70 6 66 $8,0 $680,000 Local Market Update 7 4 MEDIAN SALE PRICE,0, 0 16 1 6 44 1, AVERAGE
California Housing Market Update. Monthly Sales and Price Statistics October 2018
 California Housing Market Update Monthly Sales and Price Statistics October 2018 Sales Had the 2 nd Largest Drop in the Last 6 Months California, October 2018 Sales: 397,060 Units, -3.7% YTD, -7.9% YTY
Market Report. Manhattan Q Significant findings in Q1 2010
 ket Report StreetEasy is pleased to present our Quarterly Report on the residential market. The bulk of the report is based on approximately 3,100 recorded sales for this quarter as well as over 1,000
1 ACRE RETAIL PAD SITE
 LEASE OVERVIEWVIEW PROPERTY DESCRIPTION 1 Acre Retail Pad Site in New 15 Acre Development LEASE RATE: $75,000 Per Year (Ground) LOT SIZE: 1.0 Acres PROPERTY HIGHLIGHTS Shared Signaled Access Close Proximity
MANHATTAN RESIDENTIAL MARKET REPORT FOURTH QUARTER
 2016 MANHATTAN RESIDENTIAL MARKET REPORT FOURTH QUARTER Data Highlights Cover Property: halstead.com WEB# 15919235 Apartment prices averaged a record $2,110,566, fueled by new development closings Resale
Market Segmentation: The Omaha Condominium Market
 Market Segmentation: The Omaha Condominium Market Roger P. Sindt Steven Shultz University of Nebraska at Omaha Introduction A highly visible and growing niche in the homeownership market is the condominium
Market Report. Manhattan Q Significant findings in Q2 2010
 Market Report StreetEasy is pleased to present our Quarterly Report on the residential market. The bulk of the report is based on approximately 3,500 recorded sales for this quarter as well as over 1,000
CITI HABITATS. Manhattan Residential Sales Market Report
 Manhattan Residential Sales Market Report Contents 4/7 12/17 3 8 9 10 Market Wide 4 Sales / Days on Market 5 / Months of Supply 6 7 Market Share Resale Co-ops Resale Condos New Developments 11 Luxury Neighborhoods
January Home Sales Fall as Prices Continue to Rise
 Date: 2/23/15 For Release: Immediately For More Information Contact: Michael Theo, WRA President & CEO, 608-241-2047, mtheo@wra.org or David Clark, Economist, C3 Statistical Solutions and Professor of
2 ACRE HOTEL/RETAIL PAD SITE
 LEASE OVERVIEWVIEW PROPERTY DESCRIPTION 2 Acre Pad Site in New 15 Acre Development AVAILABLE SF: 2.0 Acres LEASE RATE: $200,000 Per Year (Ground) LOT SIZE: 2.0 Acres PROPERTY HIGHLIGHTS Shared Signaled
2Q2017 L O N G ISLAND CITY
 2Q2017 L O N G ISLAND CITY M A R K E T R E P O R T INTRODUCTION L O N G I S L A N D C I T Y S A L E S R E P O R T Q 2 2 0 1 7 : LONG ISLAND CITY IS THE FASTEST GROWING NEIGHBORHOOD IN THE COUNTRY. The
2015 First Quarter Market Report
 2015 First Quarter Market Report CAAR Member Copy Expanded Edition Charlottesville Area First Quarter 2015 Highlights: Median sales price for the region was up 5.1% over Q1-2014, rising from $244,250 to
Single Family Sales Maine: Units
 Maine Home Connection 19 Commercial St Portland, Maine 04101 MaineHomeConnection.com Office: (207) 517-3100 Email: Info@MaineHomeConnection.com For the fourth consecutive year, Maine home sales set a new
State of the Nation s Housing 2008: A Preview
 State of the Nation s Housing 28: A Preview Eric S. Belsky Remodeling Futures Conference April 15, 28 www.jchs.harvard.edu The Housing Market Has Suffered Steep Declines Percent Change Median Existing
California Housing Market Update. Monthly Sales and Price Statistics May 2018
 California Housing Market Update Monthly Sales and Price Statistics May 2018 Sales Lost Momentum as Mortgage Rates Continued to Climb California, May 2018 Sales: 409,270 Units, +0.3% YTD, -4.6% YTY 700,000
MonthlyStatistics AUGUST 2018
 MonthlyStatistics AUGUST 2018 FOR IMMEDIATE RELEASE September 4, 2018 Sales Bounce Back Slightly From July But Still Lower Than in 2017 NANAIMO, BC Sales of single-family homes in August were seven per
Monthly Indicators. Monthly Snapshot. March % % 0.0%
 Monthly Indicators 2017 We can comfortably consider the first quarter to have been a good start for residential real estate in 2017. There was certainly plenty to worry over when the year began. Aside
Manhattan Residential Market Report. Second Quarter 2012
 Manhattan Residential Market Report Second Quarter 2012 Manhattan s and s Manhattan apartments sold for an average price of $1,451,155 in the second quarter, down from the prior quarter, but up slightly
California Housing Market Update. Monthly Sales and Price Statistics January 2018
 California Housing Market Update Monthly Sales and Price Statistics January 2018 Sales Started with a Slight Decrease California, Jan. 2018 Sales: 388,800 Units, -2.9% YTD, -2.9% YTY 700,000 600,000 500,000
May 2016 Loudoun County Market Trends Report Homes selling twice as fast as 2015 with re-emergence of seller s market
 FOR IMMEDIATE RELEASE Contact: Christine Windle 703-777-2468 Dulles Area Association of REALTORS cwindle@dullesarea.com Sponsored by: Access National Bank Tom Ciolkosz, (703) 871-1045, tciolkosz@accessnationalbank.com
1Q18 MANHATTAN The Corcoran Report
 1Q18 MANHATTAN The Corcoran Report Contents First Quarter 2018 3 Overview 4/7 Market Wide 8 9 10 12/23 24 4 Sales / Days on Market 5 Inventory / Months of Supply 6 Prices 7 Market Share Resale Co-ops Resale
500 Q Q Q Q Q Q Q Q Q Q Q Q1-2015
 A QUARTERLY UPDATE ON THE ROLE OF FORECLOSURES IN THE REGION PROVIDED BY THE METROPOLITAN INDIANAPOLIS BOARD OF REALTORS Number of Available for Sale 2,250 2,000 1,750 1,500 1,250 1,000 750 500 Q1-2004
Monthly Indicators. Monthly Snapshot. July % + 7.8% %
 Monthly Indicators For residential real estate activity by members of the Florida REALTORS 2012 A few short years ago, housing was considered a headwind to economic recovery. Today, housing is seen as