Residential Land Strategy for Ottawa
|
|
|
- Isaac Ball
- 6 years ago
- Views:
Transcription

1 Residential Land Strategy for Ottawa City of Ottawa Department of Infrastructure Services and Community Sustainability Planning Branch Research and Forecasting Section Feb 2009 Publication # 9-23
2 Residential Land Strategy for Ottawa Executive summary Setting Ottawa s urban boundary to 2031 is a complex process that involves a balance between policy direction and market forces. Policy direction flows from a variety of sources, including provincial policy, the cost of providing and maintaining new infrastructure and community services, and the type of city we want. Market forces carry a powerful momentum of long-established industry practices, business plans and consumer demand patterns that have evolved over time. While not immune to change, market forces tend to evolve slowly unless unexpected shocks or stimuli cause people to shift preferences more quickly. The Residential Land Strategy s primary goals are to be consistent with the Provincial Policy Statement and City Council s direction. As such, it rests on the following key principles: Grow in, not out Set intensification targets that guide new residential construction toward more urban forms of development, while remaining reasonable from a market perspective. Set density targets at key stations and locations along the rapid transit network to support the City s transit investment and modal split objectives; Set intensification targets for Traditional and Arterial Mainstreets, to support, strengthen or set the stage for vibrant mainstreets in the older areas of the city; Set density targets for greenfields, and put in place the support mechanisms that will lead to the housing industry choosing pedestrian- and transit-supportive development patterns over the caroriented patterns of the last six decades; Set density targets for suburban Town Centres to support future upgrades of the rapid transit service from Bus Rapid Transit to Light Rail Transit; If urban expansion is required, keep it to a minimum. The elements and proposals of the Residential Land Strategy are summarized as follows: Projected TOTAL of 147,532 new dwellings in Ottawa between 2006 and Projected new construction dwelling type split of 40% single detached, 5% semi-detached, 27% townhouses and 28% apartments. Projected rural share of 9% (13,278 units) of all new dwellings to be built in Ottawa, with the balance of 91% (134,254) to be built in the urban area. Projected new rural dwellings at 94% single detached, 1% semi-detached, 4% townhouses and 1% apartments. Projected new urban dwellings at 35% single detached, 5% semi-detached, 29% townhouses and 31% apartments. Establish a city-wide minimum intensification target of 40% of new urban dwellings to 2031, a TOTAL of 53,700 dwellings. Provide for the intensification target to be phased-in as follows: o : 36% o : 40% o : 44% Establish as target areas for intensification: o The Central Area o Major Mixed-Use Centres o Mixed-Use Centres at Transfer Stations o Emerging Mixed-Use Centres o Traditional Mainstreets o Arterial Mainstreets o Town Centres Establish minimum intensification targets for the target areas, to reside outside the Official Plan, but to guide Community Design Plans (CDPs), zoning and infrastructure planning. Establish the following density targets, expressed in people and jobs per gross hectare:
3 o The Central Area 500 o Major Mixed-Use Centres 250 o Target Arterial Mainstreets 120 to 200 o Mixed-Use Centres at Transfer Stations 200 o Emerging Mixed-Use Centres 120 o Town Centres 120 Ensure that all future CDPs or amendments to existing CDPs, and new zoning flowing therefrom, provide for no less than the minimum intensification targets set out in this document for Traditional and Arterial Mainstreets, Mixed-Use Centres and Town Centres. Permit high-rise buildings in the Central Area, Mixed-Use Centres and Town Centres. Acknowledge intensification potential outside the target areas and accommodate it subject to urban design and building height requirements that preserve neighbourhood character and do not detract from the target areas ability to be the focus of intensification and growth within the built-up area. On greenfields outside the Greenbelt, establish a minimum net density of 26 units per hectare for all new single detached dwellings, and a minimum overall residential net density of 32 units per hectare. Create an Intensification Implementation Group led by the Planning Branch that will be tasked with coordinating all City departments and services practices, by-laws and administration to support intensification and compact, mixed-use development, and lead discussions with all external stakeholders (including School Boards and utilities) with a view to addressing technical, regulatory and design matters in a way that will allow the City s Residential Land Strategy to be successful. Foreword Setting Ottawa s urban boundary to 2031 is a complex process that involves a balance between policy direction and market forces. Policy direction flows from a variety of sources, including provincial policy, the cost of providing and maintaining new infrastructure and community services, and the type of city we want. Market forces carry a powerful momentum of long-established industry practices, business plans and consumer demand patterns that have evolved over time. While not immune to change, market forces tend to evolve slowly unless unexpected shocks or stimuli cause people to shift preferences more quickly. This report is the result of extensive technical analysis and consultation with stakeholders in the homebuilding industry and the city s community associations. It builds on the work contained in the document titled Growth Projections for Ottawa: Prospects for Population, Housing and Jobs (November 2007) and incorporates the results of consultations that flowed from the White Papers (winter ), and the Intensification Forum (May 2008). Representatives of the homebuilding industry have participated in technical discussions with staff on a monthly basis since January 2007 and have provided information and opinion on the topic. This report contains five sections. The first section deals with policy requirements and direction. It discusses the application of the Provincial Policy Statement (PPS) to Ottawa s housing forecast. It also relates Council s intent, as expressed in the 2003 Official Plan (OP) and its Growth Management section, to the current projection of population and housing and to PPS requirements. The second section addresses housing requirements and presents the recommended projection of dwellings by type. It is based on detailed analysis of statistics and building trends and represents, in the opinion of staff, the most methodologically defensible and appropriate forecast of housing needs for Ottawa based on available information and policy direction. The third section deals with intensification targets. This is a new feature in the Official Plan. The calculation of the targets and their application to the forecast is addressed in this section. The discussion addresses target locations for intensification, minimum densities to sustain rapid transit, intensification outside target areas, and strategies to support intensification. The fourth section addresses greenfield suburban development. It discusses residential densities and subdivision layout, the relationship of residential uses to overall suburban land, contributors to suburban densities and strategies to support higher suburban densities.
4 Section five concludes with the recommendations of the Residential Land Strategy. 1. Policy Requirements 1.1 Summary The policy framework for the review of Ottawa s urban land requirements requires the City to accomplish the following things: The City must include the existing built-up area and the redevelopment potential it provides in its calculation of residential supply [PPS, policy 1.1.2]. The City must establish minimum intensification targets and a monitoring system that will allow it to verify whether the targets are being achieved at the same time as, or before, greenfield development within the urban boundary [PPS policies and ]. The City must develop intensification targets. It will develop an overall city-wide target for the OP, and targets for the Central Area, Mainstreets, Mixed-Use Centres and Town Centres that will reside outside the OP [OP and OP Review Preliminary Proposals, received by Planning and Environment Committee April 22, 2008]. The City must adopt development standards and density targets that facilitate compact urban form along transit corridors and on greenfields [PPS policies , and 1.2.2(d); Council Direction of May 28, 2008]. The City s intensification targets must be met before approving any further expansion of the urban boundary [PPS policies and (c)]. The City must provide for an appropriate range of housing types and densities to meet projected requirements of the entire regional market area [PPS policy 1.4.3; City Housing Strategy ]. Overall, in its assessment of how to accommodate residential growth, the City must begin with an intensification target and then develop greenfield development density targets that are higher than the suburban densities observed in the past. Once it has done this, and if the projected housing requirement still exceeds the amount of designated urban land, it may expand the urban boundary. 1.2 Provincial Policy The Provincial Policy Statement (2005) contains policies under the heading Managing and Directing Land Use to Achieve Efficient Development and Land Use Patterns that provide direction to municipalities on managing urban growth. For ease of reference, they are transcribed below: Sufficient land shall be made available through intensification and redevelopment and, if necessary, designated growth areas, to accommodate an appropriate range and mix of employment opportunities, housing and other land uses to meet projected needs for a time horizon of up to 20 years. [ ] Planning authorities shall identify and promote opportunities for intensification and redevelop-ment where this can be accommodated taking into account existing building stock or areas, including brownfield sites, and the availability of suitable existing or planned infrastructure and public service facilities required to accommodate projected needs Appropriate development standards should be promoted which facilitate intensification, redevelopment and compact form, while maintaining appropriate levels of public health and safety Planning authorities shall establish and implement minimum targets for intensification and redevelopment within built-up areas Planning authorities shall establish and implement phasing policies to ensure that specified targets for intensification and redeve-lopment are achieved prior to, or concurrent with, new development within designated growth areas New development taking place in designated growth areas should occur adjacent to the existing built-up area and shall have a compact form, mix of uses and densities that allow for the efficient use of land, infrastructure and public service facilities.
5 Planning authorities shall establish and implement phasing policies to ensure the orderly progression of development within designated growth areas and the timely provision of the infrastructure and public service facilities required to meet current and projected needs A planning authority may identify a settlement area or allow the expansion of a settlement area boundary only at the time of a comprehensive review and only where it has been demonstrated that: a. sufficient opportunities for growth are not available through intensification, redeve-lopment and designated growth areas to accommodate the projected needs over the identified planning horizon; b. the infrastructure and public service facilities which are planned or available are suitable for the development over the long term and protect public health and safety; c. in prime agricultural areas: 1. the lands do not comprise specialty crop areas; 2. there are no reasonable alternatives which avoid prime agricultural areas; and 3. there are no reasonable alternatives on lower priority agricultural lands in prime agricultural areas; and d. impacts from new or expanding settlement areas on agricultural operations which are adjacent or close to the settlement area are mitigated to the extent feasible Where planning is conducted by an upper-tier municipality, the upper-tier municipality in consultation with lower-tier municipalities shall: [ ] e. identify targets for intensification and redevelopment within all or any of the lower-tier municipalities, including minimum targets that should be met before expansion of the boundaries of settlement areas is permitted in accordance with policy ; f. where transit corridors exist or are to be developed, identify density targets for areas adjacent or in proximity to these corridors, including minimum targets that should be met before expansion of the boundaries of settlement areas is permitted in accordance with policy Where there is no upper-tier municipality, planning authorities shall ensure that policy is addressed as part of the planning process, and should coordinate these matters with adjacent planning authorities. [ ] Planning authorities shall provide for an appropriate range of housing types and densities to meet projected requirements of current and future residents of the regional market area by: a. establishing and implementing minimum targets for the provision of housing which is affordable to low and moderate income households. b. permitting and facilitating: 1. all forms of housing required to meet the social, health and well-being requirements of current and future residents, including special needs requirements; and 2. all forms of residential intensification and redevelopment in accordance with policy ; c. directing the development of new housing towards locations where appropriate levels of infrastructure and public service facilities are or will be available to support current and projected needs; d. promoting densities for new housing which efficiently use land, resources, infrastructure and public service facilities, and support the use of alternative transportation modes and public transit in areas where it exists or is to be developed; and e. establishing development standards for residential intensification and new residential development which minimize the cost of housing and facilitate compact form, while maintaining appropriate levels of health and safety. 1.3 City of Ottawa Council Direction Official Plan The Official Plan contains strategic directions with respect to the direction of growth in Ottawa. These policies will not change during the course of the current OP review. Section 2 (Strategic Directions) sets out the City s growth pattern: The City will manage growth by directing it to the urban area where services already exist or where they can be provided efficiently.
6 Growth in the urban area will be directed to areas where it can be accommodated in compact and mixed-use development, and served with quality transit, walking and cycling facilities. Downtown Ottawa will be a vibrant mix of thriving economic and cultural activities within a setting that celebrates the unique qualities of both the city and the National Capital. A transportation system that emphasizes transit, walking and cycling will be built. Public water and sanitary wastewater facilities will be provided to reinforce the City s commitments to a compact urban area and safe and healthy communities. Section 2.2 (Managing Growth) states that about 90% of the projected growth in population, jobs and housing is to be accommodated within the urban boundary (or designated settlement area under the PPS). The urban boundary defines the area that is already, or is approved to be, serviced with major roads, transit and piped sewer and water services. Section (Managing Growth Within the Urban Area) states that within the designated urban area, growth will be directed to locations with significant development potential, specifically those designated as Central Area, Mixed-Use Centres, Employment Areas, Enterprise Areas, Developing Communities and Mainstreets. (Growth, in this context, includes both housing and jobs.) It further states: Within the General Urban Area, opportunities for intensification exist and will be supported, although such opportunities are generally at a much smaller scale than in the land use designations described above. Section states that the areas targeted for intensification include the Central Area, Mainstreets, Mixed-Use Centres and Town Centres. Policies in S also identify additional areas where opportunities for intensification are promoted, including: Lands within 600 m of existing or future rapid transit stations with potential to develop as compact, mixed-use and pedestrian-friendly cores; Lands that are no longer viable for the purposes for which they were intended, such as older industrial areas, exhausted quarries, or abandoned transportation corridors [ ]; Lands where the present use is maintained but the addition of residential uses or other uses can be accomplished in a complementary manner, such as on under-utilized shopping centre sites; Lands currently or formerly used as parking lots or other extensive storage purposes; Lands where records indicate existing contamination due to previous commercial or industrial use, but which can be made suitable for development if cleaned up. The PPS and OP policy frameworks require a new way of calculating land requirements for residential purposes. In fact, the notion of land requirements becomes somewhat inaccurate under this new system because redevelopment opportunities cannot, by definition, be quantified in the same way as vacant greenfield land. Proposed Transportation Master Plan The first phase of the proposed Transportation Master Plan was the approval by Council, on May 28, 2008, of a Primary Rapid Transit Network which is centered on the construction of a Light Rail Transit (LRT) tunnel through downtown, the conversion of the existing Transitway to LRT between Blair and Baseline stations, and the conversion of the existing O-Train to twin-track electric LRT along with its extension to the airport and into Riverside South. City Council provided additional direction with respect to suburban densities in their decision to adopt the Primary Rapid Transit Network, as follows: 2. That staff recommended Option 4 be amended to extend Light Rail Transit (LRT) in the east to Trim Road (along Cumberland Transitway) and in the west to Scotiabank Place subject to the following: Development of transit corridors inside Greenbelt first Business case supports return on rail investment (ridership, capital and operating costs) Achieving a minimum density target (to be determined in the updated Official Plan) Availability of funding. 9. That the recommended Transit Network be approved on the following basis: a. A city-wide network that ultimately extends LRT to Kanata, Orléans and Barrhaven/Riverside South; b. A priority network within the planning horizon based on Option 4, as amended.
7 Based on this direction by Council, minimum density targets for suburban development will be included in the Official Plan. City Housing Strategy The City Housing Strategy, (CHS), adopted by Council in 2007, contains specific directions with respect to residential development. Direction 1, Building Healthy, Sustainable, Inclusive Communities, informs the City s residential land strategy. It directs the City to promote compact, sustainable housing development and redevelopment and to encourage and enable diverse, flexible housing solutions across the city. The promotion of a diversity of housing throughout Ottawa increases housing options in each neighbourhood and reduces the use of cars by enabling residents to live closer to workplaces. It promotes pedestrian-oriented and transit supportive neighbourhoods. Diversity and flexibility is defined as a mix of types and tenures and housing affordable to all community members. The CHS requires a more integrated approach to land use planning and the achievement of affordable housing targets as set out in the 2003 Official Plan. It establishes clear linkages between the inclusion of affordable housing in residential development and growth management strategies. The achievement of affordable housing targets is a key part of successful growth management. The City s most recent Annual Development Report (2007) indicates the need to ensure the inclusion of affordable housing as part of the City s residential land strategy. Migration data from Statistics Canada shows that our most significant population deficit in the period has been to Gatineau and Ontario Municipalities Adjacent to Ottawa (OMATO), likely due to the mounting cost of housing in Ottawa as well as improved road access into Ottawa. 2. Housing Requirements 2.1 Projections Recap The population projection adopted by City Council in November 2007 is Scenario 2 as presented in the document Growth Projections for Ottawa: Prospects for Population, Housing and Jobs (November 2007). That projection is summarized as follows: Figure 1 Projected population, households and jobs to Population 871, ,000 1,031,000 1,136,000 Households 351, , , ,000 Jobs 530, , , ,000 From the above projection, the City needs to provide opportunities for 146,000 additional households and 173,000 more jobs by Methodology and Scenarios In Growth Projections for Ottawa, two methodologies were presented for projecting housing requirements. Because of the size and complexity of a city like Ottawa, the Detailed Methodology was selected. The Detailed Methodology involves a projection of dwelling type propensities by age groups: that is to say, a forecast of the types of homes the population is likely to inhabit based on their age, and a forecast of how these preferences may evolve over the projection period both from a demographic and market standpoint and from the perspective of what the City would like to encourage. The TOTAL number of required dwellings is obtained by adding to the TOTAL projected household demand a vacancy factor and accounting for demolition replacements. The population that resides in institutions (e.g. nursing homes, group homes or prisons) is factored out of the market housing demand; however, provision must be made to accommodate a growing institutionalized population (see Appendix 1 for a discussion on the institutionalized population).
8 A projection of propensities was presented in Growth Projections for Ottawa, but after consultations, two more scenarios were added to reflect a variety of hypotheses about evolving dwelling choices. The resulting three scenarios are presented below. All technical data and calculations appear as appendices at the end of this report. The assumptions behind the four scenarios take into account the following factors, which are discussed in Growth Projections for Ottawa (s. 2.4): Housing choices of an aging population Housing choices of an older population with increasing disabilities Housing choices of households of decreasing size Housing choices of immigrants The appeal of the urban lifestyle Increasing cost of, and challenges to finance municipal infrastructure construction and maintenance Increasing cost of energy Scenario 1 This is the dwelling propensity scenario, using the detailed methodology, that appeared in the Growth Projections for Ottawa report. Under this scenario, new housing units required to 2031 would be distributed as follows: Figure 2 New dwelling units by type, , Scenario 1 Single Semi Row Apt. TOTAL Units 44,979 7,465 44,737 50, ,767 % 30% 5% 30% 34% 100% This scenario entails no expansion to the current urban boundary and the achievement of a higher intensification target than in the two next scenarios. It anticipates the most significant shift in people s housing preferences toward apartments and away from single detached homes. Scenario 2 The second scenario anticipates a shift in people s housing preferences, but accounts for a more gradual transition toward multi-family dwellings. The share of single detached homes and townhouses remains at levels close to those seen in recent market history. Apartments increase their share at the lowest rate in this scenario. New housing units required to 2031 would be distributed as follows: Figure 3 New dwelling units by type, , Scenario 2 Single Semi Row Apt. TOTAL Units 63,632 7,841 44,418 32, ,155 % 43% 5% 30% 22% 100% This scenario entails an expansion of the urban boundary and the achievement of a 40% intensification target. Scenario 3 The third scenario also anticipates a shift in people s housing preferences based on the reasons noted above, and accounts for a quicker transition than in Scenario 2 toward apartments, which would take share away from townhouses and single detached dwellings. The share of single detached homes remains at levels close to those seen in recent market history. Under this scenario, new housing units required to 2031 would be distributed as follows:
9 Figure 4 New dwelling units by type, , Scenario 3 Single Semi Row Apt. TOTAL Units 59,101 7,257 39,447 41, ,532 % 40% 5% 27% 28% 100% This scenario also entails an expansion of the urban boundary and the achievement of a 40% intensification target. Recent housing construction trends To compare these three scenarios with recent trends in homebuilding, the following figure summarizes housing starts by share of dwelling type for the last three five-year periods. Figure 5 Share of housing starts by type, Single Semi Row Apt % 3% 42% 10% % 5% 27% 12% % 6% 34% 17% On an annualized basis, housing starts for the last fifteen years have produced the following number of units by type: Figure 6 Housing starts by type (annualized), Single Semi Row Apt. TOTAL , , , , , , , ,003 1,036 6,197 Figures 5 and 6 show cyclical variations in the shares of each dwelling type that correspond with prevailing economic conditions. For example, during the period (a time of economic recession in Ottawa), townhouses accounted for 42% of new housing construction because they were more affordable types of homes. In the following period ( ), which corresponds to the high-tech boom, the proportion of single detached homes surged to 56%, an all-time record, on the strength of higher incomes and buoyant economic conditions, in combination with relatively low house prices following the mid-1990s economic slowdown. One trend clearly appears in the data, and that is the rising share of apartments regardless of the ups and downs of the wider economy. Another salient feature of Ottawa s housing market is the prominence of townhouses. Their share has increased in the most recent period, which nevertheless coincides with relative economic prosperity and stability. 2.3 Preferred scenario Scenario 1 would allow the City to stay within its current urban boundary, but supposes a greater shift in housing preferences than recent market history suggests might be reasonable to anticipate. Scenarios 2 and 3 represent both an incremental market shift and support for a policy direction that fulfills the City s planning objectives. The question is which of these scenarios best captures the likely demographic evolution of the city s population. The difference between the two is in the proportion of townhouses and apartments. In Scenario 2, the proportion of townhouses is closer to what recent market history has produced. In Scenario 3, the proportion of apartments is slightly higher than the proportion of townhouses and is about double the share achieved over the last 15 years.
10 Scenario 3 will be carried forward as the preferred scenario. It maintains ground-oriented dwellings (notably townhouses and single detached homes) as the largest component of Ottawa s new housing construction over the next 25 years, but anticipates a shift toward apartments. An important assumption of this Residential Land Strategy is that the next 25 years will be different than the past 25 years in terms of people s choice of where to live. A shift toward apartments and away from single detached dwellings is the most salient change anticipated. Much of this shift will be due to demographic-based market demand stemming from smaller households, an ageing population, the emergence of a viable market for urban lifestyles along with rising energy prices, and the desirability of the types of locations where new apartments are projected to be constructed (the Central Area, the Mainstreets, and near hubs of transit and employment activity). The City s investment in rail rapid transit over the projection period will solidify the desirability of many of these areas, which are also the focus of the intensification targets discussed in Section 3. The argument has been made that people generally wish to age in place and this means that seniors are expected (and often encouraged) to stay in their homes (typically single detached dwellings) until they need institutional care. Looking at today s senior-age cohort, this appears to be the case. However, these homes were built between the mid-1940s and the late 1960s, which means that they would typically be of significantly smaller sizes, and in locations that are more central, than the much larger single detached dwellings built over the last 30 years at more peripheral locations. Can seniors reasonably be expected to age in place in the future in 2,500 square-foot homes at similar rates to which they do today in 1,200 square-foot homes? Staff believe they will not, especially if there are homeownership options available to seniors in the form of condominium apartments at locations that are close to services and amenities. Scenario 3 anticipates a gradual shift in the share of each dwelling type over the projection period, as detailed in Figure 7: Figure 7 Share of new dwelling units by type, , Scenario 3 Single Semi Row Apt. TOTAL % 5% 29% 23% 100% % 5% 27% 27% 100% % 5% 27% 27% 100% % 5% 25% 31% 100% % 5% 25% 32% 100% % 5% 27% 28% 100% The forecast number of new dwellings for the projection period, on an annualized basis, is presented in Figure 8 Forecast number of new dwelling units by type, , Scenario 3 (annualized) Single Semi Row Apt. TOTAL , ,889 1,496 6, , ,651 1,681 6, , ,635 1,778 6, , ,428 1,743 5, , ,287 1,647 5,075 This scenario will be carried forward as the basis for the City s Residential Land Strategy.
11 2.4 Distribution between urban and rural areas A further defining element of the housing projection is the distribution of dwelling units between the urban and rural parts of the city. Since amalgamation, the rural area has averaged about 9% of all residential building permits issued by the City. This share is consistent with a longer series of historical data prior to amalgamation, gathered from Census data, which reveals that since 1971 the rural area has accounted for an average of 9.1% of Ottawa s household growth (Figure 10). The Residential Land Strategy proposes to use a 9% share of new dwellings to the rural area. The distribution of dwellings would therefore be as follows: Figure 9 Projected distribution of new dwellings between urban and rural areas to 2031 Period TOTAL units Urban Rural ,287 29,381 2, ,997 28,207 2, ,700 27,937 2, ,172 25,636 2, ,377 23,093 2,284 TOTAL 147, ,254 13,278 Within the rural area, dwellings are predominantly single detached. In some of the larger villages there are limited opportunities for denser forms of housing including townhouses and apartments; however the composition of rural housing is not projected to change significantly. Figure 10 The following assumption is applied to the assumption of rural dwellings to 2031: Figure 11
12 Rural dwelling types, 2006 to 2031 Dwelling type Share Units Single detached 94% 12,481 Semi-detached 1% 133 Townhouse 4% 531 Apartment 1% 133 TOTAL 100% 13,278 The balance of the city s housing requirements will be accommodated in the urban area (Figure 12). Figure 12 Urban dwelling type projection, 2006 to 2031 Dwelling type Share Units Single detached 35% 46,619 Semi-detached 5% 7,124 Townhouse 29% 38,915 Apartment 31% 41,595 TOTAL 100% 134,254 These projections are carried forward into Sections 3 and 4, which discuss intensification targets and greenfield development. 2.5 The Regional Market Area Ottawa s Regional Market Area includes the City of Gatineau, Ontario Municipalities Adjacent to Ottawa (OMATO) and Québec Municipalities Adjacent to Gatineau (QMAG). In Growth Projections for Ottawa, a projection of population, jobs and dwellings was prepared for the entire metropolitan area, summarized in Figure 13 below: Figure 13 Projection of population, jobs and households for the Regional Market Area Ottawa Gatineau OMATO QMAG TOTAL 2006 Population 870, , ,800 47,200 1,307,100 Households 345, ,000 52,100 18, ,900 Jobs 529, ,500 73,700 24, , Population 923, , ,700 49,900 1,385,000 Households 376, ,200 54,700 18, ,400 Jobs 580, ,800 78,700 26, , Population 1,031, , ,300 59,000 1,561,600 Households 437, ,800 66,000 22, ,500 Jobs 648, ,900 95,300 31, , Population 1,135, , ,600 68,600 1,733,800 Households 489, ,200 77,200 27, ,600 Jobs 703, , ,800 37,200 1,008,300 OMATO = Ontario Municipalities Adjacent to Ottawa QMAG = Québec Municipalities Adjacent to Gatineau * Removes institutionalized population

13 In the absence of formal planning mechanisms to prepare a Residential Land Strategy for the Regional Market Area, which encompasses two provinces and two sets of planning legislation, the City has established dialogues with Regional Market Area municipalities. Detailed projections were prepared in partnership with the Ville de Gatineau and comments were received from many of the other adjacent municipalities in Ontario and Québec. The City s projections for the Regional Market Area incorporate all input from other municipalities. The household projections presented in Figure 13 above were obtained by aggregating the dwelling occupancy rates for Ottawa, Gatineau, OMATO and QMAG municipalities, then projecting how these might evolve taking into account the role fulfilled by each of these four components within the Regional Market Area. Figure 14 Ottawa s Regional Market Area comprises 32 municipalities in Ontario and Québec with a combined population of over 1.3 million in Ottawa and Gatineau, as the mature central cities, are in a more advanced state of urbanization, have the most diverse housing stock (with differences between them), and have smaller households. The average household size is projected to continue getting smaller as a result of a higher concentration of singleperson, senior, and non-family households in these two urban centres. OMATO has 14 municipalities, many of which are closely tied to the Ottawa-Gatineau labour market. Over 40% of the employed labour force in half the OMATO municipalities, and between 20% and 40% in the other half, works in Ottawa-Gatineau. This integration is confirmed by the existence of eight regional transit systems that operate lines into Ottawa. Several Ottawa-based homebuilders are active in OMATO municipalities. As a result, several OMATO municipalities exhibit dwelling occupancy rates that reflect a more suburban role for these communities, in addition to their traditional rural profile. It is projected that this role will continue to grow and as a result, average household sizes are projected to increase in OMATO to QMAG has 16 municipalities. The seven largest ones are immediately adjacent to Gatineau (forming the MRC Les-Collines-de-l Outaouais) and have a very high degree of integration with the Ottawa-Gatineau labour market: 67% of the employed labour force residing in the municipalities of Les-Collines work in one of the two central cities. The nine other QMAG municipalities are much smaller in population and still
14 exhibit rural demographic characteristics, including average household sizes higher than Gatineau s but falling, reflecting youth migration to the cities. However, because of their adjacency and position on the highway network, residential development aimed at commuters is beginning to take place in all of them. As a result, the percentage of employed labour force working in Ottawa or Gatineau and residing in those outer municipalities ranges from 30% to 70%. It is projected that the suburban role of QMAG municipalities will continue to grow, but at a slower pace than OMATO s since this evolution is at an earlier stage than OMATO s. As a result, it is projected that the average household size in QMAG will continue to be significantly higher than Gatineau s, but will gradually become smaller to reflect a continuing net out-migration from the more rural areas. The projection of dwellings by type, given the demographic composition and metropolitan role of each of the four large components of the Regional Market Area (Ottawa, Gatineau, OMATO and QMAG), anticipates that the overall share of single detached dwellings will decrease to varying degrees. For Ottawa the assumptions are discussed in Section 2.3 above. For Gatineau, as a mature urban centre, a projection similar to Ottawa s is proposed but with the share of single detached homes starting at a higher point, reflecting that city s housing stock and current housing market. Townhouses are not as present in Gatineau s housing market as they are in Ottawa s; it is anticipated that their share will rise. Apartments already make up a significant share of the housing market in Gatineau, and this is projected to accelerate. In OMATO the majority of the housing stock and current market is comprised of single detached homes. This is not projected to change significantly, but a slightly higher share of townhouses is anticipated in response to a diversifying housing market in those municipalities. The share of apartments will remain low throughout the projection period. In QMAG, no significant changes are projected in the housing market. Single detached homes will continue to predominate. The projected share of new dwellings by type appears in Figure 15 below: Figure 15 Projected share of new dwellings by type, Single Semi Town Apt. TOTAL Ottawa % 5% 29% 23% 100% % 5% 27% 27% 100% % 5% 27% 29% 100% % 5% 25% 31% 100% % 5% 25% 32% 100% Gatineau % 13% 3% 28% 100% % 12% 5% 29% 100% % 11% 7% 30% 100% % 10% 8% 32% 100% % 10% 10% 34% 100% OMATO % 4% 6% 2% 100% % 4% 7% 2% 100% % 4% 8% 2% 100% % 3% 9% 3% 100% % 3% 9% 4% 100% QMAG % 1% 0% 0% 100% % 1% 0% 0% 100% % 1% 1% 1% 100% % 1% 2% 2% 100% % 1% 3% 2% 100%
15 On an annualized basis, the projected number of housing starts by dwelling type would be as follows: Figure 16 Projected housing starts by dwelling type, Regional Market Area (annualized) Single Semi Town Apt. TOTAL Ottawa , ,889 1,496 6, , ,651 1,681 6, , ,635 1,778 6, , ,428 1,743 5, , ,287 1,647 5,075 Gatineau , , , , ,094 OMATO , , , , , ,112 QMAG TOTAL , ,969 1,870 8,635 Regional , ,795 2,080 9,001 Market , ,827 2,195 9,048 Area , ,643 2,185 8, , ,510 2,072 7,754 NOTE: The institutionalized population has not been factored out of the projections for Gatineau, OMATO and QMAG. Under this projection, Ottawa s share of total housing will increase slightly, from 66.7% in 2006 to 67.4% in 2031, because of smaller average household sizes. Gatineau s share will decrease from 19.7% to 18.2%. OMATO s and QMAG s shares will rise, from 10.1% to 10.6% and from 3.5% to 3.7% respectively. Figure 17 summarizes the share of Regional Market Area total dwellings projected for each of the four major components: Figure 17 Projected share of total dwellings, Regional Market Area Ottawa 66.7% 67.4% 67.5% 67.6% 67.5% 67.4% Gatineau 19.7% 19.4% 19.0% 18.7% 18.5% 18.2% OMATO 10.1% 9.8% 10.0% 10.2% 10.4% 10.6% QMAG 3.5% 3.4% 3.4% 3.5% 3.6% 3.7% TOTAL 100% 100% 100% 100% 100% 100%
16 OMATO and QMAG will have an increasing share of the new single detached dwellings built in the Regional Market Area to Ottawa and Gatineau, while retaining a range of dwelling type choices, will have a greater focus of higher density forms of housing. The share of new dwellings by type across the Regional Market Area will be as outlined in the following figure: Figure 18 Projected share of new dwellings by type, Regional Market Area Single Semi Town Apt % 6% 23% 22% % 6% 20% 23% % 5% 20% 24% % 5% 19% 26% % 5% 19% 27% The projection shows that there will remain sufficient choice across the Regional Market Area for all types of dwellings including single detached homes throughout the projection period. Overall, only a very slight downward shift in the share of single detached is anticipated across the Regional Market Area, and an increase in the share of apartments primarily focused on Ottawa and Gatineau. The assumptions behind this projection comply with PPS policies 1.4.3(c) and (d). Planning for denser forms of housing in the two central cities of Ottawa and Gatineau establishes the correct match between the amount and density of new housing and appropriate levels of infrastructure and public service facilities, promotes densities for new housing that efficiently use land, resources, infrastructure and public service facilities, and supports the use of alternative transportation modes and public transit in areas where it exists or is to be developed. 3. Intensification and density targets 3.1 Background Why set a target for intensification As outlined in Section 1 of this report, the Official Plan, and predecessor Regional and Local Official Plans, have for some years encouraged intensification at specific locations including the Central Area, Mainstreets and Mixed-Use Centres, and generally inside the Greenbelt. Under the Provincial Policy Statement, municipalities in Ontario are required to establish and implement minimum targets for intensification and redevelopment Policy and monitoring requirements The PPS requires targets for intensification and redevelopment for the built-up area in general, and density targets for transit corridors [PPS policies , and 1.2.3]. These targets should be met before any expansion of the boundaries of settlement areas is permitted. Since settlement area boundaries are subject to comprehensive reviews, which are carried out every five years, the intensification and density targets will be monitored for performance over five-year periods, and annually as documentation and trend analysis. The city-wide intensification target will be monitored through the annual analysis of residential building permits that meet the definition of Residential Intensification in the PPS. Location-specific targets that will not form part of the OP (Central Area, Vicinity of Rapid Transit Stations, Mixed-Use Centres, Mainstreets and Town Centres) will also be monitored annually. The density targets for transit corridors, which will be analyzed in terms of people and jobs per gross hectare, will be monitored every five years (at each Census year), concurrently with the City s Employment Survey.
17 3.1.3 Recent Intensification Trends A minimum target for intensification should be based on an understanding of how much intensification has been taking place in recent years and express the City s objectives for the future. In the report Residential Intensification in Ottawa, , the City analysed all residential building permits and calculated the number of those that conformed to the Provincial definition of intensification. The period covered is mid-2001 to mid-2006, to correspond with the national Census. The report found that intensification accounted for 36% of all dwellings built in the urban area of Ottawa during the study period. Comparable records for the period 1998 to mid-2001 show that intensification then had a share of about 25% of urban dwellings. Intensification has therefore gathered momentum. Figure 18 summarizes the amount and share of new dwellings built through intensification during the study period. Figure 19 New residential dwelling units, mid-2001 to mid TOTAL Jul- Dec Jan-Jun Urban, 782 2,599 2,237 2,323 1,545 1,070 10,556 intensification Urban, nonintensification 1,688 4,492 3,716 4,417 3,006 1,647 18,966 Urban, TOTAL 2,470 7,091 5,953 6,740 4,551 2,717 29,522 Rural dwellings ,197 TOTAL Units, 2,755 7,835 6,711 7,388 5,092 2,938 32,719 City of Ottawa Intensification as % of urban units 32% 37% 38% 34% 34% 39% 36% Source: Residential Intensification in Ottawa, Publication # The report also detailed the types of dwelling built each year through intensification. Between mid-2001 and mid-2006, intensification accounted for 10% of all single detached homes built in Ottawa, 25% of all townhouses, 31% of all semi-detached homes and 87% of all apartments. Figure 20 Average annual number and share of intensification units by type, Single Semi Row Apt TOTAL Intensification ,300 2,111 Nonintensification 1, , ,793 TOTAL, Urban 2, ,025 1,494 5,904 Area % intensification 10% 31% 25% 87% 36% Of the dwellings built through intensification, the majority were apartments (including condominium, rental, additions, new construction, etc.). Figure 21 details the types of dwellings built through intensification between mid-2001 and mid-2006:
18 Figure 21 Residential intensification by dwelling type, mid-2001 to mid-2006 Dwelling type Units Share (%) Single detached 1, % Semi-detached % Townhouses 2, % Apartments 6, % Condominium apartments 3, % Condominium stacked % townhouses Retirement residences % Student residences % Other types of apartments 1, % TOTAL 10, % 3.2 City-wide intensification target Discussion In Section 1, the recommended scenario for the projection of housing requirements calls for 147,507 new dwellings in Ottawa by As detailed in Figure 10, 13,276 of those dwellings are intended to be built in the rural area. The balance, 134,231 dwellings, will be built in the urban area. Figure 22 below summarizes the breakdown of urban and rural dwellings by type projected to Figure 22 Projected dwellings by type, urban and rural areas, Dwelling type Urban Rural TOTAL Units % Units % Units % Single detached 46,619 35% 12,481 94% 59,101 40% Semi-detached 7,124 5% 133 1% 7,257 5% Townhouse 38,915 29% 531 4% 39,447 27% Apartment 41,595 31% 133 1% 41,728 28% TOTAL 134, % 13, % 147, % In setting a target, the City wishes to increase the share of intensification from recent levels. The reasons for this are as follows: The City has a multi-billion dollar rapid transit plan that involves the construction of a downtown Light Rail Transit (LRT) tunnel; the conversion of the east-west Bus Rapid Transit (BRT) Transitway to LRT between Blair and Baseline stations; the twin-tracking of the existing O-Train line, its extension to the airport and to Riverside South, and its conversion to LRT to provide high-order rapid transit along that corridor; and new BRT lines. For the City s transit investment to have a measurable impact on congestion and transportation efficiency, the City will require a much more urban form of development that will bring people and buildings, dwellings and jobs closer together, especially along the new rail rapid transit lines. The City also requires a more urban form of development to improve cost efficiency in terms of infrastructure construction and maintenance and service delivery. The City wishes to leverage the market s interest in urban living to rejuvenate, revitalize and repopulate certain older areas of the city that would provide opportunities for more people to live in environments where walking, cycling and transit are viable alternatives to the car. At all public consultations led by the City for its 2003 Official Plan, and during the current Official Plan review, it has emerged from the public that there is a strong wish for a city that is compact, humanscaled, urban (in the sense of a city that is dense enough to be walkable, with basic services and
19 conveniences a walk away). Sensitive residential intensification increases the number of people living in a given neighbourhood, and therefore increases the local market that needs services, retail, schools and other amenities that can therefore be viably provided, thus reducing the need to drive. A compact and walkable city is also necessary to accommodate the future needs of an aging population that may less be able to drive. The City is mindful of its responsibility as Canada s capital and wishes to continue the repopulation of its downtown core and its surrounding neighbourhoods to improve Ottawa s image as a world city that is animated, vibrant, and a suitable reflection of Canada as an urban country. At the same time, the City is mindful of its responsibility toward the almost 90% of its territory that is not urbanized and wishes to be a good steward of its rural area by containing urban sprawl that consumes agricultural and other rural land. In summary, residential intensification is a key component of the City s residential land strategy because: It is required by Provincial policy; It is needed to support the rapid transit plan; It is the kind of city we want; It repopulates and rejuvenates older, walkable areas of the city; It is supportive of an aging population; It contributes to the symbolism that the capital city conveys to the world about Canada; It lessens the impact on rural resource areas. It is proposed that an overall minimum intensification target of 40% of new urban dwellings be set for the projection period to This translates to 53,700 dwelling units over the projection period Phasing-in the target To successfully implement an intensification target, the City will need to examine its various frameworks and by-laws to ensure that the intensification it seeks is or will be permitted and encouraged by the Corporation s various branches and approvals processes. To account for this examination and the time it will take to make appropriate adjustments, the intensification target is proposed to be phased in gradually as follows: : 36% : 40% : 44% It is anticipated that the majority of intensification will be in the form of apartments, as evidenced by the activity monitored between mid-2001 and mid However, there will remain opportunities for intensification with ground-oriented dwellings including single detached and semi-detached homes. In the forecast, however, a diminishing number of opportunities for lower-density housing is anticipated as the amount of vacant land within the built-up area available for intensification decreases, and more of the potential for intensification is found through redevelopment. Overall, the intensification target of 53,690 dwelling units is broken down as follows: Figure 23 Projected residential intensification by dwelling type, Dwelling type Units Share Single detached 3,225 6% Semi-detached 2,150 4% Row 10,200 19% Apartment 38,125 71% TOTAL 53, %
20 To provide for a smoother phasing of the intensification target and to account for the gradually diminishing opportunities for ground-oriented intensification, it is expected that the dwelling mix within the intensification target will evolve, as outlined in Figure 24: Figure 24 Projected evolution of residential intensification, Single Semi Row Apt % 8% 26% 56% % 3% 20% 70% % 3% 17% 75% % 3% 17% 75% % 3% 16% 78% (TOTALs may not add due to rounding) Intensification Potential In the 2004 report Where Will We Live? Housing Potential in Ottawa, the City calculated total residential potential for the OP s intensification target areas based on a series of assumptions that were meant to be illustrative of a possible urban form, subject to neighbourhood-specific refinements. In that report, no time lines or phasing were provided. The homebuilding industry criticized the study for its lack of phasing considerations, market acceptability of some of the identified areas, and questionable qualification of certain parcels of land. Building on the work of that study and on the industry s input, the City considers the methodology used to identify locations and development potential to remain essentially sound. The necessary next step to be applied to such an exercise is to differentiate the areas targeted for intensification by time of likely development (phasing) and to apply an extra level of scrutiny to the selection of candidate lands. The City carried out this work as part of the preparation of intensification targets. Accounting for new projects developed since the Where Will We Live report and some of the more detailed work undertaken for certain recent Community Design Plans, the total residential potential for the intensification target designations as of mid-2008 is estimated as follows: Figure 25 Estimated TOTAL residential potential, Target areas, mid-2008 OP Designation Units Central Area 7,000 Traditional Mainstreets 20,425 Arterial Mainstreets 72,725 Mixed-Use Centres 22,050 TOTAL 122,200 The entire potential will not be realized within the projection period, as it is more than double the intensification target of 40% of urban dwellings by The questions then become: Which of these target areas ought to be priorities for the OP targets?, How can the overall target number of units be distributed among the designations?, and What phasing can be applied to the projected targets based on market considerations and the timing of municipal services and infrastructure upgrades, if relevant? Target locations for intensification The Official Plan directs residential intensification to the following designations: Central Area; Mainstreets; Mixed-Use Centres; Town Centres; Enterprise Areas. It also directs intensification to within 600 metres of rapid transit stations.
21 During the period mid-2001 to mid-2006 those target areas accounted for 20% of the new dwellings in the urban area of Ottawa, or 56% of the total intensification activity. Figure 26 lists the number of dwelling units built in each of the target areas, and each target area s share. Figure 26 Intensification dwellings and share by OP target areas, mid-2001 to mid-2006 OP Target Area Units Share Vicinity of rapid transit stations (600 m) 2,091 35% Central Area 2,077 35% Mainstreets 1,393 23% Town Centres % Mixed-Use Centres % Enterprise Areas 103 2% TOTAL, target areas 5,943* * TOTAL Intensification 10,556 TOTAL Urban dwellings 29,522 Target areas as % of intensification 56.3% Target areas as % of urban dwellings 20.1% * TOTAL removes double counting of units that fall within more than one of the target areas. Therefore, the summed share of all target areas adds to more than 100%. From these data it appears that the rapid transit network, the Central Area and the Mainstreets are the focus of most of the intensification activity within the OP s target areas. It also appears that there are significant intensification opportunities beyond these target areas, since 44% of the city s intensification during the 5-year monitoring period took place outside of the target areas. The proposed Transportation Master Plan (TMP), which includes the 2031 Primary Rapid Transit Network (Appendix 4), provides a reconfirmed focus for intensification and becomes a greater determinant in the setting of intensification targets. The Central Area, where the LRT will be underground, as well as the Mainstreets and Mixed-Use Centres that are on or close to the new rail transit lines, will have priority in the setting of targets. Town Centres will be addressed in this section because Council has instructed staff to prepare a strategy that involves suburban density targets that will one day justify LRT extensions beyond the Greenbelt. The three suburban Town Centres will form a key part of such a strategy. Enterprise Areas will be removed from the list of target areas for intensification. The original intent of this designation was to achieve a more efficient use of land in business parks by permitting medium- and high-density residential uses integrated with employment uses. Following Official Plan Amendment 28, the number of Enterprise Areas has been significantly reduced and the remaining ones will now be subject to minimum density targets if they comprise greenfield lands. 3.3 The Rapid Transit Network Description of target locations The Rapid Transit Network forms the first basis for the intensification targets. LRT, as a higher order form of transit than BRT, will incite more people to use the transit system for work and other trips. The underground LRT in the downtown core will allow commuters to wait for their train in a weather-protected station. The underground LRT downtown will also lessen the need for commuter automobile parking, and the City will encourage the disappearance of downtown surface parking lots to entice more people into using the LRT network. In every major city that has rail-based rapid transit, residential locations close to stations are highly sought after and desirable. From the prestige of residing close to the more central stations, to the
22 convenience and comparable affordability of living close to the more distant stations, the mobility that is offered by a rail-based transit system attracts a substantive interest that is visible in the housing market. A map of the Primary Rapid Transit Network to 2031 adopted by Council appears at Appendix 4. The Central Area, as well as the Mixed-Use Centres and Traditional Mainstreets that are on or near the rail rapid transit network, are therefore in the first order of priority for intensification. This includes: The Central Area (downtown) Designated Key Transfer Stations at Blair, Hurdman, Baseline (Lincoln Fields is a special case, discussed separately) Tunney s Pasture and Carling-Bayview Mixed-Use Centres Lees, Industrial, and Cyrville Mixed-Use Centres Blair-174 Mixed-Use Centre Confederation Heights Mixed-Use Centre Carling Avenue Arterial Mainstreet These correspond to the following rapid transit stations (OP designations in brackets): LRT network: Future LRT underground stations, to be determined but possibly at: Rideau Centre, Metcalfe/O Connor, Kent/Lyon (Central Area) Future LRT-BRT Key Transfer Stations within major mixed-use nodes: Baseline, Blair (Mixed-Use Centre) Future LRT-BRT Key Transfer Station in an under-developed area: Hurdman (Mixed-Use Centre) Future LRT-BRT Key Transfer Station along an Arterial Mainstreet: Lincoln Fields (Arterial Mainstreet; Major Open Space) Future LRT stations within major mixed-use nodes: Tunney s Pasture, Cyrville, Carling, Confederation (Mixed-Use Centre) Future LRT stations within other types of major destinations: Train (Mixed-Use Centre), St. Laurent, Carleton, Greenboro, South Keys (General Urban), Airport Future LRT stations in urban neighbourhoods within Mixed-Use Centre or Central Area designations: Bayview, Campus, Gladstone (future), Somerset (future), Lebreton, Lees Future LRT stations in urban neighbourhoods on or near a Traditional Mainstreet: Westboro, Dominion (General Urban) Future LRT station in suburban neighbourhoods: Iris (General Urban) BRT network: BRT stations within employment nodes: Billings Bridge, Heron (Mixed-Use Centre) BRT stations at suburban Town Centres: Place d Orléans, Shenkman Centre (future), Barrhaven Centre, Terry Fox (Town Centre) BRT stations near employment nodes: Moodie, Eagleson, Kanata North, Montreal-Canotek, Trim (General Urban) BRT stations in suburban neighbourhoods: Hazeldean, Bayshore, Fallowfield, Strandherd, Jeanned Arc, Lycée Claudel, Smyth, Riverside, Pleasant Park (General Urban) BRT stations within other types of destinations: Walkley, Millennium (General Urban) Of these locations, some are readier to be immediately embraced by the housing market as desirable places to live: the Central Area, and the West Wellington, Richmond, and Preston Traditional Mainstreets which are within or near Mixed-Use Centres served by the proposed LRT network. At those locations it is reasonable to expect that a short-term target can be realized. In the case of the broader Carling-Bayview Mixed-Use Centre, its more peripheral parts (including the vicinity of Bayview Station) will require public realm improvements before the housing market moves toward it. Other areas require new anchor developments and/or public realm enhancements to reach a similar degree of market readiness: Baseline-Woodroffe and Tunney s Pasture Mixed-Use Centres.
23 In the case of Baseline-Woodroffe, the upcoming new buildings by Algonquin College, the new City Archives project, the infrastructure investment in road work as well as the new transfer station between LRT and the BRT line to Barrhaven, make this a suitable location to expect the attainment of short- and medium-term targets. Already there is residential development activity along Centrepointe Drive, and Algonquin College is a major source of demand for housing. However, the very large size of this Mixed- Use Centre will mean it will take more time to reach a target of 200. It is therefore listed as a beyond-2031 target. Tunney s Pasture Mixed-Use Centre encompasses more than the federally owned office campus of that name. It takes in the Quad area bounded by Scott Street, Holland Avenue, West Wellington Street and Parkdale Avenue. The City sees a long-term potential for intensification on the federal lands at Tunney s Pasture and above the current Transitway s right-of-way through air-rights development. In the more immediate future, the Quad area is located within one of Ottawa s currently most sought-after urban neighbourhoods and represents a viable short-term location for intensification targets. Holland Avenue in particular, and Parkdale Avenue to a lesser extent, are natural pedestrian links between the West Wellington Mainstreet and Tunney s Pasture station, which is slated to be part of the LRT network. The Lees, Hurdman and Industrial Mixed-Use Centres present environmental and public realm challenges that make them longer-term propositions. Still, the Lees Mixed-Use Centre (Ottawa s smallest) already has a significant number of dwellings, and the University of Ottawa has expanded its campus into the area between Lees Station and the Rideau River. Subject to any environmental constraints that may exist at this Mixed-Use Centre, it can be considered a possible short- to mid-term target. Hurdman station will become a Key Transfer Station between the north-south BRT and the east-west LRT. At present, there is peripheral residential development clustered to the southeast of the intersection between these two transit lines, and along Riverside Drive. The lands that immediately surround the station are vacant. Given the conversion of the east-west BRT to LRT and the proximity of this station to downtown, it is possible that some development may occur here through market forces alone during the projection period. The City must act as a proponent of development, and coordinate stakeholders, around the station lands to kick-start the process. However, land ownership and environmental challenges make this station a longer-term target. The Blair-174 Mixed-Use Centre is essentially suburban in form. It is primarily comprised of office and retail uses. It is, however, designated as a Key Transfer Station (it will receive the eastern transfer station between the east-west LRT line and the BRT line to Orléans). Residential opportunities could therefore become feasible in the mid-term, once the rail transit system is in place. The development of a condominium community at the nearby Cyrville Station, which will also be part of the LRT network, is presently underway, at a location with comparable suburban attributes. For Blair-174, however, to achieve the proposed density target to sustain rail rapid transit (see next section), the City will have to act as a proponent of development, and coordinate stakeholders, around the station lands to kick-start the process. Confederation Heights will be another Key Transfer Station between north-south LRT and BRT lines and is already a significant employment hub. Under current projections, its density will approach but not reach the target 200 by Federal land ownership also introduces extra uncertainty about the timing of possible reurbanization efforts here. It will be listed as a post-2031 target. As for Lincoln Fields, the current Transitway station is within a Major Open Space designation that corresponds to the Ottawa River Parkway corridor, owned by the National Capital Commission. Carling Avenue, which intersects this corridor at Lincoln Fields station, is designated an Arterial Mainstreet and is itself a Supplementary Transit Corridor in the proposed Transportation Master Plan. Intensification at this station will be challenged by the fact that the Ottawa River Parkway corridor is 400 metres wide along the northern frontage of Carling Avenue and 200 metres wide along the southern frontage. Unless the station lands along Carling Avenue are made available for development, adjacency to the station will not be achievable. The potential for intensification within 600 metres will be accordingly reduced.
24 3.3.2 Minimum densities to sustain transit In addition to intensification targets, the PPS also requires minimum density targets along transit corridors. Density targets are proposed for the vicinity of rapid transit stations that correspond to Mixed- Use Centres and suburban Town Centres. However, Provincial Policy also states that minimum density targets must be established for transit corridors in general, which may include all Transit Priority Corridors as designated in the proposed TMP. Of primary concern to the City is to achieve higher employment and residential densities at and around the rapid transit stations that serve Mixed-Use Centres along the planned LRT lines, and suburban town centres at existing and planned BRT lines. The Provincial Government, in its 2006 Growth Plan for the Greater Golden Horseshoe (Growth Plan), established a benchmark for density targets at Urban Growth Centres, and set out a hierarchy of Growth Centres to which a different density target applies. The density targets are expressed in people and jobs per net hectare. Although the Growth Plan does not apply to the Greater Ottawa Area, the density targets and hierarchy of growth centres approach can be applied to Mixed-Use Centres. The Ministry of Municipal Affairs and Housing (MMAH) referred the City of Ottawa to a recent study by IBI Group that deals with transit in the Greater Toronto Area and Hamilton (GTAH). That report suggests that urban densities listed in Figure 27 are considered minimums for various levels of transit service. The report also establishes the importance of the link between transit and land use: A key principle is that compact, mixed-use urban development supports good transit service, which, in turn, serves and makes possible the compact urban form in a true symbiotic relationship. Figure 27 Transit service potential based on urban density Density range* Transit potential Type of service Under 20 Low No public transit. Requires dial-up cabs, jitneys, etc Modest Marginal public transit. Buses every half-hour. Rush hour express buses Good Good bus service Very good Excellent bus service. Possible BRT/LRT BRT/LRT Higher order transit Over 200 Subway Higher order transit * Density is expressed as People and Jobs per Gross Hectare. Source: IBI Group: Transportation Trends and Outlooks for the Greater Toronto Area and Hamilton Needs and Opportunities, January 29, 2007 Using data from the 2006 Employment Survey and the 2006 Census, current densities in the Central Area and at Mixed-Use Centres are as follows:
25 Figure 28 Employment and dwelling densities at Mixed-Use Centres, 2006 Area (ha) Jobs (2006) Pop. (2006) DENSITY* Central Area ,710 8, Tunney s-quad ,873 2, Lees , Bayview-Preston ,916 2, Billings Bridge , Blair-Hwy , Baseline ,897 5, Woodroffe Confederation , Heights Hurdman , Cyrville , Industrial ,120 1, Kanata West , Mer Bleue (Undeveloped) (Undeveloped) 0 * Density is expressed as People and Jobs per Gross Hectare. Density targets are applied to the Central Area and Mixed-Use Centres according to a hierarchy. The highest density target is assigned to the Central Area, which is the metropolitan employment hub and its symbolic heart. It is also the hub of the rapid transit system and will have underground LRT stations. The target for the Central Area is set at 500 people and jobs per gross hectare. Major Mixed-Use Centres are those that already have high employment and residential densities, are in mature urban areas close to downtown and are served by planned LRT stations. They receive the second highest density targets, 250 people and jobs per gross hectare. It is the City s objective to focus a significant amount of employment and residential growth at and around these stations. Their location and maturity justifies that they be treated immediately as fully urban nodes that function first and foremost as transit-based pedestrian areas. Mixed-Use Centres at Key Transfer Stations between LRT and BRT receive the third tier of density targets, 200 people and jobs per gross hectare. The target is set high despite existing densities that, in some cases, are well below. The intent of this target is to focus the City s effort on the scale of redevelopment that must take place at these locations to reach densities that will sustain higher order transit. Emerging Mixed-Use Centres receive the fourth tier of density targets, 120 people and jobs per gross hectare. The City s objective, for these low-density Mixed-Use Centres, is to direct future development to achieve densities that will be consistent with rail rapid transit service. In Mixed-Use Centres where there are no dwellings or very few, the target should be read as encouraging more residential development. In cases where there are few jobs, the target should be read as encouraging more employment. The following are the density targets proposed for the Central Area and Mixed-Use Centres. These targets are at or above the benchmarks required to sustain higher-order transit, and recognize that target densities will be reached post-2031 in some cases.
26 Figure Density targets for the Central Area and Mixed-Use Centres Area Target Density* At 2031 Post-2031 Central Area 500 Major Mixed-Use Centres 250 (MUC) Tunney s - Quad 250 Lees 250 MUC at Key Transfer Stations 200 Bayview-Preston 200 Blair Confederation Heights 200 Baseline-Woodroffe 200 Hurdman 200 Emerging MUC 120 Billings Bridge 120 Cyrville 120 Industrial 120 Kanata West 120 Mer Bleue 120 * Density is expressed as People and Jobs per Gross Hectare. It is proposed that all future Community Design Plans provide for these densities as a minimum. Zoning by-laws should be examined and amended if required to permit these densities as of right. In order to achieve these densities, Figure 30 sets out projections of jobs and population to It is to be noted that in some cases, these projections do not achieve the target densities by 2031 and intensification at those locations will be an ongoing long-term planning goal post In all cases, however, the projections yield densities that correspond to the Very Good benchmark of transit support.
27 Figure 30 Projected population and employment for the Central Area and Mixed-Use Centres, 2031 Area New New jobs TOTAL TOTAL 2031 TARGET* dwellings Jobs Population Density* Central Area 7,850 22, ,250 19, Lees ,000 3, Tunney s- 1,325 2,042 17,915 4, Quad Bayview- 2,500 2,036 10,952 6, Preston Blair-174 1,250 3,650 10,061 2, Confederation 950 3,589 7,271 1, Heights Baseline- 1,000 1,333 9,230 7, Woodroffe Hurdman 1, , Billings Bridge ,600 1, Cyrville 1, ,912 3, Kanata West 2,424 12,774 15,120 6, Mer Bleue 800 8,000 8,000 1, Industrial 500 1,067 5,187 2, * Density is expressed as People and Jobs per Gross Hectare. In Confederation Heights, Blair-174, Hurdman and some parts of Tunney s-quad, given land ownership, the amount of development in the above Figure is unlikely to occur unless the City takes the lead in acting as a catalyst for development and in coordinating stakeholders to initiate the process Intensification targets The potential and the targets for Mixed-Use Centres and the vicinity of rapid transit stations is drawn from the Where Will We Live report, and further detailed by input from the homebuilding industry and by sitespecific planning exercises undertaken by the City. These targets will reside outside the Official Plan but will be part of technical documentation for infrastructure planning and the preparation of Community Design Plans. Figure 31 Targets for the Central Area (dwelling units) Short-term Mid-term Target Projection Long term TOTAL ( ) ( ) period (post-2031) Central Area 3,000 2,350 5,350 1,650 7,000 Lebreton 1,500 1,000 2,500 1,500 4,000 TOTAL 4,500 3,350 7,850 3,150 11,000
28 Figure 32 Targets for Mixed-Use Centres (dwelling units) Mixed-Use Short-term Mid-term Target Projection Long term TOTAL Centre ( ) ( ) period (post-2031) Bayview- 1,000 1,500 2,500 2,275 4,775 Preston Blair ,250 1,350 2,600 Cyrville , ,625 Tunney s-quad 325 1,000 1, ,300 Hurdman ,000 1,625 2,625 Industrial ,000 1,500 Baseline ,000 1,300 2,300 Woodroffe Confed ,000 1,950 Heights Lees ,250 Billings Bridge ,000 1,700 TOTAL 4,475 7,300 11,775 11,225 23,000 Kanata West* 1,400 1,024 2,424 Mer Bleue* * Kanata West and Mer Bleue Mixed-Use Centres are not considered Intensification, but have dwelling unit and density targets. It is proposed that the Official Plan permit high-rise buildings in the Central Area and Mixed-Use Centres to help achieve the targets. Community Design Plans will continue to be the basis for planning at a more detailed level for growth at specific locations, and an opportunity to assess community facility shortfalls and infrastructure capacity requirements. It is proposed that existing and future Community Design Plans and Zoning By-laws that apply to the Central Area and Mixed-Use Centres ensure that the minimum targets set out above can be accommodated as-of-right. There is intensification potential at other transit stations that are not within the Central Area or Mixed-Use Centres, but they will not receive a target because the City will focus its priority on the locations listed in the previous two Figures. Since the total intensification potential exceeds the 40% city-wide target (see Summary, Section 3.9), the City will focus its efforts on the most important locations along the rapid transit network. In subsequent phases (post-2031), intensification potential at other stations can be evaluated and targeted. 3.4 Mainstreets In the Official Plan, Mainstreets are identified in Section as offering some of the most significant opportunities in the city for intensification through more compact forms of development, a lively mix of uses and a pedestrian-friendly environment. The Plan also states The common feature of all Mainstreets is their function as a mixed-use corridor with the ability to provide a wide range of goods and services for neighbouring communities and beyond. It is the intent of this Plan to continue to focus on nodes and corridors (Mixed-Use Centres and Mainstreets) to support the public transit system, to create an essential community focus, to allow for minimum travel and to minimize disruption in existing stable neighbourhoods. The Official Plan designates two types of Mainstreets: Traditional Mainstreets, and Arterial Mainstreets.
29 3.4.1 Description of Traditional Mainstreets Traditional Mainstreets are the functional backbone of Ottawa s older areas. The transit system operates on each of them and, with the upcoming conversion of the majority of the Transitway to LRT, feeder bus lines linking Mainstreets with stations will take on a new importance. As is the case with Mixed-Use Centres, not all Traditional Mainstreets are at the same point of market readiness and acceptability. Traditional Mainstreets will all receive a target, but a differentiation must be made between short-, mid- and long-term targets. Recent trends in the housing market indicate the popularity and desirability of certain Traditional Mainstreets. Figure 33 lists the number of residential projects and dwelling units on or within one block of Traditional Mainstreets and in the Central Area since As the figure illustrates, Rideau and Bank Streets and both the east and west parts of the Central Area have been the focus of most of the projects, followed by the Richmond and West Wellington Mainstreets. In total, in the Central Area and on Traditional Mainstreets, 69 projects with 4,752 dwelling units were built or under construction, 12 projects with 984 units were approved, and a further 24 projects with 2,658 units were in the approvals pipeline. This adds to 105 projects and 8,394 units.
30 Figure 33 Projects and dwelling units in the Central Area and on Traditional Mainstreets, OP Designation Built or u/c* Approved Planned TOTAL Projects Units Projects Units Projects Units Projects Units Central Area East 16 1, ,777 (1) Bank TM ,139 Central Area West ,044 (2) Rideau TM Elgin TM Richmond TM West Wellington TM Somerset TM Scott TM Preston TM Main TM Dalhousie TM McArthur TM Bronson TM Montreal TM Gladstone TM TOTAL 69 4, , ,394 * u/c = Under Construction; TM = Traditional Mainstreet (1) Central Area East: As designated in Schedule B of the Official Plan, east of the Rideau Canal (mostly the ByWard Market area) (2) Central Area West: As designated in Schedule B of the Official Plan, west of the Rideau Canal (the financial and office district). The Traditional Mainstreets designation will have an overall target and phases. The technical analysis presented here outlines the potential number of units on each of the streets and a forecast phasing based on the convergence of municipal priorities (sustaining transit, improving the pedestrian environment, etc.), and market readiness, which affects the likelihood of attaining the target. The potential for each Traditional Mainstreet is drawn from the Where Will We Live report with changes based on input from the homebuilding industry and to account for projects built since the report was published. Figure 25 summarized the total potential of Traditional Mainstreets at 20,425 dwelling units. This total includes longer-term potential, which is defined as beyond the projection period to For the purposes of this analysis (Figure 35), the short term is defined as the period to 2021 and the mid-term as the period Intensification targets for Traditional Mainstreets The targets for Traditional Mainstreets were developed on the basis of the potential calculated by the WWWL methodology, which assumes five-storey buildings with four residential storeys as the norm for Traditional Mainstreets. However, the potential may be higher because taller buildings are appropriate on some Traditional Mainstreets. As is the case for transit system targets, the Traditional Mainstreet targets will reside outside the Official Plan but will be part of technical documentation for infrastructure planning and the preparation of Community Design Plans.
31 It is proposed that all future CDP s, or amendments to existing CDP s, and new zoning flowing from them, provide for no less than the minimum targets specified in Figure 34 below. Figure 34 Targets for Traditional Mainstreets (dwelling units) Traditional Short-term (to Mid-term 2031 Long term TOTAL Mainstreet 2021) ( ) TARGET (post-2031) Richmond 800 1,000 1,800 2,350 4,150 Bank 1, , ,725 West , ,000 Wellington Rideau , ,600 Beechwood ,200 Montreal ,000 1,750 Preston ,500 Bronson Main Somerset Gladstone Stittsville Main ,225 1,725 Scott ,400 1,800 Elgin McArthur ,400 1,800 Merivale ,100 Dalhousie King Edward TOTAL 6,000 6,450 12,450 10,975 23,425 It is proposed to update policies pertaining to Traditional Mainstreets by assigning a range of building storeys to each. This would fulfill a number of planning goals: It would provide a strong urban design framework within which to insert new buildings, with the aim to create a cohesive urban fabric that is suitable to each street. It would provide greater certainty about future urban form on each street for both the neighbourhood and the homebuilding industry. It would set the stage for a zoning regime that is more focused on urban form, and less on land use and performance standards. Specifically, Floor Space Index (FSI) requirements would be removed altogether from all Traditional Mainstreet zoning, and buildings would have to conform to a prescribed height, without exceeding or under-building. Hence, the total potential for Traditional Mainstreets may change pending a more street-specific set of assumptions based on building height. Consequently, the targets may also change. As they stand calculated, however, Traditional Mainstreets can realistically be expected to fulfill approximately 23% of the total intensification target, about 12,500 units to Description of Arterial Mainstreets Surrounding the older, more walkable areas of Ottawa is a vast inner belt of post-world War II neighbourhoods. Their location (now close to the city centre) and positioning on the rapid transit system mean that they will, or are starting to, experience a surge in value, and this in turn calls for a strategic approach to direct orderly intensification at the right locations in those areas, and gradually integrate them into the walkable sections of the city primarily through transit corridors, most of which are Arterial Mainstreets.
32 Arterial Mainstreets present the first order of potential to achieve a balance between intensifying the inner suburban areas outside the core while ensuring that the residential sections that abut them remain stable. Schedule D of the Official Plan illustrates the City s Rapid Transit Network. Many Arterial Mainstreets inside the Greenbelt, along with several other major arterials inside and outside the Greenbelt, are designated Supplementary Transit Corridors in the City s Transit Plan. Carling Avenue is proposed to receive rail-based transit. In general, Arterial Mainstreets as they are today are not ready to absorb large amounts of intensification. They are still too car-oriented, too suburban in form, too deficient in their public realm and therefore too far from market maturity to expect them to fulfill any significant short-term intensification target. However, there are sections of some Arterial Mainstreets that are suitable for residential intensification projects for site-specific reasons: they may be located adjacent to established and vibrant Traditional Mainstreets (e.g.: Carling Avenue near Preston Street and Bronson Avenue), they may be located near major places of employment (e.g. Montreal Road East); they may present a lot fabric that bring one or both of their frontages close to established residential areas (e.g. the west side of Merivale Road, the north side of Richmond Road west of the Ottawa River Parkway); or they may have site-specific redevelopment opportunities at locations where a residential component will be viable (e.g. Laurentian High School site at Baseline and Merivale Roads). In all cases, residential intensification along Arterial Mainstreets must take on the role of generator of a future urban fabric that is pedestrian-oriented and transit supportive. The City, in its planning for Arterial Mainstreets, should consider improvements to the public realm (wider sidewalks, shade trees, permitting on-street parking, road design options like slip roads for parking and local access to lessen the functional width of arterials for pedestrians, and converting bus lines to streetcars) before most of these streets can become urban avenues in their own right, and suitable residential locations for their entire length. Nevertheless, there is some intensification potential that may be reasonably anticipated in the short- and medium-term on Arterial Mainstreets Intensification targets for Arterial Mainstreets The targets for Arterial Mainstreets are drawn from the Where Will We Live report with changes based on input from the homebuilding industry and to account for projects built since the report was published. As is the case for the other targets, the Arterial Mainstreet targets will reside outside the Official Plan, but will be part of technical documentation for infrastructure planning and the preparation of Community Design Plans. It is proposed that all future CDP s, or amendments to existing CDP s, and new zoning flowing from them, provide for no less than the minimum targets specified in the Figure below. Figure 35 Targets for Arterial Mainstreets (dwelling units) Arterial Short-term Mid-term TARGET Long term TOTAL Mainstreet (to 2021) ( ) for 2031 (post-2031) Montreal 750 1,500 2,250 5,375 7,625 St. Joseph 400 1,600 2,000 8,700 10,700 Carling 500 1,000 1,500 8,600 10,100 Merivale ,000 9,500 10,500 Bank ,825 11,575 St. Laurent ,400 8,900 Robertson ,475 8,475 Hazeldean ,175 3,175 Richmond ,675 1,675 TOTAL 2,150 5,850 8,000 64,725 72,725
33 These targets were developed on the basis of the potential calculated by the WWWL methodology, which assumes eight-storey buildings with seven residential storeys as the norm for Arterial Mainstreets. However, the potential may be higher because taller buildings are appropriate on some Arterial Mainstreets. The greatest challenge for new development along Arterial Mainstreets is to initiate a more urban fabric at locations where the established context is largely suburban and car-oriented. Because new development will help set the stage for the evolution of Arterial Mainstreets as more genuinely urban avenues, particular attention should be placed on their relationship to the street, the location of parking and minimizing gaps between buildings along the sidewalk Density targets for Arterial Mainstreets The PPS states that municipalities should establish density targets along designated transit corridors, and this applies to Arterial Mainstreets. Figure 36 shows the existing density on Arterial Mainstreets. Richmond Road and Carling Avenue stand out as the Arterial mainstreets with the highest densities. In the Transportation Master Plan, Richmond Road will be near the east-west LRT line while Carling Avenue is designated a Supplementary Transit Corridor and is slated for a streetcar line in later phases of implementation of the city s rapid transit plan. Figure 36 Densities on Arterial Mainstreets, 2006 (people and jobs per gross hectare) Arterial Mainstreet Jobs Population Density Richmond 653 1, Carling 21,215 4, St. Laurent 8,927 2, Bank 9,692 1, Hazeldean 3, Robertson-Richmond 3, St. Joseph 3, Merivale-Clyde-Baseline 7,357 1, Montreal East 11,508 4, Innes 1, Eagleson Source: 2006 Census custom tabulation, Statistics Canada (population); City of Ottawa 2006 Employment Survey (jobs) A target density of 200 dwellings and jobs per hectare is proposed for Richmond and Carling Arterial Mainstreets. This target is based on an analysis of current densities and a level of density that supports higher order transit. In a more distant future (post-2031) it is possible that other Arterial Mainstreets inside the Greenbelt may receive light rail service in the form of streetcars on dedicated rights-of-way. To prepare those streets for eventual upgrades in transit service, a target density of 120 dwellings and jobs per hectare is proposed for St. Laurent, Bank, Montreal East and Merivale-Clyde Arterial Mainstreets. Combining the residential intensification targets for Arterial Mainstreets set out in Figure 35 and a projection of new jobs on those streets to 2031, resulting densities are shown in Figure 37.
34 Figure 37 Projected densities on Target Arterial Mainstreets, 2031 (people and jobs per gross hectare) Arterial Mainstreet New jobs New population Density Richmond (n. of Carling) Carling 1,655 2, St. Laurent 2, Bank 1,134 1, Merivale-Clyde 4,348 1, Montreal East 2,601 3, (The average number of persons per dwelling that produces the projected population for each Mainstreet, and the employment growth projection, are detailed in Appendix 8.) The decrease in density on Richmond Road is due to declining household size combined with few new jobs and no new dwellings projected by 2031 on this short stretch of the street. Carling Avenue will surpass the target density of 200 people and jobs per hectare, St. Laurent will get close, and the three other Arterial Mainstreets will remain a work in progress. It is proposed that each new development on the target Arterial Mainstreets be required to meet the target density, implemented in terms of dwellings and jobs per net hectare, to ensure that development takes the proper urban form and that progress is made with each new project toward the attainment of the target densities. (The conversion of density measures is outlined in Appendix 5). The achievement of target densities will be incremental and depends on individual development projects meeting or exceeding the targets. The City will require individual development applications, from site plans to rezonings and Official Plan Amendments, to comply with the minimum density target. However, the achievement of the ultimate density targets will not be tied to urban land reviews. It is not proposed to establish density targets for the other Arterial Mainstreets in order to focus on the ones that have the greatest possibility of achieving densities that will support higher order transit. 3.5 Town Centres Existing Densities The three suburban Town Centres (Orléans, Kanata, Barrhaven) are at different stages of their development. Orléans is the most mature. Recent investments by the City and private sector in cultural facilities, combined with residential infill and a new hotel, continue to consolidate the urban fabric of Orléans Town Centre. In Kanata, high-rise apartment buildings appeared at the turn of the 21st century and more are planned; there is a significant residential component made up of ground-oriented housing. The core of the Town Centre in Barrhaven is not yet constructed. The employment recorded at that location is in retail outlets at the northern fringe of the area designated Town Centre. Using data from the 2006 Employment Survey and the 2006 Census, current densities in Town Centres are shown in Figure 38. Figure 38 Employment and population densities at Town Centres, 2006 Area (ha) Jobs (2006) Pop. (2006) Density* Orléans TC , Kanata TC ,818 3, Barrhaven TC , * Density is expressed as People and Jobs per Gross Hectare.
35 3.5.2 Density Targets for Town Centres Development in Town Centres will be considered intensification under the PPS definition for the purposes of this Residential Land Strategy. It will count toward the City s 40% intensification target. In the Orléans and the Kanata Town Centres, certain land parcels that have remained undeveloped are now surrounded by development, which makes those lands fall under the PPS definition of vacant or underutilized lands within previously developed areas. The Barrhaven Town Centre is rapidly becoming surrounded by developed areas, even though the core of the Town Centre itself is yet to be developed. When residential development starts, this Town Centre will therefore also qualify under the same PPS definition. Because of their position on the rapid transit network, the Town Centres are part of the City s strategy to bring about compact mixed-use development at higher densities. The primary goal of this Residential Land Strategy is to increase population and employment density with targets in mind, so as to generate additional ridership for rapid transit. The density targets proposed for the suburban Town Centres are consistent with those of Emerging Mixed-Use Centres inside the Greenbelt. In all cases, it is anticipated that the amount of development during the projection period will not allow the three Town Centres to reach their target densities. Intensification will remain an ongoing planning goal post-2031 at these locations. Figure Projections for Town Centres Town Centre Area (ha) 2031 Jobs New dwellings 2031 Pop. Density* Orléans TC , , Kanata TC ,280 1,072 5, Barrhaven TC ,143 2,875 5, * Density is expressed as People and Jobs per Gross Hectare. The target density proposed for Town Centres is 120 people and jobs per gross hectare, the minimum threshold required to support higher-order transit including LRT. It is proposed that the Official Plan permit high-rise buildings in the Town Centres to help achieve the density targets. 3.6 Intensification outside the target areas One of the findings of the Residential Intensification report was that 44% of the residential intensification that occurred between mid-2001 and mid-2006 was not in the OP target areas. The report also highlighted the prominent role of lands sold by the Federal government and made available for development during that period. The supply of federal lands suitable for redevelopment, although still quite large, is subject to a number of political and other considerations that make their availability unpredictable. For example, the former CFB Rockcliffe has been slated for reurbanization since the mid-1990s but First Nations land claims have delayed the project. Other than potential Federal lands, the opportunities for intensification outside the target areas would fall in one of the following categories: Additions of dwellings to existing buildings Conversions of non-residential buildings to residential uses Infill by lot severance Infill on vacant lots Infill on vacant school sites Redevelopment
36 Data from the Residential Intensification report for the period of mid-2001 to mid-2006 tracked intensification under those categories. Figure 40 Residential intensification by category, mid-2001 to mid-2006 (dwelling units) Category Single Semi Row Apt. TOTAL Redevelopment Federal lands ,861 Commercial ,234 1,544 and office sites Residential replacements Closed schools Former industrial sites Former gas stations Sub-TOTAL ,628 2,847 5,277 Development on vacant or underutilized lots within previously developed areas Vacant lots ,092 2,873 Former parking ,064 1,140 & used car lots Enterprise Area Former Hydro right-of-way Sub-TOTAL ,156 4,174 Infill Infill by severance Infill on vacant school sites Sub-TOTAL Expansion or conversion of existing buildings Conversion* Addition Sub-TOTAL TOTAL 1, ,506 6,500 10,556 * Including new secondary dwelling units It is generally accepted that the opportunities on vacant lots may gradually diminish in the built-up area. It is also generally accepted that from time to time, unforeseen opportunities come up for which no forecast can be made. Examples include religious or school properties, utility sites, parcels created through rightof-way reconfigurations, unforeseen redevelopment sites, and other circumstances. The OP s intent with respect to established residential neighbourhoods outside the target areas is that they will remain stable without necessarily remaining static. This means that intensification will be supported where it is in scale and character with the surroundings, but the General Urban Area is not considered to be the main focus of intensification and is not a target area. The intent is not to transform established neighbourhoods, but to accommodate occasional opportunities that meet OP policies and are contextually integrated with their surroundings.
37 Scale and character refer to the height and positioning of buildings, and to urban design and architecture, but do not relate to types of dwellings or density measures. Greater varieties of dwelling types and increases in residential densities are not, by themselves, reasons to disqualify what can otherwise be good small-scale intensification Infill Infill by severance (382 units), on vacant lots (2,873 units) or on unused school sites (201 units) added 3,456 units between mid-2001 and mid-2006 (Figure 40), an average of 691 units per year. The number of vacant lot opportunities may gradually diminish, but the number of severance opportunities remains significant, given the amount of wide-lot development carried out in Ottawa especially in the decades after the Second World War. In the period to 2031, it is anticipated that infill activity will produce 3,225 single detached dwellings (an average of 129 per year), 1,850 semi-detached dwellings (74 per year) and 6,000 townhouses (240 per year). These averages will vary as the projection period advances to account for diminishing opportunities over time. Appendix 3 details the projection on an annual basis Secondary dwelling units Additions of secondary dwelling units to existing residences are difficult to count from building permits because many are done without one, leaving the City with no official record of the actual number of units created yearly. From building permit information, there were 231 apartments created legally in single detached homes or apartment buildings in the five years between mid-2001 and mid In 2004 the City legalized the creation of secondary apartments in all single- and semi-detached homes in all residential zones. It is therefore a reasonable expectation that there will be a sustained number of such types of units created throughout the projection period. It is anticipated that an average of 100 secondary apartments per year, to 2031, will be created Planned intensification outside the target areas There is an officially stated intent by Canada Lands Company (CLC) to redevelop CFB Rockcliffe for residential and employment uses. Preliminary concepts prepared prior to the latest interruption in this process called for approximately 6,000 housing units Unforeseen intensification This category is the most unpredictable and includes religious or school properties, utility sites, parcels created through right-of-way reconfigurations, which become available for residential development over time on a regular basis. Under this category it is assumed that there will be a total of approximately 6,000 units during the projection period to 2031, comprised of 300 single detached homes, 200 semi-detached homes, 4,000 townhouses and 1,500 apartments. The total number of intensification units anticipated outside the target areas is summarized in the following Figure:
38 Figure 41 Intensification potential outside the target areas, (dwelling units) Non-target area Short-term (to Mid-term ( ) TOTAL Projection period 2021) CFB Rockcliffe 0 6,000 6,000 Apts in houses 1,300 1,000 2,300 Infill singles 2, ,225 Infill semis 1, ,150 Infill towns 3,600 2,400 6,000 Unforeseen 3,600 2,400 6,000 TOTAL 12,350 13,325 25,675 The potential in Figure 41 is not a target. Some of it, however, is assumed to occur and is therefore included in this Residential Land Strategy as contributing to achieve the City s overall intensification target. The potential for CFB Rockcliffe constitutes a minimum target, but due to the ownership and legal status of the property, it is unknown at this time whether its redevelopment will proceed in the short- or mid-term. For the purpose of erring on the side of caution, the potential has been assigned to the later stages of the projection period. Intensification outside the target areas should be accommodated under urban design and building height requirements that protect and preserve neighbourhood character. Specifically, intensification outside the target areas should not detract from the target areas ability to be the focus of growth and intensification within the built-up area inside the Greenbelt. 3.7 Intensification and Affordable Housing Intensification targets can support the provision of affordable housing, which in turn meets the needs of the diversity of workers required across Ottawa, particularly in the designations targeted for residential intensification, the Central Area, Mainstreets, Mixed-Use Centres and Town Centres. Affordable housing supports growth management by promoting more pedestrian-oriented neighbourhoods and increased demand for good transit services. Intensification in the form of smaller units and/or apartments can lead to an increase in the affordability of housing. For example, increases in density can result in a lower land cost per unit. However, market demand can increase the cost of housing in areas undergoing intensification, particularly in desirable locations such as those close to transit stations. In addition to minimum intensification targets, it is proposed that all future Community Design Plans or amendments to CDP s provide targets that implement the Official Plan s affordable housing policy, including housing for lower income households. 3.8 Strategies to support intensification To successfully implement the City s intensification target, a series of strategies must be put in place to deal with administrative practices and a regulatory framework that may not have anticipated this type of direction for development. Through consultations with community groups and homebuilding industry representatives, the following matters have been identified as salient: Building height: Some communities are concerned about the impact of tall buildings that might not be properly integrated into their context. Industry representatives are concerned that height and density restrictions are too strict in favoured locations and thus reduce the viability of intensification projects. A clearer direction on the height profile of permitted buildings will be provided in the OP. In some cases this may mean taller buildings than are currently permitted; in other cases it may mean shorter ones. The fundamental principle is that the areas targeted for intensification by the OP are to be
39 considered appropriate for denser development and taller buildings in general, while the residential areas outside the targets are not to be considered appropriate for taller buildings, but rather, for small-scale intensification. Urban design: There is concern about the look of new buildings in established neighbourhoods. A sharper direction on urban design is therefore an important condition of success for intensification. The areas targeted for intensification should be made Design Priority Areas. Zoning: Aside from the issue of building height, it should be remembered that zoning was introduced to Ottawa in 1964 at a time when the goal of urban planning was to reduce urban densities and reinforce land use separation. Today the City s planning goals have changed, yet we retain a number of performance standards in our Zoning By-law that impede the achievement of intensification targets and transportation objectives. These must be investigated and amended as required. Zoning should immediately implement OP direction. The City should lead in rezoning target areas. Certainty: A common grievance by community groups is the lack of certainty as to whether the zoning in place accommodates the targeted amount of intensification, or whether rezonings should continue to be approved on the argument of accommodating intensification. While it is impossible for the City to provide absolute and permanent certainty, since cities are organic and evolve with time, it certainly should ensure the Zoning By-law accommodates the intensification targets (this could include upzoning as may be necessary). Once the City is satisfied that the zoning reflects its targets, arguments that rezoning is necessary to achieve those targets should no longer be accepted. Public education and quality communications are key conditions of success. Seminars, videos, and publications that explain intensification as part of a bigger picture, and that illustrate and celebrate successes, should be produced on an ongoing basis. The Committee of Adjustment should be given clearer direction on Council s policies about intensification and community compatibility. Servicing capacities: The City has to gain full knowledge of its piped infrastructure capacity limitations and prioritize upgrades based on this Residential Land Strategy and other criteria. Parking requirements: For new mixed-use buildings these requirements introduce an extra level of design complexity that demands separate entrances for residential and retail parking. To facilitate development forms that contribute to a walkable urban fabric, the City may wish to abandon parking requirements at certain locations and instead simply permit off-street parking, and let the market decide. This is especially relevant for new mixed-use buildings on Mainstreets that feature small retail spaces. Road widening requirements: Annex 1 Table 1 of the Official Plan contains minimum right-of-way width protections for streets that include many Traditional Mainstreets. There are provisions to grant exceptions for new development to proceed based on reduced or waived road protection setbacks, but these introduce a further level of process and uncertainty that could be eliminated if the City were to take a firmer position on whether such setbacks are truly expected to be fully realized. Hydro line setbacks: Recent increases to 5.m in the required setback of a building from a hydro line have a major impact on a building s volume. There remains a cost barrier and institutional unwillingness to bury hydro wires. However, if this new setback has the effect of sterilizing a significant amount of intensification potential, it must be addressed with the utilities. A long-term utilities strategy is needed to ensure that quality urban design, public realm and architecture, and density and intensification, are the overriding priorities. Seismic code requirements have significantly increased the cost of construction of multi-unit residential buildings. Other factors, including snow operations, waste removal requirements, encroachment fees, sign bylaws, visitor parking requirements, private approach by-laws and Canada Post requirements have been raised as not being fully prepared for urban-type development. This Residential Land Strategy proposes the creation of an Intensification Implementation Group led by the Planning Branch that will be tasked with coordinating all City departments and services practices, bylaws and administration to support intensification and compact, mixed-use development. The Group will also lead discussions with external stakeholders (including school boards and utilities) with a view to addressing technical, regulatory and design matters in a way that will allow the City s land strategy to be successful.
40 The Intensification Implementation Group should include senior representatives from the following branches in both the Infrastructure Services and Community Sustainability Department and the City Operations Department: Planning Branch (lead) Infrastructure Services Branch Water and Wastewater Services Branch Transit Services Branch OC Transpo Solid Waste Services Branch Housing Branch Parks and Recreation Branch Surface Operations Branch Traffic and Parking Operations Branch Real Property Assets Management Branch Fire Services Branch Fleet Services Branch 3.9 Intensification and Density Targets Summary Based on the analysis of potential and the City s priorities in directing its intensification targets, the 40% intensification target to 2031 is distributed as follows: Figure 42 Summary of Intensification and Density Targets Area Target Intensification City-wide target (40% of new urban dwellings) 53,700 Central Area (including LeBreton) 7,850 Mixed-Use Centres 11,775 Traditional Mainstreets 12,450 Arterial Mainstreets 8,000 Suburban Town Centres 4,500 Intensification outside target areas 25,675 Potential: 71,250 Density (People and Jobs per Gross Hectare) Central Area 500 Major Mixed-Use Centres 250 Target Arterial Mainstreets: Carling, Richmond St. Laurent, Bank, Merivale, Montreal East Mixed-Use Centres at Key Transfer Stations 200 Emerging Mixed-Use Centres 120 Town Centres 120 The sum of target numbers of dwelling units for the six intensification areas exceeds the 40% target of 53,690 by 17,560 dwellings. This allows for a great degree of flexibility, including ebbs and flows in the housing market, to reach the City s minimum target through development in several different areas and of different types.
41 4. Suburban and Greenfield Strategies 4.1 Housing requirements Following the projections set out in Figure 12, Ottawa needs the following number of greenfield dwellings: Figure 43 Greenfield dwelling type projection to 2031 Dwelling type Projected Urban Dwellings Intensification Greenfield TOTAL Single detached 3,222 43,397 46,619 Semi-detached 2,148 4,976 7,124 Townhouse 10,203 28,712 38,915 Apartment 38,128 3,467 41,595 TOTAL 53,702 80, ,254 Ottawa s best chance to contain urban sprawl and change the way it grows lies in its ability to urbanize greenfields differently. Intensification is an essential step in setting a course for the city s future, but over the projection period, reaching the 40% intensification target still means that 60% of new urban dwellings will be on greenfields. Provincial policy says that municipalities should adopt density targets and development standards that facilitate compact urban form on greenfields. The greatest challenges facing Ottawa s suburbs are that they are separated by the Greenbelt from the core of the urban area. Even if the outer greenfields are developed at higher densities and in compact, mixed-use forms, there will remain a large suburban fabric both outside and inside the Greenbelt separating any new neighbourhoods from the more walkable areas of the city. Therefore, it is not realistic to hope to achieve a completely walkable urban fabric across Ottawa s entire urban area. The area inside the Greenbelt can eventually be consolidated as such, but the suburban communities outside the Greenbelt will remain satellite communities for as long as there is a Greenbelt. In other words, there will remain for the foreseeable future large sections of the city that are car-dependent. Serving those areas with rail rapid transit will be a challenge. An intensification strategy that targets stations and corridors will be the logical place for those targets to generate high ridership. A longer-term challenge will be to densify the areas beyond rapid transit stations and to regenerate an urban fabric that will lend itself to support rail rapid transit. Taking a long-term view also means planning greenfields at densities that will allow them to sustain higher-order transit (including BRT) right away, so that over time, intensification at targeted locations in established areas outside the Greenbelt will yield sufficient densities and ridership to warrant rail rapid transit. In other words, by planning new suburban communities at transit-supportive densities, at build-out they will be at an appropriate level of density for rail rapid transit and will therefore not require extra intensification efforts to achieve those densities. 4.2 Description of suburban densities According to the 2007 Vacant Urban Residential Land Survey (VURLS), the average density of residential development has increased since 2001 (indicating a trend in today s market toward a greater acceptance of density), but in the specific case of single detached homes, average densities remain within a relatively invariable range. Figures 44 and 45 illustrate these findings.
42 Figure 44 Density of development on VURLS parcels, (units/net ha) Avg.* Single Semi Row Stacked n.a. n.a. n.a Apt TOTAL * Weighted 5-year average, , obtained by dividing the sum of units built by the sum of hectares developed. n.a. = not available. Figure 45 As Figure 45 shows, for the 25 years between 1983 and 2007 the density of single detached dwellings has largely remained between 19 and 21 units per net hectare. The overall density of VURLS residential development has mostly been in the range of 25 to 30 units per net hectare, only recently returning to levels above 30 as was observed in the early 1980s. 4.3 Minimum densities for greenfields The biggest consumer of suburban residential land is the single detached house, but that consumption could be lower. Ottawa s older neighbourhoods illustrate that detached homes can be built at higher densities and designed in such a way as to create a pedestrian-friendly environment. That means a different layout of streets, a different location for car parking, and a different location for private green space. Other municipalities in Ontario like Toronto and Markham have successfully implemented New Urbanism development standards to large new suburban subdivisions, showing that there are other viable and market-appropriate ways to develop suburbs. The Residential Land Strategy rests on an increase of suburban densities. In the Official Plan, residential development on lands designated Developing Communities were required to reach an overall minimum
43 net density of 29 units per net hectare. In the years that followed, several greenfield Community Design Plans were prepared for lands with this designation. In those plans, the most common approach in obtaining the target density has been to increase the number of townhouses, and add stacked townhouses, in the overall housing mix, but single detached homes continued to be planned at the densities observed for the past 25 years. Examples of such CDPs include Riverside South and Mer Bleue. As a result, without changing those CDPs to achieve higher densities for single detached dwellings, very large amounts of greenfield suburban land are now committed to low-density residential development that will not be sufficiently transit supportive to justify rail rapid transit, and will result in continued pressures to widen roads. It will likely also result in the need to add more lands to the urban boundary. Going forward, it is proposed that any future greenfield development, amendments to existing CDPs, and future CDPs, be required to comply with residential density targets that include a minimum net density of 26 units per hectare for single detached dwellings and an overall net density of 32 units per hectare (which implies densities of 34 units per hectare for semi-detached dwellings, 45 units per hectare for townhouses and 150 units per hectare for apartments, although these will not be specified as targets in the OP). These target densities are all higher than what has been observed in recent history, significantly so in the case of single detached homes. This is intentional. In setting these targets, the City seeks to accomplish a variety of objectives: Recognize that single detached homes remain the choice of a significant proportion of the population; Accommodate the market s wish for single detached homes in denser formats that make servicing them more cost-effective; Encourage New Urbanist subdivisions, to make new neighbourhoods more walkable and transitsupportive; Accommodate homes on less land, including single detached homes, to contribute to their affordability. Net residential densities of 26 units per hectare for single detached homes can be achieved in a variety of ways that will not unduly restrict choice in the market. Typical lot sizes of 15.2 x 30.5 m (50 x 100 feet) produce net residential densities of 21.5 units per hectare. Reducing the lot size to 12.6 x 30.5 m (41 x 100 ft), would produce a density of 26 units per net hectare. To obtain a variety of lot sizes, the following frontage and depth combinations also yield a net density of 26 units per hectare: Figure 46 Examples of lot sizes at 26 u/net ha for single detached dwellings Frontage Depth Lot Area m ft m ft m2 ha sq.ft , , , , , , , ,125 Net residential densities on greenfields will be measured on a subdivision-by-subdivision basis. While minimum densities and New Urbanism development standards can increase the affordability of housing, this is not automatic but rather determined by market demand. It is proposed that all future
44 CDPs or amendments to CDPs for Developing Communities incorporate Official Plan affordable housing targets, including housing for lower income households. 4.4 Other contributors to suburban density School sites It has been an ongoing concern for both the City and the homebuilding industry that School Boards are asking for increasingly large parcels of land for school sites. The City has also started requiring off-street loading areas for cars and buses in addition to off-street parking, and no longer entertains the combination of schoolyards with city parkland. All this is making schools significant consumers of land. School sites now introduce very significant discontinuities in the urban fabric of new communities, making their environment less hospitable to pedestrians, their buildings more disconnected and therefore requiring more driving, and pulling down the overall density of their neighbourhoods. This should change. School Boards should be asked to consider multi-storey buildings set closer to the street. They should be required to locate staff parking away from any street frontage. School bus drop-offs should be on the street. There should be wider sidewalks in front of school buildings. Requirements for sports fields and open space should be reviewed to reduce them and, where the opportunity exists, combining them with City park space should be required. The ultimate goals in pursuing these changes in school sites are: To integrate new school buildings into denser communities, making them viable walking destinations for the children they serve. To slow down traffic in front of them by moving school bus loading back to the street. To reduce the amount of land consumed by school sites in order to reach the density targets the City seeks to achieve in the suburbs Parks and Open Space The City s requirements for parks and open space may have to be revisited to ensure that the types of spaces required of developers at the plan of subdivision stage reflect the need for quality spaces of all sorts (active, passive, programmed, soft-surface and hard-surface) at the right locations, and of the right sizes. As much as possible, it is important to take on a greater number of smaller spaces for active parks at the right locations, than large residual spaces with no development potential whose fringe location and larger size will limit the space s use to passive, un-maintained and marginal green area. As much as possible, new directives should be implemented to combine large passive spaces with schoolyards, sports fields, or other land-extensive active and recreational uses, to minimize land consumption. The goals of a review of park and recreational land requirements should be: Quality over quantity of space should be the guiding principle. To adjust the amount of land taken on as parks and green space to thresholds that guarantee acceptable access to and amounts of green space without introducing excessive distances along streets, which become barriers to walkability and reinforce the need to drive within and between neighbourhoods; To combine passive uses with environmental conservation functions and/or school properties as much as possible; To provide active open green and hard-surface spaces that are at the appropriate locations and of the right sizes to be animated and become focal points for neighbourhoods; To achieve higher overall residential densities in new communities than in the suburban developments of the last sixty years.
45 4.5 Greenfield supply The City monitors its supply of greenfield residential land in an annual report titled Vacant Urban Residential Land Survey (VURLS), which has been in continuous publication since Based on VURLS data for the end of 2006, and including unit estimates for the Fernbank CDP, Ottawa s greenfields outside the Greenbelt had capacity for 97,195 dwelling units, summarized in Figure 47. Figure 47 Urban residential land supply outside the Greenbelt, December 2006 Single Semi Town STH* Apt. MX** TOTAL Kanata- 10, , ,391 6,954 30,332 Stittsville South 4, , ,320 5,817 27,564 Nepean Riverside 7, ,022 1,409 1, ,947 South Leitrim 2,319 1,001 1, ,151 Orléans 5, , ,339 2,226 16,200 Sub-total 29,680 2,354 28,103 3,379 18,364 15,314 97,195 TOTAL with MX** 35,806 3,120 35,760 4,145 18, ,195 * STH = Stacked Townhouses (classified as Apartments when not separated) ** MX = Mixed unit types, where there is no development application and no Community Design Plan. In the last line, the assumed split of MX units is 40% single detached, 5% semi-detached, 50% townhouses and 5% apartments. To bring the supply to the same starting point in time as the projection (mid-2006), the units built between July and December 2006 are subtracted from the demand: Figure 48 Adjusted residential demand, adjusting mid-2006 to end of 2006 Period Single Semi Row Apt TOTAL Demand 59,101 7,257 39,447 41, ,532 Built Jul-Dec 1, , , Adj. demand 57,891 7,060 38,345 40, ,211 From this adjusted demand, projected dwellings are apportioned as per Sections 2, 3 and 4 of this report, as shown in Figure 49. Figure 49 Distribution of adjusted residential demand, end of 2006 to 2031 TOTAL new units 144,211 Rural Units (9%) 12,979 Urban Units (91%) 131,232 Intensification (40% of urban units) 52,493 Greenfield (60% of urban units) 78,739 Single Semi Row Apt TOTAL Intensification 3,150 2,100 9,974 37,270 52,493 Greenfield 42,541 4,830 27,852 3,516 78,739 Rural 12, ,979 TOTAL 57,891 7,060 38,345 40, ,211
46 From Figures 47 and 49, the required supply of greenfield residential land, and the difference between the projected requirement and the inventoried supply, is as follows: Figure 50 Difference between greenfield land requirement and supply, December 2006 Dwelling type Projected Greenfield Dwellings Requirement Supply Difference Single detached 42,541 35,806-6,735 Semi-detached 4,830 3,120-1,710 Townhouse 27,852 35,760 7,908 Apartment 3,516 22,509 18,993 TOTAL 78,739 97,195 18,456 Apartments are not included in the calculation of greenfield land requirements because they account for the least amount of the demand for land, due to the relatively small number of projected units and their higher density. The main driver of suburban land demand is the single detached house. Applying the suburban density target of 26 units per net hectare for single detached dwellings and 34 units per net hectare for semi-detached, as set out in Section 4.3, the net land requirement for these unit types is approximately 310 net ha (Figure 51). There is a significant over-supply of land for townhouses and apartments, but most of the supply of townhouses is already committed in approved Community Design Plans and in plans of subdivision. Therefore in order to avoid creating areas comprised solely of single and semi-detached houses, provision is made in the land requirement for 40% of units to be townhouses and apartments. total net land requirements are shown in Figure 51. Figure 51 Net land requirement (ha) Dwelling type Units required Density (units/net ha) Net land requirement (ha) Single detached 6, Semi-detached 1, Townhouses 5, Apartments TOTAL 14, Assuming a net-to-gross ratio of 50%, the requirement for additional residential land adds to gross ha. 4.6 Strategies to support higher suburban densities By definition, many people perceive suburbs as places to escape from urban density. The most significant challenge in creating a denser form of suburban development is to capture the features that people value in suburban communities (privacy, peace and quiet, low-rise buildings, green space) and incorporate them within subdivision designs that will allow residents of the new communities to also function on foot and in a more urban manner, and the City to achieve higher efficiency in infrastructure and servicing. Internally, the City and its various departments must tackle a number of matters if this Residential Land Strategy is to succeed. The most important suggestions so far are listed below, and more may come up during the course of the work to be undertaken by the Intensification Implementation Group: A land efficiency-first mentality should guide the City s actions in all infrastructure and service delivery planning. It should generally be accepted that in the big picture, the most effective way to protect the environment is to not urbanize it. Therefore, land that is designated as urban should not be expected to act as an environmental preserve, it should be expected to act as urban and to have urban density, to allow a greater amount of land to be left unurbanized at the edge of the city.
47 Zoning should immediately implement OP direction. The City should lead in rezoning target areas. Financial incentives, including the Development Charges By-law, should be set up to reward density while recovering the appropriate amount of growth-related costs to support development. New retail development in the suburbs must adopt a more urban form. Pedestrian-friendly shopping areas will contribute to suburban densities, improve the look of new communities, and reduce car dependency. Specifically, all City departments should embrace the notion of compact development, narrower streets and roads, and rear lanes. Easements should be combined and piped infrastructure should be deployed so as to avoid easement creep that consumes more land and affects urban form and design. Cable, gas, hydro, telephone and other types of easements should be combined to reduce their land consumption through easement creep. Locating easements along rear lanes or under sidewalks should be considered. Snow operations should adapt to denser and more compact urban forms, and not the other way around. Whatever extra work and cost is required to plow and clear snow from better-looking streets should be invested for the greater good of the city. The Ottawa Fire Services should consider the acquisition of smaller vehicles that will allow them to operate efficiently on narrower streets. The City should anticipate that new streets will feature on-street parking. The unfettered flow and speed of traffic should no longer be the prime consideration for roadway planning; rather, streets and roads as public spaces that function for pedestrians first should be the new guiding principle. Setback requirements from creeks should be harmonized with Ministry of Natural Resources guidelines and reduced if warranted. The City should consider allowing residential lots to incorporate setbacks from creeks. The City should accept parkettes as part of the 5% parkland dedication. Parkland dedication should generally proceed on the basis of quality over quantity of space. The City should consider dual-zoning commercial and retail sites to allow a transition to urban forms of development without the need for a rezoning. It is proposed that the coordination of these strategies to support higher suburban densities be placed under the responsibility of the Intensification Implementation Group, the creation of which was proposed in Section Summary The Residential Land Strategy s primary goals are to be consistent with the Provincial Policy Statement and City Council s direction as outlined in Section 1 of this report. As such, it rests on the following key principles: Grow in, not out Set intensification targets that guide new residential construction toward more urban forms of development, while remaining reasonable from a market perspective. Set density and intensification targets at key stations and locations along the rapid transit network to support the City s transit investment and modal split objectives; Set intensification targets for Traditional and Arterial Mainstreets, to support, strengthen or set the stage for vibrant mainstreets through the older areas of the city; Set density targets for greenfields, and put in place the support mechanisms that will lead to the housing industry to choose pedestrian- and transit-supportive development patterns over the caroriented patterns of the last six decades; Set density and intensification targets for suburban Town Centres to support future upgrades of the rapid transit service from BRT to LRT; If urban expansion is still required, keep it to a minimum. The Residential Land Strategy, in terms of dwelling unit demand and supply by area and additional urban land requirements, is summarized in Figure 52.
48 Figure 52 Residential Land Strategy: demand and supply summary Single Semi Row Apt TOTAL New dwellings, ,891 40% 7,060 5% 38,345 27% 40,916 28% 144, % Urban dwellings 45,690 6,930 37,825 40, ,232 Rural dwellings 12, ,979 Intensification 3,150 2,100 9,974 37,270 52,493 Greenfield 42,541 4,830 27,852 3,516 78,739 Supply on 35,806 3,120 35,760 22,509 97,195 greenfield land, end-2006 Greenfield -6,735-1,710 7,908 18,993 18,456 demand vs. supply Density requirements (units/net ha) Net land requirement (ha) Net-to-gross ratio 50% Gross residential land requirement * for the period from the end of 2006 to mid-2031 The elements and recommendations of this Residential Land Strategy are summarized as follows: Project a TOTAL of 144,186 new dwellings in Ottawa between 2006 and Project an overall dwelling type split of 40% single detached, 5% semi-detached, 27% townhouses and 28% apartments. Project that 91% of all new dwellings (131,209) will be built in the urban area and 9% (12,977) in the rural area. Project new rural dwellings at 94% single detached, 1% semi-detached, 4% townhouses and 1% apartments. Project new urban dwellings at 35% single detached, 5% semi-detached, 29% townhouses and 31% apartments. Establish a city-wide minimum intensification target of 40% of new urban dwellings to 2031, a TOTAL of 52,484 dwellings. Provide for the intensification target to be phased-in as follows: o : 36% o : 40% o : 44% Establish the following as target areas for intensification: o The Central Area o Major Mixed-Use Centres o Mixed-Use Centres at Transfer Stations o Emerging Mixed-Use Centres o Traditional Mainstreets o Arterial Mainstreets o Suburban Town Centres Establish minimum intensification targets for the target areas, to reside outside the Official Plan but to guide CDP s, zoning and infrastructure planning. Establish the following density targets, expressed in people and jobs per gross hectare: o Central Are: 500 o Major Mixed-Use Centres: 250
49 o Target Arterial Mainstreets: 120 to 200 o Mixed-Use Centres at Transfer Stations: 200 o Emerging Mixed-Use Centres: 120 o Suburban Town Centres: 120 Ensure that all future Community Design Plans or amendments to existing CDPs, and new zoning flowing therefrom, provide for no less than the minimum intensification and density targets set out in this document for Traditional and Arterial Mainstreets, Mixed-Use Centres and Town Centres. Permit high-rise buildings in the Central Area, Mixed-Use Centres and Town Centres. Acknowledge intensification potential outside the target areas and accommodate it subject to urban design and building height requirements that preserve neighbourhood character and do not detract from the target areas ability to be the focus of intensification and growth within the built-up area inside the Greenbelt. On greenfields outside the Greenbelt, establish a minimum net density of 26 units per hectare for all new single detached dwellings, and an overall residential net density minimum of 32 units per hectare. Create an Intensification Implementation Group led by the Planning Branch that will be tasked with coordinating all City departments and services practices, by-laws and administration to support intensification and compact, mixed-use development, and lead discussions with all external stakeholders (including school boards and utilities) with a view to addressing technical, regulatory and design matters in a way that will allow the City s Residential Land Strategy to be successful. Appendix 1 - The Institutionalized Population In each Census, Statistics Canada distinguishes persons who live in Institutional Collective Dwellings from the rest of the population. The Census definition of an Institutional Collective Dwelling is: General hospitals and hospitals with emergency, other hospitals and related institutions, nursing homes, facilities for persons with a disability, establishments for delinquents and young offenders, establishments for children and minors, penal and correctional institutions, jails, shelters for persons lacking a fixed address, other shelters and lodging and rooming with assistance services. Source: The percentage of the population that is institutionalized (residing in institutional collective dwellings) is small, but in a city the size of Ottawa and given that the population of seniors is projected to increase significantly (almost half the city s population growth to 2031 will be among people aged 65 and older), a more detailed examination of institutionalized persons is warranted. From the 2006 Census, Statistics Canada provides the following rate of institutionalization by age group:
50 As the chart shows, the fraction of the population residing in institutions is minute in the younger age groups but rises steadily after age 65. In the 85+ age group, fully 27.7% of the population resided in institutional collective dwellings. Given that the population residing in institutional collective dwellings does not form part of the private dwellings housing market, then that population has to be factored out of the calculations of housing requirements and accounted for separately, under demand for institutional accommodation. Applying the rates of institutionalization by age group to the estimated 2006 population for the cohorts over the age of 15 (those associated with housing demand), we obtain the institutionalized and noninstitutionalized population numbers shown in Table A1-1. Table A1-1 Total and Non-Institutionalized population, 2006 estimate and projection to 2031 Age group Noninstit. Pop. Est Projected Pop Projected pop Projected pop rate Total Non- Inst Total Non- Inst. Total Non- Inst. Total Non- Inst % 55,776 55,355 58,649 58,206 53,897 53,490 57,374 56, % 59,952 59,657 62,333 62,027 61,900 61,596 61,269 60, % 65,486 65,256 68,664 68,423 74,636 74,374 70,842 70, % 64,067 63,704 71,957 71,549 78,306 77,862 79,048 78, % 66,767 66,379 68,173 67,777 79,842 79,378 86,738 86, % 75,684 75,280 69,180 68,811 78,869 78,448 85,846 85, % 71,717 71,385 76,103 75,751 71,422 71,092 83,473 83, % 61,830 61,397 70,552 70,058 68,886 68,404 78,884 78, % 54,470 54,102 60,297 59,890 73,487 72,991 69,443 68, % 38,944 38,586 52,334 51,853 66,690 66,077 65,656 65, % 29,313 28,984 36,854 36,441 55,337 54,717 68,063 67, % 24,627 24,080 27,025 26,424 45,871 44,852 59,157 57, % 21,097 20,139 21,160 20,199 29,652 28,305 45,079 43, % 15,901 13,511 16,383 13,920 18,574 15,782 32,107 27, % 13,044 9,435 16,478 11,919 19,555 14,145 26,516 19,180 Total 718, , , , , , , ,802 Total pop. 870, ,041 1,031,305 1,135,840 As the table shows, the institutionalized population (the difference between the Total and Non-Inst. columns in the table) grows from 11,425 persons in 2006 to 20,693 persons in Since most of this institutionalized population is comprised of seniors who might otherwise be part of the private household housing market, having separate projections for the non-institutionalized population helps prepare a more accurate projection of housing need by dwelling type. Private retirement homes are not considered Institutions, unless they are nursing homes or long-term care, and are therefore treated as apartments in the calculation of housing requirements. Accommodation of the institutionalized population will continue to be in nursing homes and long-term care facilities, which are high-density building forms. As such, they can easily be accommodated within the urban boundary including on sites located within intensification target locations and through expansions of existing facilities.
51 Appendix 2 - Projection of Dwelling Type Propensities Section 2 of the report Growth Projections for Ottawa discusses the two main methodologies used to project housing demand by dwelling type. It also discusses the various assumptions behind the projections of how housing choice (propensities) might evolve over the projection period. Dwelling type propensities will change over the projection period due to factors like evolving housing choices of an aging population, evolving housing choices of an older population with an increasing share of people with disabilities, evolving housing choices of increasingly smaller households, housing choices of immigrants, the appeal of the urban lifestyle, the increasing cost of, and challenges to finance, municipal infrastructure construction and maintenance, and increasing energy costs. In Section 1 of this report, three housing requirement scenarios are presented. Each represents a different projection of dwelling type propensities and therefore, each arrives at a different housing mix even though the total number of required dwellings is approximately the same across the scenarios. This Appendix details the calculations for each of the three scenarios. Common calculations The three scenarios share the same population and household projections, including the distinction between the total population and the non-institutionalized population (see Appendix 1), which forms the basis of the projection of total housing demand. The three scenarios share the same methodology to translate total household demand to total housing demand by adding demolition replacements and accounting for vacancies in the housing stock. Demolition replacements are calculated at 100 dwellings per year (approximated based on the average of the last ten years), broken down as follows: 74 single detached, 4 semi-detached, 5 row houses and 17 apartments. Vacancies in the housing stock are calculated as follows: rented dwellings are assumed to have a 3% vacancy rate (considered to represent a balanced rental market), and owned dwellings are assumed to have a 0.5% vacancy rate (to account for units that are vacant waiting for occupancy, including the small number of single detached and semi-detached dwellings that are rented). The owned and rented housing stocks are calculated as follows: from Census data, 30% of row houses and 75% of apartments in Ottawa are rented. The projection assumes that 15% of new row houses built to 2031 will be rental and 85% owned. For apartments, until 2021 the projection assumes that 25% of new units will be rental and 75% will be condominiums (owner-occupied). For the period the projection assumes 40% of new apartments will be rental (to account for a rising number of private retirement homes) and 60% condominiums.
52 SCENARIO 1 In Scenario 1, between 2006 and 2031 the propensity for single detached dwellings is projected to decrease for households in all age groups, most notably households headed by persons aged between 30 and 49. Propensities for semi-detached dwellings decrease slightly in all age groups up to age 49, then either remain the same as or increase very slightly from the propensities for semis observed in Propensities for row houses increase in all age groups, most significantly in households headed by persons aged between 25 and 49. Lastly, the propensity for apartments remains unchanged, or experiences slight decreases, by 2031 in age groups 25-59, and experiences small increases in age groups over 70. As the charts show, townhouses in this scenario experience the biggest shift in propensities: more households between the ages of 25 and 49 are forecast to choose them over the projection period. The propensity for single detached houses shows slighter changes across all age groups. The propensity for apartments shows very small changes, noticeable only in the youngest and oldest age groups. However, due to the proportional increase of the seniors population, this scenario translates into a requirement for an increasing number of apartments and a decreasing number of townhouses and single detached homes.
53 Dwelling type propensities by age group and dwellings by type in this scenario are as follows: Age Propensity by Dwelling Type 2006 Group Single Semi Row Apt Single Semi Row Apt Total , ,986 9,004 12, ,083 1,451 5,912 15,747 27, ,769 1,765 8,676 12,032 32, ,588 2,449 8,735 9,445 36, ,673 2,881 9,641 8,813 42, ,827 3,034 9,351 7,182 41, ,509 2,368 7,270 6,935 36, ,941 2,028 5,270 6,954 32, ,415 1,298 3,142 6,231 23, , ,191 5,343 17, , ,490 5,443 15, ,400 1,145 1,845 13,878 29, ,288 20,746 65, , ,591 Age Propensity by Dwelling Type 2011 Group Single Semi Row Apt Single Semi Row Apt Total , ,123 9,362 12, ,424 1,522 7,054 16,512 28, ,490 1,982 10,226 13,514 36, ,176 2,389 10,140 9,274 36, ,511 2,519 9,695 7,672 38, ,294 3,290 10,160 7,182 43, ,632 2,703 8,337 7,501 41, ,686 2,357 6,254 7,341 35, ,560 1,744 4,656 8,063 31, ,599 1,201 3,189 6,718 21, , ,801 5,973 16, ,250 1,227 2,006 14,864 31, ,443 22,405 75, , ,576
54 Age Propensity by Dwelling Type 2021 Group Single Semi Row Apt Single Semi Row Apt Total , ,339 9,297 12, ,208 1,550 8,287 17,948 30, ,392 2,089 12,220 14,707 39, ,475 2,668 12,871 11,295 43, ,572 2,854 12,603 8,746 43, ,624 2,923 10,937 6,740 41, ,293 2,639 8,944 7,324 40, ,123 2,872 8,491 8,947 43, ,916 2,223 6,724 10,670 39, ,589 1,803 5,114 10,087 32, ,079 1,461 3,336 10,138 28, ,603 1,550 2,669 18,777 39, ,620 25,170 94, , ,045 Age Propensity by Dwelling Type 2031 Group Single Semi Row Apt Single Semi Row Apt Total , ,315 9,392 12, ,898 1,427 8,351 16,741 29, ,899 2,096 13,939 14,846 39, ,545 3,133 16,571 11,800 47, ,154 3,250 15,247 9,996 47, ,418 3,416 13,986 8,359 48, ,812 3,022 9,814 8,387 46, ,424 2,590 8,163 8,865 41, ,557 2,188 6,632 10,543 38, ,121 2,218 6,290 12,459 40, ,131 1,884 4,303 13,811 36, ,639 2,378 4,096 30,657 60, ,197 28, , , ,965
55 Using these propensities, household demand to 2031 would be as follows: Year Single Semi Row Apt Total ,288 20,746 65, , , ,443 22,405 75, , , ,531 23,787 85, , , ,620 25,170 94, , , ,408 26, , , , ,197 28, , , ,965 Adding demolition replacements and accounting for vacancies, the total number of dwellings required to 2031 would be as follows: Year Single Semi Row Apt Total ,044 20,849 66, , , ,626 22,537 76, , , ,131 23,947 86, , , ,636 25,358 96, , , ,830 26, , , , ,023 28, , , ,294 Total new dwellings Year Single Semi Row Apt Total ,582 1,688 10,273 7,776 31, ,505 1,410 9,549 10,529 30, ,505 1,410 9,549 10,529 30, ,194 1,478 7,683 10,876 27, ,194 1,478 7,683 10,876 27,231 Total new dwellings, annualized , ,055 1,555 6, , ,910 2,106 6, , ,910 2,106 6, , ,537 2,175 5, , ,537 2,175 5,446 Share of new dwellings, annualized % 5.4% 32.8% 24.8% 100.0% % 4.5% 30.8% 34.0% 100.0% % 4.5% 30.8% 34.0% 100.0% % 5.4% 28.2% 39.9% 100.0% % 5.4% 28.2% 39.9% 100.0% Total new dwellings, ,979 7,465 44,737 50, , % 5.1% 30.3% 34.2% 100%
56 SCENARIO 2 In Scenario 2, the propensity for single detached dwellings decreases for all age groups up to age 54, but increases in all older age groups. This projection assumes that older baby-boomers will want as much as possible to age in place and for about half of the people of that generation, the place in question is their single detached home. However, for a variety reasons from lifestyle choice to cost, younger age groups would see their propensity for single homes decrease over time, and families with children would opt for townhouses in a much greater proportion. The propensity for townhouses would start decreasing in age groups 55 and older, for which it is assumed that the primary wish will be for living accommodations on a single level. In this projection, the propensity for apartments goes down for all age groups based on the supposition that younger households will prefer ground-oriented housing in greater proportions, and that among older age groups there will be a greater number of households opting to age in place in single detached houses.
57 Dwelling type propensities by age group and dwellings by type in this scenario are as follows: Age Propensity by Dwelling Type 2006 Group Single Semi Row Apt Single Semi Row Apt Total , ,911 9,554 12, ,485 1,117 6,841 15,750 27, ,389 1,741 9,210 11,902 32, ,504 2,179 9,074 9,459 36, ,356 2,569 9,144 8,938 42, ,996 2,364 8,366 8,669 41, ,261 2,185 6,749 7,886 36, ,182 1,996 5,639 7,376 32, ,978 1,515 3,597 5,994 23, ,640 1,064 2,630 4,930 17, , ,782 5,160 15, ,103 1,391 2,541 13,232 29, ,939 19,274 67, , ,583 Age Propensity by Dwelling Type 2011 Group Single Semi Row Apt Single Semi Row Apt Total , ,142 9,810 12, ,598 1,122 7,807 15,987 28, ,469 1,900 11,178 12,663 36, ,764 2,182 9,696 9,337 36, ,722 2,322 9,949 7,403 38, ,512 2,461 10,661 8,293 43, ,532 2,474 8,325 8,841 41, ,700 2,209 6,005 7,722 35, ,401 2,065 4,768 7,787 31, ,135 1,363 3,143 6,065 21, , ,906 5,461 16, ,542 1,527 2,621 13,658 31, ,369 20,878 78, , ,569
58 Age Propensity by Dwelling Type 2021 Group Single Semi Row Apt Single Semi Row Apt Total , ,307 9,624 12, ,849 1,113 9,552 16,479 30, ,853 1,949 14,356 12,248 39, ,440 2,456 13,841 9,571 43, ,403 2,587 12,515 8,269 43, ,088 2,221 11,592 7,321 41, ,558 2,376 8,699 8,565 40, ,370 2,693 7,171 9,199 43, ,288 2,703 5,902 9,638 39, ,883 2,122 4,560 9,028 32, ,163 1,631 3,101 9,118 28, ,573 2,023 3,255 16,746 39, ,193 24,172 97, , ,032 Age Propensity by Dwelling Type 2031 Group Single Semi Row Apt Single Semi Row Apt Total , ,461 9,409 12, , ,493 15,494 29, ,005 1,847 15,518 12,411 39, ,832 2,559 16,425 10,233 47, ,189 2,750 14,990 8,719 47, ,384 2,492 15,292 8,012 48, ,237 2,677 10,942 9,179 46, ,365 2,546 6,636 8,496 41, ,336 2,731 5,647 9,204 38, ,969 2,703 5,408 11,008 40, ,551 2,190 3,931 11,456 36, ,382 3,249 4,606 25,529 60, ,408 26, , , ,962
59 Using these propensities, household demand to 2031 would be as follows: Year Single Semi Row Apt Total ,939 19,274 67, , , ,369 20,878 78, , , ,281 22,525 87, , , ,193 24,172 97, , , ,301 25, , , , ,408 26, , , ,962 Adding demolition replacements and accounting for vacancies, the total number of dwellings required to 2031 would be as follows: Year Single Semi Row Apt Total ,684 19,371 68, , , ,552 21,003 79, , , ,900 22,679 88, , , ,248 24,355 98, , , ,782 25, , , , ,316 27, , , ,664 Total new dwellings Year Single Semi Row Apt Total ,868 1,632 10,855 5,006 31, ,348 1,676 9,431 6,646 31, ,348 1,676 9,431 6,646 31, ,534 1,428 7,351 6,983 27, ,534 1,428 7,351 6,983 27,297 Total new dwellings, annualized , ,171 1,001 6, , ,886 1,329 6, , ,886 1,329 6, , ,470 1,397 5, , ,470 1,397 5,459 Share of new dwellings, annualized % 5.2% 34.6% 16.0% 100% % 5.4% 30.3% 21.4% 100% % 5.4% 30.3% 21.4% 100% % 5.2% 26.9% 25.6% 100% % 5.2% 26.9% 25.6% 100% Total new dwellings, ,632 7,841 44,418 32, , % 5.3% 30.0% 21.8% 100%
60 SCENARIO 3 In Scenario 3, the propensity for townhouses is the only one to rise significantly between 2006 and 2031, at the expense of all other housing types. As a result of to the shift to townhouses, propensities for singles decline among younger age group. Rates for singles increase slightly among those over 65. Townhouse propensities rise in younger groups and decline to 2001 levels among the 55 to 69 group. For ages over 70 rates are held close to 2006 levels, reflecting the popularity of singlelevel (bungalow) townhouses for older households seeking non-apartment accommodation without stairs. For apartments, only slight increases in rates for age groups under 24 are anticipated. Rates decline among the 35 to 49 cohort due to a shift to townhouses, and increase moderately for ages 55 to 69, reflecting moves to condo apartments. Above 70, 2006 rates are held constant. Because of the demographic weight of the 60+ age cohorts, the resulting number of apartments required under this projection (as for the others) would see their share increase over time.
61 Dwelling type propensities by age group and occupied dwellings by type in this scenario are as follows: Age Propensity by Dwelling Type Occupied Dwelling Units Group Single Semi Row Apt Single Semi Row Apt Total , ,911 9,554 12, ,485 1,117 6,841 15,750 27, ,389 1,741 9,210 11,902 32, ,504 2,179 9,074 9,459 36, ,356 2,569 9,144 8,938 42, ,996 2,364 8,366 8,669 41, ,261 2,185 6,749 7,886 36, ,182 1,996 5,639 7,376 32, ,978 1,515 3,597 5,994 23, ,640 1,064 2,630 4,930 17, , ,782 5,160 15, ,103 1,391 2,541 13,232 29, ,939 19,274 67, , ,583 Age Propensity by Dwelling Type Occupied Dwelling Units Group Single Semi Row Apt Single Semi Row Apt Total , ,063 9,900 12, ,631 1,129 7,679 16,005 28, ,498 1,855 10,981 13,035 36, ,736 2,130 10,553 8,776 37, ,454 2,296 9,404 7,280 38, ,301 2,544 9,823 7,978 43, ,935 2,602 7,925 8,908 41, ,987 2,265 5,966 8,929 36, ,083 2,006 4,705 8,504 31, ,874 1,322 3,127 6,406 21, , ,962 5,651 16, ,979 1,460 2,661 14,148 31, ,255 20,854 77, , ,579
62 Age Propensity by Dwelling Type Occupied Dwelling Units Group Single Semi Row Apt Single Semi Row Apt Total , ,157 9,798 12, ,706 1,125 9,134 16,844 30, ,935 1,773 12,941 13,822 39, ,358 2,244 14,516 9,246 43, ,445 2,483 12,426 7,285 43, ,512 2,464 10,487 6,341 40, ,017 2,779 8,051 8,610 40, ,746 2,914 6,791 11,814 44, ,324 2,467 5,761 11,409 39, ,485 1,931 4,312 9,931 32, ,556 1,523 3,348 9,574 28, ,585 1,757 3,254 17,841 39, ,366 23,793 93, , ,866 Age Propensity by Dwelling Type Occupied Dwelling Units Group Single Semi Row Apt Single Semi Row Apt Total , ,221 9,696 12, ,178 1,030 9,266 15,944 29, ,306 1,691 13,863 13,923 39, ,132 2,329 17,643 9,951 47, ,160 2,644 15,009 7,838 47, ,525 2,915 13,442 7,299 48, ,387 3,291 9,506 9,851 46, ,942 2,811 6,054 11,237 41, ,760 2,394 5,488 11,279 38, ,564 2,348 4,927 12,247 40, ,485 1,962 4,335 12,344 36, ,886 2,643 4,861 27,376 60, ,899 26, , , ,976
63 Using these propensities, household demand to 2031 would be as follows: Year Single Semi Row Apt Total ,939 19,274 67, , , ,255 20,854 77, , , ,625 22,360 85, , , ,366 23,793 93, , , ,885 25, , , , ,899 26, , , ,976 Adding demolition replacements and accounting for vacancies, the total number of dwellings required to 2031 would be as follows: Year Single Semi Row Apt Total ,684 19,371 68, , , ,437 20,979 78, , , ,240 22,513 86, , , ,411 23,974 94, , , ,354 25, , , , ,784 26, , , ,041 Total new dwellings Year Single Semi Row Apt Total ,754 1,608 9,445 7,481 32, ,803 1,535 8,253 8,407 30, ,171 1,461 8,177 8,891 30, ,943 1,375 7,138 8,715 28, ,430 1,278 6,434 8,234 25,377 Total new dwellings, annualized , ,889 1,496 6, , ,651 1,681 6, , ,635 1,778 6, , ,428 1,743 5, , ,287 1,647 5,075 Share of new dwellings, annualized % 5.0% 29.3% 23.2% 100.0% % 5.0% 26.6% 27.1% 100.0% % 4.8% 26.6% 29.0% 100.0% % 4.9% 25.3% 30.9% 100.0% % 5.0% 25.4% 32.4% 100.0% Total new dwellings, ,101 7,257 39,447 41, , % 4.9% 26.7% 28.3% 100.0%
64 Appendix 3 - Annual Projections of Dwelling Units By Type and Location Note: Year refers to the 12-month period ending June 30 Year TOTAL UNITS RURAL UNITS Single Semi Row Apt Total Single Semi Row Apt TOTAL , ,889 1,496 6, , ,889 1,496 6, , ,889 1,496 6, , ,889 1,496 6, , ,889 1,496 6, , ,651 1,681 6, , ,651 1,681 6, , ,651 1,681 6, , ,651 1,681 6, , ,651 1,681 6, , ,635 1,778 6, , ,635 1,778 6, , ,635 1,778 6, , ,635 1,778 6, , ,635 1,778 6, , ,428 1,743 5, , ,428 1,743 5, , ,428 1,743 5, , ,428 1,743 5, , ,428 1,743 5, , ,287 1,647 5, , ,287 1,647 5, , ,287 1,647 5, , ,287 1,647 5, , ,287 1,647 5, TOTAL 59,101 7,257 39,447 41, ,532 12, ,278 Rural Dwellings: 9% of total Single 94% Semi 1% Row 4% Apartment 1%
65 Year URBAN UNITS Single Semi Row Apt TOTAL Single Semi Row Apt , ,866 1,490 5, % 5.4% 31.7% 25.4% , ,866 1,490 5, % 5.4% 31.7% 25.4% , ,866 1,490 5, % 5.4% 31.7% 25.4% , ,866 1,490 5, % 5.4% 31.7% 25.4% , ,866 1,490 5, % 5.4% 31.7% 25.4% , ,628 1,676 5, % 5.3% 28.9% 29.7% , ,628 1,676 5, % 5.3% 28.9% 29.7% , ,628 1,676 5, % 5.3% 28.9% 29.7% , ,628 1,676 5, % 5.3% 28.9% 29.7% , ,628 1,676 5, % 5.3% 28.9% 29.7% , ,613 1,773 5, % 5.1% 28.9% 31.7% , ,613 1,773 5, % 5.1% 28.9% 31.7% , ,613 1,773 5, % 5.1% 28.9% 31.7% , ,613 1,773 5, % 5.1% 28.9% 31.7% , ,613 1,773 5, % 5.1% 28.9% 31.7% , ,407 1,738 5, % 5.3% 27.4% 33.9% , ,407 1,738 5, % 5.3% 27.4% 33.9% , ,407 1,738 5, % 5.3% 27.4% 33.9% , ,407 1,738 5, % 5.3% 27.4% 33.9% , ,407 1,738 5, % 5.3% 27.4% 33.9% , ,269 1,642 4, % 5.4% 27.5% 35.6% , ,269 1,642 4, % 5.4% 27.5% 35.6% , ,269 1,642 4, % 5.4% 27.5% 35.6% , ,269 1,642 4, % 5.4% 27.5% 35.6% , ,269 1,642 4, % 5.4% 27.5% 35.6% TOTAL 46,619 7,124 38,915 41, , % 5.3% 29.0% 31.0%
66 Year INTENSIFICATION UNITS GREENFIELD UNITS Single Semi Row Apt Total inten.% Single Semi Row Apt Total ,240 2, % 2, , , ,240 2, % 2, , , ,240 2, % 2, , , ,240 2, % 2, , , ,240 2, % 2, , , ,582 2, % 1, , , ,582 2, % 1, , , ,582 2, % 1, , , ,582 2, % 1, , , ,582 2, % 1, , , ,665 2, % 1, , , ,665 2, % 1, , , ,665 2, % 1, , , ,665 2, % 1, , , ,665 2, % 1, , , ,577 2, % 1, , , ,577 2, % 1, , , ,603 2, % 1, , , ,603 2, % 1, , , ,628 2, % 1, , , ,473 1, % 1, , ,521 1, % 1, , ,544 2, % 1, , ,567 2, % 1, , ,600 2, % 1, ,554 TOTAL 3,225 2,150 10,200 38,128 53, % 43,394 4,974 28,715 3,467 80,551 Must 3,222 2,148 10,203 38,128 53,701 43,397 4,976 28,712 3,467 80,553 6% 4% 19% 71% 100%
67 Year INTENSIFICATION UNITS GREENFIELD UNITS Single Semi Row Apt Total Single Semi Row Apt Total % 7.1% 24.8% 58.6% 100% 53.3% 4.4% 35.6% 6.6% 100% % 7.1% 24.8% 58.6% 100% 53.3% 4.4% 35.6% 6.6% 100% % 7.1% 24.8% 58.6% 100% 53.3% 4.4% 35.6% 6.6% 100% % 7.1% 24.8% 58.6% 100% 53.3% 4.4% 35.6% 6.6% 100% % 7.1% 24.8% 58.6% 100% 53.3% 4.4% 35.6% 6.6% 100% % 3.3% 19.9% 70.1% 100% 55.7% 6.7% 34.8% 2.8% 100% % 3.3% 19.9% 70.1% 100% 55.7% 6.7% 34.8% 2.8% 100% % 3.3% 19.9% 70.1% 100% 55.7% 6.7% 34.8% 2.8% 100% % 3.3% 19.9% 70.1% 100% 55.7% 6.7% 34.8% 2.8% 100% % 3.3% 19.9% 70.1% 100% 55.7% 6.7% 34.8% 2.8% 100% % 3.4% 16.8% 74.5% 100% 53.5% 6.3% 36.9% 3.2% 100% % 3.4% 16.8% 74.5% 100% 53.5% 6.3% 36.9% 3.2% 100% % 3.4% 16.8% 74.5% 100% 53.5% 6.3% 36.9% 3.2% 100% % 3.4% 16.8% 74.5% 100% 53.5% 6.3% 36.9% 3.2% 100% % 3.4% 16.8% 74.5% 100% 53.5% 6.3% 36.9% 3.2% 100% % 3.6% 16.6% 75.0% 100% 53.3% 6.4% 35.0% 5.3% 100% % 3.6% 16.6% 75.0% 100% 53.3% 6.4% 35.0% 5.3% 100% % 3.5% 16.4% 75.3% 100% 53.7% 6.5% 35.3% 4.5% 100% % 3.5% 16.4% 75.3% 100% 53.7% 6.5% 35.3% 4.5% 100% % 3.5% 16.3% 75.6% 100% 54.2% 6.6% 35.6% 3.7% 100% % 3.8% 17.3% 75.0% 100% 52.0% 6.6% 35.0% 6.4% 100% % 2.5% 17.1% 76.6% 100% 52.5% 7.6% 35.3% 4.6% 100% % 2.5% 16.9% 76.9% 100% 52.9% 7.7% 35.6% 3.8% 100% % 2.5% 16.7% 77.1% 100% 53.4% 7.8% 35.9% 2.9% 100% % 2.4% 16.5% 77.5% 100% 54.1% 7.9% 36.4% 1.7% 100%
68 BY PERIOD: TOTAL UNITS Single Semi Row Apt Total ,754 1,608 9,445 7,481 32, ,803 1,535 8,253 8,407 30, ,171 1,461 8,177 8,891 30, ,943 1,375 7,138 8,715 28, ,430 1,278 6,434 8,234 25,377 TOTAL 59,101 7,257 39,447 41, ,532 RURAL UNITS URBAN UNITS Single Semi Row Apt Total Single Semi Row Apt Total , ,906 11,022 1,579 9,328 7,452 29, , ,790 10,180 1,507 8,141 8,379 28, , ,763 9,574 1,433 8,066 8,863 27, , ,535 8,560 1,350 7,037 8,690 25, , ,284 7,283 1,255 6,343 8,211 23,093 TOTAL 12, ,278 46,619 7,124 38,915 41, ,254
69 Appendix 4 - Primary Rapid Transit Network to Map 4 See figure on following page.
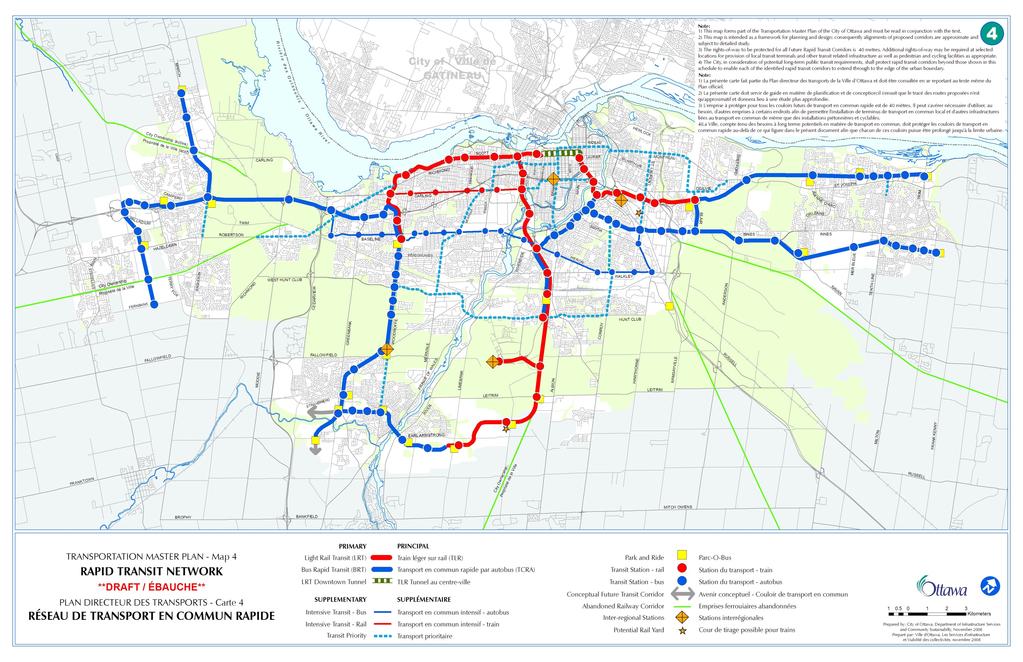
70
71 Appendix 5 - Conversion of Density Benchmarks For Transit In the IBI Group s report, Transportation Trends and Outlooks for the Greater Toronto Area and Hamilton Needs and Opportunities, benchmarks are provided as indicative of densities required to support various levels of transit service. These benchmarks are as follows: Table A5-1 Transit Service Potential Based on Urban Density Density Transit potential Type of service range* Under 20 Low No public transit. Requires dial-up cabs, jitneys, etc Modest Marginal public transit. Buses every half-hour. Rush hour express buses Good Good bus service Very good Excellent bus service. Possible BRT/LRT BRT/LRT Higher order transit Over 200 Subway Higher order transit * Density is expressed as People and Jobs per Gross Hectare. BRT = Bus Rapid Transit LRT = Light Rail Transit Because the Greater Golden Horseshoe has several upper-, lower- and single-tier municipalities each with a different dwelling occupancy rate, density targets there are expressed as people and jobs per gross hectare. Ottawa, being a single-tier municipality, has one Census occupancy rate for dwellings. Generally, planning documents in Ottawa measure density in terms of dwelling units or jobs per net hectare. Therefore, the above benchmarks require conversion so that they may be understood in terms of Ottawa s density measurement approach. Two elements require conversion: people to dwellings and gross to net hectares. There also needs to be an understanding of the proportion of people and jobs entailed by the benchmarks. For planning purposes, the benchmarks will apply to the Central Area, Mixed-Use Centres, Arterial Mainstreets, suburban Town Centres and the Riverside South Community Core, which are designations that call for a mix of uses. At present, some of the locations with these designations contain more jobs than residents; in other cases the opposite is true. An optimal mixed-use environment would have a roughly half-and-half balance between jobs and residents (with the understanding that some locations, such as the Central Area, will remain more heavily tilted toward employment). The target is to be interpreted as a blended sum of jobs and people. First, a net-to-gross ratio has to be determined. To do this, an average was taken of the gross and net land areas in Ottawa s Central Area, Mixed-Use Centres, Arterial Mainstreets and suburban Town Centres. Even with the presence of several suburban and largely undeveloped Mixed-Use Centres and Town Centres, the average works out to 70%. Therefore, this 70% ratio is applied to gross density measurements to obtain a comparable net density expression. Given the more urban and denser nature (or planned future) of these areas, such a ratio is reasonable as it implies higher land coverage than typical suburban or general urban contexts. Second, the proper dwelling occupancy rate has to be applied to each development application that is subject to the targets to translate dwellings into population. The dwelling occupancy rates are updated after every national Census. The current occupancy rates from the 2006 Census are as follows:
72 Dwelling Type Persons per household Single detached 3.35 Semi-detached 2.53 Townhouse 2.50 Stacked Townhouse 2.06 Apartment 1.62 NOTE: No new single detached dwellings are expected in Target Areas. The data is provided for information and to reflect the fact that there are existing single detached dwellings in some areas which may be part of future development applications The full calculation appears in the table below: Table A5-3 Conversion of Transit Service Potential Based on Urban Density Transit People and Jobs per Hectare People and Jobs per hectare potential Gross Net:Gross Net Net Min Max Ratio Min Max Min Max Low % Modest % Good % Very Good % BRT-LRT % Subway % Rounding off the benchmarks would produce the following table expressing density in terms of Dwellings and Jobs per Net Hectare: Table A5-4 - Transit Service Potential Based on Urban Density expressed in Dwellings and Jobs per Net Hectare Density Transit Type of service range* potential Under 30 Low No public transit. Requires dial-up cabs, jitneys, etc Modest Marginal public transit. Buses every half-hour. Rush hour express buses Good Good bus service Very good Excellent bus service. Possible BRT/LRT BRT/LRT Higher order transit Over 285 Subway Higher order transit * Density is expressed here in terms of Dwellings and Jobs per Net Hectare.
73 Therefore, the Density Targets summarized in Section 3.9 as People and Jobs per Gross Hectare are translated into Dwellings and Jobs per Net Hectare as follows: Area Target (people and jobs per gross ha) (people and jobs per net ha) Central Area Major Mixed-Use Centres Target Arterial Mainstreets: Carling, Richmond (north of Carling) St. Laurent, Bank, Merivale, Montreal East Mixed-Use Centres at Key Transfer Stations Emerging Mixed-Use Centres Town Centres Riverside South Community Core IMPLEMENTATION FOR ZONING AND SITE PLAN APPLICATIONS The minimum densities assigned to each of the target areas must be complied with by all Official Plan Amendment, Zoning Amendment, Site Plan, Plan of Condominium and Minor Variance applications, subject to the relevant policies of the Official Plan. Interpretation of the Density Targets The density target expressed in People and Jobs per Hectare means that the target (e.g. 200) represents the combined minimum number of residents or employees that must be accommodated by any development subject to the target. The target can be met through a development that provides only jobs, or only residents, or a combination of jobs and residents on a site or in a building. Measuring the Density of an Proposed Development Table A5-5 above expresses the minimum densities for target areas in Dwellings and Jobs per Net Hectare. This provides Approvals staff with a better measure with which to evaluate an application that would contain residential units against the minimum density requirements. For employment, the following benchmarks are applied: For development applications with office-type employment: 20 m 2 (215 sq.ft.) of gross floor space per employee For development applications with retail-type employment: 35 m 2 (376 sq.ft.) of gross leasable area (GLA) per employee (outlets under 9,000 m 2 ) 45 m 2 (484 sq.ft.) of GLA per employee (outlets 9,000 m 2 and greater) Example 1: New downtown office building A new office building in the Central Area is proposed on a site that measures 4,500 m 2 (0.45 net hectare). The total amount of floor space will be 34,000 m 2, of which there will be 30,600.m 2 of gross floor space for office employees and 2,500 m 2 of gross leasable retail space on the ground floor. The density calculation for this project will thus be as follows: Site Area: 0.45 ha (net) Total floor space: 34,000 m 2 Gross office space: 30,600 m 2 Retail GLA: 2,500 m 2
74 Employment density: Office space: 30,600 / 20 = 1,530 jobs Retail space: 2,500 / 35 = 71 jobs Total: 1,601 jobs Jobs per net hectare: 1,601 / 0.45 ha = 3,558 This project exceeds the minimum density target of 700 people and jobs per net hectare for the Central Area, and meets the target through the provision of office and retail employment. Example 2: New mixed retail-condo building A new mixed-use development is proposed on Preston Street, within the Bayview-Preston Mixed-Use Centre. It is a 5-storey building with a retail ground floor and 4 residential storeys with 25 condo apartments on a small urban lot fronting on the Mainstreet. The lot measures 993 m 2 ( ha net). Because of rear yard setback requirements, the building occupies only 70% of the lot. The density calculation would be as follows: Site Area: ha (net) Building floorplate: 690 m 2 Number of dwelling units: 25 Retail GLA: 450 m 2 Retail jobs: 450 / 35 = 13 Building population: 25 units * 1.62 persons per household (apt. occupancy rate) = 40 people Combined jobs and people: 43 People and jobs per net hectare: 43 / ha = 433 This project exceeds the minimum density requirement of 285 people and jobs per net hectare. Example 3: Retail development in a Town Centre A proposal comes in for a 7,500-m 2 single-storey retail development on a 27,500-m 2 site in the Kanata Town Centre. The retail strip will feature a large pharmacy outlet and twelve other outlets including an end-cap coffee shop without a drive-through. There will be two hectares of landscaped surface parking. The density calculation for this project would be as follows: Site area: 2.75 ha (net) Retail building floorplate: 7,500 m 2 Retail GLA: 7,125 m 2 Retail jobs: 7,125 / 35 = 204 Jobs per net hectare: 204 /2.75 = 74 This proposal does not meet the minimum density requirement for Town Centres, which is 170 people and jobs per hectare. It cannot be approved.
75 Appendix 6 - Best Practice Examples of New Suburban Development Increasing suburban densities means revisiting the way suburbs are developed. It is important that future suburban neighbourhoods retain the vital residential features of privacy, quiet and safety. Across Canada and North America, new approaches to suburban development have been tested over the last fifteen years and some hold considerable potential. One such approach is New Urbanism. With increased densities, new opportunities arise for quality urban design. In New Urbanism subdivisions, garages are behind the houses, serviced by rear lanes. Rear lanes also serve as utility corridors, thus removing overhead wires and utility boxes from the street frontage. Rear lanes function as public places that provide play space away from the street. They allow for continuous curb frontage at the front of the houses to accommodate on-street parking for visitors. Cars parked on the street in turn introduce a buffer between the sidewalk and moving traffic, making sidewalks safer for children. Sidewalks are also safer for children when they are not crossed by driveways. The grid layout makes wayfinding easier and supports walkability and transit much more than curving street layouts. To prevent cut-through traffic, offset grids replace the regular grids found in older urban areas. Finally, houses that are built closer to the sidewalk give the street better enclosure and remove the possibility of front yard parking, which blights many neighbourhoods with large front yards. New Urbanism communities are difficult to build in Ottawa in great part because the City s various standards and regulatory frameworks have not anticipated this type of development. For the past sixty years worth of suburban development, the principles of subdivision design have been driver safety and ease of movement, the elimination of cut-through traffic with street layouts in crescents and cul-de-sacs, the separation of land uses and buildings, the buffering of incompatible uses with greenery, and the channelling of traffic from local streets to collector roads to arterials and highways. Throughout all these design principles, space has been generously apportioned to things like setbacks, road width, intersection radii, cul-de-sac turning loops and similar elements. In a design environment in which the use of a private vehicle is assumed to be the norm, space is an easy design solution by which to reduce costs and maximize convenience. Over time, utilities like Hydro and natural gas have introduced their own wishes for further space in the form of easements, corridors and utility box locations. The challenge we face today is to reintroduce to suburban planning the notion that urban space is important. Suburban land is not free. It is a scarce resource that must be well planned and well used. This does not mean that suburbs should lose what makes them attractive for people who choose them: privacy, safety and quiet. It means that those attributes have to be produced in differently designed environments, so that the land base will last longer and the need to extend the urban boundary reduced. Although the City of Ottawa may not immediately require new greenfield communities to follow the principles of New Urbanism, it may consider adapting some of its internal regulatory and service delivery frameworks to make such communities feasible and attractive to the development community. There are a few built-out examples of New Urbanism neighbourhoods in Canada. In Ontario, they are mostly located within the Greater Toronto Area: the communities of Cornell (Markham), Oak Park (Oakville), and The Village at York University in the City of Toronto, among others. In Alberta, Calgary has two built-out New Urbanism communities: Garrison Woods and Mackenzie Town. In British Columbia, the community of East Clayton in the City of Surrey is a planned New Urbanism community. Cornell (Markham) Cornell is a 973-hectare greenfield site planned for 28,000 people. As of the 2006 Census it was home to about 12,000 and is still under active development. Cornell is laid out in an offset grid pattern (see site plan, right) in which there are still curving streets but they intersect at right angles. There are no crescents or cul-de-sacs. There is a complete network of rear lanes for all residential and non-residential areas. This means that homes can be closer to the street and

76 closer together, but streetscapes are not dominated by garages and driveways, so the visual effect is more neighbourly and the perception of density is thereby attenuated. There are mainstreet areas with retail storefronts along the sidewalk, and offices or condo apartments in the upper storeys. Those mainstreets are near city parks and around the corner from residential streets. They are part of people s journey in and out of their neighbourhood. Cornell has a large central park and a number of smaller local parks that take up a small city block, which is surrounded by residential city blocks. Local parks are therefore typically surrounded by houses on all four sides. This allows better informal surveillance of these public spaces. According to the Town of Markham, the overall net residential density in the first phase of Cornell is 39 units per hectare. For each type of dwelling, net densities are as follows: Single detached 30 Semi-detached 40 Townhouses 47 Apartments 75


77 Photos of Cornell: Local park with houses fronting on it Courtesy: Mattamy Homes Live-work townhouses have their ground floor designed to be either a store or professional office, or part of a home. Their location right on the sidewalk creates the possibility for these buildings to evolve over time as either people s homes or part of a mixed-use street. Courtesy: Mattamy Homes Local residential streets: quiet, private, lined with front porches, devoid of driveways and garage doors. Sidewalks on both sides of the street. Courtesy: Mattamy Homes Mixed-use building at the edge of a public park. On the street side, the building has stores along the sidewalk and condo apartments on the upper floors. Courtesy: Mattamy Homes Cornell streetscapes. New Urbanism is wrongly and derogatorily associated with copycat historical architecture. While it is fact that many New Urbanist communities offer homebuyers architectural styles that are reminiscent of older neighbourhoods, the principles of New Urbanism do not by themselves demand specific styles of architecture.
 Garrison Woods is a new neighbourhood about 2 km southwest of downtown Calgary.")
78 (Left) Housing mix and net residential density in the first phase of Cornell. Coach houses are secondary dwellings above the rear-lane garage. Courtesy: Town of Markham Garrison Woods (Calgary) Garrison Woods is a new neighbourhood about 2 km southwest of downtown Calgary. It is located on the site of a decommissioned Canadian Forces Base, which closed in The eastern portion of the base, a 71-hectare site, was immediately redeveloped as a New Urbanist neighbourhood. Development is now completed. There are 1,600 dwelling units, some of which include former military homes that were moved to new locations along the new street grid. There are also 6,500 m2 of retail space including a major grocery store. The site has a gross density of 26 dwelling units per hectare. There are a significant number of nonresidential uses in Garrison Woods, including the Museum of the Regiments, an arena, a private school and a major park. Estimating a net-to-gross ratio of 40%, the net residential density is closer to 47 units per hectare.

79 Calgary planning staff report that one of their greatest challenges was convincing other city departments to accept different development standards. For example, the Fire department at first was reluctant to accept narrower streets and tighter street corners, which are important elements of a pedestrian-friendly neighbourhood. Planners organized field trials on comparably narrow streets to determine whether response times were adversely affected by the street layout. Firefighters driving skills showed that the concern was exaggerated. The narrow streets and tighter corners proceeded. Garrison Woods is on an urban site and as such, it is not a suburban development. It remains a model for Ottawa to consider because of its strict adherence to New Urbanist principles including roads and engineering standards, and because it may also serve as a model for comparable situations in Ottawa (notably CFB Rockcliffe). The community has a retail main street that connects with an existing retail area (the Marda Loop). It has a central green surrounded by residences on all four sides. Most residential areas have rear lanes and, where they do not, the garages are at the rear of the house, accessed by shared driveways. Garage doors are therefore not at all present on the street front. Some homeowners have had accessory dwellings built above their rear-lane garages.


80 Photos of Garrison Woods: Main street in Garrison Woods: buildings that front the sidewalk, with storefronts directly accessible and condo apartments on the upper floors. Typical residential street in Garrison Woods. The homes are close to the sidewalk, creating an intimate streetscape, and there are no driveways in the front, increasing the green cover. Historical architectural styles were chosen for Garrison Woods. These are not a requirement of New Urbanism, but in this case, traditional styles were used as an extra method by which to differentiate this subdivision. Another example of some of the historical styles offered by the developers of Garrison Woods. The mixing of styles not only adds variety to the streetscape, it also better integrates various dwelling types along a street. Rear lanes conceal garages and utility boxes. Some homeowners have purchased secondary dwellings above the garage as in-law suites. These were offered as upgrades by Garrison Woods developers. Some streets have a central green with a pedestrian pathway, in addition to sidewalks on both sides. These greens become focal points for the neighbourhood, used for events like kids birthday parties, barbecues, or yard sales.
Residential Land Strategy for Ottawa
 DOCUMENT 8b Residential Land Strategy for Ottawa 2006-2031 February 2009 Publication # 9-23 ottawa.ca 2008081067.indd Page intentionally left blank Residential Land Strategy for Ottawa 2006-2031 City of
Table of Contents. Appendix...22
 Table Contents 1. Background 3 1.1 Purpose.3 1.2 Data Sources 3 1.3 Data Aggregation...4 1.4 Principles Methodology.. 5 2. Existing Population, Dwelling Units and Employment 6 2.1 Population.6 2.1.1 Distribution
Community & Infrastructure Services Committee
 REPORT TO: DATE OF MEETING: September 12, 2016 Community & Infrastructure Services Committee SUBMITTED BY: Alain Pinard, Director of Planning, 519-741-2200 ext. 7319 PREPARED BY: Natalie Goss, Senior Planner,
Table of Contents. Title Page # Title Page # List of Tables ii 6.7 Rental Market - Townhome and Apart ment Rents
 RESIDENTIAL MONITORING REPORT 2013 Table of Contents Title Page # Title Page # List of Tables ii 6.7 Rental Market - Townhome and Apart ment Rents 21 List of Figures iii 7.0 Other Housing Demands and Trends
Housing & Residential Intensification Study Discussion Paper Township of King
 Housing & Residential Intensification Study Discussion Paper Prepared by Planning Department January 2011 1.0 Background 1.1 Provincial Policies (Greenbelt and Growth Plan) Since 2001, the Province of
UNDERSTANDING DEVELOPER S DECISION- MAKING IN THE REGION OF WATERLOO
 UNDERSTANDING DEVELOPER S DECISION- MAKING IN THE REGION OF WATERLOO SUMMARY OF RESULTS J. Tran PURPOSE OF RESEARCH To analyze the behaviours and decision-making of developers in the Region of Waterloo
VACANT URBAN RESIDENTIAL LAND SURVEY 2010 UPDATE
 1. INTRODUCTION VACANT URBAN RESIDENTIAL LAND SURVEY 2010 UPDATE The Vacant Urban Residential Land Survey (VURLS) has, since 1982, monitored the supply of vacant land in Ottawa s urban area to assess whether
City of Winnipeg Housing Policy Implementation Plan
 The City of Winnipeg s updated housing policy is aligned around four major priorities. These priorities are highlighted below: 1. Targeted Development - Encourage new housing development that: a. Creates
SHAPING NINTH LINE GROWTH MANAGEMENT ANALYSIS FINAL REPORT. HEMSON C o n s u l t i n g L t d.
 SHAPING NINTH LINE GROWTH MANAGEMENT ANALYSIS FINAL REPORT HEMSON C o n s u l t i n g L t d. May 16, 2017 EXECUTIVE SUMMARY Hemson Consulting Ltd. has been engaged to provide supporting analysis and documentation
2016 Census Bulletin Changing Composition of the Housing Stock
 Metro Vancouver s Role Every five years, the Census of Canada provides benchmark data that is instrumental in analyzing and evaluating local government planning policies and services. Representing member
FEASIBILITY REPORT. 1486, 1490 and 1494 Clementine. Prepared by: Lloyd Phillips & Associates Ltd. For: Ottawa Salus
 DRAFT FEASIBILITY REPORT 1486, 1490 and 1494 Clementine Prepared by: Lloyd Phillips & Associates Ltd. For: Ottawa Salus LPA File No. 1008 Lloyd Phillips & Associates June 9, 2010 Feasibility Report Page
Document under Separate Cover Refer to LPS State of Housing
 Document under Separate Cover Refer to LPS5-17 216 State of Housing Contents Housing in Halton 1 Overview The Housing Continuum Halton s Housing Model 3 216 Income & Housing Costs 216 Indicator of Housing
CITY OF SASKATOON COUNCIL POLICY
 ORIGIN/AUTHORITY Planning and Development Committee Report No. 26-1990; Legislation and Finance Committee Report No. 42-1990; City Commissioner s Report No. 29-1990, and further amendments up to and including
TOTTENHAM SECONDARY PLAN
 TOTTENHAM SECONDARY PLAN AMENDMENT NO. 11 TO THE OFFICIAL PLAN OF THE TOWN OF NEW TECUMSETH The following text and schedules to the Official Plan of the Town of New Tecumseth constitute Amendment No. 11
How Does the City Grow?
 This bulletin summarizes information from the City of Toronto s Land Use Information System II, providing an overview of the development projects received by the City Planning Division between January
Terms of Reference for Town of Caledon Housing Study
 1.0 Introduction Terms of Reference for Town of Caledon Housing Study The Town of Caledon is soliciting proposals for a comprehensive Housing Study. Results of this Housing Study will serve as a guiding
June 12, 2014 Housing Data: Statistics and Trends
 June 12, 214 Housing Data: Statistics and Trends This presentation was provided to the Mayor s Housing Commission on June 12, 214 and provided to Council on June 23, 214 along with a report summarizing
12 REGIONAL CENTRES AND CORRIDORS PROGRAM UPDATE
 Clause No. 12 in Report No. 11 of was adopted, without amendment, by the Council of The Regional Municipality of York at its meeting held on June 26, 2014. 12 REGIONAL CENTRES AND CORRIDORS PROGRAM UPDATE
Township of Tay Official Plan
 Township of Tay Official Plan Draft for Consultation (v.3) March 2016 Contents 1. INTRODUCTION... 1 1.1 Content, Title and Scope... 1 1.2 Basis and Purpose of this Plan... 1 1.3 Plan Structure... 2 2.
THAT Council receives for information the Report from the Planner II dated April 25, 2016 with respect to the annual Housing Report update.
 Report to Council Date: April 25, 2016 File: 1200-40 To: From: Subject: City Manager Laura Bentley, Planner II, Policy & Planning Annual Housing Report Update Recommendation: THAT Council receives for
JASPER PLACE NEIGHBOURHOOD HOUSING ASSESSMENT NOVEMBER West Jasper Place. Glenwood. Britannia Youngstown. Canora
 JASPER PLACE NEIGHBOURHOOD HOUSING ASSESSMENT NOVEMBER 2013 West Jasper Place Glenwood Britannia Youngstown Canora TABLE OF CONTENTS A: INTRODUCTION................................... 01 B: PHOTOGRAPHIC
PLANNING REPORT THE CORPORATION OF THE TOWN OF COBOURG
 THE CORPORATION OF THE TOWN OF COBOURG PLANNING REPORT TO: Planning & Sustainability Advisory Committee FROM: Desta McAdam, MCIP, RPP Planner I Development DATE OF MEETING: May 8 th, 2018. REPORT TITLE/SUBJECT:
HOUSING ISSUES REPORT
 HOUSING ISSUES REPORT 8, 12 & 14 HIGH PARK AVENUE AND 1908, 1910, 1914 & 1920 BLOOR STREET WEST CITY OF TORONTO PREPARED FOR: 619595 ONTARI O INC. February 2016 TABLE OF CONTENTS 1.0 INTRODUCTION 1 2.0
Settlement Pattern & Form with service costs analysis Preliminary Report
 Settlement Pattern & Form with service costs analysis Preliminary Report Prepared for Regional Planning Halifax Regional Municipality by Financial Services, HRM May 15, 2004 TABLE OF CONTENTS INTRODUCTION...
THE CORPORATION OF THE TOWNSHIP OF WELLESLEY EMPLOYMENT LANDS STRATEGY
 THE CORPORATION OF THE TOWNSHIP OF WELLESLEY EMPLOYMENT LANDS STRATEGY February 2017 TABLE OF CONTENTS Contents 1.0 INTRODUCTION... 4 2.0 PURPOSE OF REPORT... 5 3.0 PLANNING POLICIES... 5 3.1 Provincial
METROPOLITAN COUNCIL S FORECASTS METHODOLOGY JUNE 14, 2017
 METROPOLITAN COUNCIL S FORECASTS METHODOLOGY JUNE 14, 2017 Metropolitan Council s Forecasts Methodology Long-range forecasts at Metropolitan Council are updated at least once per decade. Population, households
Bylaw No , being "Official Community Plan Bylaw, 2016" Schedule "A" DRAFT
 Bylaw No. 2600-2016, being "Official Community Plan Bylaw, 2016" Schedule "A" Urban Structure + Growth Plan Urban Structure Land use and growth management are among the most powerful policy tools at the
Planning Justification Report
 Planning Justification Report 101 Kozlov Street, Barrie, Ont. Destaron Property Management Ltd. November 2015 Revised February 2017 TABLE OF CONTENTS Page 1.0 INTRODUCTION... 1 2.0 DESCRIPTION OF SUBJECT
Chapter 1: Community & Planning Context
 Chapter 1: Community & Planning Context Yesterday, Today & Tomorrow Comprehensive Plan 2040 2 INTRODUCTION The City of Lauderdale is a small town with a long history. Nestled between Saint Paul and Minneapolis,
TASK 2 INITIAL REVIEW AND ANALYSIS U.S. 301/GALL BOULEVARD CORRIDOR FORM-BASED CODE
 TASK 2 INITIAL REVIEW AND ANALYSIS U.S. 301/GALL BOULEVARD CORRIDOR FORM-BASED CODE INTRODUCTION Using the framework established by the U.S. 301/Gall Boulevard Corridor Regulating Plan (Regulating Plan),
Housing Characteristics
 CHAPTER 7 HOUSING The housing component of the comprehensive plan is intended to provide an analysis of housing conditions and need. This component contains a discussion of McCall s 1990 housing inventory
4.0. Residential. 4.1 Context
 4. 0Residential 4.1 Context In 1986, around the time of Burnaby s last Official Community Plan, the City had a population of 145,000 living in 58,300 residential units. By 1996, there were 179,000 people
2014 Plan of Conservation and Development. Development Plan & Policies
 The Town of Hebron Section 3 2014 Plan of Conservation and Development Development Plan & Policies C. Residential Districts I. Residential Land Analysis This section of the plan uses the land use and vacant
2019 DC Study External Stakeholder Committee Minutes
 Date / Time: October 10 th, 2017 1:30pm 3:30pm Location: Committee Room #1, 2 nd Floor City Hall 2019 DC Study External Stakeholder Committee Minutes Attended: George Kotsifas (Chair), Lois Langdon, Sandy
PLANNING REPORT. 33 Arkell Road City of Guelph. Prepared on behalf of OHM Arkell Inc. August 4, Project No. 1327
 PLANNING REPORT 33 Arkell Road City of Guelph Prepared on behalf of OHM Arkell Inc. August 4, 2015 Project No. 1327 423 Woolwich Street, Suite 201, Guelph, Ontario, N1H 3X3 Phone (519) 836-7526 Fax (519)
Detroit Neighborhood Housing Markets
 Detroit Neighborhood Housing Markets Market Study 2016 In 2016, Capital Impact s Detroit Program worked with local and national experts to determine the residential market demand across income levels for
The New California Dream How Demographic and Economic Trends May Shape the Housing Market
 Voices on the Future The New California Dream How Demographic and Economic Trends May Shape the Housing Market A Land Use Scenario for 2020 and 2035 ARTHUR C. NELSON Executive Summary The New California
Planning Rationale. 224 Cooper Street
 Submitted by: Robertson Martin Architects Tel 613.567.1361 Fax 613.567.9462 216 Pretoria Ave, Ottawa, Ontario, K1S 1X2 Planning Rationale 224 Cooper Street Planning Rationale Application to City of Ottawa
ANALYSIS OF INTENSIFICATION OPPORTUNITIES IN THE CITY OF BRANTFORD. Final Report Prepared for:
 ANALYSIS OF INTENSIFICATION OPPORTUNITIES IN THE CITY OF BRANTFORD Final Report Prepared for: February 2012 TABLE OF CONTENTS I INTRODUCTION... 1 A. Purpose of this Report... 1 B. Types of Intensification
Table of Contents CITY OF BRANTFORD
 RESIDENTIAL MONITORING REPORT 2011 Table of Contents Title Page # Title Page # List of Tables I 7.0 Other Housing Demands and Trends 21 List of Figures II 7.1 Affordable Housing 22-23 List of Appendices
AMENDMENT NUMBER 38 TO THE OFFICIAL PLAN OF THE TOWNSHIP OF WEST LINCOLN (COMPLIANCE)
") AMENDMENT NUMBER 38 TO THE OFFICIAL PLAN OF THE TOWNSHIP OF WEST LINCOLN (COMPLIANCE) 2013 AMENDMENT NUMBER 38 TO THE OFFICIAL PLAN OF THE TOWNSHIP OF WEST LINCOLN PART 1 - THE PREAMBLE 1.1 TITLE This
AMENDMENT NUMBER 38 TO THE OFFICIAL PLAN OF THE TOWNSHIP OF WEST LINCOLN (COMPLIANCE) 2013 AMENDMENT NUMBER 38 TO THE OFFICIAL PLAN OF THE TOWNSHIP OF WEST LINCOLN PART 1 - THE PREAMBLE 1.1 TITLE This
ATTACHMENT NO Growth and Staging of Development Report
 ATTACHMENT NO. 1 2016 Growth and Staging of Development Report This page intentionally left blank. Table of Contents Introduction... 2 Section 1: Provincial Policy Statement (2014) and Provincial Growth
6208 Jeanne D Arc Boulevard North. Planning Rationale. Site Plan Control
 Site Plan Control Prepared By: NOVATECH Suite 200, 240 Michael Cowpland Drive Ottawa, Ontario K2M 1P6 November / 24 / 2015 Novatech File: 115100 Ref: R-2015-179 November 24, 2015 City of Ottawa 110 Laurier
METROPOLITAN COUNCIL S FORECASTS METHODOLOGY
 METROPOLITAN COUNCIL S FORECASTS METHODOLOGY FEBRUARY 28, 2014 Metropolitan Council s Forecasts Methodology Long-range forecasts at Metropolitan Council are updated at least once per decade. Population,
Fiscal Impact Analysis Evergreen Community
 Evergreen Community July 16, 2015 Evergreen Community Prepared for: Evergreen Community (Burlington) Ltd. Prepared by: 33 Yonge Street Toronto Ontario M5E 1G4 Phone: (416) 641-9500 Fax: (416) 641-9501
POPULATION FORECASTS
 POPULATION FORECASTS Between 2015 and 2045, the total population is projected to increase by 373,125 residents to reach 2.2 million. Some areas will see major increases, while other areas will see very
Task 13A: Review & Assessment of Affordable and Shared Housing, and Secondary Suites. Comprehensive Zoning By-law Project
 City of Markham Task 13A: Review & Assessment of Affordable and Shared Housing, and Secondary Suites Comprehensive Zoning By-law Project Markham Zoning By-law Consultant Team Gladki Planning Associates,
Planning & Strategic Initiatives Committee
 REPORT TO: DATE OF MEETING: February 2, 2015 SUBMITTED BY: Planning & Strategic Initiatives Committee Alain Pinard, Director of Planning PREPARED BY: Katie Anderl, Senior Planner, 519-741-2200 ext. 7987
Planning Justification Report
 Planning Justification Report Kellogg s Lands City of London E&E McLaughlin Ltd. June 14, 2017 Zelinka Priamo Ltd. Page i TABLE OF CONTENTS Page No. 1.0 2.0 2.1 2.2 3.0 4.0 5.0 5.1 5.2 5.3 5.4 5.5 5.6
Generic Environmental Impact Statement. Build-Out Analysis. City of Buffalo, New York. Prepared by:
 Generic Environmental Impact Statement Build-Out Analysis City of Buffalo, New York 2015 Prepared by: TABLE OF CONTENTS 1.0 INTRODUCTION 1 2.0 METHODOLOGY 2 3.0 EXISTING LAND USE 3 4.0 EXISTING ZONING
Planning Rationale in Support of an Application for Plan of Subdivision and Zoning By-Law Amendment
 Planning Rationale in Support of an Application for Plan of Subdivision and Zoning By-Law Amendment The Kilmorie Development 21 Withrow Avenue City of Ottawa Prepared by: Holzman Consultants Inc. Land
DRAFT FOR DISCUSSION PURPOSES ONLY. Port Credit Local Area Plan Built Form Guidelines and Standards DRAFT For Discussion Purposes
 Port Credit Local Area Plan Built Form Guidelines and Standards DRAFT For Discussion Purposes 1 Local Area Plan - Project Alignment Overview Directions Report, October 2008 (General Summary Of Selected
MINTO COMMUNITIES INC. AVALON WEST STAGE 4 PLANNING RATIONALE. July Prepared for:
 MINTO COMMUNITIES INC. AVALON WEST STAGE 4 PLANNING RATIONALE July 2015 Prepared for: MINTO COMMUNITIES INC. 200 180 Kent Street Ottawa, Ontario K1P 0B6 Prepared by: J.L. RICHARDS & ASSOCIATES LIMITED
Highland Green Estates Neighbourhood Area Structure Plan
 Highland Green Estates Neighbourhood Area Structure Plan Original Outline Plan approved by Council: March 10, 1997 Outline Plan amended by Council: March 24, 1997 Converted to a Neighbourhood Area Structure
PLANNING REPORT Gordon Street City of Guelph. Prepared on behalf of Ontario Inc. March 17, Project No. 1507
 PLANNING REPORT 1131 Gordon Street City of Guelph Prepared on behalf of 1876698 Ontario Inc. March 17, 2016 Project No. 1507 423 Woolwich Street, Suite 201, Guelph, Ontario, N1H 3X3 Phone (519) 836-7526
Appendix A: Guide to Zoning Categories Prince George's County, Maryland
 Appendix A: Guide to Zoning Categories Prince George's County, Maryland RESIDENTIAL ZONES 1 Updated November 2010 R-O-S: Reserved Open Space - Provides for permanent maintenance of certain areas of land
Town of Yucca Valley GENERAL PLAN 1
 Town of Yucca Valley GENERAL PLAN 1 This page intentionally left blank. 3 HOUSING ELEMENT The Housing Element is intended to guide residential development and preservation consistent with the overall values
Terms of Reference for the Regional Housing Affordability Strategy
 Terms of Reference for the Regional Housing Affordability Strategy Prepared by: CRD Regional Planning Services September, 2001 Purpose The Capital Region is one of the most expensive housing markets in
Town of Niagara-on-the-Lake Official Plan Review. Discussion Paper: Second Residential Units. Prepared for: The Town of Niagara-on-the-Lake
 Town of Niagara-on-the-Lake Official Plan Review Discussion Paper: Second Residential Units Prepared for: The Town of Niagara-on-the-Lake October 15, 2015 PLANSCAPE Inc. Building Community through Planning
Cork Planning Authorities Joint Housing Strategy. Managers Joint Report on the submissions received and issues raised.
 Joint Housing Strategy Managers Joint Report on the submissions received and issues raised. June 2013 Introduction This is a joint report which reviews the submissions received during the public consultation
For Vintages of Four Mile Creek Town of Niagara on the Lake, Ontario
 Planning Impact Analysis For Vintages of Four Mile Creek Town of Niagara on the Lake, Ontario Prepared by: Upper Canada Consultants 261 Martindale Road Unit #1 St. Catharines, Ontario L2W 1A1 Prepared
HOUSING & RESIDENTIAL AREAS
 CHAPTER 10: HOUSING & RESIDENTIAL AREAS OVERVIEW With almost 90% of Ridgefield zoned for residential uses, the patterns and form of residential development can greatly affect Ridgefield s character. This
10 Affordable Housing Measuring and Monitoring Guidelines
 Clause 10 in Report No. 11 of Committee of the Whole was adopted, without amendment, by the Council of The Regional Municipality of York at its meeting held on June 25, 2015. 10 Affordable Housing Measuring
WYNYARD CENTRAL HOUSING POLICY
 WYNYARD CENTRAL HOUSING POLICY 1 Policy objectives 1.1 To clarify the approach that Waterfront Auckland (WA) will take to delivering a thriving residential community. 2 Scope 2.1 Covers the approach to
MAKING THE MOST EFFECTIVE AND SUSTAINABLE USE OF LAND
 165 SOC146 To deliver places that are more sustainable, development will make the most effective and sustainable use of land, focusing on: Housing density Reusing previously developed land Bringing empty
Residential Intensification in Established Neighbourhoods Study (RIENS)
") Residential Intensification in Established Neighbourhoods Study (RIENS) EXECUTIVE SUMMARY In December 2015, the City of Kitchener retained Meridian Planning Consultants to undertake the Residential Intensification
Residential Intensification in Established Neighbourhoods Study (RIENS) EXECUTIVE SUMMARY In December 2015, the City of Kitchener retained Meridian Planning Consultants to undertake the Residential Intensification
research highlight Impact of the 2010 Winter Olympic Games on the Vancouver and Sea-to-Sky Housing Markets introduction Methodology
 research highlight November 2006 Socio-economic Series 06-022 Impact of the 2010 Winter Olympic Games on the Vancouver and Sea-to-Sky Housing Markets introduction Cities are increasingly using mega events
Our Focus: Your Future 2007 YEAR END HOUSING MONITORING AND SUBDIVISION STATUS REPORTS
 Town of Fort Erie Community & Development Services Our Focus: Your Future Prepared for Council-in-Committee Report No. CDS-011-08 Agenda Date February 4,2008 File No. 350204/350308 Subject 2007 YEAR END
An Executive Summary. Residential Market Potential
 T1 Residential Market Potential for New Traditional Neighborhoods, Neighborhood Centers, Town Centers, Urban Centers, and The Urban Core T2 October 2004 Conducted by Zimmerman/Volk Associates Inc. Clinton,
Suburban Sprawl: Exposing Hidden Costs, Identifying Innovations. Summary
 : Exposing Hidden Costs, Identifying Innovations Summary October 2013 Suburban sprawl is spreading across Canada as cities expand outwards to accommodate the growing demand for lower cost houses. But it
Ashcroft Homes Trim Road Development Planning Rationale
 18 Antares Drive Ottawa, ON K2E 1A9 Ashcroft Homes Trim Road Development Planning Rationale Proposed Site Plan & Zoning Amendment Applications File No: D02-02-17-0129 & D07-12-17-0175 August 2018 Planning
Chapter 24 Saskatchewan Housing Corporation Housing Maintenance 1.0 MAIN POINTS
 Chapter 24 Chapter 24 Saskatchewan Housing Corporation Housing Maintenance 1.0 MAIN POINTS The Saskatchewan Housing Corporation s maintenance of the 18,300 housing units it owns is essential to preserve
PIN , Part 1, Plan SR-713 in Lot 2, Concession 5, Township of McKim (1096 Dublin Street, Sudbury)
") STAFF REPORT Applicant: Dalron Construction Limited Location: PIN 02124-0103, Part 1, Plan SR-713 in Lot 2, Concession 5, Township of McKim (1096 Dublin Street, Sudbury) Official Plan and Zoning By-law:
STAFF REPORT Applicant: Dalron Construction Limited Location: PIN 02124-0103, Part 1, Plan SR-713 in Lot 2, Concession 5, Township of McKim (1096 Dublin Street, Sudbury) Official Plan and Zoning By-law:
Bridgeland-Riverside Area Redevelopment Plan (ARP)
") Bridgeland-Riverside Area Redevelopment Plan (ARP) The current Bridgeland-Riverside Area Redevelopment Plan (ARP) was approved in 1980. Since then, a lot of changes have taken place in the city and the
Bridgeland-Riverside Area Redevelopment Plan (ARP) The current Bridgeland-Riverside Area Redevelopment Plan (ARP) was approved in 1980. Since then, a lot of changes have taken place in the city and the
CHAPTER 8: HOUSING. Of these units, 2011 Census statistics indicate that 77% are owned and 23% are rental units.
 CHAPTER 8: HOUSING Port Moody has traditionally been a family oriented community. Based on the 2011 Census, 64% of all census families include children. Overall the number of dwelling units in Port Moody
CITY OF CLAREMONT MASTER PLAN 2017 CHAPTER 6: HOUSING
 CITY OF CLAREMONT MASTER PLAN CHAPTER 6: HOUSING Prepared by the Claremont Planning Board and the Claremont Planning and Development Department Vision Claremont Master Plan Chapter 6: Housing Quality housing
Corporate Services Planning and Economic Development. Memorandum
 Corporate Services Planning and Economic Development Memorandum TO: FROM: Committee of the Whole Paul Freeman, Chief Planner DATE: June 21, 2018 RE: York Region C omments on Draft Provinci al Guidance
CITY OF HAMILTON. Community Services Housing & Homelessness Division
 CITY OF HAMILTON Community Services Housing & Homelessness Division TO: Chair and Members Emergency & Community Services Committee WARD(S) AFFECTED: CITY WIDE COMMITTEE DATE: April 20, 2011 SUBJECT/REPORT
Transit-Oriented Development Specialized Real Estate Services
 COLLIERS INTERNATIONAL Transit-Oriented Development Specialized Real Estate Services Accelerating success. Colliers International transit-oriented development GROUP P. 1 2 transit-oriented development
Residential. Infill / Intensification Development Review
 Residential Infill / Intensification Development Review How Best to Manage The Compatible Integration of New Housing Within Established Residential Neighbourhoods Identification of Issues Privacy/overlook/height
RBC-Pembina Home Location Study. Understanding where Greater Toronto Area residents prefer to live
 RBC-Pembina Home Location Study Understanding where Greater Toronto Area residents prefer to live RBC-Pembina Home Location Study: Understanding where Greater Toronto Area residents prefer to live July
RENTAL MARKET REPORT. Manitoba Highlights* Highlights. Housing market intelligence you can count on
 H o u s i n g M a r k e t I n f o r m a t i o n RENTAL MARKET REPORT Highlights* C a n a d a M o r t g a g e a n d H o u s i n g C o r p o r a t i o n Date Released: Spring 2012 Figure 1 Winnipeg CMA Brandon
1.0 INTRODUCTION PURPOSE OF THE CIP VISION LEGISLATIVE AUTHORITY Municipal Act Planning Act...
 April 2017 TABLE OF CONTENTS 1.0 INTRODUCTION... 1 2.0 PURPOSE OF THE CIP... 1 3.0 VISION... 1 4.0 COMMUNITY IMPROVEMENT PROJECT AREA..3 5.0 LEGISLATIVE AUTHORITY... 3 5.1 Municipal Act... 3 5.2 Planning
DRAFT REPORT. Boudreau Developments Ltd. Hole s Site - The Botanica: Fiscal Impact Analysis. December 18, 2012
 Boudreau Developments Ltd. Hole s Site - The Botanica: Fiscal Impact Analysis DRAFT REPORT December 18, 2012 2220 Sun Life Place 10123-99 St. Edmonton, Alberta T5J 3H1 T 780.425.6741 F 780.426.3737 www.think-applications.com
HOUSING NEEDS ASSSESSMENT
 HOUSING NEEDS ASSSESSMENT June 2018 TABLE OF CONTENTS EXECUTIVE SUMMARY... 2 INTRODUCTION... 3 VALUE IN PARTNERSHIPS... 4 DETERMINING AFFORDABILITY... 5 CURRENT HOUSING CONTEXT... 7 HOUSING PROVIDERS...
Red Deer, Alberta acres ~ 468 units
 77.97 acres ~ 468 units FORMER CITY BOUNDARY LINE Red Deer, Alberta NEW CITY BOUNDARY LINE Project Details The subject Property is the fee simple interest in the South ½ of NE 12-38-27-W4M, in the City
PLANNING RATIONALE 680 BRONSON AVENUE OTTAWA, ONTARIO PROPOSED ZONING BY-LAW AMENDMENT
 PLANNING RATIONALE 680 BRONSON AVENUE OTTAWA, ONTARIO PROPOSED ZONING BY-LAW AMENDMENT FRANK PARAVAN APRIL 2014 Planning Rationale Introduction FOTENN Consultants Inc. has been engaged by Frank and Michael
Housing Issues Report Shoreline Towers Inc. Proposal 2313 & 2323 Lake Shore Boulevard West. Prepared by PMG Planning Consultants November 18, 2014
 Housing Issues Report Shoreline Towers Inc. Proposal 2313 & 2323 Lake Shore Boulevard West Prepared by PMG Planning Consultants November 18, 2014 PMG Planning Consultants Toronto, Canada M6A 1Y7 Tel. (416)
Staff Report. October 19, 2016 Page 1 of 17. Meeting Date: October 19, 2016
 October 19, 2016 Page 1 of 17 Staff Report Report No.: PDSD-P-58-16 Meeting Date: October 19, 2016 Submitted by: Subject: Recommendation: Ben Puzanov, RPP, Senior Planner Application for Zoning By-law
Chapter 5: Testing the Vision. Where is residential growth most likely to occur in the District? Chapter 5: Testing the Vision
 Chapter 5: Testing the Vision The East Anchorage Vision, and the subsequent strategies and actions set forth by the Plan are not merely conceptual. They are based on critical analyses that considered how
Regulatory Impact Statement
 Regulatory Impact Statement Establishing one new special housing area in Queenstown under the Housing Accords and Special Housing Areas Act 2013. Agency Disclosure Statement 1 This Regulatory Impact Statement
Annual (2013) Review of the Surrey Official Community Plan
 Review of the Surrey Official Community Plan") CORPORATE REPORT NO: R118 COUNCIL DATE: JUNE 23, 2014 REGULAR COUNCIL TO: Mayor & Council DATE: June 23, 2014 FROM: General Manager, Planning and Development FILE: 6440-01 SUBJECT: Annual (2013) Review
CORPORATE REPORT NO: R118 COUNCIL DATE: JUNE 23, 2014 REGULAR COUNCIL TO: Mayor & Council DATE: June 23, 2014 FROM: General Manager, Planning and Development FILE: 6440-01 SUBJECT: Annual (2013) Review
RENTAL MARKET REPORT. Manitoba Highlights* Highlight Box. Housing market intelligence you can count on
 H o u s i n g M a r k e t I n f o r m a t i o n RENTAL MARKET REPORT Manitoba Highlights* C a n a d a M o r t g a g e a n d H o u s i n g C o r p o r a t i o n Date Released: Spring 2011 Figure 1 Winnipeg
NORTH LEEDS MATTER 2. Response to Leeds Sites and Allocations DPD Examination Inspector s Questions. August 2017
 NORTH LEEDS MATTER 2 Response to Leeds Sites and Allocations DPD Examination Inspector s Questions August 2017 CLIENT: TAYLOR WIMPEY, ADEL REFERENCE NO: CONTENTS 1.0 INTRODUCTION 2.0 TEST OF SOUNDNESS
VACANT URBAN RESIDENTIAL LAND SURVEY 2016 UPDATE. City of Ottawa Planning, Infrastructure and Economic Development
 VACANT URBAN RESIDENTIAL LAND SURVEY 2016 UPDATE City of Ottawa Planning, Infrastructure and Economic Development May 2017 This page has been intentionally left blank Vacant Urban Residential Land Survey
DCLG consultation on proposed changes to national planning policy
 Summary DCLG consultation on proposed changes to national planning policy January 2016 1. Introduction DCLG is proposing changes to the national planning policy framework (NPPF) specifically on: Broadening
2006 YEAR END HOUSING MONITORING AND SUBDIVISION STATUS REPORTS
 Town of Fort Erie Community & Development Services Our Focus: Your Future Prepared for: Council-in-Committee Report No.: CDS-022-07 Agenda Date: March 5, 2007 File No.: 350204/350308 Subject: 2006 YEAR
HOUSING IN NORTH PERTH. Evaluating Affordability. Prepared by: Kristin Sainsbury, County of Perth Economic Development
 HOUSING IN NORTH PERTH June 2012 Evaluating Affordability Prepared by: Kristin Sainsbury, County of Perth Economic Development E X E C U T I V E S U M M A RY In November 2011, the North Perth Economic
Salem HNA and EOA Advisory Committee Meeting #6
 Salem HNA and EOA Advisory Committee Meeting #6 Residential Land Policies Employment Land Policies Policy Discussions with the Committee Outcome of today s meeting Direction from this Committee on proposed
City of Glen Eira. housing.id. Analysis of housing consumption and opportunities
 City of Glen Eira housing.id Analysis of housing consumption and opportunities May 2017 Table of contents 1. Introduction... 5 1.1 Objective... 5 1.2 Context... 5 1.3 Approach... 7 2. Residential demand...