1240 W. Bayaud Avenue
|
|
|
- Drusilla Norris
- 5 years ago
- Views:
Transcription


1 Offering Memorandum 2018 Denver, CO


2 The Offering A fee simple, unencumbered interest in The prospective purchaser will be selected by the Seller in consultation with Avison Young on the basis of purchase price, funding discretion/capability, level of underwriting, anticipated closing date, experience in closing similar transactions and other relevant factors determined by the Seller. Investment Contacts For additional information, please contact: Sam Crowe, Associate sam.crowe@avisonyoung.com Jaimee Keene, MAI, Vice President jaimee.keene@avisonyoung.com 2
3 Table of Contents 01 Executive Summary Property Overview 6 Location Overview 12 Market Overview 16 Comparables 22 3

4 W. BAYAUD AVENUE SUBJECT PROPERTY S. PLATTE RIVER DRIVE 25 S. NAVAJO STREET W. CEDAR AVENUE W. BYERS PLACE 01 Executive Summary ALAMEDA AVENUE

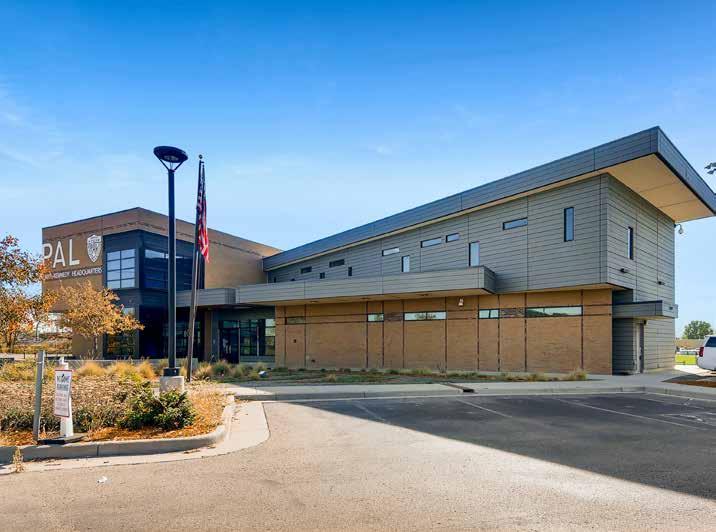
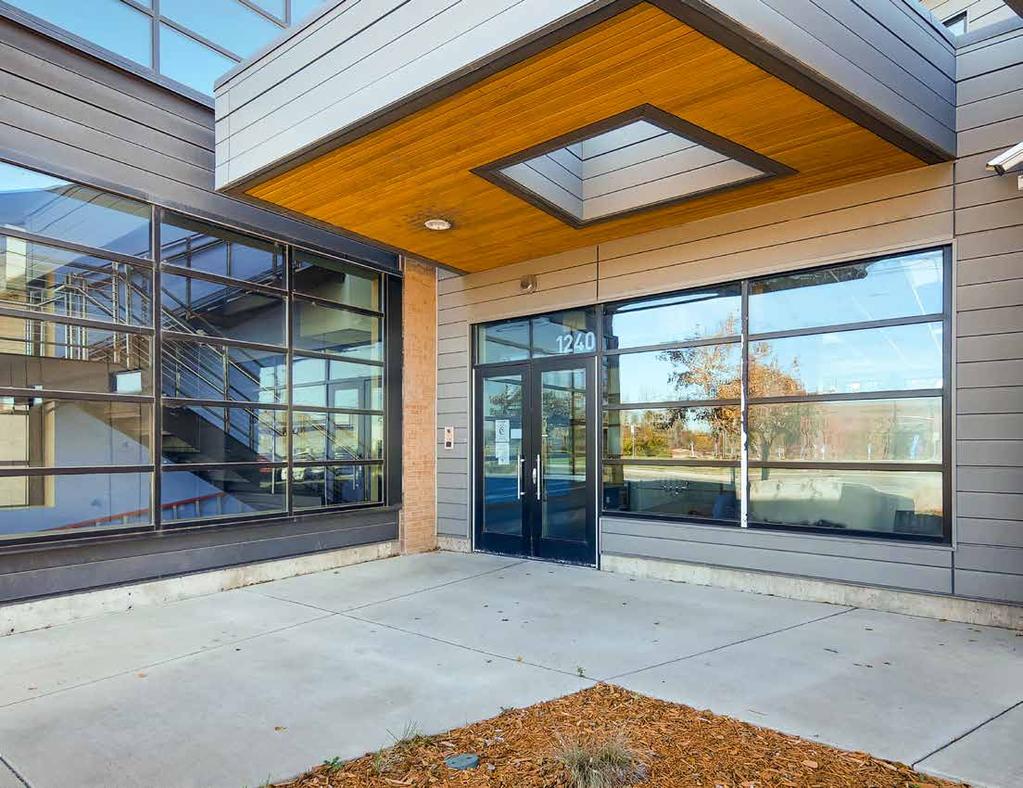
5 The Offering Avison Young, as exclusive representatives for the Owner, is pleased to present this offering for the sale of the 100% fee simple interest in (the Property ), a 2-story, 9,610 sf single tenant office/flex property located on the west side of I-25 near the Baker neighborhood. W. BAYAUD AVENUE, DENVER, CO Sales Price $4,250,000 Price/SF $442/sf 5

6 W. BAYAUD AVENUE 25 SUBJECT PROPERTY S. PLATTE RIVER DRIVE S. NAVAJO STREET 02 Property Overview W. CEDAR AVENUE

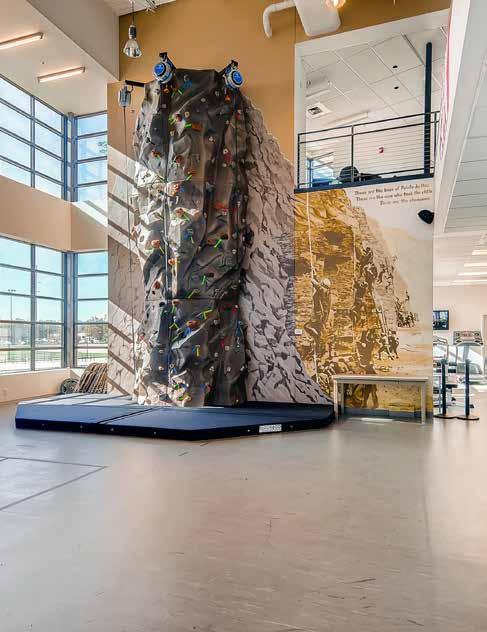
7 Property Summary is a 9,610 square foot office building directly west of Interstate 25 in the developing Baker neighborhood of Denver. Constructed in 2010, the class B office asset offers lofted common areas, a rooftop garden and a flex component with roughly 750 sf of storage space and a drive-in door. The site enjoys immediate adjacency to Valverde Park and open green space along the South Platte River Valley. The immediate access provided by Alameda and Interstate 25 in conjunction with the flexibility of General Industrial District zoning will be coveted by users in several industries. Great access to I-25 and Alameda Avenue W. BAYAUD AVENUE, DENVER, CO Total Building Area 9,610 sf Asset Type Office/Flex Stories 2 stories; single tenant Average Floor Plate 4,800 sf Year Built 2010 General Industrial District Zoning Contemporary office build-out Overhead door to storage space Class Parking Land Area County Loading Class B 12 surface spaces 0.55 acres Denver One dock entrance Walk Score Very Walkable (55) Transit Score Good (59) Zoning Billboards I-B General Industrial District UO-2 Overlay District permits billboards This district is intended to be an employment area containing industrial uses that are generally more intensive than uses permitted in the I-A zone district. The overall purpose of the district is to promote industrial development and economic activity. No new residential uses may be established in the I-B zone district in order to promote and continue a stable employment base for the city. 7
8 Site Plan W. BAYAUD AVENUE S. NAVAJO STREET W. BAYAUD AVENUE S. PLATTE RIVER DRIVE 8
9 Floorplans 1st Floor 9
10 Floorplans 2nd Floor 10
11 Floorplans Roof 11
12 03 Location Overview


13 Office/Flex Location Overview The West submarket is comprised of over 11.3 million square feet of office space (msf ) in 267 buildings, and nearly 6.7 msf of flex space in 94 properties. The submarket extends west from Interstate 25 adjacent to downtown Denver, to the Rocky Mountain Foothills, encompassing Wheat Ridge, Applewood and Golden. Class B properties make up the majority of space in the submarket. Major industries include agriculture/mining/utilities, engineers/architects, government, computers/data processing, bioscience, health care, business services and manufacturing. Some of the area s major employers include the City & County of Denver, Enserca Engineering, Peak Power Engineering, Gambro, New West Physicians, National Park Service, Department of Veterans Affairs, Kinder Morgan Foundation, FirstBank, Terumo BCT Inc., and Tallgrass Energy Partners. The West Denver submarket recorded positive office net absorption of 19,162 square feet (sf ) in the third quarter, and flex recorded 20,552 sf. Over the past four years office and flex absorption have been positive annually. Absorption should continue this trend into There is currently one office building under construction. Meow Wolf broke ground in the third quarter of 2018, totaling 90,000 sf. The building will deliver in late 2019 and will mostly be occupied by the Meow Wolf company. The last office delivery in the submarket was in second quarter 2018, as the ground floor space of a storage facility. Office vacancy has steadily decreased since 2013 when it peaked at 15.3%, as a result of new product hitting the market. The third quarter 2018 vacancy rate declined 160 basis points from third quarter 2017, to 10.6%. Flex vacancy remains incredibly low, at 1.9% and has been below 5.0% since Overall asking office rates began to rise again in fourth quarter 2017, after declining in the previous two years. The office 2018 third quarter rate of $22.52 is 5.0% higher than Flex rent began trending upwards in 2012 and were at $11.94 in third quarter, near the historical high of $12.18 achieved in first quarter Additional absorption gains, stable vacancy rates, and strong rental rate appreciation are expected in flex and office space throughout


14 COLORADO BOULEVARD Location Aerial 6TH AVENUE SPEER BOULEVARD 25 CHERRY CREEK NORTH SHOPPING CENTER SUBJECT PROPERTY BROADWAY RETAIL CORRIDOR DENVER COUNTRY GOLF CLUB ALAMEDA AVENUE BROADWAY 25 WASHINGTON PARK 14

15 Broadway Corridor Location Overview The south Broadway commercial corridor, extending from Speer Boulevard south to Interstate 25, has undergone tremendous redevelopment since The opening of the Light Rail stops at Interstate 25 and Alameda improved accessibility to the bars, restaurants and retail along Broadway. In the past 18 years 153,000 sf of new retail space was added to the area, and it is 99% occupied. Retail has performed well along Broadway, at a time when brick and mortar operators are facing increasing pressure from e-commerce. Colorado s craft spirit industry has also been successful on or near Broadway. Stranahan s Colorado Whiskey distillery is now a local landmark along Interstate 25 and the industrial area between Broadway and Interstate 25 is home to several other craft producers. Branded Oak Brewing Club, Baere Brewing Company and TRVE Brewing Company are all operating along the northern stretch of Broadway, before Speer Boulevard, complementing the new bars and restaurants. Renovations and adaptive reuse have also brought new life to underutilized space. One of the biggest projects occurred in 2012 at 65 Broadway. Punchbowl Social, a restaurant and entertainment complex, was installed in a dilapidated retail building, utilizing 27,000 sf of renovated space. The Denver Health Administration just opened its new 300,000 sf facility near Speer Boulevard and Broadway. Office space along Broadway is in high demand, as employers seek locations that afford their workers convenient accessibility and options for dining and entertainment. The nearly 2.2 msf of office space is 95.5% leased. The Broadway corridor is a vibrant area, with a diverse array of businesses. Its proximity to downtown and multiple transportation access points contribute to its resurgence as a commercial area. 15
16 04 Market Overview


17 Denver 3Q 2018 Market Overview Increasingly, technology and software companies are bolstering demand in the Denver office market. Tech companies with recent office openings include Strava, Xero, Marketo, Gusto, Thanx, Granicus, SwitchFly, Accelo and OpenTable. Netflix opened a new office in Boulder, which now has 33.4% of its office space occupied by tech firms. This increased diversification points towards continued expansion in Denver s office market into early Market Facts 30,575 Net employment increase in the last 12 months ending in August, a 2.0% increase in employment. 3.3% Unemployment in Denver, lower than the national unemployment rate of 3.9%. 3.9 Million square feet of office space now under construction, with 29% preleased. 11.1% The Denver office vacancy rate decreased in the third quarter. Through the third quarter of 2018, improving vacancy rates and positive absorption indicate that recent deliveries are being leased. Absorption remains slightly dampened by tenants vacating Class C space, but positive absorption more than made up for these losses. Rents for Class C space continue to rise, while Class B rents are flat, causing some tenants to upgrade instead of renewing leases. Improvements in Class A occupancy were facilitated by slightly softening rents and increasing incentives, as landlords found themselves in greater competition. Hord Copeland Mackt leased 18,653 square feet (sf ) at 1800 Wazee Street, receiving six months of free rent and a nearly $100 per square foot tenant improvement (TI) allowance. Lewis, Brisbois, Bisgaard & Smith s 20,168 sf expansion at 1700 Lincoln Street included three months of free rent and a $50 psf TI allowance. Downtown absorption has been especially strong, despite large deliveries, due to large blocks being leased. Although still positive, Denver is experiencing slowdowns in economic and population expansion from the record paces set since the last recession. The vacancy rate declined 90 basis points from the previous quarter, to 11.1%. The decline in vacancy from 2017 is due to strong Class B absorption and slowing deliveries. However, the 3.9 million square feet (msf ) currently under construction indicates that there is still a substantial amount of product in the pipeline. Improving vacancy and flat or decreasing rental rates show that tenants are finding deals in the market outside of downtown. ADP renewed their lease at a low rate of $18.50 psf gross in Aurora and CBD Global occupied space at $12.00 psf NNN in Golden. 17

18 Market Overview Historical Vacancy & Rent Vacancy & Availability Denver s vacancy rate declined 90 basis points (bps) in the third quarter from the 3,000, % 2,666, % 14.0% previous quarter to 11.1%, due to absorption outpacing deliveries. The vacancy rate is still low by historic standards, and improving to its best rate since fourth quarter Square Footage 2,500,000 2,000,000 1,500,000 1,000, % 1,280,259 1,295,717 1,641, % 2,428,762 2,391,233 2,129,631 2,025, % 11.4% 10.9% 10.9% 1,031,314 1,265,951 1,173, , , % 13.0% 12.0% 11.0% 10.0% 9.0% 8.0% Vacancy Rate Recent vacancy trends are similar in the Downtown, Southeast and Suburban markets. The Suburban market continues to have the lowest vacancy rates, due to its affordable rents and slower pace of deliveries. Several projects that delivered earlier in 2018 have leased large blocks of space. ATRIA, a 176,588-sf project, leased half of its space to Conga, and Civica Cherry Creek only has 500, , , , % 6.0% 28.4% of its square footage available th Street had one tenant obtain 58,000 sf, Slack signed for nearly 80,000 sf at 16 Chestnut, and WeWork committed to 50,801 0 YE11 YE12 YE13 YE14 YE15 YE16 YE17 Q % sf at HUB. Under construction projects are only 29% preleased, however third quarter Absorption Deliveries Vacancy lease-up performance proves that demand for speculative construction remains high. The vacancy rate is projected to rise slightly in 2019 due to new deliveries. Asking Rates Average asking rates in the Denver market contracted slightly in the third quarter, dropping 0.3% per square foot (psf ) to $27.49 psf gross. However, rates for Class A space in Denver s CBD built since 2010 increased to $43.31 psf gross. In the past five years, asking rates have grown at unprecedented levels due to new construction projects charging high premiums, particularly in the LoDo and Platte River submarkets, which resumed increasing after stalling in second quarter due to slow lease-ups. The frantic growth rate appears to be over, as landlords responded to rising vacancy offering increased incentives and slightly discounted rents. Rent forecasts are mixed, as new deliveries command premiums, while landlords of existing product begin offering discounts in an increasingly competitive market. 18

19 Market Overview Square Footage 3,000,000 2,500,000 2,000,000 1,500,000 1,000, % 13.1% 1,280,259 1,295,717 Absorption & Deliveries 2,666,160 2,428,762 2,391, % 2,129,631 2,025, % 11.4% 10.9% 11.1% 10.9% 1,641,770 1,031,314 1,265,951 1,173, , , % 14.0% 13.0% 12.0% 11.0% 10.0% 9.0% 8.0% Vacancy Rate Absorption & Demand Absorption totaled 1.0 million positive square feet (msf ) in the third quarter. Sublet space and Class C product accounted for approximately 100,000 sf of negative absorption. Tenants vacated 52,974 sf of sublease space in the third quarter, down from 220,061 sf leased last quarter. Denver s fossil fuels energy sector has historically been a major occupier of office space; however, its tenancy is dictated by the volatile energy market. Increasing rig counts and fossil fuel prices brought about a period of stability in energy office occupancy in Whiting Petroleum signed the second largest lease of the third quarter for 135,178 sf at 1700 Lincoln Street. Technology companies are increasingly drawn 500, , , , % 6.0% to the market by the lower operating costs. Broomfield technology company Conga announced it will consolidate its facilities from four states into a global headquarters 0 YE11 YE12 YE13 YE14 YE15 YE16 YE17 Q % in Broomfield, requiring space for up to 570 workers. Propeller Aero, a Sydney-based Absorption Deliveries Vacancy startup making drone software for construction and mining companies, moved its U.S.- based office to the RiNo area in July, with plans to double its Denver presence. Denverbased employment technology company Guild Education recently secured $40 million in Series C funding for its expansion plans. The major corporate development in the third quarter was VF Corporations announcement that it was moving its global headquarters to Denver. The Fortune 250 company will add over 800 new jobs to the local economy. 19
20 Market Overview Construction Approximately 485,000 sf of new construction broke ground in the third quarter and Denver s construction pipeline is 3.9 msf, with 29% preleased. Many tenants in the Denver market continue to make real estate decisions based on amenities available at newly built projects that improve recruiting and retention. The current development cycle represents the most construction to occur dating back to the mid-1980s. Three buildings delivered in the third quarter, totaling nearly 79,000 sf with 33% preleased. Construction activity is projected to remain elevated into 2019, although the rate of new groundbreaking is expected to slow. 3Q18 Building Deliveries DeLo (18,000 sf) Boulder Riverwalk South (35,000 sf) Parker/Castle Rock Flight (140,000 sf) Platte River Fossil Point (26,000 sf) West Construction Timeline 1,600,000 1,400,000 1,200,000 1,000, , , , , Q15 2Q15 3Q15 4Q15 1Q16 2Q16 3Q16 4Q16 1Q17 2Q17 3Q17 4Q17 1Q18 2Q18 3Q18 4Q18 1Q19 2Q19 3Q19 4Q19 1Q20 2Q20 3Q20 4Q20 Available Preleased Corporate owned 20

21 Market Overview 3Q2018 Activity Stable cap rates and sales volumes, despite a lower number of transactions, show that the Denver investment market is still strong. Prime West, the developer of One Belleview Station, broke ground on another office building in the DTC West. Located at 6900 Layton Avenue, the building will add 382,000 sf to the market in late 2020 and be anchored by Newmont Mining. Capital Markets A Real Capital Analytics search states the average cap rate for office properties in the Denver Metro area is below 6.5%. Cap rates have been declining since third quarter and have not been this low in over two years. The average price per square foot has increased from previous quarters to approximately $260 per square foot (psf ). Yearover-year (YOY) change in sales drastically increased to 250%. This indicates the market for investment office properties in Denver remains strong. There were multiple high dollar value transactions during third quarter. The largest was UBS Realty Investors sale of 1670 Broadway, otherwise known as the TIAA-CREF building. This building sold for $240 million or $ per square foot and had an occupancy rate of 90.7% at time of sale. A number of multi-property portfolios were sold during third quarter. Northstar Commercial Partners sold Cherry Creek Place I and II to Pennybacker Capital LLC for a total of $39.7 million or $202 per square foot. Both buildings were over 93% occupied at time of sale. City Office REIT acquired the two building portfolio of Circle Point Corporate Center I and II. Northridge Capital sold it for a total of $59.8 million or $ per square foot. Both buildings had over 90% occupancy at time of sale. Amid the office leasing market softening slightly and the pending end-of-cycle reactions, Denver s capital market remain strong. When comparing prices to the Tier-One markets across the country, the price of office product continues to be attractive to buyers. Alpine Investments began clearing their site for a ten-story boutique office building in the Golden Triangle neighborhood at 955 Bannock. The 65,000-sf project is one of the first office redevelopments in an area that has mostly seen multifamily projects. The biggest lease signed in the third quarter was VF Corp s acquisition of 285,000 sf at 1551 Wewatta Street, occupying the entire building. Trends to Watch The price of oil was $60.37/bbl in January 2018, increasing to $75.30/bbl in September. Projections indicate it will continue rising into Most economic sectors reported growth in the last 12 months with Information (9.0%), Leisure and Hospitality (5.7%), Mining, Logging and Construction (3.4%), and Professional and Business services (2.9%) leading the way. Median single-family home prices are up by 5.2% from the previous year to $428,
22 05 Comparables


23 23
24 Sales Comparables PROPERTY SALE DATE SIZE (SF) OCC. YOC SALE PRICE SALE PRICE/SF BUYER COMMENTS S. Gaylord Street Denver, CO April , % 1965 $2,900,000 $ Grant Real Estate, LLC Class B office E. Speer Boulevard Denver, CO May , % 1989 $3,400,000 $ AKBD4, LLC (Richard and Judy Anderson) Class B Office. Renovated in S. Cherokee Street Denver, CO March , % 1964 $2,500,000 $ Rees F. Davis Class B Industrial/Warehouse. Sale/Leaseback by Declaration Brewing Company with a 25 year lease Fox Street Denver, CO April , % 1967 $2,686,500 $ Archbrook Capital Class B Office. Renovated in N Speer Blvd. Denver, CO September , % 1943 $3,700,000 $ VHS Enterprises Class C Office. Renovated in Gaylord Street Denver, CO August , % 1915 $2,475,000 $ The Other Side Academy 1915 mansion retrofitted for professional tenants. The building is air-conditioned and features common conference rooms and kitchen, off-street parking and excellent visibility. 24

25 Sales Comparables Map SUBJECT PROPERTY
26 Lease Comparables 1 SUBJECT PROPERTY W Bayaud Avenue PROS CONS Ample parking Updated Rare opportunity Extensive remodeling needed on the first floor MetroPark W 2nd Avenue Rent: $20-21/sf NNN Occ. Rate: 0% CONS PROS Great location Impressive views of downtown Flex building Minimal parking Outdated interior and exterior Broadway Station II S Broadway Rent: $20.50/sf NNN Occ. Rate: 87% PROS CONS Immediate proximity to RTD Light Rail Highway signage Covered parking available Common space in need of updates Extensive traffic issues during typical rush hour times Broadway Station S Broadway Rent: $20.50/sf NNN Occ. Rate: 77% PROS CONS Immediate proximity to RTD Light Rail Highway signage Historic building Common space in need of updates Extensive traffic issues during typical rush hour times W Cedar Avenue Rent: $14.00/sf NNN Occ. Rate: 0% PROS Low rental rates Ample Parking New roof 201 Broadway Rent: $21-22/sf NNN Occ. Rate: 72% PROS Renovated Walkable neighborhood Surrounded by amenities 400 Santa Fe Drive Rent: $28.50/sf FS Occ. Rate: 80% PROS New building Full service lease In-house ownership 137 S Lincoln Street Rent: $18.00/sf NNN Occ. Rate: 100% PROS Flex building High ceilings Provides signage CONS Outdated building Low transit score CONS Minimal parking Low transit score CONS Difficult access Only small spaces available CONS Extremely outdated Minimal parking available 26

27 Lease Comparables Map

28 Denver, CO For more information please contact: Sam Crowe, Associate Jaimee Keene, MAI, Vice President avisonyoung.com 1801 California Street Suite 3750 Denver, CO Avison Young - Northern California, LTD. All rights reserved.
DENVER. Office Research Report. First Quarter Partnership. Performance.
 DENVER Office Research Report First Quarter 2018 Denver Market Facts 61,614 Jobs added in the last 12 months ending in February, a 4.1% increase in employment. 3.1% Unemployment in Denver, lower than the
Economic Overview DENVER INDUSTRIAL/FLEX MARKET MONITOR FIRST QUARTER Denver s industrial flex market vibrant during the first quarter.
 Economic Overview DENVER INDUSTRIAL/FLEX MARKET MONITOR FIRST QUARTER 2015 Denver s industrial flex market vibrant during the first quarter. The Denver industrial market has record high asking rental rates,
First Quarter 2017 Industrial Market Report. Chicago. Economic Overview
 Chicago Market Facts 5.3% Chicago s unemployment rate continued to trend downward. Recorded at 5.3% as of February 2017. 17 MSF The number of completed projects increased to 5.1 msf and projects currently
Chicago s industrial market thrives during the third quarter.
 CHICAGO INDUSTRIAL MARKET MONITOR THIRD QUARTER 2015 Chicago s industrial market thrives during the third quarter. Demand across the Chicago industrial market remains high sending absorption up and vacancy
Chicago s industrial market thrives during the second quarter.
 Economic Overview CHICAGO INDUSTRIAL MARKET MONITOR SECOND QUARTER 2015 Chicago s industrial market thrives during the second quarter. Demand across the Chicago industrial market remains high sending absorption
Monthly Market Snapshot
 SEPTEMBER 2018 Vacancy continues to fall. Nearing the end of the third quarter, the vacancy rate dropped 10 basis points to 6.4%, compared to this time last month at 6.5%. Occupancy of the 1.1 million
Has The Office Market Reached A Peak? Vacancy. Rental Rate. Net Absorption. Construction. *Projected $3.65 $3.50 $3.35 $3.20 $3.05 $2.90 $2.
 Research & Forecast Report OAKLAND METROPOLITAN AREA OFFICE Q1 Has The Office Market Reached A Peak? > > Vacancy remained low at 5. > > Net Absorption was positive 8,399 in the first quarter > > Gross
Summary. Houston. Dallas. The Take Away
 Page Summary The Take Away The first quarter of 2017 was marked by continued optimism through multiple Texas metros as job growth remained positive and any negatives associated with declining oil prices
Greater Los Angeles MARKETBEAT. Office Q Economy. Market Overview
 LOS ANGELES COUNTY Economic Indicators Market Indicators (Overall, All Classes) Overall Net Absorption / Overall Asking Rent Overall Vacancy Q4 15 Q4 16 Los Angeles Employment 4.3M 4.4M Los Angeles Unemployment
OFFICE MARKET ANALYSIS
 OFFICE MARKET ANALYSIS KYLE BROWN RMLS Fellow, Master of Real Estate Development Candidate Amid some encouraging signs nationally, the Portland office market has maintained its stability, with the CBD
The Upstate, South Carolina
 The Upstate, South Carolina Investment Progressing with Infrastructure and Manufacturing Expansions Following a trend started in 2015, net absorption remains positive, but has slowed pace in the last two
INDUSTRIAL QUICK STATS SUMMARY & OUTLOOK MARKET TRENDS VACANCY & NET ABSORPTION ECONOMIC STATS. Current Quarter. Direct Vacancy 2.
 ORANGE COUNTY INDUSTRIAL SECOND QUARTER 218 QUICK STATS Direct Vacancy 2.2% Overall Vacancy 2.5% Lease Rate NNN $.95 Gross Absorption Under Construction MARKET TRENDS Current Quarter 2,956,71 SF 1,367,18
Year-End 2017 / Office Market Report. Regional Economic Activity
 Year-End 207 / Office Market Report County Market Facts 27.6 MSF Total inventory in the County office market 793,46 SF Direct net absorption for 207.42% Overall Vacancy $43.36 PSF Average asking lease
Indianapolis MARKETBEAT. Office Q Economy. Market Overview INDIANAPOLIS OFFICE
 INDIANAPOLIS OFFICE Economic Indicators Market Indicators (Direct, All Classes) Direct Net Absorption/Direct Asking Rent 4-QTR TRAILING AVERAGE Direct Vacancy Q3 17 Q3 18 MSA Employment 1.05M 1.07M MSA
Postive Demand and Robust Leasing Fuels Tri-Cities Market
 Q4 215 office tri-cities market report Postive Demand and Robust Leasing Fuels Tri-Cities Market Market overview MARKET indicators - Q4 215 VACANCY 14.4% NET ABSORPTION 127,7 CONSTRUCTION 167,8 RENTAL
Research. Legal firms rightsizing leads to uptick in vacancy CLEVELAND 1Q16 OFFICE MARKET. Current Conditions
 Legal firms rightsizing leads to uptick in vacancy The Greater Cleveland office market started 2016 on a sour note, as the office sector gave back space for the first time in 12 months, ending the first
Negative Absorption Recorded For The First Time In Past Nine Quarters
 OFFICE SAN FERNANDO & VENTURA MARKET REPORT Negative Absorption Recorded For The First Time In Past Nine Quarters MARKET OVERVIEW MARKET INDICATORS - VACANCY 15.6% NET ABSORPTION -124,000 CONSTRUCTION
National Presence. Local Focus
 Metropolitan DC Market Overview 4Q 214 Overall Market Summary The Washington, DC Metropolitan commercial real estate market is comprised of approximately 41.9 million square feet of rentable office space
Market Report Q ///////// Orange County Industrial. ///////////////L o s A n g e l e s /////////////
 ///////////////L o s A n g e l e s ///////////// ///////////O r a n g e C o u n t y /////////// ////////////V e n t u r a ///////////////// ////////// I n l a n d E m p i r e //////////// Market Report
The Market Is Energized By Increased Development In Hollywood
 OFFICE CENTRAL LOS ANGELES MARKET REPORT The Market Is Energized By Increased Development In Hollywood MARKET OVERVIEW MARKET INDICATORS - VACANCY 20.5% NET ABSORPTION 24,100 CONSTRUCTION 574,000 RENTAL
Second Quarter: Suburban Maryland s Uptick in Leasing has yet to be Realized in Absorption Numbers
 Q2 2013 OFFICE SUBURBAN MARYLAND SUBURBAN MARYLAND MARKET REPORT Second Quarter: Suburban Maryland s Uptick in has yet to be Realized in Numbers Updated May 2012 MARKET INDICATIONS Q2 2013 Q3 2013 (p)
Market Report Q ///////// Los Angeles Industrial. ///////////////L o s A n g e l e s /////////////
 ///////////////L o s A n g e l e s ///////////// ///////////O r a n g e C o u n t y /////////// ////////////V e n t u r a ///////////////// ////////// I n l a n d E m p i r e //////////// Market Report
Suburban Maryland. Quarterly Market Report. 3rd Quarter lpcwashingtondc.com
 Suburban Maryland Quarterly Market Report Table of Contents Metropolitan D.C. Market Overview...3 Suburban Maryland Quarterly Overview...5 Suburban Maryland Top Leases... 8 Suburban Maryland Top Sales...
Broward County Office Market Report Third Quarter 2018
 Broward County Office Market Remains Steady Amid Rising Rental Rates Due to Job Growth and New Development Strong economic fundamentals continue to fuel Broward County's office market due to consistent
Greater Toronto Area Industrial Market Report
 3 RD QUARTER 15 Greater Toronto Area Industrial Report Partnership. Performance. Overview With the end of the third quarter, 15 is shaping up to be an incredible year for the Greater Toronto Area (GTA)
FOR SALE 140 N. BRENTWOOD CLAYTON, MO FOR SALE DOWNTOWN CLAYTON OPPORTUNITY LAND AVAILABLE FOR REDEVELOPMENT
 FOR SALE 140 N. BRENTWOOD CLAYTON, MO FOR SALE DOWNTOWN CLAYTON OPPORTUNITY LAND AVAILABLE FOR REDEVELOPMENT TABLE OF CONTENTS Section1 Section 2 Section 3 Section 4 Offering Summary Development Opportunity
MARKET WATCH SOUTHERN CALIFORNIA & PHOENIX
 SOUTHERN CALIFORNIA & PHOENIX COMMERCIAL REAL ESTATE MARKET FOURTH QUARTER 217 MARKET WATCH SOUTHERN CALIFORNIA & PHOENIX 1.888.659.DAUM WWW.DAUMCOMMERCIAL.COM D/AQ Corp. # 1129558 DAUM TABLE OF CONTENTS
>> Orange County Market Gains Positive Momentum
 Research & Forecast Report ORANGE COUNTY OFFICE Accelerating success. >> Orange County Market Gains Positive Momentum Key Takeaways > The Orange County office market saw positive demand for third quarter
2018 Greater Toronto Area Economic Outlook
 2018 Greater Toronto Area Economic Outlook 1 HIGHLIGHTS Although the Canadian economy performed exceptionally well in the first half of, posting GDP growth of approximately 4.0%, it has slowed since then
INDUSTRIAL QUICK STATS SUMMARY & OUTLOOK MARKET TRENDS VACANCY & NET ABSORPTION ECONOMIC STATS
 ORANGE COUNTY INDUSTRIAL FOURTH QUARTER 217 QUICK STATS Direct Vacancy 2.3% Overall Vacancy 2.7% Lease Rate NNN $.91 Gross Absorption Under Construction MARKET TRENDS Current Quarter 4,283,991 SF 963,138
Research. New product, high rents CLEVELAND 1Q16 INDUSTRIAL MARKET. Current Conditions
 New product, high rents The Greater Cleveland industrial market absorbed 556,046 square feet in the first quarter of 2016, the 14th consecutive quarter of positive tenancy gains for the market. The positive
MARKETBEAT INDUSTRIAL SNAPSHOT
 9.1 4.9 7.3 4.5 7. 1.3 8.1 1.3 1.7.3 msf MARKETBEAT INDUSTRIAL SNAPSHOT LAS VEGAS, NV A Cushman & Wakefield Alliance Research Publication Q1 215 ECONOMIC OVERVIEW The U.S. economy continued to add jobs
Indianapolis MARKETBEAT. Office Q Economy. Market Overview INDIANAPOLIS OFFICE
 INDIANAPOLIS OFFICE Economic Indicators Q2 17 Q2 18 MSA Employment 1.1M 1.1M MSA Unemployment 3.3% 3.0% U.S. Unemployment 4.3% 3. Market Indicators (Direct, All Classes) Q2 17 Q2 18 Total Market Vacancy
CoStar Office Statistics. M i d - Y e a r Denver Office Market
 CoStar Office Statistics M i d - Y e a r 2 0 1 7 Mid-Year 2017 Denver Table of Contents Table of Contents................................................................. A Methodology......................................................................
>> Negative Net Absorption Despite Completions
 Research & Forecast Report MID-COUNTIES INDUSTRIAL Accelerating success. >> Negative Net Absorption Despite Completions Key Takeaways > This quarter, 542,000 square feet of industrial space finished construction,
KEY TOWER SALE highlights start of 2017
 KEY TOWER SALE highlights start of 2017 Demand for office space in the Greater Cleveland office market remained strong as 2016 wound down and transitioned into the first quarter of 2017. After netting
Vacancy Inches Higher, Despite Continued Absorption
 Research & Forecast Report GREATER PHOENIX OFFICE 1Q 2017 Vacancy Inches Higher, Despite Continued Absorption Key Takeaways > > Improving conditions in the Greater Phoenix office market took a pause in
Homestretch: Office Market Set to Finish Strong
 Research & Forecast Report RENO OFFICE Q3 2016 Homestretch: Office Market Set to Finish Strong >> Vacancy drops significantly the largest drop quarter over quarter in 2016 >> Rental rates are not increasing
The Ridge Apartments $2,950, Units in the Chattanooga TN Market Area. Great Property Great Location. Asking Price:
 Great Property Great Location The Ridge Apartments 40 Units in the Chattanooga TN Market Area Asking Price: $2,950,000 3400 Lisa Dr & 3400 Gail Dr East Ridge, TN 37412 Recently renovated property in the
INDUSTRIAL QUICK STATS SUMMARY & OUTLOOK MARKET TRENDS VACANCY & NET ABSORPTION ECONOMIC STATS
 PHOENIX, ARIZONA INDUSTRIAL THIRD QUARTER 217 QUICK STATS Direct Vacancy 8.7% Overall Vacancy 9.% Lease Rate NNN $.54 Gross Absorption Under Construction MARKET TRENDS Current Quarter 5,991,128 SF 4,751,494
OFFICE MARKET ANALYSIS
 OFFICE MARKET ANALYSIS GEOFF FALKENBERG Oregon Association of Realtors Fellow The Urban Land Institute ranked Portland 11th in the nation among Markets to Watch for real estate investment in 2014. Jones
HOUSTON INDUSTRIAL MARKET
 REAL ESTATE OUTLOOK HOUSTON INDUSTRIAL MARKET FIRST QUARTER 217 Industrial Sector Continues Push Forward Flex Market Softening under Pressure from Office Market Availability OV E R V I E W Industrial gains
Broward County Office Market Report Year-End 2018
 Economic Incentives Foster Business Growth in Broward County as Significant Leasing Activity Takes Place in the CBD Broward County's office market continued to strengthen as strong leasing activity took
Caution: Vacancy Increases Ahead
 MARKET REPORT DISTRICT OF COLUMBIA OFFICE Fourth Quarter 2016 Caution: Vacancy Increases Ahead Market Indicators Q4 2016 2017 (Projected) NET Despite year-to-date negative absorption, the Washington, DC
Americas Office Trends Report
 AMERICAS OFFICE TRENDS REPORT Americas Office Trends Report Summary The overall national office market recovery slowed slightly in the first quarter of 2016 amid financial market volatility. However, as
Strong year continues with high-profile leasing; rents remain flat as new and returning space looms 10.0% 5.0%
 $ PSF Office May 2017 New York Monthly Market Update Strong year continues with high-profile leasing; rents remain flat as new and returning space looms Manhattan Class A asking rents Manhattan Class A
Industrial Real Estate Portfolio
 Industrial Real Estate Portfolio Portfolio Coverage Page 7 6565 Echo Avenue, Reno, NV Property Summary Address: Size (SF): Office Finish: HVAC Space: Year Built: 2003 Site Area: 6565 Echo Avenue Reno,
Pharma leasing boosts market, net absorption soars
 MARKETVIEW New Jersey Office, Q3 218 Pharma leasing boosts market, net absorption soars Leasing Activity 1.77 MSF Net Absorption Availability Rate 997,93 SF Average Asking Lease Rate 2.5% $26.34 PSF *Arrows
CAMBRIDGE OFFICE & LAB MARKET REPORT
 CAMBRIDGE OFFICE & LAB MARKET REPORT FOURTH QUARTER 2017 GLOBAL OFFICE AND LAB DESTINATION As Greater Boston s gateway market, Cambridge is a hub for intellectual capital, innovative minds and technological
Leasing strength concentrated in new assets
 MARKETVIEW Midtown Manhattan Office, Q4 216 Leasing strength concentrated in new assets Leasing Activity 4.25 MSF Net Absorption.62 MSF Availability Rate 11.8% Vacancy Rate 7.9% Average Asking Rent $8.18
First Quarter 2017 / Industrial Market Report. Market Overview
 Greater Toronto Area Market Facts 3.4% Availability rate in the Greater Toronto Area vs vacancy rate of 2.2% $6.53 PSF Average asking net rent in the Greater Toronto Area 18 Number of properties in the
>> 2016 Off to A Good Start for Tri-Cities
 Research & Forecast Report TRI-CITIES OFFICE Q1 216 Accelerating success. >> 216 Off to A Good Start for Tri-Cities Key Takeaways > The Tri-Cities office market saw vacancy decline for the seventh consecutive
Soaring Demand Drives US Industrial Market to New Heights
 Soaring Demand Drives US Industrial Market to New Heights Capitas (DIFC) Limited I June Issue: 2017 THIS ISSUE COVERS: The Amazon Factor a seismic shift in the way people shop Industrial real estate hitting
Chicago CBD. 4.1% Chicago s unemployment rate continued to trend downward, standing at 4.1% as of May 2017.
 Second Quarter 2017 Office Market Report Chicago CBD Market Facts 4.1% Chicago s unemployment rate continued to trend downward, standing at 4.1% as of May 2017. 34,400 jobs The Chicago metro area added
CoStar Office Statistics. Y e a r - E n d Denver Office Market
 CoStar Office Statistics Y e a r - E n d 2 0 1 6 Year-End 2016 Denver Table of Contents Table of Contents................................................................. A Methodology......................................................................
Market Report Q ///////// Inland Empire Industrial. ///////////////L o s A n g e l e s /////////////
 ///////////////L o s A n g e l e s ///////////// ///////////O r a n g e C o u n t y /////////// ////////////V e n t u r a ///////////////// ////////// I n l a n d E m p i r e //////////// Market Report
Quick Absorption of Newly Constructed Office Buildings
 Research & Forecast Report CHARLESTON, SC OFFICE Q3 2016 Quick Absorption of Newly Constructed Office Buildings Bryana Mistretta Research Coordinator South Carolina Key Takeaways >> The Interstate 526
OFFICE QUICK STATS SUMMARY & OUTLOOK MARKET TRENDS VACANCY & NET ABSORPTION ECONOMIC STATS
 LOS ANGELES CENTAL/SOUTHEAST OFFICE THIRD QUARTER 218 QUICK STATS Direct Vacancy 14.7% Overall Vacancy 15.2% Lease Rate FSG $3.16 Gross Absorption Under Construction MARKET TRENDS Change from Last Quarter
HOULIHAN LAWRENCE COMMERCIAL GROUP
 HOULIHAN LAWRENCE COMMERCIAL GROUP TH QUARTER EXECUTIVE SUMMARY FOURTH QUARTER Dear Clients, With behind us and the new year in full swing, we can now reflect, summarize and gain insight from the past
Strong Marketwide Leasing Activity Points To A Strong Finish for Tri-Cities
 OFFICE TRI-CITIES MARKET REPORT Strong Marketwide Leasing Activity Points To A Strong Finish for Tri-Cities MARKET OVERVIEW MARKET INDICATORS - VACANCY 14.9% NET ABSORPTION 254,6 CONSTRUCTION 113,8 RENTAL
Greater Toronto Area Industrial Market Report
 1 ST QUARTER 16 Greater Toronto Area Industrial Report Partnership. Performance. Overview The record-setting momentum felt through 15 in the Greater Toronto Area (GTA) industrial market showed signs of
Q PHOENIX OFFICE REPORT
 Q2 2018 PHOENIX OFFICE REPORT MARKET FUNDAMENTALS ANNUAL COMPARISON Q2 2018 Q2 2017 VACANCY 16.47% VACANCY 16.93% RENTAL RATES $25.43 RENTAL RATES $24.76 SF UNDER CONSTRUCTION 2.76 M SF UNDER CONSTRUCTION
First Quarter 2017 / Office Market Report. Orlando
 First Quarter 2017 / Office Market Report Orlando Market Facts 36.9 MSF Total office inventory in the Orlando office market 270,997 SF Direct net absorption for 1Q 2017 11.32% Overall Vacancy $25.57 PSF
Elati Street. Denver, CO OFFERING MEMORANDUM
 4230 Elati Street Denver, CO 80216 OFFERING MEMORANDUM TABLE OF CONTENTS 06 18 20 01 Executive Summary 02 Property Overview 03 Lease Details 04 Location & Market Overview 04 01 EXECUTIVE SUMMARY Executive
>> Hollywood Market Activity Flattens
 Research & Forecast Report Central Los Angeles OFFICE Q2 216 Accelerating success. >> Hollywood Market Activity Flattens Key Takeaways > There is currently 533,6 square feet () of office product under
Major tenant contractions and impending corporate development set the stage for 2014 and beyond
 Q1 2014 OFFICE MINNEAPOLIS-ST. PAUL OFFICE MARKET REPORT Major tenant contractions and impending corporate development set the stage for 2014 and beyond SF Absorbed Percent Vacant MARKET INDICATORS Q1
Second Quarter Industrial Market Report 2017
 Second Quarter Industrial Market Report 2017 03 04 04 04 05 06 08 09 10 11 13 Executive Summary National Economy Local Economy Oklahoma City Industrial Market Leasing Net Absorption and Inventory Rental
CHICAGO CBD OFFICE INVESTMENT PROPERTIES GROUP
 CHICAGO CBD OFFICE INVESTMENT PROPERTIES GROUP SECOND QUARTER NEWSLETTER 216 HOT TOPICS Capital markets remain a focus with 14 assets either under contract or sold totaling $2.6 billion, which includes
INDUSTRIAL QUICK STATS SUMMARY & OUTLOOK MARKET TRENDS VACANCY & NET ABSORPTION ECONOMIC STATS. Current Quarter. Direct Vacancy 2.
 LOS ANGELES NORTH INDUSTRIAL THIRD QUARTER 218 QUICK STATS Direct Vacancy 2.3% Overall Vacancy 2.6% Lease Rate NNN $1.1 Gross Absorption Under Construction MARKET TRENDS Current Quarter 1,632,564 SF 595,199
The Upstate, South Carolina
 The Upstate, South Carolina Office Market Experiences Negative Absorption The muchanticipated pullback in the market for Greenville office leasing has arrived. This is clearly demonstrated in the first
Greater Los Angeles MARKETBEAT. Office Q Economy. Market Overview
 LOS ANGELES COUNTY Economic Indicators Q2 16 Q2 17 Los Angeles Employment 4.38M 4.44M Los Angeles Unemployment 5.3% 4.4% U.S. Unemployment 4.9% 4.4% 12-Month Forecast Economy The job growth rate in Los
>> Orange County Vacancy Continues to Decline
 Research & Forecast Report ORANGE COUNTY OFFICE Accelerating success. >> Orange County Continues to Decline Key Takeaways > The South County submarket led the Orange County market in overall net absorption
>> Asking Rents Increase As Space Remains Limited
 Research & Forecast Report MID-COUNTIES INDUSTRIAL Accelerating success. >> Asking Rents Increase As Space Remains Limited Key Takeaways > Average asking rents increased $0.02 Per Square Foot (P) Triple
Multi-family Asset - 84 Units $7,000,000
 Multi-family Asset - 84 Units $7,000,000 1 Table of Contents I Executive Summary Property Overview 3 Property Details 4 Capital Improvements 5 Specifications 6 Amenities 7 II Financial Analysis 10 III
Office Market Continues to Improve
 Research & Forecast Report LAS VEGAS OFFICE Q3 2016 Office Market Continues to Improve > > Southern Nevada s office market is improving at a steady rate > > Net absorption has been positive in twelve of
Denver s Retail Sector Keeps Rolling 500, , , , , , , , ,000 50,000. Square Feet
 Research & Forecast Report METRO DENVER RETAIL Q4 2017 s Retail Sector Keeps Rolling Market Overview Net absorption finished the second half of 2017 with strong positive numbers from s Central and Northwest
>> Strong Sales Activity Persists in Second Quarter
 Research & Forecast Report TRI-CITIES OFFICE Q2 217 Accelerating success. >> Strong Sales Activity Persists in Second Quarter Key Takeaways > Overall vacancy in the Tri-Cities office market decreased in
CENTRE STREET
 Offering Memorandum 3945-51 CENTRE STREET San Diego, CA 92103 N O N - E N D O R S E M E N T A N D D I S C L A I M E R N O T I C E Non-Endorsements Marcus & Millichap is not affiliated with, sponsored by,
OFFICE MARKET ANALYSIS
 OFFICE MARKET ANALYSIS ALEC LAWRENCE Portland State University The fourth quarter finds the Portland office market nearing a sweet spot for developers. Strong absorption, decreasing vacancy, and increasing
Q / Quarterly Office Market Report. Silicon Valley
 / Quarterly Office Market Report Silicon Valley Market Facts Class A Vacancy 8.8% Class B Vacancy $4.68 FS Class A Average Asking Rate $4.09 FS Class B Average Asking Rate Market Overview Kicking off with
Washington, D.C. Quarterly Market Report. 2nd Quarter lpcwashingtondc.com
 Washington, D.C. Quarterly Market Report Table of Contents Washington, D.C. Leasing & Market Research Metropolitan D.C. Market Overview...3 Washington, D.C. Quarterly Overview...5 Washington D.C. Top Sales...
INDUSTRIAL QUICK STATS SUMMARY & OUTLOOK MARKET TRENDS VACANCY & NET ABSORPTION ECONOMIC STATS
 VENTURA COUNTY INDUSTRIAL FOURTH QUARTER 217 QUICK STATS Direct Vacancy 2.1% Overall Vacancy 2.4% Lease Rate NNN $.7 Gross Absorption Under Construction MARKET TRENDS Current Quarter 1,332,957 SF 774,362
The Upstate, South Carolina
 The Upstate, South Carolina Vacancy Down and Absorption Up The first quarter of 2018 ended on a rather remarkable note, posting the largest decrease in industrial vacancy in the last eight quarters. This
Chicago CBD. 4.7% Chicago s unemployment rate trended downward. As of November 2017, the unemployment rate stood at 4.7%.
 Fourth Quarter 2017 Office Market Report Chicago CBD Market Facts 4.7% Chicago s unemployment rate trended downward. As of November 2017, the unemployment rate stood at 4.7%. 31,678 jobs The metro Chicago
Columbus MARKETBEAT. Office Q2 2017
 COLUMBUS OFFICE Economic Indicators Market Indicators Q2 16 Q2 17 Unemployment 4.0% 3.9% Ohio Unemployment 5.0% 5.0% U.S. Unemployment 4.9% 4.4% Q2 16 Q2 17 Overall Vacancy 13.3% 13.4% 212K -80K Construction
OFFICE QUICK STATS SUMMARY & OUTLOOK MARKET TRENDS VACANCY & NET ABSORPTION ECONOMIC STATS
 LOS ANGELES SAN GABRIEL VALLEY OFFICE SECOND QUARTER 218 QUICK STATS Direct Vacancy 11.1% Overall Vacancy 11.4% Lease Rate FSG $2.32 Gross Absorption Under Construction MARKET TRENDS Current Quarter 345,68
MARKETBEAT Columbus. Office Q1 2018
 COLUMBUS OFFICE Economic Indicators Q1 17 Q1 18 Unemployment 4.1% 3.8% Ohio Unemployment 5.1% 4.6% U.S. Unemployment 4.7% 4.1% Market Indicators (Overall, All Classes) Q1 17 Q1 18 Overall Vacancy 12.2%
With Vacancy Low, Rents Pushing Higher
 Research & Forecast Report GREATER PHOENIX MULTIFAMILY 3Q 2 With Low, Pushing Higher Key Takeaways > > The Greater Phoenix multifamily market strengthened somewhat during the third quarter, with vacancy
MARKET INSIGHT LOUISVILLE, KENTUCKY MULTIFAMILY REPORT THIRD QUARTER 2017
 CUSHMAN & WAKEFIELD COMMERCIAL KENTUCKY LOUISVILLE MULTIFAMILY RESEARCH MARKET INSIGHT MULTIFAMILY REPORT THIRD QUARTER 217 The Cushman & Wakefield Commercial Kentucky Multifamily Research Team provides
Positive Net Absorption Recorded For The Ninth Consecutive Quarter
 OFFICE SAN FERNANDO & VENTURA MARKET REPORT Positive Net Absorption Recorded For The Ninth Consecutive Quarter MARKET OVERVIEW MARKET INDICATORS - VACANCY 15.2% NET ABSORPTION 116,700 CONSTRUCTION 120,933
>> New Construction Delivers to the Orange County Office Market
 Research & Forecast Report ORANGE COUNTY OFFICE Accelerating success. >> New Construction Delivers to the Orange County Office Market Key Takeaways > Three new office developments were delivered to the
INDUSTRIAL QUICK STATS SUMMARY & OUTLOOK MARKET TRENDS VACANCY & NET ABSORPTION ECONOMIC STATS
 INLAND EMPIRE INDUSTRIAL FOURTH QUARTER 217 QUICK STATS Direct Vacancy 5.1% Overall Vacancy 5.3% Lease Rate NNN $.57 Gross Absorption Under Construction MARKET TRENDS Current Quarter 9,23,744 SF 16,31,563
OFFICE MARKET ANALYSIS
 OFFICE MARKET ANALYSIS GEOFF FALKENBERG Oregon Association of Realtors Fellow In the U.S. and Oregon, the third quarter of 2013 saw office markets hit a plateau. Office deliveries are low, but the pipeline
TRANSWESTERN OUTLOOK DC AT Q1O8
 TRANSWESTERN OUTLOOK DC AT Q1O8 Even With Soft Office Absorption, Vacancy Remains Low; Rents Continue to Edge Up The District of Columbia s office market experienced steady conditions during the 1st quarter
Chicago CBD. 5.3% Chicago s unemployment rate continued to trend downward. As of August 2017, the unemployment rate stood at 5.3%.
 Third Quarter 2017 Office Market Report Chicago CBD Market Facts 5.3% Chicago s unemployment rate continued to trend downward. As of August 2017, the unemployment rate stood at 5.3%. 24,700 jobs The metro
RESEARCH VACANCY DOWN AS CBD PACES STEADY MARKET CLEVELAND 1Q18 OFFICE MARKET. Current Conditions. Market Analysis. Market Summary
 VACANCY DOWN AS CBD PACES STEADY MARKET The Greater Cleveland office market started 2018 on solid footing, as a modest amount of net positive absorption during the first quarter resulted in a decrease
H Street, NW Washington, DC
 471-473 H Street, NW Washington, DC OFFERING MEMORANDUM Buildings for Sale Penn Quarter/China town CONTENTS Offering Terms 3 Executive Summary 4 Property Summary 5 Floor Plans 6 Investment Highlights 7
Market Report Q ///////// Los Angeles Industrial. ///////////////L o s A n g e l e s /////////////
 ///////////////L o s A n g e l e s ///////////// ///////////O r a n g e C o u n t y /////////// ////////////V e n t u r a ///////////////// ////////// I n l a n d E m p i r e //////////// Market Report
RESEARCH & FORECAST REPORT
 Q3 2012 OFFICE LAS VEGAS NEVADA RESEARCH & FORECAST REPORT Office Forges Ahead Southern Nevada s office market continued to post positive net absorption in the third quarter of 2012, despite weak employment
Orange County Office Market Continues to Tighten Causing Rental Rates to Increase
 OFFICE ORANGE COUNTY MARKET REPORT Continues to Tighten Causing Rental Rates to Increase MARKET OVERVIEW MARKET INDICATORS - VACANCY 12.6% NET ABSORPTION 688,800 CONSTRUCTION 497,387 RENTAL RATE $2.26