Elati Street. Denver, CO OFFERING MEMORANDUM
|
|
|
- Lambert Fields
- 6 years ago
- Views:
Transcription


1 4230 Elati Street Denver, CO OFFERING MEMORANDUM
2


3 TABLE OF CONTENTS Executive Summary 02 Property Overview 03 Lease Details 04 Location & Market Overview 04


4 01 EXECUTIVE SUMMARY


5 Executive Summary Newmark Knight Frank, as exclusive agents for 4230 Elati Street, Denver, CO are pleased to offer a repurpose or full redevelopment opportunity just north of downtown Denver and LoHi, in the heart of Globeville Elati Street offers a 16,460 SF block & concrete building, on a 35,875 SF corner lot site one block from the 41st & Fox Street Light Rail stop. The property is prime for redevelopment or property repurpose because of its proximity to the 41st & Fox Light Rail stop and convenient bike access to downtown Denver and LoHi. The building, likely built in 1973, is a combination of block and twin-t construction, leaving much of the building clear span. Currently the property has 7 existing drive-in loading doors, as well as a large, fenced and paved yard. OFFERING SUMMARY Property Addresses: 4230 Elati Street, Denver, CO Building Square Footage: 16,460 SF, per county records (18,009 SF rentable square footage) Site Size: 0.82 acres (35,875 SF) Zoning: I-A (neighbors have been zoned up to C-RX-12) Date of Construction: Circa 1973 Sales Price: $3,500, Access to the site comes from the Park Avenue and Highway I-25 exit or directly from downtown Denver allowing excellent access to Sunnyside, LoHi, and RiNo, which are currently Denver s hottest markets. One block west of 4230 Elati is the 41st & Fox Light Rail stop, also known as the Goldline (G Line), which runs 11 miles west from Denver s Union Station out to Wheat Ridge, running through northwest Denver and Arvada. 5


6 02 PROPERTY OVERVIEW


7 PECOS ST Aerial View W 46TH AVE W 43RD AVE LIGHT RAIL STATION BROADWAY E 44TH AVE ELATI ST SHOSHONE ST W 38TH AVE LIPAN ST 6 W 36TH AVE LOWER HIGHLANDS GLOBEVILLE RD RIVER NORTH N 7
8 Property Overview Property Address: 4230 Elati Street, Denver, CO FLOOR PLANS County: Denver Building Square Footage: 16,460 SF, per county records (18,009 SF of rentable square footage) Acres: 0.82 acres (35,875 SF) Property Taxes: $23, (2016) Gas/Electric : Provider: Xcel, 400 amps, 3-phase power (to be verified) Water/Sewer: Public (Denver): 1 water line to building (commercial) Loading: Seven (7) Drive-In Doors, 10 T x 9 W Zoning: I-A (neighbors have been zoned up to C-RX-12) PROPERTY HIGHLIGHTS Excellent central location Walking distance to Light Rail stop Biking distance to downtown Denver Biking distance to 38th & LoHi amenities Corner Lot Regular shaped lot Large, fenced yard Expansive views of the city, RiNo and Front range Incredibly easy access to I-25 and I-70 Month to Month income in place 8

9 Property Overview SITE PLAN ELATI ST W 42ND AVE N 9
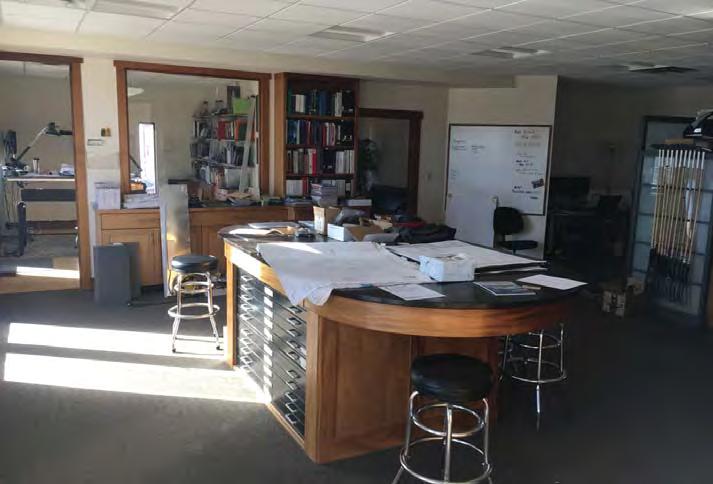
10 Property Photos 10

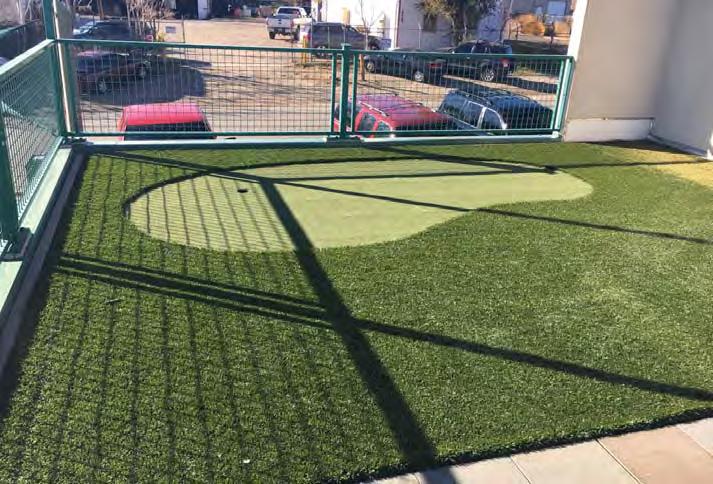
11 Property Photos Rooftop Terrace 11

12 Property Photos 12


13 Property Photos 13

14 Property Renderings 14

15 Property Renderings 15

16 Property Renderings 16

17 Property Renderings 17


18 03 LEASE DETAILS


19 Rent Roll 4230 Elati Street Renter Suite/Unit # Sq Ft* Current Monthly Rent Expire CMB** 200 1,900 12/31/2018 CMB** A & B 6,665 12/31/2018 CMB** Total 8,565 $4, Suite Conference Room Mike Hicks C 800 $ month-to-month Adams Artistic D,E & F 1,740 $1, month-to-month Lease expires Nov 2017 MN Painting Warehouse H & Parking 692 $ month-to-month Lease expired. New business name: Western Coatings Occu-Med $ month-to-month Lease expired Versa Freight 100 1,570 $1, month-to-month Rene Texture Parking 480 $ month/month LPC Construction $ month/month Lease expires Dec 2017 Hunter & Dieu 106 & $ month/month Lease expires Nov 2017 Total Sq Ft 15,333* Total Rents $9, * All Rentable square footage are estimates ** Note: CMB is owned by Seller entity and plan to vacate/terminate lease at Closing. 19


20 04 LOCATION & MARKET OVERVIEW

 and Interstate 25 (I-25). The neighborhood s eastern boundary is the South Platte River, offering the area a very scenic biking path.")
 district, which has become an international topic for real estate development.")
21 Location Overview GLOBEVILLE OVERVIEW The history of the Globeville neighborhood starts as far back as the late 1880 s when many Eastern Europeans moved to North Denver to work at the Globe Smelting & Refining Company, the railroad and packaging plants in the neighborhood. The area was platted in 1889 and incorporated as a town in Globeville was annexed into the City and County of Denver in The major landmark in the area is what Denver locals refer to as the mouse trap. The mouse trap is the junction between Interstate 70 (I-70) and Interstate 25 (I-25). The neighborhood s eastern boundary is the South Platte River, offering the area a very scenic biking path. Nowadays the area serves as one of Denver s hottest and most up-and-coming markets. It s just northwest of the River North (RiNo) district, which has become an international topic for real estate development. The Globeville area is about to begin its own transformation as well, from older, obsolete industrial into modern, residential, office, retail and lighter commercial uses. BROADWAY WASHINGTON ST 40TH & COLORADO RTD STOP S PLATTE RIVER RIVER RINO BLAKE & 38TH RTD STOP 40TH AVE N PARK AVE BRIGHTON BLVD DOWNING ST YORK ST RTD Light Rail A Line RTD Stop COLORADO BLVD
22 Market Trends 3Q 2017 Denver Industrial Market Trends # OF BUILDINGS TOTAL SF VACANT SF 3Q2017 VACANCY 3Q2016 VACANCY 3Q2017 ABSORPTION YTD ABSORPTION CENTRAL MARKET (TOTAL) ,154,938 1,485, % 5.54% 191, ,166 RENTAL RATES LOW RENTAL RATES HIGH RENTAL RATES MEDIAN Industrial Warehouse ,237,721 1,473, % 5.60% 159,586 83,248 $5.25 $10.50 $7.00 R&D / Flex ,217 11, % 3.59% 31,918 20,918 $7.50 $12.00 $8.50 3Q 2017 Denver Office Market Trends # OF BUILDINGS TOTAL SF VACANT SF 3Q2017 VACANCY 3Q2016 VACANCY 3Q2017 ABSORPTION YTD ABSORPTION RENTAL RATES LOW RENTAL RATES HIGH RENTAL RATES MEDIAN DOWNTOWN MARKET (TOTAL) ,814,345 4,260, % 15.57% 165, ,288 $33.62 Class A 53 18,739,269 2,912, % 16.74% 129, ,542 $34.00 $45.00 $39.00 Class B 55 7,056,286 1,049, % 13.22% -13,130-15,892 $24.00 $32.00 $30.30 Class C 36 2,018, , % 13.17% 48,325 54,638 $21.00 $26.00 $24.00 MIDTOWN MARKET (TOTAL) 68 5,683, , % 9.74% 5,541-44,418 $26.50 Class A 19 2,478, , % 10.55% 11,076-20,500 $31.00 $41.00 $36.63 Class B 24 2,110, , % 9.74% -3,882-32,521 $19.00 $30.00 $25.00 Class C 25 1,093,888 80, % 7.89% -1,653 8,603 $16.00 $24.00 $ Q 2017 Denver Retail Market Trends # OF BUILDINGS TOTAL SF VACANT SF 3Q2017 VACANCY 3Q2017 ABSORPTION YTD ABSORPTION MIDTOWN MARKET (TOTAL) 74 3,100, , % 12,770 97,301 RENTAL RATES LOW RENTAL RATES HIGH RENTAL RATES MEDIAN Small Strip 42 1,024,356 11, % 12,770 36,601 $20.00 $35.00 $28.00 Large Strip 4 744,900 6, % 0-1,000 $14.00 $37.00 $21.00 Sub-Regional 1 137, % 0 0 Super Regional % 0 0 Single-Tenant 27 1,194,435 99, % 0 61,700 22

23 Market Overview DENVER OVERVIEW 3Q2017 The third quarter of 2017 marked the Denver industrial market s twenty-third consecutive quarter of positive growth with net absorption of 1.7 million square feet, bringing year-to-date net absorption to 2.4 million square feet. Although this represented an increase from the third quarter net absorption of the previous year, the market returned to the previous trend of relying on new deliveries for absorption. Tenants occupying pre-leased space that delivered in the third quarter of 2017 accounted for 1.4 million square feet, slightly less than 80% of quarterly absorption. The delivery of three build-to-suits (BTS) along with moderate occupancy growth in second-generation buildings helped the overall vacancy rate drop to 4.9% from 5.2% in the prior quarter. Though vacancy dropped slightly, new deliveries that are not fully pre-leased still counter-balanced the limited amount of, and continued demand for, high-quality space. These two opposing forces are keeping rental rates stable at their current historic high. New construction was the driver behind the Industrial/Warehouse sector recording strong activity with absorption of 1.6 million square feet, accounting for nearly all of the total market absorption, with year-to-date absorption at 2.2 million square feet. It also propelled the East submarket to the strongest quarterly absorption at 1.3 million square feet, and the Central submarket to the second greatest quarterly absorption with 191,504 square feet. Five out of the seven submarkets recorded positive quarterly absorption, with four of them over 100,000 square feet. Even though the Southeast and Northwest submarkets had negative quarterly absorption, both still have positive year-to-date absorption. The Southwest is the only submarket to still have negative year-to-date absorption but experienced a turnaround in the third quarter, posting positive quarterly absorption for the first time after two quarters of negative. demand from the technology as well as food and drink sectors remains high, and these tenants are expected to continue to gobble up distribution space. The lowest median rental rates remain in the East submarket, at $5.50 NNN/SF for Industrial/Warehouse. The West submarket has the lowest vacancy rate for Industrial/ Warehouse and commands the highest median rental rate at $9.00 NNN/SF. The highest median asking rates for R&D/Flex space continue to be in the Southeast submarket, at $11.00 NNN/SF. All submarkets except the Northwest and Southwest have seen increases in median rental rates compared to the second quarter of 2016; none of have seen any decrease. Looking ahead, expect further positive absorption in the final quarter of 2017, although not as high as third quarter. Vacancy will also inch upward, as not all of the large buildings scheduled to deliver are entirely pre-leased. Vacancy will not exceed far over 5.0%, however, as the newly built space is expected to encounter strong tenant demand. Construction is likely to slow from its peak this year, not because of a lack of interest but because of a shortage of available land, continued high construction costs and the recent hurricanes pulling construction business south to exacerbate the current shortage of skilled labor. These will delay new projects from commencing until the supply pipeline and new deliveries ease. The projects currently under construction will still provide high-quality options for large tenants looking to expand in the market as well as to keep rental rates stable. However, the lower end of rental rates will begin to rise as owners feel out how much they can push rates for tenants who don t want new or high quality space. The constrained vacancy and high rental rates will keep sales activity strong for the foreseeable future. Rental rates remained mostly unchanged in the second quarter of 2017, where they plateaued after reaching record highs. The persistence of historically high rental rates despite the slow increase in vacancy since 2015 has been putting strain on some tenants, particularly tenants whose leases are about to come due, as they are facing drastically higher prices than when they had originally signed their leases. Along with an increased cost of doing business, a lack of qualified workers in construction and many retailers struggling with increased competition from online retail giants, some mid-sized tenants are choosing to close their businesses. The majority of the singletenant move-outs this quarter was concentrated in the 10,000 to 25,000-square-foot range and driven by businesses leaving the market, as opposed to relocating or shrinking. However, small and large-sized tenants are still plentiful in the market; 23

24 Market Overview OTHER THIRD QUARTER HIGHLIGHTS INCLUDE: TOTAL INDUSTRIAL MARKET BALANCE The Denver industrial market is continuing to expand following explosive inventory growth in Development is focused on both speculative construction and 6,000, % BTS projects. The continued interest from future tenants has kept developers confidence high despite the slight slowdown of pre-leasing. Eighteen additional 4,500, % buildings totaling 2.4 million square feet broke ground in the third quarter; all are scheduled to deliver over the course of ,000, % The delivery of new industrial space continued strong in the third quarter of Following fourteen buildings delivered in the second quarter of 2017, four buildings were completed in the third quarter for a total of 1.4 million square Square Feet 1,500, % feet. The new deliveries included the 1.0 million-square-foot Amazon Fulfillment Center that was occupied completely upon delivery. Two other build-to-suits were delivered and fully occupied. This puts the market on track to have a record 0 2.0% breaking year. The sales volume through the third quarter of 2017 totaled $490.6 million with 5.5 million square feet of space traded. Sales activity continued to be a sellers market, with high demand and limited options. The sales volume for 2016 totaled $656.3 million with 7.0 million square feet of space traded based on sales transactions valued over $3 million. The annual sales volumes for the past three years have surpassed the numbers posted at the previous peak in 2007, when sales volume exceeded $500 million. -1,500, Q17 Source: Newmark Grubb Knight Frank Research Supply Absorption Vacancy 0.0% The Denver industrial market is faring better than many other markets across the nation. The vacancy rate for the Denver market increased to 4.9% in the third quarter, still lower than the U.S. rate at 5.0%. 24

25 Market Overview CENTRAL SUBMARKET HIGHLIGHTS 3Q2017 The Central submarket posted the second highest quarterly absorption with 191,504 square feet. After negative absorption in the first quarter of 2017 and flat absorption in the second, the third quarter helped bring it to 104,166 square feet year-to-date. The vacancy rate dropped in the third quarter to 5.3% that was also down year-over-year from 5.5%. The Industrial/Warehouse sector contains nearly 97% of the total space in the Central submarket. 1,000, , ,000 CENTRAL INDUSTRIAL MARKET BALANCE 8.0% 7.0% 6.0% The Central submarket is expected to experience significant upheaval in the coming years. As industrial neighborhoods are redeveloped by developers looking to capitalize on settings that feel unique compared with traditional downtown office space, the industrial base of the Central market has slowly diminished. This quarter, Delgany Street began renovations to be converted into office space; all of the tenants vacated last quarter as their leases ran out without the option to renew. Six buildings have sold for redevelopment so far in 2017, following eighteen over the course of This is in addition to ten buildings that were demolished in 2013, three in 2014, followed by three more in 2015 along with one renovated to retail. The RiNo neighborhood, which contains nearly 5.5 million square feet of industrial product, is expected to be significantly converted or demolished for retail, office and multihousing buildings. The planned expansions of both I-70 and the National Western Complex have already begun to demolish current industrial space as well. With limited quality vacant space available, the displaced tenants of those buildings either have to move east, where the majority of the new construction is underway, or pay a premium to remain in the submarket. The submarket has often been heavily influenced by large single-building changes. After J&K Cabinet relocated to the East submarket in the first quarter and Amazon occupying 85,857 square feet at 480 East 55th Avenue in the second quarter was offset by all the tenants in Delgany Street vacating, the trend finally turned in the submarket s favor in the third quarter. Mattress Firm s 110,000-square-foot expansion at 5333 North Bannock Street helped push the absorption up without any large move-out to counter it. Deck building company Bison Innovative Products occupied the remaining 98,140 square feet at 701 Osage Street. The 330,000-square-foot warehouse is now fully occupied for the first time since Sears vacated the entire building in the third quarter of White Cap Construction and Ryder Logistics also occupy space in the building. Sqaure Feet 250, , , , Q17 Source: Newmark Knight Frank Research Supply Absorption Vacancy 5.0% 4.0% 3.0% 2.0% 1.0% 0.0% 25
26 Demographics 1 MILE RADIUS 3 MILE RADIUS 5 MILE RADIUS 2017 HOUSEHOLD SIZE Average Household Size HOUSEHOLD INCOME TREND 2017 Median Income $43,096 $55,513 $53, Median Income $46,712 $59,924 $56,910 Median Income Change 2000 to % 79.4% 46.9% Median Income Change 2010 to % 36.4% 23.8% Median Income Change 2017 to % 7.9% 7.0% HOUSING UNITS OVERVIEW 2017 HOME VALUE Median Home Value $235, $292, $253, Average Home Value $266, $338, $335, OCCUPANCY Total Households 4,593 71, ,542 Owner Occupied 41.7% 40.3% 46.2% Renter Occupied 58.3% 59.7% 53.8% 26


27 Traffic Counts Main Street Cross Street Count Year Cars Per Day Volume Type Miles from Subject Prop. 1 Fox Street West 44th Ave ,559 MPSI 0.2 miles northwest 2 Interstate 70 Interstate ,131 MPSI 0.5 miles north and east 3 Interstate 25 W. 44th Ave ,794 MPSI 0.5 miles east 4 Interstate 70 E. 46th Ave ,705 MPSI 1.9 miles northeast 5 Fox Street W. 39th Ave ,689 MPSI 0.5 miles south 6 Pecos Street W. 39th Ave ,470 MPSI 1.0 miles southwest 27
28 Daytime Employment Report 1 MILE RADIUS BUSINESSES EMPLOYEES BUSINESS EMPLOYMENT BY TYPE # OF BUSINESSES % OF BUSINESSES # OF EMPLOYEES % OF EMPLOYEES TOTAL BUSINESSES 1,002 11,540 Agriculture & Mining % 170 / 1.5% Construction % 1, % Manufacturing % 2, % Transportation % % Communication 7 0.7% % Utility 3 0.3% % Wholesale Trade % 1, % Retail Trade % 1, % Finance, Insurance, Real Estate % % Hotels & Lodging 6 0.6% % Automotive Services % % Motion Pictures & Amusements % % Health Services % % Legal Services 8 0.8% % Education Institutions & Libraries % % Other Services % 2, % Government 8 0.8% % Unclassified Establishments % % 28

29 29


30 4230 Elati Street INVESTMENT & LEASING ADVISORS Russell Gruber Managing Director Larimer Street, Suite 1700 Denver, CO Procuring broker shall only be entitled to a commission, calculated in accordance with the rates approved by our principal only if such procuring broker executes a brokerage agreement acceptable to us and our principal and the conditions as set forth in the brokerage agreement are fully and unconditionally satisfi ed. Although all information furnished regarding property for sale, rental, or fi nancing is from sources deemed reliable, such information has not been verifi ed and no express representation is made nor is any to be implied as to the accuracy thereof and it is submitted subject to errors, omissions, change of price, rental or other conditions, prior sale, lease or fi nancing, or withdrawal without notice and to any special conditions imposed by our principal. 2017, Newmark Grubb Knight Frank.
HISTORICAL VACANCY VS RENTS. Downtown Los Angeles Office Market Q Q RENTS VACANCY $31 2Q10 2Q11 2Q12 2Q13 2Q14
 www.colliers.com/losangeles OFFICE LOS ANGELES MARKET REPORT Rate Decrease Below 20% As Market Activity Remains Flat MARKET OVERVIEW MARKET INDICATORS - VACANCY 19.5% The Downtown Los Angeles market in
Research. New product, high rents CLEVELAND 1Q16 INDUSTRIAL MARKET. Current Conditions
 New product, high rents The Greater Cleveland industrial market absorbed 556,046 square feet in the first quarter of 2016, the 14th consecutive quarter of positive tenancy gains for the market. The positive
1211 EAST WASHINGTON FOR SALE. Full City Block Purchase Opportunity Adjacent to the Fashion & Arts Districts, 10 Fwy and Metro Blue Line
 1211 EAST FOR SALE Full City Block Purchase Opportunity Adjacent to the Fashion & Arts s, 10 Fwy and Metro Blue Line 1211 EAST EXECUTIVE SUMMARY Newmark Grubb Knight Frank (NGKF), as exclusive advisor,
Monthly Market Snapshot
 SEPTEMBER 2018 Vacancy continues to fall. Nearing the end of the third quarter, the vacancy rate dropped 10 basis points to 6.4%, compared to this time last month at 6.5%. Occupancy of the 1.1 million
The Market Is Energized By Increased Development In Hollywood
 OFFICE CENTRAL LOS ANGELES MARKET REPORT The Market Is Energized By Increased Development In Hollywood MARKET OVERVIEW MARKET INDICATORS - VACANCY 20.5% NET ABSORPTION 24,100 CONSTRUCTION 574,000 RENTAL
DENVER. Office Research Report. First Quarter Partnership. Performance.
 DENVER Office Research Report First Quarter 2018 Denver Market Facts 61,614 Jobs added in the last 12 months ending in February, a 4.1% increase in employment. 3.1% Unemployment in Denver, lower than the
FOR SALE Franklin St. OFFERING MEMORANDUM Franklin St. Denver, CO CONTACT: TIM FINHOLM SAM LEGER
 FOR SALE 3801 Franklin St. 3801 Franklin St. Denver, CO 80205 OFFERING MEMORANDUM CONTACT: SAM LEGER EXECUTIVE VICE PRESIDENT 303.512.1159 sleger@uniqueprop.com TIM FINHOLM EXECUTIVE VICE PRESIDENT 303.512.1161
>> Asking Rents Increase As Space Remains Limited
 Research & Forecast Report MID-COUNTIES INDUSTRIAL Accelerating success. >> Asking Rents Increase As Space Remains Limited Key Takeaways > Average asking rents increased $0.02 Per Square Foot (P) Triple
Vacancy Inches Higher, Despite Continued Absorption
 Research & Forecast Report GREATER PHOENIX OFFICE 1Q 2017 Vacancy Inches Higher, Despite Continued Absorption Key Takeaways > > Improving conditions in the Greater Phoenix office market took a pause in
Chicago s industrial market thrives during the second quarter.
 Economic Overview CHICAGO INDUSTRIAL MARKET MONITOR SECOND QUARTER 2015 Chicago s industrial market thrives during the second quarter. Demand across the Chicago industrial market remains high sending absorption
KEY TOWER SALE highlights start of 2017
 KEY TOWER SALE highlights start of 2017 Demand for office space in the Greater Cleveland office market remained strong as 2016 wound down and transitioned into the first quarter of 2017. After netting
FOR SALE. ±38,295 SF Office/Flex Space. c o r p o r at e c e n t e r & 9323 Chesapeake Drive San Diego, Ca 92111
 FOR SALE c o r p o r at e c e n t e r ±38,295 SF Office/Flex Space 9303 & 9323 Chesapeake Drive San Diego, Ca 92111 www.ngkf.com PAUL BRITVAR Associate Director 858.875.3609 pbritvar@ngkf.com CA RE License
INDUSTRIAL QUICK STATS SUMMARY & OUTLOOK MARKET TRENDS VACANCY & NET ABSORPTION ECONOMIC STATS
 PHOENIX, ARIZONA INDUSTRIAL THIRD QUARTER 217 QUICK STATS Direct Vacancy 8.7% Overall Vacancy 9.% Lease Rate NNN $.54 Gross Absorption Under Construction MARKET TRENDS Current Quarter 5,991,128 SF 4,751,494
Leasing strength concentrated in new assets
 MARKETVIEW Midtown Manhattan Office, Q4 216 Leasing strength concentrated in new assets Leasing Activity 4.25 MSF Net Absorption.62 MSF Availability Rate 11.8% Vacancy Rate 7.9% Average Asking Rent $8.18
NEW CLASS A INDUSTRIAL MANUFACTURING CAMPUS
 Placentia Ave W Placentia Ave 215 NEW CLASS A E Rider St N Perris Blvd W Rider St PERRIS COMMERCE CENTER FOR SALE OR LEASE NEW +/- 7,755 SQ. FT. BUILDING DON ARCHER VICE PRESIDENT 909 243 7600 TEL 714
Market Research. Market Indicators
 colliers international LAS VEGAS, NV Market Research OFFICE Third Quarter 2009 Market Indicators Net Absorption Construction Rental Rate Q3-09 Q4-2009 Projected Clark County Economic Data Jul-09 Jul-08
Chicago s industrial market thrives during the third quarter.
 CHICAGO INDUSTRIAL MARKET MONITOR THIRD QUARTER 2015 Chicago s industrial market thrives during the third quarter. Demand across the Chicago industrial market remains high sending absorption up and vacancy
FOURTH QUARTER 2013 LEASING ACTIVITY CONTINUES TO BE BETTER THAN EXPECTED MARYLAND OFFICE MARKET REPORT MARKET SUMMARY ABSORPTION
 Q4 2013 MARYLAND OFFICE MARYLAND OFFICE MARKET REPORT FOURTH QUARTER 2013 LEASING ACTIVITY CONTINUES TO BE BETTER THAN EXPECTED MARKET SUMMARY Updated April 2013 MARKET INDICATORS Q4 2013 Q1 2014* VACANCY
100% OCCUPIED - 2 TENANT INDUSTRIAL INVESTMENT. Sun MCLEOD BUSINESS CENTER E. Post Road, Las Vegas, Nevada Commercial Real Estate, Inc.
 0% OCCUPIED - TENANT INDUSTRIAL INVESTMENT Sun Commercial Real Estate, Inc. MCLEOD BUSINESS CENTER 70 E. Post Road, Las Vegas, Nevada 890 Contact Team Lisa Hauger Senior Vice President 70-968-7333 LisaH@suncommercialre.com
Leasing focused on new construction; renewals up
 MARKETVIEW Midtown Manhattan Office, Q3 216 Leasing focused on new construction; renewals up Leasing Activity 3.96 MSF Net Absorption (.86) MSF Availability Rate 12.1 Vacancy Rate 7.9 Average Asking Rent
Indianapolis MARKETBEAT. Office Q Economy. Market Overview INDIANAPOLIS OFFICE
 INDIANAPOLIS OFFICE Economic Indicators Q2 17 Q2 18 MSA Employment 1.1M 1.1M MSA Unemployment 3.3% 3.0% U.S. Unemployment 4.3% 3. Market Indicators (Direct, All Classes) Q2 17 Q2 18 Total Market Vacancy
100% LEASED INDUSTRIAL BUILDING TOTALING 181,486 SF S. RIVERSIDE DR. MODESTO, CA
 100% LEASED INDUSTRIAL BUILDING TOTALING 181,486 SF 107 S. RIVERSIDE DR. MODESTO, CA EXECUTIVE SUMMARY Newmark Knight Frank is pleased to present the opportunity to purchase a 100% leased industrial building
An Offering Memorandum for AGAVE BUSINESS PARK
 OFFERING PROPERTY SUMMARY RETAIL AMENITIES AERIALS DEVELOPMENT HIGHLIGHTS POTENTIAL SITE PLANS MARKET STATISTICS HOME An Offering Memorandum for BUSINESS PARK A rare infill development opportunity located
MARKET WATCH SOUTHERN CALIFORNIA & PHOENIX
 SOUTHERN CALIFORNIA & PHOENIX COMMERCIAL REAL ESTATE MARKET FOURTH QUARTER 217 MARKET WATCH SOUTHERN CALIFORNIA & PHOENIX 1.888.659.DAUM WWW.DAUMCOMMERCIAL.COM D/AQ Corp. # 1129558 DAUM TABLE OF CONTENTS
Strong Absorption Drives Down Vacancy to Start 2017
 Research & Forecast Report GREATER PHOENIX INDUSTRIAL 2017 Strong Absorption Drives Down to Start 2017 Key Takeaways >> Industrial vacancy in Greater Phoenix dipped below 10 percent in the first quarter,
Nashville the #5 Market to Watch in 2019
 Research & Forecast Report NASHVILLE INDUSTRIAL 4 th Quarter Nashville the #5 Market to Watch in 2019 Industrial Market The industrial real estate sector is currently undergoing one of the greatest expansionary
Metropolitan Milwaukee Office Market Report Third Quarter 2015
 Metropolitan Milwaukee Office Market Report Third Quarter 2015 RETAIL OFFICE INDUSTRIAL LAND INVESTMENT NAI MLG COMMERCIAL 414 347 9400 757 N BROADWAY, SUITE 700, MILWAUKEE, WI 53202 MLGCOMMERCIAL.COM
Summary. Houston. Dallas. The Take Away
 Page Summary The Take Away The first quarter of 2017 was marked by continued optimism through multiple Texas metros as job growth remained positive and any negatives associated with declining oil prices
Industrial Market Closes 2017 on an Upswing
 Research & Forecast Report GREATER PHOENIX INDUSTRIAL Industrial Market Closes on an Upswing Key Takeaways > > The Greater Phoenix industrial market finished off a year of robust tenant demand with a strong
Indianapolis MARKETBEAT. Office Q Economy. Market Overview INDIANAPOLIS OFFICE
 INDIANAPOLIS OFFICE Economic Indicators Market Indicators (Direct, All Classes) Direct Net Absorption/Direct Asking Rent 4-QTR TRAILING AVERAGE Direct Vacancy Q3 17 Q3 18 MSA Employment 1.05M 1.07M MSA
OFFERING MEMORANDUM LONG TERM INDUSTRIAL, OFFICE AND FLEX PORTFOLIO SALE LEASEBACK
 LONG TERM INDUSTRIAL, OFFICE AND FLEX PORTFOLIO SALE LEASEBACK Main Buiding 2917 Latoria Street, Franklin Park STREAM Capital Partners, LLC License No.: 481.012052 Lic: 475.017525 Lic: 475.152062 TABLE
Caution: Vacancy Increases Ahead
 MARKET REPORT DISTRICT OF COLUMBIA OFFICE Fourth Quarter 2016 Caution: Vacancy Increases Ahead Market Indicators Q4 2016 2017 (Projected) NET Despite year-to-date negative absorption, the Washington, DC
3 RD QUARTER 2016 RICHMOND INDUSTRIAL MARKET REPORT
 3 RD QUARTER 2016 RICHMOND INDUSTRIAL MARKET REPORT FORECAST The Richmond Industrial market continued trending in the positive direction in the third quarter, with the absorption of over 320,000 square
Pikes Peak area housing Market Statistics (As of: 9/30/2018)
") $156,25 $184, $174,697 $177,2 $21,53 $185,83 $173, $178,29 $172,25 $212,75 $21,95 $226,692 $197,5 $199, $196, $28, $25, $223,95 $216,75 $29,527 $234,9 $218,82 $229,74 $235,518 $231,457 $255, $259,11 $269,98
$156,25 $184, $174,697 $177,2 $21,53 $185,83 $173, $178,29 $172,25 $212,75 $21,95 $226,692 $197,5 $199, $196, $28, $25, $223,95 $216,75 $29,527 $234,9 $218,82 $229,74 $235,518 $231,457 $255, $259,11 $269,98
>> Vacancy Falls To Lowest Rate Ever
 Research & Forecast Report San Gabriel VALLEY INDUSTRIAL Accelerating success. >> Vacancy Falls To Lowest Rate Ever Key Takeaways Market Indicators Relative to prior period Forecast Construction Rental
OFFICE MARKET ANALYSIS:
 OFFICE MARKET ANALYSIS: DAVID WEST RMLS Fellow Certificate of Real Estate Development Student Masters of Urban and Regional Planning Candidate While the Portland office market continues the slow recovery
Market Research. Market Indicators
 colliers international LAS VEGAS, NV Market Research OFFICE Second Quarter 2009 Market Indicators Net Absorption Construction Rental Rate Q2-09 Q3-2009 Projected Clark County Economic Data UNEMPLOYMENT
17th Annual Real Estate Review & Forecast
 2017 17th Annual Real Estate Review & Forecast This Year s Sponsors Member FDIC Construction: Review & Forecast 2017 Page 2 Permits Issued 142 New Commercial Construction Permits issued for all Elkhart
Market Research. OFFICE First Quarter 2010
 colliers international LAS VEGAS, NV Market Research OFFICE First Quarter 2010 Market Indicators Net Absorption Construction Rental Rate Q1-10 Q2-2010 Projected Clark County Economic Data Jan-10 Jan-09
Office Market Continues to Improve
 Research & Forecast Report LAS VEGAS OFFICE Q3 2016 Office Market Continues to Improve > > Southern Nevada s office market is improving at a steady rate > > Net absorption has been positive in twelve of
FOR SALE PROPERTY BROCHURE. Excellent, High Image Corporate Headquarters/Distribution Facility E 40th Avenue Aurora, CO CONTACT:
 FOR SALE 155,775 SF Class A Office Warehouse On 9.3 Acres 18245 E 40th Avenue Aurora, CO 80011 Excellent, High Image Corporate Headquarters/Distribution Facility PROPERTY BROCHURE CONTACT: GREG KNOTT EXECUTIVE
East Los Angeles Flex Office with Abundant Parking For Sale 5128 VALLEY BOULEVARD & 2262 BEATIE PLACE LOS ANGELES, CA 90032
 East Los Angeles Flex Office with Abundant Parking For Sale 5128 VALLEY BOULEVARD & 2262 BEATIE PLACE LOS ANGELES, CA 90032 Colliers Brokerage NATHAN PELLOW Executive Vice President License No. 01215721
Toronto Central strengthens its position as market with lowest office vacancy in North America
 MARKETVIEW Toronto Office MarketView, Q3 2016 Toronto Central strengthens its position as market with lowest office vacancy in North America GTA Vacancy Rate 9.1% GTA Asking Net Rental Rate $17.72 PSF
Leasing cools, but deal flow consistent
 MARKETVIEW Downtown Manhattan Office, Q3 216 Leasing cools, but deal flow consistent Leasing Activity.85 MSF Net Absorption (.12) MSF Availability Rate 11.7 Vacancy Rate 9.3 Average Asking Rent $57.5 PSF
INVESTOR OR USER OPPORTUNITY. 611 S. Palmetto Avenue, Ontario ±107,754 SF Industrial Building
 INVESTOR OR USER OPPORTUNITY 611 S. Palmetto Avenue, ±107,754 SF Industrial Building INVESTOR OR USER OPPORTUNITY 611 S. Palmetto Avenue ±107,754 SF Industrial Building Table of Contents: Property Information
3 RD QUARTER 2015 RICHMOND INDUSTRIAL MARKET REPORT
 3 RD QUARTER FORECAST As the U.S. economy continued to show positive economic growth through the third quarter, the Richmond, VA Industrial market saw demand for warehouse and flex properties increase
Economic Overview DENVER INDUSTRIAL/FLEX MARKET MONITOR FIRST QUARTER Denver s industrial flex market vibrant during the first quarter.
 Economic Overview DENVER INDUSTRIAL/FLEX MARKET MONITOR FIRST QUARTER 2015 Denver s industrial flex market vibrant during the first quarter. The Denver industrial market has record high asking rental rates,
CHICAGO CBD OFFICE INVESTMENT PROPERTIES GROUP
 CHICAGO CBD OFFICE INVESTMENT PROPERTIES GROUP SECOND QUARTER NEWSLETTER 216 HOT TOPICS Capital markets remain a focus with 14 assets either under contract or sold totaling $2.6 billion, which includes
>> Negative Net Absorption Despite Completions
 Research & Forecast Report MID-COUNTIES INDUSTRIAL Accelerating success. >> Negative Net Absorption Despite Completions Key Takeaways > This quarter, 542,000 square feet of industrial space finished construction,
Industrial Market Review
 Q3 2013 industrial Stockton San JoAquin County, California research & forecast Report Industrial Market Review Amazon s Completed Facility Helps Balance the Market The San Joaquin County industrial real
Strong year continues with high-profile leasing; rents remain flat as new and returning space looms 10.0% 5.0%
 $ PSF Office May 2017 New York Monthly Market Update Strong year continues with high-profile leasing; rents remain flat as new and returning space looms Manhattan Class A asking rents Manhattan Class A
VALUE ADD INFILL RETAIL 2870 & 2864 COLORADO BOULEVARD DENVER, CO 80207
 VALUE ADD INFILL RETAIL 2870 & 2864 COLORADO BOULEVARD DENVER, CO 80207 One Broadway, Suite 300A Denver, CO 80203 303.962.9555 www.pinnaclerea.com Chris Student 303.962.9575 Jules Hochman 303.962.9533
Orange County Multifamily
 MARKET REPORT / Orange County Multifamily Employment Gains Driving Rental Demand, Low Vacancy Rates More than 2,600 units have come online to this point in, and nearly 5,000 apartments are currently under
Slow Start to the Year as Hollywood Awaits Construction Deliveries
 office CENTRAL LOS ANGELES market report Slow Start to the Year as Hollywood Awaits Construction Deliveries Market overview MARKET indicators - VACANCY 19.1% NET ABSORPTION 24,300 CONSTRUCTION 1,242,600
>> 2016 Off to A Good Start for Tri-Cities
 Research & Forecast Report TRI-CITIES OFFICE Q1 216 Accelerating success. >> 216 Off to A Good Start for Tri-Cities Key Takeaways > The Tri-Cities office market saw vacancy decline for the seventh consecutive
No Where To Grow. ALBUQUERQUE, NM Q Retail. Research & Forecast Report. Key Takeaways. Market Indicators Relative to prior period
 Research & Forecast Report ALBUQUERQUE, NM Q2 20 Retail No Where To Grow Key Takeaways > > Supply of anchor spaces becoming scarce > > Renovations help to alleviate lack of new projects > > New projects
Industrial Real Estate Portfolio
 Industrial Real Estate Portfolio Portfolio Coverage Page 7 6565 Echo Avenue, Reno, NV Property Summary Address: Size (SF): Office Finish: HVAC Space: Year Built: 2003 Site Area: 6565 Echo Avenue Reno,
Orange County Office Market Continues A Positive Stride Into 2016
 OFFICE ORANGE COUNTY MARKET REPORT Continues A Positive Stride Into 2016 MARKET OVERVIEW MARKET INDICATORS - VACANCY 12.8% NET ABSORPTION 143,900 CONSTRUCTION 594,300 RENTAL RATE $2.31 P FSG UNEMPLOYMENT
Has The Office Market Reached A Peak? Vacancy. Rental Rate. Net Absorption. Construction. *Projected $3.65 $3.50 $3.35 $3.20 $3.05 $2.90 $2.
 Research & Forecast Report OAKLAND METROPOLITAN AREA OFFICE Q1 Has The Office Market Reached A Peak? > > Vacancy remained low at 5. > > Net Absorption was positive 8,399 in the first quarter > > Gross
Las Vegas Valley Executive Summary
 ARROYO MARKET SQUARE Las Vegas Valley Executive Summary Retail Market 4th Quarter 2013 THE DISTRICT AT GREEN VALLEY RANCH January 23, 2014 Re: Commercial Real Estate Survey: 4th Quarter, 2013 Dear Reader,
OFFICE QUICK STATS SUMMARY & OUTLOOK MARKET TRENDS VACANCY & NET ABSORPTION ECONOMIC STATS
 INLAND EMPIRE OFFICE THIRD QUARTER 217 QUICK STATS Direct Vacancy 11.4% Overall Vacancy 11.7% Lease Rate FSG $1.83 Gross Absorption Under Construction MARKET TRENDS Current Quarter 529,634 SF 45,24 SF
Denver s Retail Sector Keeps Rolling 500, , , , , , , , ,000 50,000. Square Feet
 Research & Forecast Report METRO DENVER RETAIL Q4 2017 s Retail Sector Keeps Rolling Market Overview Net absorption finished the second half of 2017 with strong positive numbers from s Central and Northwest
>> Hollywood Market Activity Flattens
 Research & Forecast Report Central Los Angeles OFFICE Q2 216 Accelerating success. >> Hollywood Market Activity Flattens Key Takeaways > There is currently 533,6 square feet () of office product under
South Bay Experiences Slow and Steady Market Activity
 OFFICE SOUTH BAY MARKET REPORT South Bay Experiences Slow and Steady Market Activity MARKET OVERVIEW MARKET INDICATORS - VACANCY 21.4% NET ABSORPTION -68,500 CONSTRUCTION 210,000 RENTAL RATE $2.08 FSG
RETAIL MARKET ANALYSIS
 RETAIL MARKET ANALYSIS Portland State University Despite the doom and gloom warnings of a retail apocalypse, the national story for retail is that things are stable. Nationwide vacancy is at 5.2 percent
Picked Over. ALBUQUERQUE, NM Q Industrial. Research & Forecast Report. Key Takeaways. Market Indicators Relative to prior period
 Research & Forecast Report ALBUQUERQUE, NM Q4 20 Industrial Picked Over Key Takeaways > > Owner user acquisitions strong > > Supply tightens > > New construction projects gaining more momentum The appetite
Rents and Sales Prices on the Rise to Start 2018
 Research & Forecast Report GREATER PHOENIX MULTIFAMILY 2 and Sales Prices on the Rise to Start 2 Key Takeaways > > The Greater Phoenix multifamily market got off to a hot start to 2. continues to retreat
LEASE TERMS COMMENTS
 +/- 16,565 SQ. FT WAREHOUSE FOR LEASE 108 BADGER PARK DRIVE S T. J O H N S C O U N T Y J A C K S O N V I L L E, F L CONTACT SINA VENUS SALES ASSOCIATE T: 904. 704. 0296 E: VENUS@KILLASHEEINV.COM MARK T.
Low Vacancy Stimulates New Developments
 Research & Forecast Report LAS VEGAS MULTIFAMILY Q3 2015 Low Vacancy Stimulates New Developments > > Multifamily vacancy dipped below 5 percent in the third quarter of 2015 ELECTRIC Meter Hookups NEW HOME
Healthcare, Life Sciences and Technology Sectors Drive Q Leasing Activity
 MARKETVIEW Boston Suburban Office, Q4 2015 Healthcare, Life Sciences and Technology Sectors Drive Q4 2015 Leasing Activity Vacancy 17.3% Availability 19.9% Absorption 87,036 SF Sublease 2.5 MSF Under Construction
Market Report Q ///////// Orange County Industrial. ///////////////L o s A n g e l e s /////////////
 ///////////////L o s A n g e l e s ///////////// ///////////O r a n g e C o u n t y /////////// ////////////V e n t u r a ///////////////// ////////// I n l a n d E m p i r e //////////// Market Report
RESEARCH & FORECAST REPORT
 Q2 2012 OFFICE LAS VEGAS NEVADA RESEARCH & FORECAST REPORT Recovery Without Job Growth? Despite office employment still trending downwards, Southern Nevada s office market posted positive net absorption
National Presence. Local Focus
 Metropolitan DC Market Overview 4Q 214 Overall Market Summary The Washington, DC Metropolitan commercial real estate market is comprised of approximately 41.9 million square feet of rentable office space
Real Estate Market Analysis
 One of the challenges facing the West Berkeley shuttle is to consider whether to expand the service beyond the current operations serving major employers, to a system that provides access to a more diverse
HOULIHAN LAWRENCE COMMERCIAL GROUP
 HOULIHAN LAWRENCE COMMERCIAL GROUP TH QUARTER EXECUTIVE SUMMARY FOURTH QUARTER Dear Clients, With behind us and the new year in full swing, we can now reflect, summarize and gain insight from the past
Quarterly Market Report
 HOUSTON OFFICE JANUARY 2018 EXECUTIVE SUMMARY Office Market Shows Signs of Improvement Houston s overall vacancy rate remained relatively unchanged at 20.7% in, a decrease of 10 basis points quarter-over-quarter,
The Improvement of the Industrial Market
 Research & Forecast Report Long Island industrial MARKET Q2 2015 The Improvement of the Industrial Market Rose Liu Research & Financial Analyst Long Island Takeaways The overall economy on Long Island
The Corcoran Report 2Q 2018 MANHATTAN
 The Corcoran Report 2Q 218 MANHATTAN 2Q218 MANHATTAN 2 Overview Closed Sales 3,193-14 YEAR OVER YEAR +26 QUARTER OVER QUARTER Closed sales declined 14 annually versus Second Quarter 217. All product types
CONTACT. Great Location Within a mile of I-95 on CR210 Adjacent to Twin Creeks DRI: 5,000 homes 2.9 MM office, retail, others
 C O M M E R C I A L L A N D F O R S A L E +/- 1 A C O U T PA R C E L S AVA I L A B L E P R I C E : $ 1 8. 0 0 P E R S Q. F T. C O U N T Y R O A D 2 1 0 W E S T S T. J O H N S C O U N T Y J A C K S O N
Everything Old is New Again
 MARKET REPORT OFFICE Second Quarter 2016 Everything Old is New Again Market Indicators Q2 2016 2017 (Projected) While the global economy remains on its Jekyll and Hyde path, the District s commercial real
ACRE DEVELOPMENT SITE OFFERING MEMORANDUM PLAINFIELD, ILLINOIS UNIQUE INDUSTRIAL OR MIXED-USE DEVELOPMENT OPPORTUNITY
 235 CHARLES PLAINFIELD, ILLINOIS UNIQUE INDUSTRIAL OR MIXED-USE DEVELOPMENT OPPORTUNITY OFFERING MEMORANDUM ACRE DEVELOPMENT SITE GREG PACELLI Director Land Advisory Group Greg.Pacelli@colliers.com T +1
Greater Phoenix Multifamily
 MARKET REPORT / Greater Phoenix Multifamily Apartment Rents Remain on an Upswing Highlights > > Conditions in the Phoenix multifamily market strengthened during the third quarter. Vacancy tightened and
Negative Absorption And Sharp Rise In Total Vacancy to Begin 2014
 OFFICE TRI-CITIES MARKET REPORT Negative Absorption And Sharp Rise In Total to Begin 214 MARKET OVERVIEW MARKET INDICATORS - VACANCY 19.4% NET ABSORPTION -154,9 CONSTRUCTION 155, RENTAL RATE $2.63 P UNEMPLOYMENT
Postive Demand and Robust Leasing Fuels Tri-Cities Market
 Q4 215 office tri-cities market report Postive Demand and Robust Leasing Fuels Tri-Cities Market Market overview MARKET indicators - Q4 215 VACANCY 14.4% NET ABSORPTION 127,7 CONSTRUCTION 167,8 RENTAL
INLAND EMPIRE REGIONAL INTELLIGENCE REPORT
 INLAND EMPIRE REGIONAL INTELLIGENCE REPORT June 2016 EMPLOYMENT After a slow start to 2016, the Inland Empire s labor market returned to form, in recent job figures. Seasonally adjusted nonfarm employment
ECONOMIC CURRENTS. Vol. 5 Issue 2 SOUTH FLORIDA ECONOMIC QUARTERLY. Key Findings, 2 nd Quarter, 2015
 ECONOMIC CURRENTS THE Introduction SOUTH FLORIDA ECONOMIC QUARTERLY Economic Currents provides an overview of the South Florida regional economy. The report presents current employment, economic and real
INLAND EMPIRE REGIONAL INTELLIGENCE REPORT. School of Business. April 2018
 INLAND EMPIRE REGIONAL INTELLIGENCE REPORT April 2018 Key economic indicators suggest that the Inland Empire s economy will continue to expand throughout the rest of 2018, building upon its recent growth.
Bakersfield 4Q18 Office Market Trends
 Bakersfield the higher cost of leasing in the submarket is unlikely to hinder demand as CRC s lease expirations create more available inventory within the University Centre Submarket. Mark J. Smith, SIOR
Second Quarter: Suburban Maryland s Uptick in Leasing has yet to be Realized in Absorption Numbers
 Q2 2013 OFFICE SUBURBAN MARYLAND SUBURBAN MARYLAND MARKET REPORT Second Quarter: Suburban Maryland s Uptick in has yet to be Realized in Numbers Updated May 2012 MARKET INDICATIONS Q2 2013 Q3 2013 (p)
Americas Office Trends Report
 AMERICAS OFFICE TRENDS REPORT Americas Office Trends Report Summary The overall national office market recovery slowed slightly in the first quarter of 2016 amid financial market volatility. However, as
Research KANSAS CITY 3Q17 INDUSTRIAL MARKET. Current Conditions
 4.6 Million Square feet of Net Absorption YEAR TO-DATE The Kansas City industrial market continued its strong growth into the third quarter of 2017, as 1.6 million square feet of net absorption was posted.
Boulder, CO 2nd Quarter 2015 INDUSTRIAL. Market Trends COMMERCIAL REAL ESTATE INFORMATION
 Boulder, CO 2nd Quarter 2015 INDUSTRIAL Market Trends COMMERCIAL REAL ESTATE INFORMATION Table of Contents/Methodology of Tracked Set Table of Contents/Methodology of Tracked Set 2 Boulder Industrial Market
Solid Fundamentals Keep Nashville Industrial Market Competitive in 1Q
 Research & Forecast Report NASHVILLE INDUSTRIAL 1st Quarter Solid Fundamentals Keep Nashville Industrial Market Competitive in 1Q 1Q Summary >> Nashville s industrial vacancy rate increased slightly in
First Quarter 2017 / Industrial Market Report. Market Overview
 Greater Toronto Area Market Facts 3.4% Availability rate in the Greater Toronto Area vs vacancy rate of 2.2% $6.53 PSF Average asking net rent in the Greater Toronto Area 18 Number of properties in the
2.8% 2.0% $811M. 2017: A Solid Year for the Metro Denver Office Sector HIGHLIGHTED METRO DENVER OFFICE. Market Report Q ECONOMIC TRENDS
 Market Report METRO DENVER OFFICE Q4 2017 2017: A Solid Year for the Metro Denver Office Sector MARKET OVERVIEW Denver s office market finished 2017 with strong positive absorption during the fourth quarter
First Quarter Industrial Market Report 2017
 First Quarter Industrial Market Report 2017 03 04 04 04 05 06 08 09 10 11 13 Executive Summary National Economy Local Economy Oklahoma City Industrial Market Leasing Net Absorption and Inventory Rental
HOUSING REPORT WASHTENAW DECEMBER 2018
 WASHTENAW DECEMBER 218 Washtenaw County Don t Delay Prices and Interest Rates Rising A shortage of affordable listings combined with rising interest rates will continue to give mid and entry-level buyers
Sarasota-Manatee, FL 3rd Quarter 2015 INDUSTRIAL. Market Trends COMMERCIAL REAL ESTATE INFORMATION
 Sarasota-Manatee, FL 3rd Quarter 2015 INDUSTRIAL Market Trends COMMERCIAL REAL ESTATE INFORMATION Table of Contents/Methodology of Tracked Set Table of Contents/Methodology of Tracked Set Sarasota-Manatee
Truck Repair Facility
 Truck Repair Facility OFFERING MEMORANDUM 18244 Valley Blvd Bloomington, CA 92316 Truck Repair Facility CONTENTS 01 Executive Summary Executive Summary 5 Location Summary 6 Demographics 7 Demographic Charts
INDUSTRIAL QUICK STATS SUMMARY & OUTLOOK MARKET TRENDS VACANCY & NET ABSORPTION ECONOMIC STATS. Current Quarter. Direct Vacancy 2.
 ORANGE COUNTY INDUSTRIAL SECOND QUARTER 218 QUICK STATS Direct Vacancy 2.2% Overall Vacancy 2.5% Lease Rate NNN $.95 Gross Absorption Under Construction MARKET TRENDS Current Quarter 2,956,71 SF 1,367,18