EVICTIONS IN GREATER MINNESOTA
|
|
|
- Eugene Chandler
- 6 years ago
- Views:
Transcription
1 EVICTIONS IN GREATER MINNESOTA HOME Line - May 2018
2 Contents Report Summary... 2 Context and Purpose... 2 Overview and Key Findings... 2 Conclusions and a Call to Action... 3 Notes about the Data... 4 Researchers... 5 HOME Line Study of Eviction Distributions in Minnesota... 6 Methodology... 6 Key Findings... 6 Case file review... 9 Methodology... 9 Key findings... 9 Tables and Figures Comparison to Minneapolis Data Methodology Overview and Key Findings Notes about Process Map Comparison Tables and Figures Appendix: Eviction Rate and Total Evictions Filed by County and Year ( ) 1
3 Report Summary Context and Purpose This study broadens the scope of the July 2016 Evictions in Minneapolis Report ( Minneapolis Report ) produced by the Minneapolis Innovation Team. The Minneapolis Report focused specifically on eviction data in Minneapolis. This report will focus on the same issues; however, it excludes the 11 Minnesota counties comprising the exurbs, suburbs, and central Twin Cities communities (Anoka, Carver, Chisago, Dakota, Hennepin, Isanti, Ramsey, Scott, Sherburne, Washington, and Wright). Instead, this report examines eviction data in the remaining counties ( Greater Minnesota for the purposes of this report) using statewide eviction data and data gathered from individual case files collected from 102 cities in 47 different counties from This report examines trends related to residential evictions in Greater Minnesota while comparing these trends to those in Minnesota as a whole and Minneapolis specifically in order to better understand the eviction process in general and move towards fewer eviction filings. There are three portions to this report: A mapped geographic distribution by county of eviction filings and judgments in Minnesota using a summarylevel data extract from the state courts and census data. Case file review consisting of individual analyses of a randomly selected set of eviction cases filed in A comparison of the data used and findings in the Minneapolis Report to the data used and findings in this report. Overview and Key Findings Evictions, regardless of outcome, may limit a renter s available options to lower-quality or otherwise less-desirable housing. While the number of evictions in Minnesota has decreased over the last few years, approximately 16,000 evictions were filed in An eviction action resulting in a judgment against the tenant leads to the short term disruption of a household, forcing an unplanned move. It can also lead to long-term instability and barriers to access. Even an eviction filing may limit future access to housing, as the filing itself is part of a standard rental report and can be used by landlords to deny housing. An eviction filing remains on a tenant s rental record for 7 years and can be found in court records indefinitely. Understanding the contributing factors behind both filings and judgments is essential in developing ways to increase housing access, stability, and quality. This study found the following: Cases filings are disproportionally high in the metro county area. The cumulative eviction rate ( ) in the metro county area is 3.3%, just over double the eviction rate in Greater Minnesota which is 1.6%. Reducing the metro county eviction rate to the Greater Minnesota eviction rate for that three-year time period would have reduced the number of evictions by 18,978 a 38% reduction in total evictions filings. 3 months rent or approximately $1,500 stand between tenants and eviction in Greater Minnesota. Non-payment cases account for 89% of eviction filings in Greater Minnesota, most of which had no other reasons identified. (This 2
4 figure is higher than the actual amount of rent owed, as court fees of approximately $300 are typically included in the total amount owed.) More than three out of four evictions filed ended in tenant displacement in Greater Minnesota. This number is likely even higher as unclear or unknown settlement agreements were not counted towards tenant displacement. Showing up matters. Tenants showed up in 56% of cases. In 92.7% of cases where the tenant did not show up but the landlord did, the tenant was displaced. When both parties show up to the hearing, 36% of cases result in a settlement. When the tenant showed up, they had a one in four chance of avoiding displacement. There were unique differences between Minneapolis and Greater Minnesota indicating areas for further study. Settlements were more likely in Minneapolis cases; however, settlements in Minneapolis cases were also more likely to fail. Writs were much more likely to issue in Minneapolis cases that did not settle when compared to Greater Minnesota. Landlords in Minneapolis were less likely to mention other reasons for evictions besides non-payment (76% non-payment only compared to 46%). Landlords in Minneapolis evicted tenants faster for non-payment than landlords in Greater Minnesota. 74% of cases in Minneapolis were filed when tenants were only two or less months behind compared to only 51% in Greater Minnesota. Conclusions and a Call to Action Preventing and addressing the damaging consequences of evictions must be part of a comprehensive approach to increasing housing stability, access, and quality. Evictions stem from a variety of reasons a response to housing disrepair, lack of affordable housing, short- and long-term financial difficulties and the manner in which the formal eviction process plays out throughout the state makes a significant difference for the housing outcomes of Minnesota families. Differences between eviction trends in Minneapolis and Greater Minnesota also raise important questions, such as why are landlords in metro areas more likely to evict tenants and why are settlements in Minneapolis both more likely to occur and more likely to fail? These differences, coupled with similarities in eviction trends that mirrored the Minneapolis analysis, raise important public policy questions and areas for future study. How might we o o o o o Ensure the process is providing equitable, fair access to justice and outcomes regardless of court jurisdiction and location? Connect tenants experiencing financial emergencies to rental assistance more easily and quickly? Increase the number of renters who show up to housing court for their hearing? Increase the likelihood and quality of settlements? Discover the reason for increased eviction filings in metro areas? o Reduce the number of evictions filed, especially in the metro areas? 3
5 Notes about the Data There are four primary data sources for this report. First, a data extract from the state of Minnesota which contains high level data on evictions filed in Minnesota. Second, data from the American Community Survey. The Year estimate was used for 2015 while the , 5-Year estimates were used for Third, direct review of physical case files. Fourth, the data collected in the first Minneapolis Report. Each section will note what data set it is using. Race, ethnicity, and other demographic data are not collected in civil court processes. Future data collection should identify more precise demographic data. Eviction cases are largely standard residential rental cases, but also include some commercial evictions, bank foreclosures, and contract-for-deed cases. There is no official coding in the court data to indicate which cases are of which type. Portions using the state data extract will include some non-residential evictions. However, direct case file review was able to identify non-residential evictions with a high level of certainty. Portions using the case file review data contain only residential eviction cases. There are a significant number of renters who are displaced through informal evictions. Informal evictions include situations outside of court where renters receive notices to vacate, lease non-renewals, or are simply being asked to leave. Many tenants comply with these notices regardless of their validity and enforceability. HOME Line, through its statewide tenant hotline, advises renters facing such situations nearly as regularly as we advise renters facing formal eviction filings. These types of situations are not reflected in the data provided, but could be a rich area for future research. Unfortunately, no formal data sources for these types of evictions exists. Our analysis assumes that if a writ of recovery (eviction judgment) was issued, the tenant was forced to move. While extremely unlikely, it is possible that in some cases, a writ could be resolved through a payment from emergency assistance, for example. There is no way to distinguish those cases with official records. However, observation by professionals and experts in this field support the assumption that writs nearly always result in displacement. In some cases, it is possible that the address provided for the defendant is not the address from which they were evicted, but a later, more current address provided to the court for purposes of ongoing communications with the court and other parties. This may have caused minor distortions in the data. Settlements are often considered to be positive outcomes. Certainly a settled case means both the landlord and tenant reached a mutually agreed upon resolution. However, settlements also mean that a great deal of information is lost. Generally, a settlement means that the actual merits of the case are never determined. Tenants may or may not have owed rent. Tenants may or may not have wanted or needed to move. Due to the nature of the court process and the tenant-landlord relationship, it is possible that tenants agree to deals that are simply not achievable and/or are largely against their interests. Settlements, and the data as a whole, must be viewed in this light. Finally, throughout the analysis, expunged cases are necessarily not reflected in the data because expunged cases are removed from public records (which is the data used in this report). Evictions are more likely to be expunged when the case is resolved in favor of the tenant; however, anecdotal data suggests the expungement rate is very low. Nevertheless, this element distorts the representativeness of the data to an unknown degree. 4
6 Researchers Contributing Researchers Eric Hauge, HOME Line, Executive Director Samuel Spaid, HOME Line, Staff Attorney and Research Director Sophia Rigelman, HOME Line, Americorps VISTA Tenant Organizer Jennifer Flynn, HOME Line, Research Intern Nate Merrill, HOME Line, GIS Mapping Intern Report prepared by Samuel Spaid, HOME Line, Staff Attorney and Research Director 2016 Evictions in Minneapolis Report prepared by Zoe Thiel, City of Minneapolis Innovation Team We want to thank Zoe Thiel and the rest of the Minneapolis Innovation Team for directing the research and publication of the Minneapolis report. This report relies on the framing and analysis in that report and allowed us the opportunity to compare and contrast the data sets. 5

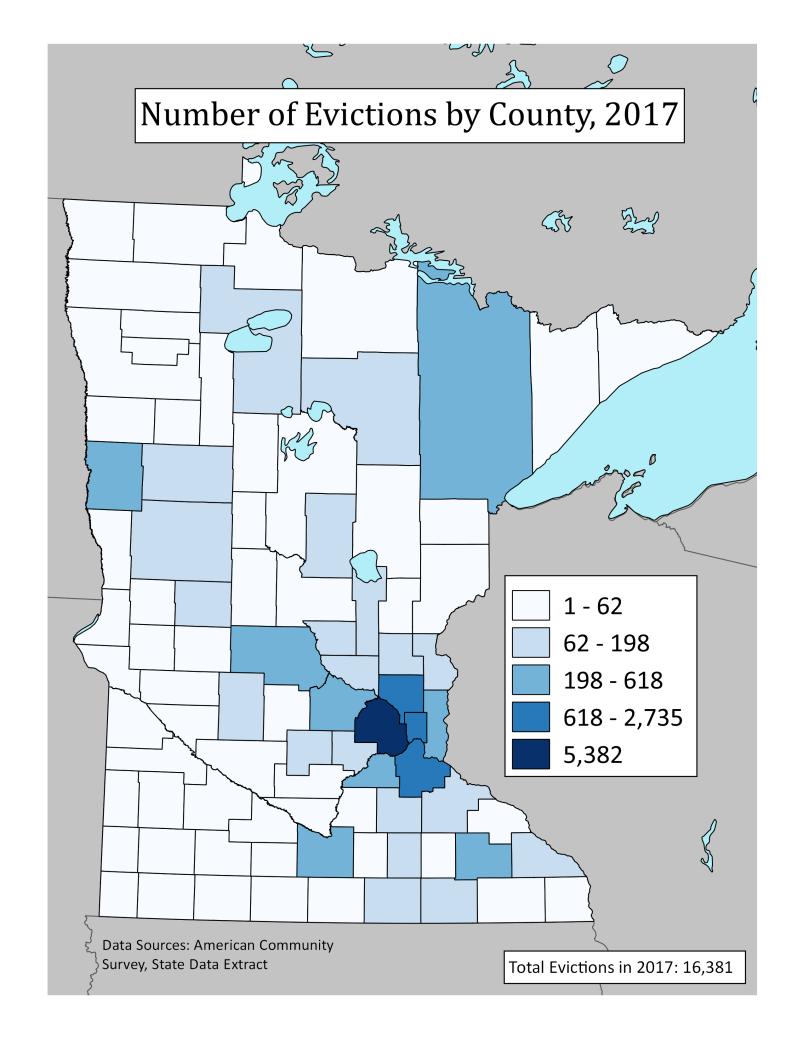
7 HOME Line Study of Eviction Distributions in Minnesota Methodology In 2017 HOME Line conducted an initial study of eviction distribution across Minnesota. This study was broadened in The data for this analysis comes from the state data extract and the American Community Survey data. The Eviction Rate was calculated by taking the number of evictions in a given area and dividing that number by the number of rental units in the same given area as reported by the American Community Survey. Key Findings Evictions are not distributed proportionally to renter density across Minnesota and these trends remain stable over multiple years. Cases filings are disproportionally high in the metro county area. The cumulative eviction rate ( ) in the metro county area is 3.3%, just over double the eviction rate in Greater Minnesota which is 1.6%. Reducing the metro county eviction rate to the Greater Minnesota eviction rate for that three-year time period would have reduced the number of evictions by 18,978 a 38% reduction in total evictions filings. * Fig 1. Cumulative Eviction Rate by County in Minnesota and Total Eviction Filings in Minnesota * For a complete breakdown of eviction filings and rates by county and year, see the attached appendix. 6


")
8 Figs Eviction Rate by County in Minnesota and Total Eviction Filings in Minnesota ( ) 7

9 8
10 Case file review Methodology The court data extract provides important summary-level data; however, much of the detail behind each of those cases is captured in hand-written and scanned case files, accessible only by public access court terminals. 250 eviction cases from 2016 were selected at random from the state court data extract. (Cases from 11 counties closest to the Twin Cities metropolitan area were excluded.) Staff, interns, and volunteers from HOME Line reviewed each of the 250 case files individually and recorded the details about each case on a custom Google survey form. After completion of reviews, staff removed cases determined to the best of our ability to be bank foreclosures, commercial evictions, contract-for-deed cases, or where significant documents or information were missing or not captured, leaving 213 cases. Key findings 3 months rent or approximately $1,500 stand between tenants and eviction in Greater Minnesota. Nonpayment cases account for 89% of eviction filings in Greater Minnesota, most of which had no other reasons identified. (This figure is higher than the actual amount of rent owed, as court fees of approximately $300 are typically included in the total amount owed.) Of all filings, 75% ultimately resulted in a tenant displacement. This is assuming that all unknowns resolved favorably for the tenant. If we remove the unknown outcomes, then nearly 80% of cases resulted in tenant displacement. If all unknown outcomes resulted in tenant displacement then 85% of cases resulted in tenant displacement. Showing up matters. Tenants showed up in 56% of cases. In 92.7% of cases where the tenant did not show up but the landlord did, the tenant was displaced. When both parties show up to the hearing, 36% of cases result in a settlement. When the tenant showed up, they had a one in four chance of avoiding displacement. Nearly 30% of cases settled. The most common type of settlement was some form of payment plan. Most payment plans appeared to be successful as writs (the clearest sign of a failed settlement) were only issued later in 3 cases. However, 40% of settlements were agreements by the tenant to move. Landlord representation does not appear to result in different outcomes. No statically significant conclusions about tenant representation can be reached as only 5% of cases had a represented tenant. While not statistically significant, tenants in these cases did fare better than tenants without attorneys; however, this may merely be a result of the small sample size. 9

11 Tables and Figures Fig 5. Overall Results of Sampled Cases 10
12 Fig 6. Reason for Filing Stated Reason for Eviction Filing Non-Payment of Rent Landlords may cite more than one reason for filing an eviction case. By far the most-often cited reason for filing was nonpayment of rent; it was cited in 89.2% of the cases Other Reason Non-Payment Only Breach of Lease Holding Over Categories were condensed for readability. Breach of Lease includes any breach claim. Holding Over includes any holding over claim excluding those holding over claims combined with breach claims. Complete Eviction Categories as Cited # Non-Payment of Rent Only 98 Non-Payment of Rent/ 25 Breach of Lease Holding Over/Failure to Vacate, Breach of 1 Lease, Drugs/Crime/Etc. (504B.171) Non-Payment of Rent, Holding Over/Failure 43 to Vacate Non-Payment of Rent, Holding Over/Failure 20 to Vacate, Breach of Lease Non-Payment of Rent, Holding Over/Failure 1 to Vacate, Breach of Lease, Drugs/Crime/Etc. (504B.171) Non-Payment of Rent, Holding Over/Failure 2 to Vacate, Drugs/Crime/Etc. (504B.171) Breach of Lease 6 Breach of Lease, Drugs/Crime/Etc. 1 (504B.171) Holding Over/Failure to Vacate 4 Holding Over/Failure to Vacate 11 Breach of Lease Holding Over/Failure to Vacate, Breach of 1 Lease, Drugs/Crime/Etc. (504B.171) Total 213 Occurrence of Eviction Category # Non-payment of Rent 190 Breach of Lease 66 Holding Over/Failure to Vacate 81 Drugs/Crime/Etc. (504B.171) 6 11
13 Fig 7. Non-Payment Months Behind and Amount Owed in Non-Payment Cases < $4,500 $4,000 $3,500 $3,000 $2,500 $2,000 $1,500 $1,000 $500 $0 Number of Cases Average Amount Owed For nonpayment of rent cases, the average number of months a tenant was behind on rent was 3, owing approximately $1,500. The majority of cases were for nonpayment of rent for between 1 and 3 months. Months Behind on Rent # of cases Average Amount owed ($) Less than 1 3 $ $ $1, $1, $1, $1, $2, $1, $2, $2, $3, $3, $1, $2, $4,112 8 or More 7 $3,630 12
14 Fig 8. Appearance at Hearing Who Showed Up? Both Landlord Only Neither Tenant Only 1% 11% 33% 55% Who showed up? # % Both Tenant and Landlord % Landlord Only 69 33% Neither 24 11% Tenant 2 1% Grand Total 213 Both the tenant and the landlord were present at the hearing in about 55% of cases. In more than 32% of cases, only the landlord was present. In a few cases, the matter was resolved prior to the hearing, or neither party was present. Fig 9. Result of the Hearing, by Appearance Result of Hearing by Appearance Both Landlord Tenant Neither Court Order Settled Result of the Hearing # % When both Tenant and Landlord 118 were there Court Order 73 62% Settled 45 38% When only the Landlord was there 69 Court Order 67 97% Settled 2 3% Tenant or Unknown 5 Court Order 4 80% Settled 1 20% When no one was there 21 Court Order 8 38% Settled 13 62% Grand Total 213 When both the landlord and tenant were present, more than 1 out of 3 cases settled. When only the landlord was present, more than 9 out of 10 resulted in a court order. 13
15 Fig 10. Writ Issuance, by Appearance Writ Issued by Appearance Both Landlord Tenant Neither Was a writ issued? # % When both Tenant and Landlord 118 were there No 88 74% Yes 30 26% When only the Landlord was 69 there No 30 43% Yes 39 57% Tenant or Unknown 5 No 5 100% Yes 0 0% When no one was there 21 No % Yes 0 0% Grand Total 213 No Yes Fig 11. Representation Who Had Representation? Who had Representation? # % Both 7 3% Landlord % Tenant 3 2% Neither 90 42% Grand Total In over 40% of cases, neither the landlord nor the tenant had representation. In the remaining cases, the landlord was far more likely to have representation than the tenant Both Landlord Tenant Neither Who Had Representation Note: In 16 cases, there was a Power of Authority on file, typically a representative of a management company; not reflected in representation. 14
16 Fig Results, by Representation status Result of Hearing by Representation Both Landlord Tenant Neither Court Order Settled Result of Hearing by # % Representation When both Tenant and Landlord 7 were Represented Court Order 4 57% Settlement 3 43% When only the Landlord was 113 Represented Court Order 74 65% Settlement 39 35% When Only the Tenant was 3 Represented Court Order 0 0% Settlement 3 100% When no one was Represented 90 Court Order 75 83% Settlement 15 17% Grand Total Writ Issued by Representation Both Landlord Tenant Neither No Yes Writ Issued by Representation # % When both Tenant and Landlord 7 were Represented No 6 86% Yes 1 14% When only the Landlord was 113 Represented No 75 66% Yes 38 34% When Only the Tenant was 3 Represented No 3 100% Yes 0 0% When no one was Represented 90 No 60 67% Yes 30 33% Grand Total 213 Writs were most likely to be issued when only the landlord showed up. Writs were not issued if only the tenant or no one showed up. Note: in many cases the tenant was ordered to move even when no writ was later issued, implying the tenant left. 15
17 Comparison to Minneapolis Data Methodology HOME Line staff compared the findings of the Minneapolis Report, along with the underlying data, to the findings of this report from Greater Minnesota. In both cases HOME Line relied on the data collected from the physical file review. Overview and Key Findings In many cases the overall trends between the Minneapolis Report and this report were similar. However, there were differences between Minneapolis cases and Greater Minnesota cases. Settlements were less likely in Greater Minnesota when compared to Minneapolis. In Minneapolis, 96 (or 57%) of cases that made it to the hearing settled. However, in Greater Minnesota, only 43 (or 22%) of cases settled under the same circumstances. The types of settlements were also different. In Minneapolis, tenants agreed to move in only 28% of settlements while, in Greater Minnesota, tenants agreed to move in 40% of settlements. Additionally, writs were issued in 39% of settled cases in Minneapolis and only 7% of settlements in Greater Minnesota, indicating settlements in Minneapolis failed more often than settlements in Greater Minnesota. While non-payment of rent remained the primary and most cited reason for evictions in Greater Minnesota (89%) there was a difference between the two samples. In Minneapolis, non-payment only cases comprised the vast majority of all filings, amounting to 76% of total cases. However, in the Greater Minnesota analysis, nonpayment only cases comprised only 46% of total cases, with holding over and breach of lease playing a much higher role. Landlords in Minneapolis evicted tenants faster for non-payment than landlords in Greater Minnesota. While the greatest number of non-payment cases were filed within one to two months in both Minneapolis and Greater Minnesota, 74% of cases in Minneapolis were filed when tenants were only two or less months behind compared to only 51% in Greater Minnesota. As noted earlier, based on renter density as outlined in Census data, eviction case filings are disproportionally high in the metro area. Notes about Process Map Comparison Results for the process map were tracked slightly differently between reports, making a direct comparison hard. The Minneapolis Report only considered cases from Minneapolis which were all heard by the Hennepin County Housing Court, mostly by the same referee. For this reason, results and process were consistent. However, this report considered cases from a variety of counties and in front of many different judges. The process was less consistent. In order to accommodate for this lack of consistency, slightly different breaks were used. Most significantly, the final case disposition closed administratively does not appear. Instead the cases are divided by time of closure Prior to Hearing, Hearing, and Trial and type of closure Settlement or Court Order. Each case was then individually reviewed (as in the Minneapolis Report) to determine the specific results. 16

18 Tables and Figures Fig 14. Minneapolis Process Map Minneapolis Report Minneapolis Report 17

19 Fig 15. Greater Minnesota Process Map Greater Minnesota 18
20 Number of Writs Issued Number of Writs Issued 100% 100% 90% 80% 15 90% 80% 70% 57 70% 90 60% 50% 60% 50% 54 40% 30% 50 40% 30% 20% 37 20% 62 10% 0% Settled Court Order 10% 0% 7 Settled Court Order Yes No Yes No Minneapolis Report Greater Minnesota Fig Writs Issued in Minneapolis and Greater Minnesota Cases Filed with Two or Less Months Owed 100% Number of Settlements 100% 90% 90% 80% 70% 60% 50% 40% 30% 20% 10% 0% Minneapolis Greater Minnesota More than Two Months Owed 80% 70% 60% 50% 40% 30% 20% 10% 0% Minneapolis Greater Minnesota Two Or Less Months Owed Settlements Court Ordered Fig 18. Cases Filed with Two or Less Months Owed Fig 19. Number of Settlements 19
21 Stated Reason for Eviction Filing Non-Payment of Rent Other Reason Non-Payment Only Breach of Lease Drugs/Crime/Etc Holding Over Other Minneapolis Report Stated Reason for Eviction Filing Non-Payment of Rent Other Reason Non-Payment Only Breach of Lease Holding Over Greater Minnesota Fig Reasons for Evictions in Minneapolis and Greater Minnesota Stated Reason for Eviction Filing 100% 90% 80% 70% 60% 50% 40% 30% Greater Minnesota does have cases that alleged both non-payment and crimes as noted in the more specific table accompanying Fig. 6. However, due to the way the issues are combined (see Fig. 6 s note) that specific category does not show up here. 20% 10% 0% Minneapolis Non-Payment Only Holding Over Greater Minnesota Breach of Lease Crimes Fig 22. Direct Comparison of Reasons for Filings 20
22 Months Behind and Amount Owed in Non-Payment Cases 60 $7, $6, < Number of Cases Average Rent Owed $5,000.0 $4,000.0 $3,000.0 $2,000.0 $1,000.0 $- Minneapolis Report Months Behind and Amount Owed in Non-Payment Cases < $4,500 $4,000 $3,500 $3,000 $2,500 $2,000 $1,500 $1,000 $500 $0 Number of Cases Average Rent Owed Greater Minnesota Fig Months Behind and Amounts Owed in Minneapolis and Greater Minnesota 21
23 22
24 Eviction Rate by County and Year County Cumulative Aitkin 2.39% 1.51% 2.11% 2.00% Anoka 4.69% 4.51% 4.32% 4.51% Becker 2.55% 2.40% 2.36% 2.44% Beltrami 1.78% 1.52% 1.77% 1.69% Benton 3.18% 2.86% 3.12% 3.05% Big Stone 0.84% 0.63% 1.27% 0.91% Blue Earth 2.25% 2.51% 2.40% 2.39% Brown 1.39% 1.20% 1.42% 1.34% Carlton 2.52% 2.25% 1.79% 2.19% Carver 2.63% 2.27% 1.95% 2.29% Cass 1.25% 1.86% 1.50% 1.54% Chippewa 2.34% 2.09% 2.23% 2.22% Chisago 4.63% 3.62% 3.41% 3.89% Clay 2.55% 2.98% 3.13% 2.88% Clearwater 0.67% 0.55% 0.27% 0.49% Cook 0.72% 0.58% 0.72% 0.67% Cottonwood 1.47% 1.05% 0.96% 1.16% Crow Wing 2.53% 2.87% 2.91% 2.77% Dakota 3.38% 3.28% 3.42% 3.36% Dodge 2.55% 2.41% 2.41% 2.46% Douglas 1.63% 1.91% 1.83% 1.79% Faribault 1.29% 1.13% 1.19% 1.20% Fillmore 0.92% 0.72% 1.11% 0.92% Freeborn 1.99% 2.60% 2.16% 2.25% Goodhue 2.05% 2.18% 1.90% 2.04% Grant 0.80% 2.17% 1.18% 1.38% Hennepin 3.19% 2.92% 2.88% 3.00% Houston 0.79% 1.11% 0.72% 0.87% Hubbard 1.71% 1.24% 1.80% 1.58% Isanti 3.75% 3.63% 3.41% 3.60% Itasca 1.59% 1.37% 2.11% 1.69% Jackson 0.59% 1.85% 1.03% 1.15% Kanabec 4.03% 4.11% 3.86% 4.00% Kandiyohi 1.77% 1.70% 1.70% 1.72% Kittson 0.54% 0.57% 0.28% 0.47% Appendix Page 1
25 Eviction Rate by County and Year County Cumulative Koochiching 1.34% 0.51% 1.94% 1.26% Lac qui Parle 0.84% 0.49% 1.79% 1.04% Lake 1.17% 1.39% 1.39% 1.32% Lake of the Woods 1.27% 2.07% 0.41% 1.25% Le Sueur 2.44% 3.40% 3.06% 2.97% Lincoln 0.39% 1.36% 0.97% 0.91% Lyon 1.81% 1.17% 1.51% 1.49% Mahnomen 2.06% 2.50% 3.04% 2.54% Marshall 0.65% 0.66% 0.80% 0.70% Martin 1.16% 0.85% 1.12% 1.04% McLeod 1.45% 1.06% 2.09% 1.53% Meeker 2.30% 2.20% 2.68% 2.39% Mille Lacs 3.22% 2.66% 2.58% 2.82% Morrison 1.88% 2.32% 2.21% 2.14% Mower 2.36% 1.95% 2.07% 2.13% Murray 0.72% 0.70% 0.42% 0.61% Nicollet 1.52% 1.73% 1.26% 1.50% Nobles 0.55% 0.61% 0.44% 0.53% Norman 0.38% 1.39% 1.19% 0.99% Olmsted 1.99% 2.13% 2.34% 2.15% Otter Tail 1.92% 1.78% 2.33% 2.01% Pennington 2.46% 1.45% 2.58% 2.16% Pine 3.82% 3.93% 2.45% 3.40% Pipestone 0.69% 1.25% 1.14% 1.03% Polk 1.17% 1.40% 0.94% 1.17% Pope 0.52% 0.94% 0.94% 0.80% Ramsey 3.23% 3.08% 3.03% 3.11% Red Lake 1.71% 1.53% 0.92% 1.39% Redwood 0.74% 1.08% 0.93% 0.91% Renville 1.85% 1.48% 2.33% 1.89% Rice 1.85% 1.67% 1.52% 1.68% Rock 0.31% 0.39% 0.49% 0.40% Roseau 0.81% 1.28% 1.20% 1.10% Scott 3.17% 2.77% 2.63% 2.86% Sherburne 3.25% 3.57% 3.00% 3.27% Sibley 1.33% 1.22% 1.30% 1.28% Appendix Page 2
26 Eviction Rate by County and Year County Cumulative St. Louis 2.53% 2.29% 2.41% 2.41% Stearns 1.70% 1.74% 2.04% 1.83% Steele 2.93% 2.65% 3.20% 2.93% Stevens 0.67% 0.52% 0.61% 0.60% Swift 1.24% 1.48% 0.82% 1.18% Todd 1.16% 0.77% 1.43% 1.12% Traverse 0.34% 1.44% 2.53% 1.44% Wabasha 1.80% 2.09% 1.35% 1.75% Wadena 1.30% 1.07% 1.57% 1.31% Waseca 2.54% 2.19% 3.00% 2.58% Washington 3.07% 2.97% 2.86% 2.97% Watonwan 1.05% 1.37% 0.77% 1.06% Wilkin 0.59% 0.75% 0.60% 0.64% Winona 1.72% 1.88% 1.99% 1.86% Wright 3.84% 3.65% 3.12% 3.53% Yellow Medicine 1.35% 0.77% 0.88% 1.00% Appendix Page 3
27 Total Evictions Filed by County and Year County Cumulative Aitkin Anoka Becker Beltrami Benton Big Stone Blue Earth Brown Carlton Carver Cass Chippewa Chisago Clay Clearwater Cook Cottonwood Crow Wing Dakota Dodge Douglas Faribault Fillmore Freeborn Goodhue Grant Hennepin Houston Hubbard Isanti Itasca Jackson Kanabec Kandiyohi Kittson Koochiching Appendix Page 4
28 Total Evictions Filed by County and Year County Cumulative Lac qui Parle Lake Lake of the Woods Le Sueur Lincoln Lyon Mahnomen Marshall Martin McLeod Meeker Mille Lacs Morrison Mower Murray Nicollet Nobles Norman Olmsted Otter Tail Pennington Pine Pipestone Polk Pope Ramsey Red Lake Redwood Renville Rice Rock Roseau Scott Sherburne Sibley St. Louis Appendix Page 5
29 Total Evictions Filed by County and Year County Cumulative Stearns Steele Stevens Swift Todd Traverse Wabasha Wadena Waseca Washington Watonwan Wilkin Winona Wright Yellow Medicine Appendix Page 6
Out of Reach 2013 Minnesota
 Out of Reach 2013 Minnesota In Minnesota, the Fair Market Rent (FMR) for a two-bedroom apartment is $836. In order to afford this level of rent and utilities without paying more than 30% of on housing
Foreclosures in Minnesota: A Report Based on County Sheriff s Sale Data
 Foreclosures in Minnesota: A Report Based on County Sheriff s Sale Data February 26, 2009 Supplement Published by: Prepared by: 600 18 th Avenue North Minneapolis, MN 55411 Telephone: 612-522-2500 Facsimile:
STATE LAND OFFICE: An Inventory of Its Appraisals of State Land:
 MINNESOTA HISTORICAL SOCIETY Minnesota State Archives STATE LAND OFFICE: An Inventory of Its Appraisals of State Land: OVERVIEW OF THE RECORDS Agency: Series Title: Minnesota. State Land Office. Appraisals
Annual Report on the Minnesota Housing Market
 X0A0T Annual Report on the Minnesota Housing Market FOR RESIDENTIAL REAL ESTATE ACTIVITY IN THE STATE OF MINNESOTA X1A0T 2018 Annual Report on the Minnesota Housing Market FOR RESIDENTIAL REAL ESTATE ACTIVITY
Annual Report on the Minnesota Housing Market FOR RESIDENTIAL REAL ESTATE ACTIVITY IN THE STATE OF MINNESOTA
 Annual Report on the Minnesota Housing Market FOR RESIDENTIAL REAL ESTATE ACTIVITY IN THE STATE OF MINNESOTA FOR RESIDENTIAL REAL ESTATE ACTIVITY IN THE STATE OF MINNESOTA With a new U.S. president from
Out of. Reach. The growing gap between. Minnesota 2017 WAGES AND RENT. An annual report from
 Out of Reach Minnesota 2017 The growing gap between WAGES AND RENT An annual report from Executive Summary When families pay too much for rent, they re forced to sacrifice to make ends meet cutting back
2005 Property Values and Assessment Practices Report (Assessment year 2004)
") 2005 Property Values and Assessment Practices Report (Assessment year 2004) A report submitted to the Minnesota State Legislature pursuant to Laws 2001, First Special Session, Chapter 5, Article 3, Section
2005 Property Values and Assessment Practices Report (Assessment year 2004) A report submitted to the Minnesota State Legislature pursuant to Laws 2001, First Special Session, Chapter 5, Article 3, Section
2006 Property Values and Assessment Practices Report (Assessment Year 2005)
") 2006 Property Values and Assessment Practices Report (Assessment Year 2005) A report submitted to the Minnesota State Legislature pursuant to Laws 2001, First Special Session, Chapter 5, Article 3, Section
2006 Property Values and Assessment Practices Report (Assessment Year 2005) A report submitted to the Minnesota State Legislature pursuant to Laws 2001, First Special Session, Chapter 5, Article 3, Section
EDA President Krant, EDA Board Members, and Interim Administrator Meyer
 MEMORANDUM DATE: April 9, 2018 TO: FROM: RE: EDA President Krant, EDA Board Members, and Interim Administrator Meyer Cynthia Smith Strack, Community Development Director Item 5.2 Meeting with Area Realtors
[A!] [N] rn ~ Lr~ DEPARTMENT OF NATURAL RESOURCES 500 LAFAYETIE ROAD ST. PAUL, MINNESOTA , _
![[A!] [N] rn ~ Lr~ DEPARTMENT OF NATURAL RESOURCES 500 LAFAYETIE ROAD ST. PAUL, MINNESOTA , _](/thumbs/93/112559545.jpg "[A!] [N] rn ~ Lr~ DEPARTMENT OF NATURAL RESOURCES 500 LAFAYETIE ROAD ST. PAUL, MINNESOTA , _") This document is made available electronically by the Minnesota Legislative Reference Library as part of an ongoing digital archiving project. http://www.leg.state.mn.us/lrl/lrl.asp 950217 ~ STATE OF [A!]
This document is made available electronically by the Minnesota Legislative Reference Library as part of an ongoing digital archiving project. http://www.leg.state.mn.us/lrl/lrl.asp 950217 ~ STATE OF [A!]
Manufactured Home Parks Handbook
 The Manufactured Home Parks Handbook From the Office of Minnesota Attorney General Mike Hatch www.ag.state.mn.us 1 The Manufactured Home Parks Handbook This handbook explains the Minnesota laws concerning
2004 Property Values and Assessment Practices Report
 2004 Property Values and Assessment Practices Report A report submitted to the Minnesota State Legislature pursuant to Laws 2001, First Special Session, Chapter 5, Article 3, Section 92. Property Tax Division
MINNESOTA ASSOCIATION OF COUNTY AUDITORS TREASURERS AND FINANCE OFFICERS 2016 COMMITTEE LIST. Committee Name County Address
 MINNESOTA ASSOCIATION OF COUNTY AUDITORS TREASURERS AND FINANCE OFFICERS 2016 COMMITTEE LIST Committee Name County Email Address Executive Committee President Laurie Davies Carver ldavies@co.carver.mn.us
2010 Property Values and Assessment Practices Report (Assessment Year 2009)
") This document is made available electronically by the Minnesota Legislative Reference Library as part of an ongoing digital archiving project. http://www.leg.state.mn.us/lrl/lrl.asp 2010 Property Values
This document is made available electronically by the Minnesota Legislative Reference Library as part of an ongoing digital archiving project. http://www.leg.state.mn.us/lrl/lrl.asp 2010 Property Values
Committee Name County Address
 MINNESOTA ASSOCIATION OF COUNTY AUDITORS TREASURERS AND FINANCE OFFICERS 2018 COMMITTEE LIST Executive Committee President Michelle Knutson Big Stone michelle.knutson@co.big-stone.mn.us First Vice President
2015 SSTS Annual Report Subsurface Sewage Treatment Systems in Minnesota
 Kwq- 2015 SSTS Annual Report Subsurface Sewage Treatment Systems in Minnesota October 2016 Author Cody Robinson Contributors/acknowledgements (MPCA) Subsurface Sewage Treatment Systems (SSTS) staff would
Potential Right of Way Conveyance Parcels. March 2015
 Potential Right of Way Conveyance Parcels March 205 Prepared by The Minnesota Department of Transportation 395 John Ireland Boulevard Saint Paul, Minnesota 5555-899 Phone: 65-296-3000 Toll-Free: -800-657-3774
Biennial Report on the Potential Right of Way Conveyance Parcels
 2017-2018 Biennial Report on the Potential Right of Way Conveyance Parcels March 2019 Prepared by: The Minnesota Department of Transportation 395 John Ireland Boulevard Saint Paul, Minnesota 55155-1899
REPORT # O L A OFFICE OF THE LEGISLATIVE AUDITOR STATE OF MINNESOTA A BEST PRACTICES REVIEW. Preserving Housing
 O L A REPORT # 03-05 OFFICE OF THE LEGISLATIVE AUDITOR STATE OF MINNESOTA A BEST PRACTICES REVIEW Preserving Housing APRIL 2003 Program Evaluation Division The Minnesota Office of the Legislative Auditor
2017 SSTS Annual Report Subsurface Sewage Treatment Systems in Minnesota
 Wastewater April 2018 2017 SSTS Annual Report Subsurface Sewage Treatment Systems in Minnesota Author Cody Robinson Contributors/acknowledgements (MPCA) Subsurface Sewage Treatment Systems (SSTS) staff
The Minnesota Rural Real Estate Market in by Jon Brekke, Hung-Lin Tao and Philip M. Raup
 The Minnesota Rural Real Estate Market in 1992 by Jon Brekke, Hung-Lin Tao and Philip M. Raup University of Minnesota St. Paul, MN 55108 Economic Report ER 93-5 July, 1993 Including Special Studies Of:
PLANNING AGENCY An Inventory of Its 701 Planning Assistance Program Reports and Studies
 MINNESOTA HISTORICAL SOCIETY Minnesota State Archives PLANNING AGENCY An Inventory of Its 701 Planning Assistance Program Reports and Studies OVERVIEW OF THE RECORDS Agency: Series Title: Dates: 1946-1992
The Role of Housing Markets, Regulatory Frameworks, and Local Government Finance
 H TRANSPORTATION AND REGIONAL GROWTH a study of the relationship between transportation and regional growth University of Minnesota Center for Transportation Studies Center for Urban and Regional Affairs
Minnesota s School Trust Lands
 Minnesota s School Trust Lands Biennial Report Fiscal Years 2010-2011 (7/1/2009-6/30/2011) Minnesota Department of Natural Resources March 2012 i Table of Contents Executive Summary... iv 1. History of
Estimate of the Percentage of Rent that Constitutes Property Taxes in Minnesota. Based on Rent and Property Taxes Paid in 2016
 Estimate of the Percentage of Rent that Constitutes Property Taxes in Minnesota Based on Rent and Property Taxes Paid in 2016 March 1, 2018 Minnesota Statute 3.197 requires any report to the Legislature
New affordable housing production hits record low in 2014
 1 Falling Further Behind: Housing Production in the Twin Cities Region December 2015 Key findings Only a small percentage of added housing units were affordable to households with low and moderate incomes.
Assessment and Classification Practices Report Property Used for Horse Breeding and Horse Boarding Activities
 Assessment and Classification Practices Report Property Used for Horse Breeding and Horse Boarding Activities A report submitted to the Minnesota State Legislature pursuant to Minnesota Laws 2009, Chapter
Sales Ratio: Alternative Calculation Methods
 For Discussion: Summary of proposals to amend State Board of Equalization sales ratio calculations June 3, 2010 One of the primary purposes of the sales ratio study is to measure how well assessors track
Nonresidential construction activity in the Twin Cities region was robust in 2013
 1 Recent Nonresidential Construction Activity in the Twin Cities Region March 2015 Key Findings After bottoming out in 2010, nonresidential construction activity in the Twin Cities region is once again
Limited Market Value Report
 Limited Market Value Report 2005 Assessment Year Tax Research Division March 1, 2006 This report is available on the web at http://www.taxes.state.mn.us/taxes/legal_policy/index.shtml March 1, 2006 To
Myth Busting: The Truth About Multifamily Renters
 Myth Busting: The Truth About Multifamily Renters Multifamily Economics and Market Research With more and more Millennials entering the workforce and forming households, as well as foreclosed homeowners
PRINCE GEORGE S COUNTY AUGUST 2018
 STATPAK PRINCE GEORGE S COUNTY AUGUST 2018 McEnearney.com MARKET IN A MINUTE A SUMMARY OF MARKET CONDITIONS FOR JULY 2018 Contract activity in July 2018 was up 19.7% from July 2017, and through the first
For further information about this report, contact Fred Brousseau at the Budget and Legislative Analyst s Office.
 subsequent to Unlawful Detainers being filed against them. Only 153, or 17.9 percent of the tenants served by the organization, remained in their rental unit. Of 575 of the 703 tenants served by the Eviction
Filling the Gaps: Active, Accessible, Diverse. Affordable and other housing markets in Johannesburg: September, 2012 DRAFT FOR REVIEW
 Affordable Land and Housing Data Centre Understanding the dynamics that shape the affordable land and housing market in South Africa. Filling the Gaps: Affordable and other housing markets in Johannesburg:
Implementing Small Area Fair Market Rents (SAFMRs) in the HCV Program. Plano Housing Authority Case Study
 in the HCV Program. Plano Housing Authority Case Study") Implementing Small Area Fair Market Rents (SAFMRs) in the HCV Program Plano Housing Authority Case Study 1 Contents Background...2 Motivations for Implementing SAFMR...2 Market conditions...2 Strategic
Implementing Small Area Fair Market Rents (SAFMRs) in the HCV Program Plano Housing Authority Case Study 1 Contents Background...2 Motivations for Implementing SAFMR...2 Market conditions...2 Strategic
Filling the Gaps: Stable, Available, Affordable. Affordable and other housing markets in Ekurhuleni: September, 2012 DRAFT FOR REVIEW
 Affordable Land and Housing Data Centre Understanding the dynamics that shape the affordable land and housing market in South Africa. Filling the Gaps: Affordable and other housing markets in Ekurhuleni:
MARKET WATCH: Dakota County
 MARKET WATCH: Dakota County Trends in the unsubsidized multifamily rental market Minnesota Housing Partnership OCTOBER 2018 Across the Twin Cities, the growing ranks of renter households are facing an
STATPAK MARKET IN A MINUTE A SUMMARY OF MARKET CONDITIONS FOR JULY McEnearney.com CONTRACTS URGENCY INDEX INVENTORY INTEREST RATES AFFORDABILITY
 STATPAK WASHINGTON, DC AUGUST 2018 McEnearney.com MARKET IN A MINUTE A SUMMARY OF MARKET CONDITIONS FOR JULY 2018 Contract activity in July 2018 was up just 0.5% from July 2017. Through the first seven
Commissioner s Exemptions
 Commissioner s Exemptions List of Entities that Received Commissioner s Exemption under Minnesota Statutes Section 500.24 Doug Spanier, 651-201-6166 625 Robert St. N., St. Paul, MN www.mda.state.mn.us
STATPAK MARKET IN A MINUTE A SUMMARY OF MARKET CONDITIONS FOR APRIL McEnearney.com CONTRACTS URGENCY INDEX INVENTORY INTEREST RATES
 STATPAK WASHINGTON, DC MAY 2018 McEnearney.com MARKET IN A MINUTE A SUMMARY OF MARKET CONDITIONS FOR APRIL 2018 Contract activity in April 2018 was up 9.4% from April 2017, and four of the six price categories
Estimating National Levels of Home Improvement and Repair Spending by Rental Property Owners
 Joint Center for Housing Studies Harvard University Estimating National Levels of Home Improvement and Repair Spending by Rental Property Owners Abbe Will October 2010 N10-2 2010 by Abbe Will. All rights
MARKET WATCH: Twin Cities Trends in the unsubsidized multifamily rental market
 MARKET WATCH: Twin Cities Trends in the unsubsidized multifamily rental market Issue #3 NOV 2018 Naturally occurring affordable housing (NOAH) appears in distinctly different forms throughout the 7-county
Ludgvan Parish HOUSING NEED SURVEY. Report Date: 21 st January Version: 1.2 Document Status: Final Report
 Ludgvan Parish HOUSING NEED SURVEY Report Date: 21 st January 2019 Version: 1.2 Document Status: Author: Final Report Andrew Prendergast Rural Housing Enabler Affordable Housing Team, Cornwall Council
A project of Neighborhood Projects for Community Revitalization At the Center for Urban and Regional Affairs (CURA) University of Minnesota
 University of Minnesota") Affordable Housing Siting Opportunities in Minneapolis October 2008 Rachel C. Robinson, Author With assistance from Joel Larson A project of Neighborhood Projects for Community Revitalization At the Center
Affordable Housing Siting Opportunities in Minneapolis October 2008 Rachel C. Robinson, Author With assistance from Joel Larson A project of Neighborhood Projects for Community Revitalization At the Center
REAL ESTATE MARKET OVERVIEW 1 st Half of 2015
 REAL ESTATE MARKET OVERVIEW 1 st Half of 2015 With Comparisons to the 2 nd Half of 2014 September 4, 2015 Prepared for: First Bank of Wyoming Prepared by: Ken Markert, AICP MMI Planning 2319 Davidson Ave.
Assessment of Fair Housing Tool for Local Governments. Table of Contents
 Assessment of Fair Housing Tool for Local Governments (LG0) OMB Control Number: -00 I. Cover Sheet Assessment of Fair Housing Tool for Local Governments Table of Contents II. III. IV. Executive Summary
Source: Minnesota Legislative Manual 1965/1966
 This document is made available electronically by the Minnesota Legislative Reference Library as part of an ongoing digital archiving project http://wwwlegstatemnus/lrl/mngov/electionresultsaspx September
Expunging an Eviction Case
 Fact Sheet Expunging an Eviction Case What does expungement mean? Expungement means removing the record of a court case from the public view. If your eviction court case is expunged, then someone searching
STATPAK MARKET IN A MINUTE A SUMMARY OF MARKET CONDITIONS FOR MAY McEnearney.com CONTRACTS URGENCY INDEX INVENTORY INTEREST RATES AFFORDABILITY
 STATPAK WASHINGTON, DC JUNE 2017 McEnearney.com MARKET IN A MINUTE A SUMMARY OF MARKET CONDITIONS FOR MAY 2017 Contract activity in May 2017 was up 2.9% from May 2016, and there were increases for the
Revenue Received from State Mineral Leases FY
 This document is made available electronically by the Minnesota Legislative Reference Library as part of an ongoing digital archiving project. http://www.leg.state.mn.us/lrl/lrl.asp Revenue Received from
HOUSING NEEDS ANALYSIS & ASSESSMENT REQUEST FOR PROPOSALS
 HOUSING NEEDS ANALYSIS & ASSESSMENT REQUEST FOR PROPOSALS I. Introduction Sibley County is located southwest of the seven-county metro. It directly borders Scott, Carver, McLeod, Le Sueur, Renville, and
FREQUENTLY ASKED QUESTIONS MISSOURI EVICTION TRIALS
 MISSOURI OFFICE 3740 BROADWAY, 2ND FLOOR KANSAS CITY, MISSOURI 64111 PH: (816) 931-2207 FX: (816) 931-2247 KANSAS OFFICE 4800 RAINBOW BLVD., SUITE 200 WESTWOOD, KANSAS 66205 PH: (913) 262-2207 FX: (913)
Document under Separate Cover Refer to LPS State of Housing
 Document under Separate Cover Refer to LPS5-17 216 State of Housing Contents Housing in Halton 1 Overview The Housing Continuum Halton s Housing Model 3 216 Income & Housing Costs 216 Indicator of Housing
November An updated analysis of the overall housing needs of the City of Aberdeen. Prepared by: Community Partners Research, Inc.
 City of Aberdeen HOUSING STUDY UPDATE November 2010 An updated analysis of the overall housing needs of the City of Aberdeen Prepared by: Community Partners Research, Inc. nd 10865 32 Street North Lake
YOUNG AMERICA TOWNSHIP Draft Policy Chapter
 YOUNG AMERICA TOWNSHIP Draft Policy Chapter Produced by CARVER COUNTY Planning and Water Management Department Government Center, Administration Building 600 East 4th Street, Chaska, MN 55318 TOWNSHIP
Ontario Rental Market Study:
 Ontario Rental Market Study: Renovation Investment and the Role of Vacancy Decontrol October 2017 Prepared for the Federation of Rental-housing Providers of Ontario by URBANATION Inc. Page 1 of 11 TABLE
PRINCE GEORGE S COUNTY JULY 2018
 STATPAK PRINCE GEORGE S COUNTY JULY 2018 McEnearney.com MARKET IN A MINUTE A SUMMARY OF MARKET CONDITIONS FOR JUNE & FIRST HALF 2018 Contract activity in June 2018 was up 16.4% from June 2017, and through
PRINCE GEORGE S COUNTY FEBRUARY 2018
 STATPAK PRINCE GEORGE S COUNTY FEBRUARY 2018 McEnearney.com MARKET IN A MINUTE A SUMMARY OF MARKET CONDITIONS FOR JANUARY 2018 Contract activity in January 2018 was up 20.9% from January 2017, and there
Local Agency Permit Fee Policies for Oversize/Overweight Vehicles
 TRS 1806 Ocber 2018 Local Agency Permit Fee Policies for Oversize/Overweight Vehicles Prepared by CTC & Associates LLC Members of the Local Road Research Board are seeking basic data about the oversize/overweight
City of Lonsdale Section Table of Contents
 City of Lonsdale City of Lonsdale Section Table of Contents Page Introduction Demographic Data Overview Population Estimates and Trends Population Projections Population by Age Household Estimates and
MINNESOTA BASELINE HOUSING MEASURES
 2013 MINNESOTA BASELINE HOUSING MEASURES February 2015 710 South Second Street, Suite 400 Minneapolis, MN 55401 T. 612-333-4220 F. 612-332-3833 www.mcknight.org Prepared by: 275 Market Street Suite 509
Assessment-To-Sales Ratio Study for Division III Equalization Funding: 1999 Project Summary. State of Delaware Office of the Budget
 Assessment-To-Sales Ratio Study for Division III Equalization Funding: 1999 Project Summary prepared for the State of Delaware Office of the Budget by Edward C. Ratledge Center for Applied Demography and
Carver County AFFORDABLE HOUSING UPDATE
 Carver County AFFORDABLE HOUSING UPDATE July 2017 City of Chaska Community Partners Research, Inc. Lake Elmo, MN Executive Summary - Chaska Key Findings - 2017 Affordable Housing Study Update Chaska is
RENTERS GUIDE TO EVICTION COURT
 RENTERS GUIDE TO EVICTION COURT This booklet briefly describes the eviction process for Chicago renters who are in eviction court at the Daley Center, 50 W. Washington Street, Chicago, IL Subsidized Housing
[Hodges v. Sasil Corp., 189 N.J. 210, 221 (2007).]
![[Hodges v. Sasil Corp., 189 N.J. 210, 221 (2007).]](/thumbs/73/69188870.jpg "[Hodges v. Sasil Corp., 189 N.J. 210, 221 (2007).]") By: NON-PAYMENT OF RENT LANDLORD-TENANT PRACTICE TIPS Alexander G. Fisher, Esq. Mauro, Savo, Camerino, Grant & Schalk, P.A. Michael P. O Grodnick, Esq. Mauro, Savo, Camerino, Grant & Schalk, P.A. 1. An
By: NON-PAYMENT OF RENT LANDLORD-TENANT PRACTICE TIPS Alexander G. Fisher, Esq. Mauro, Savo, Camerino, Grant & Schalk, P.A. Michael P. O Grodnick, Esq. Mauro, Savo, Camerino, Grant & Schalk, P.A. 1. An
Expunging an Eviction Case
 Fact Sheet Expunging an Eviction Case What does expungement mean? Expungement means removing the record of a court case from the public view. If your eviction court case is expunged, then someone searching
MONTGOMERY COUNTY JULY 2018
 STATPAK MONTGOMERY COUNTY JULY 2018 McEnearney.com MARKET IN A MINUTE A SUMMARY OF MARKET CONDITIONS FOR JUNE & FIRST HALF 2018 Contract activity in June 2018 was up 1.2% from June 2017, solely because
STATPAK MARKET IN A MINUTE A SUMMARY OF MARKET CONDITIONS FOR JULY McEnearney.com CONTRACTS URGENCY INDEX INVENTORY INTEREST RATES AFFORDABILITY
 STATPAK LOUDOUN COUNTY AUGUST 2017 McEnearney.com MARKET IN A MINUTE A SUMMARY OF MARKET CONDITIONS FOR JULY 2017 Contract activity in July 2017 was down 8.7% from July 2016, and there were decreases in
Foreclosure Counseling Program Report. Prepared by Karen Pederson, MSW, LISW Minnesota Homeownership Center
 2015 Foreclosure Counseling Program Report Prepared by Karen Pederson, MSW, LISW Minnesota Homeownership Center 2015 Foreclosure Counseling Key Findings 2,141 households served in 2015 Northwest 53 Northeast
Census Tract Data Analysis
 Data Analysis Study Area: s within the City of Evansville, Indiana Prepared For Mr. Kelley Coures City of Evansville Department of Metropolitan Development 1 NW MLK Jr. Boulevard Evansville, Indiana 47708
Landlord Tenant Law Module #2
 Landlord Tenant Law Module #2 LEADING AGE MINNESOTA 2015 HOUSING-WITH-SERVICES MANAGEMENT CERTIFICATE PROGRAM May 13, 2015 April J. Boxeth, Esq. Voigt, Rodè & Boxeth, LLC 2550 University Ave W, Suite 190
Overview - Training Objectives
 Overview - Training Objectives Learn to recognize the type of case How can you help the constituent? I m not a lawyer and you are not a lawyer what can we do? How can we bring housing justice to Housing
STATPAK MARKET IN A MINUTE A SUMMARY OF MARKET CONDITIONS FOR JUNE & FIRST HALF McEnearney.com CONTRACTS URGENCY INDEX INVENTORY INTEREST RATES
 STATPAK LOUDOUN COUNTY JULY 2018 McEnearney.com MARKET IN A MINUTE A SUMMARY OF MARKET CONDITIONS FOR JUNE & FIRST HALF 2018 Contract activity in June 2018 was up 5.1% from June 2017. Through the first
Revenue Received from State Mineral Leases FY
 This document is made available electronically by the Minnesota Legislative Reference Library as part of an ongoing digital archiving project. http://www.leg.state.mn.us/lrl/lrl.asp Revenue Received from
STATPAK MARKET IN A MINUTE A SUMMARY OF MARKET CONDITIONS FOR JANUARY McEnearney.com CONTRACTS URGENCY INDEX INVENTORY INTEREST RATES
 STATPAK LOUDOUN COUNTY FEBRUARY 2018 McEnearney.com MARKET IN A MINUTE A SUMMARY OF MARKET CONDITIONS FOR JANUARY 2018 Contract activity in January 2018 was down just 2.0% from January 2017, but that is
NORTHERN VIRGINIA MARCH 2017
 STATPAK NORTHERN VIRGINIA MARCH 2017 McEnearney.com MARKET IN A MINUTE A SUMMARY OF MARKET CONDITIONS FOR FEBRUARY 2017 Contract activity in February 2017 was up 4.0% from February 2016, and there were
The Impact of Market Rate Vacancy Increases Eleven-Year Report
 The Impact of Market Rate Vacancy Increases Eleven-Year Report January 1, 1999 - December 31, 2009 Santa Monica Rent Control Board April 2010 TABLE OF CONTENTS Summary 1 Vacancy Decontrol s Effects on
MINNESOTA BASELINE HOUSING MEASURES
 2010 MINNESOTA BASELINE HOUSING MEASURES June 2010 710 South Second Street, Suite 400 Minneapolis, MN 55401 T. 612 333 4220 F. 612 332 3833 www.mcknight.org Prepared by: 275 Market Street Suite 509 Minneapolis
James Alm, Robert D. Buschman, and David L. Sjoquist In the wake of the housing market collapse
 istockphoto.com How Do Foreclosures Affect Property Values and Property Taxes? James Alm, Robert D. Buschman, and David L. Sjoquist In the wake of the housing market collapse and the Great Recession which
How Did Foreclosures Affect Property Values in Georgia School Districts?
 Tulane Economics Working Paper Series How Did Foreclosures Affect Property Values in Georgia School Districts? James Alm Department of Economics Tulane University New Orleans, LA jalm@tulane.edu Robert
Notice for Suspension of Small Area Fair Market Rent (Small Area FMR) Designations: Solicitation of Comment - Docket No.
 Designations: Solicitation of Comment - Docket No.") January 11, 2018 VIA ELECTRONIC SUBMISSION Regulations Division Office of General Counsel U.S. Department of Housing and Urban Development Room 10276 451 Seventh Street SW Washington, DC 20410-0500 Re:
January 11, 2018 VIA ELECTRONIC SUBMISSION Regulations Division Office of General Counsel U.S. Department of Housing and Urban Development Room 10276 451 Seventh Street SW Washington, DC 20410-0500 Re:
The Impact of Using. Market-Value to Replacement-Cost. Ratios on Housing Insurance in Toledo Neighborhoods
 The Impact of Using Market-Value to Replacement-Cost Ratios on Housing Insurance in Toledo Neighborhoods February 12, 1999 Urban Affairs Center The University of Toledo Toledo, OH 43606-3390 Prepared by
The rapidly rising price of single-family homes in. Change and Challenges East Austin's Affordable Housing Problem
 Change and Challenges East 's Affordable Housing Problem Harold D. Hunt and Clare Losey March 2, 2017 Publication 2161 The rapidly rising price of single-family homes in East has left homeownership out
Chapter 12 Changes Since This is just a brief and cursory comparison. More analysis will be done at a later date.
 Chapter 12 Changes Since 1986 This approach to Fiscal Analysis was first done in 1986 for the City of Anoka. It was the first of its kind and was recognized by the National Science Foundation (NSF). Geographic
Memo to the Planning Commission JULY 12TH, 2018
 Memo to the Planning Commission JULY 12TH, 2018 Topic: California State Senate Bill 828 and State Assembly Bill 1771 Staff Contacts: Joshua Switzky, Land Use & Housing Program Manager, Citywide Division
WISCONSIN HOUSING MARKETPLACE
 WISCONSIN REALTORS ASSOCIATION WISCONSIN HOUSING MARKETPLACE Date: 2/16/06 For Release: Immediately For More Information Contact: David E. Clark, Economist C3 Statistical Solutions Inc. Office phone: 414-803-6537
Rent Stabilization, Vacancy Decontrol and Reinvestment in Rental Property in Berkeley, California
 Rent Stabilization, Vacancy Decontrol and Reinvestment in Rental Property in Berkeley, California REVISED FINAL REPORT July 16, 2012 Jay Kelekian, Executive Director Stephen Barton, Ph.D., Project Manager
MONTGOMERY COUNTY APRIL 2018
 STATPAK MONTGOMERY COUNTY APRIL 2018 McEnearney.com MARKET IN A MINUTE A SUMMARY OF MARKET CONDITIONS FOR MARCH 2018 Contract activity in March 2018 was down 6.0% from March 2017, and there were decreases
CITY OF CLAREMONT MASTER PLAN 2017 CHAPTER 6: HOUSING
 CITY OF CLAREMONT MASTER PLAN CHAPTER 6: HOUSING Prepared by the Claremont Planning Board and the Claremont Planning and Development Department Vision Claremont Master Plan Chapter 6: Housing Quality housing
Exposure Draft ED/2013/6, issued by the International Accounting Standards Board (IASB)
") Leases Exposure Draft ED/2013/6, issued by the International Accounting Standards Board (IASB) Comments from ACCA 13 September 2013 ACCA (the Association of Chartered Certified Accountants) is the global
Leases Exposure Draft ED/2013/6, issued by the International Accounting Standards Board (IASB) Comments from ACCA 13 September 2013 ACCA (the Association of Chartered Certified Accountants) is the global
Minneapolis Trends. Permitted residential conversions, remodels and additions. Permitted non-residential conversions, remodels and additions
 Minneapolis Trends A Quarterly Overview of Socioeconomic & Housing Trends in Minneapolis Highlights for the fourth quarter of 214 fourth quarter 214 Labor force 219,419 residents change from 4Q-14 3Q-14
MARKET IN A MINUTE A SUMMARY OF MARKET CONDITIONS FOR MARCH & 1st QUARTER 2016
 STATPAK ` WASHINGTON, DC APRIL 2016 MARKET IN A MINUTE A SUMMARY OF MARKET CONDITIONS FOR MARCH & 1st QUARTER 2016 Contract activity in March 2016 was up 12.6% from March of 2015, and there were increases
STATPAK MARKET IN A MINUTE A SUMMARY OF MARKET CONDITIONS FOR AUGUST McEnearney.com CONTRACTS URGENCY INDEX INVENTORY INTEREST RATES
 STATPAK WASHINGTON, DC SEPTEMBER 2017 McEnearney.com MARKET IN A MINUTE A SUMMARY OF MARKET CONDITIONS FOR AUGUST 2017 Contract activity in August 2017 was up 4.9% from August 2016, and there were increases
March 3, 2017 Prepared by
 MN Housing Measures 2012-2015 March 3, 2017 Prepared by 2012-2015 MINNESOTA HOUSING MEASURES Naturally Occurring Affordable Housing (NOAH) Percent of Private Market Rental Listings Affordable to 60% AMI
MONTGOMERY COUNTY MAY 2018
 STATPAK MONTGOMERY COUNTY MAY 2018 McEnearney.com MARKET IN A MINUTE A SUMMARY OF MARKET CONDITIONS FOR APRIL 2018 Contract activity in April 2018 was up just 0.9% from, but there were increases in four
WACONIA TOWNSHIP Draft Policy Chapter
 WACONIA TOWNSHIP Draft Policy Chapter Produced by CARVER COUNTY Planning and Water Management Department Government Center, Administration Building 600 East 4th Street, Chaska, MN 55318 TOWNSHIP OVERVIEW
MEMORANDUM. Background
 MEMORANDUM Background In your e-mail following our national coalition conference call of May 20, 2009, you asked a number of questions related to the details of the pilot project. I attempt to respond
acuitas, inc. s survey of fair value audit deficiencies August 31, 2014 pcaob inspections methodology description of a deficiency
 August 31, 2014 home executive summary audit deficiencies improve pcaob inspections methodology description of a deficiency audit deficiency trends fvm deficiencies description of fair value measurement
Eviction. Court approval required
 Eviction An eviction is a lawsuit filed by a landlord to remove persons and belongings from the landlord's property. In Texas law, these are also referred to as "forcible entry and detainer" or "forcible
BUSINESS PROPERTY THE REAL VALUE OF. New Minnesota law gives appraisers a way to establish minimum compensation in eminent domain cases
 THE REAL VALUE OF BUSINESS PROPERTY New Minnesota law gives appraisers a way to establish minimum compensation in eminent domain cases BY JOHN SCHMICK Real estate markets are dynamic in nature, constantly