EDA President Krant, EDA Board Members, and Interim Administrator Meyer
|
|
|
- Denis Baker
- 6 years ago
- Views:
Transcription
1 MEMORANDUM DATE: April 9, 2018 TO: FROM: RE: EDA President Krant, EDA Board Members, and Interim Administrator Meyer Cynthia Smith Strack, Community Development Director Item 5.2 Meeting with Area Realtors and Developers GENERAL INFORMATION 2018 EDA goals include bringing new residential lots to market and meeting with various market sectors to further collaboration, rapport, and understanding. To those ends staff recommended and the EDA scheduled a meeting with area realtors and developers to gain input/insight into the current market, express our interest in their expertise, and learn about bringing additional lots to market. A work session is scheduled for April 18 th from 5 to 6 p.m. Attached for background information please find a report from MN Post regarding difficulties first time home buyers are facing in the current market and the 2017 Minnesota Realtors Association annual report on the Minnesota housing market. Following is a framework for discussion which is intended to be round-table style. Commissioners will each receive a copy of the questions at the work session and are asked to share in prompting discussion by asking said questions and others you feel are appropriate. 1. How would you describe the current real estate market residential first, then commercial in Belle Plaine? Sound, dynamic, short on inventory, etc. 2. At the national and regional level experts report a crippling shortage of inventory... is that true locally? How severe is it? What are contributing factors? 3. What types of housing and what price points for new inventory are needed most? 4. In previous cycles, increased demand and strong prices enticed construction. Why is that not happening this time? Why aren t builders building, developers developing? When do you think it will turn? 5. What densities are needed to cash flow new development? Do those densities match up with market demand in your estimation? 6. The City has refrained from raising fees associated with development for several years. What, in addition, can the City do to raise awareness of key issues or solutions or what resources can the City help develop and communicate to increase inventory? 7. How can the City address the fear of new development at the neighborhood level which in the past has derailed higher density developments? 8. Do we need rentals? What types? 9. Is there an adequate supply of contractors/subs locally? Are building material prices restricting supply? 10. Where specifically should redevelopment/rehabilitation be a priority? What is the correct level of participation by the City in promoting redevelopment/rehabilitation?
2 11. What trends will drive the real estate and development markets in the future? 12. Big cities are getting more expensive, is that an opportunity for Belle Plaine or a challenge to curtail land consumption? REQUEST This item is for information and discussion.

3 Why it s extremely difficult to buy a first home in Minnesota right now By Greta Kaul 02/01/18 At the end of 2006, there was about a 7-month supply of home inventory in the Twin Cities. Today, there s about a 1.4-month supply. It s an agonizing problem for a lot of young people. You want to buy a house of your own. You can t find a lot in your price range. You keep throwing rent money more-orless down the drain and wondering if your income will ever support owning your own place. You despair as, in some ways, that prospect seems to grow dimmer all the time, even though you re not living in a coastal city with sky-high home values. It s not just millennials imaginations, and it s not because they spend too much money on avocado toast. The housing market has been hot before, but several factors, including rising home prices, high demand, low inventory, and the rising cost of building new homes have conspired to make now an especially difficult time to get a foot in the door of home ownership. Insufficient funds The first piece of buying a house, of course, is having the money to pay for it the down payment, the mortgage, the taxes and the maintenance. But the cost of houses is rising faster than people s incomes, making affording each of those pieces that much farther out of reach. In 2014, just after the economy came out of the Great Recession, median home list prices in Minneapolis-St. Paul were more than three times greater than median household incomes, according to data compiled by the Federal Reserve Bank of Minneapolis. Median home prices have been rising fast, and are now record-high, at $246,000 a year compared to a previous alltime high of $230,000, according to data from the Minneapolis Area Association of Realtors. Median sale price for Twin Cities homes, The median sale price for Twin Cities homes has been climbing in recent years. These figures are not adjusted for inflation. Wages have begun to see meaningful increases after years of stagnation, but house prices are rising faster: in the Twin Cities today, they re more than four times greater than median household incomes, according to the Minneapolis Fed. Home list prices are also outpacing growth in household income in Fargo-Moorhead and Rochester (and nationwide, for that matter) compared to just a few years ago.
4 High demand, low inventory Even though incomes are rising, albeit slowly, many people are less willing than they might have been a decade ago to look at more expensive homes, having watched the housing market implode during the financial crisis. That s despite low interest rates for borrowing. If you re most people, your first home, you re probably looking to keep your payments in that $1,200 to $1,600 a month sweet spot analogous to the rent on a two-bedroom apartment, said David Arbit, director of research and economics at the Minneapolis Area Association of Realtors. People are kind of payment sensitive, especially after everything that happened with the housing downturn. Meanwhile, there are people looking in that lower price range who can afford to offer over asking, said Karli Pikala, a realtor with Verve Realty in Minneapolis who is in the market for a starter home herself. Sellers, on average, are getting a high percentage of their asking price, with some would-be buyers offering above asking prices. Whereas a family of four with an annual household income of $100,000 might have looked at buying a $400,000 to $600,000 home in 2006, today they re going to be much more focused on that $200,000 to $250,000, maybe stretching to that $300,000 house, Arbit said. In this environment, people with limited budgets are at a loss because there s these other people swooping in and they have more flexibility with what they can afford, Pikala said. All that adds up to even more interest in houses in the starter home segment of the market. But there aren t necessarily a lot of them available. There s definitely a lot of demand for houses in the lower price range, Pikala said. There s a ton of competition, which can be really frustrating, of course, for first-time home buyers, because a lot of them really can t afford to go over their (budget). We ve seen high demand for homes before, but the short supply is more acute now, Arbit said. That has ripples beyond the new homeowner set. The lack of homes under $250,000 means more competition in the market, which also affects, say, baby boomers looking to downsize. It means many young professionals who, in past generations, might have bought a house, are renting, putting pressure on the rental stock and making it harder for lower-income people to find places to live. At the end of 2006, there was about a 7-month supply of home inventory in the Twin Cities. Today, there s a less than two month supply, Arbit said. The lack of inventory puts pressure on prices. New homes Compared to today, in the early 2000s, it was relatively cheap to build a house or a development, and relatively easy to get a loan to finance it. Times have changed, with prices for materials rising and banks more hesitant to make loans. Today, developers are sinking more costs into building a housing unit than they were in the past.
5 It starts with the land, which has increased in cost since the cheap, bank-owned land that flooded the post-recession market was scooped up. Before you put a house in the ground, it used to be, about 20 to 30 years ago, the rule of thumb was the cost of a lot that was about 30 percent of a house, so if you could build an actual house you'd sort of do a multiplier of three to four, said Remi Stone, executive vice president of the Builders Association of Minnesota. Today, the lot might cost $100,000 multiply that by three or four and you ve missed the $250,000 and below market entirely. The rise in new construction costs is also a result of more expensive raw materials: tariffs and demands on lumber mean some construction companies are paying 30 percent more, Stone said, and some of the higher-tech materials that go into houses now drive up prices, too. Labor, too. The construction industry was hit hard by the housing bust and is facing a major workforce shortage, especially acute among workers with five to six years of experience, because fewer made a start in the construction industry during the recession, said Mike Paradise, the president of Bigelow Homes, a residential homebuilder in Rochester, who serves on Gov. Mark Dayton s housing affordability task force. The shortage of workers means contractors have to pay higher wages to attract and retain workers, which adds to the overall cost of a home. There s also the matter of regulations local, state and federal. While some like energy efficiency rules have good intentions and good results, Paradise said, they add to construction costs. In his view, it's important to make sure regulations are needed and costeffective. The rising cost of new construction is driving up the cost of all homes, Paradise said, as existing homes are a substitute for new, and if people who live in starter homes now can t move into a house that s a step up, or a step over from the home they re in, that starter home isn t available for the next family. It s the perfect storm all the factors lining up to create some issues, Paradise said. If we don t change anything, it can get worse. He urges policymakers to look at different types of housing: from townhomes to condos and single-family homes, to figure out how to meet the needs of a population whose preferences and needs are changing. Advice from the experts Between rising home prices, short supply and lots of competition, it s a tough time to be buying a starter home. But all is not lost, experts insist. Kath Hammerseng, an Edina Realty realtor and the president of the Minneapolis Area Association of Realtors, said it s important for new homebuyers to be open-minded: your first house might not be your dream house maybe not right away, maybe not ever. In this market, a lot of reasonably-priced starter homes are going to need some elbow grease, she said.
6 Think about what you can create, dream about the potential places have, but try not to need it to be ready, turnkey ready, she said. Look for that orange carpet and purple walls some people can t look past that. And, Pikala said, be patient. The advice I would give to people looking is just to keep your expectations realistic, she said. Just know that houses are (getting) multiple offers, so try not to get your hopes up too much. There s always something else that will come along. Be patient,
7
8 X0A0T Annual Report on the Minnesota Housing Market FOR RESIDENTIAL REAL ESTATE ACTIVITY IN THE STATE OF MINNESOTA
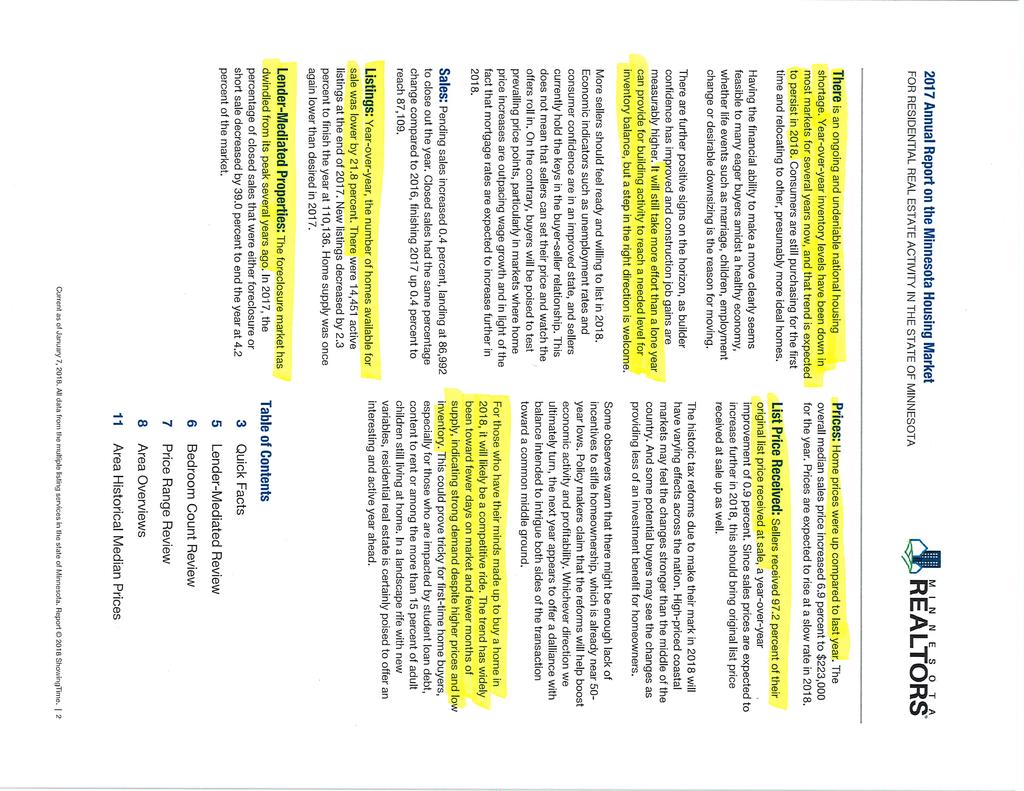
9 X1A0T 2017 Annual Report on the Minnesota Housing Market FOR RESIDENTIAL REAL ESTATE ACTIVITY IN THE STATE OF MINNESOTA There is an ongoing and undeniable national housing shortage. Year-over-year inventory levels have been down in most markets for several years now, and that trend is expected to persist in Consumers are still purchasing for the first time and relocating to other, presumably more ideal homes. Having the financial ability to make a move clearly seems feasible to many eager buyers amidst a healthy economy, whether life events such as marriage, children, employment change or desirable downsizing is the reason for moving. There are further positive signs on the horizon, as builder confidence has improved and construction job gains are measurably higher. It will still take more effort than a lone year can provide for building activity to reach a needed level for inventory balance, but a step in the right direction is welcome. More sellers should feel ready and willing to list in Economic indicators such as unemployment rates and consumer confidence are in an improved state, and sellers currently hold the keys in the buyer-seller relationship. This does not mean that sellers can set their price and watch the offers roll in. On the contrary, buyers will be poised to test prevailing price points, particularly in markets where home price increases are outpacing wage growth and in light of the fact that mortgage rates are expected to increase further in Sales: Pending sales increased 0.4 percent, landing at 86,992 to close out the year. Closed sales had the same percentage change compared to 2016, finishing 2017 up 0.4 percent to reach 87,109. Listings: Year-over-year, the number of homes available for sale was lower by 21.8 percent. There were 14,451 active listings at the end of New listings decreased by 2.3 percent to finish the year at 110,136. Home supply was once again lower than desired in Lender-Mediated Properties: The foreclosure market has dwindled from its peak several years ago. In 2017, the percentage of closed sales that were either foreclosure or short sale decreased by 39.0 percent to end the year at 4.2 percent of the market. Prices: Home prices were up compared to last year. The overall median sales price increased 6.9 percent to $223,000 for the year. Prices are expected to rise at a slow rate in List Price Received: Sellers received 97.2 percent of their original list price received at sale, a year-over-year improvement of 0.9 percent. Since sales prices are expected to increase further in 2018, this should bring original list price received at sale up as well. The historic tax reforms due to make their mark in 2018 will have varying effects across the nation. High-priced coastal markets may feel the changes stronger than the middle of the country. And some potential buyers may see the changes as providing less of an investment benefit for homeowners. Some observers warn that there might be enough lack of incentives to stifle homeownership, which is already near 50- year lows. Policy makers claim that the reforms will help boost economic activity and profitability. Whichever direction we ultimately turn, the next year appears to offer a dalliance with balance intended to intrigue both sides of the transaction toward a common middle ground. For those who have their minds made up to buy a home in 2018, it will likely be a competitive ride. The trend has widely been toward fewer days on market and fewer months of supply, indicating strong demand despite higher prices and low inventory. This could prove tricky for first-time home buyers, especially for those who are impacted by student loan debt, content to rent or among the more than 15 percent of adult children still living at home. In a landscape rife with new variables, residential real estate is certainly poised to offer an interesting and active year ahead. Table of Contents 3 Quick Facts 5 Lender-Mediated Review 6 Bedroom Count Review 7 Price Range Review 8 Area Overviews 11 Area Historical Median Prices Current as of January 7, All data from the multiple listing services in the state of Minnesota. Report 2018 ShowingTime. 2
10 Quick Facts New Listings Pending Sales 115, , , ,136 75,433 72,393 83,442 86,667 86, , % + 6.5% - 2.1% - 2.3% - 4.0% % + 3.9% + 0.4% Top 5 Areas: Change in New Listings from 2016 Top 5 Areas: Change in Pending Sales from 2016 Pipestone County % Pipestone County % Norman County % Norman County % Nobles County % Polk County % Koochiching County % Nobles County % Wilkin County % Koochiching County % Bottom 5 Areas: Change in New Listings from 2016 Bottom 5 Areas: Change in Pending Sales from 2016 Lake of the Woods County % Watonwan County % Traverse County % Houston County % Yellow Medicine County % Pine County % Kittson County % Clearwater County % Watonwan County % Red Lake County % Closed Sales Inventory of Homes for Sale At the end of the year. 75,995 72,472 82,191 86,801 87,109 23,539 24,094 22,082 18,490 14, % % + 5.6% + 0.4% + 2.4% - 8.4% % % Top 5 Areas: Change in Closed Sales from 2016 Top 5 Areas: Change in Homes for Sale from 2016 Norman County % Marshall County % Pipestone County % Red Lake County % Polk County % Pennington County % Nobles County % Rock County % Lincoln County % Stevens County % Bottom 5 Areas: Change in Closed Sales from 2016 Bottom 5 Areas: Change in Homes for Sale from 2016 Steele County % Mower County % Clearwater County % Olmsted County % Houston County % Lincoln County % Wilkin County % Norman County % Red Lake County % Mahnomen County % Current as of January 7, All data from the multiple listing services in the state of Minnesota. Report 2018 ShowingTime. 3
11 Quick Facts Median Sales Price Average Sales Price $172,425 $180,625 $194,900 $208,600 $223,000 $211,208 $222,824 $232,741 $243,690 $260, % + 7.9% + 7.0% + 6.9% + 5.5% + 4.5% + 4.7% + 7.1% Top 5 Areas: Change in Median Sales Price from 2016 Top 5 Areas: Change in Avg. Sales Price from 2016 Norman County % Norman County % Pipestone County % Lac Qui Parle County % Jackson County % Pipestone County % Traverse County % Kittson County % Lac Qui Parle County % Jackson County % Bottom 5 Areas: Change in Median Sales Price from 2016 Bottom 5 Areas: Change in Avg. Sales Price from 2016 Clay County % Traverse County - 7.5% Mahnomen County % Koochiching County - 8.0% Swift County % Wilkin County - 8.2% Stevens County % Stevens County % Rock County % Rock County % Days on Market Until Sale Percent of Original List Price Received % 97.2% 95.5% 94.7% 94.5% + 1.4% - 5.4% % % - 0.2% + 1.1% + 0.8% + 0.9% Top 5 Areas: Change in Days on Market from 2016 Top 5 Areas: Change in Pct. of Orig. Price Received from 2016 Stevens County % Red Lake County + 5.2% Watonwan County % Big Stone County + 4.8% Kittson County % Marshall County + 4.5% Mahnomen County % Chippewa County + 4.2% Yellow Medicine County % Cottonwood County + 4.0% Bottom 5 Areas: Change in Days on Market from 2016 Bottom 5 Areas: Change in Pct. of Orig. Price Received from 2016 Grant County % Traverse County - 2.8% Traverse County % Mahnomen County - 3.2% Clay County % Pipestone County - 3.3% Murray County % Kittson County - 3.5% Norman County % Rock County - 3.5% Current as of January 7, All data from the multiple listing services in the state of Minnesota. Report 2018 ShowingTime. 4
12 Lender-Mediated Review 4.2% % Top Areas: Lender-Mediated Market Share in 2017 Percent of Closed Sales That Were Lender-Mediated One-Year Change in Lender-Mediated Sales Percent of Sales That Were Lender-Mediated 22.5% 14.2% 9.6% 6.9% 4.2% Pipestone County 13.6% Kanabec County 12.6% Pine County 9.7% Renville County 9.6% Lake County 8.6% Watonwan County 8.5% Sibley County 8.1% Meeker County 8.1% Morrison County 7.9% Mille Lacs County 7.9% Carlton County 7.8% Jackson County 7.7% Cottonwood County 7.5% Lincoln County 7.1% Aitkin County 7.0% Stevens County 6.7% Waseca County 6.7% Isanti County 6.6% Roseau County 6.5% Todd County 6.5% Polk County 6.4% Wadena County 6.2% Rice County 5.8% Saint Louis County 5.8% Benton County 5.7% Chippewa County 5.7% % % % % Three-Year Change in Price All Properties Three-Year Change in Price Traditional Properties Three-Year Change in Price Short Sales Three-Year Change in Price Foreclosures Median Sales Price $192,000 $203,000 $215,000 $226,000 $149,900 $155,000 $161,250 $167,500 $124,355 $120,000 $130,000 $139, % +5.9% +5.1% +3.4% +4.0% +3.9% -3.5% +8.3% +7.6% Traditional Short Sales Foreclosures Current as of January 7, All data from the multiple listing services in the state of Minnesota. Report 2018 ShowingTime. 5
13 Bedroom Count Review + 1.8% + 0.3% Growth in Closed Sales 2 Bedrooms or Less Closed Sales 20,525 20,889 34,196 34,024 Growth in Closed Sales 4 Bedrooms or More ,904 32, % - 0.5% + 0.3% 2 Bedrooms or Less 3 Bedrooms 4 Bedrooms or More The sum of all bedroom information shown may not match all property totals due to some listings not having bedroom information classified in the MLS and bedroom information being unavailable from RASM and WCAR. Top Areas: 4 Bedrooms or More Market Share in 2017 Carver County 50.4% Scott County 48.9% Stevens County 48.9% Olmsted County 47.2% Clay County 46.5% Red Lake County 45.5% Washington County 45.1% Benton County 45.1% Wright County 43.9% Lyon County 43.5% Sherburne County 43.4% Stearns County 42.4% Nicollet County 42.1% Redwood County 42.1% Dakota County 42.0% Anoka County 41.0% Goodhue County 40.2% Blue Earth County 40.1% Dodge County 40.1% Wilkin County 40.0% Yellow Medicine County 38.6% Douglas County 38.6% Chisago County 37.6% Rice County 37.1% Kandiyohi County 36.7% Steele County 36.4% 97.2% 96.9% 97.5% 97.0% Percent of Original List Price Received in 2017 for All Properties Percent of Original List Price Received in 2017 for 2 Bedrooms or Less Percent of Original List Price Received in 2017 for 3 Bedrooms Percent of Original List Price Received in 2017 for 4 Bedrooms or More Percent of Original List Price Received This chart uses a rolling 12-month average for each data point. 98% 2 Bedrooms or Less 3 Bedrooms 4 Bedrooms or More 97% 96% 95% 94% 93% 92% 91% Current as of January 7, All data from the multiple listing services in the state of Minnesota. Report 2018 ShowingTime. 6
14 Price Range Review $150,001 to $200,000 Price Range with Shortest Average Days on Market Until Sale Days on Market Until Sale by Price Range $100,000 and Below 10.0% Price Range with Longest Average Days on Market Until Sale of Closed Sales at Year End were Priced $100,000 and Below Share of Closed Sales $100,000 and Below % One-Year Change in Closed Sales Priced $100,000 and Below $100,000 and Below 92 30% $100,001 to $150, % $150,001 to $200,000 $200,001 to $300,000 $300,001 to $400, % 15% $400,001 to $500, % $500,001 and Above 82 5% $200,001 to $300, % Price Range with the Most Closed Sales Price Range with Strongest One-Year Change in Sales: $500,001 and Above $400,001 to $500, % Price Range with the Fewest Closed Sales Price Range with Weakest One-Year Change in Sales: $100,000 and Below Closed Sales by Price Range ,807 25,155 21,650 18,180 18,739 17,905 10,282 9,293 7,636 14,736 13,249 11,256 9,239 12,313 10,736 4,809 5,450 5,741 3,869 4,235 4,820 $100,000 and Below $100,001 to $150,000 $150,001 to $200,000 $200,001 to $300,000 $300,001 to $400,000 $400,001 to $500,000 $500,001 and Above The total number of closed sales across price ranges is not necessarily the sum of all sales due to some invalid prices in MLS entries. Current as of January 7, All data from the multiple listing services in the state of Minnesota. Report 2018 ShowingTime. 7
15 Area Overviews Total Closed Sales Change from 2016 Percent Foreclosures Percent Short Sales Percent Traditional Days on Market Until Sale Pct. of Orig. Price Received Entire State 87, % 1.7% 0.6% 95.8% % 1 Northwest Region % 2.0% 0.2% 94.4% % 2 Headwaters Region 1, % 1.5% 0.4% 96.8% % 3 Arrowhead Region 4, % 4.2% 0.4% 93.7% % 4 West Central Region 2, % 1.4% 0.2% 98.1% % 5 North Central Region 3, % 2.2% 0.4% 94.4% % 6E Southwest Central Region 1, % 1.6% 0.2% 95.3% % 6W Upper Minnesota Valley Region % 2.2% 0.0% 97.3% % 7E East Central Region 2, % 2.4% 1.1% 92.9% % 7W Central Region 7, % 1.4% 0.6% 95.2% % 8 Southwest Region % 2.7% 0.4% 96.3% % 9 South Central Region 3, % 1.2% 0.3% 95.6% % 10 Southeast Region 7, % 1.0% 0.4% 97.6% % 11 7-County Twin Cities Region 51, % 1.5% 0.7% 95.9% % Aitkin County % 3.2% 1.0% 92.9% % Anoka County 6, % 2.3% 0.8% 94.5% % Becker County % 1.5% 0.0% 98.5% % Beltrami County % 1.8% 0.4% 96.6% % Benton County % 2.2% 0.7% 94.3% % Big Stone County % 0.0% 0.0% 100.0% % Blue Earth County % 0.2% 0.0% 98.4% % Brown County % 1.5% 0.0% 94.6% % Carlton County % 5.6% 0.2% 92.1% % Carver County 2, % 0.9% 0.4% 97.3% % Cass County % 2.1% 0.4% 95.9% % Chippewa County % 4.1% 0.0% 95.0% % Chisago County 1, % 1.5% 0.8% 95.4% % Clay County % 5.5% 0.0% 94.5% % Clearwater County % 3.8% 0.0% 96.2% % Cook County % 3.0% 0.6% 96.4% % Cottonwood County % 7.5% 0.0% 92.5% % Crow Wing County 1, % 1.4% 0.4% 95.1% % Dakota County 7, % 1.4% 0.8% 95.6% % Dodge County % 0.9% 0.0% 98.2% % Douglas County % 0.6% 0.1% 98.8% % Current as of January 7, All data from the multiple listing services in the state of Minnesota. Report 2018 ShowingTime. 8
16 Area Overviews Total Closed Sales Change from 2016 Percent Foreclosures Percent Short Sales Percent Traditional Days on Market Until Sale Pct. of Orig. Price Received Faribault County % 2.6% 0.5% 95.8% % Fillmore County % 3.2% 0.5% 96.4% % Freeborn County % 1.4% 0.2% 97.3% % Goodhue County % 0.9% 0.6% 95.5% % Grant County % 0.0% 0.0% 97.9% % Hennepin County 20, % 1.4% 0.6% 96.4% % Houston County % 0.0% 0.0% 100.0% % Hubbard County % 0.8% 0.5% 97.4% % Isanti County % 2.6% 1.2% 93.4% % Itasca County % 1.0% 0.2% 95.7% % Jackson County % 8.7% 0.0% 91.3% % Kanabec County % 3.5% 2.6% 88.2% % Kandiyohi County % 1.3% 0.2% 98.2% % Kittson County % 0.0% 0.0% 100.0% % Koochiching County % 2.5% 0.0% 95.1% % Lac Qui Parle County % 0.0% 0.0% 98.2% % Lake County % 4.6% 0.3% 92.8% % Lake of the Woods County % 0.0% 0.0% 95.8% % Le Sueur County % 0.8% 0.6% 94.9% % Lincoln County % 0.0% 0.0% 95.1% % Lyon County % 1.4% 0.7% 97.9% % Mahnomen County % 3.8% 0.0% 96.2% % Marshall County % 0.0% 0.0% 96.7% % Martin County % 3.2% 0.5% 95.4% % McLeod County % 1.4% 0.0% 95.0% % Meeker County % 1.3% 0.3% 92.6% % Mille Lacs County % 4.1% 0.4% 92.1% % Morrison County % 2.6% 0.0% 92.2% % Mower County % 3.7% 0.6% 95.4% % Murray County % 2.6% 0.0% 97.4% % Nicollet County % 0.7% 0.0% 95.3% % Nobles County % 2.8% 0.0% 97.2% % Norman County % 0.0% 0.0% 100.0% % Olmsted County 2, % 0.3% 0.2% 99.5% % Otter Tail County % 1.9% 0.1% 98.0% % Current as of January 7, All data from the multiple listing services in the state of Minnesota. Report 2018 ShowingTime. 9
17 Area Overviews Total Closed Sales Change from 2016 Percent Foreclosures Percent Short Sales Percent Traditional Days on Market Until Sale Pct. of Orig. Price Received Pennington County % 2.0% 0.7% 96.7% % Pine County % 1.6% 1.2% 89.7% % Pipestone County % 4.8% 0.0% 85.7% % Polk County % 5.4% 0.0% 90.1% % Pope County % 0.0% 1.2% 97.0% % Ramsey County 7, % 1.8% 0.6% 95.1% % Red Lake County % 0.0% 0.0% 100.0% % Redwood County % 2.4% 0.6% 96.3% % Renville County % 4.6% 0.7% 90.2% % Rice County % 1.0% 0.3% 95.6% % Rock County % 4.0% 0.0% 96.0% % Roseau County % 0.0% 0.0% 93.5% % Scott County 2, % 0.9% 1.1% 96.0% % Sherburne County 1, % 1.3% 0.6% 95.0% % Sibley County % 2.5% 2.0% 89.6% % Saint Louis County 2, % 4.9% 0.5% 93.5% % Stearns County 2, % 1.7% 0.7% 94.6% % Steele County % 0.4% 0.4% 96.5% % Stevens County % 4.4% 0.0% 93.3% % Swift County % 0.0% 0.0% 100.0% % Todd County % 3.5% 0.7% 92.2% % Traverse County % 0.0% 0.0% 100.0% % Wabasha County % 2.0% 0.7% 97.7% % Wadena County % 5.9% 0.0% 92.6% % Waseca County % 1.0% 0.0% 94.9% % Washington County 4, % 1.0% 0.7% 96.7% % Watonwan County % 8.5% 0.0% 91.5% % Wilkin County % 0.0% 0.0% 100.0% % Winona County % 1.7% 0.8% 97.7% % Wright County 2, % 1.1% 0.6% 96.0% % Yellow Medicine County % 4.5% 0.0% 95.5% % Current as of January 7, All data from the multiple listing services in the state of Minnesota. Report 2018 ShowingTime. 10
18 Area Historical Median Prices Change From 2016 Change From 2013 Entire State $172,425 $180,625 $194,900 $208,600 $223, % % 1 Northwest Region $91,000 $91,500 $123,000 $121,500 $125, % % 2 Headwaters Region $135,000 $140,500 $147,000 $150,000 $160, % % 3 Arrowhead Region $131,000 $135,500 $141,000 $145,000 $153, % % 4 West Central Region $150,000 $152,500 $166,000 $173,000 $180, % % 5 North Central Region $145,000 $145,000 $150,100 $162,000 $172, % % 6E Southwest Central Region $120,000 $128,000 $133,500 $135,000 $145, % % 6W Upper Minnesota Valley Region $72,400 $65,000 $73,500 $72,750 $77, % + 6.5% 7E East Central Region $131,900 $149,900 $160,000 $174,000 $190, % % 7W Central Region $160,000 $170,000 $182,000 $194,900 $211, % % 8 Southwest Region $91,500 $95,000 $100,000 $105,000 $115, % % 9 South Central Region $129,900 $132,500 $141,000 $148,500 $154, % % 10 Southeast Region $142,500 $145,500 $157,850 $168,000 $182, % % 11 7-County Twin Cities Region $199,000 $212,000 $224,900 $236,900 $250, % % Aitkin County $144,000 $148,825 $148,000 $157,450 $161, % % Anoka County $174,900 $187,750 $200,000 $219,900 $232, % % Becker County $169,500 $185,000 $179,900 $192,000 $215, % % Beltrami County $141,450 $141,500 $146,000 $157,000 $164, % % Benton County $138,000 $149,500 $154,000 $165,000 $176, % % Big Stone County $85,000 $76,000 $76,150 $74,000 $90, % + 5.9% Blue Earth County $158,500 $158,000 $162,500 $181,178 $182, % % Brown County $109,000 $105,500 $116,000 $118,000 $123, % % Carlton County $126,000 $132,000 $143,500 $147,750 $156, % % Carver County $251,820 $258,100 $273,240 $279,950 $312, % % Cass County $166,000 $165,000 $178,000 $188,000 $210, % % Chippewa County $79,000 $72,000 $70,000 $74,250 $82, % + 3.8% Chisago County $165,000 $183,000 $191,450 $209,950 $229, % % Clay County $144,000 $136,000 $158,600 $208,000 $186, % % Clearwater County $100,000 $84,750 $93,500 $129,000 $131, % % Cook County $200,000 $215,000 $200,000 $212,500 $235, % % Cottonwood County $60,000 $53,500 $55,000 $73,750 $79, % % Crow Wing County $156,000 $165,000 $167,850 $178,000 $189, % % Dakota County $200,000 $215,000 $227,000 $240,000 $252, % % Dodge County $135,450 $130,000 $154,900 $154,900 $175, % % Douglas County $167,750 $168,500 $187,500 $192,500 $195, % % Current as of January 7, All data from the multiple listing services in the state of Minnesota. Report 2018 ShowingTime. 11
19 Area Historical Median Prices Change From 2016 Change From 2013 Faribault County $56,500 $59,000 $72,000 $69,950 $70, % % Fillmore County $92,000 $98,380 $112,000 $117,900 $128, % % Freeborn County $73,000 $77,000 $79,900 $87,200 $90, % % Goodhue County $147,650 $151,000 $165,500 $174,000 $195, % % Grant County $73,800 $69,950 $90,638 $100,000 $118, % % Hennepin County $209,900 $221,000 $235,000 $246,555 $263, % % Houston County $118,500 $129,700 $134,900 $144,000 $163, % % Hubbard County $149,900 $163,475 $163,000 $150,000 $179, % % Isanti County $128,050 $149,900 $161,533 $176,961 $195, % % Itasca County $140,000 $144,950 $145,000 $145,000 $165, % % Jackson County $37,750 $65,387 $60,000 $79,900 $120, % % Kanabec County $100,000 $101,500 $121,625 $130,000 $144, % % Kandiyohi County $135,000 $135,000 $144,000 $138,900 $150, % % Kittson County $0 $48,500 $69,900 $68,380 $86, % -- Koochiching County $72,000 $83,625 $65,500 $115,000 $112, % % Lac Qui Parle County $58,000 $41,000 $68,250 $48,000 $65, % % Lake County $125,000 $125,000 $125,000 $125,000 $129, % + 3.9% Lake of the Woods County $94,000 $112,000 $109,900 $112,000 $125, % % Le Sueur County $140,000 $144,575 $149,700 $162,000 $175, % % Lincoln County $64,200 $75,000 $74,500 $77,250 $77, % % Lyon County $126,000 $128,000 $130,000 $127,750 $135, % + 7.1% Mahnomen County $53,935 $68,000 $75,000 $73,475 $65, % % Marshall County $75,000 $75,000 $58,533 $82,500 $108, % % Martin County $89,900 $85,000 $104,000 $94,900 $89, % - 1.0% McLeod County $115,000 $131,500 $138,000 $141,250 $158, % % Meeker County $115,000 $121,000 $127,500 $139,000 $145, % % Mille Lacs County $110,000 $124,900 $137,500 $149,555 $160, % % Morrison County $117,250 $129,900 $131,000 $139,250 $150, % % Mower County $87,500 $89,850 $94,000 $99,950 $106, % % Murray County $112,000 $67,000 $159,000 $82,500 $107, % - 4.5% Nicollet County $155,000 $157,950 $170,000 $178,500 $179, % % Nobles County $126,450 $137,500 $125,000 $129,250 $137, % + 8.3% Norman County $72,000 $33,450 $60,000 $30,000 $58, % % Olmsted County $166,000 $169,850 $181,330 $197,500 $220, % % Otter Tail County $139,900 $140,000 $154,900 $158,500 $170, % % Current as of January 7, All data from the multiple listing services in the state of Minnesota. Report 2018 ShowingTime. 12

20 Area Historical Median Prices Change From 2016 Change From 2013 Pennington County $97,000 $127,000 $137,900 $143,000 $139, % % Pine County $103,000 $115,653 $118,450 $142,000 $135, % % Pipestone County $25,035 $42,400 $55,500 $50,000 $78, % % Polk County $72,000 $82,000 $93,250 $105,000 $122, % % Pope County $114,500 $126,000 $132,000 $135,000 $150, % % Ramsey County $163,000 $176,500 $187,855 $200,000 $216, % % Red Lake County $0 $57,900 $50,000 $92,250 $116, % -- Redwood County $67,700 $79,000 $68,750 $80,600 $97, % % Renville County $65,500 $73,500 $64,750 $75,000 $77, % % Rice County $157,000 $166,650 $171,000 $192,000 $216, % % Rock County $25,000 $85,000 $184,500 $147,500 $85, % % Roseau County $96,000 $94,500 $134,500 $114,125 $124, % % Scott County $226,750 $239,900 $245,000 $257,000 $266, % % Sherburne County $162,300 $175,000 $189,900 $209,575 $224, % % Sibley County $87,900 $94,950 $114,900 $126,000 $130, % % Saint Louis County $129,900 $133,000 $139,884 $144,000 $147, % % Stearns County $145,158 $150,000 $156,450 $164,000 $170, % % Steele County $129,450 $130,000 $144,500 $148,900 $158, % % Stevens County $89,750 $76,600 $78,000 $134,000 $107, % % Swift County $69,000 $63,750 $72,500 $73,000 $61, % % Todd County $99,000 $96,750 $111,000 $120,000 $118, % % Traverse County $55,250 $31,750 $59,000 $48,000 $71, % % Wabasha County $141,000 $139,900 $152,500 $154,550 $166, % % Wadena County $83,250 $88,000 $100,000 $108,000 $119, % % Waseca County $106,000 $109,000 $115,750 $120,000 $129, % % Washington County $220,000 $236,000 $242,150 $260,000 $278, % % Watonwan County $58,863 $79,500 $100,000 $83,500 $83, % % Wilkin County $159,900 $121,000 $82,750 $88,000 $102, % % Winona County $130,000 $132,000 $139,100 $149,900 $147, % % Wright County $176,000 $185,000 $205,000 $219,000 $236, % % Yellow Medicine County $56,275 $71,750 $82,250 $79,500 $75, % % Current as of January 7, All data from the multiple listing services in the state of Minnesota. Report 2018 ShowingTime. 13
Annual Report on the Minnesota Housing Market
 X0A0T Annual Report on the Minnesota Housing Market FOR RESIDENTIAL REAL ESTATE ACTIVITY IN THE STATE OF MINNESOTA X1A0T 2018 Annual Report on the Minnesota Housing Market FOR RESIDENTIAL REAL ESTATE ACTIVITY
Annual Report on the Minnesota Housing Market FOR RESIDENTIAL REAL ESTATE ACTIVITY IN THE STATE OF MINNESOTA
 Annual Report on the Minnesota Housing Market FOR RESIDENTIAL REAL ESTATE ACTIVITY IN THE STATE OF MINNESOTA FOR RESIDENTIAL REAL ESTATE ACTIVITY IN THE STATE OF MINNESOTA With a new U.S. president from
Out of Reach 2013 Minnesota
 Out of Reach 2013 Minnesota In Minnesota, the Fair Market Rent (FMR) for a two-bedroom apartment is $836. In order to afford this level of rent and utilities without paying more than 30% of on housing
Foreclosures in Minnesota: A Report Based on County Sheriff s Sale Data
 Foreclosures in Minnesota: A Report Based on County Sheriff s Sale Data February 26, 2009 Supplement Published by: Prepared by: 600 18 th Avenue North Minneapolis, MN 55411 Telephone: 612-522-2500 Facsimile:
STATE LAND OFFICE: An Inventory of Its Appraisals of State Land:
 MINNESOTA HISTORICAL SOCIETY Minnesota State Archives STATE LAND OFFICE: An Inventory of Its Appraisals of State Land: OVERVIEW OF THE RECORDS Agency: Series Title: Minnesota. State Land Office. Appraisals
Annual Report on the MLS PIN Housing Market A FREE RESEARCH TOOL FROM MLS PROPERTY INFORMATION NETWORK, INC.
 Annual Report on the MLS PIN Housing Market A FREE RESEARCH TOOL FROM MLS PROPERTY INFORMATION NETWORK, INC. Annual Report on the MLS PIN Housing Market A FREE RESEARCH TOOL FROM MLS PROPERTY INFORMATION
Out of. Reach. The growing gap between. Minnesota 2017 WAGES AND RENT. An annual report from
 Out of Reach Minnesota 2017 The growing gap between WAGES AND RENT An annual report from Executive Summary When families pay too much for rent, they re forced to sacrifice to make ends meet cutting back
Annual Report on the South Carolina Housing Market FOR RESIDENTIAL REAL ESTATE ACTIVITY FROM THE STATE OF SOUTH CAROLINA
 Annual Report on the South Carolina Housing Market FOR RESIDENTIAL REAL ESTATE ACTIVITY FROM THE STATE OF SOUTH CAROLINA Annual Report on the South Carolina Housing Market FOR RESIDENTIAL REAL ESTATE ACTIVITY
Annual Report on the Coastal Carolinas Housing Market RESIDENTIAL REAL ESTATE ACTIVITY IN THE COASTAL CAROLINAS
 Annual Report on the Coastal Carolinas Housing Market RESIDENTIAL REAL ESTATE ACTIVITY IN THE COASTAL CAROLINAS RESIDENTIAL REAL ESTATE ACTIVITY IN THE COASTAL CAROLINAS There is an ongoing and undeniable
Annual Report on the Hilton Head Housing Market
 X0A0T Annual Report on the Hilton Head Housing Market A FREE RESEARCH TOOL FROM THE HILTON HEAD AREA ASSOCIATION OF REALTORS Annual Report on the Hilton Head Housing Market A FREE RESEARCH TOOL FROM THE
Annual Report on the Charleston Area Housing Market FOR RESIDENTIAL REAL ESTATE ACTIVITY FROM THE CHARLESTON TRIDENT ASSOCIATION OF REALTORS MLS
 Annual Report on the Charleston Area Housing Market FOR RESIDENTIAL REAL ESTATE ACTIVITY FROM THE CHARLESTON TRIDENT ASSOCIATION OF REALTORS MLS FOR RESIDENTIAL REAL ESTATE ACTIVITY FROM THE CHARLESTON
EVICTIONS IN GREATER MINNESOTA
 EVICTIONS IN GREATER MINNESOTA HOME Line - May 2018 Contents Report Summary... 2 Context and Purpose... 2 Overview and Key Findings... 2 Conclusions and a Call to Action... 3 Notes about the Data... 4
2005 Property Values and Assessment Practices Report (Assessment year 2004)
") 2005 Property Values and Assessment Practices Report (Assessment year 2004) A report submitted to the Minnesota State Legislature pursuant to Laws 2001, First Special Session, Chapter 5, Article 3, Section
2005 Property Values and Assessment Practices Report (Assessment year 2004) A report submitted to the Minnesota State Legislature pursuant to Laws 2001, First Special Session, Chapter 5, Article 3, Section
2006 Property Values and Assessment Practices Report (Assessment Year 2005)
") 2006 Property Values and Assessment Practices Report (Assessment Year 2005) A report submitted to the Minnesota State Legislature pursuant to Laws 2001, First Special Session, Chapter 5, Article 3, Section
2006 Property Values and Assessment Practices Report (Assessment Year 2005) A report submitted to the Minnesota State Legislature pursuant to Laws 2001, First Special Session, Chapter 5, Article 3, Section
Annual Report on the Columbus Region Housing Market
 Annual Report on the Columbus Region Housing Market FOR RESIDENTIAL REAL ESTATE ACTIVITY IN THE COLUMBUS REGION Columbus REALTORS Multiple Listing Service (MLS) serves all of Delaware, Fayette, Franklin,
Annual Report on the REcolorado Housing Market
 Annual Report on the REcolorado Housing Market A RESEARCH TOOL PROVIDED BY RECOLORADO RESIDENTIAL LISTINGS SINGLE FAMILY DETACHED AND ATTACHED All data from REcolorado. Report 2018 ShowingTime. Due to
[A!] [N] rn ~ Lr~ DEPARTMENT OF NATURAL RESOURCES 500 LAFAYETIE ROAD ST. PAUL, MINNESOTA , _
![[A!] [N] rn ~ Lr~ DEPARTMENT OF NATURAL RESOURCES 500 LAFAYETIE ROAD ST. PAUL, MINNESOTA , _](/thumbs/93/112559545.jpg "[A!] [N] rn ~ Lr~ DEPARTMENT OF NATURAL RESOURCES 500 LAFAYETIE ROAD ST. PAUL, MINNESOTA , _") This document is made available electronically by the Minnesota Legislative Reference Library as part of an ongoing digital archiving project. http://www.leg.state.mn.us/lrl/lrl.asp 950217 ~ STATE OF [A!]
This document is made available electronically by the Minnesota Legislative Reference Library as part of an ongoing digital archiving project. http://www.leg.state.mn.us/lrl/lrl.asp 950217 ~ STATE OF [A!]
2004 Property Values and Assessment Practices Report
 2004 Property Values and Assessment Practices Report A report submitted to the Minnesota State Legislature pursuant to Laws 2001, First Special Session, Chapter 5, Article 3, Section 92. Property Tax Division
Manufactured Home Parks Handbook
 The Manufactured Home Parks Handbook From the Office of Minnesota Attorney General Mike Hatch www.ag.state.mn.us 1 The Manufactured Home Parks Handbook This handbook explains the Minnesota laws concerning
MINNESOTA ASSOCIATION OF COUNTY AUDITORS TREASURERS AND FINANCE OFFICERS 2016 COMMITTEE LIST. Committee Name County Address
 MINNESOTA ASSOCIATION OF COUNTY AUDITORS TREASURERS AND FINANCE OFFICERS 2016 COMMITTEE LIST Committee Name County Email Address Executive Committee President Laurie Davies Carver ldavies@co.carver.mn.us
2010 Property Values and Assessment Practices Report (Assessment Year 2009)
") This document is made available electronically by the Minnesota Legislative Reference Library as part of an ongoing digital archiving project. http://www.leg.state.mn.us/lrl/lrl.asp 2010 Property Values
This document is made available electronically by the Minnesota Legislative Reference Library as part of an ongoing digital archiving project. http://www.leg.state.mn.us/lrl/lrl.asp 2010 Property Values
Committee Name County Address
 MINNESOTA ASSOCIATION OF COUNTY AUDITORS TREASURERS AND FINANCE OFFICERS 2018 COMMITTEE LIST Executive Committee President Michelle Knutson Big Stone michelle.knutson@co.big-stone.mn.us First Vice President
Central Mississippi Annual Market Heartbeat RESIDENTIAL REAL ESTATE ACTIVITY FOR
 Central Mississippi Annual Market Heartbeat RESIDENTIAL REAL ESTATE ACTIVITY FOR FOR RESIDENTIAL REAL ESTATE ACTIVITY IN THE 3-COUNTY AREA With a new U.S. president from a different political party taking
Annual Report on the MLS PIN Housing Market A FREE RESEARCH TOOL FROM MLS PROPERTY INFORMATION NETWORK, INC.
 Annual Report on the MLS PIN Housing Market A FREE RESEARCH TOOL FROM MLS PROPERTY INFORMATION NETWORK, INC. Annual Report on the MLS PIN Housing Market A FREE RESEARCH TOOL FROM MLS PROPERTY INFORMATION
Weekly Market Activity Report
 X0A0T Weekly Market Report A RESEARCH TOOL FROM THE MINNEAPOLIS AREA ASSOCIATION OF REALTORS BROUGHT TO YOU BY THE UNIQUE DATA-SHARING TRADITIONS OF THE REALTOR COMMUNITY For Week Ending July 14, 2018
Potential Right of Way Conveyance Parcels. March 2015
 Potential Right of Way Conveyance Parcels March 205 Prepared by The Minnesota Department of Transportation 395 John Ireland Boulevard Saint Paul, Minnesota 5555-899 Phone: 65-296-3000 Toll-Free: -800-657-3774
2015 SSTS Annual Report Subsurface Sewage Treatment Systems in Minnesota
 Kwq- 2015 SSTS Annual Report Subsurface Sewage Treatment Systems in Minnesota October 2016 Author Cody Robinson Contributors/acknowledgements (MPCA) Subsurface Sewage Treatment Systems (SSTS) staff would
Monthly Indicators % % % Activity Overview New Listings Pending Sales. Closed Sales. Days on Market Until Sale. Median Sales Price
 Monthly Indicators 2018 Residential real estate activity has been relatively slow in the first quarter of 2018, yet housing is proving its resiliency in a consistently improving economy. Some markets have
Quick Facts. For Week Ending July 14, 2018 Publish Date: July 23, 2018 All comparisons are to % - 2.7% - 14.
 Weekly Market Report A RESEARCH TOOL FROM THE SAINT PAUL AREA ASSOCIATION OF REALTORS. BROUGHT TO YOU BY THE UNIQUE DATA-SHARING TRADITIONS OF THE REALTOR COMMUNITY For Week Ending July 14, 2018 Publish
Monthly Indicators % % - 5.3% Activity Overview New Listings Pending Sales. Closed Sales. Days on Market Until Sale. Median Sales Price
 Monthly Indicators 2018 Housing price bubble chatter has increased this summer, as market observers attempt to predict the next residential real estate shift. It is too early to predict a change from higher
Annual Report on the Charlotte Housing Market FOR RESIDENTIAL REAL ESTATE ACTIVITY FROM THE CHARLOTTE REGIONAL REALTOR ASSOCIATION
 Annual Report on the Charlotte Housing Market FOR RESIDENTIAL REAL ESTATE ACTIVITY FROM THE CHARLOTTE REGIONAL REALTOR ASSOCIATION Annual Report on the Charlotte Housing Market FOR RESIDENTIAL REAL ESTATE
Monthly Indicators + 3.5% + 3.0% % Activity Overview New Listings Pending Sales. Closed Sales. Days on Market Until Sale. Median Sales Price
 Monthly Indicators 218 Housing price bubble chatter has increased this summer, as market observers attempt to predict the next residential real estate shift. It is too early to predict a change from higher
Monthly Indicators + 5.7% % % Market Overview New Listings Pending Sales. Closed Sales. Days on Market Until Sale. Median Sales Price
 Monthly Indicators 2018 The three most prominent national market trends for residential real estate are the ongoing lack of abundant inventory, the steadily upward movement of home prices and year-over-year
Monthly Indicators. Quick Facts - 6.6% + 8.3% - 0.6%
 Monthly Indicators A RESEARCH TOOL PROVIDED BY NORTH TEXAS REAL ESTATE INFORMATION SYSTEMS, INC. 2018 New residential real estate activity has been relatively slow in the first quarter of 2018, yet housing
Annual Report for Gallatin County RESIDENTIAL REAL ESTATE IN GALLATIN COUNTY
 Annual Report for Gallatin County RESIDENTIAL REAL ESTATE IN GALLATIN COUNTY RESIDENTIAL REAL ESTATE IN GALLATIN COUNTY While the 2017 housing market was marked by renewed optimism fueled by stock market
Monthly Indicators + 0.9% + 5.9% + 5.7%
 Monthly Indicators A RESEARCH TOOL PROVIDED BY NORTH TEXAS REAL ESTATE INFORMATION SYSTEMS, INC. 2018 Housing price bubble chatter has increased this summer, as market observers attempt to predict the
REPORT # O L A OFFICE OF THE LEGISLATIVE AUDITOR STATE OF MINNESOTA A BEST PRACTICES REVIEW. Preserving Housing
 O L A REPORT # 03-05 OFFICE OF THE LEGISLATIVE AUDITOR STATE OF MINNESOTA A BEST PRACTICES REVIEW Preserving Housing APRIL 2003 Program Evaluation Division The Minnesota Office of the Legislative Auditor
Monthly Indicators + 4.8% - 3.5% %
 Monthly Indicators 2015 New Listings were up 45.0 percent for single family/duplex homes but decreased 44.1 percent for townhouse-condo properties. Pending Sales increased 14.3 percent for single family/duplex
Monthly Indicators - 5.9% + 7.1% % Market Overview New Listings Pending Sales. Closed Sales Median Sales Price
 Monthly Indicators 2018 Housing price bubble chatter has increased this summer, as market observers attempt to predict the next residential real estate shift. It is too early to predict a change from higher
Monthly Indicators + 7.3% + 6.6% + 8.3% Single-Family Market Overview Condo Market Overview New Listings Pending Sales.
 Monthly Indicators 2018 The three most prominent national market trends for residential real estate are the ongoing lack of abundant inventory, the steadily upward movement of home prices and year-over-year
Monthly Indicators - 5.1% + 3.6% % Market Overview New Listings Pending Sales. Closed Sales. Days on Market Until Sale. Median Sales Price
 Monthly Indicators 2015 In 2015, national residential real estate, by and large, had a good year. Supply and demand were healthy in an environment rife with low interest rates and improved employment.
Monthly Indicators - 8.0% + 4.2% - 3.4% Activity Overview New Listings Pending Sales. Closed Sales. Days on Market Until Sale. Median Sales Price
 Monthly Indicators 2018 If the last few months are an indication of the temperature of housing markets across the country, a period of relative calm can be expected during the last three months of the
Monthly Indicators - 7.4% + 5.6% % Activity Overview New Listings Pending Sales. Closed Sales. Days on Market Until Sale. Median Sales Price
 Monthly Indicators 218 Rising home prices, higher interest rates and increased building material costs have pressured housing affordability to a ten-year low, according to the National Association of Home
Monthly Indicators + 6.3% % + 4.1% Market Overview New Listings Pending Sales. Closed Sales. Days on Market Until Sale. Median Sales Price
 Monthly Indicators 2016 As anticipated at the outset of the year, demand has remained high through the first three quarters of 2016, propping up sales and prices despite heavy reductions in inventory and
Monthly Indicators. Activity Snapshot % + 8.0% % Activity Overview New Listings Pending Sales. Closed Sales. Days on Market Until Sale
 Monthly Indicators 2018 Many sellers and builders are in a good position for financial gains, as the economy continues to favor putting existing homes on the market and building new homes for sale. While
Monthly Indicators - 4.9% - 0.7% % Market Overview New Listings Pending Sales. Closed Sales. Days on Market Until Sale. Median Sales Price
 Monthly Indicators 2018 If the last few months are an indication of the temperature of housing markets across the country, a period of relative calm can be expected during the last three months of the
Annual Report on the Hilton Head Housing Market A FREE RESEARCH TOOL FROM THE HILTON HEAD AREA ASSOCIATION OF REALTORS
 Annual Report on the Hilton Head Housing Market A FREE RESEARCH TOOL FROM THE HILTON HEAD AREA ASSOCIATION OF REALTORS Annual Report on the Hilton Head Housing Market A FREE RESEARCH TOOL FROM THE HILTON
Monthly Indicators + 8.7% - 1.6% % Activity Overview New Listings Pending Sales. Closed Sales. Days on Market Until Sale. Median Sales Price
 Monthly Indicators 2018 Residential real estate activity has been relatively slow in the first quarter of 2018, yet housing is proving its resiliency in a consistently improving economy. Some markets have
Housing Supply Overview
 Housing Supply Overview A Research Tool Provided by the Greater San Diego Association of REALTORS December 2017 Quick Facts + 18.1% + 2.1% - 2.3% Inventory was again a driving metric in residential real
Monthly Indicators. Monthly Snapshot. April % % + 4.7%
 Monthly Indicators For residential real estate activity in the state of New Jersey 2018 Monthly Snapshot Many sellers and builders are in a good position for financial gains, as the economy continues to
Annual Report on the Columbus Region Housing Market
 Annual Report on the Columbus Region Housing Market FOR RESIDENTIAL REAL ESTATE ACTIVITY IN THE COLUMBUS REGION Columbus REALTORS Multiple Listing Service (MLS) serves all of Delaware, Fayette, Franklin,
Monthly Indicators - 1.1% - 2.8% % Market Overview New Listings Pending Sales. Closed Sales. Days on Market Until Sale. Median Sales Price
 Monthly Indicators 2018 Rising home prices, higher interest rates and increased building material costs have pressured housing affordability to a ten-year low, according to the National Association of
Monthly Indicators. Quick Facts - 0.9% December % + 7.1%
 Monthly Indicators 2017 The number of homes for sale, days on market and months of supply were all down in year-over-year comparisons in a majority of the country for the entirety of 2017, as was housing
Monthly Indicators A RESEARCH TOOL PROVIDED BY THE MINNEAPOLIS AREA ASSOCIATION OF REALTORS
 Monthly Indicators A RESEARCH TOOL PROVIDED BY THE MINNEAPOLIS AREA ASSOCIATION OF REALTORS 2018 Housing price bubble chatter has increased this summer, as market observers attempt to predict the next
Annual Report on the Columbus Region Housing Market
 Annual Report on the Columbus Region Housing Market FOR RESIDENTIAL REAL ESTATE ACTIVITY IN THE COLUMBUS REGION Columbus REALTORS Multiple Listing Service (MLS) serves all of Delaware, Fayette, Franklin,
Annual Report on the Charleston Area Housing Market FOR RESIDENTIAL REAL ESTATE ACTIVITY FROM THE CHARLESTON TRIDENT ASSOCIATION OF REALTORS MLS
 Annual Report on the Charleston Area Housing Market FOR RESIDENTIAL REAL ESTATE ACTIVITY FROM THE CHARLESTON TRIDENT ASSOCIATION OF REALTORS MLS Annual Report on the Charleston Area Housing Market FOR
Weekly Market Activity Report
 Weekly Market Report A RESEARCH TOOL FROM THE MINNEAPOLIS AREA ASSOCIATION OF REALTORS BROUGHT TO YOU BY THE UNIQUE DATA-SHARING TRADITIONS OF THE REALTOR COMMUNITY For Week Ending June 30, 2018 Publish
Monthly Indicators % + 9.8% % Market Overview New Listings Pending Sales. Closed Sales. Days on Market Until Sale. Median Sales Price
 Monthly Indicators 2018 Last year, U.S. consumers seemed to be operating with a renewed but cautious optimism. The stock market was strong, wages were edging upwards and home buying activity was extremely
Monthly Indicators - 1.9% + 5.4% - 7.2% Market Overview New Listings Pending Sales. Closed Sales. Days on Market Until Sale. Median Sales Price
 Monthly Indicators 2017 The employment landscape and wages have both improved over the last few years, allowing for more people to participate in the home-buying process. When the economy is in good working
Quick Facts. For Week Ending December 15, 2018 Publish Date: December 24, 2018 All comparisons are to % - 6.7% + 1.
 Weekly Market Report A RESEARCH TOOL FROM THE SAINT PAUL AREA ASSOCIATION OF REALTORS. BROUGHT TO YOU BY THE UNIQUE DATA-SHARING TRADITIONS OF THE REALTOR COMMUNITY For Week Ending December 15, 2018 Publish
PLANNING AGENCY An Inventory of Its 701 Planning Assistance Program Reports and Studies
 MINNESOTA HISTORICAL SOCIETY Minnesota State Archives PLANNING AGENCY An Inventory of Its 701 Planning Assistance Program Reports and Studies OVERVIEW OF THE RECORDS Agency: Series Title: Dates: 1946-1992
VERMONTHOUSINGMARKET AnnualReport
 VERMONTHOUSINGMARKET AnnualReport 2015 TheVermontHousingMarket AnnualReportforresiden al realestateac vityinthestate ofvermont. Annual Report on the Vermont Housing Market FOR RESIDENTIAL REAL ESTATE ACTIVITY
Biennial Report on the Potential Right of Way Conveyance Parcels
 2017-2018 Biennial Report on the Potential Right of Way Conveyance Parcels March 2019 Prepared by: The Minnesota Department of Transportation 395 John Ireland Boulevard Saint Paul, Minnesota 55155-1899
Monthly Indicators + 0.5% + 3.7% + 4.0%
 Monthly Indicators A RESEARCH TOOL PROVIDED BY NORTH TEXAS REAL ESTATE INFORMATION SYSTEMS, INC. 2018 Many sellers and builders are in a good position for financial gains, as the economy continues to favor
Monthly Indicators. September Quick Facts + 0.2% + 5.0% %
 Monthly Indicators 2017 It s not just you there really are fewer homes for sale and more are selling. Indiana s statewide housing market has outpaced 2016 in sales and price growth 9 out of 9 months this
Monthly Indicators % % % Activity Overview New Listings Pending Sales. Closed Sales. Days on Market Until Sale. Median Sales Price
 Monthly Indicators 2018 Last year, U.S. consumers seemed to be operating with a renewed but cautious optimism. The stock market was strong, wages were edging upwards and home buying activity was extremely
Monthly Indicators. Monthly Snapshot. March % % 0.0%
 Monthly Indicators 2017 We can comfortably consider the first quarter to have been a good start for residential real estate in 2017. There was certainly plenty to worry over when the year began. Aside
Monthly Indicators % + 2.1% %
 Monthly Indicators A RESEARCH TOOL PROVIDED BY NORTH TEXAS REAL ESTATE INFORMATION SYSTEMS, INC. 2019 Despite a strong U.S. economy, historically low unemployment and steady wage growth, home sales began
Housing Supply Overview
 Housing Supply Overview A RESEARCH TOOL PROVIDED BY SOUTH CAROLINA REALTORS April 2016 We should see a healthy number of sales in most categories for the next few months, yet there is still some lingering
Monthly Indicators % % % Market Overview New Listings Pending Sales. Closed Sales. Days on Market Until Sale. Median Sales Price
 Monthly Indicators 2017 We can comfortably consider the first quarter to have been a good start for residential real estate in 2017. There was certainly plenty to worry over when the year began. Aside
Monthly Indicators % + 8.2% % Market Overview New Listings Pending Sales. Closed Sales. Days on Market Until Sale. Median Sales Price
 Monthly Indicators 2017 We can comfortably consider the first quarter to have been a good start for residential real estate in 2017. There was certainly plenty to worry over when the year began. Aside
Monthly Indicators % % % Activity Overview New Listings Pending Sales. Closed Sales. Days on Market Until Sale. Median Sales Price
 Monthly Indicators 2017 tends to mark the waning of housing activity ahead of the school year. Not all buyers and sellers have children, but there are enough parents that do not want to uproot their children
Monthly Indicators % + 6.9% - 1.7% Market Overview New Listings Pending Sales. Closed Sales. Days on Market Until Sale. Median Sales Price
 Monthly Indicators 2016 We are in the thick of an exciting period of home buying and selling, often with quick multiple offers that are near, at or even above asking price, depending on the factors of
Monthly Indicators - 5.6% % + 0.1%
 Monthly Indicators A RESEARCH TOOL PROVIDED BY NORTH TEXAS REAL ESTATE INFORMATION SYSTEMS, INC. 2017 The employment landscape and wages have both improved over the last few years, allowing for more people
SPRING 2017 MARKET TRENDS REPORT
 SPRING 2017 MARKET TRENDS REPORT 1 WISCONSIN It seems almost impossible, but homes in Wisconsin are going from for sale to sold even faster than they did this time a year ago. According to real estate
The Minnesota Rural Real Estate Market in by Jon Brekke, Hung-Lin Tao and Philip M. Raup
 The Minnesota Rural Real Estate Market in 1992 by Jon Brekke, Hung-Lin Tao and Philip M. Raup University of Minnesota St. Paul, MN 55108 Economic Report ER 93-5 July, 1993 Including Special Studies Of:
Charlotte Region Monthly Indicators
 Charlotte Region Monthly Indicators A RESEARCH TOOL PROVIDED BY CHARLOTTE REGIONAL REALTOR ASSOCIATION FOR MORE INFORMATION CONTACT A REALTOR 2018 Housing price bubble chatter has increased this summer,
Monthly Indicators % + 9.4% % Activity Overview New Listings Pending Sales. Closed Sales. Days on Market Until Sale. Median Sales Price
 Monthly Indicators 2017 The number of homes for sale, days on market and months of supply were all down in year-over-year comparisons in a majority of the country for the entirety of 2017, as was housing
WHAT TO WATCH IN 2018 FOR THE HOUSING MARKET & PROPERTY MANAGEMENT INDUSTRY
 WHAT TO WATCH IN 2018 FOR THE HOUSING MARKET & PROPERTY MANAGEMENT INDUSTRY As a property manager, the day-to-day responsibilities that demand your attention can be all-consuming. It s rare that you get
Monthly Indicators % % - 3.5%
 Monthly Indicators 2017 New Listings were up 6.3 percent for the category but decreased 33.1 percent for the category. Pending Sales increased 5.0 percent for but decreased 1.3 percent for. The Median
Quick Facts. For Week Ending July 29, 2017 Publish Date: August 7, 2017 All comparisons are to % - 4.7% - 16.
 Weekly Market Report A RESEARCH TOOL FROM THE SAINT PAUL AREA ASSOCIATION OF REALTORS. BROUGHT TO YOU BY THE UNIQUE DATA-SHARING TRADITIONS OF THE REALTOR COMMUNITY For Week Ending July 29, 2017 Publish
Monthly Indicators + 1.4% % % Activity Overview New Listings Pending Sales. Closed Sales. Days on Market Until Sale. Median Sales Price
 Monthly Indicators 2018 Rising home prices, higher interest rates and increased building material costs have pressured housing affordability to a ten-year low, according to the National Association of
Housing Supply Overview
 Housing Supply Overview A RESEARCH TOOL PROVIDED BY THE UPSTATE ALLIANCE OF REALTORS MLS December 2018 Housing affordability was a growing concern in 2018, and that is expected to intensify in 2019. Although
2017 SSTS Annual Report Subsurface Sewage Treatment Systems in Minnesota
 Wastewater April 2018 2017 SSTS Annual Report Subsurface Sewage Treatment Systems in Minnesota Author Cody Robinson Contributors/acknowledgements (MPCA) Subsurface Sewage Treatment Systems (SSTS) staff
Rhode Island 2017 Full Year Housing Report
 Rhode Island 2017 Full Year Housing Report What Changes Can We Expect From Housing In 2018? To close the year, the Rhode Island market remains steady, while permits decline By John Tarducci, MIRM, Senior
Monthly Indicators - 8.1% + 3.6% - 0.6% Activity Overview New Listings Pending Sales. Closed Sales. Days on Market Until Sale. Median Sales Price
 Monthly Indicators 2019 In addition to ongoing housing price increases and affordability concerns in the state of New York, the first quarter of 2019 saw a fair share of adverse weather as well. Sales
Quarterly Indicators Gallatin County, Montana
 Quarterly Indicators Gallatin County, Montana Quick Facts - 7.7% + 14.5% Home prices were consistently up again in most markets in 2018 but at reduced levels compared to recent years. High demand for few
MARKET AREA UPDATE Year: 2017 Report as of: 1Q 2Q 3Q 4Q
 MARKET AREA UPDATE Year: 2017 Report as of: 1Q 2Q 3Q 4Q Market Area (City, State): Essex, Hunterdon, Middlesex, Morris, Somerset & Union Provided by (Company / Companies): BHHS New Jersey Properties Provided
Q SOUTHWEST REGION
 Quarterly Indicators SOUTHWEST REGION Monthly Snapshot Includes the Durango Area Association of REALTORS, Four Corners Board of REALTORS, Pagosa Springs Area Association of REALTORS and the San Luis Valley
Monthly Indicators - 7.5% % - 9.5%
 Monthly Indicators A RESEARCH TOOL PROVIDED BY NORTH TEXAS REAL ESTATE INFORMATION SYSTEMS, INC. 2016 Most of 2016 offered the same monthly housing market highlights. The number of homes for sale was drastically
Monthly Indicators + 8.8% + 9.0% % Market Overview New Listings Pending Sales. Closed Sales. Days on Market Until Sale. Median Sales Price
 Monthly Indicators 2017 The facts of residential real estate have remained consistent in 2017. In year-overyear comparisons, the number of homes for sale has been fewer in most locales, and homes have
Monthly Indicators % % - 9.2%
 Monthly Indicators 2016 New Listings were down 1.4 percent for single family/duplex homes and 25.0 percent for townhouse-condo properties. Pending Sales increased 58.3 percent for single family/duplex
CAAR Market Report. Greater Charlottesville Area. Q Quick Facts + 3.5% + 8.0% %
 CAAR Market Report Includes the city of Charlottesville and the counties of Albemarle, Fluvanna, Greene, Louisa and Nelson. Quick Facts + 3.5% + 8.0% We can comfortably consider the first quarter to have
Orange County Housing Report: Like a Model Home. November 4, Good morning!
 Orange County Housing Report: Like a Model Home November 4, 2018 Good morning! Buyers expectations in the ideal home have evolved, so sellers need to price accordingly. Carefully Pricing: Sellers must
Housing Supply Overview
 Housing Supply Overview A RESEARCH TOOL PROVIDED BY SOUTH CAROLINA REALTORS July 2017 Local news outlets across the nation have been delving into the cause for lower sales totals in their markets during
Annual Report On Our National Real Estate Market
 A TWINCITIESPROPERTYFINDER.COM RESOURCE Annual Report On Our National Real Estate Market 1 Contents Industry Facts 3 Mortgage Stats 4 Distressed Properties & Price Information 5 Today s Buyer 6 First-Time
Monthly Indicators. Monthly Snapshot. July % + 7.8% %
 Monthly Indicators For residential real estate activity by members of the Florida REALTORS 2012 A few short years ago, housing was considered a headwind to economic recovery. Today, housing is seen as
Monthly Indicators + 1.2% - 2.1% % Activity Overview New Listings Pending Sales. Closed Sales. Days on Market Until Sale. Median Sales Price
 Monthly Indicators 2017 We can comfortably consider the first quarter to have been a good start for residential real estate in 2017. There was certainly plenty to worry over when the year began. Aside
Monthly Indicators. Quick Facts + 5.1% + 8.2% % July 2018
 Monthly Indicators 2018 Indiana REALTORS have closed the books on, releasing their summary of existing-home sales from last month. All metrics are up except inventory, which is certainly a result of strong
Housing Supply Overview
 Housing Supply Overview A RESEARCH TOOL PROVIDED BY SOUTH CAROLINA REALTORS October 2018 Although every community is different, a general analysis of all housing markets across the country reveals that