Results Presentation (12M17)
|
|
|
- Benedict Washington
- 6 years ago
- Views:
Transcription


1 Results Presentation (12M17)
2 Results Summary (Income Statement) (Rp bn) 12M17 12M16 % YoY Revenue 6,443 6,739-4% Effect of 8% YoY decline in Property Development segment while Recurring segment grew 7% YoY COGS (3,423) (3,450) -1% Gross Profit 3,020 3,290-8% Gross Profit Margin 47% 49% Less revenue recognized fom higher-margin shophouses Operating Expense (1,461) (1,484) -2% Increased operational efficiency and reduction in professional fees post-merger of subsidiaries Operating Profit 1,559 1,806-14% Operating Profit Margin 24% 27% Effect of decline in Gross Profit Margin Interest Income (Expense) - Net (372) (348) 7% Other Income (Expense) - Net % Final Tax and Income Tax (280) (330) -15% Net Income Before Non-Controlling Interest 1,019 1,171-13% Non-Controlling Interest % Net Income Attributable to Owners 894 1,021-12% Net Profit Margin 14% 15% 2
3 Results Summary (Revenue Breakdown and Margin Performance) (Rp bn) 12M17 12M16 % YoY Revenue Breakdown Property Development Revenue 4,734 5,143-8% Houses, shophouses, and land lots 3,622 4,050-11% Longer revenue recognition schedule from 2015 residential projects Apartments % Near completion of Voila, Orchard, and The Residence projects Office for sale % Construction progress of Tokopedia Care Tower and Kemayoran Tower 1 Recurring Revenue 1,709 1,597 7% Shopping malls % Hotels % Higher occupancy and ARR of Raffles Hotel Hospitals % First-year operation of Ciputra Mitra Hospital Office leasing % Newly opened Tokopedia Tower Others % Total Revenue 6,443 6,739-4% Margin Performance Property Development GPM 44% 46% Houses, shophouses, and land lots 45% 50% Apartments 38% 31% Office towers 45% 38% Effect of product mix Recurring GPM 54% 58% Shopping malls 65% 68% Effect of lower rental reversions Hotels 44% 49% Effect of oversupply in budget hotel industry Hospitals 43% 48% First-year operation of Ciputra Mitra Hospital Office leasing 66% 68% Others 39% 37% 3
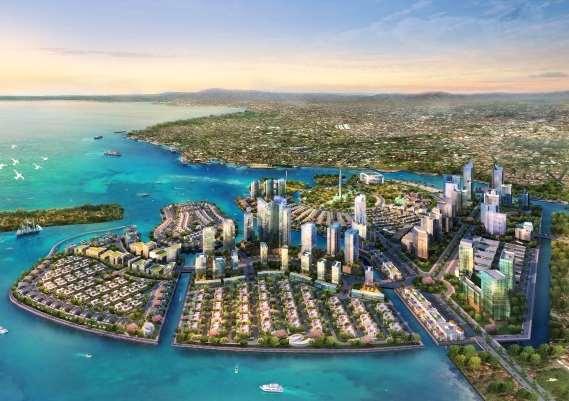
4 Results Summary (Revenue per Segment and per Location) Revenue per Segment (12M17) Apartments 11% Office Towers 6% Shopping Malls 12% Hotels 8% Revenue per Location (12M17) Greater Surabaya 19% Other Java 16% Others 7% Sumatra 9% Houses, shophouses, and land lots 56% Greater Jakarta 50% Sulawesi 4% Others 2% Development = 73% (Houses + Apartments + Office) Recurring = 27% (Malls + Hotels + Hospitals) Sustained focus on geographically diversified revenue sources to minimize concentration risk 4
5 Results Summary (Historical Revenue Breakdown) Rp tn Development vs. Recurring Revenue % % 18% 18% 24% 27% Development Revenue Recurring Revenue Recurring as % of Total Revenue Continued focus on high-growth core development business and complemented by stable recurring assets 5
6 Key Developments Launched 7 new clusters/towers in existing projects with a combined presales of Rp327bn (20% of 3M18 achievement) New Clusters / Towers = Ciputra World Surabaya (Surabaya), CitraSun Garden Semarang (Semarang), CitraIndah Jonggol (South Greater Jakarta), CitraLand Surabaya (Surabaya), CitraLand Cibubur (South Greater Jakarta), CitraGarden Sidoarjo (Greater Surabaya), The Taman Dayu Pandaan (West Surabaya) Total 3M18 presales reached Rp1.6tn (21% of FY18 target) En bloc sale of 192 apartment units to The Ascott (CapitaLand) in Ciputra World Jakarta 2 Booked as Rp675bn presales in October 2017 Issued SGD150mn Medium Term Note with 4-year maturity and 4.85% coupon rate (September 2017) SGD35mn for working capital and SGD115mn for refinancing 25% cross-currency hedge and 75% call-spread Received a credit rating from Fitch of BB- / Stable Outlook (September 2017) Completed merger of 2 subsidiaries CTRS and CTRP (January 2017) 6
7 Pre-Sales Summary (Rp bn) Historical Presales Presales per Location M18 9,179 16% 16% 991 3,099 7, ,640 7, ,625 2,661 2,831 27% 30% 9% 16% 1% 27% 24% 10% 5% 19% Greater Jakarta Surabaya Other Java Sumatra Sulawesi Others 5,088 5,081 4,549 4,411 1,218 1, T 3M17 3M18 Directly-Owned JO - Profit Sharing JO - Revenue Sharing Presales per Product M18 18% 2% 19% 3% Units Sold 10,668 8,288 8,645 1,494 1,778 80% 78% Area Sold (Ha) Houses, shophouses, land lots Apartment Office 7
8 Pre-Sales Summary Presales per Payment Method Presales per Unit Price 10% 11% 15% 12% 12% 8% 16% 6% 10% 11% 57% 57% 36% 40% 48% 27% 26% 24% 30% 28% 32% 24% 30% 24% 25% 33% 32% 49% 48% 40% 33% 34% 40% 36% 37% * * 3M18 Mortgage Installments Cash Rising mortgage payment due to higher exposure to end-users and better accessibility to mortgages * * 3M18 < Rp1bn Rp 1-2bn Rp 2-5bn > Rp 5bn Units below Rp2bn continue to make up majority of presales as end-users are targeted *Note: 2015 and 2017 excludes en bloc sales to Ascott (Rp835bn and Rp675bn) 8
9 Sufficient Land Bank to Sustain >15 Years of Development Directly-Owned Project Developed Land (Saleable) Undeveloped Land (Raw) Land ASP Trend Land ASP (Rp mn per sqm) Ha Ha CAGR CAGR 2017 CitraGarden City 83-48% 9% 16.1 CitraRaya Tangerang % 10% 3.8 CitraIndah Jonggol % 17% 1.6 CitraLand Cibubur Total Greater Jakarta CitraLand Surabaya % 16% 9.9 CitraHarmoni Sidoarjo % 22% 4.6 CitraGarden Sidoarjo % 29% 6.8 Total Surabaya CitraGarden Lampung 3-28% 3% 2.3 CitraLand Lampung % 4.4 CitraLand Pekanbaru % 4.7 CitraLand NGK Jambi - 2-5% 3.2 Total 937 1,411 Total directly-owned land bank of 2,348 Ha Gross (1,409 Ha Net) 9
10 Rights to Additional Land Bank Through Joint-Operation Schemes Joint Operation Project Development Plan (Ha) Land ASP (Rp mn per sqm) Joint Operation Project Development Plan (Ha) Land ASP (Rp mn per sqm) CitraLake Sawangan Depok CitraGrand Senyiur City Samarinda Total Greater Jakarta 12 CitraGarden City Samarinda The Taman Dayu Pandaan CitraLand City Samarinda CitraLand The Green Lake Surabaya CitraMitra City Banjarbaru CitraIndah Sidoarjo CitraLand Banjarmasin Total Greater Surabaya 642 CitraGarden Banjarmasin CitraMaja Raya 1, CitraGarden Aneka Pontianak CitraLand BSB City Semarang Citra BukitIndah Balikpapan CitraGrand Semarang CitraCity Balikpapan CitraSun Garden Semarang CitraLand Denpasar CitraGarden City Malang Total Kalimantan + Bali 888 Citra Green Dago Bandung CitraGrand Galesong City Gowa CitraGarden BMW Cilegon CitraLand City Losari Makassar CitraLand Cirebon CitraLand Talassa City Makassar CitraLand Puri Serang CitraLand Celebes Makassar CitraGarden Pekalongan CitraGarden Makassar CitraGrand Mutiara Yogyakarta CitraLand Palu CitraSun Garden Yogyakarta CitraLand Kendari Total Java Ex-Jakarta Ex-Surabaya 1,702 Total Sulawesi 803 CitraRaya City Jambi CitraGrand City Palembang CitraLand Bagya City Medan CitraLand Botanical City Pangkalpinang Citra AeroLink Batam CitraLand Megah Batam CitraGarden Pekan Baru Total JO Land Bank of 5,063 Gross Ha Total Sumatra 1,016 10
11 High-rise (Apartment and Office - Strata Title) High-rise Project Tower Total Saleable Area (sqm) Construction Progress CitraRaya Tangerang EcoHome 9,316 40% 14% CitraGarden City Jakarta CitraLake Suites 17,986 52% 95% Citra Living 9,064 90% 5% Kemayoran Citra Towers 37,955 72% 35% Ciputra World Jakarta 1 Raffles Residence 41,500 84% 100% DBS Bank Tower 19,284 93% 100% Tokopedia Tower 28,000 75% 94% Ciputra World Jakarta 2 The Orchard 36,000 98% 95% The Residence 14,000 96% 96% Ciputra World Jakarta 2 Ext. The Newton 15,800 94% 22% Tokopedia Care Tower 24,000 69% 82% Ciputra International San Francisco 21,000 39% 79% Office Tower 2 19,500 62% 0% Amsterdam 25,500 85% 79% Total Jakarta 318,905 Vieloft SOHO 40,298 31% 12% Ciputra World Surabaya Office Tower 40,298 61% 5% Voila Apartment 35,801 89% 100% The Vertu 9,070 62% 13% CitraLand Surabaya Denver Apartment 22,481 71% 2% Total Surabaya 147,948 Barsa City Yogyakarta Cornell 8,534 27% 0% CitraPlaza Nagoya Tower 1 15,926 71% 0% Vida View Apartment Tower B 24,640 32% 66% Total High-rise Projects 515,953 Sold % Total unsold high-rise area of 160,000 m² 11
12 Healthy Occupancy and Lease Expiry Profile for Malls Mall Net Leasable Occupancy Rate Area (m²) Ciputra World Jakarta 1 81, % 100% 100% 100% 100% Ciputra World Surabaya 56,000 96% 98% 99% 95% 94% Ciputra Mall Jakarta 42,700 97% 97% 98% 95% 97% Ciputra Mall Semarang 20, % 90% 98% 99% 100% Expansion Plans Ciputra Mall CitraRaya Tangerang 26,000 Planned completion end-2019 Ciputra World Surabaya Extension 37,300 Planned completion early-2020 Total mall NLA of 200k m² with average occupancy rate of 98% (m²) Lease Expiry Profile (by NLA) 120, ,000 54% 80,000 60,000 40,000 20,000 11% 13% 6% 16% Onwards 12
 - - - 813 1,520 87% Ciputra World Surabaya Hotel - - 419 482 504 4% Ciputra Hotel Jakarta 479 453 404 393 391-1%")

 Dec-15 1.")
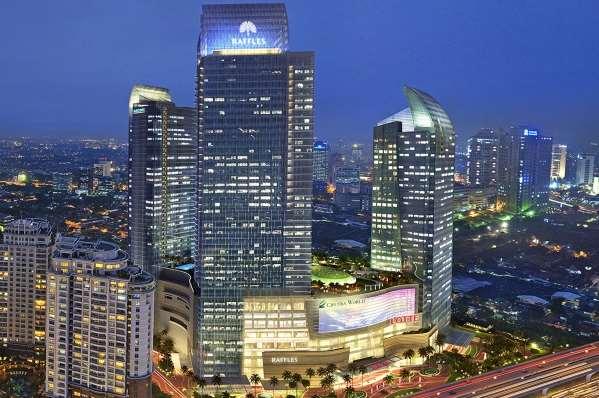
13 Continued Strong Performance of Diversified Recurring Assets Revenue per Available Room (RevPAR) across hotels Hospital Assets Rp ' % YoY Ciputra World Jakarta 1 (Raffles Hotel) ,520 87% Ciputra World Surabaya Hotel % Ciputra Hotel Jakarta % Ciputra Hotel Semarang % CitraDream Hotel Bintaro % CitraDream Hotel Cirebon % CitraDream Hotel Yogyakarta % CitraDream Hotel Semarang % CitraDream Hotel Bandung % Start Total Capacity Hospital Project Location Remarks Operation Area (Ha) (Beds) Ciputra Hospital Jakarta CitraRaya Tangerang (Greater Jakarta) Nov CTRA's first healthcare project Ciputra Hospital Tangerang CitraGarden City (Jakarta) Dec Ciputra Mitra Hospital CitraLand Banjarmasin (Kalimantan) Nov JV with Mitra Group 13
14 Debt Profile As of Dec-17 Total Borrowings: Rp7.6tn Floating 76% Fixed 24% Rupiah 78% Foreign Currency 22% (Rp tn) Maturity Profile (% of total debt) 33% 2.0 Borrowing Cost* % 12.7% 12.1% 11.7% 10.3% 15% 12% 12% 12% 0.5 4% 3% 4% 2% Short Term Bank Loan Maturity Long Term Bank Loan Maturity Bonds and Notes Payable Maturity Borrowing Cost *Borrowing Cost calculation includes capitalized interest expense of Rp72bn, 96bn, 74bn, 131bn, 179bn in 2013, 2014, 2015, 2016, and
15 Capex Schedule Land for Development 59% 12M17 Rp1.9tn Office 20% Hotel 5% Others 9% Mall 4% Apartment 3% Rp tn Historical Capex capex largely due to Ciputra World Jakarta project (mall + hotel + office tower) Land acquisition capex largely for land reclamation project in Makassar 15
16 Financial Highlights (Rp bn) 5,077 Revenue 6,340 7,514 6,739 6,443 (Rp bn) 2,546 Gross Profit 3,724 3,330 3,290 3,019 3,323 1,667 50% 50% 53% 50% 49% 47% Gross Profit Gross Margin (Rp bn) Net Profit Key Ratios 1,685 1,645 1, % 26% 27% 22% 1, % 14% % -7% 10% 17% 22% 28% Net Profit Net Margin Net Debt to Equity Current Ratio 16
17 Balance Sheet Summary Rp bn Dec 2017 Dec 2016 Dec 2015 Dec 2014 Assets 31,706 29,072 26,259 23,539 Cash & cash equivalents 3,229 3,468 3,034 2,889 Land 11,391 10,016 9,229 7,765 Others 17,086 15,589 13,995 12,885 Liabilities 16,255 14,774 13,209 11,886 Debt 7,558 6,662 5,277 4,021 Advances from customers 6,455 5,851 5,732 5,871 Others 2,242 2,262 2,200 1,994 Equity 15,451 14,298 13,050 11,652 Minority interests 2,073 1,654 1, Equity net of minority interests 13,378 12,643 11,510 10,826 Debt to Total Equity 49% 47% 40% 35% Net Debt to Total Equity 28% 22% 17% 10% 17
18 Growth Strategy Retain healthy land bank levels (currently sufficient for >15 years of development) by continuously replenishing land bank in existing projects while searching for new strategic locations Sustain wide geographical footprint (currently have a presence in 33 cities) to allow diversification of products and target market while minimizing concentration risk Continue to leverage on the Ciputra brand equity by continuing Joint-Operation schemes with land owners Maintain prudent capital management (net gearing at 0.28x as of 12M17) with a well-balanced debt maturity profile and mixed sources of funding Create innovative product launches to best cater to existing demand by capitalizing on the flexibility given by ample and diverse land bank Increase portion of recurring income while simultaneously boost synergy by focusing on complimentary amenities within existing developments (e.g. malls, hospitals, and offices) 18

 Middle to high Rp 222 billion Rp 2.")

19 Key Projects 2018 CitraLand City Losari Makassar Location Launch Development plan Market segment Pre-sales 1Q18 Selling price per unit Average unit selling price Average land selling price Unit sold Others Makassar, South Sulawesi October ha (sold 7 ha) Middle to high Rp 222 billion Rp 2.2 billion to Rp 57.5 billion Rp 5.7 billion Rp 15.3 million 39 units Grand-launching event in Mar-18 to celebrate 100% land reclamation process for 1 st phase (100Ha) 19


20 Key Projects 2018 CitraRaya Tangerang Location Launch Development plan Market segment Pre-sales 1Q18 Selling price per unit Average unit selling price Average land selling price Unit sold Others Tangerang, West of Jakarta ,760 ha (sold 826 ha) Middle-low to middle-high Rp 127 billion Rp 260 million to Rp 2.4 billion Rp 749 million IDR 4.2 million 169 units - 20


21 Key Projects 2018 CitraMaja Raya Banten Location Launch Development plan Market segment Pre-sales 1Q18 Selling price per unit Average unit selling price Average land selling price Unit sold Others Lebak, Banten, West Java November ,200 ha (sold 121 ha) Middle to middle-low Rp billion Rp 110 million to Rp 1.3 billion IDR 270 million IDR 1.3 million 418 units - 21

 Middle to middle-high Rp 109.")

22 Key Projects 2018 CitraLand Surabaya Location Launch Development plan Market segment Pre-sales 1Q18 Selling price per unit Average unit selling price Average land selling price Unit sold Others West Surabaya ,700 ha (sold 723 ha) Middle to middle-high Rp billion Rp 550 bllion to Rp 3.9 billion Rp 2.2 billion Rp 8.5 million 49units Launched new commercial cluster Palma Galeria 3 in Feb Pre-sales was recorded at Rp 51.2 billion. 22

 Middle to middle-low Rp 61billion Rp 388 million to Rp 2.")

23 Key Projects 2018 CitraLand Cibubur Location Launch Development plan Market segment Pre-sales 1Q18 Selling price per unit Average unit selling price Average land selling price Unit sold Others Greater Jakarta May ha (sold 3 ha) Middle to middle-low Rp 61billion Rp 388 million to Rp 2.3 billion IDR 1.1 billion IDR 4.1 million 57 units A joint venture project. Launched new commercial cluster - The Avenue in Mar Pre-sales was recorded at Rp 58 billion 23


24 Key Projects 2018 CitraGarden City Jakarta Location Launch Development plan Market segment Pre-sales 1Q18 Selling price per unit Average unit selling price Average land selling price Unit sold Others Kalideres, West Jakarta ha (sold 364 ha) Middle to high Rp 43 billion Rp 930 million to Rp 4.7 billion Rp 2.1 billion Rp 15.3 million 23 units - 24


25 Key Projects 2018 CitraLand Talassa City Makassar Location Launch Development plan Market segment Pre-sales 1Q18 Selling price per unit Average unit selling price Average land selling price Unit sold Others Makassar, South Sulawesi May ha (sold 6 ha) Middle Rp 40 billion Rp 878 million to Rp 3.4 billion Rp 1.3 billion Rp 4.6 million 30 units A joint-operation project 25

26 Appendix A: New Corporate Structure Post Merger B: Corporate Milestones C: Competitive Strength D: Project Portfolio E: Management Team F: Company Awards G: Indonesia Macroeconomics


27 New Corporate Structure Post Merger 27
 1996 : - Rights issue I - Listing on SSX - Issuance of bond (Rp 150")
28 Corporate Milestones Capital raising & corporate actions -> STRENGTHEINING OUR FINANCIAL POSITION TO SUPPORT BUSINESS EXPANSION.. Established under the name of PT Citra Habitat Indonesia 1994 : IPO and listing on JSX 1995 : Issuance of Notes (US$ 100 million) 1996 : - Rights issue I - Listing on SSX - Issuance of bond (Rp 150 billion) - Issuance of TLCF (US$ 25 million) (Transferrable loan certificate facility) Developed and launched: 1984 : CitraGarden City, our first project, in West Jakartaz 1993 : - CitraLand, our first and largest township project in Surabaya - Ciputra Mall & Hotel Jakarta, our first commercial project 1994 : CitraRaya Tangerang, our largest township development project, covering an area of more than 2,700 ha 1997 : Economic crisis hit Indonesia. Start of debt restructuring process 1999 : PT Ciputra Surya Tbk (CTRS) s listing on JSX 2000 : Bonus shares distribution Developed and launched: 2005 : CitraGarden Lampung in Sumatra and CitraGarden Banjarmasin in Kalimantan, marking the beginning of business expansion outside of Java h 2006 : - Issuance of 2.4 billion shares without pre-emptive rights for debt settlement - Rights Issue II 2007 : IPO of PT Ciputra Property Tbk (CTRP) 2015 : Share dividend distribution 2016 : Share dividend distribution Merger plan with CTRS and CTRP Developed and launched: 2007 : Ciputra World Surabaya 2008 : Ciputra World Jakarta 2009 : CitraLand Celebes Makassar, our first project in Sulawesi 2011 : Ciputra Hospital Tangerang, our first health care project 2012 : CitraDream Hotel Cirebon, our first budget hotel 2013 : Ciputra Beach Resort Bali, our first resort development 2015 : CitraLand City Losari in Makassar, our first reclamation residential project 2016 : Ciputra Mitra Hospital, our first health care project in Kalimantan Project Development -> OVER 30 YEARS EXPERIENCE.. 28


29 Geographically Diversified Project Portfolio CitraLand Bagya City CitraGarden CitraLand BizPark Commercial Estate CitraLand CitraGarden Ciputra Mitra Hospital CitraGrand City CitraLand Megah Citra AeroLink Citra Plaza Citra BukitIndah CitraCity CitraLand City CitraGrand Senyiur City CitraGarden City CitraLand Botanical City CitraGarden CitraLand CitraGarden Aneka Medan Pekan Baru CitraLand NGK CitraRaya City Batam CitraLand CitraLand CitraMitra City projects in 33 cities KALIMANTAN Jambi CitraLand Celebes CitraGarden Vida View Apartment CitraGrand Galesong City CitraLand City Losari CitraLand Talassa City Samarinda Balikpapan Pontianak Palu Palembang Banjarmasin Bengkulu Pangkalpinang B. Lampung CitraGarden City CitraRaya CitraIndah CitraLake CitraTowers Kemayoran CitraLand Ciputra Mall & Hotel Somerset Grand Citra Ciputra World Ciputra Hospital Ciputra Hospital DIPO Business Center CitraDream Hotel Ciputra International Ciputra World 2 Extension CitraMaja Raya Tangerang Lebak Cilegon Serang Banjarbaru Jakarta Depok Cirebon Tegal Pekalongan JAVA Pandaan Jogjakarta CitraDream Hotel CitraGarden BMW CitraLand CitraDream Hotel Ciputra Mall & Hotel CitraDream Hotel Kendari Surabaya Semarang Bandung CitraGreen Dago Makassar Sidoarjo Malang Denpasar CitraLand CitraLand CitraGarden C CitraSun Garden CitraGrand Mutiara CitraDream Hotel CitraSun Garden CitraGrand CitraLand BSB CitraLand CitraHarmoni CitraGarden CitraIndah The Taman Dayu CitraLand Green Lake Ciputra Golf Ciputra World CitraGarden City The Nivata Ciputra Beach Resort 56 Townships & residential projects 19 Commercial property projects CitraLand Puri 29


30 Greater Jakarta Project Portfolio 30


31 Competitive Strength BUSINESS PROSPECT Increase in housing needs Urbanization trends Change in customers lifestyle Availability in mortgage facility Potential economic growth Government stimulus plan Stable political outlook Focus on real estate business We are well positioned in Indonesia s current property outlook because of the following factors: Steady launch and development of pipeline projects Most diversified in market targets, products offered & project locations Reputable brand & experienced management team Large land bank at prime locations to support future growth 31


32 Experienced Management Team Board of Commissioners Board of Directors DR. Ir. Ciputra Chairman Dian Sumeler Rina Ciputra S. Junita Ciputra Candra Ciputra President Cakra Ciputra Budiarsa Sastrawinata Harun Hajadi Sandra Hendharto Kodradi Independent member Henk Wangitan Independent member Thomas Bambang Independent member Agussurja Widjaja MI Meiko Handojo Nanik J. Santoso Sutoto Yakobus Artadinata Djangkar Bing Sugiarto C. Tanan H. Antonius Tulus Santoso Corporate Secretary 32


33 Company Awards 100 Fastest Growing Company Award 2017: 2 nd Place in Property, Real Estate and Construction Sector Indonesia Top Ten Developers 2017 Indonesia Most Innovative Business Award 2017: Winner in Property and Real Estate Category Indonesia Most Admired Companies Award 2017: Winner in Property Category IAIR Award 2017: Company of the Year Indonesia Property and Real Estate Indonesia Most Admired Companies Award 2017: Top 15 Emiten Pilihan Analis dalam Program Yuk Nabung Saham 2017 Corporate Image Award 2017: The Best in Building and Managing Corporate Image Category: Housing Developer 33
34 Investor Relations Corporate Secretary PT. CIPUTRA DEVELOPMENT TBK Ciputra World 1 DBS Bank Tower 39 th Floor Jl. Prof. DR. Satrio Kav. 3-5 Jakarta INDONESIA Phone : / 6868 Fax : investor@ciputra.com Website : 34
35 Disclaimer Any person obtaining this Presentation material, will be deemed to have understood and agreed to the obligations and restrictions herein. The content of this material are provided on a strictly private confidential basis and shall be the proprietary of PT. CIPUTRA DEVELOPMENT Tbk. Information contained in the material are intended for information purpose and does not constitute or form part of an offer solicitation, invitation or inducement to purchase or subscribe for any securities of the PT. CIPUTRA DEVELOPMENT Tbk. or any contract or commitment whatsoever, and further is not intended to be distributed, reproduced or copied at any time to any party without prior written consent of PT. CIPUTRA DEVELOPMENT Tbk. The communication of this information herein is restricted by law, it is not intended for distribution to or use by any person in any jurisdiction where such distribution or use would be contrary to local law or regulation in such jurisdiction. The information and opinions contained in this material have not been independently verified, and no representations or warranties (expressed or implied) is made as to, and no reliance should be placed on the fairness, accuracy, completeness, correctness, omissions of the information or opinions contained herein. It is not the intention to provide and you may not rely on this material as providing a complete or comprehensive analysis of the condition (financial or others), earnings, business affairs, business prospects, properties or results of operations of the company or its subsidiaries. The information and opinions contained in this material are provided as at the date of this presentation and are subject to change without any notice. The company (including any of its subsidiaries, shareholders, affiliates, representatives, partners, directors, employees, advisers or agents) shall have no responsibility or liability whatsoever (in negligence or otherwise) for any direct, indirect or consequential loss and/ or damages arising from the use of this materials, contents, information, opinions or communication therewith. This presentation may contain forward-looking statements and assumptions that are subject to various risks and uncertainties which may change over time and in many cases are outside the control of the company. Therefore, actual performance, outcomes and results may differ materially from those expressed in the statements. You are advised and cautioned not to place undue reliance on these statements, which are based on current view of management on future events. 35

36 @ PT Ciputra Development Tbk
First Sponsor Group Limited Investor Presentation 24 July 2015
 First Sponsor Group Limited Investor Presentation 24 July 2015 The initial public offering of the Company s shares was sponsored by DBS Bank Ltd., who assumes no responsibility for the contents of this
PT Matahari Department Store Tbk.
 PT Matahari Department Store Tbk. Q2 2015/ 1H 2015 Results Update Earnings call: July 30, 2015 Indonesia s Most Preferred Department Store 1 Key Highlights Q2 2015 and 1H 2015 Financial Update Summary
RESIDENTIAL PROPERTY PRICE SURVEY FOR PRIMARY HOUSE
 RESIDENTIAL PROPERTY PRICE SURVEY FOR PRIMARY HOUSE Quarter III - 2017 Residential Property Prices Increased in the Third Quarter of 2017 Respondents of the Bank Indonesia Residential Property Price Survey
Presentation for REITs Symposium 2016
 Presentation for REITs Symposium 2016 4 June 2016 Important Notice This presentation shall be read in conjunction with OUE Commercial REIT s Financial Results announcement for 1Q 2016 dated 10 May 2016.
SUNTEC REIT FINANCIAL RESULTS. For the 2 nd Quarter and Half Year ended 30 June 2017
 SUNTEC REIT FINANCIAL RESULTS For the 2 nd Quarter and Half Year ended 30 June 2017 26 July 2017 Agenda 03 2Q 17 Highlights 05 Financial Highlights 18 Office Portfolio Performance 25 Retail Portfolio Performance
Macquarie ASEAN Conference 28 August 2013
 Macquarie ASEAN Conference 28 August 2013 Disclaimer This presentation has been prepared by Bowsprit Capital Corporation Limited, in its capacity as the manager of First Real Estate Investment Trust (
RESIDENTIAL PROPERTY PRICE SURVEY FOR PRIMARY HOUSE
 RESIDENTIAL PROPERTY PRICE SURVEY FOR PRIMARY HOUSE Quarter IV - 2017 Residential Property Prices Accelerated in the Fourth Quarter of 2017 Respondents of the Bank Indonesia Residential Property Price
Opportunities and Hurdles for Investors in Light Industrial Properties
 Opportunities and Hurdles for Investors in Light Industrial Properties Experiences from the German Market Tom de Witte CFRO Geneba Properties NV Sommerconferenz Darmstadt, 7 July 2016 15.07.16 Contents
26 February 2013 FIRST HALF RESULTS PRESENTATION
 26 February 2013 FIRST HALF RESULTS PRESENTATION Investment highlights Proven track record of consistent earnings growth and meeting targets Strategically located and diverse residential portfolio Urban
TRIM FLASH NOTES. Hanson International. Huge land bank NOT RATED. Jan 21, Company Update. Stock Data. Major Shareholders:
 Volume Price - Hanson International Huge land bank TRIM FLASH NOTES Jan 21, 2014 Sitting on plenty of land bank Hanson has 2899ha of land bank, third largest after BSDE (4,100ha) and KIJA (2,911ha) among
Acquisition of Wilkie Edge. Extraordinary General Meeting 23 November 2007
 Acquisition of Wilkie Edge Extraordinary General Meeting 23 November 2007 Important Notice THIS PRESENTATION IS AVAILABLE ONLY TO PERSONS WHO ARE NON-U.S. PERSONS, PERSONS WITH ADDRESSES OUTSIDE THE U.S.
CENTURY PROPERTIES GROUP, INC. Analysts Presentation: FY 2013 Results April 2014
 CENTURY PROPERTIES GROUP, INC. Analysts Presentation: FY 2013 Results April 2014 IMPORTANT NOTICE AND DISCLAIMER These materials have been prepared by Century Properties Group Inc. (together with its subsidiaries,
CPN Retail Growth Leasehold REIT
 CPN Retail Growth Leasehold REIT Investor Presentation Opportunity Day 28 February 2018 Importance Notice The information contained in this presentation is for information purposes only and does not constitute
Inflation Rate 6.96% Gross Domestic Product. Jul % 8.36% 4.30% 3.79% 3.35% 3.21%
 Inflation Rate 6.96% 3.79% 4.30% 8.38% 8.36% 3.35% 3.21% Gross Domestic Product 2010 2011 2012 2013 2014 2015 Jul 16 Property market in Indonesia during second quarter continued to languish with more moderate
INTRODUCTION AND HIGHLIGHTS FINANCIAL REVIEW BUSINESS REVIEW
 COVER 1 AGENDA INTRODUCTION AND HIGHLIGHTS FINANCIAL REVIEW BUSINESS REVIEW Highlights Financial Review Business Review http://www.crland.com.hk/ CR Land Results 2016 2 INTRODUCTION AND HIGHLIGHTS Highlights
CENTURY PROPERTIES GROUP, INC. Analysts Presentation April 20, 2017
 CENTURY PROPERTIES GROUP, INC. Analysts Presentation April 20, 2017 IMPORTANT NOTICE AND DISCLAIMER These materials have been prepared by Century Properties Group, Inc. (together with its subsidiaries,
仁恒置地集团 YANLORD LAND GROUP LIMITED. 4Q and FY 2017 Results Presentation
 仁恒置地集团 YANLORD LAND GROUP LIMITED 4Q and FY 2017 Results Presentation Yanlord 4Qand FY 2017Business Review Yanlord 4Q and FY 2017 Business Review Averagesellingprice( ASP )rosesignificantlyin4q2017tormb66,234/sqmfromrmb25,739/sqm
2013 Annual Results Presentation
 Stock code:1777 2013 Annual Results Presentation March 2014 Disclaimer This presentation has been prepared by Fantasia Holdings Group Co., Limited (the Company ) solely for use at the presentation regarding
SUNTEC REIT FINANCIAL RESULTS. For the 1 st Quarter ended 31 March 2017
 SUNTEC REIT FINANCIAL RESULTS For the 1 st Quarter ended 31 March 2017 26 April 2017 Agenda 03 Q1 17 Highlights 05 Financial Highlights 15 Office Portfolio Performance 22 Retail Portfolio Performance 29
OUE Commercial REIT s Portfolio To Exceed S$3.0 Billion With Proposed Acquisition Of Indirect Interest In One Raffles Place
 PRESS RELEASE For Immediate Release OUE Commercial REIT s Portfolio To Exceed S$3.0 Billion With Proposed Acquisition Of Indirect Interest In One Raffles Place 10 June 2015 OUE Commercial REIT Management
STA. LUCIA LAND, INC. (SLI)
") Company stats: Price (P) 0.73 52 week high (P) 1.02 52 week low (P) 0.64 Shares out. (m) 8,546.5 Market cap (P m) 6,238.9 ytd change (%) -8.8 EPS (P) 0.1 PER (x) 7.1 BV/share 1.6 P/BV 0.5 Sta. Lucia Land,
Company stats: Price (P) 0.73 52 week high (P) 1.02 52 week low (P) 0.64 Shares out. (m) 8,546.5 Market cap (P m) 6,238.9 ytd change (%) -8.8 EPS (P) 0.1 PER (x) 7.1 BV/share 1.6 P/BV 0.5 Sta. Lucia Land,
Macquarie ASEAN Conference August 2015
 Macquarie ASEAN Conference 24-26 August 2015 DISCLAIMER This presentation has been prepared by Bowsprit Capital Corporation Limited, in its capacity as the manager of First Real Estate Investment Trust
4Q & FY16/17 Financial Results
 4Q & FY16/17 Financial Results 24 April 2017 Important Notice This presentation shall be read in conjunction with Mapletree Industrial Trust s ( MIT ) financial results for Fourth Quarter Financial Year
Investor Presentation December 2017
 Investor Presentation December 2017 Cautionary Statement This presentation includes statements concerning our expectations, beliefs, plans, objectives, goals, strategies, future events or performance and
Lippo Malls Indonesia Retail Trust. 1Q 2018 Results Presentation 3 May 2018
 Lippo Malls Indonesia Retail Trust 1Q 2018 Results Presentation 3 May 2018 Disclaimer Certain statements in this presentation concerning our future growth prospects are forward-looking statements, which
Ascott Residence Trust A Leading Global Serviced Residence REIT
 Ascott Residence Trust A Leading Global Serviced Residence REIT Acquisition of a Second Property in New York, United States of America 1 14 March 2016 Disclaimer IMPORTANT NOTICE The value of units in
Corporate Presentation 4 th Quarter 2018 Financial Results
 Corporate Presentation 4 th Quarter 2018 Financial Results 17 January 2019 Important Notice This presentation is for information only and does not constitute an invitation or offer to acquire, purchase
National Real Estate Company. Earnings Presentation Q1 FY2014
 National Real Estate Company (Kuwait KSE: NRE) Earnings Presentation Q1 FY2014 May 28, 2014 1 Agenda 1. NREC Overview 3 2. Q1 FY2014 Summary 4 3. Financial Performance 5 4. Key Financial Ratios 7 5. Quarterly
Table of Contents. 1. Business Overview. 2. Current Property & Economic Outlook. 3. Ramping Up for Future Growth. 4. 9M2015 Financial Highlights
 3Q2015 Results Presentation 17 August 2015 1 Important Notes This presentation does not constitute or form part of any offer or invitation to sell or issue, or any solicitation of any offer to purchase
ATRIUM Q RESULTS ANALYST AND INVESTOR CALL. 18 May 2016
 ATRIUM Q1 2016 RESULTS ANALYST AND INVESTOR CALL 18 May 2016 KEY EVENTS IN 2016 YTD OPERATIONAL PERFORMANCE Core Markets¹: NRI increased 1.2% to 36.3m; LFL NRI remained stable at 31.4m Russia continues
PRESENTATION RESULTS Q Aldar Q Results
 Q1 2018 RESULTS PRESENTATION DISCLAIMER This disclaimer governs the use of this presentation. You must not rely on the information in the presentations and alternatively we recommend you to seek advice
3Q FY18 Financial Results 10 July 2018
 3Q FY18 Financial Results 10 July 2018 Disclaimer This presentation is for information only and does not constitute an invitation or offer to a c q u i r e, p u r c h a s e or s u b s c r i b e f o r u
Investor Presentation Shaw and Partners - Emerging Leaders Conference
 Investor Presentation Shaw and Partners - Emerging Leaders Conference Your Community Developer 31 May 2017 1 AVJennings at a glance 2 ON AFFORDABLE HOUSING IN URBAN GROWTH CORRIDORS STRONG BALANCE SHEET
FY2012 RESULTS PRESENTATION
 FY2012 RESULTS PRESENTATION 21 August 2012 INVESTMENT HIGHLIGHTS Proven track record of consistent earnings growth and meeting targets Strategically located and diverse residential portfolio Urban and
Y2017 Final Results. 16 March 2018
 Y2017 Final Results 16 March 2018 DISCLAIMER The information in this presentation is for personal, non-commercial reference and general information purposes only and should not be relied upon for investment
仁恒置地集团 YANLORD LAND GROUP LIMITED. 2Q and 1H 2013 Results Presentation
 仁恒置地集团 YANLORD LAND GROUP LIMITED 2Q and 1H 2013 Results Presentation 1 Presentation Content I. Key Financial Highlights II. Business and Operation Overview III. Outlook 2 Yanlord 2Q 2013 Business Review
Interim Results - FY2015. Sun Hung Kai Properties Limited
 Interim Results - FY2015 27 February 2015 1 Disclaimer The information contained in these materials is intended for reference and general information purposes only. Neither the information nor any opinion
INVESTOR PRESENTATION. September 2011
 INVESTOR PRESENTATION September 2011 Disclaimer This document does not constitute or form part of and should not be construed as, an offer to sell or issue or the solicitation of an offer to buy or acquire
FINANCIAL YEAR 2012 RESULTS
 FINANCIAL YEAR 2012 RESULTS 31 January 2013 Contents Financial Highlights FY 2012 Portfolio Update KLCA & Cyberjaya Office Market Outlook Klang Valley & Penang Retail Market Outlook Conclusion 2 Important
1Q2016 Results Presentation
 1Q2016 Results Presentation 1 Important Notes This presentation does not constitute or form part of any offer or invitation to sell or issue, or any solicitation of any offer to purchase or subscribe for,
仁恒置地集团 YANLORD LAND GROUP LIMITED. 1Q 2017 Results Presentation
 仁恒置地集团 YANLORD LAND GROUP LIMITED 1Q 2017 Results Presentation Yanlord1Q2017Business Review Yanlord 1Q 2017 Business Review Underscored by robust pre-sale delivery and higher ASP for units delivered during
2011 Annual Results Presentation
 Stock code:1777 2011 Annual Results Presentation March 2012 Disclaimer This presentation has been prepared by Fantasia Holdings Group Co., Limited (the Company ) solely for use at the presentation regarding
Q RESULTS 15 MAY 2018 TLG IMMOBILIEN AG Q RESULTS
 TLG IMMOBILIEN AG Q 208 RESULTS DISCLAIMER This presentation includes statements, estimates, opinions and projections with respect to anticipated future performance of TLG IMMOBILIEN ("Forward-Looking
Frasers Commercial Trust 3 rd Annual General Meeting. 17 January 2012
 Frasers Commercial Trust 3 rd Annual General Meeting 17 January 2012 Important notice Certain statements in this Presentation constitute forward-looking statements, including forward-looking financial
2016 FULL-YEAR RESULTS WEBCAST 21 FEBRUARY 2017
 FULL-YEAR RESULTS WEBCAST 21 FEBRUARY 2017 DISCLAIMER The information contained in this document has not been independently verified. No representation, warranty or undertaking, express or implied, is
H RESULTS 10 AUGUST 2018 TLG IMMOBILIEN AG H RESULTS
 TLG IMMOBILIEN AG H1 2018 RESULTS DISCLAIMER This presentation includes statements, estimates, opinions and projections with respect to anticipated future performance of TLG IMMOBILIEN ("Forward-Looking
Viva Industrial Trust 1Q2018 Results Presentation. 15 May 2018
 Viva Industrial Trust 1Q2018 Results Presentation 15 May 2018 1 Important Notice This presentation is for information purposes only and does not constitute or form part of an offer, invitation or solicitation
Financial Results for the 2nd Quarter of FY November 8, 2017 NTT Urban Development Corporation
 Financial Results for the 2nd Quarter of FY 2017 November 8, 2017 NTT Urban Development Corporation Financial Results for the 2nd Quarter of FY 2017 Operating revenue and operating income were 72.7 billion
Fiera Milano 1 st Quarter 2008 Financial Results. Conference Call 15 May 2008
 Fiera Milano 1 st Quarter 2008 Financial Results Conference Call 15 May 2008 Contents Section 1. Section 2. Major Events after quarter-end Section 3. Outlook for FY2008 Contents 2 Section 1 1 st Quarter
Welcome to Opportunity Day Financial Performance Result for the 6 months period ended Jun 30, 2018
 Welcome to Opportunity Day Financial Performance Result for the 6 months period ended Jun 30, 2018 Creating Perfect Cities where Possibilities Happen Disclaimer This document was prepared by Amata Corporation
Q4 Full Year ended 31 December 2012 Results Presentation 7 January
 Q4 Full Year ended 31 December 2012 Results Presentation 7 January 2013 http://www.alarkan.com 1 FORWARD-LOOKING STATEMENT This presentation contains forward-looking statements. Such statements are not
Sunway Berhad TP: RM3.27 (+10.6%) Acquires Industrial Land Parcels in Selangor
 Acquires Industrial Land Parcels in Selangor") A Member of the TA Group MENARA TA ONE, 22 JALAN P. RAMLEE, 50250 KUALA LUMPUR, MALAYSIA TEL: +603-20721277 / FAX: +603-20325048 C O M P A N Y U P D A T E Monday, 22 February 2016 FBMKLCI: 1,674.88 Sector:
A Member of the TA Group MENARA TA ONE, 22 JALAN P. RAMLEE, 50250 KUALA LUMPUR, MALAYSIA TEL: +603-20721277 / FAX: +603-20325048 C O M P A N Y U P D A T E Monday, 22 February 2016 FBMKLCI: 1,674.88 Sector:
BTS Group Holdings PCL
 16 October 2014 Disclaimer Investment involves risk. Prospective should understand the characteristics of Securities and study information about BTS Group Holdings Public Company Limited (the Company )
DEVELOPING EAST CAIRO SINCE
 1 DEVELOPING EAST CAIRO SINCE 1959 MNHD at a glance 2 2019 MNHD Corporate History & Structure MNHD is currently positioned as one of the leading real estate developers in Egypt MNHD s history dates back
CENTURY PROPERTIES GROUP, INC. Analysts Presentation: Q Results 14 August 2013
 CENTURY PROPERTIES GROUP, INC. Analysts Presentation: Q2 2013 Results 14 August 2013 IMPORTANT NOTICE AND DISCLAIMER These materials have been prepared by Century Properties Group Inc. (together with its
Full Year Results Presentation for the year ended 31 December March 2015
 Full Year Results Presentation for the year ended 31 December 2014 3 March 2015 Disclaimer This presentation is not intended to, and does not constitute or form part of, any offer, invitation or the solicitation
Corporate Presentation 3 rd Quarter 2017 Financial Results
 Corporate Presentation 3 rd Quarter 2017 Financial Results 17 November 2017 Important Notice This presentation is for information only and does not constitute an invitation or offer to acquire, purchase
Macquarie Mexican REIT
 Macquarie Mexican REIT Fourth Quarter 2012 Results Presentation February 26, 2013 4Q12 Results Agenda 1. Overview Nick O Neil 2. Highlights & Portfolio Performance Jaime Lara 3. Financials Jaime Lara 2
FY18 Financial Results 11 October 2018
 FY18 Financial Results 11 October 2018 Disclaimer This presentation is for information only and does not constitute an invitation or offer to a c q u i r e, p u r c h a s e or s u b s c r i b e f o r u
Investor Presentation. First Quarter 2015
 Investor Presentation First Quarter 2015 1 CAUTIONARY STATEMENTS Today s session and our answers to questions contain statements that constitute forward-looking statements about expected future events
3Q2018 EARNINGS CALL. November 08 th, 2018
 3Q2018 EARNINGS CALL November 08 th, 2018 BUSINESS RESULTS 9M2018 Sales performance Accumulative sales performance (1) (Units) Handed over units (Units) 24,791 25,282 6,000 P 19,302 3,596 12,034 1,903
Housing New Zealand Investor Update
 Housing New Zealand Investor Update May 2018 Matthew Needham CFO Matthew.needham@hnzc.co.nz Sam Direen Treasury Manager Sam.direen@hnzc.co.nz Disclaimer This presentation has been prepared by Housing New
CAPITALAND COMMERCIAL TRUST ANNOUNCEMENT PROPOSED ACQUISITION OF ASIA SQUARE TOWER 2
 CAPITALAND COMMERCIAL TRUST (Constituted in the Republic of Singapore pursuant to a trust deed dated 6 February 2004 (as amended)) ANNOUNCEMENT PROPOSED ACQUISITION OF ASIA SQUARE TOWER 2 1. INTRODUCTION
Agenda. A Snapshot of 2014 Key Achievements Sustainable Growth Land Bank
 Agenda A Snapshot of 2014 Key Achievements Sustainable Growth Land Bank Business Review Property Development Property Investment & Management Hospitality Investment & Management Diversified and Robust
Proposed Acquisition of an Indirect Interest in One Raffles Place. 10 June 2015
 Proposed Acquisition of an Indirect Interest in One Raffles Place 10 June 2015 Disclaimer This presentation should be read in conjunction with the announcement on the proposed acquisition of an indirect
» Fifth level. Financial Highlights. Click to edit Master title style. Portfolio Performance. Growth Outlook. Acquisitions
 Disclaimer Certain statements in this presentation concerning our future growth prospects are forward-looking statements, which involve a number of risks and uncertainties that could cause actual results
MANAGING HIGH VALUE ADDED PROCESSES GLOBALLY. MID TERM FINANCIAL REPORT SEPTEMBER 30 th 2017
 1 MANAGING HIGH VALUE ADDED PROCESSES GLOBALLY MID TERM FINANCIAL REPORT SEPTEMBER 30 th 2017 DISCLAIMER 2 This document has been prepared by CIE Automotive, S.A. ("CIE Automotive"), and is for information
MANAGING HIGH VALUE ADDED PROCESSES GLOBALLY. MID TERM FINANCIAL REPORT JUNE 30 th 2017
 1 MANAGING HIGH VALUE ADDED PROCESSES GLOBALLY MID TERM FINANCIAL REPORT JUNE 30 th 2017 DISCLAIMER 2 This document has been prepared by CIE Automotive, S.A. ("CIE Automotive"), and is for information
Apartment Sector SURABAYA APARTMENT APARTMENT FOR STRATA- TITLE. Supply. Colliers Half Year H February Forecast at a glance
 Colliers Half Year 16 February 2017 SURABAYA APARTMENT Accelerating success. Apartment Sector Ferry Salanto Senior Associate Director Research Despite further pressure from tight competition amongst projects
First Sponsor Group Limited Investor Presentation 27 April Dreeftoren, Amsterdam Southeast (artist impression)
") First Sponsor Group Limited Investor Presentation 27 April 2017 Dreeftoren, Amsterdam Southeast (artist impression) Contents Page Section 1 Key Message 2 Section 2 Financial Highlights 6 Section 3 Key
First Sponsor Group Limited Investor Presentation 27 April 2017 Dreeftoren, Amsterdam Southeast (artist impression) Contents Page Section 1 Key Message 2 Section 2 Financial Highlights 6 Section 3 Key
Annual General Meeting 19 April 2016
 Annual General Meeting 19 April 2016 DISCLAIMER This presentation has been prepared by Bowsprit Capital Corporation Limited, in its capacity as the manager of First Real Estate Investment Trust ( First
Company Presentation February
 Company Presentation February 2017 www.alamsuterarealty.co.id Our Company Township Development High-Rise Projects Property Investment Operational Data Financial Performance 2 Key Milestones More than 20
2018 HALF-YEAR RESULTS
 2018 HALF-YEAR RESULTS WEBCAST 25 JULY 2018 Disclaimer The information contained in this document has not been independently verified. No representation, warranty or undertaking, express or implied, is
New World One Step Forward. We Create New Living Experience. FY2014 Annual Results 24 Sep 2014
 New World One Step Forward We Create New Living Experience FY2014 Annual Results 24 Sep 2014 Disclaimer IMPORTANT NOTICE The information contained in these materials is intended for reference and general
TRENDS SUMMARY. 1 st Quarter 2006
 PT FAS In association with PT Paragon Property 1 st Quarter 26 Jakarta TRENDS SUMMARY Office: Retail: Apartment: Hotel: Gross rents continue to increase as existing vacant stock is taken up. New space
Results of Operations
 JINUSHI REIT JINUSHI Business Results of Operations for the Fiscal Year Ended March 31, 2017 June 6, 2017 Securities code: 3252 (TSE/NSE, First Sections) 1. FY3/17 Financial Highlights 2. JINUSHI REIT
INVESTOR PRESENTATION MAY 2013
 INVESTOR PRESENTATION MAY 2013 Forward-Looking Statements This presentation includes forward-looking statements. These statements are subject to a number of risks, uncertainties and other factors that
This document does not constitute an offer to sell or an invitation or solicitation of an offer to subscribe for or purchase any securities, and
 This document has been prepared by Atrium (the Company ). This document is not to be reproduced nor distributed, in whole or in part, by any person other than the Company. The Company takes no responsibility
» Fifth level. Financial Highlights. Click to edit Master title style. Portfolio Performance. Growth Outlook. Latest Acquisition
 Disclaimer Certain statements in this presentation concerning our future growth prospects are forward-looking statements, which involve a number of risks and uncertainties that could cause actual results
The Artisanal NEW WORLD. FY2017 Interim Results
 The Artisanal NEW WORLD FY2017 Interim Results DISCLAIMER 2 DISCLAIMER- IMPORTANT NOTICE The information contained in these materials is intended for reference and general information purposes only. Neither
Fantasia Holdings Group Announces 2010 Interim Results
 Fantasia Holdings Group Announces 2010 Interim Results Urban complexes fuel sales growth Total revenue and net profit increase 42.8% and 74.5% respectively In the first half of 2010, total sales and net
TRENDS SUMMARY. 2 nd Quarter 2006
 PT FAS In association with PT Paragon Property 2 nd Quarter 26 Jakarta TRENDS SUMMARY Office: Retail: Apartment: Hotel: Over the long term, an over supply condition may develop as new space currently under
FY18/12 Q2 PRESENTATION
 FY18/12 Q2 PRESENTATION RENESAS ELECTRONICS CORPORATION JULY 31, 2018 2018 Renesas Electronics Corporation. All rights reserved. FINANCIAL TARGETS AND STRATEGY Long-term Financial Targets *1 (Starting
O KEY GROUP TRADING UPDATE Q3 AND 9M November, 2018
 O KEY GROUP TRADING UPDATE Q3 AND 9M 2018 13 November, 2018 Disclaimer 2 By attending the meeting where this presentation is made, or by reading the presentation slides, you agree to be bound by the following
TRENDS SUMMARY. 1 st Quarter 2007
 PT FAS In cooperation with PT Paragon Property 1 st Quarter 27 Jakarta TRENDS SUMMARY Office: Retail: Apartment: While demand for space is increasing, occupancy levels remain nearly the same as newly completed
Q BUSINESS ACTIVITY AND REVENUE WEBCAST 25 APRIL 2018
 BUSINESS ACTIVITY AND REVENUE WEBCAST 25 APRIL 2018 DISCLAIMER The information contained in this document has not been independently verified. No representation, warranty or undertaking, express or implied,
FY2016 Interim Results
 FY2016 Interim Results 26 February 2016 1 Contents Interim Results Highlights Business Overview A) Property Business Hong Kong Land Bank Property Development Property Investment B) Property Business Mainland
APAC REALTY, OPERATOR OF MARKET-LEADING REAL ESTATE BROKERAGE IN SINGAPORE UNDER THE ERA BRAND, LAUNCHES $58.2 MILLION IPO
 APAC REALTY, OPERATOR OF MARKET-LEADING REAL ESTATE BROKERAGE IN SINGAPORE UNDER THE ERA BRAND, LAUNCHES $58.2 MILLION IPO APAC Realty, through its wholly-owned subsidiary ERA Realty, is the operator of
TRENDS SUMMARY. 4 th Quarter 2006
 PT FAS In association with PT Paragon Property 4 th Quarter 26 Jakarta TRENDS SUMMARY Office: Retail: Apartment: There is evidence that demand is increasing for both for lease and strata title spaces.
COMMERCIAL PROPERTY DEVELOPMENT. The Commercial Property Price Index Increased on Rising Demand. Quarter IV COMMERCIAL PROPERTY
 COMMERCIAL PROPERTY DEVELOPMENT Quarter IV - 2017 The Commercial Property Price Index Increased on Rising Demand Based on the Commercial Property Development Survey conducted by Bank Indonesia, the Commercial
the-bridge January - March, 2015 VOL 4 ISSUE 4 Simplicity with Variety!
 the-bridge January - March, 2015 VOL 4 ISSUE 4 Simplicity with Variety! Contents 03 Standing Tall 04 Omaxe Presence Across India 05 Business Overview Q4 FY15 06 Business Overview FY15 07 Business Operation
APAC REALTY REPORTS NET PROFIT OF S$24.2 MILLION IN FY2018
 APAC REALTY REPORTS NET PROFIT OF S$24.2 MILLION IN FY2018 Declares final dividend of 2.5 cents per share; including the interim dividend of 2.0 cents per share, bringing the total dividend for FY2018
International Complex Projects Limited
 Rating Report RATING REPORT REPORT DATE: January 03, 2017 RATING ANALYSTS: Talha Iqbal talha.iqbal@jcrvis.com.pk Osman Rahi Osman.rahi@jcrvis.com.pk RATING DETAILS Initial Rating Rating Category Longterm
First REIT strengthens growth with acquisition in Kupang, East Nusa Tenggara, Indonesia
 FOR IMMEDIATE RELEASE First REIT strengthens growth with acquisition in Kupang, East Nusa Tenggara, Indonesia To acquire Siloam Hospitals Kupang and Lippo Plaza Kupang for S$70.00 million, at a 7.19% discount
Douja Promotion Groupe Addoha. An African leader of Real Estate Development
 Douja Promotion Groupe Addoha An African leader of Real Estate Development Summary I II III IV V Addoha Group: Strong fundamentals & a clear focus Development in Morocco Development in Africa Key highlights
Q BUSINESS ACTIVITY AND REVENUE WEBCAST 25 APRIL 2017
 BUSINESS ACTIVITY AND REVENUE WEBCAST 25 APRIL 2017 DISCLAIMER The information contained in this document has not been independently verified. No representation, warranty or undertaking, express or implied,
Five Oaks Investment Corp.
 Five Oaks Investment Corp. Investor Presentation May 2018 Disclaimer & Name Change This presentation contains forward-looking statements within the meaning of Section 27A of the Securities Act of 1933,
Central Pattana Plc. January 10, Property Development and Investment. Central Marina Pattaya Re-launched on 19 December 2016
 Central Pattana Plc. Property Development and Investment Central Marina Pattaya Re-launched on 19 December 2016 January 10, 2017 Contents Our Company Financing Looking ahead 2 CPN at a Glance Our company
Investor Presentation 2007
 Investor Presentation 2007 1 Forward Looking Statements This presentation contains forward-looking statements within the meaning of the federal securities laws. These statements reflect management s current
FY2018 annual results - 20 Sep 2018
 FY2018 annual results - 20 Sep 2018 DISCLAIMER - IMPORTANT NOTICE The information contained in these materials is intended for reference and general information purposes only. Neither the information nor