CENTURY PROPERTIES GROUP, INC. Analysts Presentation: FY 2013 Results April 2014
|
|
|
- Molly Watson
- 6 years ago
- Views:
Transcription

1 CENTURY PROPERTIES GROUP, INC. Analysts Presentation: FY 2013 Results April 2014
2 IMPORTANT NOTICE AND DISCLAIMER These materials have been prepared by Century Properties Group Inc. (together with its subsidiaries, the "Company or Century ), and have not been independently verified. No representation or warranty, expressed or implied, is made and no reliance should be placed on the accuracy, fairness or completeness of the information presented in these materials. Neither the Company nor any of its affiliates, advisers or representatives accepts any liability whatsoever for any loss howsoever arising from any information presented in these materials. The information presented or contained in these materials is subject to change without notice and its accuracy is not guaranteed. These materials contain statements that constitute forward-looking statements. These statements include descriptions regarding the intent, belief or current expectations of Century or its officers with respect to the consolidated results of operations and financial condition of Century. These statements can be recognized by the use of words such as "targets", "believes", "expects", "aims", "intends", "will", "may", "anticipates", "would", "plans", "could", "predicts", "projects", "estimates", "foresees," or words of similar meaning. Such forward-looking statements are not guarantees of future performance and involve risks and uncertainties, and actual results may differ from those in the forward-looking statements as a result of various factors and assumptions. Century has no obligation and does not undertake to revise forward-looking statements to reflect future events or circumstances. Representative examples of these factors and assumptions include (without limitation) general industry and economic conditions, interest rate trends, cost of capital and capital availability, availability of real estate properties, competition from other companies and venues for sale of projects, shifts in customer demands, customers and partners, changes in operating expenses, including employee wages, benefits and training, governmental and public policy changes and continued availability of financing in the amounts and the terms necessary to support future business. 1

3 CONTENTS 1 INTRODUCTION 3 2 PRE-SALES AND COLLECTION 7 3 FINANCIAL PERFORMANCE AND CAPITAL MANAGEMENT 4 PROOF OF CONCEPT 22 5 FUTURE PROJECTS 43 16
4 INTRODUCTION 1
5 WHERE WE ARE NOW Earnings Momentum FY 2013 Revenue of P10.8 B, representing 12.5% growth from P9.6 B in FY 2012 FY 2013 Gross Profit from Real Estate Development of P4.2 B, representing 5.8% growth from P4.0 B in FY 2012 FY 2013 EBITDA of P2.8 B, representing 8.0% growth from P2.6 B in FY 2012 FY 2013 Net Income of P1.84 B, representing a slight decline of -0.3% from P1.85 B FY 2012 Earnings Quality Steady Increase In Selling Price Average price increase of 8%, 25%, 15% for Luxury, Middle Income and Affordable Markets, respectively, between December 2013 and December 2012 based on sold units Average PSM sold of 208,000 (Luxury), 166,696 (Middle Income), and 115,348 (Affordable) for the 12 months 2013 Increased Construction Cost GP margin declined to 42.1% from 44.5% due to the focus on brand building CPG believes that brand building translates into differentiation and will result in long-term market share Healthy Collection Middle Income: 57% cash, 42% bank, 1% in house Affordable: 39% cash, 58% bank, 3% in house 4
6 WHERE WE ARE NOW Earnings Sustainability Pre-Sales FY 2013 Pre-Sales of P24.6 B, representing 15% growth from P21.4 B in FY 2012 Total un-booked revenues amounting to P35.1 B as of December 2013 FY 2013 pre-sales as % of new launches was at 124% mitigating inventory buildup Liquidity Total debt capacity increased to P10.6 B by March 2014 Cash flow from operations improved to P1.6 B in FY 2013 vs -P3.4B in FY 2012 Recurring Income Initial foray into the recurring income space with the completion of 17,000 net leasable sqm Century City mall that is 99% leased and 100% reserved as of March 2014 Finished excavation for office building with GFA of 29,530 sqm 1 in Fort Bonifacio (1) CPG s share is 49% : 14,470 sqm 5
7 RESULTS OVERVIEW PHP (Million) FY 2011 FY 2012 FY 2013 Total Revenues 4,702 9,611 10,809 Gross Profit from Real Estate Development 1 1,751 3,962 4,192 EBITDA 1 1,353 2,543 2,786 Net Income 866 1,850 1,845 Gross Profit Margin from Real Estate Development % 44.5% 42.1% Net Income Margin ROE Net Debt / Equity 18.4% 19.2% 17.1% 23.8% 29.4% 23.4% 0.12x 0.33x 0.40x (1) With Interest Accretion 6
8 PRE-SALES AND COLLECTION 2
9 REAL ESTATE MARKET OVERVIEW Despite increased supply (170K units since 2011 with average of 56.7K units), take up has increased as well (142K since 2011 units with average of 47.4K units) In 000 (K) 70,000 60,000 59,025 59,379 50,000 48,199 51,525 51,735 42,590 40,000 30,000 20,000 10, Take-up Launches Source: Colliers International as of FY

10 CPG s TARGET MARKETS Premium pricing across all market segments Colliers Price Points CPG s Price Points Economic Below P1.25M None Affordable P1.25M to P3.0M P2.3M to P3.6M Middle Income Upscale P3.0M to P5.0M P5.0M to P7.0M P3.7M to P7.2M Luxury P7.0M and above P7.3M and above 9
11 REAL ESTATE MARKET OVERVIEW Remaining Inventory Life (in # of Years) Economic Affordable Middle Income Upscale Luxury All Segments Source: Colliers International as of FY
12 PRE-SALES Balanced Product Mix FY 2012 By Product: Php21.4 B Total Pre-sales 15 % Increase FY 2013 By Product: Php24.6 B Total Pre-sales Luxury 22% Luxury 26% Affordable 45% Affordable 51% Middle Income 33% Middle Income 23% Visibility on earnings with P35.1 B of un-booked revenue Note: Luxury, Middle Income and Affordable markets are defined wherein majority of the units total contract price is over P7.3M, between P3.7M to P7.2M and between P2.3M to P3.6M respectively. 11
13 PRE-SALES Industry Leading International Sales Platform FY 2013 By Geographic Location FY 2013 By Country Others 8% Philippines 28% North America 13% Philippines 28% Middle East 5% Europe 11% International 72% Asia 35% 12
14 UNPARALLELED INTERNATIONAL SALES PLATFORM AND PRUDENT LAUNCHES Increased market share through dominant international sales and marketing presence Launching projects in a staggered manner to prevent build-up of inventory CPG is #3 in terms of value of units sold as of FY 2013 Total inventory for FY 2013: 16,872 units DMC 13% SMDC 6% CPG 15% ALI 43% Sold 89% Unsold 11% MEG 23% Source: Colliers International as of FY
15 ABILITY TO INCREASE SELLING PRICE DUE TO PREMIUM PRODUCTS Luxury (Ave. PSM, Sold) Middle Income (Ave. PSM, Sold) 210, , , , , , , , , , , , , , ,000 FY 2012 FY ,000 FY 2012 FY 2013 Affordable (Ave. PSM, Sold) 120, , , , , ,000 99,972 95,000 90,000 FY 2012 FY 2013 Note: Reflects pre-sold units pricing on above mentioned time periods 14
16 COLLECTION SNAPSHOT Middle Income Payment of Turnover Balances Bank Financing 42% In-house Financing 1% Affordable Payment of Turnover Balances In-house Financing 3% Bank Financing 58% Cash Payment 39% Cash Payment 57% Note: Past collection efficiency is not an indication of future collection efficiency. 15
17 FINANCIAL PERFORMANCE AND CAPITAL MANAGEMENT 3
18 SUSTAINED EARNINGS GROWTH MOMENTUM Key Income Statement Details Total revenues (Php Million) 12,000 10,000 8,000 9,611 10,809 Gross profit from real estate development 1 (Php Million) Margin (%) 5, ,192 3,962 4,000 6,000 4,000 2,000 3,072 4,702 3,000 2,000 1, ,751 0 EBITDA 1 (Php Million) Margin (%) 3,000 2,500 2, ,603 2, ,000 1, Profit After Tax (Php Million) Margin (%) ,850 1,845 1,500 1,353 1, , (1) With Interest Accretion 17
19 HEALTHY BALANCE SHEET Amount in Php Million Cash and Cash Equivalents ,439 Total Assets 7,555 10,033 18,556 26,166 Total Borrowings 1, ,661 6,039 Net Debt ,759 4,600 Stockholder s Equity 2,950 4,322 8,241 11,435 Debt-to-Equity Ratio 60% 52.8% Net Debt-to-Equity Ratio 50.0% 50% 40% 30% 20% 10% 41.6% 20.4% 44.4% 40.0% 30.0% 20.0% 10.0% 32.0% 11.9% 33.5% 40.2% 0% %
20 IMPROVING OPERATING CASH FLOW Amount in Php Million Cash Flow from Operations (922) (252) (3,414) (1,586) Cash Flow from Investing (109) 325 (863) (1,548) Cash Flow from Financing 1, ,812 3,670 Change in Cash Beginning Cash Ending Cash ,439 19
21 MORE CREDIT FACILITIES, LOWER COST OF DEBT Approved Credit Facilities (Php Million) Number Of Banks 13,000 11,000 9, ,645 Cost of Debt Weighted Average Interest Rate % 9.5% 9.0% 8.5% 8.0% 9.5% 8.9% 7,000 6, % 7.0% 7.5% 5, % 3,000 1,695 2, % 5.5% 6.1% 1, Mar % Mar-2014 (1) Based on total credit lines, and interest rate is before hedging costs 20

 PNB Building BPI Buendia")
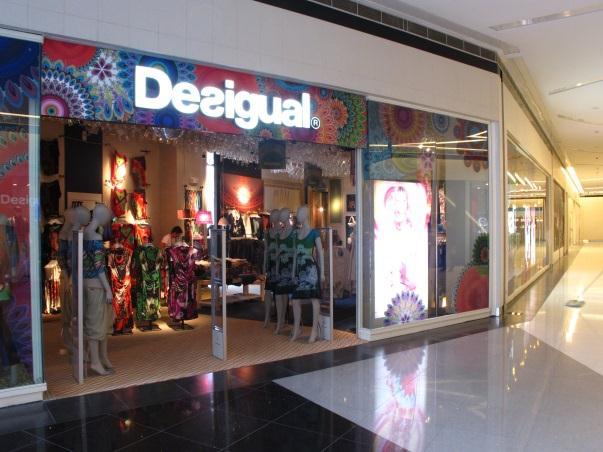
22 INCREASING REVENUES FROM PROPERTY MANAGEMENT Total Revenues from Property Management (Php Million) Largest Independent Property Manager with 49 Buildings Totaling 2.6M sqm under Management As of Dec No. of projects GFA ( 000 sqm) Residential 21 1,253 Commercial 28 1,302 Total 49 2,555 Notable Projects Under Management, with 80% of contracts with 3 rd parties Asian Development Bank Makati Medical Center Pacific Star Building Globe Telecom Plaza (Cebu, Mandaluyong, Makati) PNB Building BPI Buendia Center One San Miguel Avenue 21
23 PROOF OF CONCEPT 4
 An aerial view of the Azure")

24 1 AZURE URBAN RESORT RESIDENCES (THEN & NOW) An aerial view of the Azure project A landscape view of the Azure development with the resort-themed amenities 23


25 1 AZURE URBAN RESORT RESIDENCES (NOW) The Paris Beach Club was inaugurated on March 13 24


26 1 3 AZURE URBAN RESORT RESIDENCES (NOW) St. Tropez begins turnover in February; Positano and Miami buildings top off Azure s third tower, St. Tropez, has began turnover of its first few units in February. Tthe Paris Beach Club and Azure s first four residential towers. 25


27 1 3 AZURE URBAN RESORT RESIDENCES (NOW) Miami and Positano towers Positano completed its superstructure Following structural completion, the Miami and Positano Towers have moved on to interior activities. 26
 Boracay and Maldives towers")

28 1 3 AZURE URBAN RESORT RESIDENCES (NOW) Boracay and Maldives towers The Boracay Tower and Maldives Tower are undergoing basement works. 27


29 2 ACQUA PRIVATE RESIDENCES (THEN & NOW) 28
 Niagara")

30 2 3 ACQUA PRIVATE RESIDENCES (NOW) Niagara undergoing finishing works; Sutherland has topped of already 29


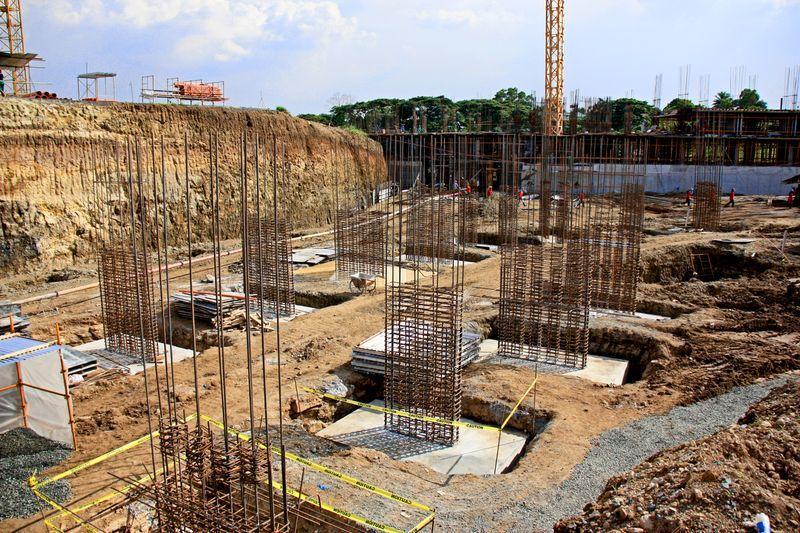
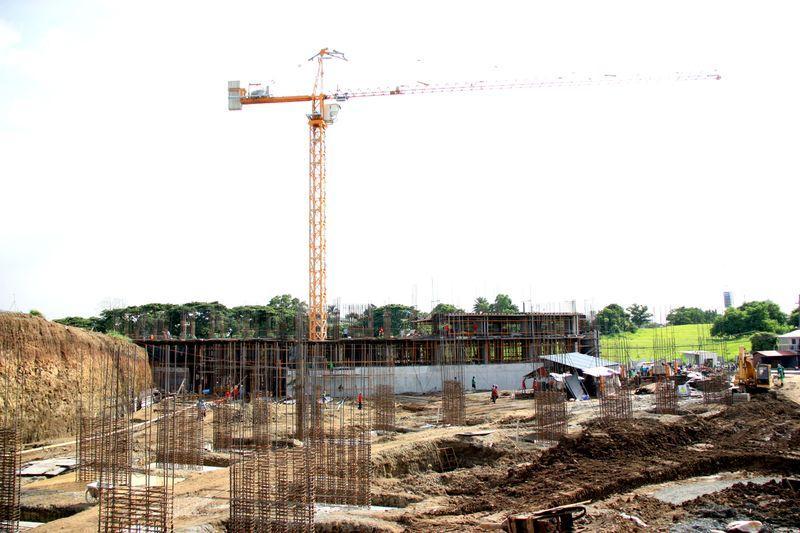
31 2 3 ACQUA PRIVATE RESIDENCES (NOW) Frameworks and rebar installation for Detifoss tower, while Livingstone is progressing well in its construction 30


32 2 3 ACQUA PRIVATE RESIDENCES The Niagara Tower Ceramic flooring and light wood kitchen cabinets have been installed in this corner unit. Dark wood finishes and cream walls are shown in this unit s kitchen area. 31

 32")
33 3 CENTURY CITY (THEN & NOW) 32
 71")


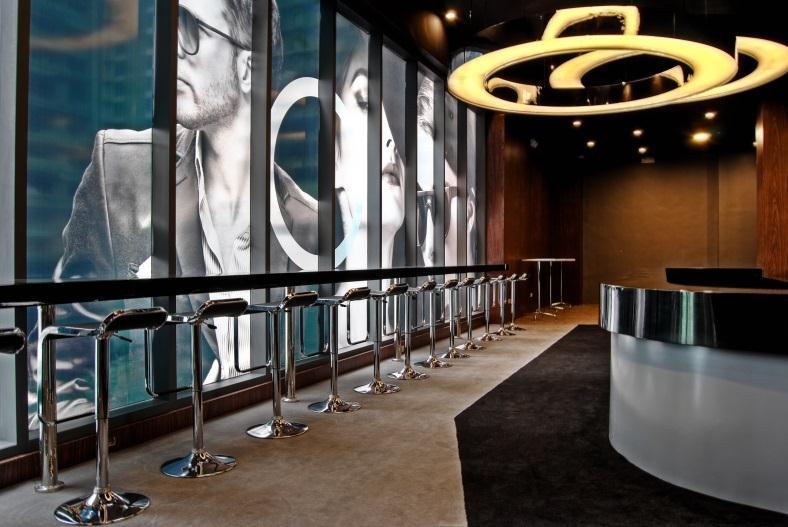
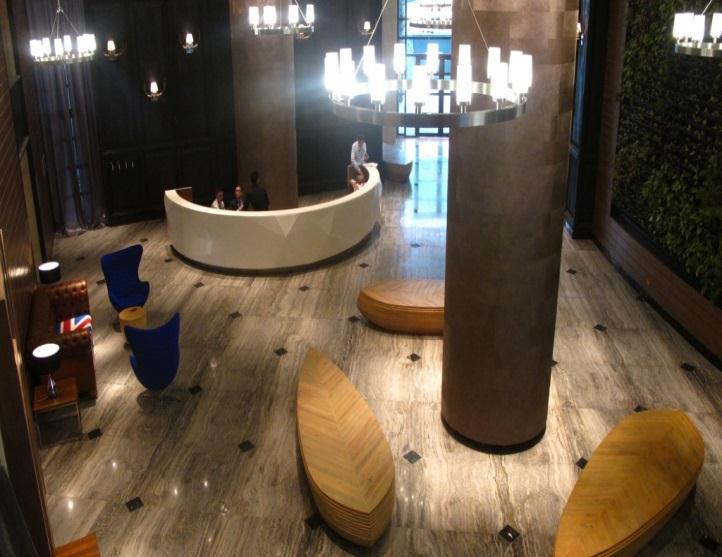
34 3 GRAMERCY (NOW) 71 Gramercy dining entrance View from 71 Gramercy 71 Gramercy lounge bar 33
 Century")

35 3 CENTURY CITY MALL (THEN & NOW) Century City Mall was formally inaugurated on March 24 34

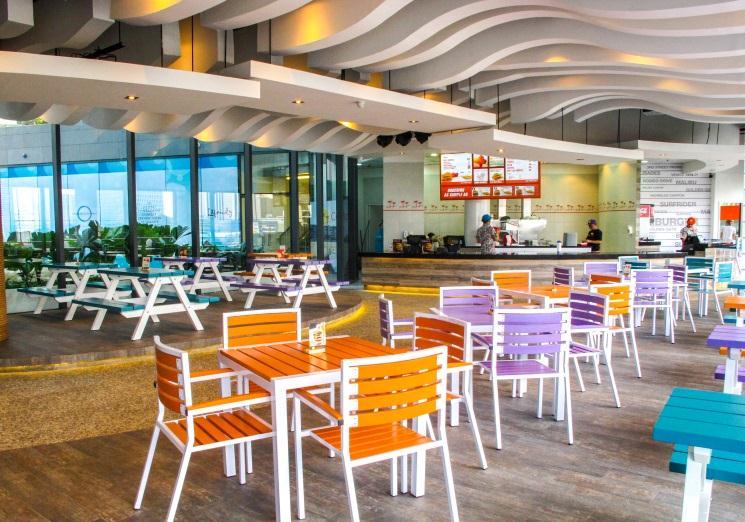
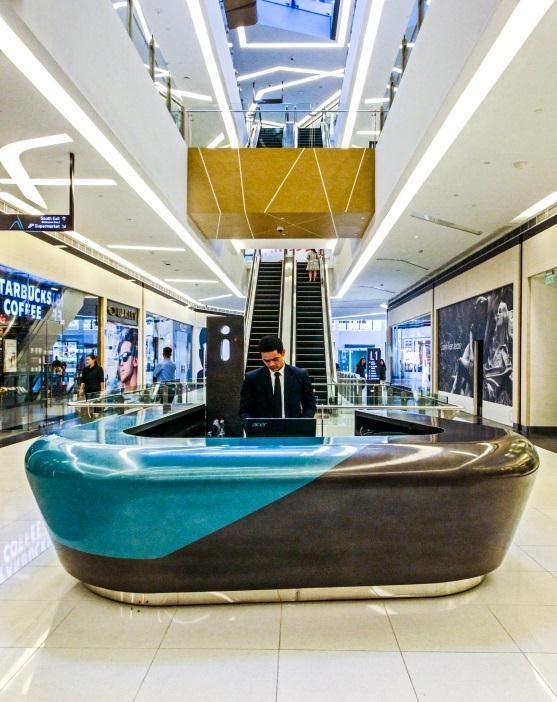

36 3 CENTURY CITY MALL (NOW) 35

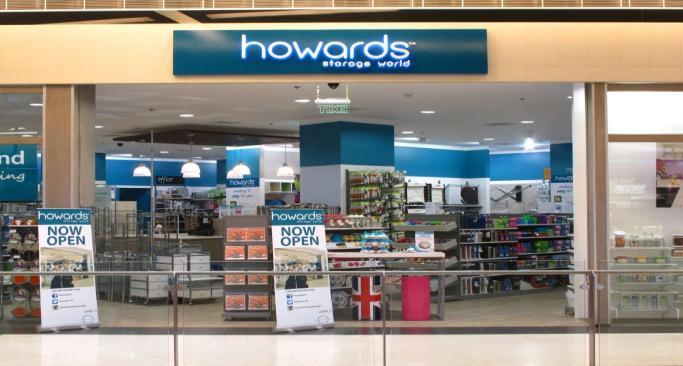


37 3 CENTURY CITY MALL (NOW) 36
 The Knightsbridge")

38 3 THE KNIGHTSBRIDGE RESIDENCES (THEN & NOW) The Knightsbridge Residences was completed in December 2013 and started turning over In January. 37


39 3 THE KNIGHTSBRIDGE RESIDENCES (NOW) 38


40 3 CENTURIA MEDICAL MAKATI (THEN & NOW) Centuria Medical Makati continues interior works in preparation for turnover this year Century Properties IT-medical outpatient facility, moves on with masonry activities, painting works, and dry wall partitioning on various levels of the tower. Centuria Medical Makati is targeted for turnover to clinic unit owners in
 Milano Residences is")

41 3 3 MILANO RESIDENCES (THEN & NOW) Milano Residences is almost complete with its topping off, for completion in December

42 4 THE RESIDENCES AT COMMONWEALTH (THEN) 41
,")
, is on 6th floor structural activities.")
43 4 THE RESIDENCES AT COMMONWEALTH (NOW) Finishing works at the first tower. Second and third towers continue structural progress The first tower, Osmeña West (right), is undergoing exterior painting works. The second tower, Quezon North (left), is on 6th floor structural activities. The Osmeña East Tower is currently on 4th level formworks and rebar installation. 42
44 FUTURE PROJECTS 5
45 NEW PROJECT LAUNCH Earnings Sustainability: New Project Launches in 2014 GFA (sqm, excl parking) Projected Project Launch Date Estimated Completion For Sale Residential For Sale Commercial For Lease Commercial Total (Sqm) Sales Revenue (P Million) Mall ,943 33,943 NA Centuria ,068 8,035 45,103 NA Fort ,765 14,765 NA Spire ,416-27, ,463 8,400 Subtotal 73,416 37,068 83, ,274 8,400 Acqua 6 3 Q ,848-10,303 40,151 2,200 Forbes Q ,496 22,795 63,291 5,500 Pampanga 4 Q TBD 25,140 - TBD 25,140 1,800 Batulao, Batangas TBD Subtotal 54,988 40,496 33, ,582 9,500 Grand Total 128,404 77, , ,856 17,900 Note: For un-launched projects, represents indicative plans and is subject to change (1) Century is currently evaluating keeping more for leasing income (2) CPG share: 49% (3) For lease component represents a condotel product (4) Represents first phase only 44


46 NEW PROJECT LAUNCH - FORBES 3 45


47 NEW PROJECT LAUNCH ACQUA 6 46
48 Q & A 6
CENTURY PROPERTIES GROUP, INC. Analysts Presentation: Q Results 14 August 2013
 CENTURY PROPERTIES GROUP, INC. Analysts Presentation: Q2 2013 Results 14 August 2013 IMPORTANT NOTICE AND DISCLAIMER These materials have been prepared by Century Properties Group Inc. (together with its
CENTURY PROPERTIES GROUP, INC. Analysts Presentation April 20, 2017
 CENTURY PROPERTIES GROUP, INC. Analysts Presentation April 20, 2017 IMPORTANT NOTICE AND DISCLAIMER These materials have been prepared by Century Properties Group, Inc. (together with its subsidiaries,
CENTURY PROPERTIES GROUP, INC. Analysts Presentation: Q Results 15 November 2013
 CENTURY PROPERTIES GROUP, INC. Analysts Presentation: Q3 2013 Results 15 November 2013 IMPORTANT NOTICE AND DISCLAIMER These materials have been prepared by Century Properties Group Inc. (together with
CENTURY PROPERTIES GROUP, INC. Company Presentation for the Annual Stockholders Meeting June 29, 2017
 CENTURY PROPERTIES GROUP, INC. Company Presentation for the Annual Stockholders Meeting June 29, 2017 IMPORTANT NOTICE AND DISCLAIMER These materials have been prepared by Century Properties Group, Inc.
SECURITIES AND EXCHANGE COMMISSION SEC FORM 17-C
 SECURITIES AND EXCHANGE COMMISSION SEC FORM 17-C CURRENT REPORT UNDER SECTION 17 OF THE SECURITIES REGULATION CODE AND SRC RULE 17.2(c)(iii) THEREUNDER 1. Date of Report (Date of earliest event reported):
SECURITIES AND EXCHANGE COMMISSION SEC FORM 17-C
 SECURITIES AND EXCHANGE COMMISSION SEC FORM 17-C CURRENT REPORT UNDER SECTION 17 OF THE SECURITIES REGULATION CODE AND SRC RULE 17.2(c)(iii) THEREUNDER 1. Date of Report (Date of earliest event reported):
ˆ200G=1CkK&taHGjRxŠ. 30-Jan :26 EST BOND OFFERING START PAGE
 RR Donnelley ProFile START PAGE HK8814AM025016 11.6.12 HKR lichr0hk ˆ200G=1CkK&taHGjRxŠ 200G=1CkK&taHGjRx 30-Jan-2015 07:26 EST 840189 EXT 1 PS PMT 1* 1C Management s Discussion and Analysis of Financial
仁恒置地集团 YANLORD LAND GROUP LIMITED. 4Q and FY 2017 Results Presentation
 仁恒置地集团 YANLORD LAND GROUP LIMITED 4Q and FY 2017 Results Presentation Yanlord 4Qand FY 2017Business Review Yanlord 4Q and FY 2017 Business Review Averagesellingprice( ASP )rosesignificantlyin4q2017tormb66,234/sqmfromrmb25,739/sqm
仁恒置地集团 YANLORD LAND GROUP LIMITED. 2Q and 1H 2013 Results Presentation
 仁恒置地集团 YANLORD LAND GROUP LIMITED 2Q and 1H 2013 Results Presentation 1 Presentation Content I. Key Financial Highlights II. Business and Operation Overview III. Outlook 2 Yanlord 2Q 2013 Business Review
仁恒置地集团 YANLORD LAND GROUP LIMITED. 1Q 2017 Results Presentation
 仁恒置地集团 YANLORD LAND GROUP LIMITED 1Q 2017 Results Presentation Yanlord1Q2017Business Review Yanlord 1Q 2017 Business Review Underscored by robust pre-sale delivery and higher ASP for units delivered during
National Real Estate Company. Earnings Presentation Q1 FY2014
 National Real Estate Company (Kuwait KSE: NRE) Earnings Presentation Q1 FY2014 May 28, 2014 1 Agenda 1. NREC Overview 3 2. Q1 FY2014 Summary 4 3. Financial Performance 5 4. Key Financial Ratios 7 5. Quarterly
Fiera Milano 1 st Quarter 2008 Financial Results. Conference Call 15 May 2008
 Fiera Milano 1 st Quarter 2008 Financial Results Conference Call 15 May 2008 Contents Section 1. Section 2. Major Events after quarter-end Section 3. Outlook for FY2008 Contents 2 Section 1 1 st Quarter
Macquarie Mexican REIT
 Macquarie Mexican REIT Fourth Quarter 2012 Results Presentation February 26, 2013 4Q12 Results Agenda 1. Overview Nick O Neil 2. Highlights & Portfolio Performance Jaime Lara 3. Financials Jaime Lara 2
Acquisition of Wilkie Edge. Extraordinary General Meeting 23 November 2007
 Acquisition of Wilkie Edge Extraordinary General Meeting 23 November 2007 Important Notice THIS PRESENTATION IS AVAILABLE ONLY TO PERSONS WHO ARE NON-U.S. PERSONS, PERSONS WITH ADDRESSES OUTSIDE THE U.S.
First Sponsor Group Limited Investor Presentation 24 July 2015
 First Sponsor Group Limited Investor Presentation 24 July 2015 The initial public offering of the Company s shares was sponsored by DBS Bank Ltd., who assumes no responsibility for the contents of this
Macquarie Mexican REIT First Quarter 2014 Supplementary Financial Information
 Macquarie Mexican REIT First Quarter 2014 Supplementary Financial Information Consolidated Income Statement Mar 31, 2013 Mar 31, 2014 Lease Rental Income 383.0 511.7 Tenant Recoveries 22.8 16.9 Other Income
Investor Presentation December 2017
 Investor Presentation December 2017 Cautionary Statement This presentation includes statements concerning our expectations, beliefs, plans, objectives, goals, strategies, future events or performance and
FY18/12 Q2 PRESENTATION
 FY18/12 Q2 PRESENTATION RENESAS ELECTRONICS CORPORATION JULY 31, 2018 2018 Renesas Electronics Corporation. All rights reserved. FINANCIAL TARGETS AND STRATEGY Long-term Financial Targets *1 (Starting
Manila Office Trends Report Q3, Real Estate Industry Summary: Office Market Overview - Metro Manila
 Incl. Preview of Manila Residential Market and Serviced Offices P 7,500 Manila Office Trends Report Q3, 2011 Real Estate Industry Summary: Figure 1) Vacancy rates at the end of 2nd quarter of 2011. Commercial
Ascott Residence Trust A Leading Global Serviced Residence REIT
 Ascott Residence Trust A Leading Global Serviced Residence REIT Acquisition of a Second Property in New York, United States of America 1 14 March 2016 Disclaimer IMPORTANT NOTICE The value of units in
Presentation for REITs Symposium 2016
 Presentation for REITs Symposium 2016 4 June 2016 Important Notice This presentation shall be read in conjunction with OUE Commercial REIT s Financial Results announcement for 1Q 2016 dated 10 May 2016.
Proposed acquisitions of CGGVeritas Hub and Rutherford & Science Hub
 Proposed acquisitions of CGGVeritas Hub and Rutherford & Science Hub 24 January 2008 Content The Properties Rutherford & Science Hub CGGVeritas Hub Impact on A-REIT Pro forma Financial Effect Portfolio
Tenant: Law Firm 4 NAICS: Primary Industry: Offices of lawyers
 Tenant: Law Firm 4 NAICS: 541110 Primary Industry: Offices of lawyers Date: 05.25.17 Table of Contents Law Firm 4 132 Main Street TABLE OF CONTENTS TIL Score Executive Summary Tenant Score Information
INTRODUCTION AND HIGHLIGHTS FINANCIAL REVIEW BUSINESS REVIEW
 COVER 1 AGENDA INTRODUCTION AND HIGHLIGHTS FINANCIAL REVIEW BUSINESS REVIEW Highlights Financial Review Business Review http://www.crland.com.hk/ CR Land Results 2016 2 INTRODUCTION AND HIGHLIGHTS Highlights
CONSTRUCTION UPDATE. June 2012
 CONSTRUCTION UPDATE June 2012 Azure towers 1, 2 and beach near completion; Tower 3 slated to top off by end of July Construction continues to be on schedule for Azure Urban Resort Residences, Century Properties
Acquisition of The Kendall Purchase consideration of S$112.0 million 30 March 2015
 Acquisition of The Kendall Purchase consideration of S$112.0 million 30 March 2015 Content The Acquisition The Kendall Impact on A-REIT Pro forma Financial Impact Weighted Average Lease Expiry Profile
O KEY GROUP TRADING UPDATE Q3 AND 9M November, 2018
 O KEY GROUP TRADING UPDATE Q3 AND 9M 2018 13 November, 2018 Disclaimer 2 By attending the meeting where this presentation is made, or by reading the presentation slides, you agree to be bound by the following
ATRIUM Q RESULTS ANALYST AND INVESTOR CALL. 18 May 2016
 ATRIUM Q1 2016 RESULTS ANALYST AND INVESTOR CALL 18 May 2016 KEY EVENTS IN 2016 YTD OPERATIONAL PERFORMANCE Core Markets¹: NRI increased 1.2% to 36.3m; LFL NRI remained stable at 31.4m Russia continues
PRESENTATION RESULTS Q Aldar Q Results
 Q1 2018 RESULTS PRESENTATION DISCLAIMER This disclaimer governs the use of this presentation. You must not rely on the information in the presentations and alternatively we recommend you to seek advice
INVESTOR PRESENTATION. September 2011
 INVESTOR PRESENTATION September 2011 Disclaimer This document does not constitute or form part of and should not be construed as, an offer to sell or issue or the solicitation of an offer to buy or acquire
Holliday GP Corp. ( HFF ), a Texas licensed real estate broker, has been exclusively retained by the Owner to offer qualified investors the
, a Texas licensed real estate broker, has been exclusively retained by the Owner to offer qualified investors the") OFFERING SUMMARY Holliday GP Corp. ( HFF ), a Texas licensed real estate broker, has been exclusively retained by the Owner to offer qualified investors the opportunity to purchase Greenway Tower (the
OFFERING SUMMARY Holliday GP Corp. ( HFF ), a Texas licensed real estate broker, has been exclusively retained by the Owner to offer qualified investors the opportunity to purchase Greenway Tower (the
Y2015 Final Results KERRY PROPERTIES LIMITED 嘉里建設有限公司. 18 March 2016
 Y2015 Final Results KERRY PROPERTIES LIMITED 嘉里建設有限公司 18 March 2016 1 Disclaimer The information in this presentation is for personal, non-commercial reference and general information purposes only and
Y2017 Final Results. 16 March 2018
 Y2017 Final Results 16 March 2018 DISCLAIMER The information in this presentation is for personal, non-commercial reference and general information purposes only and should not be relied upon for investment
Proposed development of two warehouse retail facilities at Tampines Avenue 10 For Cold Storage and Courts
 Proposed development of two warehouse retail facilities at Tampines Avenue 10 For Cold Storage and Courts 24 January 2006 Content New initiative Code of Collective Schemes Property Funds Guidelines on
Q BUSINESS ACTIVITY AND REVENUE WEBCAST 25 APRIL 2018
 BUSINESS ACTIVITY AND REVENUE WEBCAST 25 APRIL 2018 DISCLAIMER The information contained in this document has not been independently verified. No representation, warranty or undertaking, express or implied,
Suburban Sanctuary in the City
 Suburban Sanctuary in the City HLURB TLS No. ENCRFO-12-11-056 Every single day, SM touches the lives of millions of people through its stores, malls, banks, hotels and leisure facilities. Now too, Filipinos
2011 Annual Results Presentation
 Stock code:1777 2011 Annual Results Presentation March 2012 Disclaimer This presentation has been prepared by Fantasia Holdings Group Co., Limited (the Company ) solely for use at the presentation regarding
Sekisui House, Ltd. Second Quarter of FY2017 (February 1, 2017 through July 31, 2017) Summary of Consolidated Financial Results. Management Direction
 Summary of Consolidated Financial Results. Management Direction") Sekisui House, Ltd. Second Quarter of (February 1, 2017 through July 31, 2017) Summary of Consolidated Financial 1. Overview 2. Financial Position 3. Segment Information Built to Order Supplied Housing
Sekisui House, Ltd. Second Quarter of (February 1, 2017 through July 31, 2017) Summary of Consolidated Financial 1. Overview 2. Financial Position 3. Segment Information Built to Order Supplied Housing
Lessor Example Performance Obligation Approach
 Lessor Example Performance Obligation Approach **Disclaimer The exposure draft received nearly 700 letters of comment through the comment period ended December 15, 2010. There is some expectation that
the-bridge January - March, 2015 VOL 4 ISSUE 4 Simplicity with Variety!
 the-bridge January - March, 2015 VOL 4 ISSUE 4 Simplicity with Variety! Contents 03 Standing Tall 04 Omaxe Presence Across India 05 Business Overview Q4 FY15 06 Business Overview FY15 07 Business Operation
Year-end 2008 Performance. Analysts Briefing February 10, 2009
 Year-end 2008 Performance Analysts Briefing February 10, 2009 1 FY08 Revenue Breakdown Development business accounted for half of consolidated revenues Php 33.7 billion Shopping Centers (13%) Corporate
Technical Briefing February 2016 FOR TRAINING PURPOSES ONLY TLS # ENCRFO
 Technical Briefing February 2016 FOR TRAINING PURPOSES ONLY About SMDC Every single day, SM touches the lives of people through its stores, malls, banks, hotels and leisure facilities. And now, Filipinos
Investor Presentation. First Quarter 2015
 Investor Presentation First Quarter 2015 1 CAUTIONARY STATEMENTS Today s session and our answers to questions contain statements that constitute forward-looking statements about expected future events
the-bridge OCTOBER - DECEMBER, 2013 VOL 3 ISSUE 3 Happiness Lies in the joy of achievement and thrill of creative effort
 the-bridge OCTOBER - DECEMBER, 2013 VOL 3 ISSUE 3 Happiness Lies in the joy of achievement and thrill of creative effort Contents 03 Standing Tall 04 Omaxe Presence Across India 05 Business Operation Q3
Sekisui House, Ltd. First Quarter of FY2018 (February 1, 2018 through April 30, 2018) Summary of Consolidated Financial Results
 Summary of Consolidated Financial Results") Sekisui House, Ltd. First Quarter of (February 1, 2018 through April 30, 2018) Summary of Consolidated Financial 1. Overview 2. Financial Position 3. Segment Information Built to Order Supplied Housing
Sekisui House, Ltd. First Quarter of (February 1, 2018 through April 30, 2018) Summary of Consolidated Financial 1. Overview 2. Financial Position 3. Segment Information Built to Order Supplied Housing
2013 Annual Results Presentation
 Stock code:1777 2013 Annual Results Presentation March 2014 Disclaimer This presentation has been prepared by Fantasia Holdings Group Co., Limited (the Company ) solely for use at the presentation regarding
Q4 Full Year ended 31 December 2012 Results Presentation 7 January
 Q4 Full Year ended 31 December 2012 Results Presentation 7 January 2013 http://www.alarkan.com 1 FORWARD-LOOKING STATEMENT This presentation contains forward-looking statements. Such statements are not
This document does not constitute an offer to sell or an invitation or solicitation of an offer to subscribe for or purchase any securities, and
 This document has been prepared by Atrium (the Company ). This document is not to be reproduced nor distributed, in whole or in part, by any person other than the Company. The Company takes no responsibility
AS MERKO EHITUS Annual General Meeting of Shareholders. Nordic Hotel Forum, Tallinn 9 May 2018
 AS MERKO EHITUS Annual General Meeting of Shareholders Nordic Hotel Forum, Tallinn 9 May 2018 1. Approval of the annual report of the year 2017 and overview of the economic results and outlook 2. Decision
CREATING A FUTURE WORTH LIVING. FOR PATIENTS. WORLDWIDE. EVERY DAY. Third quarter Conference call October 29, 2015
 CREATING A FUTURE WORTH LIVING. FOR PATIENTS. WORLDWIDE. EVERY DAY. Third quarter 2015 Conference call October 29, 2015 Our motivation in numbers 9m 2015 Every 0.8 seconds we provide a dialysis treatment
Investor Presentation Second Quarter 2006
 Investor Presentation Second Quarter 2006 2006 Highlights (Six months to June 30, 2006) Revenues up 10.2% from accretive acquisitions Net Operating Income up 10.9% NOI margin increases Stabilized portfolio
Q Conference Call Presentation. October 31, 2018
 Q3 2018 Conference Call Presentation October 31, 2018 FORWARD LOOKING ADVISORY In talking about our financial and operating performance and in responding to your questions we may make forward-looking statements
Frasers Commercial Trust 3 rd Annual General Meeting. 17 January 2012
 Frasers Commercial Trust 3 rd Annual General Meeting 17 January 2012 Important notice Certain statements in this Presentation constitute forward-looking statements, including forward-looking financial
Achieved record annual revenues of $110.0 million for 2018, representing an increase of 5.8%
 Clipper Realty Inc. Announces Fourth Quarter and Full-Year 2018 Results Reports Record Annual Revenues, Record Annual Income from Operations and Record Quarterly and Annual Adjusted Funds from Operations
Clipper Realty Inc. Announces Third Quarter 2018 Results Reports Record Revenues, Income From Operations and Adjusted Funds From Operations
 Clipper Realty Inc. Announces Third Quarter 2018 Results Reports Record Revenues, Income From Operations and Adjusted Funds From Operations NEW YORK, November 1, 2018 /Business Wire/ -- Clipper Realty
2010 Interim Results Presentation Interim Results 1 September 2010
 2010 Interim Results Presentation 2010 Interim Results 1 September 2010 1 Disclaimer This presentation contains forward-looking statements that involve risks and uncertainties. These statements are generally
Fiskars Group Q Helsinki, July 29, 2015
 Fiskars Group Q2 2015 1.1. 30.6.2015 Helsinki, July 29, 2015 : Steady sales performance, major step taken in growth strategy execution Q2 Net Sales MEUR 253.4, +26% Comparable net sales (CN and excluding
Financial Results for the 2nd Quarter of FY November 8, 2017 NTT Urban Development Corporation
 Financial Results for the 2nd Quarter of FY 2017 November 8, 2017 NTT Urban Development Corporation Financial Results for the 2nd Quarter of FY 2017 Operating revenue and operating income were 72.7 billion
3Q FY18 Financial Results 10 July 2018
 3Q FY18 Financial Results 10 July 2018 Disclaimer This presentation is for information only and does not constitute an invitation or offer to a c q u i r e, p u r c h a s e or s u b s c r i b e f o r u
STA. LUCIA LAND, INC. (SLI)
") Company stats: Price (P) 0.73 52 week high (P) 1.02 52 week low (P) 0.64 Shares out. (m) 8,546.5 Market cap (P m) 6,238.9 ytd change (%) -8.8 EPS (P) 0.1 PER (x) 7.1 BV/share 1.6 P/BV 0.5 Sta. Lucia Land,
Company stats: Price (P) 0.73 52 week high (P) 1.02 52 week low (P) 0.64 Shares out. (m) 8,546.5 Market cap (P m) 6,238.9 ytd change (%) -8.8 EPS (P) 0.1 PER (x) 7.1 BV/share 1.6 P/BV 0.5 Sta. Lucia Land,
26 February 2013 FIRST HALF RESULTS PRESENTATION
 26 February 2013 FIRST HALF RESULTS PRESENTATION Investment highlights Proven track record of consistent earnings growth and meeting targets Strategically located and diverse residential portfolio Urban
2018 HALF-YEAR RESULTS
 2018 HALF-YEAR RESULTS WEBCAST 25 JULY 2018 Disclaimer The information contained in this document has not been independently verified. No representation, warranty or undertaking, express or implied, is
2016 FULL-YEAR RESULTS WEBCAST 21 FEBRUARY 2017
 FULL-YEAR RESULTS WEBCAST 21 FEBRUARY 2017 DISCLAIMER The information contained in this document has not been independently verified. No representation, warranty or undertaking, express or implied, is
News Release. PS Business Parks, Inc. 701 Western Avenue P.O. Box Glendale, CA
 News Release PS Business Parks, Inc. 701 Western Avenue P.O. Box 25050 Glendale, CA 91221-5050 www.psbusinessparks.com For Release: Immediately Date: May 3, 2001 Contact: Mr. Jack Corrigan (818) 244-8080,
Project Briefing October 2011
 Project Briefing October 2011 Target Market End-users and Investors Professionals working or doing business in the business districts, particularly in Makati, Ortigas, Bonifacio Global City and Rockwell
Investors and Analyst
 KITE HEADQUARTERS Indianapolis, IN PRESENTED TO: Investors and Analyst 11.2011 DISCLAIMER This presentation contains certain statements that are not historical fact and may constitute forwardlooking statements
>> 2016 Off to A Good Start for Tri-Cities
 Research & Forecast Report TRI-CITIES OFFICE Q1 216 Accelerating success. >> 216 Off to A Good Start for Tri-Cities Key Takeaways > The Tri-Cities office market saw vacancy decline for the seventh consecutive
First Sponsor Group Limited Investor Presentation 27 April Dreeftoren, Amsterdam Southeast (artist impression)
") First Sponsor Group Limited Investor Presentation 27 April 2017 Dreeftoren, Amsterdam Southeast (artist impression) Contents Page Section 1 Key Message 2 Section 2 Financial Highlights 6 Section 3 Key
First Sponsor Group Limited Investor Presentation 27 April 2017 Dreeftoren, Amsterdam Southeast (artist impression) Contents Page Section 1 Key Message 2 Section 2 Financial Highlights 6 Section 3 Key
Institutional Presentation 3Q FY2017
 Institutional Presentation 3Q FY2017 IRSA Commercial Properties (IRCP) at a Glance The leading commercial real estate player in Argentina Largest owner and operator of premium malls and office buildings
HISTORICAL VACANCY VS RENTS $1.75 2Q10 2Q11 2Q12 2Q13 2Q14
 www.colliers.com/greaterlosangeles RETAIL GREATER LOS ANGELES BASIN MARKET REPORT Vacancy Decreases and Net Absorption Increases From Previous Quarter MARKET INDICATORS - VACANCY 6. NET ABSORPTION 732,000
Welcome to Opportunity Day Financial Performance Result for the 6 months period ended Jun 30, 2018
 Welcome to Opportunity Day Financial Performance Result for the 6 months period ended Jun 30, 2018 Creating Perfect Cities where Possibilities Happen Disclaimer This document was prepared by Amata Corporation
INVESTOR PRESENTATION MAY 2013
 INVESTOR PRESENTATION MAY 2013 Forward-Looking Statements This presentation includes forward-looking statements. These statements are subject to a number of risks, uncertainties and other factors that
Hopewell HK Properties (288 HK)
") Hopewell HK Properties (288 HK) Hong Kong / Properties / IPO brief A long-established property developer in Hong Kong Spin off from Hopewell Holdings with a property portfolio of ~3.5mn sq ft GRA in HK
Hopewell HK Properties (288 HK) Hong Kong / Properties / IPO brief A long-established property developer in Hong Kong Spin off from Hopewell Holdings with a property portfolio of ~3.5mn sq ft GRA in HK
PROJECT OVERVIEW West Service Rd., Bgy. Sun Valley, Bicutan, Parañaque 3.1 Hectares (31, sqm.)
") SALES KIT PROJECT OVERVIEW Location : West Service Rd., Bgy. Sun Valley, Bicutan, Parañaque Land Area : 3.1 Hectares (31,313.75 sqm.) Type of Development : Medium-rise Residential development : 11 medium
SALES KIT PROJECT OVERVIEW Location : West Service Rd., Bgy. Sun Valley, Bicutan, Parañaque Land Area : 3.1 Hectares (31,313.75 sqm.) Type of Development : Medium-rise Residential development : 11 medium
Q RESULTS 15 MAY 2018 TLG IMMOBILIEN AG Q RESULTS
 TLG IMMOBILIEN AG Q 208 RESULTS DISCLAIMER This presentation includes statements, estimates, opinions and projections with respect to anticipated future performance of TLG IMMOBILIEN ("Forward-Looking
PT Matahari Department Store Tbk.
 PT Matahari Department Store Tbk. Q2 2015/ 1H 2015 Results Update Earnings call: July 30, 2015 Indonesia s Most Preferred Department Store 1 Key Highlights Q2 2015 and 1H 2015 Financial Update Summary
COVER SHEET C E N T U R Y P R O P E R T I E S G R O U P I N C. (FORMERLY EAST ASIA POWER RESOURCES CORPORATION) (Company s Full Name)
 (Company s Full Name)") COVER SHEET 6 0 5 6 6 S.E.C. Registration Number C E N T U R Y P R O P E R T I E S G R O U P I N C. (FORMERLY EAST ASIA POWER RESOURCES CORPORATION) (Company s Full Name) 21 st FLOOR, PACIFIC STAR BUILDING,
COVER SHEET 6 0 5 6 6 S.E.C. Registration Number C E N T U R Y P R O P E R T I E S G R O U P I N C. (FORMERLY EAST ASIA POWER RESOURCES CORPORATION) (Company s Full Name) 21 st FLOOR, PACIFIC STAR BUILDING,
PRIMARIS RETAIL REIT Announces Third Quarter Results
 PRIMARIS RETAIL REIT Announces Third Quarter Results Toronto (Ontario) November 8, 2011 Primaris Retail REIT (TSX:PMZ.UN) is pleased to report positive operating results for the third quarter of 2011.
FINANCIAL OVERVIEW RACHEL GLASER. Analyst & Investor Day 2014 May 22, 2014 CHIEF FINANCIAL OFFICER
 FINANCIAL OVERVIEW RACHEL GLASER CHIEF FINANCIAL OFFICER Analyst & Investor Day 2014 May 22, 2014 Statements made in this presentation or orally accompanying its delivery (whether in narrative, bullet,
Results Presentation. Unaudited interim results for the six months ended 31 August
 Results Presentation Unaudited interim results for the six months ended 31 August 2018 www.calgrom3.com Agenda Difficulties experienced Operational overview Financial review IFRS 15 implications Looking
MTR Corporation Interim Results. 7 August 2007
 MTR Corporation 2007 Interim Results 7 August 2007 2007/8/7 Page 1 Results highlights and business overview Mr. CK Chow, CEO 2007/8/7 Page 2 First half 2007 achievements Merger Key legislative process
Agenda. A Snapshot of 2014 Key Achievements Sustainable Growth Land Bank
 Agenda A Snapshot of 2014 Key Achievements Sustainable Growth Land Bank Business Review Property Development Property Investment & Management Hospitality Investment & Management Diversified and Robust
SUNTEC REIT FINANCIAL RESULTS. For the 1 st Quarter ended 31 March 2017
 SUNTEC REIT FINANCIAL RESULTS For the 1 st Quarter ended 31 March 2017 26 April 2017 Agenda 03 Q1 17 Highlights 05 Financial Highlights 15 Office Portfolio Performance 22 Retail Portfolio Performance 29
Second Quarter 2008 Results
 Second Quarter 2008 Results Earnings Release and Supplemental Financial Information Investor Relations Contact: Julia Freitas ri@gafisa.com.br 1 Overview of 2Q08 Results - Wilson Amaral, CEO Financial
Q Investor Presentation
 Q1 2018 Investor Presentation 0 FORWARD-LOOKING STATEMENTS This presentation contains forward-looking information and other forward-looking statements. Words such as continue, expected, forecast, grow,
CPN Retail Growth Leasehold REIT
 CPN Retail Growth Leasehold REIT Investor Presentation Opportunity Day 28 February 2018 Importance Notice The information contained in this presentation is for information purposes only and does not constitute
LIGHTSTONE VALUE PLUS REIT V Investor Presentation. June 21, 2018
 LIGHTSTONE VALUE PLUS REIT V Investor Presentation June 21, 2018 1 2 Dial-in Information To listen to today s call: +1 (914) 614-3221 Participant PIN Code: 476-364-176 3 Forward-Looking Statements This
FY18 Financial Results 11 October 2018
 FY18 Financial Results 11 October 2018 Disclaimer This presentation is for information only and does not constitute an invitation or offer to a c q u i r e, p u r c h a s e or s u b s c r i b e f o r u
SUNTEC REIT FINANCIAL RESULTS. For the 2 nd Quarter and Half Year ended 30 June 2017
 SUNTEC REIT FINANCIAL RESULTS For the 2 nd Quarter and Half Year ended 30 June 2017 26 July 2017 Agenda 03 2Q 17 Highlights 05 Financial Highlights 18 Office Portfolio Performance 25 Retail Portfolio Performance
Los Angeles Basin Retail Market Witnessed A Slight Increase In Vacancy Rates
 RETAIL GREATER LOS ANGELES BASIN MARKET REPORT Witnessed A Slight Increase In Vacancy Rates MARKET INDICATORS - VACANCY 6.2% NET ABSORPTION -551,200 CONSTRUCTION 1,946,000 RENTAL RATE $1.96 P NNN UNEMPLOYMENT
Los Angeles Basin Retail Market Continues To Witness Decreasing Vacancy Rates
 RETAIL GREATER LOS ANGELES BASIN MARKET REPORT Continues To Witness Decreasing Vacancy Rates MARKET INDICATORS - VACANCY 6. NET ABSORPTION 588,800 CONSTRUCTION 3,312,470 RENTAL RATE $2.04 P NNN UNEMPLOYMENT
2015 ANNUAL RESULTS WEBCAST 16 FEBRUARY 2016
 ANNUAL RESULTS WEBCAST 16 FEBRUARY 2016 DISCLAIMER The information contained in this document has not been independently verified. No representation, warranty or undertaking, express or implied, is made
MANAGING HIGH VALUE ADDED PROCESSES GLOBALLY. MID TERM FINANCIAL REPORT SEPTEMBER 30 th 2017
 1 MANAGING HIGH VALUE ADDED PROCESSES GLOBALLY MID TERM FINANCIAL REPORT SEPTEMBER 30 th 2017 DISCLAIMER 2 This document has been prepared by CIE Automotive, S.A. ("CIE Automotive"), and is for information
A-REIT ACQUIRES ASCENDAS Z-LINK FOR ATTRIBUTED VALUE OF RMB300 MILLION
 (Constituted in the Republic of Singapore pursuant to trust deed dated 9 October 2002 (as amended)) A-REIT ACQUIRES ASCENDAS Z-LINK FOR ATTRIBUTED VALUE OF RMB300 MILLION 1. INTRODUCTION 1.1 The Acquisition
Corporate Update 1H FY2014 Financial Results. 28 August 2014
 Corporate Update 1H FY2014 Financial Results 28 August 2014 1H 2014 Key Highlights Achieved 2Q FY14 PATMI of RM89.5m, +132.5% y-o-y Achieved 1H FY14 PATMI of RM97.3m, +18.5% y-o-y Total property sales
MANAGING HIGH VALUE ADDED PROCESSES GLOBALLY. MID TERM FINANCIAL REPORT JUNE 30 th 2017
 1 MANAGING HIGH VALUE ADDED PROCESSES GLOBALLY MID TERM FINANCIAL REPORT JUNE 30 th 2017 DISCLAIMER 2 This document has been prepared by CIE Automotive, S.A. ("CIE Automotive"), and is for information
CONSOLIDATED STATEMENT OF INCOME
 CONSOLIDATED STATEMENT OF INCOME 1 st quarter (a) 2017 4 th quarter Sales 41,183 42,275 32,841 Excise taxes (5,090) (5,408) (5,319) Revenues from sales 36,093 36,867 27,522 Purchases, net of inventory
Ying Li International Real Estate Limited 1Q2015 Financial Results 15 May 2015
 New Beijing Centre. Tongzhou Beijing Artist s Impression Ying Li International Real Estate Limited 1Q2015 Financial Results 15 May 2015 Ying Li International Financial Centre, Chonqging Disclaimer This
CHASE BANK & RETRO FITNESS 435 Broadway Bayonne, NJ Offering Memorandum
 435 Broadway Bayonne, NJ 07002 Offering Memorandum N O N - E N D O R S E M E N T A N D D I S C L A I M E R N O T I C E Confidentiality and Disclaimer The information contained in the following Marketing
International Complex Projects Limited
 Rating Report RATING REPORT REPORT DATE: January 03, 2017 RATING ANALYSTS: Talha Iqbal talha.iqbal@jcrvis.com.pk Osman Rahi Osman.rahi@jcrvis.com.pk RATING DETAILS Initial Rating Rating Category Longterm