@Value Narrative Appraisal Software User's Guide and Help Manual Version 2.0
|
|
|
- Phoebe Atkins
- 6 years ago
- Views:
Transcription

1 @Value Narrative Appraisal Software User's Guide and Help Manual Version 2.0 Software, LLC
2 Table of Contents Part Overview 1 Installation Registration Macros Narrative Tools... 7 Report Wizard..Step ,... Overview Report Wizard..Step ,... Scope Report Wizard...Step ,... Departures Report Wizard...Step ,... Introduction Report Wizard...Step ,... The Cost......Approach Report Wizard...Step ,... The Sales Approach Report Wizard...Step ,... The Income Approach Report Wizard...Step ,... Reconciliation &... Addenda Data Manager...Overview Data Manager: Report Mode Data Manager: Design Mode Clipboard: Narrative Report Templates Analysis Tools... From Word Importing Appraisal Data AutoText Autotext......Utilities Pictures & Picture Tables Quick Tools Bookmarks Analysis Tools... & Database 38 Sales Analysis... Grid Grid Adjustments Editing Drop-Down Lists Creating Sales Analysis Grid Templates Comp Sheets Writing New.....Comparables Grids Without Comp Sheets Clipboard: Sales Analysis Sales Analysis... And......Database Overview Database The Comp..... Manager Sharing Comp Data Income Analysis Capitalization Rate......Tools Expense Reimbursements Clipboard: Income Capitalization Cost Analysis Clipboard: Cost Analysis Other Analysis... Tools Index 69
3 1 Overview Version 2.0, 11/9/03 This software package includes: Narrative Report templates for self-contained, summary and restricted reports, with analysis content for limited and/or complete appraisals A Report Wizard to generate any type of report, complete with 2003 USPAP Departure citations, if applicable Digital Imaging Tools Sales Comparison Analysis with Database Cost Analysis Income Analysis This help system is organized as follows: Narrative Tools Analysis Tools Sales Comparison Analysis and Database Income Analysis Cost Analysis Note: Macros must be enabled to function. Software, LLC Curry Place on Squam Lake PO Box 308 Holderness, NH info@atvalue.com software has been developed by Tom Armstrong, MAI.

4 1.1 3 Installation Installation Instructions and Notes Load CD in the CD drive of your computer or download the file avnar.exe (short Narrative) from Save this file to your desktop or other easily accessible location. Find and double-click avnar.exe. Follow the on-screen instructions. Single User Installation Notes will install to the user-designated drive of your computer and create a folder named atvalue. We recommend you install to the c: drive. 2. Files created are normal MS Office files and may be stored in any local or network folder. files will operate in demo mode when opened on a computer that does not installed, and the help menus will not Directory Structure Notes 1. The main atvalue folder contains the "avnarrative.dot" file. This is the primary file for the narrative module. The atvalue folder also contains the "avatbackup.dot" file. This file is used for autotext exports and back-ups. Another important file in this directory is the "Comps Index.xls" file, the user-interface for sorting and selecting comparables from the database. 2. The Comps folder contains the individual comparable sale records. 3. The Reports folder contains narrative report templates. 4. The Tools folder contains sub-folders, each of which contains templates for the Cost, Income and Sales modules. Network Installation for a free Network Installation Kit (registered users only please) and install to the server. Note that any computer on a network can function as a is designed to run on primarily on individual computers with network services for two key components: the database autotext (@Value autotext is a database of narrative report components). The network installation simply provides a central storage and retrieval facility for these data components so they may be shared among users connected to the server on individual computers. We recommend installing to the c: drive. Install the network components on the server. On each individual computer, map network connections to the database and autotext import/export functions.
5 1.2 4 Registration Registration can be accomplished from the Narrative, the Sales Comparison Analysis or the Income Analysis. Registration from any one of these modules will unlock all the modules. Narrative Open Narrative, click on Help menu and select Registration. Enter your registration name and number combination. Sales Comparison Analysis Open the Sales Comparison Analysis and click the Registration button from the main menu (top right of Sales Comparison Analysis). Enter your registration name and number combination. Income Analysis Open the Income Analysis and click the Registration button (top right of Income Analysis). Enter your registration name and number combination. is sold on an individual license basis. Each customer may install the software on as many computers as they need. For example, if you have a computer at your office, one at home and a notebook, you can on all of these machines, or more. This should be misinterpreted as permission to install the software on computers for use by other appraisers who have not purchased a license. Pricing For Each License Software Narrative Report Software Sales Comparison Analysis Comparable Sales Database Income Analysis With Cap Rate Tools Cost Analysis, Expandable to 5 Sections Discounted Cash Flow Analysis Standard ü ü ü ü ü ü Unit Sales Subdivision Analysis Toll Free Support Price Professional ü ü ü ü ü ü 60 days $595 1 Year $795 Multiplier License Discounts: 2 Licenses: Save 10% 3-5 Licenses: Save 15% 6-9 Licenses: Save 20% 10+ Licenses: Call Support Toll free phone and support (9-5 eastern time) is free for the first 60 days. After 60 days, toll free support (9-5 eastern time) is available for $199 annually. Support service include all software upgrades. Use American Express, Visa, MasterCard or check. There are three ways to 1. On-line via a secure processes credit card transactions through Authorize.Net,
6 5 one of the largest and most secure transaction providers on the web. Click here to order on-line. 2. By Phone: If Your organization requires a purchase order, call
7 1.3 6 Macros IMPORTANT >> Close all Word Files before starting Narrative. This is only necessary while the software is in Demo Mode. IMPORTANT >> Macros must be enabled to function. See notes below. files installed on your computer have been scanned with Norton AntiVirus software and are safe to use. See note concerning AVG AntiVirus software below. Office 97 Users This version requires MS Word and Excel 2000 or XP. If you need to upgrade your version of Office in order to run Narrative, we will reduce the price of the Narrative by $100. Call for more information. About Macros Office 2000 and XP: Office 2000 and XP are often shipped with Security set to High. This automatically disables macros won't run under this setting. If you run AntiVirus software, such as McAfee or Norton, you can safely set the security to Low. This option allows for the best operation Without AntiVirus software, you need to change your Security setting to Medium. You will need to enable macros each time you Security settings must be set for both Word and Excel. How Do I Change Security Settings? Start Excel/Word then click Tools -> Macro -> Security and select Low or Medium. If you run an antivirus program, you may safely select Low. You do not need to save the file after making these changes. XP Users You must change an additional setting in Excel: click the "Trusted Sources" tab and check the Trust Access To Visual Basic Project checkbox. Questions? at AVG AntiVirus Software In some cases, this free virus software will erroneously indicate that@value contains a may not function if you have this software installed. In most cases it must be uninstalled. We recommend Norton or McAfee antivirus software. If you purchase one of these programs to replace AVG AntiVirus will reimburse you, just call and we'll take care of it.
8 1.4 7 Narrative Tools To start Narrative either click on a Desktop shortcut or click Start, Programs, then scroll to program group and select Narrative. This will automatically start Word and Narrative Software. You have three choices when starting a new file: 1. Use the Report Wizard to build a new report. Use this option to build reports on the fly, selecting scope specific options for the analysis at hand including valuation approaches and USPAP Departure reporting. 2. Select a report template. Use this option property specific templates or user-built templates that have been saved 3. Start with a blank document. Build documents from scratch quickly Autotext or select from report templates. Also, use this option when importing your previous narrative work to system. One hour invested in adding local market, neighborhood, zoning, qualifications, certifications, limiting conditions, assumptions and other commonly referenced data to system will get you off to a quick start.

. Note when the Limited Appraisal option is selected, a new \"Departures\" tab appears. Each subsequent tab contains narrative report sections.")
9 Report Wizard Step 1, Overview Use Report Wizard to dynamically and quickly build narrative reports, incorporating previous narrative work, such as area analyses, zoning, etc. The Wizard will set-up USPAP scoped reports, including USPAP Departure documentation, when applicable. After the initial report build, use Data Manager to add and manage appraisal specific items, such as subject address, appraisal date, site and building size, value conclusions, etc. Start by scoping the appraisal and report (Scope tab). Note when the Limited Appraisal option is selected, a new "Departures" tab appears. Each subsequent tab contains narrative report sections. Each component is identified in the left-hand column and may be included or excluded from the report build. The right-hand column consists of drop-down lists with narrative sections for the report component. For example, the Zoning component on the left-hand column will typically have several zoning districts listed on the drop-down in the righthand column. New narrative sections are easily be added via Autotext tool, and existing sections can be edited as necessary. While there is ample content to start building reports immediately, the system is designed to incorporate your existing and on-going narrative work.
10 Report Wizard Step 2, Scope Begin scoping the appraisal and report format with Step 2. Select from the following: Report Type Self-Contained Summary Restricted Appraisal Type Complete Limited Note: When a Limited Appraisal is selected, a new "Departures" tab appears. About The Departure Rule This software is not a substitute for appraiser competency. It is the appraiser's sole responsibility to determine if a Limited Appraisal is appropriate based on: - Analysis of the appraisal problem - Analysis of the client and intended users needs - The results will not be misleading - Communication with and confirmation by the client that a Limited Appraisal is appropriate Care must be taken to determine if a specific USPAP requirement is applicable and necessary to perform a credible appraisal. If a specific USPAP requirement is applicable and necessary, Departure is not permitted. See USPAP Departure Rule, USPAP Statement on Appraisal Standards No. 7 (SMT-7), Permitted Departure from Specific Requirements for Real Property Appraisal and USPAP Advisory Opinion No. 15 (AO-15), Using Departure Rule in Developing a Limited Appraisal. Departure can be applied to a wide variety of appraisal components, allowing the appraiser to focus on what is most important to the analysis. The appraiser cannot invoke Departure however, when the results are not credible or the results misleading. The appraiser must determine when an appraisal component is both applicable and necessary. If so, Departure cannot be applied to the appraisal component. For example, appraising a 100 year old Victorian that has been converted to an apartment building would require a Sales Comparison and/or Income Approach to produce credible results. With adequate data the analysis could be limited to a single approach using the Departure Provision. Properly understood, Departure is a highly effective tool for the appraiser to be more competitive and efficient. Per USPAP, "Appraisers need to be familiar with the DEPARTURE RULE because it is a powerful tool that allows the extent of appraisal analysis or development (conducted under STANDARD 1, 6, 7 or 9) to be varied as appropriate for the appraisal assignment. Appropriate use of the DEPARTURE RULE provides appraisers with an effective means to compete in an increasingly competitive market." The key to Departure is understanding the client's needs and delivering a credible analysis and report that meets those needs.

11 Report Wizard Step 3, Departures The Departure tab will appear when the Limited Appraisal option has been selected under Step 2. Alternatively, the Departure Wizard can be started independently from Narrative Toolbar. Based on USPAP for has defined 11 categories for Departure provisions: Cycle through each of the Departure categories and select applicable will automatically populate the Scope and Methodology sections of report with applicable narrative and USPAP citations.

12 11 Note: Only select applicable departures, including the elimination of approaches. If an approach is not applicable or necessary and normally would not be developed, do not exclude it with the Departure Wizard, rather simply exclude it later in the report building process under steps 5, 6 or 7. Otherwise, it's exclusion will erroneously be listed as a departure.

13 Report Wizard Step 4, Introduction Start adding components to the report at Introduction tab. This tab includes all narrative sections up the valuation section. Simply select the narrative component to include in the current document. Select summary or detailed narrative components to match the scope and type of report being generated. For help on importing narrative components to system Autotext. This section incorporates the following sections, all are optional and customizable: Cover Page Area/Market Analysis Letter of Transmittal Subject Description & Analysis Table of Contents Assessment & Taxes Introduction, Summary of Salient Facts, Zoning/Land Use Regulations Appraisal Specifics Highest and Best Use Scope Methodology Limiting Conditions

14 Report Wizard Step 5, The Cost Approach Select the desired report components to match the report scope and format. For help on importing narrative components to system Autotext. The Cost Approach has five sections: Introduction Land Valuation Cost Analysis Depreciation Analysis Summary
 Analysis/Reconciliation.")
15 Report Wizard Step 6, The Sales Approach Select the desired report components to match the report format. For help on importing narrative components to system Autotext. The Sales Analysis has three sections: Introduction Market Data (This includes comps, maps and analysis grid.) Analysis/Reconciliation. (This includes the narrative discussion of the adjustments made on the analysis grid and reconciliation of the analysis.)

16 Report Wizard Step 7, The Income Approach Select the desired report components to match the report format. Given the inherent complexities of the Income Approach, there are many components to choose from all of which can be customized by the analyst. For help on importing narrative components to system Autotext. The Income Analysis has nine sections: Introduction Income History/Actual Rental/Income Comparables Income Analysis/Projection Vacancy & Collection Loss Expense History/Actual Expense Analysis/Projection Capitalization Rate/Discount Rate Development Income Approach Conclusion
.")
17 Report Wizard Step 8, Reconciliation & Addenda This section adds the final components to the appraisal, including: Reconciliation Certification Qualifications (qualifications for two appraisers can be included here and more from the appraisal via autotext if necessary). Limiting Conditions and Assumptions (note this can also be placed at the front of the document, depending on your preference.) Addenda Page Invoice Headers and provides quick options for headers and/or footers. These can be further edited from the body of the document, if desired. To do so click on View, then scroll to Header and Footer.
18 Data Manager Overview The Data Manager is a central location to manage data that is dispersed throughout the report. Report specific data, from the appraiser's name to the value conclusion are entered on this dialog. Many fields have editable drop-down lists with common responses to speed the report writing process. The Data Manager makes documents dynamic, allowing for global changes of over 50 appraisal variables. With the help of Clipboard, these data can also be transferred directly to the cost, income and sales spreadsheets. Enter or edit information in the Data Manager at anytime; the software will automatically update the entire report. Note that in certain cases a bookmark table will be inserted into the document when the Data Manager is activated. Two Modes of Operation 1. Report Mode 2. Design Mode Report Mode is the default mode that is used when writing reports. This mode is an interface for entering and editing appraisal data. Design Mode is used when creating or editing a report or report template or autotext component. This mode enables the placement of fields in the document that reference the information entered in the Data Manager while in Report Mode.

19 Data Manager: Report Mode Report Mode is the primary mode of operation for the Data Manager. Enter and edit report data that is dispersed throughout the document and associated valuation spreadsheets. Many items have lists that can be added to for future reference.

20 19 Enter Summary Data The Data Manager is designed to manage and distribute summary data. For example, the highest and best use entries are intended for highest and best use conclusions, not the full analyses, which can be further detailed narratively in the body of the document. The conclusions are then referenced via the Data Manager in the Highest and Best Use section, the Summary of Salient Facts section and other sections the user may have defined. Another example are property description items, which can be transferred to the valuation spreadsheets as adjustment description items, as well as to other locations in the narrative like the Summary of Salient Facts. If, for example, the site topography is sloping, simply enter "Sloping". If warranted, add further detail around this reference in the narrative Site Description section. Property description items can be dispersed throughout the report to populate narrative sections with subject data. For example, a paragraph summarizing the property might be set up as follows, where
21 20 [Ref] is populated with data entered in the Data Manager: The subject property is [Ref], with [Ref] acres of land and [Ref] SF of gross building area. The property is in [Ref] condition and has a highest and best use as [Ref]. The current assessment is [Ref] and the annual tax bill is [Ref]. Enter Numbers as Numbers Items such as gross building area (GBA), net leasable area (NLA), site size, number of units, etc., can be transferred to the valuation spreadsheets and used for calculations. Therefore these numbers should be entered as numbers without additional text (SF, sq. ft., etc.) or special symbols (±, ~, etc.) so they will be interpreted as values, not text, on the spreadsheets. Formatting can be used, such as commas, decimals and any typical date convention ( , 10/15/03, 10/15/2003, October 15, 2003, etc.). This does not apply to the File Number field, which is a text field Data Manager: Design Mode Use Design Mode when setting up templates and autotext report sections. It is activated when the Design Mode button at lower-left is selected. The Data Manager is a tool to insert references for various fields throughout the document. Most of the time, the fields in the Data Manager will have no information when the initial references are created. Using the Data Manager is an interactive process that involves frequent switching between the Word document and the Data Manager. After the Data Manager is running, simply click the Word document to activate it. Note that the Data Manager can be moved to the side of the screen by clicking and dragging the title bar Place the cursor in the Word document where you want a reference field to appear. Switch back to the Data Manager and click the Radio button for the information you want to reference. Select a Reference from the list and Click "Insert Reference at Cursor" Repeat this process for each item, keeping the Data Manager "on top" while you work.

22 21 Notes The Data Manager will automatically insert a "Bookmark Container Table" at the end of the document if it doesn't already exists, which is usally the case when working with document sections. IMPORTANT >> Before saving the document section to the system Autotext, be sure the "Bookmark Container Table" is not included in the will automatically include a table when the report is generated. The individual components should not be saved with a Bookmark Container Table.

23 22 Clipboard: Narrative Clipboard has various appearances, depending on where it is used. This discussion details the Clipboard functions available from the narrative. Data Flow The Data Manager is the first stage of data entry. From here, data flows to the spreadsheets via Clipboard. After spreadsheets are completed, they flow back to the narrative, as graphic images, via Clipboard. Therefore the data available to the narrative clipboard consists of spreadsheet images that has been copied to the clipboard from those modules. The Narrative Clipboard is organized by four tabs with two additional tabs under Cost. Clipboard uses a color scheme to easily identify the information to be acted upon. Blue identifies content in the active document while beige/light yellow identifies content already pasted to the clipboard. To paste the spreadsheet image (worksheet or chart), the item must be checked. Note there is a "Select All" toggle button. About Pasting Spreadsheets and will look for certain bookmarks before pasting spreadsheets, charts or comparables to the narrative. If they do not exist, the spreadsheets and/or comparables will be pasted to the narrative at the current cursor location (adding bookmarks as part of the process). The table below details the bookmarks that correspond with the various spreadsheets, charts and comparables.
24 23 Spreadsheet/Comparable Sales Analysis Grid Bookmark AnalysisGrid Comparable Sales 1-6 Comp1, Comp2, Comp3, Comp4, Comp5, Comp6 Land Sales Analysis Grid AnalysisGrid_Land Comparable Land Sales 1-6 Income Analysis Expense Reimbursements Comp1_Land, Comp2_Land, Comp3_Land, Comp4_Land, Comp5_Land, Comp6_Land CostAnalysis, CostAnalysis2, CostAnalysis3, CostAnalysis4, CostAnalysis5 ValuationWorksheet ExpenseReimbursements Income Profile (Chart) IncomeProfile Expense Profile (Chart) Cash Flow Profile (Chart) ExpenseProfile CashFlowProfile Capitalization Rate Calculations (From Income Cap Analysis) Capitalization Rate Calculations (From stand-alone analysis, accessed from "Other" Category) RateTools Cost Analysis CapRateTools Clipboard is slightly different for each analysis module. Clipboard: Sales Clipboard: Income Clipboard: Cost Analysis

25 Report includes the following report templates: General Use: Complete Appraisal, Self-Contained Report General Use: Complete Appraisal, Summary Report General Use: Limited Appraisal, Summary Report Multi-Family: Limited Appraisal, Summary Report Retail/Office: Limited Appraisal, Summary Report General Use: Limited Appraisal, Restricted Report To create a new report based on a template, open the Reports dialog. Simply select a report type from the list and click the "Insert at Cursor" button. Copy a Report to System Start by clicking the "Copy New Report System" button at the top of the dialog. Before saving files to the system, please see Prepping a file for System Click the "Select A File" button. This start Word's File Find dialog. The selected file name will appear under the button. Enter a description for the file name. We recommend ample detail here; the type of report, scope of the appraisal, approaches applied, etc. Finally, save the file. Note that copy of file will be created and added to system in the..\atvalue\reports folder, the original is not modified or moved.

26 25 Prepping A File For System Remove appraisal/client specific items, such as names, dates, addresses. Remove all photographs and images. Remove all property specific narrative such as property description, highest and best use, analysis narrative, etc. Use Placeholder for items that need to be customized. Click the "Quick Tools" button on toolbar, then scroll down to and click on "Placeholder" or "Bookmarked Placeholder". A placeholder will be inserted at the cursor location. Clipboard: Narrative

27 Analysis Tools From includes the following analysis tools: Sales Comparison Analysis and Database Income Capitalization Analysis with built-in expense reimbursement and cap rate tools Cost Analysis, with sections for detailed building and site improvements, depreciation schedules, expandable to five connected sections Stand-alone capitalization rate Analysis Tools can be operated as stand-alone Excel spreadsheets or they can be embedded into Word where they become part of the Word file and can only be accessed through the Word file. Even with a new computer, working with large embedded files, such as Sales Comparison Analysis, can tax the system resources. We recommend stand-alone spreadsheets. Analysis tools can be accessed from narrative toolbar, from Program Group or from a Desktop Shortcut. When you start Analysis Tools from the narrative toolbar you will be presented with two choices: 1. Open a spreadsheet as a stand-alone file (recommended). 2. Embed a spreadsheet in the active Word document. Open a Stand-Alone Spreadsheet We recommend this because it allows for better file stability, faster file operation and fewer "enable macros" prompts. This option will open an Excel file that serves as a menu Analysis Tools. There are four categories: 1. Sales Analysis Tools 2. Income Analysis Tools 3. Cost Analysis Tools 4. Other Tools

28 27 Embed A Spreadsheet Choosing this option opens the same dialog as pictured above. The difference is that when a file is selected, it embeds the spreadsheet into the Word document, with a picture of the spreadsheet showing on the page. If the spreadsheet you are embedding contains macros (all spreadsheets do), depending on your security settings, you may get several warnings concerning macros. Of course, spreadsheet macros should be enabled. This action often requires two types of re-sizing for the embedded image The embedded spreadsheet is often over-sized, and too large for the page. The picture of the embedded spreadsheet often includes additional rows and columns. Re-size The Image 1. Select the image with a right-button single-click on the image. This display a Word shortcut menu. 2. From the shortcut menu, select Format Object, then click the Size tab. 3. From the Size tab, scroll down to the Scale section and use the spin button to roll the percentages down. Start with 50% and refine as necessary. Change Displayed Rows and Columns 1. Select the image with a right-button single-click. This display a Word shortcut menu. 2. Select Worksheet Object 4 this will bring up a side menu, select Edit (not Open). 3. This will open the worksheet within Word. Note your Word menus and toolbars are now Excel items. The edge of the embedded Excel sheet is now a hatched line with small square "handles" on the corners and sides. 4. To show or hide Excel rows and columns, click and drag a handle. When your done, click outside the Excel area to return to Word. Opening An Embedded Spreadsheet 1. Select the image with a right-button single-click. This display a Word shortcut menu. 2. Select Worksheet Object 4 which will bring up a side menu, select Open (not Edit, as used above).
29 Importing Appraisal Data It will pay dividends to go through some of your files and extract local market, neighborhood, zoning, qualifications, certifications, limiting conditions and assumptions and other commonly referenced data to system. Start with a document. Next, click Insert on Word's main menu, then scroll down to Insert File. Find and select the file you want to extract information from. For each section of the file you want to import, do the following: Select the document section Activate AutoText tool Select the category (and sub-category, if applicable) Name the selection Optional: Make the selection a report component for Report Wizard by selecting the checkbox. Save the entry See Adding A New AutoText Entry Building Custom Entries Use AutoText tool to build custom appraisal components. For example, you may have a property description or highest and best use layout you want to use. Simply purge any appraisal specific data from the selection, insert placeholders or bookmarked placeholders where appropriate, then save the selection. See Data Manager: Design Mode

30 29 AutoText This feature is central to effective use of Narrative. AutoText to quickly save and retrieve report sections, standard comments or even tables and graphics. Custom AutoText entries can be very important to your work; we recommend regular AutoText organized by common report components, ordered like a typical appraisal report, starting with "Covers" (Cover Page), ending with Addenda and miscellaneous items, such as invoices and digital signatures. The "About This Category" window (top-right) provides basic information about each autotext category and if a page break should be included when creating a new autotext entry. This applies primarily to report sections that are to be used by the Report Wizard. The Autotext Preview window provides a quick but unformatted preview of the autotext content. See Preview Autotext discussion, below. Inserting AutoText AutoText is always inserted at the cursor location. Note that AutoText dialog can remain "on-top" while you work with the Word document. The dialog can be moved to the side by clicking and dragging the title bar at the top of the dialog, allowing you to move the cursor to different locations in the document if necessary.
31 Select the appropriate category tab on the left side of the dialog and sub-category, if applicable. Select the Autotext entry. Click the "Insert at Cursor" button. Note that you can reverse the Insert by clicking the "Undo" button or Ctrl+Z. Preview Autotext The easiest way to preview an autotext entry is to simply insert it to the document. Remove it by clicking the "Undo" button or Ctrl+Z. It may be helpful to open a document, then insert various autotext entries to review the content. Add A New AutoText Entry Start be selecting text, table or other document section from Word document. Simply select, or "highlight" with your cursor. Tip: Press F8 and use arrow and page-up/page-down keys for better control selecting text Select the "Create New Entry" option button at the top of the dialog. Select a category from the tabbed list on the left side of the dialog. Some categories have additional sub-categories, so you may need to click the sub-category drop-down list to refine the location where the AutoText entry is stored. Name the entry. The name field has a 27 character maximum length, so abbreviate as necessary. If the AutoText entry is a report component, click the "Make Available To Report Wizard" checkbox. Further, add "Detailed" or "Summary" to the end of the name if the component is specifically for a self-contained or summary report, respectively. Save the AutoText.

32 31 Edit An Existing Autotext Entry This is very similar to creating a new autotext entry, described above. Start by inserting the Autotext entry to be modified and make the desired edits. Next, select and re-save the edited content, using the original name. The software will provide a warning that it is over-writing an existing entry, which is of course the intent. Tip: If your are modifying an autotext entry that was originally included with the software, use a new name, that way when you update or reinstall the software, the entries won't be replaced with the AutoText content. Delete An AutoText Entry Select the autotext entry and click the delete button. Autotext Backups and Exporting For autotext back-up/export, or autotext restore/import AutoText Utilities.

33 32 Autotext AutoText AutoText utilities are a set of tools to export or AutoText entries. Use these utilities to backup autotext, send autotext directly to another user or to send autotext entries to a server for distribution across a network. Start the Export utility by AutoText, then click the Export AutoText button (lowerright). is installed, a file called "avatbackup.dot" is created in the atvalue folder. By default, the Export utility will Autotext entries to this file. Autotext entries should be exported to this file regularly, and this file included in your regular computer back-up schedule. Export Autotext to a Server or Other Computer To Export files to a server or another computer on the network, simply click the Browse button and navigate to the remote folder where the "avatbackup.dot" has been installed, then run the Export function. AutoText Entries: This is essentially the same as the above process, and will import AutoText entries from avatbackup.dot to avnarrative.dot. About Importing and Exporting AutoText Importing autotext will overwrite existing autotext entries with the same name. Similarly, exporting autotext entries will over-write entries with the same name in the destination file. Other entries will not be affected. For example, if the autotext on your computer contains an entry named "Letter of Transmittal" and there is an entry with the same name in the destination file ("avatbackup.dot"), the entry on the destination file will be overwritten. However, if the destination file has a file named "Transmittal Letter", it will not be overwritten. Tips: When adding new entries, provide unique names. With time sensitive information, such as zoning or regional data, add the date to the name. Remember, the maximum name length is 27 characters (we don't like the limitation either...), so abbreviate as necessary.
34 33 Print All AutoText Entries Careful! This will print over 100 pages of autotext.

35 Pictures & Picture Tables Start the picture tool from toolbar by clicking the "Insert Images" button. The Picture tool will appear blank at first. To view photos, click the "Folder" button and select the folder that contains your pictures. Think of the pictures as a roll of film that can be scrolled up or down. To insert a picture (at the current cursor location), simply click on it. Different cameras produce different sized images, so experiment with the scale settings at the will remember the settings and the last pictures you looked at, so if you close the Picture tool and then return to the file at a later date, you can pick up where you left off, no need to scroll through all of the pictures again. Tip: You can keep the Picture tool viable while you work in Word. This is very helpful when writing property descriptions, etc. Tip: Keep the number of pictures in a picture folder to 50 or less. Picture Tables This helps with your photograph layout. There are two options: arrange with description text to the right of the photograph, or under the photograph. Each picture table holds two pictures with one picture table to a page.

36 Quick Tools Quick Tools is a collection of tools to expedite routine tasks. Update Table of Contents Use this option to update the table of contents. Go To and Mark Active Edit Use these functions to mark and return to the active section of the document. "Mark Active Edit" will place a bookmark at the current cursor location; "Go To Active Edit" will return to that location. Formatting: Normal Through Heading Level 4 Faster than Word's built-in menu, this function will quickly format the selected text. Heading levels 1 up to 4 will be added to the Table of Contents, depending on the number of levels selected in the Report build. See Table Of Contents Bookmarks This function has a separate help page. See Bookmarks. Symbols Again, a quicker way to find and insert common symbols used in appraisal work. Paste Without Format This will paste the contents of the Windows clipboard as plain text. This is handy if you have copied from another document with different formatting, or a web page or spreadsheet. Insert Placeholder This function will insert a placeholder field, which is simply an easy to find visual que where user input may be required. This is used when designing report components and templates. Insert Bookmarked Placeholder
37 36 This inserts a placeholder with a bookmark. Show/Hide Hidden Text This will reveal or hide text formatted as hidden text. fields have hidden text which describe features of the filed, such as the associated bookmark name (if applicable). Show/Hide Bookmarks This will reveal or hide bookmarks. Note that empty bookmarks appears as "I-beams", while bookmarks with content start and end with brackets. It is helpful to keep bookmarks visible when designing report components and templates has a powerful tool for Word bookmarks. Use this tool to: Navigate to bookmarks Create new bookmarks Delete bookmarks Insert bookmarked content Insert page number cross references to bookmarks

38 37 Clipboard: Narrative for a list of bookmarks used
39 Analysis Tools & Database As detailed in the Narrative Tools section of this help includes the following analysis tools: Sales Comparison Analysis and Database Income Capitalization Analysis with built-in expense reimbursement and cap rate tools Cost Analysis, with sections for detailed building and site improvements, depreciation schedules, expandable to five connected sections Stand-alone capitalization rate tools These analysis tools can be operated as stand-alone Excel spreadsheets, or they can be embedded into Word where they become part of the Word file and can only be accessed through the Word file. Even with a new computer, working with large embedded files, such as Sales Comparison Analysis, can tax the system. See Analysis Tools From Word. Open A Stand-Alone Spreadsheet We recommend this because it allows for better file stability, faster file operation and fewer "enable macros" prompts. This option will open an Excel file that serves as a menu Analysis Tools. We recommend stand-alone spreadsheets. Analysis Tools Click Start, Programs, then scroll to Program Group Double-click the desktop shortcut

40 Sales Analysis Grid The Main Menu The Main Menu is located at the top-right corner of the Analysis Grid. The function of each button is explained below. Grid Options: Activate this dialog to set the number of comps to analyze, to set the adjustment categories and methods and to refresh the comp data on the Analysis Grid after a new comp has been added or an existing comp edited. Manage Comps: Activate to import comps selected from the database, add a new blank comp sheet, change the order of comps, or remove comparables from the analysis. Open Database: This button will open Database where you can sort, preview and select comps to be imported the analysis grid. There are two steps to importing comps: Selecting comps from the database. When you open the database, you can build a list of up to ten comps to import when you return to the analysis grid. After you build and save your list, exit the database. From the Analysis Grid, open the Manage Comps tool and import the comps to the Analysis Grid. Edit Drop-Downs: The Analysis Grid has numerous drop-down lists that can be customized to your preferences.
41 40 Copy to Clipboard: Copy the Analysis Grid to Clipboard. Save as Template: Save a customized Analysis Grid with comp sheet template. What You Can and Can't Do The Analysis Grid and comp sheets are loaded with drop-down lists and formulas. For flexibility most of these cells can be over-written and copied to or formatted. What You Can Do: Over-write formulas, ignore drop-down lists and type different entries. What You Shouldn't Do: Cut/Copy, Drag & Drop cells with drop-downs (each is tied to a comp specific list).
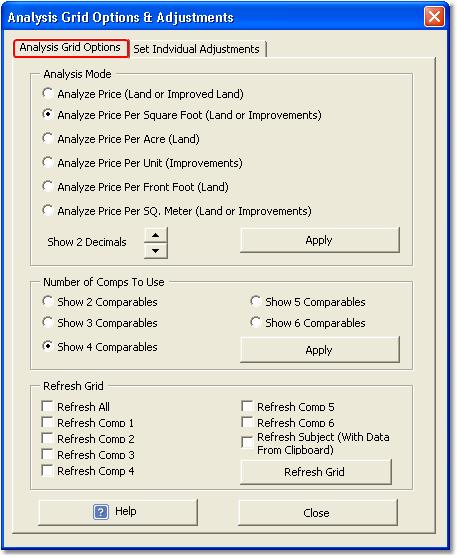
42 41 Setting Up The Analysis Grid The Analysis Grid pulls much of its data from the comp sheets (though comp sheets are optional). The following section assumes comps have been imported to the analysis. Database for that function. Analysis Grid Options This dialog has four functions: 1. Set the analysis mode (SF, Per Unit, etc.) 2. Set the number of comps 3. Refresh the Analysis Grid 4. Set the adjustment categories (2nd tab) Note: The "Apply" button must be pressed for each section. Analysis Mode There are several options, as shown on the image below, and they can be changed at any time. Number of Comps to Use Analysis Grid holds a minimum of two comps and a maximum of six, though up to ten comps may be stored with any analysis. In the rare event that only one comp is available for analysis, the information for the second comp may be left blank. Refresh Analysis Grid This will re-populate the analysis grid with comp sheet data. This is helpful when a new comp has been added or when an existing comp has been will search for adjustment categories that match any of the comp sheet description items and will populate the analysis grid with data from the comparable. For example, if an adjustment has been established for site will find the site size for each comp and place this data in the adjustment grid in the appropriate locations. A similar process is followed for subject will search each adjustment category and place the corresponding subject data in the subject column.
43 42
.")
44 43 Set Individual Adjustments (2nd tab) The left-hand side of the dialog shows the adjustment categories. Some are not shown, such as Property Rights, Financing, Conditions of Sale and Economic Trends (Time). The first item is different than the others in that it is reserved for the Location adjustment, discussed further below. Each adjustment item has a drop-down list that has been generated from the comp sheet template associated with the Analysis Grid. The drop-down list has been populated with all the description items from the comp sheet and provides the analyst with a good starting point for defining relevant adjustment categories. Adjustment descriptions/categories can be edited at any time, either with this dialog or on the adjustment grid. Automatically Populate The Analysis will automatically populate the adjustment grid with comp data for each adjustment item, if the item is selected from the drop-down lists. The right-hand side of the dialog is used to select the adjustment method. There are two basic adjustment methods, percent and dollar, with optional comparison rows and narrative description rows. Additionally, there are four options for user-defined adjustments, spanning two to six rows. All adjustments are editable and can be changed at any time.

45 44 At the bottom of the dialog is a drop-down list for previewing the various adjustment methods and formats Grid Adjustments Working With The Adjustment Grid Assuming the analysis includes comp sheets, the software will populate the analysis grid with comp data. The top section of the grid will include comp specific data regarding location, date of sale, unit price (optional), property rights and financing. The balance of the comp data will populate the adjustment grid, matching adjustment categories with comp data. For example, if an adjustment category for land size has been will populate the grid with the land size for each comparable in the appropriate location. If there are no matching adjustment categories, the comp data is always available in the drop-down lists found throughout the grid. The comp data in the drop-down lists is visible only when the cell is selected and the drop-down arrow is clicked. Comp data will automatically load to the adjustment grid when a comp is loaded to the analysis from the database. If changes are made to a comp sheet after it has been loaded to the grid, the grid must be refreshed. Similarly, if a new comp has been written, the grid must be refreshed in order to load the new comp data to the grid. To refresh, click Grid Options, then reference the Refresh Grid section at the bottom of the dialog. The first three adjustment categories, Property Rights, Financing and Conditions of Sale are fixed categories and accept only percent adjustments. Click the adjustment cell to activate the drop-down list with common percent adjustments listed. Note that you can edit these lists. Economic Trends will automatically calculate the difference between the sale and appraisal dates, and apply a percent adjustment for each month elapsed. Enter the time adjustment as shown in the image below.


46 45 Note that the time adjustment formulas for the individual comps can be over-written. Location Adjustment The Location adjustment has unique characteristics. Unlike the adjustments below this item, the Location adjustment cannot be renamed and it does not have options for creating a user-defined adjustment. There are two options: a percent adjustment or a dollar adjustment. A comparison row may also be included. If you need to set up the Location adjustment differently, you can hide the built-in Location adjustment and create a new Location adjustment in one of the rows below. General Adjustments The names of the adjustment categories, located on the left side of the Analysis Grid, can be set via the Grid Options dialog, as described above or directly on the Analysis Grid worksheet. Either select an adjustment category from the drop-down list or enter a new one. Note that the type of adjustment (% or $) must be set through the Grid Options dialog. In the column for each comparable, the drop-down lists are populated with three types of information: The top row drop-down contains data from the comp sheet, such as site size, improvements, etc Row 2 and 3 drops-downs include common comparative notes, such as inferior, similar, superior, etc The Row 4 drop-down contains common percent adjustments Row 5 holds the final dollar adjustment.

47 46 Again, drop-down lists are optional and can be over-written. The cells are unlocked for user-defined adjustments and formulas. You can show 2 to 5 rows for a single adjustment. See Set Individual Adjustments, above. Other Features The Analysis Grid has optional Average and Weighted Average calculations at the bottom of the sheet. Further, after the Time Adjustment and before the Location Adjustment, the grid can be expanded for an additional adjustment. A common use for this feature is post sale expenses, such as razing improvements, etc. To expand the grid and reveal this adjustment, click the + sign in the left margin Editing Drop-Down Lists Most of the lists in the Analysis Grid and Comp sheets are editable to some degree. Certain lists are a combination of editable data and fixed data. For example, some of the lists in the Analysis Grid contain qualitative ratings, such as "Average", "Good", "Very Good", etc., which are editable items, and data extracted from the comp sheets, which is not editable. Edit Analysis Grid Lists 1. Select Edit Lists from the top-right section of the Analysis Grid sheet 2. At the top of the dialog, select the list you want to edit from the drop-down list 3. Enter new items in the text box (top-right) and click Add To List. Likewise, you can move or remove items from the list 4. Click Save Changes Edit Comp Lists Comp lists are edited the same way, but from the comp sheet Creating Sales Analysis Grid Templates This function saves a customized Sales Analysis as a template for future use. Analysis grids and comp sheet templates are designed to be property-type specific and stay together as a set. When a custom template is created, two components are customized; the analysis grid and the comp sheet template, which are saved as a single workbook. Therefore, when a new project is started, the analysis grid and a comp sheet template are both formatted for a specific property type. Note: Before saving, do the following: Clear all adjustment text Set all adjustments to 0 Remove comparables

48 Comp comp sheets have many fields and lists that can be customized for a particular property type. Both land and improved comps use the same basic comp sheet - simply leave the improvements related fields blank for land comps and set the unit price calculations to land. Comp sheets and analysis grids are designed to be customized together and are saved as a single Excel workbook, organized around a particular property type. The controls are located on the upper-right corner of the comp sheet. Optional sections include assessment data and cash flow characteristics with calculations for capitalization rates, gross and effective income multipliers and the expense ratio. Optional sections can be hidden from view by clicking the show/hide buttons on the right-hand side of the comp sheet. Writing New Comparables New comps are written from the Analysis Grid worksheet. See Writing New Comparables. Saving Comps To The Local or Network Database saves a comparable, it creates a copy of the comp, then saves it as a individual Excel worksheet in the local or network database. At the same time, it adds a record of the comparable to the database index so it may be searched and retrieved later. Important: Comps are saved to the database by property address, so each comp must have a unique address.

49 48 Drop-Downs These are designed to save input time, and to facilitate data consistency. Each drop-down has a category and list associated with it. Many of the categories can be changed. The largest list is the Property Type list, which uses the Appraisal Institute Commercial Database property type standards. The 13 major categories are listed at the top of the drop-down list, then it is broken down to 227 sub-categories below. As always, the lists are optional and can be edited/over-written. We suggest using the AI standard in the interest of industry consistency. The remaining lists have a capacity of 16 items, though parts of some lists may be reserved, leaving fewer editable items. Edit Comp Sheet Lists 1. Select Edit Lists from the top-right section of the comp sheet. 2. At the top of the dialog, select the list you want to edit from the drop-down list. 3. Enter new items in the text box (top-right) and click Add To List. Likewise, you can move or remove items from the list. 4. Click Save Changes Locked Cells While attempting to keep as many cells unlocked and editable as possible, certain fields cannot be changed in order to for the system to keep track of key data fields. To see what cells are locked, click the Show Locked button. All other fields may be customized. Set Unit can calculate the unit price for: Square Foot of Gross Building Area (GBA) Square Foot of Net Leasable Area (NLA) Square Meter of Gross Building Area Square Meter of Net Leasable Area Square Foot of Land Area Acre of Land Area Acre of Usable Land Area Front Foot Note that the text describing the unit price on the comp sheet will change accordingly and the unit price will be calculated.

50 49 Analyzing Unique Unit Types If the property type requires analysis of a unique unit type, such a price per slip, bed, hole, etc., utilize the price per unit comparison. Insert Images The center section of the comp sheet is for digital maps, plans and/or photos. Click the Insert Images button to start Excel's Insert Picture dialog. You may need to resize and re-position the image after it has been placed on the comp sheet. Re-position by dragging the image. To re-size, select the object then drag the handles at the corners, or, right-click the image, then select Format Object from the shortcut menu. Enter/Edit Notes The Notes section of the comp sheet is an embedded Word file. Double-click the notes area to activate Word. When finished, click anywhere outside of the Word edit area Writing New Comparables Writing New Comparables New comps are written from the Sales Analysis Grid, which has a comparable template attached to the worksheet ("Standard Commercial Template"). Think of analysis grids are dual purpose: Comparable templates Analysis grid templates There are no stand alone comp templates - all comp templates are associated with an analysis grid. From the Sales Analysis Grid, click the Manage Comps button (top-right). Then click the "Insert Bank Comp Sheet" button. This will insert a new blank comp sheet in the analysis. If it is the first comp added to the grid, the sheet tab (at the bottom) will be labeled Comp 1. After you have completed this comparable, click the Save Comp button to save it to the database. You may be prompted to choose a local or network database if the network database component has been installed. Note that if you opened a new Analysis Grid to for the purpose of writing a new comp, once the comp has been saved to the database, you do not need to save the analysis grid file.

51 50 Important: Don't fill out the comp template - use the Comps Manager to insert a new blank Comp sheet. Tip: You can save time by setting the unit price and other options on the Standard Commercial template sheet before you create new blank comps. Do not include special characters in the comparable's address such as \ / ~ ; : * & % $ Dashes and commas are acceptable. Also, see Creating Sales Analysis Grid templates Grids Without Comp Sheets Comp sheets are optional. The drop-downs will still include many adjustment related items to speed data entry. Further, at the top left of the Adjustment Grid is an area that can be expanded to reveal additional items to identify the comparables. Clipboard: Sales Analysis Type Of Analysis Sales Analyses can be categorized one of two ways: As a stand-alone analysis. This can be land or improved property. As a land analysis that is part of the cost approach. This selection tells the narrative software where to place the completed spreadsheets in the report. Data Flow The Data Manager is the first stage of data entry. From here, data flows to the spreadsheets via Clipboard. After spreadsheets are completed, spreadsheet data flows back to the narrative, as graphic images, via Clipboard. The Sales Analysis Clipboard is organized by three tabs: General Analysis Grid & Comp Images Analysis Type and Clipboard Options The General Tab This tab displays data collected from the narrative Data Manager. Subject address, appraisal date, property rights, site and improvement items are collected from the Data Manager. With regard to site and improvement data, the intent of the Data Manager and Clipboard is to collect basic elements most often used in the sales comparison analysis adjustment grid. It is not intended to be a comprehensive
52 51 property description. Each item has a checkbox and can be individually selected for pasting to the Analysis Grid, or, use the "Select All" button to select all items. Only selected items will be pasted the Analysis Grid. Where Data From The General Tab Is Pasted When items are pasted to the grid, they will appear in one or two places. The subject address, property rights, analysis date will be immediately visible on the Analysis Grid. If adjustment categories have been established and there are matching categories for site and improvement items, the clipboard data will pasted next to the adjustment category in the subject column. For example if an adjustment item has been set up for "Zoning", the software will recognize this and place the subject zoning in the subject column next to this item. If there is not a matching adjustment item, the clipboard data is always available in the subject property column in the drop-down lists. These items are only visible when the cell is selected the drop-down arrow clicked. Use the Analysis Grid and Comp Images tab to copy images of these spreadsheets to Clipboard, or to view the current clipboard content for these items. The Analysis Type and Windows Clipboard tab has an option to change the type of sales analysis being copied to the clipboard. The default type of analysis is "Stand-Alone". The second option is a Sales Comparison Analysis that is a component of the Cost Approach. Use the Windows Clipboard to bypass Clipboard system and copy the active page to the Windows Clipboard. When pasting to the Word document, use Paste Special, Picture option. Click Edit, Paste Special and select the Picture option.
53 Sales Analysis And Database Overview Overview The system is Analysis Grid centric, allowing you to perform all your sales analysis tasks from one place (the sales grid), including writing new comps or searching and importing previously documented comps. Analysis grids and comp sheet templates are designed to be property-type specific and stay together as a set. The system allows the user to create custom templates, though it is very easy to customize an analysis grid and associated comp sheet template and on the fly. When a custom template is created, two components are customized; the analysis grid and the comp sheet template, which are saved as a single workbook. Therefore, when a new project is started, the analysis grid and a comp sheet template are both formatted for the property type at hand. The Analysis Grid The Analysis Grid can handle two to six comps but, you can store up to 10 comps with any Sales Analysis Grid. The grid has 15 adjustment categories, though most of these can be hidden if not used. You can set up your adjustments anyway you like, but several common adjustment methods are included and can be implemented or customized at any point. You can also change the order of comps at any time. For example, if you move Comp 2 to the Comp 4 position, all of the adjustments and narrative entries will also be moved. The comp data is automatically imported to the Analysis Grid; some of the comp data is immediately visible, most is accessed through various drop-down lists. The Analysis Grid is populated with drop-down lists that are activated when a cell is selected. Many of these lists can be customized. Further, as noted above, many drop-down lists are populated with data from the various comp sheets associated with the Analysis Grid. Information in drop-down lists are always optional, you can select an item from the list or type a different entry. Further, comp sheets are optional; data can be entered directly to the analysis grid and there are optional extra rows to identify and describe the comparables when comp sheets are not used. Other features include average and weighted average value calculations. These are optional and may be hidden from view if not used. The Database The database consists of two parts, the Database index worksheet and a folder named Comps where the individual comps are stored. Directory Structure. New comparables are written from Analysis Grids, where the comp sheet templates are stored. This takes a little getting used to. It helps to think of sales grids as dual purpose: templates for new comps and templates for sales analyses. The database index allows you to sort comps by selecting search criteria from drop-down lists. You can also preview/edit the comparables from saves each comparable as a single Excel file in the comps folder (..\atvalue\comps). Comps selected from the database are copied into the current analysis as additional then collects the comp data and populates the analysis grid and the drop-down lists with comp specific data. Note: The Analysis Grid and Comp sheets are loaded with drop-down lists and formulas. For flexibility most of these cells can be over-written, copied to and formatted. What You Can Do: Over-write formulas, ignore drop-down lists and type different entries. What You Shouldn't Do: Cut/Copy, Drag & Drop.
, or from the @Value Program Group (Click Start, Programs, then scroll to the @Value Program Group).")
54 Database Adding Comparables To The Database See Writing New Comparables. Database Database is accessed from the Analysis Grid (menu button, top right), or from Program Group (Click Start, Programs, then scroll to Program Group). Local And/Or Network Database By default, will install a local database to the atvalue folder. Upon will provide registered users with a network database installation at no charge. The local and network databases work the same way and are nearly identical. The Local Database The local database consists of two parts, the Database index worksheet named "Comps Index.xls" and a folder named Comps where the individual comps are stored. Each Comp is saved as an individual Excel worksheet and can be opened, edited and moved to another computer or ed as you would any normal Excel file. (@Value includes two sample comps. You can delete these by opening the Comps folder at..\atvalue\comps. See Directory Structure. After you have deleted the comps, remember to refresh the database.) The Network Database The network database must be installed on the server by the network administrator. This database works the same way as the local database, only it is located on a network server. Again, there are two parts to the system, the Database index worksheet named "NW Comps Index.xls" and a folder named Comps where the individual comps are stored. By will always open the local database. Click the View Network Database button to switch to the network database (if installed). Database:


55 54 Search Comparables Search and sort comps via the drop-down lists. For example, to view all the comps for a particular property type, click the "Type" drop-down, then select the property type to view. The list will then show only comps that match that property type. You can further sort by date ranges and other criteria. In the example below, we have selected "Custom" from the Unit Price drop-down, then set the criteria to show comps with unit prices between $95 and $140. Select Comparables After sorting your comps list, flag the comp for importing by double-clicking the cell to the left. When you have finished sorting and flagging comps, click the Save/Clear List button. This will bring up the following dialog:

,")
56 55 Click the Save List To Comp Manager For Importing. You may now exit the database. When you return to the Analysis Grid, click the Comp Manager button, top-right, to import the comps to the analysis The Comp Manager From the Analysis Grid, click the Manage Comps button. This will bring up the following dialog: Select each comp from the left hand list (one at a time), then click Copy To Analysis >.
57 56 Other Functions of the Comp Manager Remove comps from the analysis Change the order of comps Insert blank comp sheets New Comps New comps are written to blank comp sheets, then saved to the database. Note that data from comp sheets will automatically populate the adjustment grid, but comp data entered directly to the analysis grid will not automatically populate comp sheets. Important: Don't fill out the comp template - use the Comps manager tools to create a new blank Comp sheet. Allow Duplicates This allows the same comp to be inserted to the current analysis more than once. This is handy for comp write-ups of transactions where there is a similar sale already documented in the database Sharing Comp Data When a comp is saved to the database, it is saved as an individual Excel file consisting of a single worksheet, stored in the..\atvalue\comps folder. You can also manually copy/move any comp, group of comps or the entire comps folder to another computer that have Narrative Software installed. After new comps have been manually added to the comps folder, open Database and click the Refresh Database Index button. This will regenerate the list of comp data to reflect the contents of the comp folder. Note that if you have a large number of comparables (100+), refreshing the database index may take several minutes. Note: Only comps should be placed in the comps folder, otherwise, the database index will contain faulty records.
58 Income Analysis Overview The Income Capitalization Analysis features the following components: 30 income rows with income/sf, month or annual calculations; income can be projected for a single unit, or a group of units Vacancy & collection loss Other income (lump sum) 10 expense rows, with expense calculations per/sf, unit, percent of value, percent of income or lump sum amounts Expense reimbursement calculations Capitalization rate tools: band of investment and debt coverage ratio analyses Automatic cash flow graphing for income, expense and cash flow profiles Setting up the Income Analysis Enter the analysis date, property address, size of the improvements and number of rental units at the top section of the will automatically breakout expenses and unit values on a price per square foot basis, or per unit basis. Income can develop income projections based on: Income Per Square Foot Income Per Month Annual Income Enter the income for the tenant or unit type under down with selections for $/SF, $/Mo. and $/Year ; income projection. Next, under the # Units or SF income and calculation will then the potential gross income (PGI). the Income column. The next column has a dropselect the income type that matches that matches the Size column, enter the size that corresponds with the calculate the annual income and the contribution to Other Income Other Income is entered as a lump sum at the bottom of the income section. Hide/Show has the capacity for 30 unit tenants or unit groups. For example, you could have a mix of individual tenants and groups of unit types, such as apartments. Use the Hide/Show Rows button at the top right corner of the analysis to hide or show income rows as necessary. Vacancy and Collection Loss Vacancy & Collection Loss is entered as a percent directly on the worksheet.
 or as a percent of value. The latter is handy for tax abatement work.")
59 58 Entering Expenses Enter the expense as a percent or dollar amount, formatting as necessary. The dollar amount can be $/SF, $/Unit or a Lump Sum. Percent expense can be calculated as a percent of effective gross income (EGI) or as a percent of value. The latter is handy for tax abatement work. In the Expense Type column select from the drop-down list the expense type that matches the expense percent or dollar amount.
. See Expense Reimbursements.")
60 59 Reimbursable has comprehensive expense reimbursement capabilities. Expense reimbursements are automatically imported to the income analysis sheet and added to the Net Operating Income (NOI). See Expense Reimbursements. Entering the Capitalization Rate The cap rate is entered on the worksheet directly under the net operating income. See Capitalization Rate Tools Capitalization Rate includes two capitalization rate tools, Band of Investment and Debt Coverage Ratio. Edit the variables at the top part of the sheet and the formulas will automatically recalculate.

61 60 The Band of Investment This technique utilizes lender and real estate investor investment criteria to develop, or synthesize a capitalization rate. There are four key inputs necessary for this method: The loan-to-value ratio (M) The mortgage interest rate (i) The loan term (n) The equity cap rate or equity dividend rate (R E) The mortgage variables are used to build the mortgage constant (R M), which is the total amount of the payments made in one year, expressed as a percentage of the original loan amount. Payments x 12 / Original Loan Amount = Mortgage Constant (R M) The equity cap rate is the annual return to the investor, expressed as a percent of the original amount invested. The annual return to the investor is also known as the equity dividend rate; it is the profit remaining after debt service and all other expenses. After Debt Service Profit / Equity Investment = Equity Cap Rate (R E) Note that the equity cap rate is not the same (usually, that is) as the equity yield rate. The equity yield rate reflects the total return to the investor over the life of the investment. Factors such as appreciation and mortgage pay down affect and usually increase this return to a point higher than the equity dividend rate. In markets where substantial appreciation is expected, investors will often accept a low or even negative equity dividend rate, anticipating a compensating payoff when the property is
62 61 eventually sold. In markets where little appreciation is expected, much more weight is given to the annual equity dividend. Formula: RM x M = rate RE x (1-M) = rate = Cap Rate (R o) Debt Coverage Ratio Analysis This technique develops a capitalization rate based on typical mortgage terms. There are four variables necessary for this method: The loan-to-value ratio (M) The mortgage interest rate (i) The loan term (n) The debt coverage ratio (DCR) Items 1 through 3 are discussed above under the Band of Investment section. In this method it is also used to develop the mortgage constant (R M). The debt coverage ratio is the factor by which income exceeds debt on an annual basis. Formula: Debt Coverage Ratio x Loan to Value Ratio x Mortgage Constant = Ro or DCR x M x RM = Ro Expense Reimbursements Expense Reimbursements Expense Reimbursements are expense items passed through to or reimbursed to the property owner(s) by the tenants. Expenses may be reimbursed according to the tenant's proportional square foot area or proportional income contribution, or user-defined by the analyst. Navigating the Expense Reimbursement Sheet It is important to navigate the expense reimbursement sheet by using the drop-down list at the top-left corner of the sheet. This will move the menu with you as you move from tenant to tenant. Expense Reimbursement Options There are four options: 1. "% of Area" will calculate the proportional share of each expense, based on the tenant's proportion of building area. If the tenant's square foot area is not defined on the valuation worksheet (if for example, the rent is calculated monthly), click the "Edit Area" button and enter the tenant's square foot area. 2. "% of Income" will calculate the proportional share of the expense, based on the tenant's share of the income stream. This is based on potential gross income. 3. "User-Defined" unlocks the Tenant column, and allows the user to enter amounts directly. Note: This will over-write the formulas in the cells, and they cannot be restored. 4. "None" will set the reimbursements to zero. Each expense has a Yes/No option to activate or deactivate reimbursement calculations. Type "Yes" or

63 62 "No". Tip: Double-click the cell to toggle between "Yes" and "No". Expense Stops: Enter the amount of the expense not reimbursed by the tenant. This amount is deducted from the reimbursement amount allocated to the tenant. Clipboard: Income Capitalization Data Flow The Data Manager is the first stage of data entry. From here, data flows to the spreadsheets via Clipboard. After spreadsheets are completed, spreadsheet data flows back to the narrative, as graphic images, via Clipboard. The Income Analysis Clipboard is organized by two tabs: General Valuation Worksheet & Images Use Clipboard for general data, such as property address, analysis date and certain subject physical characteristics that are applicable to the income capitalization analysis, such as number of units, gross building area, etc. Additionally, images of the Valuation Worksheet, Expense Reimbursements, Cap Rate Calculations and the three cash flow graphs can be copied to the clipboard. Note that when Income Capitalization images are pasted from Clipboard to the narrative document, the software looks for certain bookmarks to identify the location to paste the various images. Clipboard: Narrative for a table of bookmarks uses.

64 63 To paste, the item must be checked. Note there is a "Select All" toggle button. Only information on the General tab may be pasted from the clipboard to the Valuation Worksheet. Worksheet and chart images can only be copied to the clipboard. Use the Valuation Worksheet and Chart Images tab to copy images of the worksheets and charts to Clipboard, or to view the current clipboard content for these items. A Note About Expense Reimbursements: If there is more than one page of expense reimbursements, it is more efficient to print directly from Excel and insert the pages into the document. The Expense Reimbursements worksheet can be very tall, encompassing several pages. Each 8.5" x 11" area can hold three reimbursement tables. Therefore, if the analysis has 30 leases, there will be ten pages of reimbursement tables. The copy function will copy the current print range of the Expense Reimbursement sheet. This can include a single page (set of three reimbursement tables) or several pages. If the print range is greater than one page, the reimbursements will not display properly when pasted to Word. It is therefore recommended that the Expense Reimbursements worksheet be printed while in Excel then inserted into the Word document if there are more than one page of expense reimbursements. The Windows Clipboard To bypass Clipboard, use the Windows clipboard option. This will copy the print area of the active sheet to the Windows Clipboard. For best results in Word, paste the spreadsheet as a picture. In Word, click Edit, Paste Special and select Picture.

65 Cost Analysis Overview The Cost Analysis features the following components: 10 categories for building component costs 5 categories for site improvements 4 soft cost categories Contingency and entrepreneurial costs Automatic allocation of building and site costs Site items depreciation Building items depreciation Functional and external obsolescence depreciation Location for incorporating additional cost sections (create up to 5 cost sections) Land value summary Cost Approach value summary Copy to clipboard Hide or show various sections and items Building Cost Components The cost analysis is populated with common building cost components in the drop-down lists. Choose an item from the list or type a new entry. Next select or enter the type of measure for the cost component (Sq. Ft., Lump Sum, etc.). Finally enter a quantity and cost for the will then calculate the component cost. Note this section can contain a detailed break-out of cost components or single cost item. The level of detail is very flexible. Site Cost Components Site costs are calculated the same way as the above building costs. Soft Costs, Contingency and Profit Soft costs can be calculated based on a percentage of the building cost or building and site costs combined. The soft cost categories can be changed by the user. Contingency and profit are based on a percentage of the total project cost. Note that the Profit cell contains a drop-down list with various profit labels, such as Developer's Profit and Builder's Profit.


66 65 will automatically allocate the building and site costs for physical depreciation. Enter the effective age and economic life of the component to calculate physical depreciation. Functional and External Obsolescence are calculated based on building improvement costs. Other Cost Sections Four additional cost sections can be added to the primary cost analysis will label each section (top right section of analysis) and link the cost summary of each section to the primary page under the Other Cost Sections area. When a new section is added, the Land Value Summary and Other Cost Sections are hidden on the new sheet. Land Value Summary This section is for the land value and associated land value items that may warrant inclusion. Show/Hide Features This function will show/hide features that may not be applicable for a particular analysis or cost section Contingency Profit Other Cost Sections Land Value Clipboard: Cost Analysis Data Flow The Data Manager is the first stage of data entry. From here, data flows to the spreadsheets via the

67 Clipboard. After spreadsheets are completed, spreadsheet data flows back to the narrative, as graphic images, via Clipboard. The Cost Analysis Clipboard is organized by two tabs: General Cost Analysis Images Use Clipboard for general data, such as property address, analysis date and certain subject physical characteristics that are applicable to the cost analysis, such as number of units, gross building area, etc. Additionally, images of the Cost Analysis worksheets can be copied to the clipboard. Note that when Cost images are pasted from Clipboard to the narrative document, the software looks for certain bookmarks to identify the location to paste the various images. Clipboard: Narrative for a table of bookmarks uses. To copy, the item must be checked. Note there is a "Select All" toggle button. Only information on the General tab may be pasted from the clipboard to the Cost Analysis. Images of the Cost Analysis worksheets can only be copied to the clipboard while in the Cost Analysis. Use the Cost Analysis Images tab to copy images of the cost analysis Clipboard, or to view the current clipboard content for these items.
Six Steps to a Completed Appraisal Report
 Six Steps to a Completed Appraisal Report Section 1 DataLog - Comparable Sales Database ClickFORMS - Report Processor Section 2 Addenda Section 3 Mini Sample - Approach Pages 1 Six Steps to a Completed
HOW TO CREATE AN APPRAISAL
 Page 1 7/19/2005 IMAGEsoft s Appraise Link Instruction Manual HOW TO CREATE AN APPRAISAL Start at the MAIN MENU. Click on APPRAISALS. The WORK WITH APPRAISALS screen appears. This screen stores your appraisals,
Features Guide. Enhancements. Mortgage Calculators VERSION 7. May 2008
 Features Guide VERSION 7 May 2008 Copyright 2002-2008 SuperTech Software All rights reserved. Printed in Australia. Enhancements This document describes new features and enhancements in POSH. Mortgage
Full CMA. Cover Page Tab
 CMA A Comparable Market Analysis (CMA) is a comparison between properties that are like a property you re trying to sell. A CMA is used in pricing a property you compare the property you re trying to sell
User Manual. Section 2: Implementation and Industry Translations. Created: October Copyright PropertyBoss Solutions, LLC. All Rights Reserved.
 User Manual Section 2: Implementation and Industry Translations Created: October 2010 Copyright PropertyBoss Solutions, LLC. All Rights Reserved. PropertyBoss Manual Section 2 - Implementation and Industry
Comparative Lease Analysis Version 3. User s Guide. RealData Inc. PO Box 691 Southport, CT 06890
 Comparative Lease Analysis Version 3 User s Guide RealData Inc. PO Box 691 Southport, CT 06890 www.realdata.com 1983-2012, RealData Inc. RealData is a registered trademark of RealData, Inc Comparative
Real Estate Investment Analysis Version User s Guide. RealData Inc. P. O. Box 691 Southport, CT 06890
 Real Estate Investment Analysis Version 16.0 User s Guide RealData Inc. P. O. Box 691 Southport, CT 06890 www.realdata.com 1982-2012, RealData Inc. RealData is a registered trademark of RealData, Inc.
Appraisal Firewall Guide for Administrators
 Appraisal Firewall Guide for Administrators Managing Your Branches and Market Areas in Appraisal Firewall The Appraisal Firewall Administrator user was designed to give lenders fast and easy access to
Regression + For Real Estate Professionals with Market Conditions Module
 USER MANUAL 1 Automated Valuation Technologies, Inc. Regression + For Real Estate Professionals with Market Conditions Module This Regression + software program and this user s manual have been created
WinTen² Section 8 Desktop Inspections
 WinTen² Section 8 Desktop Inspections Preliminary User Manual User Manual Edition: 11/15/2004 We are your inside track for making your job easier! Tenmast Software 132 Venture Court, Suite 1 Lexington,
Investit Software Inc. Investor Pro
 Investor Pro Table of Contents Investor Pro...3 Introduction...3 The fastest way to learn Investor Pro...4 Selecting a Template. Which Template should I use?...6 Setting and changing the Starting Date
OnePlace CMA User s Guide. Creating a CMA using the OnePlace CMA module.
 OnePlace CMA User s Guide Creating a CMA using the OnePlace CMA module. How to Find It Go to http://www.ouroneplace.net Choose My CMA CMA: Manage CMA Choose CMA. To create a new CMA, enter a name for the
Credit Union Leasing of America Residual Web Users Guide Consumer Lease Program. January 2018
 Credit Union Leasing of America Residual Web Consumer Lease Program January 2018 i CULA Residual Web - Consumer Lease Program Table of Contents Table of Contents Accessing CULA Residual Web... 3 Creating
Performance Pro Update 3.13 June 7, Concurrent Appraisals
 Performance Pro Update 3.13 June 7, 2018 Concurrent Appraisals 3.13_2018 What s New? The 3.13 release adds a few exciting new features to Performance Pro. The first is the ability to add a new section
WCMS User s Guide. Effective August, 2013
 WCMS User s Guide Effective August, 2013 Your Computer s Settings: WCMS is currently compatible with Internet Explorer only using any other web browser such as Mozilla Firefox, Google Chrome, etc. may
Estate Administration. Quickstart Guide
 Estate Administration Quickstart Guide WORKFLOW SOLUTIONS...SIMPLIFIED ESTATE ADMINISTRATION Emergent Estate Administration is designed to handle data storage and document assembly. Matters are the actual
WinTar-Tenant Accts Receivable User' s Guide
 WinTar-Tenant Accts Receivable User' s Guide Copyright HAB INC June 2009 All Rights Reserved Revised August 2011 2 P a g e 3 P a g e WinTAR Users Guide Table of Contents WinTAR Users Guide... 4 Table of
Here s How to Do a Simple Property Search.
 Here s How to Do a Simple Property Search. Conducting a Search Using the Single Property Search First step to conducting a property search is selecting the state and the county in which to search. Then,
Step By Step Guide. Release Version 14.0 August 21 st, 2008
 Step By Step Guide Release Version 14.0 August 21 st, 2008 ARGUS Software: ARGUS Valuation DCF Step By Step Guide The contents of this document are considered proprietary by ARGUS Software, the information
Keller Williams Listing System (KWLS)
") Keller Williams Listing System (KWLS) NOTES... KWLS AND THE GSO 0707R3 2007 KELLER WILLIAMS REALTY INC. i NOTICES While Keller Williams Realty International (KWRI) has taken due care in the preparation
Keller Williams Listing System (KWLS) NOTES... KWLS AND THE GSO 0707R3 2007 KELLER WILLIAMS REALTY INC. i NOTICES While Keller Williams Realty International (KWRI) has taken due care in the preparation
Table of Contents Before You Begin... 2 Starting an Analysis... 2 Address Verification... 3 Order Confirmation... 5 Overview of Drop Down Menu Bar...
 Table of Contents Before You Begin... 2 Starting an Analysis... 2 Address Verification... 3 Order Confirmation... 5 Overview of Drop Down Menu Bar... 6 Overview of the Analytic Process... 7 Process Tab
CMA "Price It Right"- Matrix
 CMA "Price It Right"- Matrix Houston Association of Realtors 3 Hours CE Course#: 3160 2 Table of Contents 1. Overview 3 2. Subject Property Information 3 3. Selecting Comparables (Comps) 5 4. History Report
Working in the Appraisal Firewall Relationships Screen
 Working in the Appraisal Firewall Relationships Screen User Training Guide for Managers The Relationships window is your guide to manage your clients accounts, work within their orders, and oversee all
Saving your reports NOTE
 Saving your reports NOTE: It is always a good idea to have copies of the work that you are doing. UHAB will not keep these records for you, so it is your responsibility to regularly save and print copies
THE VALUATION ANALYST
 USER MANUAL Companion Spreadsheet for the book: THE VALUATION ANALYST Research in Extracting Adjustment Rates by David A. Braun, MAI, SRA, AI-GRS. The Compass Spreadsheet copyright 2016 by Automated Valuation
Abila MIP Fund Accounting TM. Encumbrances STUDENT WORKBOOK ABILA LEARNING SERVICES. Important Notice:
 Abila MIP Fund Accounting TM Encumbrances STUDENT WORKBOOK ABILA LEARNING SERVICES Important Notice: Authentic Abila MIP Fund Accounting TM training guides display a holographic image on the front cover.
Investit Software Inc. INVESTMENT ANALYSIS RETAIL EXAMPLE USA USING RENT ROLL AND TWO CATEGORIES
 INVESTMENT ANALYSIS RETAIL EXAMPLE USA USING RENT ROLL AND TWO CATEGORIES INTRODUCTION This comprehensive retail example uses Rent Roll and Categories and includes all the lease features such as Free Rent,
Uniform Collateral Data Portal (UCDP) General User Guide October 2017
 General User Guide October 2017") Uniform Collateral Data Portal (UCDP) General User Guide October 2017 direction of their regulator, the Federal Housing Finance Agency. 1 of 100 direction of their regulator, the Federal Housing Finance
Uniform Collateral Data Portal (UCDP) General User Guide October 2017 direction of their regulator, the Federal Housing Finance Agency. 1 of 100 direction of their regulator, the Federal Housing Finance
Listing Load Manual. for. Staff
 Listing Load Manual for Staff 1 Listing Load Listing Load is the module that allows you to add a new listing, change listing information and make contractual changes such as status or price at any time
OQOOD Off-Plan Property Management Solution
 Emirates Real Estate Solutions (ERES) OQOOD Off-Plan Property Management Solution Property Developers Guide Version 1.1 http://www.oqood.ae/ Copyrights Emirates Real Estate Solutions (ERES) 2010. All Rights
Introduction to CREST EDG Reports
 9 Introduction to CREST EDG Reports Introduction to CREST EDG Reports Overview Action Items Reports Report Formats Types of CREST EDG Reports CREST EDG produces many types of reports that help you to
Introduction to Property Management
 6 Introduction to Property Management Introduction to Property Management Overview CREST EDG Property Management Module Commercial Property Management and Other Income Transactions Property Management
Homeowner s Exemption (HOE)
") Homeowner s Exemption (HOE) Table of Contents CHEAT SHEETS... 3 Add HOE to a Parcel...3 Edit HOE Record...3 Remove HOE from a Parcel...3 Find the HOE Amount...3 Who is getting the exemption?...4 New Application
Homeowner s Exemption (HOE) Table of Contents CHEAT SHEETS... 3 Add HOE to a Parcel...3 Edit HOE Record...3 Remove HOE from a Parcel...3 Find the HOE Amount...3 Who is getting the exemption?...4 New Application
User Guide and Training Manual
 User Guide and Training Manual Version 2012 Table of Contents Introduction About This Manual... 1 Exercises... 1 Statement of Warranty and Disclaimer... 2 Training Files... 3 LOGON & Keyboard Objectives...
Appraisal Firewall Quick Start Guide
 Appraisal Firewall Quick Start Guide Information for Manager Users BASIC USAGE AND LAYOUT... 2 MANAGER SETTINGS... 3 ORDERS... 5 PINNED ORDERS... 6 WORKING IN AN ORDER... 7 RELATIONSHIPS... 9 LENDERS TAB...
Investit Software Inc. OFFICE BUILDING YEARLY CANADA EXAMPLE
 INTRODUCTION This office example uses features such as Free Rent. OFFICE BUILDING YEARLY CANADA EXAMPLE For simplicity there are only two tenants used in the example. Tenant A. 5,000 Sq. Ft Tenant B. 3,400
Demonstration Appraisal Report Utilizing a Form Report
 Demonstration Appraisal Report Utilizing a Form Report National Association of Independent Fee Appraisers 330 North Wabash Avenue, Suite 2000 Chicago, IL 60611 Phone: (312) 321-6830 Fax: (312) 673-6652
table of contents Profile Setup...1 Personal Info, Contact Info, Web Info... 2 Profile Photo... 3 Create a Presentation in 5 Easy Steps!...
 USER GUIDE table of contents Profile Setup...1 Personal Info, Contact Info, Web Info... 2 Profile Photo... 3 Create a Presentation in 5 Easy Steps!... 3 Working with the Search Screen... 4 Presentation
Title Transfer of Ownership (Bill of Sale Initiation)
") Title Transfer of Ownership (Bill of Sale Initiation) Note: The transfer of title between Free Miners is handled in two (2) parts. These instructions cover the Initiation portion. 1. The seller enters
Title Transfer of Ownership (Bill of Sale Initiation) Note: The transfer of title between Free Miners is handled in two (2) parts. These instructions cover the Initiation portion. 1. The seller enters
VISION ASSET REGISTER TABLE OF CONTENTS
 VISION ASSET REGISTER TABLE OF CONTENTS Introduction... 2 Outlook of the Asset Register Software... 2 Setups... 4 Asset Location... 5 Asset Type/Group... 5 Currencies... 7 Custodian... 7 Cost Center/Project
Inspections Application - Mobile
 STANDARD OPERATING PROCEDURES Inspections Application - Mobile For Maintenance Supervisors and Maintenance Techs Revised: July 3, 2018 Singh Management Company 7125 Orchard Lake Road, Suite 200 West Bloomfield,
Yardi Voyager 6.0 Manual
 Yardi Voyager 6.0 Manual Created 2.26.2010 Updated On 12.11 Updated 3.26.2012 Echelon Property Group 5655 South Yosemite Street #460 Greenwood Village, CO 80111 Yardi Voyager Manual Page Voyager Log in
The list below shows the errors that can occur during submission, as well as some details about each one.
 Identifying s Version: 1.5 Publish Date: 09/09/2013 When an appraisal is submitted to UCDP, the XML data will immediately be checked for errors. Some of these errors can cause the submission to fail, while
AFFORDABLE HOUSING CONNECTIONS NOTES FOR CHART REPORTING (FOLLOW THESE INSTRUCTIONS TO AVOID FINDINGS)
") AFFORDABLE HOUSING CONNECTIONS NOTES FOR HTC-12 PREPARATION AND REPORTING: PROGRAM YEAR 2015, DUE MARCH 15, 2016 (FOLLOW THESE INSTRUCTIONS TO AVOID FINDINGS) i. The HTC 12 requires the signature of the
AFFORDABLE HOUSING CONNECTIONS NOTES FOR HTC-12 PREPARATION AND REPORTING: PROGRAM YEAR 2015, DUE MARCH 15, 2016 (FOLLOW THESE INSTRUCTIONS TO AVOID FINDINGS) i. The HTC 12 requires the signature of the
GeoWarehouse Land Registry. Teranet Enterprises Inc.
 GeoWarehouse Land Registry Teranet Enterprises Inc. TABLE OF CONTENTS Neighoubourhood Sales... 1 Overview... 1 Find Neighbourhood Sales... 1 Neighbourhood Sales and Map... 6 Map Neighbourhood Sales...
Owner Builder Training Guide for the New Home Buyer Protection Public Registry
 Owner Builder Training Guide for the New Home Buyer Protection Public Registry Prepared by New Home Buyer Protection Office Alberta Municipal Affairs Contents 1 Introduction... 3 2 Using the Owner Builder
Accessing and Viewing Voided Claims in EI Billing
 1 Accessing and Viewing Voided Claims in EI Billing 2 Introduction Hint: For quicker navigation, click on the 'Menu' link on the top right-hand side of the player to move freely among the sections of this
Pro Series User Guide
 Pro Series User Guide Table of Contents Page 2 Getting Started Page 7 Property Search and Reports Page 22 Farm Search and Reports Page 30 Using the Map GETTING STARTED 2 P a g e Property Search select
Implementation Success with
 Implementation Success with Copyrights IMPORTANT NOTICE: YOUR USE OF THESE MATERIALS SHALL BE DEEMED TO CONSTITUTE YOUR AGREEMENT THAT SUCH USE SHALL BE GOVERNED BY THE MUTUAL NON-DISCLOSURE PROVISIONS
Real Estate Software User s Guide Close It Original HUD Title Page DisplaySoft 2018 Display Systems, Inc.
 DisplaySoft Close It Original HUD Real Estate Software User s Guide Close It Original HUD Title Page DisplaySoft 2018 Display Systems, Inc. GET STARTED Open a new file or a file in progress (File). Inside
The ecrv Submit application opens with the following important warning message on privacy:
 Submit Form Tabs Buyers and Sellers Property Sales Agreement Supplementary Submitter The ecrv form is a single Web-page form with entry fields, choices and selections in multiple tabs for submitting a
etransfer Form User Guide The Property Registry s
 s etransfer Form User Guide A service provider for the Province of Manitoba Most recent update: 2018-01-08 Version 2.03 Table of Contents Purpose... 4 General Guidelines for Completion... 4 Requirements...
MMSVP Migration Wizard
 MMSVP Migration Wizard Questions? From within BS&A, go to Help>Contact Customer Support and select Request Support Phone Call or Email Support. Or, you may call us at (855) 272-7638 and ask for the appropriate
Marshall & Swift SwiftEstimator
 Program Reference Marshall & Swift SwiftEstimator Commercial Estimator Program June 2016 June 2016 SwiftEstimator - Commercial Estimator 2 - i 2016 CoreLogic, Inc. All Rights Reserved Worldwide. No part
54 System Design Collaborate: Agent Task Instructions
 1 54 System Design Collaborate: Agent Task Instructions Version Date Description By 1.0 1/25/2013 Final Lizette Patterson Table of Contents Profile information... 2 Agent (Listing) Confirmation Task...
All information and reports concerning properties can be found by clicking on the Properties tab in your black toolbar along the top of your page.
 support@payprop.co.za 087 820 7368 TRAINING MANUAL: PROPERTIES All information and reports concerning properties can be found by clicking on the Properties tab in your black toolbar along the top of your
PROPERTY TAX TIPS AND TRICKS
 PROPERTY TAX TIPS AND TRICKS Presented By: Vicki Chiasson & Wes Pogorzelski PROVEN GOVERNMENT TECHNOLOGY LEADERSHIP Enhanced Levy Calculation Tax levies take a long time to generate Corrections may require
BPO Best Practices Guide
 BPO Best Practices Guide A Step by Step Guide for Completing BPO Reports Version: 1.0.0 Published: 03/01/2011 Global DMS, 1555 Bustard Road, Suite 300, Lansdale, PA 19446 2014, All Rights Reserved. Table
MUNICIPAL REPORTING SYSTEM. SOE Assessment (SOE-A) User Guide June 2018
 User Guide June 2018") MUNICIPAL REPORTING SYSTEM SOE Assessment (SOE-A) User Guide June 2018 Crown copyright, Province of Nova Scotia, 2018 Municipal Reporting System SOE Assessment (SOE-A) User Guide Municipal Affairs June
MUNICIPAL REPORTING SYSTEM SOE Assessment (SOE-A) User Guide June 2018 Crown copyright, Province of Nova Scotia, 2018 Municipal Reporting System SOE Assessment (SOE-A) User Guide Municipal Affairs June
Family Self-Sufficiency winfss M anual
 Family Self-Sufficiency winfss M anual Page 1 of 25 General Setup Some general setup work needs to be done before you can use WinFSS: (1) Transaction codes need to be created (FSS Transaction Codes), (2)
Veco User Guides. Tenancy Agreements
 Veco User Guides Tenancy Agreements Introduction Veco version 1.1.5.0 introduces a new mail merge facility to automate the pulling together of standard clauses to create a tenancy agreement. Your company
Comparables Sales Price (Old Version)
") Chapter 486 Comparables Sales Price (Old Version) Introduction Appraisers often estimate the market value (current sales price) of a subject property from a group of comparable properties that have recently
Chapter 486 Comparables Sales Price (Old Version) Introduction Appraisers often estimate the market value (current sales price) of a subject property from a group of comparable properties that have recently
Investit Software Inc. LEASE ANALYSIS LANDLORD INDUSTRIAL USA EXAMPLE TENANT RENTING SINGLE SPACE
 LEASE ANALYSIS LANDLORD INDUSTRIAL USA EXAMPLE TENANT RENTING SINGLE SPACE INTRODUCTION This Lease Analysis example analyses an industrial lease from a Landlord s perspective where the tenant is renting
General Questions. What happens to my saved CMAs in my current program? Your saved CMAs, unfortunately, cannot be transferred over to Moxi Present.
 FAQs General Questions What is Moxi Present? Moxi Present is a powerful presentation and CMA tool that you can use to easily create professional, tech-savvy presentations that will impress clients and
Investit Software Inc. LEASE ANALYSIS TENANT RETAIL USA EXAMPLE TENANT RENTING SINGLE SPACE
 LEASE ANALYSIS TENANT RETAIL USA EXAMPLE TENANT RENTING SINGLE SPACE INTRODUCTION This Lease Analysis example analyses a retail lease from a tenant s perspective where the tenant is renting one space in
MARS User Guide Appraisers https://gp.marswales.org https://medical.marswales.org. Guide Index
 1 MARS User Guide Appraisers https://gp.marswales.org https://medical.marswales.org This guide is intended to walk you through the Appraisal Process using the online MARS system. Primarily for Appraisers
Investit Software Inc. LEASE ANALYSIS LANDLORD OFFICE USA EXAMPLE TENANT RENTING SINGLE SPACE
 LEASE ANALYSIS LANDLORD OFFICE USA EXAMPLE TENANT RENTING SINGLE SPACE INTRODUCTION This Lease Analysis example analyses an office lease from a landlord s perspective where the tenant is renting one space
Demonstration Properties for the TAUREAN Residential Valuation System
 Demonstration Properties for the TAUREAN Residential Valuation System Taurean has provided a set of four sample subject properties to demonstrate many of the valuation system s features and capabilities.
ProForm User Guide. SoftPro Select 3.0 Friday, May 01, Falls of Neuse Road, Suite 400 Raleigh, NC 27609
 ProForm User Guide SoftPro Select 3.0 Friday, May 01, 2015 4800 Falls of Neuse Road, Suite 400 Raleigh, NC 27609 p (800) 313-0085 Support@softprolite.com Table of Contents Resources... 4 Connecting to
Configuring Service Charge Settlement in Flexible Real Estate Management (RE FX)
") Configuring Service Charge Settlement in Flexible Real Estate Management (RE FX) Applies to: Any consultant who wants to configure the Service Charge Settlement settings for user requirements in SAP flexible
Configuring Service Charge Settlement in Flexible Real Estate Management (RE FX) Applies to: Any consultant who wants to configure the Service Charge Settlement settings for user requirements in SAP flexible
MRI Commercial Management For Web Operational Training Guide Version 4.2
 MRI Commercial Management For Web Operational Training Guide Version 4.2 2012 MRI Software LLC. Any unauthorized use or reproduction of this document is strictly prohibited. All Rights Reserved. 2012 MRI
Investit Software Inc. ANALYZER EXPRESS
 ANALYZER EXPRESS Table of Contents Introduction...3 Project Info Folder...4 Finance Folder...6 Income Folder...8 Expenses Folder...9 Goal Seeking...10 Sample Reports...12 Comparison Report...14 Introduction
How to Read a Real Estate Appraisal Report
 How to Read a Real Estate Appraisal Report Much of the private, corporate and public wealth of the world consists of real estate. The magnitude of this fundamental resource creates a need for informed
USER MANUAL. for. Program Version SDS Shelton Development Services Redcroft House Redcroft Walk Cranleigh Surrey GU6 8DS
 USER MANUAL for Program Version 7.10 SDS Shelton Development Services Redcroft House Redcroft Walk Cranleigh Surrey GU6 8DS Tel. 01483 278444 Fax. 0845 076 3777 Email support@sdslandval.co.uk Contents
A Complete Guide to Creating a Tenancy
 A Complete Guide to Creating a Tenancy 1 This guide initially describes all the steps that will need to be in place prior to a tenancy being created. To Create Instruction: Area Applicant Property Landlord
TOOL FOR COSTING SUSTAINABLE COMMUNITY PLANNING: USER GUIDE
 Canadian Mortgage and Housing Corporation TOOL FOR COSTING SUSTAINABLE COMMUNITY PLANNING: USER GUIDE DRAFT SEPTEMBER 2006 TABLE OF CONTENTS 1. INTRODUTION...1 1.1 What is the Tool for Costing Sustainable
Capital One Escrow Express SM Reference Guide
 Capital One Escrow Express SM Reference Guide Table of Contents Overview 2 Accessing Capital One Escrow Express 2 About the Capital One Escrow Express Menu 4 About the Master Account Summary 5 Creating
MULTI-TENANT SOLUTION GUIDE
 c MULTI-TENANT SOLUTION GUIDE Front Office 8.5 A solution guide to support Multi-Tenant implementations Contents 1.0 Introduction... 3 2.0 Solution Principles... 3 3.0 Licensing... 4 4.0 Integration &
MARS Doctor User Guide Primary Care
 1 MARS Doctor User Guide Primary Care https://gp.marswales.org This guide is intended to walk you through the Appraisal Process using the online MARS system. Primarily for primary care doctors practising
Investit Software Inc. LEASE ANALYSIS LANDLORD INDUSTRIAL USA EXAMPLE
 LEASE ANALYSIS LANDLORD INDUSTRIAL USA EXAMPLE INTRODUCTION This Lease Analysis example analyses an industrial lease from a Landlords perspective. The landlord is considering a proposal from Apex Manufacturing
3-Way Reconciling in ProTrust (Standard Edition)
") Introduction 3-Way Reconciling in ProTrust (Standard Edition) The steps below outline the process of reconciling your trust account(s) in ProTrust with your monthly bank statement. More detailed instructions
Introduction 3-Way Reconciling in ProTrust (Standard Edition) The steps below outline the process of reconciling your trust account(s) in ProTrust with your monthly bank statement. More detailed instructions
Universal Anywhere Getting Started Guide. Thesaurus Technology
 Universal Anywhere Getting Started Guide Thesaurus Technology 0845 83 82 666 support@thesaurus.org.uk Universal Rentals Management Getting Started Guide The getting start guide is designed to help you
MLSSAZ: Comparative Market Analysis (CMA) in Flexmls
 in Flexmls") MLSSAZ: Comparative Market Analysis (CMA) in Flexmls Class Objectives Utilize property research tools to assist you in obtaining listing information. Use search results to create a CMA.. MLS Technical
MLSSAZ: Comparative Market Analysis (CMA) in Flexmls Class Objectives Utilize property research tools to assist you in obtaining listing information. Use search results to create a CMA.. MLS Technical
1 MLS Settings Glossary
 1 MLS Settings Glossary Association vs MLS... 2 Broker Load... 2 Collection... 2 Dashboard... 2 Export... 3 Fallthrough Date... 3 Geocode... 3 Incomplete Listing... 3 Marketing Name... 3 MLS Datashare...
Part 1. Estimating Land Value Using a Land Residual Technique Based on Discounted Cash Flow Analysis
 Table of Contents Overview... v Seminar Schedule... ix SECTION 1 Part 1. Estimating Land Value Using a Land Residual Technique Based on Discounted Cash Flow Analysis Preview Part 1... 1 Land Residual Technique...
Power Analy$I$ Maximizing Inve$tment Return$ With Your Computer
 Power Analy$I$ Maximizing Inve$tment Return$ With Your Computer New Version 10.0 Developed by: James F. Little, MBA, CCIM www.1031.com JamesFLittle@MSN.com Introduction New Version 10.0 The following screen
Real Estate Products USER MANUAL. Get Started Log in... 1
 Real Estate Products USER MANUAL Get Started Log in... 1 CA Agent Market Wizard Introduction... 2 Generate A Report... 3 Save Search... 4 Report Output... 4 Export Report & Data... 5 CA HomePriceTrends
ARGUS Software: ARGUS Valuation-Capitalisation Step-by-Step Guide
 ARGUS Software: ARGUS Valuation-Capitalisation Step-by-Step Guide The contents of this document are considered proprietary by ARGUS Software, the information enclosed and any portion thereof may not be
RECOMMENDED METHODOLOGY FOR SUPPLY & DEMAND ANALYSIS FOR BROWARD COUNTY S AFFORDABLE HOUSING MARKET
 RECOMMENDED METHODOLOGY FOR SUPPLY & DEMAND ANALYSIS FOR BROWARD COUNTY S AFFORDABLE HOUSING MARKET PREPARED FOR BROWARD COUNTY 110 NE 3 RD STREET FT. LAUDERDALE, FLORIDA 33301 ATTN: MR. RALPH STONE, EXECUTIVE
Quarterly Owner s Financial Certification Reporting Instructions
 Quarterly Owner s Financial Certification Reporting Instructions Quarterly Owner Financial Certification Reports are due by the 15 th business day of April (for the Quarter Jan Mar), July (for the Quarter
DATA-ENTRY EXAMPLES FOR HOME OFFICES UltraTax/1040
 DATA-ENTRY EXAMPLES FOR HOME OFFICES UltraTax/1040 Introduction... 1 Example Entering home office information in the asset module... 1 Results... 5 Figure 5: Example 1 Form 8829 for Home Office 1... 6
Audit Rent... 3 Calculate Rent... 3 Verify and Accept Rent... 4 Print Tenant Rent Report... 4 Print Revised Tenant Rent Report...
 Rent Calc Rent Calculation Tabs Prompt Tab... 1 Family Tab... 1 Income Tab... 1 Assets Tab... 1 Detail Tab... 2 Summary Tab... 2 History Tab... 2 Audit Tab... 2 Comments Tab... 2 Amounts Tab... 2 Control
Agent Quick Guide REGISTRATION & USE
 Agent Quick Guide REGISTRATION & USE Register and set your preferences 1. Go to TrustFunds via the Matrix Home tab drop- down menu: Or via the External links box on the Matrix home screen: 2. TrustFunds
Asset. Capital Asset Management Module. Asset Lookup Form
 Capital Asset Management Module Asset Under KFS Modules, Capital Asset Management, Reference, select the Lookup button in the Asset row. The next screen allows you to search the CAM system for assets that
RealEC Interface with Closing Market. The Settlement Industry s Digital Marketplace
 RealEC Interface with Closing Market RealEC & Closing Market Through the RealEC integration with Closing Market, the Title Company and Lender can communicate and share data with one another. Using Event
ForeclosureRadar iphone App
 ForeclosureRadar.com Tutorial: ForeclosureRadar is the most powerful foreclosure search tool available on the market today. And now, exclusively on the iphone, it s available anytime, anywhere. in the
Working with the LendingQB-Appraisal Firewall Interface
 Working with the LendingQB-Appraisal Firewall Interface Setup and User Training Guide Lenders that use the LendingQB LOS can stay in their familiar loan origination system and place real estate appraisal
ProLease Release Notes
 IMPORTANT - This document includes all changes made to the ProLease Lease Administration Database since version 9.1. You can print only the pages you want based on the table of contents below. Version
Overview In the past DIS has distributed price updates on CD. Now, you will be able to retrieve price updates directly from the DIS website.
 Retrieve Price Files from Internet via WebLockers (Keystone Dealers Only) Overview In the past DIS has distributed price updates on CD. Now, you will be able to retrieve price updates directly from the
etrac Guide Enhanced Appraiser Scoring Global DMS, 1555 Bustard Road, Suite 300, Lansdale, PA , All Rights Reserved.
 etrac Guide to Enhanced Appraiser Scoring Version: 2.5.0 Published: 09/22/2014 Global DMS, 1555 Bustard Road, Suite 300, Lansdale, PA 19446 2014, All Rights Reserved. Table of Contents Introduction to