ANALYS SIS OF METRO READINE PREPARED
|
|
|
- Ferdinand Lawrence
- 5 years ago
- Views:
Transcription


1 ANALYS SIS OF METRO VANCOUVER S MARKET READINE ESS OF VACANT INDUSTRIAL LANDS REPORT JUNE 2013 PREPARED BY:
2 TABLE OF CONTENTS Acknowledgement... iv Preamble... v Executive Summary... vii 1.0 Introduction Terms of Reference Method of Analysis Planning and Development Constraint Analysis Lot Size Distribution Analysis Case Studies Conclusion CHARTS 1. Total Amount of Lands Unavailable for Development Before 2017 Based on Restriction (Including Government-owned) 2. Total Amount of Lands Unavailable for Development Before 2017 Based on Restriction (Excluding Government-owned) 3. Lands Available for Development Before 2017 (Excluding Government-owned) 4. Lands Available for Development Before 2017 (Including Government-owned) 5. Parcel Size Breakdown of Lands Available for Development Before 2017 TABLES 1. Lot Size Distribution FIGURES 1. Government/Quasi-government Owned B Avenue, Surrey 2. Government/Quasi-government Owned Street, Surrey 3. Dedicated as Road Avenue, Surrey 4. Dedicated as Road Lougheed Highway, Port Coquitlam 5. Current Industrial Use Avenue, Surrey 6. Current Industrial Use Croydon Drive, Surrey 7. Current Non-industrial Use No. 5 Road, Richmond 8. Current Non-industrial Use Street, Surrey 9. Environmentally-sensitive Area Street, Surrey 10. Environmentally-sensitive Area Fraser Dyke Road, Pitt Meadows 11. Servicing Restrictions Street, Surrey 12. Servicing Restrictions Scott Road, Surrey 13. Unsuitable Topography Colebrook Road, Surrey 14. Unsuitable Topography A Avenue, Surrey 15. Non-industrial Designation Scott Road, Surrey 16. Non-industrial Designation - Harris Road, Pitt Meadows NAIOP VANCOUVER PACIFIC LAND GROUP ii
3 17. Isolated Lots Under 1.0 acre No. 5 Road, Richmond 18. Isolated Lots Under 1.0 acre Kingston Road, Maple Ridge Industrial Land Inventory - Metro Vancouver Industrial Land Inventory - Burnaby Industrial Land Inventory - Campbell Heights, Surrey Industrial Land Inventory - Carvolth, Langley Industrial Land Inventory - Cloverdale, Surrey Industrial Land Inventory - Coquitlam Industrial Land Inventory - Delta Industrial Land Inventory - Gloucester, Langley Industrial Land Inventory - Highway 99 Corridor, Surrey Industrial Land Inventory - Maple Ridge Industrial Land Inventory - New Westminster Industrial Land Inventory - Newton/Panorama, Surrey Industrial Land Inventory - Pitt Meadows Industrial Land Inventory - Port Coquitlam Industrial Land Inventory - Richmond Industrial Land Inventory - South Westminster/Bridgeview, Surrey Industrial Land Inventory - Tsawwassen First Nation Industrial Land Inventory YVR 37. Industrial Land Sales APPENDICES A. Metro Vancouver s Market Readiness of Metro Vancouver Vacant Industrial Lands, August 2012 B. Metro Vancouver 2010 Industrial Lands Inventory, November 2011 NAIOP VANCOUVER PACIFIC LAND GROUP iii
4 Acknowledgement NAIOP Vancouver would like to acknowledge Metro Vancouver for supplying the Metro Vancouver 2012 Industrial Lands Inventory data upon which this report is based, Pacific Land Group for the analysis of the Metro Vancouver data and CBRE Ltd and Colliers International for their assistance on the case studies. Statement of Limitations The analysis contained in this document has been prepared by Pacific Land Resource Group Inc. (PLG) and is intended for the exclusive use of the NAIOP Vancouver. No other party is entitled to rely on any conclusions, data, opinions or other information contained in this document. Copyright Notice These materials are for the exclusive use of the NAIOP Vancouver Chapter who is permitted to reproduce the materials within the document for the Chapter s use and distribution to third parties. NAIOP VANCOUVER PACIFIC LAND GROUP iv
5 Preamble As part of our role in representing the owners, users and developers of Metro Vancouver s industrial land, we believe it is important that NAIOP provide some data, commentary and identification of some of the key factors that we believe are relevant in any discussion around Metro Vancouver s industrial land base. When we say Industrial land or use what do we really mean? In NAIOP s opinion, there are three key stakeholders who hold a different perspective on what Industrial land means: Port Metro Vancouver and Provincial/Federal Government agencies view industrial land as supporting a national system of exporting commodities to ensure Canada maintains its standard of living. Large parcels of land with the ability for outdoor storage located in close proximity to major transport routes are required in support of this goal; Municipalities and Quasi-Government authorities such as First Nations tend to view the industrial sector as a provider of well-paying jobs to support families and also as a user that pays high property taxes to support other needed public amenities; and The real estate development market sees industrial land as a flexible and cost effective means of creating buildings, lots, and turn-key options for tenants and end users, generating employment and allowing businesses to become established, and to generate employment. What is the Metro Vancouver region s current and future role in the global/national/regional goods movement chain? Canada is an exporting nation and British Columbia is net exporter of raw materials, despite our perception that we have evolved into a modern cosmopolitan region. A major portion of our primary exports today remain relatively unprocessed coal and grains (Port of Vancouver 2011 Statistics Overview), not manufactured and valueadded products. Metro Vancouver s industrial real estate market therefore predominantly serves the needs of the local economy (except for direct Port related functions). What is the effect of extremely high costs of industrial land? The high land costs faced by industrial users in Metro Vancouver are unique to most of North America, not just Canada. High land cost is a constraint for our market that will not go away for the foreseeable future due to the limited supply, geographical and topographical constraints, and pressure on the industrial land base from competing uses. This report identifies that we do not have enough available large sites (greater than 15 acres) for regional distribution uses as the economics simply do not work to NAIOP VANCOUVER PACIFIC LAND GROUP v
6 support these uses due to our high land costs; as a result Calgary, the Interior of British Columbia and/or Northern British Columbia have become the alternative for some types of industries. We can see how the market has responded to our high land costs when we look at the actual uses that take place on industrial zoned land in Metro Vancouver. There are several examples of businesses using industrial land that are actually serving office, sales and marketing functions and very few are purely manufacturing or traditional processing or assembly industrial uses. So although we have land called Industrial, the local market has addressed the high cost of land by creating more cost effective/intensively used space to allow businesses to function. How much land do we actually need and what types of land do we need the most? NAIOP believes strongly that the answers to these questions can only be determined through consultation with all of the regions stakeholders. We believe that it is necessary for all levels of government to foster the conditions to ensure that a sufficient supply of industrial land is available to the marketplace in the short to medium term, as land availability has been shown to drive absorption. Without the ability for end users to acquire land necessary for the establishment and growth of their business, some of these key job creators will be forced out, of necessity, to find alternative regions to meet their client needs, which in turn will only serve to reduce the overall economic prosperity of Metro Vancouver. This reality was also recognized in Metro Vancouver 2005 (and updated 2010) Industrial Land Inventory report: The amount of vacant industrial land in the inner (Vancouver and middle ring areas of the region is limited. Industrial land is needed in all sub regions in order to provide city serving industrial activities, a diversity of jobs, proximity to the labour force for commuting, and efficient use of goods movement infrastructure, including, road, rail, and barge. NAIOP VANCOUVER PACIFIC LAND GROUP vi
7 Executive Summary NAIOP Vancouver retained Pacific Land Resource Group Inc. (PLG) to provide a finer grained analysis of the report authored by Metro Vancouver entitled Market Readiness of Metro Vancouver Vacant Industrial Lands, dated August 2012, which was based on Metro Vancouver s November 2011 report entitled Metro Vancouver 2010 Industrial Lands Inventory. The 2012 Metro Vancouver report undertook a general assessment of the amount of industrial lands potentially available for development in Metro Vancouver both on a short term (before 2017) and long term basis. As the Metro Vancouver report specifically noted that an assessment was not completed on the potential constraints on development of the lands identified in the report, NAIOP Vancouver requested that PLG undertake a further review. The purpose of this review is twofold: to assess the development constraints of the lands Metro Vancouver classified as potentially available for developing in the short term; and to provide additional information to our members, key policy makers both in Metro Vancouver and other Provincial and Municipal authorities. The primary purpose of this analysis was to ensure that key policymakers such as Metro Vancouver are working with as accurate and realistic information database as possible to guide their decisions with regard to the industrial land base. NAIOP s interest is aligned with the region s interest in ensuring that the region retains the ability to support the expected future growth in employment both in the short to medium term and in the long term as well. NAIOP wants to foster an environment where discussions can take place between all stakeholders regarding regional level opportunities to secure future land supply along corridors where there is significant regional investment to improve goods movement infrastructure such as the South Fraser and North Fraser Perimeter Road projects. NAIOP is not in favour of the establishment of an Industrial Land Reserve (ILR) as we believe that this will severely limit the ability of the region to respond effectively to market forces and infrastructure changes and shift uses and transportation patterns over time. NAIOP believes that there is currently enough protection contained both within the Regional Growth Strategies as well as local municipal zoning to protect currently zoned and designated industrial lands. The methodology for this analysis consisted of assessing and categorizing the development potential of currently vacant industrial land parcels by the following constraints: Government/Quasi-Government owned; Dedicated as road; Current industrial use; Current non-industrial use; Environmentally-sensitive area; Unsuitable topography; Non-industrial designation; NAIOP VANCOUVER PACIFIC LAND GROUP vii
8 Servicing restrictions; and Isolated lots under 1.0 acre. 4,521 acres were identified in the Metro Vancouver report as available for industrial development before Of those, 792 acres consisted of isolated, non-contiguous individual parcels categorized as unavailable for short term development and therefore not included in the analysis. The remaining 3,729 acres were organized into 17 areas to assist in the analysis. Based on recent market information (not available to Metro Vancouver at the time of their 2012 report), an additional 241 acres were also included for a total of 3,970 acres. The analysis determined that 1,527 acres of land were impacted by at least one development constraint. Of the categories identified, Government or Quasi- Government ownership was the most prevalent restriction which encumbered 913 acres of land. This resulted in 2,443 acres of serviced, privately-owned land available for near team development. Based on the historical average of land absorption of 250 acres per year (as determined by Metro Vancouver using statistics from 2005 to 2010), the full 2,443 acres represent approximately a 10 to 12 year supply from This is only a potential supply constraint and could be offset by a number of factors and trends, both globally and locally. Local development economics could also add supply through the redevelopment of underutilized lands and designation of new lands that can all impact absorption and supply. The analysis also demonstrates that the availability of land for large distribution, regional contractors, food service and agricultural cold storage facilities, national and international logistics, e-commerce, and large scale manufacturing corporations is limited in the short to medium term. Additional industrial lands are considered to be available after To further explore this with the current marketplace, NAIOP, with the assistance of CBRE Ltd and Colliers International, undertook case studies (Section 6). We used parameters based on real demand from tenants currently looking for land in Metro Vancouver. Although the Metro Vancouver report indicates 4,521 acres of available industrial land in the region, this does not mean that all the properties available meet the needs of tenants or end users in the market. We found only a handful of sites that would meet the large distribution tenant s criteria. It is important to note that smaller industrial businesses and activities can be accommodated on smaller sites. NAIOP VANCOUVER PACIFIC LAND GROUP viii
9 1.0 Introduction Pacific Land Resource Group Inc. (PLG) was retained by NAIOP Vancouver to conduct a technical review, and provide a development analysis on lands identified as readily available for short/medium term development in the report entitled Market Readiness of Metro Vancouver Vacant Industrial Lands, issued in August 2012 (included herein as Appendix 1). The report released by Metro Vancouver in August 2012 builds on their previous report entitled Metro Vancouver 2010 Industrial Lands Inventory, and details 4,521 acres of industrial land as potentially available for development in the short/medium term (before 2017). This is a sub-set of the larger industrial inventory in the region. The Metro Vancouver region contains approximately 21,600 acres of developed industrial land and 6,600 acres of vacant industrial land, as of The Regional Growth Strategy designates and protects 25,370 acres of industrial land and 8,416 acres of mixed employment lands. The Metro Vancouver report noted that many designated industrial lands may not be fully available for free market development due to a number of restrictions, and contained the following statements: Note that these are high level estimates and are not necessarily indicative of the development potential of individual properties. Further review and consultation with municipalities is required to determine the development potential of specific sites. ; and The market readiness of vacant industrial land is a general assessment of the potential or probable availability and development timing of the lands. This does not include an assessment of all potential constraints on development. Properties included as market ready may still require further utility / infrastructure investments, rezoning and other development approvals, be hindered by factors such as location or accessibility, current uses, lot assembly, soil conditions, need for pre-loading, etc. 2.0 Terms of Reference PLG was retained by NAIOP to undertake a detailed analysis of the lands identified as vacant and available for development in the short term and to consider factors not included in the Metro Vancouver report. This analysis is to provide an additional layer of information to allow key policy makers to more accurately classify or designate vacant industrial lands development. PLG screened the lands identified as available for development in the short/medium term in the Market Readiness of Metro Vancouver Vacant Industrial Lands report, dated August 2012, based on the following constraints: Government/Quasi-Government owned; Dedicated as road; Current industrial use; Current non-industrial use; Environmentally-sensitive area; NAIOP VANCOUVER PACIFIC LAND GROUP 1
10 Unsuitable topography; Non-industrial designation; Servicing restrictions; and Isolated lots under 1.0 acre. The summary report is intended to provide supplementary information to document the realistic limitations of the development of industrial lands identified in the Metro Vancouver Report. This in turn will provide more accurate and reliable data to local and regional government policy makers and is intended to assist with determining need for additional supply to keep pace with the region s future growth. The findings of this summary report are current as of May Method of Analysis 4,521 acres were identified in the Metro Vancouver report as available for development before Of this, 792 acres consisted of isolated, non-contiguous individual parcels categorized as unavailable for short term development and therefore not included in the analysis. The remaining 3,729 acres were organized into 17 geographical sub regions to assist in the analysis. Based on recent market information (not available to Metro Vancouver at the time of their report in 2012), an additional 241 acres were also included for a total of 3,970 acres. The additional 241 acres included, 501 Boyd Street, New Westminster and a portion of Tsawwassen First Nation lands. This initial work allowed a finer detailed analysis of the key areas in Metro Vancouver with significant amounts of vacant industrial lands. The 17 sub-regions identified were: Burnaby; Campbell Heights, Surrey; Carvolth, Langley; Coquitlam; Cloverdale, Surrey; Delta; Gloucester, Langley; Highway 99 Corridor, Surrey; Maple Ridge; New Westminster; Newton/Panorama, Surrey; Pitt Meadows; Port Coquitlam; Richmond; South Westminster/Bridgeview, Surrey; Tsawwassen First Nation (TFN); and Vancouver Airport (YVR). In order to fully demonstrate the impact of each constraint, while allowing for simple categorization, lands were reviewed according to the significance of each constraint. The constraints, as defined below, are listed in order of importance 1 : 1. Government/quasi-government owned owned by a level of government (federal, provincial, regional, or municipal) or government-regulated organization (railways, transit, or crown corporation); 2. Dedicated as road land is currently dedicated as road; 3. Current industrial use permanent, market-supported industrial use is present; 4. Current non-industrial use permanent, market-supported non-industrial use is present; 5. Environmentally-sensitive area land impacted by riparian area regulations; 1 Contaminated lands was a category considered to screen properties; however, as none of the lands stated as available for development in the short/medium term appeared on the Treasury Board of Canada Secretariat s Federal Contaminated Sites Inventory, the constraint is not further referenced in the study. NAIOP VANCOUVER PACIFIC LAND GROUP 2
11 6. Unsuitable topography land encumbered by significant topographic considerations; 7. Non-industrial designation - land designation within a local area plan or official community plan that does not prescribe industrial use; 8. Servicing restrictions lots that are encumbered by the presence of, or restrictions to provide, services; and 9. Isolated lots under 1.0 acre one or more lots adjacent to each other that collectively do not measure over 1.0 acre in area. If 50% or more of a parcel was impacted by a constraint, then the entire parcel was considered to be encumbered. The remaining lands not encumbered by one or more of the constraints were classified as available for fee simple purchase (or lease for TFN) and development. Two examples of each constraint are provided to aid in understanding how the methodology was applied on actual lots, they include: 1. Government/quasi-government owned; a B Avenue, Surrey (figure 1) b Street, Surrey (figure 2) 2. Dedicated as road; a Avenue, Surrey (figure 3) b. 731 Lougheed Highway, Port Coquitlam (figure 4) 3. Current industrial use; a Avenue, Surrey (figure 5) b Croydon Drive, Surrey (figure 6) 4. Current non-industrial use; a No. 5 Road, Richmond (figure 7) b Street, Surrey (figure 8) 5. Environmentally-sensitive area; a Street, Surrey (figure 9) b Fraser Dyke Road, Pitt Meadows (figure 10) 6. Servicing Restrictions; a Street, Surrey (figure 11) b Scott Road, Surrey (figure 12) 7. Unsuitable topography; a Colebrook Road, Surrey (figure 13) b A Avenue, Surrey (figure 14) 8. Non-industrial designation; and a Scott Road, Surrey (figure 15) b. Harris Road, Pitt Meadows (figure 16) 9. Isolated lots under 1.0 acre. a No. 5 Road, Richmond (figure 17) b Kingston Road, Maple Ridge(figure 18) The detailed analysis of the 17 sub-regions can be found in figures 19 to 36. NAIOP VANCOUVER PACIFIC LAND GROUP 3


 and therefore is not as readily available for general market")
 1,527")

12 4.0 Planning and Development Constraint Analysis Based on the initial analysis of the 3,970 acres, it was determined thatt 1,527 acres of land were impacted by at least one of the developmentt constraints (see chart 1 below). One of the main development constraints is land owned by government or quasi-government agencies. This constraint is duee to the fact that land may be only available through uncertain leasehold arrangemen nts or reserved specifically for certain uses (such as direct port-related activity) and therefore is not as readily available for general market industrial use, fee simple purchase and development. Chart 1 Restricted Lands for Development Before 2017:(Including Government-owned) 1,527 ac Isolated Lots Under 1.0 Acre, 26 ac Unsuitable Topography, 19 ac Servicing Restrictions, 7 ac Non-Industriall Designation, 76 ac Current Non- Use, Environmentally- Area, 41 Industrial Sensitivee 163 ac ac Government/Qu asi-government Owned, 913 ac Current Industrial Use, 227 ac Dedicated as Road, 56 ac NAIOP VANCOUVER PACIFIC LAND GROUP 4


13 Chart 2 excludes the government-owned land constraint. By removing this constraint from the analysis, over half of the lands previously restricted are now considered available for development. This reduces the amount of lands impacted to 614 acres. Chart 2 Restricted Lands For Development Before 2017 (Excluding Government-owned): 614 ac Dedicated as Road, 56 ac Isolated Lots Under 1.0 Acre, 26 ac Current Industrial Use, 227 ac Unsuitable Topography, 19 ac Servicing Restrictions, 7 ac Environmenta ally- 41 Sensitive Area, ac Current Non- Use, Industrial 163 ac Non-Industrial Designation, 76 ac Chart 3 provides a graphical representation of the total lands available for development by municipality y. Surrey is shown as having the largest proportion of land available for development at 846 acres, with Delta offering the second largest amount of land available at 397 acres. Chart 3 has factored in land restricted by the Government-owned constraint, whereas chart 4 includes these lands. NAIOP VANCOUVER PACIFIC LAND GROUP 5
14 Chart 3 Lands Available for Development Before 2017 (Excluding Government-owned): 2,443 ac Surrey, 846 ac Richmond, 147 ac Port Coquitlam, 94 ac Pitt Meadows, 138 ac Tsawwassen, 327 New Westminster, 50 ac Maple Ridge, 54 ac Langley, 276 ac Delta, 397 ac Burnaby, 94 ac Coquitlam, 19 ac Chart 4 Lands Available for Development Before 2017 (Including Government-owned): 3,356 ac Surrey, 914 ac YVR, 331 ac Richmond, 444 ac Tsawwassen, 327 Port Coquitlam, 94 ac Pitt Meadows, 172 ac New Westminster, 64 ac Langley, 279 ac Delta, 492 ac Burnaby, 127 ac Coquitlam, 32 ac Maple Ridge, 79 ac NAIOP VANCOUVER PACIFIC LAND GROUP 6
15 5.0 Lot Size Distribution Analysis As previously noted, some lands classified as government/quasi-government owned are owned by Port Metro Vancouver and are not available for fee simple purchase and development. For the Port owned lands, while certain industrial uses that directly support Port-related activity may be considered by the Port, other non-port related industrial uses would likely be excluded. Of the 327 acres within the Tsawwassen First Nation lands (TFN) that have been designated for industrial use, 200 acres are planned for warehouse distribution uses (see figure 35). For the purposes of this part of the analysis, it was assumed that reasonable market-based lease arrangements are possible to obtain for development of these lands. Including the 327 acres of TFN lands, 2,443 acres are identified as available for development in Chart 3. These lands have been further broken down into 474 individual parcels, with an average lot size of 5.15 acres. The lands were then organized into five lot size categories by acreage ranges. Table 1 lists the distribution of acres based on lot size and typical use and chart 5 graphically represents the data. Table 1 Lot Size Distribution Lot Size (acres) # of Lots Lot % of Total # of Acres Acre % of Total Typical Users Small owner/occupiers Small to medium size manufacturers Regional contractors, cold storage facilities and developers Large manufacturers, transportation companies, and developers National and international logistics, e-commerce, manufacturing corporation, and developers Total: The greatest source of available land, 1,250 acres, is from lots that are 15 acres and greater in size; however, these lands are distributed amongst 34 parcels. Conversely, the largest number of lots, 373, can be found with lot areas between 0 and 5 acres, occupying a total of 645 acres. Within this category are 137 lots that are less than 1 acre in size, representing 44 acres in total. NAIOP VANCOUVER PACIFIC LAND GROUP 7
16 Small-sized lots (0-5 acres) are typically intended for small owner/occupiers with limited building area and truck-turning access requirements; however, the lots identified within this study are largely encumbered by additional restrictions not easily met by owner/occupiers. Specifically, lots with incorrect zoning, requiring new or upgraded services, require specific knowledge beyond the scope of a typical industrial user, in order to solve the restrictions. Therefore, these users typically locate in larger industrial parks that provide a turn-key solution with a building already constructed and ready to use. Medium-sized lots (5-15 acres) are generally occupied by manufacturers, regional contractors, and users such as cold storage facilities serving the storage and distribution operations of our food services and agricultural industries. These types of users typically allocate a majority of their property for buildings and serve the metropolitan areas in which they are located. There are only 67 lots of this size available. Currently only 16 lots are in the 15 to 30 acre range that can offer potential options for large manufacturers and transportation companies. Lot sizes in excess of 30 acres are needed to attract national and international logistics, e-commerce, and medium to large scale manufacturing corporations to Metro Vancouver. Currently, only 18 lots are in excess of 30 acres in size. Chart 5 Parcel Size Breakdown of Lands Available for Development (Total: 2443 Ac) Acres, 173 ac Acres, 354 ac 5 10 Acres, 374 ac 30+ Acres, 896 ac 0 5 Acres, 645 ac As reported in the Metro Vancouver 2010 Industrial Lands Inventory, an average of approximately 250 acres of industrial land was absorbed annually in the 2005 to 2010 period. However, as cited in the report entitled Industrial Lands Inventory for Greater Vancouver 2005, published in 2006, historic trends and input from the brokerage industry have generally suggested that historic rates of industrial land absorption are NAIOP VANCOUVER PACIFIC LAND GROUP 8
17 between 320 to 400 acres per year (see absorption data from 2008 to 2012 provided by Realnet in Figure 37). At an absorption of 320 to 400 acres per year (as stated in Industrial Lands Inventory for Greater Vancouver 2005 ) and with no change in fundamental development economics such as increases in effective lease rates or reductions in development costs, the 2,443 acres represents a supply of only 6 to 9 years. At 250 acres per year absorption this represents a 10 to 12 year supply. Certain market segments within the 10 acre and larger parcel sizes could potentially be exhausted sooner depending on whether the economics work for these types of users (see Preamble for a discussion on high land cost constraints). In reality, the 44 acres available in lot sizes of 0 1 acre, as well as a portion of the 601 acres available in lot sizes of 1 5 acres, will be challenging to be absorbed by the market because of the obstacle of acquiring multiple, privatelyowned lots and consolidating them. 6.0 Case Studies The analysis noted the limited availability for lots in the acre range for large manufacturers and transportation companies and parcels in excess of 30 acres to meet the needs of national and international logistics, e-commerce, and medium to large scale manufacturing corporations in Metro Vancouver. As a result NAIOP wanted to undertake a current market test of national tenants in our market. NAIOP enlisted the services of CBRE Ltd and Colliers International to assist in these case studies. While the results of our analysis identifies that 2,443 acres are potentially available for development before 2017, this does not necessarily mean we have the contiguous parcels required to meet the demands of the market. Nor does it mean the lands that are available meet the needs of today s tenants. Tenants are demanding proximity to major highways, labour pools, public transportation and amenities. As the results of these two case studies show, the options available to Tenants are very limited in our marketplace. This supports the need for regional-level discussions between all stakeholders regarding opportunities to identify and secure future lands supply. The case studies below assumed a time frame for delivery of the facility to the tenant of 18 to 24 months. It should be noted that this time frame is the fastest that Metro Vancouver can typically deliver on new construction. Other competing markets (Calgary and Toronto) are able to deliver within a 12 to 18 month timeframe. This is mostly due to the fact that our permit approval process takes longer, and our sites generally require more preparation. NAIOP VANCOUVER PACIFIC LAND GROUP 9
18 Case Study #1 Requirements: Company requiring 300,000 square feet of building area for a light manufacturing operation; The site size required is approximately 20 acres of net useable land; Timing for occupancy of the building is 18 to 24 months; and Ownership options to lease or own. Results: Total of eight options were found on the market within Metro Vancouver; four of the options were available for purchase, and four not available in the time frame required with two available on a land sale basis and the other options requiring a construction contract with a developer for the building; Five of the options had public transportation within 400 m to 800 m; and Five of the options had highway access within 3 km. Properties Reviewed for Case Study #1 Area Sale Lease Rail Service Timing Boundary Bay Industrial Park, Delta 47 Yes Yes None Q Derwent Way, Delta 23 No Yes SRY Q Boyd Street, New Westminster 40 No Yes SRY Q Canfor Avenue, New Westminster 40 No Yes BN Q Golden Ears Business Centre, Pitt Meadows Oxford Burnaby Site, Burnaby (former Norampac Mill Site) 62 No Yes None 12 Mths 64 No Yes CN Q Glenlyon Business Park, Burnaby 69 Yes No None Mths Fraser Richmond Lands 70+ No Yes CN On hold Gloucester NE Quadrant, Langley 100 Yes Yes None Mths Campbell Heights North, Surrey 185 Yes Yes None 18 Mths TFN, Delta 294 No Yes Yes Q NAIOP VANCOUVER PACIFIC LAND GROUP 10
19 Case Study #2 Requirements: Company requiring 800,000 square feet of building for distribution operation; The site size required is approximately 40 acres of net useable land; Timing for occupancy is 18 to 24 months; and Ownership options to lease or own. Results: Total of four options were found on the market within Metro Vancouver; Two of the options would be available on a land sale basis. The other two were lease only; and All options had close access to public transportation and Highways. Properties Reviewed for Case Study #2 Area Sale Lease Rail Service Timing Boundary Bay Industrial Park, Delta 47 Yes Yes None Q Boyd Street, New Westminster 40 No Yes SRY Q Golden Ears Business Centre, Pitt Meadows Oxford Burnaby Site, Burnaby (former Norampac Mill Site) 62 No Yes None 12 Mths 64 No Yes CN Q Glenlyon Business Park, Burnaby 69 Yes No None Mths Fraser Richmond Lands 70+ No Yes CN On hold Campbell Heights North, Surrey 185 Yes Yes None 18 Mths TFN, Delta 294 No Yes Yes Q Chatterton Lands, Delta 110 No Yes BN/CN (est) 7.0 Conclusion Vacant industrial land in Metro Vancouver is experiencing diminished available inventory year over year as steady absorption continues to outpace market ready supply of developable land. Based on the best case of historical absorption figures, with no change in fundamental development economics these lands could represent less than a decade supply of general industrial land and potentially far less supply for lands serving regional and national scale users. NAIOP VANCOUVER PACIFIC LAND GROUP 11
20 The primary purpose of this analysis was to ensure an accurate and realistic database of lands so that key policymakers such as Metro Vancouver are working with an accurate and realistic information database as possible to guide their decisions with regard to industrial lands. NAIOP is not in favour of the establishment of an Industrial Land Reserve (ILS) as we believe that this will severely limit the ability of the region to respond effectively to market forces and infrastructure changes and shifting uses and transportation patterns over time. NAIOP believes that there is currently enough protection contained both within the Regional Growth Strategies as well as local municipal zoning to protect currently zoned and designated industrial land. NAIOP s interest is aligned with the region s interest in ensuring that the region retains the ability to support the expected future growth in employment both in the short to medium term and in the coming decades. While this report was limited in its scope to a review of the Metro Vancouver Industrial Land Inventory, we believe there are a number of other areas of investigation that should be examined by Metro Vancouver policy makers from a regional perspective to facilitate an informal, open discussion on this issue. A key consideration in any discussions should be consideration of the land use impacts and opportunities arising from the significant regional investment to improve our goods movement infrastructure, such as the South Fraser and North Fraser Perimeter Road projects. While this study reviewed only the 4,521 acres identified in the Metro Vancouver Industrial Land Inventory (see appendix 1) as available (for development) before 2017, we believe it is also appropriate to note that the 2012 Metro Vancouver Market Readiness Exercise also identifies 1,988 acres listed as available in 2017 or after (for development). One of the larger areas within the second category is Maple Ridge s collection of lands in the Golden Ears area. This area represents 649 acres, or 33% of the total lands available after It should be noted that this area is limited by current services, topographic constraints, and lengthy travel distance to major highway and market access constraints. NAIOP VANCOUVER PACIFIC LAND GROUP 12
21 FIGURE 1 GOVERNMENT/QUASI-GOVERNMENT OWNED B AVENUE, SURREY NAIOP VANCOUVER PACIFIC LAND GROUP 13
22
23 FIGURE 2 GOVERNMENT/QUASI-GOVERNMENT OWNED STREET, SURREY NAIOP VANCOUVER PACIFIC LAND GROUP 14

24
25 FIGURE 3 DEDICATED AS ROAD AVENUE, SURREY NAIOP VANCOUVER PACIFIC LAND GROUP 15

26
27 FIGURE 4 DEDICATED AS ROAD 731 LOUGHEED HIGHWAY, PORT COQUITLAM NAIOP VANCOUVER PACIFIC LAND GROUP 16

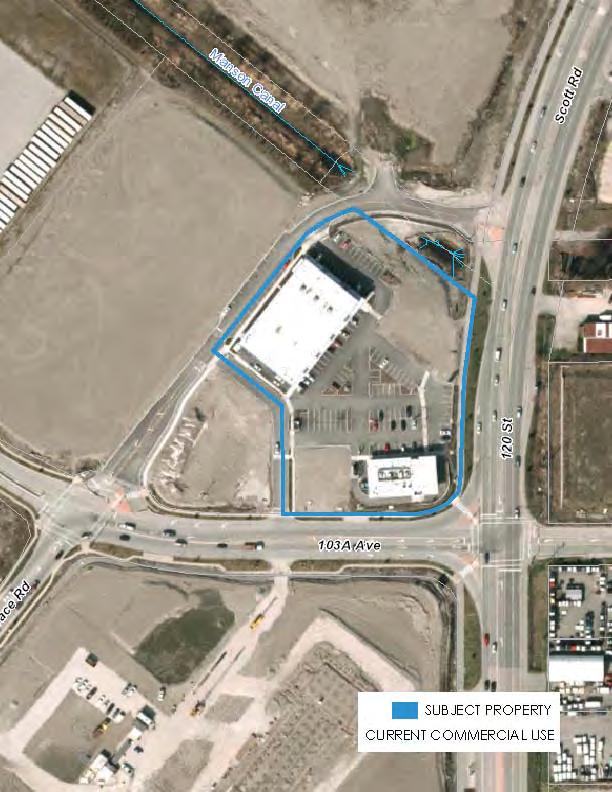
28 SUBJECT PROPERTY
29 FIGURE 5 CURRENT INDUSTRIAL USE AVENUE, SURREY NAIOP VANCOUVER PACIFIC LAND GROUP 17
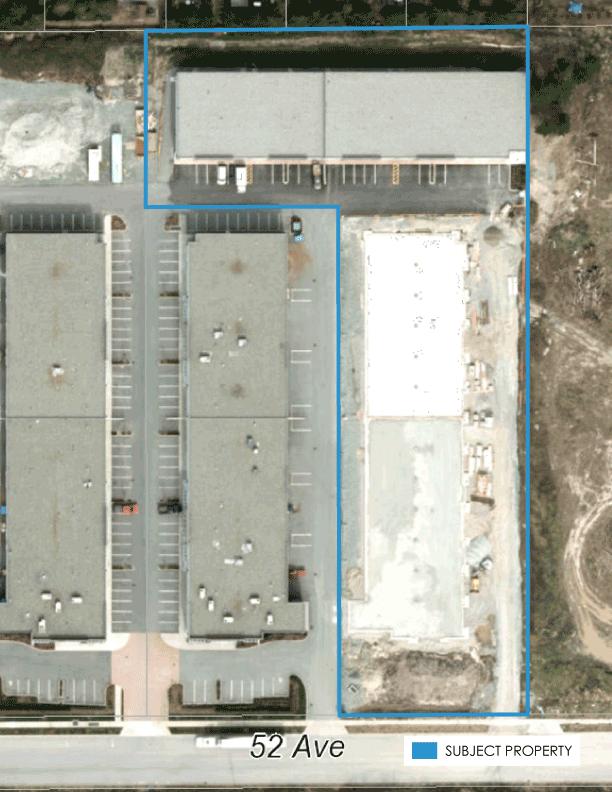
30
31 FIGURE 6 CURRENT INDUSTRIAL USE 2626 CROYDON DRIVE, SURREY NAIOP VANCOUVER PACIFIC LAND GROUP 18

32
33 FIGURE 7 CURRENT NON-INDUSTRIAL USE NO. 5 ROAD, RICHMOND NAIOP VANCOUVER PACIFIC LAND GROUP 19

34 SUBJECT PROPERTY CURRENT SINGLE-FAMILY USE
35 FIGURE 8 CURRENT NON-INDUSTRIAL USE STREET, SURREY NAIOP VANCOUVER PACIFIC LAND GROUP 20
36
37 FIGURE 9 ENVIRONMENTALLY-SENSITIVE AREA STREET, SURREY NAIOP VANCOUVER PACIFIC LAND GROUP 21
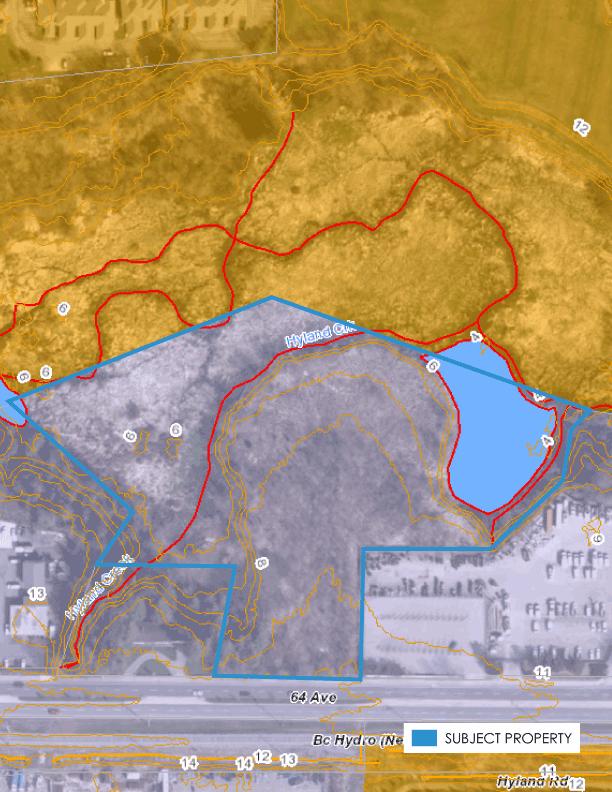
38
39 FIGURE 10 ENVIRONMENTALLY-SENSITIVE AREA FRASER DYKE ROAD, PITT MEADOWS NAIOP VANCOUVER PACIFIC LAND GROUP 22

40 SUBJECT PROPERTY
41 FIGURE 11 SERVICING RESTRICTIONS STREET, SURREY NAIOP VANCOUVER PACIFIC LAND GROUP 23

42
43 FIGURE 12 SERVICING RESTRICTIONS SCOTT ROAD, SURREY NAIOP VANCOUVER PACIFIC LAND GROUP 24
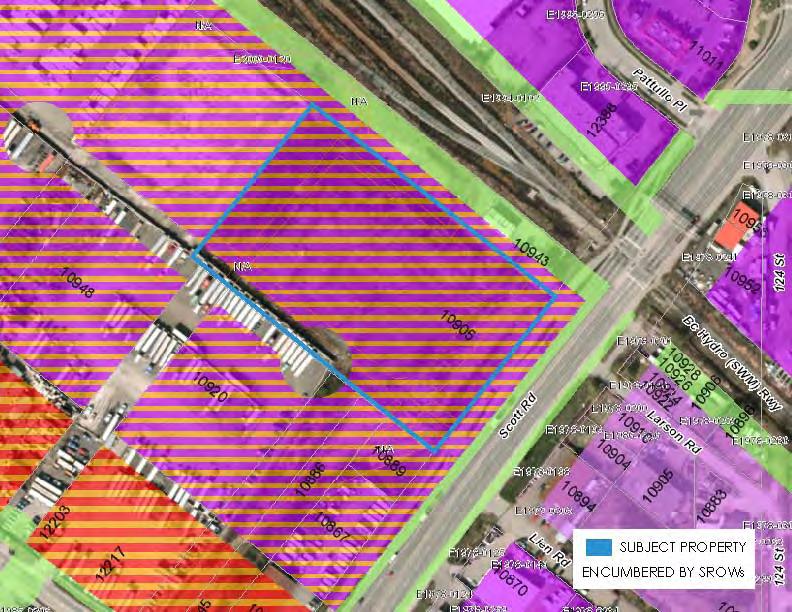
44
45 FIGURE 13 UNSUITABLE TOPOGRAPHY COLEBROOK ROAD, SURREY NAIOP VANCOUVER PACIFIC LAND GROUP 25

46
47 FIGURE 14 UNSUITABLE TOPOGRAPHY A AVENUE, SURREY NAIOP VANCOUVER PACIFIC LAND GROUP 26
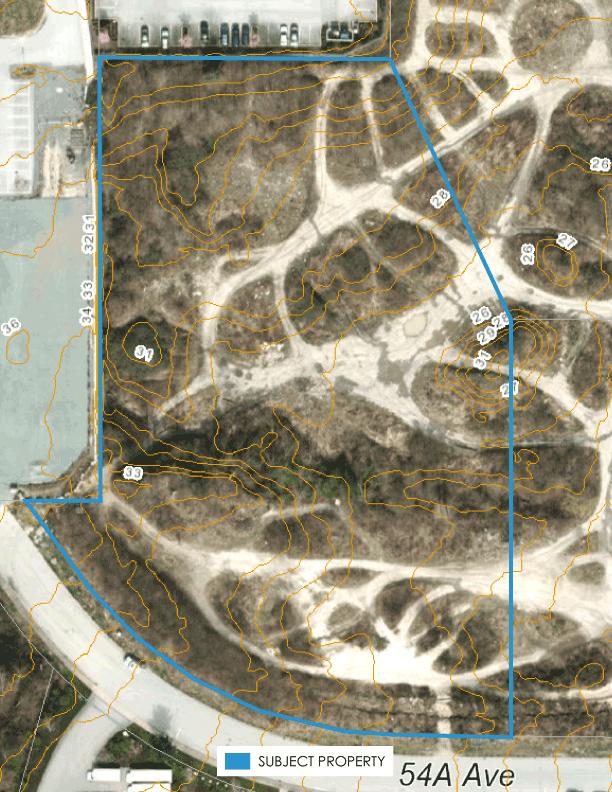
48
49 FIGURE 15 NON-INDUSTRIAL DESIGNATION SCOTT ROAD, SURREY NAIOP VANCOUVER PACIFIC LAND GROUP 27
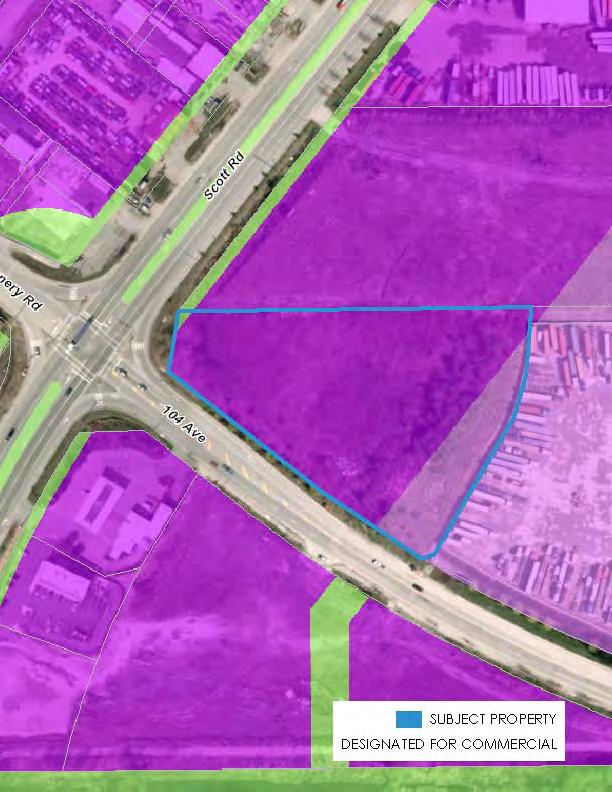
50
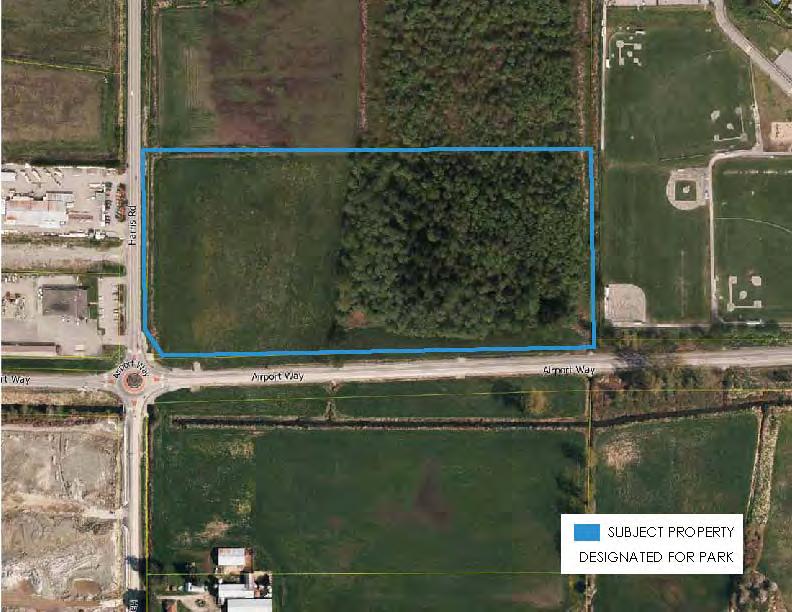
51 FIGURE 16 NON-INDUSTRIAL DESIGNATION HARRIS ROAD, PITT MEADOWS NAIOP VANCOUVER PACIFIC LAND GROUP 28
52
53 FIGURE 17 ISOLATED LOTS UNDER 1.0 ACRE NO. 5 ROAD, RICHMOND NAIOP VANCOUVER PACIFIC LAND GROUP 29

54 SUBJECT PROPERTY
55 FIGURE 18 ISOLATED LOTS UNDER 1.0 ACRE KINGSTON ROAD, MAPLE RIDGE NAIOP VANCOUVER PACIFIC LAND GROUP 30
56 SUBJECT PROPERTY
57 FIGURE INDUSTRIAL LANDS INVENTORY METRO VANCOUVER NAIOP VANCOUVER PACIFIC LAND GROUP 31
58 0 5 Kilometers 10 1:250,000 Government/Quasi-Government Owned Current Industrial Use Non-Industrial Designation Isolated Lots Under 1.0 Acre Environmentally-Sensitive Area Lands Available for Development Dedicated as Road Current Non-Industrial Use Unsuitable Topography Servicing Restrictions Lands Available Before 2017 (not reviewed) Lands Available in 2017 or After 2.5 UEL West Vancouver Tsawwassen First Nation Richmond Vancouver City of North Vancouver Delta Burnaby District of North Vancouver 2012 Industrial Land Inventory - Metro Vancouver New Westminster Belcarra Coquitlam Port Moody Anmore White Rock Surrey Port Coquitlam City of Langley Pitt Meadows Township of Langley Maple Ridge
59 FIGURE INDUSTRIAL LANDS INVENTORY BURNABY NAIOP VANCOUVER PACIFIC LAND GROUP 32
60 2012 Industrial Land Inventory - Burnaby Metro Vancouver Estimate of Lands Available Before 2017: ac Government/Quasi-Government Owned: ac Current Industrial Use: ac Non-Industrial Designation: 6.06 ac Isolated Lots Under 1.0 Acre: 0.86 ac Lands Available for Development: ac Meters ,000 1:30,000
61 FIGURE INDUSTRIAL LAND INVENTORY CAMPBELL HEIGHTS, SURREY NAIOP VANCOUVER PACIFIC LAND GROUP 33
62 2012 Industrial Land Inventory - Campbell Heights, Surrey Metro Vancouver Estimate of Lands Available Before 2017: ac Government/Quasi-Government Owned: 4.25 ac Current Industrial Use: ac Current Non-Industrial Use: ac Lands Available for Development: ac Meters 1:20,
63 FIGURE INDUSTRIAL LAND INVENTORY CARVOLTH, LANGLEY NAIOP VANCOUVER PACIFIC LAND GROUP 34
64 2012 Industrial Land Inventory - Carvolth, Langley Metro Vancouver Estimate of Lands Available Before 2017: ac Government/Quasi-Government Owned: 3.26 ac Current Industrial Use: ac Environmentally-Sensitive Area: 5.84 ac Non-Industrial Designation: 1.58 ac Isolated Lots Under 1.0 Acre: 1.27 ac Lands Available for Development: ac Meters ,000 1:20,000
65 FIGURE INDUSTRIAL LAND INVENTORY CLOVERDALE, SURREY NAIOP VANCOUVER PACIFIC LAND GROUP 35
66 2012 Industrial Land Inventory - Cloverdale, Surrey Metro Vancouver Estimate of Lands Available Before 2017: ac Government/Quasi-Government Owned: 2.41 ac Current Industrial Use: 2.44 ac Non-Industrial Designation: 2.85 ac Current Non-Industrial Use: 0.30 ac Isolated Lots Under 1.0 Acre: 4.07 ac Lands Available for Development: ac Meters ,000 1:25,000
67 FIGURE INDUSTRIAL LAND INVENTORY COQUITLAM NAIOP VANCOUVER PACIFIC LAND GROUP 36
68 2012 Industrial Land Inventory - Coquitlam Metro Vancouver Estimate of Lands Available Before 2017: ac Government/Quasi-Government Owned: ac Isolated Lots Under 1.0 Acre: 1.49 ac Lands Available for Development: ac Meters :20,000
69 FIGURE INDUSTRIAL LAND INVENTORY DELTA NAIOP VANCOUVER PACIFIC LAND GROUP 37
70 2012 Industrial Land Inventory - Delta Metro Vancouver Estimate of Lands Available Before 2017: ac Government/Quasi-Governmental Owned: ac Dedicated as Road: ac Current Industrial Use: ac Isolated Lots Under 1.0 Acre: 1.18 ac Lands Available for Development: ac Meters ,500 1:40,000 currently government-owned
71 FIGURE INDUSTRIAL LAND INVENTORY GLOUCESTER, LANGLEY NAIOP VANCOUVER PACIFIC LAND GROUP 38
72 2012 Industrial Land Inventory - Gloucester, Langley Metro Vancouver Estimate of Lands Available Before 2017: ac Current Industrial Use: ac Non-Industrial Use: 0.30 ac Environmentally-Sensitive Area: 5.37 ac Non-Industrial Designation: 8.21 ac Isolated Lots Under 1.0 Acre: 0.60 ac Lands Available for Development: ac Meters :15,000
73 FIGURE INDUSTRIAL LAND INVENTORY HIGHWAY 99 CORRIDOR, SURREY NAIOP VANCOUVER PACIFIC LAND GROUP 39
74 2012 Industrial Land Inventory - Highway 99 Corridor, Surrey Metro Vancouver Estimate of Lands Available Before 2017: ac Government/Quasi-Government Owned: 3.15 ac Current Industrial Use: 6.18 ac Current Non-Industrial Use: ac Non-Industrial Designation: 1.61 ac Isolated Lots Under 1.0 Acre: 0.94 ac Lands Available for Development: ac Meters :15,000
75 FIGURE INDUSTRIAL LAND INVENTORY MAPLE RIDGE NAIOP VANCOUVER PACIFIC LAND GROUP 40
76 2012 Industrial Land Inventory - Maple Ridge Metro Vancouver Estimate of Lands Available Before 2017: ac Government/Quasi-Government Owned: ac Non-Industrial Use: 1.77 ac Isolated Lots Under 1.0 Acre: 0.61 ac Lands Available for Development: ac Meters :10,000
77 FIGURE INDUSTRIAL LAND INVENTORY NEW WESTMINSTER NAIOP VANCOUVER PACIFIC LAND GROUP 41
78 2012 Industrial Land Inventory - New Westminster Metro Vancouver Estimate of Lands Available Before 2017: ac Government/Quasi-Government Owned: ac Current Industrial Use: ac Isolated Lots Under 1.0 Acre: 1.53 ac Lands Available for Development: ac Meters ,000 1:30,000
79 FIGURE INDUSTRIAL LAND INVENTORY NEWTON/PANORAMA, SURREY NAIOP VANCOUVER PACIFIC LAND GROUP 42
80 2012 Industrial Land Inventory - Newton/Panorama, Surrey Metro Vancouver Estimate of Lands Available Before 2017: ac Government/Quasi-Government Owned: 5.14 ac Current Industrial Use: 1.44 ac Environmentally-Sensitive Area: ac Non-Industrial Designation: 5.04 ac Unsuitable Topography: ac Lands Available for Development: ac Meters :15,000
81 FIGURE INDUSTRIAL LAND INVENTORY PITT MEADOWS NAIOP VANCOUVER PACIFIC LAND GROUP 43
82 2012 Industrial Land Inventory - Pitt Meadows Metro Vancouver Estimate of Lands Available Before 2017: ac Government/Quasi-Government Owned: ac Dedicated as Road: 1.22 ac Current Industrial Use: ac Environmentally-Sensitive Area: ac Non-Industrial Designation: ac Lands Available for Development: ac Meters :25,000
83 FIGURE INDUSTRIAL LAND INVENTORY PORT COQUITLAM NAIOP VANCOUVER PACIFIC LAND GROUP 44
84 2012 Industrial Land Inventory - Port Coquitlam Metro Vancouver Estimate of Lands Available Before 2017: ac Dedicated as Road: 2.01 ac Current Industrial Use: 4.63 ac Current Non-Industrial Use: ac Lands Available for Development: ac Meters :15,000
85 FIGURE INDUSTRIAL LAND INVENTORY RICHMOND NAIOP VANCOUVER PACIFIC LAND GROUP 45
86 2012 Industrial Land Inventory - Richmond Metro Vancouver Estimate of Lands Available Before 2017: ac Government/Quasi-Government Owned: ac Dedicated as Road: 0.07 ac Non-Industrial Use: 0.90 ac Environmentally-Sensitive Area: 2.02 ac Isolated Lots Under 1.0 Acre: 1.15 ac Lands Available for Development: ac Meters ,500 1:35,000
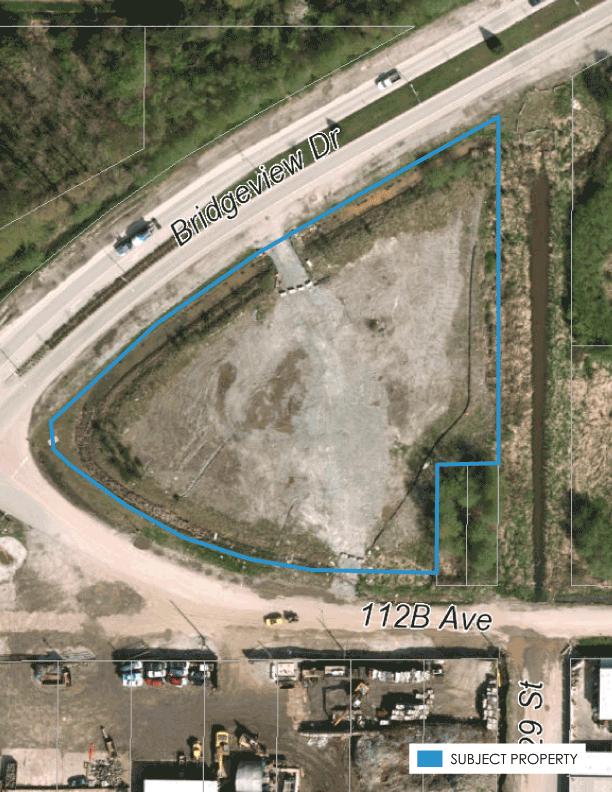
87 FIGURE INDUSTRIAL LAND INVENTORY SOUTH WESTMINSTER/BRIDGEVIEW, SURREY NAIOP VANCOUVER PACIFIC LAND GROUP 46
88 2012 Industrial Land Inventory - South Westminster/Bridgeview, Surrey Metro Vancouver Estimate of Lands Available Before 2017: ac Government/Quasi-Government Owned: ac Dedicated as Road: 5.89 ac Current Industrial Use: ac Current Non-Industrial Use: 5.20 ac Non-Industrial Designation: ac Servicing Restrictions: 6.81 ac Isolated Lots Under 1.0 Acre: ac Lands Available for Development: ac Meters ,000 1:20,000
89 FIGURE INDUSTRIAL LAND INVENTORY TSAWWASSEN FIRST NATION NAIOP VANCOUVER PACIFIC LAND GROUP 47
90 2012 Industrial Land Inventory - Tsawwassen First Nation Metro Vancouver Estimate of Lands Available Before 2017: ac Non-Industrial Designation: 2.21 ac Lands Available for Development*: ac *current servicing limitations Meters 1:10,
91 FIGURE INDUSTRIAL LAND INVENTORY YVR NAIOP VANCOUVER PACIFIC LAND GROUP 48
92 2012 Industrial Land Inventory - YVR Metro Vancouver Estimate of Lands Available Before 2017: ac Government/Quasi-Government Owned: ac Meters ,000 1:25,000
93 FIGURE 37 INDUSTRIAL LAND SALES NAIOP VANCOUVER PACIFIC LAND GROUP 49
94 Industrial Land Sales Total Total acres sold Total acres sold Total acres sold Total acres sold Total acres sold Abbotsford Burnaby Chilliwack Coquitlam Delta Langley Maple Ridge Mission New Westminster North Vancouver Pitt Meadows Port Coquitlam Port Moody Richmond Surrey Vancouver Grand Total Average per year * data provided by Realnet
95 APPENDIX A METRO VANCOUVER S MARKET READINESS OF METRO VANCOUVER VACANT INDUSTRIAL LANDS, AUGUST 2012 NAIOP VANCOUVER PACIFIC LAND GROUP 50
96 Market Readiness of Metro Vancouver Vacant Industrial Lands For the year 2010, Metro Vancouver completed an inventory (vacant and developed) of industrial lands in the region. 1 As part of further analyzing the vacant industrial land supply, factors which impact industrial development potential were explored. This included the potential development timing of the land or market readiness. The market readiness of vacant industrial land is a general assessment of the potential or probable availability and development timing of the lands. This does not include an assessment of all potential constraints on development. Properties included as market ready may still require further utility / infrastructure investments, rezoning and other development approvals, be hindered by factors such as location or accessibility, current uses, lot assembly, soil conditions, need for pre-loading, etc. The following two categories of market readiness timing were used: Short/Medium Term (within 5 years from January 2012 / before 2017) Long Term (5+ years from January 2012 / 2017 & after) In order to assist with the market readiness exercise, Metro Vancouver staff firstly consulted with industrial brokers, developers, and consultants to confirm the relevant and practical criteria to estimate the market readiness of industrial lands. Secondly, with these criteria and definition, Metro Vancouver distributed to municipalities maps illustrating their vacant industrial lands (excluding rail and port lands) and received structured responses to each criteria which may impact the potential market readiness of vacant industrial lands. The assessment was completed as a general overview of larger industrial areas, not as a parcel by parcel review of individual lands. The following criteria were considered when estimating the development potential / market readiness of vacant industrial lands (or areas): Servicing - Water Infrastructure Servicing - Sewer Infrastructure Municipal Industrial Zoning Municipal Industrial OCP / NCP Designation Based on these and any other relevant factors, municipalities were asked to estimate the likelihood of the vacant industrial lands being available for development as typical industrial uses within the next 5 years (as of early 2012) 2. It is recognized that this exercise includes certain subjectivity and professional judgement was required to consider if the criteria are adequately in place to likely allow development. Further, it is recognized that other factors, such as site constraints or land ownership patterns, may limit the development potential and timing of lands. Summary findings reflecting the estimated likelihood of vacant industrial lands being available for development as typical industrial uses within the next 5 years are shown in the following tables and charts. Note that these are high level estimates and are not necessarily indicative of the development potential of individual properties. Further review and consultation with municipalities is required to determine the development potential of specific sites. 1 Metro Vancouver 2010 Industrial Lands Inventory, November 15, 2011, available at: 2 Some lands that were reported as 'vacant' in the 2010 Industrial Land Inventory (ILI) have since been removed from the Industrial Land Inventory (ILI) at the request of municipal planning staff.
97 Industrial Lands Market Readiness by Municipality Municipality Short / Medium Term 1 Before 2017 (Acres) Long Term & After (Acres) Total Vacant 2011 Industrial Land Inventory 3 Burnaby Coquitlam Delta Langley City 8-8 Langley Township Maple Ridge New West North Vancouver City North Vancouver District Pitt Meadows Port Coquitlam Port Moody Richmond Surrey 1, ,279 Tsawwassen First Nation Vancouver Metro Vancouver 4,521 1,988 6,509 Industrial Lands Market Readiness by Subregion Subregion Short / Medium Term 1 Before 2017 (Acres) Long Term & After (Acres) Total Vacant 2011 Industrial Land Inventory 3 North Shore Vancouver Burnaby/New West Northeast Sector Richmond Delta / TFN ,066 Surrey/White Rock 1, ,279 Langleys Ridge-Meadows ,008 Metro Vancouver 4,521 1,988 6,509 Notes 1 Short/Medium Term - lands which are likely to be developed for typical industrial uses before Long Term - lands which are likely to be developed for typical industrial uses at some point in 2017 or thereafter. 3 Some lands that were reported as 'vacant' in the 2010 Industrial Land Inventory (ILI) have since been removed from the Industrial Land Inventory (ILI) at the request of municipal planning staff.
98 Metro Vancouver Vacant Industrial Lands - Market Readiness Land Area (acres) 1,800 1,600 1,400 1,200 1, Before & After
99 Market Readiness - Before 2017 (4,521 acres) Langleys, 395 ac, 9% Surrey/White Rock, 1,560 ac, 34% Delta / TFN, 708 ac, 16% Richmond, 841 ac, 19% Ridge-Meadows, 359 ac, 8% North Shore, 59 ac, 1% Vancouver, 67 ac, 1% Burnaby/New West., 349 ac, 8% Northeast Sector, 183 ac, 4% Market Readiness & After (1,988 acres) Langleys, 168 ac, 8% Ridge-Meadows, 649 ac, 33% Richmond, 94 ac, 5% Surrey/White Rock, 719 ac, 36% Delta / TFN, 358 ac, 18%

100 248th St 184th St No 1 Rd Arthur D r 140th St 128th St Knight St Rupert St Patterson Ave Royal Oak Ave Caledonia Ave North Rd 144th St Willingdon Ave Scott Rd Elgin Rd Mariner W ay Coast M eridian Rd 208th St 192nd St Harris Rd 204th St 216th St 210th St 264th St 272nd St 272nd St Market Readiness of Vacant Industrial Lands in Metro Vancouver Cypress Bowl Rd West Vancouver Marine Dr Queens Ave 21st St 15th St Mathers Ave Eyremount Dr!(!( 99 1A Southborough Dr Stevens Dr Capilano Rd Marine Dr Capilano Rd Edgemont Blvd Montroyal Blvd Highland Blvd W 16th St W Queens R d Westview Dr Delbrook Av e Lonsdale Ave North Vancouver City E 29th St Grand Blvd E Keith Rd E 3rd St Lynn Valley Rd Mountain Hwy Mountain Hwy E Keith Rd Cotton Rd Dempsey Rd Main St!( 1 North Vancouver District Mt Seym our Pky Deep C ove Rd N D ollarton Hw y Belcarra Anmore Plateau Blvd Plateau Blvd Fraser Valley Regional District Dollarton Hwy Ioco Rd NW Marine Dr Wesbrook Mall Wesbrook Mall Chancellor Blvd University Blvd UEL/ Electoral Area A W 10th Ave SW M arine D r!ä Alm a St W 16th Ave Dunbar St Dunbar St MacKenzie St MacDonald St MacDonald St International Arrivals W 4th Ave East Blvd W 49th Ave No 2 Rd Bridge Arbutus St Arbutus St Burrard St W King Edward Av e!( 99 Grant McConachie Way Russ Baker Way Denman St Beach Ave W Broadw ay Granville St Miller R d No 3 Rd Davie St Pacific St Robson St Oak St Burrard St Pacific Blvd W 6th Ave W King Edward Ave W 70th Ave Sea Island W ay Smithe St Nelson St W 41s t Ave Cambie St Alderbridge Way Dunsm uir St W Georgia St W 16th Ave No 4 Rd W 2nd Av e Expo Blvd W Broadw ay SW M arine D r!( 1A!( 7A!(7A Fraser St Clark Dr Vancouver Shell Rd Quebec St E 2nd Ave Main St Main St Pow ell St E 16th Ave Richm ond Fwy Prior St Terminal Ave Great Northern Way E 41st Ave Fraser St Bridgeport Rd No 5 Rd E 12th Ave E King Edw ard Ave Knight St SE Marine Dr Knight St Bridge Knight St Venables St Argyle St Commercial Dr Victoria Dr Victoria Dr Argyle Dr Dundas St!( 7 Nanaimo St Renfrew St S Grandview Hwy SE Marine Dr McGill St Renfrew St E 49th Ave Kerr St E 1st Ave E 29th Ave Rupert St highway ramp Rupert St Rupert St Joyce St Westminster Hwy E 49th Av e Boundary Rd!( 91 Moscrop St Rumble St Greenall Ave Parker St Willingdon Ave Imperial St!( 1 Parker St Imperial St Marine W ay Canada W ay Gilpin St Deer Lake Pky Marine Dr!( 1A Sprott St 99A Sperling Ave!( 7 Burnaby Byrne Rd Curtis St Kensington Ave Canada W ay Rumble St Southridge Dr Westminster Hwy Broadw ay Griffiths Dr Burnaby Mountain Pky Canada W ay Southridge Dr Marine Dr 20th St 7th Ave!( 91 10th Ave Marine W ay 91A Boyd St 8th St 6th St SF PR Gaglardi Way 6th Ave 10th Ave E 8th Av e 99A New Westminster Derwent W ay River Rd 8th Ave 96th Ave 90th Ave River Rd Columbia St 96th Ave Nordel W ay Broadw ay Austin Rd Holmes St E Colum bia St Scott Rd Braid St Brunette Ave Clarke Rd Scott Rd Old Yale Rd Blue Mountain St!( 7 108th Ave Como Lake Ave Port Moody Coquitlam 104th Ave Schoolhouse St 108th Ave 96th Ave 99A Austin Ave SF PR Grosvenor Rd Dawes H ill R d McBride Dr 108th Ave 144th St 104th Ave!( 1A!( 7A Mariner W ay!( 1 Johnson St!( 7!( 7 Shaughnessy St Port Coquitlam 160th St!( 7B 96th Ave Kingsway Ave Apel Dr Prairie Ave SF PR 104th Ave 88th Ave Pitt Meadows 176th St!( 15 Dewdney Trunk Rd Electoral Area A!( 1 Dewdney Trunk Rd Dewdney Trunk Rd!( 7 no name 88th Ave 203rd St Maple Cres 132nd Ave 88th Ave 128th Ave 216th St 132nd Ave 224th St Haney Bypass Glover R d 232nd St Dewdney Trunk Rd Kanaka Creek Rd Glover R d Albion Ferry 240th St Maple Ridge 240th St!( 7 River Rd No 2 Rd Gilbert Rd Richmond Blundell Rd No 5 Rd!( 99 No 6 Rd River Rd 80th Ave 80th Ave 80th Ave 80th Ave Rawlison Cres 112th St Surrey 192nd St Glover R d 232nd St Steveston Hwy 72nd Ave Scott Rd 72nd Ave 200th St 72nd Ave Crush Cres!( 10 River Rd W 47A Ave Elliott St River Rd!( 17 Ladner Trunk Rd Highway 17 62B St!( 10 SF PR Delta 104th St!( 99!( 91 64th Ave Kittson Pky Kitson Pky 64th Ave 64th Ave!( 10!( 10 64th Ave 144th St 99A 152nd St 184th St!( 1A 192nd St 192nd St 64th Ave 56th Ave 64th Ave 64th Ave 56th Ave Langley City Mufford Cres Glover R d 56th Ave Langley Bypass 56th Ave Langley Township 48th Ave!( 1 56th Ave Offramp 52nd Ave 40th Ave!( 1A Crescent Rd 232nd St Deltaport W ay 53rd St Deltaport W ay SF PR 32nd Ave Diversion 32nd Ave!( 15 Roberts Bank Rd Deltaport W ay 27B Ave Tsawwassen First Nation 16th Ave 53rd St 12th Ave 28th Ave 56th St 16th Ave 12th Ave!( 17 Boundary Bay Rd 28th Ave N 128th St 20th Ave Marine Dr Nichol Rd North Bluff Rd Kilometers 16th Ave White Rock!( 99 Stayte Rd 168th St 8th Ave Onramp 8th Ave 24th Ave 216th St 16th Ave Fraser Valley Regional District English Bluff Rd 3rd Ave 4th Ave 1st Ave USA 0 Ave 176A St USA 0 Ave Metro Vancouver Industrial Land Inventory Prepared By: Metropolitan Planning, Environment & Parks Date: August 9, 2012 Lands Available Before 2017 (4,521 acres) Lands Available in 2017 or After (1,988 acres) Highways Major Roads Rail G:\PROJECTS\CP11\00\Industrial_Land_Study\Mxd\WebsiteMaps\MarketReadiness_ILI_2010.mxd
101 APPENDIX B METRO VANCOUVER 2010 INDUSTRIAL LANDS INVENTORY, NOVEMBER 2011 NAIOP VANCOUVER PACIFIC LAND GROUP 51


102 Metro Vancouver 2010 Industrial Lands Inventory November 15, 2011 Prepared by: Metro Vancouver Metropolitan Planning, Environment, and Parks Department
103 Executive Summary In 2010, a detailed parcel-based Industrial Lands Inventory was prepared for all industrial lands located within the Metro Vancouver region. The purpose of this study and inventory was to: Estimate how much land was allocated for industrial use in Metro Vancouver and where those industrial lands were located within the region. Estimate how much of the industrial land base was utilized by industrial activity, and how much was vacant (not utilized by industry, but designated for future industrial development). Compare these 2010 results with the findings of the 2005 inventory to assess changes. The last detailed industrial land inventory was prepared by Metro Vancouver in The 2010 inventory update is part of the research program supporting the Metro Vancouver Regional Growth Strategy (RGS) adopted by the Metro Vancouver Board in July, A key component of the RGS is to ensure an adequate supply of industrial land to support a diverse, efficient, and prosperous regional economy. The Industrial Lands Inventory provides a snapshot of the industrial land supply in Metro Vancouver in mid The inventory can be used as a reference to past and future years for monitoring and tracking changes and absorption of industrial land in the region. The inventory can also be used by Metro Vancouver and member municipalities as the basis for making informed land use decisions around the supply and use of industrial lands in Metro Vancouver. The industrial land inventory / supply comprises both developed and vacant industrial lands, and uses the following definitions: Industrial Land designated by municipal Official Community Plans for industrial uses, or land zoned and utilized for industrial uses. Developed Industrial Land industrial land that is wholly or partially utilized for industrial related uses, which includes properties used for outdoor storage. This also includes office, retail, or institutional uses that are allowed within municipal industrial zones. Vacant Industrial Land industrial land that is not utilized for industrial related uses, which includes industrial properties that are completely vacant as well as industrial properties currently utilized for residential and agriculture uses. METRO VANCOUVER 2010 INDUSTRIAL LANDS INVENTORY Page i
104 2010 Inventory For the 2010 Inventory, the Metro Vancouver Industrial Lands Task Group provided input on the draft industrial land classification mapping and study. The Task Group included representatives from member municipalities, the real estate brokerage community, and various government agencies. As of mid 2010, there were approximately 28,200 acres (11,400 ha) of industrial land in Metro Vancouver. The Surrey/White Rock subregion comprised 22% of the region s industrial lands. Richmond and Delta/TFN comprised a further 30% of the region s industrial lands, and Burnaby/New Westminster and the Northeast Sector an additional 24%. In Metro Vancouver, approximately 76% of the industrial land base, or 21,600 acres (8,700 ha), had been developed as of The remaining approximate 24% of the industrial land base, or 6,600 acres (2,700 ha), was vacant. The majority (35%) of the vacant industrial land in the region was located in Surrey/White Rock. Distribution of Industrial Lands by Subregion, 2010 Developed Vacant Total Industrial Land Industrial Land Industrial Land Regional Subregions (acres) (acres) (acres) Share North Shore , % Vancouver 1, , % Burnaby / New Westminster 3, , % Northeast Sector 2, , % Richmond 3, , % Delta / TFN 2,860 1,066 3, % Surrey / White Rock 4,041 2,293 6, % Langleys 1, , % Ridge - Meadows 754 1,008 1, % Metro Vancouver 21,612 6,634 28, % Note: The term vacant industrial lands includes lands planned for future industrial use, but not currently utilized for industrial activity; this may include properties with non-industrial uses, as well as properties having environmental and other constraints on development. The term developed industrial lands includes both lands wholly or partially utilized for industrial related purposes; these lands may have additional development capacity. Of note, roughly 3% (807 acres) of the developed land inventory included properties zoned and utilized for industrial uses but not designated for industrial activities in municipal Official Community Plans (OCPs). These lands were included in the inventory. However it is important to note that these lands are anticipated to convert over to non-industrial uses in the future and therefore may not form part of Metro Vancouver s long-term industrial land supply. As for the size of parcels, of the vacant industrial land (6,600 acres), approximately 29% (1,900 acres) was in the form of parcels less than 5 acres in size, 26% (1,800 acres) on parcels between 5 to 20 acres, and 45% (3,000 acres) on parcels greater than 20 acres. Of the developed industrial lands, 73% were in the form of parcels under 20 acres in size. METRO VANCOUVER 2010 INDUSTRIAL LANDS INVENTORY Page ii
105 Changes to the Industrial Land Inventory Between 2005 and 2010 Between 2005 and 2010, there was a net increase of 1,226 acres to the region s total industrial land inventory. Major inventory changes included the addition of industrial lands in Tsawwassen First Nations (332 acres), Pitt Meadows Airport Area (188 acres), Delta / Tilbury (185 acres) and Maple Ridge (105 acres). Major deletions included lands in Surrey Campbell Heights (231 acres to park and conservation), Surrey South Fraser Perimeter Road (200 acres), and Coquitlam Fraser Mills (65 acres to residential). Including the net industrial land added and deleted from the inventory between 2005 and 2010, there was an overall net increase of 1,242 acres of developed industrial land over the period. This represented an average annual land absorption rate of approximately 250 acres over the five year period. Along with the net increase of 1,242 acres of developed land to the inventory, there was a net decrease of 16 acres of vacant industrial land. The following table compares the total inventories in 2005 and Comparing the Industrial Land Inventory Parcel Status: Revised Net Change Industrial Land Industrial Land 2005 vs 2010 Industrial Land Status (acres) (acres) (acres) Vacant 6,650 6,634 (16) Developed 20,370 21,612 1,242 Total Industrial Land 27,020 28,246 1,226 Note: With the benefit of additional data clarification, some corrections and revisions were done to the 2005 inventory to enable a direct comparison with the 2010 inventory. While the developed industrial land inventory increased over the study period, the net change in the vacant land inventory was negligible because other vacant lands, such as in Tsawwassen First Nation, Delta and Maple Ridge, were added to the land inventory. Land Supply Considerations The Metro Vancouver Regional Growth Strategy (RGS) establishes two regional land use designations for industrial related uses: Industrial and Mixed Employment. Of the total 2010 industrial lands inventory, 66% was located within the RGS Industrial designation, 23% within the Mixed Employment designation, 9% within General Urban, and 2% within other RGS designations. For a copy of the RGS: In addition to the remaining vacant land capacity, it is assumed there is additional development capacity available on currently developed sites which are under-utilized. It is anticipated that a significant amount of new industrial development will continue to occur through building expansion or redevelopment on existing developed sites. It is important to note that land inventory is a gross estimate of land, some of which may be currently occupied by non-industrial uses, have environmental, servicing or other development constraints. There can also be many factors affecting the METRO VANCOUVER 2010 INDUSTRIAL LANDS INVENTORY Page iii
106 availability, desirability and development potential of industrial lands, such as location, current uses, accessibility, lot assembly, market considerations, soil conditions, need for pre-loading or high development costs. These factors are not considered in this inventory study. Industrial lands are not all equal, and location is a very important factor for many industrial users. Some industries are more able to locate in a wider range of locations, whereas other industries must have direct and reliable access to transportation infrastructure. For industrial businesses involved in trade, transportation, warehousing, storage, and logistics, proximity to highways, ports, rail yards, and airports are of vital importance. These types of users cannot be accommodated on poorly located lands; much of the industrial land inventory in the region is simply not an option for these types of users. Furthermore, this study does not include a detailed assessment of potential development constraints, but cautions that such constraints could affect the availability and development potential of the industrial land supply. Additionally, the study does not consider the quality of the lands in terms of location, market or transportation factors. Thus, although the total inventory of industrial land in the region may be significant, much of it may not be useable for many industries. As such, the actual available and usable industrial land may be notably lower. However, at the same time, industrial lands currently considered developed may eventually re-develop at higher densities / intensities, and other lands may be added to the industrial inventory. Further analysis of the industrial lands in the region will be completed through separate detailed industrial land demand / utilization / intensification studies. The completion of this additional work will better inform the current and future industrial land situation in the Metro Vancouver region. METRO VANCOUVER 2010 INDUSTRIAL LANDS INVENTORY Page iv
107 Acknowledgements Metro Vancouver would like to thank the Metro Vancouver Industrial Lands Task Group for their input and review throughout this process. A list of Task Group members is found in Appendix B. METRO VANCOUVER 2010 INDUSTRIAL LANDS INVENTORY Page v
108 Table of Contents Executive Summary... i Acknowledgements... v Table of Contents... 1 List of Tables and Figures Introduction Background Purpose Industrial Lands Task Group Study Structure Methodology Study and Inventory Approach Data Sources Inventory Refinements Geographic Areas Definitions Inventory Process Limitations Industrial Land Supply Sources and Factors Affecting Supply Sources of Industrial Land Supply Development of Industrial Lands Factors Affecting Industrial Land Capacity Industrial Land Inventory Total Industrial Land Supply Developed Industrial Land Supply Vacant Industrial Land Supply Revised 2005 Inventory Change in Inventory Between Pre-2005 Industrial Lands Inventories Industrial Land Absorption Possible Future Land Absorption Regional Growth Strategy Designation of Industrial Land Inventory Conclusions Appendix A: References Appendix B: Industrial Lands Task Group Appendix C: Municipal Inventories METRO VANCOUVER 2010 INDUSTRIAL LANDS INVENTORY Page 1
109 List of Tables and Figures Table 2-1: Correspondence Between Municipalities and Subregions...7 Table 2-2: Lands Included in Industrial Lands Inventory...11 Table 4-1: Distribution of Total Industrial Lands by Subregion, Table 4-2: Distribution of Total Industrial Lands by Municipality, Table 4-3: Percentage of Total Land Inventory Vacant by Subregion, Table 4-4: Developed Industrial Lands by Subregion, Table 4-5: Distribution of Developed Industrial Land Area by Parcel Size by Subregion as Acres, Table 4-6: Distribution of Developed Industrial Land Area by Parcel Size by Subregion as Percentage, Table 4-7: Vacant Industrial Lands by Subregion, Table 4-8: Distribution of Vacant Industrial Land Area by Parcel Size by Subregion, Table 4-9: Distribution of Vacant Industrial Land Area by Parcel Size by Subregion as Percentage, Table 4-10: 2005 Original and 2005 Revised Inventory and Net Change...30 Table 4-11: Distribution of Industrial Lands by Subregion, 2005 (Revised)...30 Table 4-12: Net Change In Regional Industrial Land Inventory Between Table 4-13: Net Change In Industrial Land Inventory by Subregion, Table 4-14: Notable Industrial Land Additions, Table 4-15: Notable Industrial Land Deletions, Table 4-16: Comparison of Industrial Land Inventories...34 Table 4-17: Hypothetical Depletion Timeline for Vacant Industrial Land Supply Under Alternative Demand/Absorption Rate Scenarios...37 Table 4-18: Distribution of Metro Vancouver 2010 Industrial Land Inventory by RGS Designations Table C-1: Total Industrial Land Supply by Subregion and Municipality, A3 Table C-2: Parcel Size of Developed Industrial Land by Subregion and Municipality, A4 Table C-3: Parcel Size of Vacant Industrial Land by Subregion and Municipality, A5 Table C-4: Revised 2005 Industrial Land Inventory by Subregion and Municipality, A6 Table C-5: Net Change in Industrial Land Inventory by Subregion and Municipality, A7 Figure 2-1: Map of the Metro Vancouver Municipalities and Subregions...7 Figure 4-1: Map of the Regional Distribution of Industrial Lands, Figure 4-2: Distribution of Total Industrial Land Inventory by Subregion, Figure 4-3: Industrial Lands by Developed and Vacant Status by Subregion, Figure 4-4: Developed Industrial Lands by Subregion, Figure 4-5: Map of the Regional Distribution of Developed Industrial Lands, Figure 4-6: Developed Industrial Lands by Parcel Size and Subregion, Figure 4-7: Distribution of Vacant Industrial Lands by Subregion, Figure 4-8: Map of the Regional Distribution of Vacant Industrial Lands, Figure 4-9: Vacant Industrial Lands by Parcel Size and Subregion, Figure 4-10: Map of 2005 Vacant Industrial Lands in Metro Vancouver that Developed by METRO VANCOUVER 2010 INDUSTRIAL LANDS INVENTORY Page 2
110 1 Introduction 1.1 Background In 2010, Metro Vancouver (Greater Vancouver Regional District) conducted an Industrial Lands Inventory covering the Metro Vancouver geographic area. The previous region-wide Industrial Lands Inventory was completed in This industrial inventory study is part of the research program supporting the Metro Vancouver Regional Growth Strategy which has a key policy objective of assisting in the protection of industrial and employment lands.. Industrial activities have played an important role in Metro Vancouver s historical development and continue to provide a significant contribution to Metro Vancouver s economy. According to the Statistics Canada Labour Force Survey, over 23% (287,500 jobs) of the region s labour force was employed in the industrial sector in 2010, including manufacturing, wholesale trade, construction, transportation, and utilities. According to the 2010 Metro Vancouver Land Use Inventory, approximately 13% (28,200 acres) of all urban land in the Metro Vancouver was designated for industrial uses in Metro Vancouver Purpose The purpose of the 2010 study and inventory was to: Estimate how much land was allocated for industrial use in Metro Vancouver and where those industrial lands were located within the region. Estimate how much of the industrial land base was utilized by industry, and how much was vacant (not utilized by industry, but designated for future industrial development). Compare these 2010 results with the findings of the 2005 inventory to assess changes. To fulfill this objective, a detailed parcel-based Industrial Lands Inventory for Metro Vancouver was assembled to provide a snapshot of the region s industrial land supply for mid This inventory can be used as a comparison to the inventory completed in mid 2005, and to provide a baseline for future comparisons over time. This study documents the methodology and findings of the inventory at a subregional and municipal level. The study also offers recommendations for the 1 For the purpose of this report, urban is defined as all lands located within the region s Urban Containment Boundary as defined in the Metro Vancouver Regional Growth Strategy, plus designated industrial lands located outside of the Urban Containment Boundary. METRO VANCOUVER 2010 INDUSTRIAL LANDS INVENTORY Page 3
111 further development and updating of the inventory and conducting additional research. The Industrial Lands Inventory has multiple uses. It can provide the basis for making informed land use decisions around the supply and use of industrial lands by member municipalities. It can also assist in the coordination of industrial land use policy and transportation investments. Finally, the information can generally be used as an economic development tool for industrial activity in the region. 1.3 Industrial Lands Task Group In late 2010, the Metro Vancouver Industrial Lands Task Group provided input on mapping classification of lands and in early 2011 comments on the draft study. The Task Group consisted of representatives from Metro Vancouver, member municipalities, real estate brokerages, and various government agencies. A list of the task group members is included in Appendix B. 1.4 Study Structure This study is organized into five sections, followed by appendices. Section 1 is the study introduction. Section 2 presents the approach, methodology, and limitations of the study and Industrial Lands Inventory. Section 3 discusses various factors affecting industrial land supply. Section 4 presents the key findings from the Industrial Lands Inventory. Section 5 provides study conclusions. Appendix A provides a list of reference documents. Appendix B provides a list of the Industrial Lands Task Group members. Appendix C provides tables of the Industrial Lands Inventory broken down by municipality and subregion. METRO VANCOUVER 2010 INDUSTRIAL LANDS INVENTORY Page 4
112 2 Methodology 2.1 Study and Inventory Approach The Industrial Lands Inventory was undertaken using a comprehensive technical and consultative approach. Both the 2005 and 2010 industrial inventories used a GIS-based parcel inventory. With this approach, data at the smallest level of geography individual parcels were used for populating and querying the database. The advantage of this approach was that it facilitates maintaining and updating the database. In addition, it allowed the data to be related to other databases, such as the BC Assessment Authority data. The parcel-level approach for the database enables data to be queried at sub-municipal levels of geography, such as major industrial areas. Second, the inventory involved a consultative process, from refinement of the methodology to the review of the inventory at the parcel level. Experts were involved in the review process, including representatives from the member municipalities, the real estate brokerage community, and various government agency representatives. 2.2 Data Sources The following are the main data sources that were used for the 2010 Industrial Lands Inventory: Cadastral GIS data (Integrated Cadastral Initiative and Metro Vancouver data sources) BC Assessment Authority Land Use and Zoning GIS files from the member municipalities Orthophoto image (flown in mid 2009) Municipal planning staff and local industrial brokerage experts METRO VANCOUVER 2010 INDUSTRIAL LANDS INVENTORY Page 5
113 Inventory Refinements With the benefit of additional and improved data the inventory for 2005 was slightly refined and revised. These improvements to the 2005 inventory were based on the following factors: Improved GIS mapping / boundaries information Improved consistency in terms of applying developed vs vacant criteria for such lands as outdoor storage Improved consistency in terms of recognizing site constraints (physical and environmental) Removing un-developable lands due to transportation and infrastructure rightof-ways Removing lands below the foreshore waterline These refinements improve the 2005 inventory and also make it possible to directly and accurately compare the revised 2005 inventory with the 2010 inventory results to assess changes. 2.4 Geographic Areas The data was compiled at the parcel level and summarized by municipalities, subregions, and for Metro Vancouver as a whole. Industrial lands on Indian Reserves were not included in this inventory; however lands within the Tsawwassen First Nation were included. The Vancouver International Airport was included within the Richmond inventory, and all port lands were included within their respective local municipality. The majority of the data in the body of the study is presented at the subregional level; municipal level data are in the appendices. There are nine subregions in Metro Vancouver. The following figure shows the location of the subregions and the municipalities within each subregion, and the table indicates the correspondence between municipalities and subregions. METRO VANCOUVER 2010 INDUSTRIAL LANDS INVENTORY Page 6

114 Figure 2-1: Map of the Metro Vancouver Municipalities and Subregions Table 2-1: Correspondence Between Municipalities and Subregions Subregion: North Shore Vancouver Burnaby / New Westminster Northeast Sector Richmond Delta / TFN Surrey / White Rock Langleys Ridge Meadows Municipalities included: Village of Lions Bay, Bowen Island Municipality, District of West Vancouver, City of North Vancouver, District of North Vancouver City of Vancouver, University Endowment Lands, University of British Columbia City of Burnaby, City of New Westminster City of Port Moody, City of Coquitlam, City of Port Coquitlam, Village of Anmore, Village of Belcarra City of Richmond (including Vancouver International Airport) Corporation of Delta, Tsawwassen First Nation City of Surrey, City of White Rock City of Langley, Township of Langley District of Maple Ridge, City of Pitt Meadows METRO VANCOUVER 2010 INDUSTRIAL LANDS INVENTORY Page 7
115 2.5 Definitions The following provides the key definitions used in this study. Note that these definitions were slightly revised for clarity from the terms used in the 2005 inventory study; however the intents are still the same: Industrial Land This is land designated by municipal Official Community Plans for industrial uses, or land zoned and utilized for industrial uses, such as processing, manufacturing, assembling, storage, transportation of goods or other industrial related uses. Developed Industrial Land This is industrial land that is wholly or partially utilized for industrial related uses, which includes properties used for outdoor storage. A property is considered utilized when it has been cleared and worked with footings in place or if there is discernable (outdoor) storage on the site. This also includes office, retail, or institutional uses that are allowed within municipal industrial zones. Although these properties are classified as developed, they may be only partially utilized and have additional development capacity. Vacant Industrial Land This is industrial land that is not utilized for industrial related uses. This includes industrial properties that are completely vacant as well as industrial properties currently utilized for residential and agriculture uses. Zoned Industrial, but Not Designated Industrial Land This includes properties that are zoned for industrial use, but do not have an industrial land use designation in a municipality s Official Community Plan. If such a property is currently utilized for industry, it is included in the inventory as developed; however given the land use designation these lands are likely to ultimately redevelop in a non-industrial form. If such a property is not utilized for industry, it is not included in the inventory. Vacant Land / Vacant Building Vacant land is distinct from a vacant industrial building. If an industrial site has been developed, but is currently vacant of tenants, it would be included as developed in the Industrial Lands Inventory. Industrial lands with residential and agricultural uses are classified as vacant with future industrial development potential, whereas industrial lands with office, retail or institutional uses are classified as developed. This reflects the likelihood of these lands re-developing as industrial. Also note: The developable part of a significant portion of the vacant industrial lands may be hindered or delayed by factors such as location, current uses, accessibility, lot assembly, market considerations, soil conditions, need for preloading or high development costs. This study does not include a detailed assessment of potential development constraints, but cautions that such constraints could affect the availability and development potential of the vacant industrial land supply. However, at the same time, lands currently considered developed may eventually re-develop at higher densities / intensities. METRO VANCOUVER 2010 INDUSTRIAL LANDS INVENTORY Page 8
116 The Metro Vancouver Regional Growth Strategy applies regional land use designations to the entire region. The RGS establishes two regional land use designations for industrial related uses as follows: Industrial, which are areas primarily intended for heavy and light industrial activities and appropriate accessory uses. Mixed Employment, which: o supports a mix of industrial, commercial, office and other related employment uses, while maintaining support for established industrial areas, including potential intensification policies for industrial activities, where appropriate; and o allows large and medium format retail, where appropriate, provided that such development will not undermine the broad objectives of the RGS. Industrial activities are allowable in other areas, however are predominantly located in the Industrial and Mixed Employment designations. All references to the inventory of industrial lands in this study are independent of their designation in the Regional Growth Strategy. METRO VANCOUVER 2010 INDUSTRIAL LANDS INVENTORY Page 9
117 2.6 Inventory Process Generally consistent with the 2005 inventory, and building on this past study where appropriate, the 2010 Industrial Lands Inventory was prepared using the following steps and process: Step 1) Review of Literature A literature review was undertaken of industrial land inventories from other jurisdictions, to identify possible parameters to include in the industrial lands database. Step 2) Design of Database The structure of the industrial lands database was designed to link GIS parcel data with attribute data from municipalities and property characteristics from the BC Assessment Authority (BCAA). The database was designed for use at the parcel-level. The database structure was set up as a relational database to be linked with the BCAA database, which includes assessed value and other property parameters. Step 3) Obtaining Property GIS Data Metro Vancouver obtained applicable property data from member municipalities and BCAA, and overlaid this with an aerial photograph from mid Step 4) Creation of GIS Parcel Layer Metro Vancouver created a region-wide parcel layer to be used as the foundation for the parcel-based inventory. The data were based on municipal cadastral data files from the Integrated Cadastral Initiative (ICI) and Metro Vancouver data for areas lacking data from the ICI database. Step 5) Revisions to 2005 Inventory The 2005 inventory was revised based on additional available mapping data and refined definitions. Step 6) Identification of Developed and Vacant Industrial Lands All lands that were defined as industrial were included in the inventory. In addition, properties that were not designated industrial, but were zoned industrial and developed, were included and classified as developed (see definitions). All other parcels were excluded from the inventory as shown in the following table. METRO VANCOUVER 2010 INDUSTRIAL LANDS INVENTORY Page 10
118 Table 2-2: Lands Included in Industrial Lands Inventory DEVELOPED INVENTORY VACANT INVENTORY OCP Land Use Designation Designated Industrial Designated Non-Industrial Zoned Industrial Zoned Non- Industrial X Zoned Industrial X Zoned Non- Industrial X = included in Industrial Lands Inventory X = not included in Industrial Lands Inventory All the parcels in the Industrial Lands Inventory were reviewed to identify which parcels were developed and which were vacant. Parcels that were zoned nonindustrial (residential, agricultural) but had an industrial OCP land use designation were classified as vacant. Parcels with some industrial activity (or office, retail, institutional uses), including outdoor storage, were classified as developed. A GIS overlay of the industrial parcels with 2009 aerial orthophotos was undertaken. Developed parcels were identified through air photo interpretation. The classification procedure enabled the examination or removal of anomalies in the database. In total, there were over 11,000 parcels included in the regional industrial lands database. Step 7) Review of Developed and Vacant Industrial Parcels In late 2010, large-scale hard copy maps showing individual industrial parcels were reviewed by municipalities that had large industrial land holdings, as well as other parties such as the Vancouver Airport Authority and Port Metro Vancouver and local brokerage firms, and their feedback was incorporated into the database. This included an Industrial Lands Task Group meeting. In early 2011, the draft study was distributed to the Task Group for review and comment at a second meeting. The feedback from this review culminated in the final 2010 Industrial Lands Inventory Study. METRO VANCOUVER 2010 INDUSTRIAL LANDS INVENTORY Page 11
119 2.7 Limitations Information on all potential development constraints was not readily available. Where available, such as the Fraser River Estuary Management Program (FREMP) 2 red-coded areas, this information was captured and these parcels were excluded. Steep slopes, setbacks from streams and water bodies, environmental constraints or sensitive areas, and lands prone to natural hazards all reduce the amount of land potentially developable for industrial purposes. This study does not include a detailed assessment of potential development constraints, location, or usability, but cautions that such constraints could significantly affect the availability and development potential of the industrial land supply. The 2005 inventory study included a section on the market readiness of the vacant industrial land base. Market readiness status was based on a combination of variables, including proximity of adequate infrastructure (water, sewer, drainage, roads) and the probability of when those could be available for industrial development of the properties. However, properties may require rezoning or other development approvals, and may be subject to other development constraints, such as location, current uses, accessibility, lot assembly, market considerations, soil conditions, need for pre-loading, high development costs or other factors. Determining the market readiness of land was very challenging, as many different factors may affect the development potential and timing of lands and cannot be known with any certainty or applied in a consistent fashion. As such, no market readiness component was completed in the 2010 study. The 2005 study also included a component on under-utilized industrial lands, considering such factors as the level (value or floor area) of improvements relative to the value or size of property. This section has not been included in this 2010 study, however will be further analyzed in greater detail in separate industrial land utilization and demand studies. (While the presence of underutilized lands does not increase the overall regional supply of industrial lands, the potential for redevelopment does provide for the opportunity of new industrial development at higher densities.) 2 For more information, please refer to FREMP Estuary Management Plan: METRO VANCOUVER 2010 INDUSTRIAL LANDS INVENTORY Page 12
120 3 Industrial Land Supply Sources and Factors Affecting Supply 3.1 Sources of Industrial Land Supply The overall industrial land supply was determined by the amount of land designated by land use plans (namely Official Community Plans) in each of the municipalities. These properties were not all necessarily zoned for industrial use. There were a small number of properties within the region that were not designated industrial, but were zoned industrial and developed as industrial. These properties were included as developed within the inventory totals, but are expected to redevelop into non-industrial uses in the future and therefore may not be part of the region s long term industrial land supply. 3.2 Development of Industrial Lands Industrial designated properties were categorized as either developed or vacant, with both having future (re)development potential. Vacant properties include sites that are not currently used for industrial activities, and are available to be developed. This includes greenfield sites that have never been developed, as well as brownfield sites already developed for a variety of non-industrial uses. Although the developed properties are currently utilized by industry, many of those properties are under-utilized sites that can be further developed or redeveloped. In the inventory, industrial lands that are partially used or used for only outdoor storage purposes are classified as developed industrial lands. An important aspect of future industrial capacity is the redevelopment potential of under-utilized sites, which will be further explored in other studies. Note that for both inventories, steep slopes, setbacks from streams and water bodies, environmental constraints or sensitive areas, and lands prone to natural hazards all reduce the amount of land that is potentially developable for industrial purposes. Further, because of site constraints, as well as location and market factors, some lands may not be developed for some time. Industrial lands are not all equal, and location is a very important factor for many industrial users. Some industries are more able to locate in a wider range of locations, whereas other industries must have direct and reliable access to transportation infrastructure. For industrial businesses involved in trade, transportation, warehousing, storage, and logistics, proximity to highways, ports, rail yards, and airports are of vital importance. These types of users cannot be accommodated on poorly located lands; much of the industrial land inventory in the region is simply not an option for these types of users. METRO VANCOUVER 2010 INDUSTRIAL LANDS INVENTORY Page 13
121 3.3 Factors Affecting Industrial Land Capacity There are various factors that can affect the development capacity of industrial lands. These factors include: Environmental constraints o Stream and water body setbacks o Environmentally sensitive areas o Contaminated sites Natural hazard constraints o Steep slopes o Areas prone to flooding o Loss of developable area due to the requirement to provide mitigation measures for flooding and other natural hazards Re-designation/rezoning of industrial land for other uses, such as housing, office, retail, institutional, etc Acquisition of industrial land for road / transit right-of-ways or utility corridors Inclusion of non-industrial uses as permitted uses in industrial zones (e.g. large format retail and free standing offices) which reduces the supply of land for industrial uses Also of note, some industrial lands may have significant legal / title / tenure / use limitations in terms of potential uses. This may be such lands as those owned by the airport authority which are restricted to airport related uses or port lands restricted to port related activities. Restrictions may also apply to lands within Indian Reserves or the Tsawwassen First Nation. Additionally, there are lands which are used for rail yards and infrastructure / utilities which are not conventional market lands. These types of lands may not necessarily be available to develop as industrial. The supply of industrial land can also be increased by designating new lands for industrial uses and/or mitigating site constraints. METRO VANCOUVER 2010 INDUSTRIAL LANDS INVENTORY Page 14
122 4 Industrial Land Inventory 4.1 Total Industrial Land Supply As of mid 2010, there were approximately 28,200 acres (11,400 ha) of industrial land in Metro Vancouver. Of the 22 Metro Vancouver municipalities (including the Tsawwassen First Nation), 16 of the municipalities had a supply of industrial lands. The six municipalities without a supply of industrial lands are: West Vancouver, Lions Bay, Bowen Island, Belcarra, Anmore, and White Rock. However, each of these municipalities is located in subregions that do have industrial lands. The majority of the industrial land base is both designated in the municipality s Official Community Plan and zoned for industrial use. However, roughly 3% (807 acres) of the developed industrial land inventory included properties zoned and utilized for industrial uses but not designated for industrial activities in municipal Official Community Plans (OCPs). These lands were included in the inventory. However, it is important to note that these lands are anticipated to convert over to non-industrial uses in the future and therefore may not form part of Metro Vancouver s long-term industrial land supply. Conversely, there are also lands designated industrial which are occupied by non-industrial uses. The amount of lands falling into this category is unknown, but will be explored in greater detail in separate utilization studies. The distribution of industrial lands are shown in the following tables and figures and further explained in the following sections. Table 4-1: Distribution of Total Industrial Lands by Subregion, 2010 Developed Vacant Total Industrial Land Industrial Land Industrial Land Regional Subregion (Acres) (Acres) (Acres) Share North Shore , % Vancouver 1, , % Burnaby / New West. 3, , % Northeast Sector 2, , % Richmond 3, , % Delta / TFN 2,860 1,066 3, % Surrey / White Rock 4,041 2,293 6, % Langleys 1, , % Ridge - Meadows 754 1,008 1, % Metro Vancouver 21,612 6,634 28, % Note: The term vacant industrial lands includes lands planned for future industrial use, but not currently utilized for industrial activity; this may include properties with non-industrial uses, as well as properties having environmental and other constraints on development. The term developed industrial lands includes both lands wholly or partially utilized for industrial related purposes; these lands may have additional development capacity. METRO VANCOUVER 2010 INDUSTRIAL LANDS INVENTORY Page 15


123 Figure 4-1: Map of the Regional Distribution of Industrial Lands, 2010 METRO VANCOUVER 2010 INDUSTRIAL LANDS INVENTORY Page 16
124 Table 4-2: Distribution of Total Industrial Lands by Municipality, 2010 Developed Vacant Total Industrial Land Industrial Land Industrial Land Regional Municipality (Acres) (Acres) (Acres) Share Burnaby 2, , % Coquitlam % Delta 2, , % Langley City % Langley Township 1, , % Maple Ridge , % New West % North Vancouver City % North Vancouver District % Pitt Meadows % Port Coquitlam , % Port Moody 1, , % Richmond 3, , % Surrey 4,041 2,293 6, % Tsawwassen First Nation % Vancouver 1, , % Metro Vancouver 21,612 6,634 28, % Note: The term vacant industrial lands includes lands planned for future industrial use, but not currently utilized for industrial activity; this may include properties with non-industrial uses, as well as properties having environmental and other constraints on development. The term developed industrial lands includes both lands wholly or partially utilized for industrial related purposes; these lands may have additional development capacity. Note that within the Richmond subregion, the Vancouver International Airport (Sea Island) had approximately 877 acres of industrial land (546 acres developed; 331 acres vacant). The following figure presents a breakdown of the total industrial land supply by subregion. The Surrey/White Rock region comprised approximately 22% of the region s industrial lands. Richmond and Delta/TFN comprised a further 30% of the region s industrial lands. Burnaby/New Westminster, and the Northeast Sector comprised an additional 24% of the industrial lands. The remaining consisted of the Langleys (9%), Ridge-Meadows (6%), Vancouver (6%), and the North Shore (4%). Approximately 61% of the region s industrial land supply was located south of the Fraser River (including Richmond). METRO VANCOUVER 2010 INDUSTRIAL LANDS INVENTORY Page 17
125 Figure 4-2: Distribution of Total Industrial Land Inventory by Subregion, 2010 Northeast Sector, 3,053 ac, 11% Burnaby / New West., 3,590 ac, 13% Richmond, 4,487 ac, 16% Vancouver, 1,577 ac, 6% North Shore, 1,014 ac, 4% Delta / TFN, 3,926 ac, 14% Ridge Meadows, 1,762 ac, 6% Langleys, 2,503 ac, 9% Surrey / White Rock, 6,334 ac, 21% The industrial land supply comprises both developed and vacant industrial lands. In Metro Vancouver, 76% of the industrial land base, or 21,600 acres (8,700 ha), was developed as of The remaining 24% of the industrial land base, or 6,600 acres (2,700 ha), was vacant. The following figure shows the breakdown of the land supply by both developed and vacant land status by subregion. A detailed municipal breakdown of the industrial land is included as Appendix C. METRO VANCOUVER 2010 INDUSTRIAL LANDS INVENTORY Page 18
126 Figure 4-3: Industrial Lands by Developed and Vacant Status by Subregion, ,000 6,000 5,000 Land Area (acres) 4,000 3,000 2,000 1,000 0 North Shore Vancouver Burnaby / New West. Northeast Sector Richmond Delta / TFN Surrey / White Rock Langleys Ridge Meadows Developed Vacant Within the subregions, the proportion of the total industrial lands which were vacant varies greatly, from a low of approximately 5% (such as North Shore, Vancouver and Northeast Sector) to over 30%. The highest were Surrey/White Rock with 36% of its industrial land base vacant, and Ridge-Meadows with 57%. Table 4-3: Percentage of Total Industrial Land Inventory Vacant by Subregion, 2010 Total Percent of Land Industrial Land Vacant by Subregions (acres) Subregion North Shore 1,014 6% Vancouver 1,577 4% Burnaby / New Westminster 3,590 10% Northeast Sector 3,053 6% Richmond 4,487 21% Delta / TFN 3,926 27% Surrey / White Rock 6,334 36% Langleys 2,503 27% Ridge - Meadows 1,762 57% Metro Vancouver 28,246 23% Note: The term vacant industrial lands includes lands planned for future industrial use, but not currently utilized for industrial activity; this may include properties with non-industrial uses, as well as properties having environmental and other constraints on development. The term developed industrial lands includes both lands wholly or partially utilized for industrial related purposes; these lands may have additional development capacity. The following sections provide a more detailed picture of the developed and vacant industrial lands in the region. METRO VANCOUVER 2010 INDUSTRIAL LANDS INVENTORY Page 19
127 4.2 Developed Industrial Land Supply The developed industrial land inventory consisted of lands that were either designated industrial and utilized by industry, or zoned but not designated industrial and utilized by industry. There is also an unknown amount of developed lands that are designated for industrial, but are used for office, retail, and institutional uses. These issues will be further explored in a separate utilization study. In 2010, there were 21,600 acres (8,700 ha) of developed industrial lands in Metro Vancouver. Of this, 97% (20,800 acres) consisted of lands designated for industrial in municipal Official Community Plans (OCPs) with the balance 3% (807 acres) zoned but not designated, and likely to redevelop as non-industrial uses in the future. Of note, approximately two-thirds of these lands were within 400 metres of urban centres or existing rapid transit stations. Approximately 57% of the developed industrial lands (12,300 acres) were located south of the Fraser River (including Richmond). A significant amount of developed industrial land was also located in Burnaby / New Westminster (3,200 acres) and the Northeast Sector (2,900 acres). Note that a small percentage of the developed industrial land included properties that were zoned for permitted non-industrial uses (such as office, retail, institutional). Table 4-4: Developed Industrial Lands by Subregion, 2010 Developed Industrial Land Regional Subregion (Acres) Share North Shore % Vancouver 1, % Burnaby / New West. 3, % Northeast Sector 2, % Richmond 3, % Delta / TFN 2, % Surrey / White Rock 4, % Langleys 1, % Ridge - Meadows % Metro Vancouver 21, % METRO VANCOUVER 2010 INDUSTRIAL LANDS INVENTORY Page 20
128 Figure 4-4: Developed Industrial Lands by Subregion, 2010 Surrey / White Rock, 4,041 ac, 20% Langleys, 1,829 ac, 8% Delta / TFN, 2,860 ac, 13% Ridge Meadows, 754 ac, 3% North Shore, 955 ac, 4% Vancouver, 1,510 ac, 7% Richmond, 3,552 ac, 17% Northeast Sector, 2,870 ac, 13% Burnaby / New West., 3,241 ac, 15% The location of the developed industrial lands is shown on the following figure. METRO VANCOUVER 2010 INDUSTRIAL LANDS INVENTORY Page 21

129 Figure 4-5: Map of the Regional Distribution of Developed Industrial Lands, 2010 METRO VANCOUVER 2010 INDUSTRIAL LANDS INVENTORY Page 22
130 The following two tables show the breakdown of the developed industrial land by parcel size and by subregion. Demand for land can vary based on many factors, including the size of parcels. Approximately 43% (9,300 acres) of the developed industrial land was in the form of parcels less than 5 acres in size, 30% (6,400 acres) on parcels between 5 to 20 acres, and 27% (5,900 acres) on parcels greater than 20 acres. On a proportional basis, the largest concentration of large developed industrial parcels was located in the North Shore, the Northeast Sector and Ridge- Meadows. Approximately 55% of the industrial land in the North Shore occurred on parcels greater than 20 acres in size, while this number was only 8% in the Langleys. In the Northeast Sector and Ridge-Meadows, approximately 43-47% of the developed industrial lands occurred on parcels greater than 20 acres. The Northeast Sector had the region s largest supply of developed parcels greater than 50 acres. Table 4-5: Distribution of Developed Industrial Land Area by Parcel Size by Subregion as Acres, 2010 Less than 1 acre to 5 acres to 10 acres to 20 acres to 50 acres Total Subregion 1 acre 4.9 acres 9.9 acres 19.9 acres 49.9 acres and over Land Area North Shore Vancouver ,510 Burnaby / New West , ,241 Northeast Sector ,209 2,870 Richmond 236 1, ,552 Delta / TFN ,860 Surrey / White Rock 365 1, ,041 Langleys ,829 Ridge - Meadows Total 1,796 7,479 3,635 2,796 2,219 3,687 21,612 Table 4-6: Distribution of Developed Industrial Land Area by Parcel Size by Subregion as Percentage, 2010 Less than 10 acres to 20 acres Subregion 10 acres 20 acres and over North Shore 38.3% 6.6% 55.1% Vancouver 77.4% 9.5% 13.2% Burnaby / New West. 60.3% 13.0% 26.8% Northeast Sector 40.5% 12.6% 46.9% Richmond 61.7% 14.7% 23.6% Delta / TFN 56.0% 14.9% 29.2% Surrey / White Rock 67.7% 11.9% 20.5% Langleys 76.1% 16.2% 7.7% Ridge - Meadows 45.5% 11.3% 43.2% Total 59.7% 12.9% 27.3% The following figure shows the distribution by parcel size of developed industrial lands within each subregion. METRO VANCOUVER 2010 INDUSTRIAL LANDS INVENTORY Page 23
131 Figure 4-6: Developed Industrial Lands by Parcel Size and Subregion, ,800 1,600 1,400 Land Area (acres) 1,200 1, North Shore Vancouver Burnaby / New West. Northeast Sector Richmond Delta / TFN Surrey / White Rock Langleys Ridge Meadows under 1 ac 1 to 4.9 ac 5 to 9.9 ac 10 to 19.9 ac 20 to 49.9 ac over 50 ac The regional supply of larger (greater than 20 acres) developed industrial properties was predominantly located in the Northeast Sector, Richmond, Delta / TFN, and Surrey / White Rock. Burnaby / New Westminster, Richmond, Delta / TFN, Surrey / White Rock and the Langleys had a significant number of smaller (under 5 acres) properties. METRO VANCOUVER 2010 INDUSTRIAL LANDS INVENTORY Page 24
132 4.3 Vacant Industrial Land Supply There were approximately 6,600 acres (2,700 ha) of vacant industrial land in 2010 in Metro Vancouver. The following table shows the breakdown of the vacant industrial land by subregion. Approximately 75% of the vacant industrial land was located south of the Fraser River (including Richmond). Specifically, of the region s vacant industrial land: 35% was located in Surrey/White Rock, 16% in Delta/TFN, 14% in Richmond, and 10% in the Langleys. The largest portion of vacant land north of the Fraser River was located in Ridge-Meadows (15%), Burnaby / New Westminster (5%) and the Northeast Sector (3%). The North Shore and Vancouver comprised each only 1% of the region s vacant industrial lands. Table 4-7: Vacant Industrial Lands by Subregion, 2010 Vacant Industrial Land Regional Subregion (Acres) Share North Shore % Vancouver % Burnaby / New West % Northeast Sector % Richmond % Delta / TFN 1, % Surrey / White Rock 2, % Langleys % Ridge - Meadows 1, % Metro Vancouver 6, % Note: The term vacant industrial lands includes lands planned for future industrial use, but not currently utilized for industrial activity; this may include properties with non-industrial uses, as well as properties having environmental and other constraints on development. The term developed industrial lands includes both lands wholly or partially utilized for industrial related purposes; these lands may have additional development capacity. METRO VANCOUVER 2010 INDUSTRIAL LANDS INVENTORY Page 25
133 Figure 4-7: Distribution of Vacant Industrial Lands by Subregion, 2010 Langleys, 674 ac, 10% Ridge Meadows, 1,008 ac, 15% Surrey / White Rock, 2,293 ac, 35% North Shore, 59 ac, 1% Vancouver, 67 ac, 1% Burnaby / New West., 349 ac, 5% Northeast Sector, 183 ac, 3% Delta / TFN, 1,066 ac, 16% Richmond, 935 ac, 14% The location of the vacant industrial lands is shown on the following figure. METRO VANCOUVER 2010 INDUSTRIAL LANDS INVENTORY Page 26

134 Figure 4-8: Map of the Regional Distribution of Vacant Industrial Lands, 2010 METRO VANCOUVER 2010 INDUSTRIAL LANDS INVENTORY Page 27
135 The following two tables show the breakdown of vacant industrial land by parcel size and subregion. It shows that approximately 29% (1,900 acres) of the vacant industrial land was in the form of parcels less than 5 acres in size, 26% (1,800 acres) on parcels between 5 to 20 acres, and 45% (3,000 acres) on parcels greater than 20 acres. Approximately 41% of the large vacant industrial parcels greater than 20 acres in size were located in Surrey/White Rock and Richmond, with also a significant amount in Delta/TFN and Ridge-Meadows. Surrey/White Rock and the Langleys had a relatively large supply of parcels less than 5 acres. Table 4-8: Distribution of Vacant Industrial Land Area by Parcel Size by Subregion, 2010 Less than 1 acre to 5 acres to 10 acres to 20 acres to 50 acres Total Subregion 1 acre 4.9 acres 9.9 acres 19.9 acres 49.9 acres and over Land Area North Shore Vancouver Burnaby / New West Northeast Sector Richmond Delta / TFN ,066 Surrey / White Rock ,293 Langleys Ridge - Meadows ,008 Total 328 1, ,775 1,152 6,634 Note: The term vacant industrial lands includes lands planned for future industrial use, but not currently utilized for industrial activity; this may include properties with non-industrial uses, as well as properties having environmental and other constraints on development. The term developed industrial lands includes both lands wholly or partially utilized for industrial related purposes; these lands may have additional development capacity. Table 4-9: Distribution of Vacant Industrial Land Area by Parcel Size by Subregion as Percentage, 2010 Less than 10 acres to 20 acres Subregion 10 acres 20 acres and over North Shore 33.9% 0.0% 66.1% Vancouver 76.1% 23.9% 0.0% Burnaby / New West. 41.0% 26.6% 32.4% Northeast Sector 50.3% 13.1% 36.6% Richmond 27.8% 15.1% 57.1% Delta / TFN 25.6% 7.4% 67.0% Surrey / White Rock 54.0% 12.2% 33.8% Langleys 85.5% 6.2% 8.3% Ridge - Meadows 18.3% 19.4% 62.3% Total 42.8% 13.1% 44.1% Note: The term vacant industrial lands includes lands planned for future industrial use, but not currently utilized for industrial activity; this may include properties with non-industrial uses, as well as properties having environmental and other constraints on development. The term developed industrial lands includes both lands wholly or partially utilized for industrial related purposes; these lands may have additional development capacity. The following figure shows the distribution by parcel size of vacant industrial lands within each subregion. METRO VANCOUVER 2010 INDUSTRIAL LANDS INVENTORY Page 28
136 Figure 4-9: Vacant Industrial Lands by Parcel Size and Subregion, Land Area (acres) North Shore Vancouver Burnaby / New West. Northeast Sector Richmond Delta / TFN Surrey / White Rock Langleys Ridge Meadows under 1 ac 1 to 4.9 ac 5 to 9.9 ac 10 to 19.9 ac 20 to 49.9 ac over 50 ac Note: The term vacant industrial lands includes lands planned for future industrial use, but not currently utilized for industrial activity; this may include properties with non-industrial uses, as well as properties having environmental and other constraints on development. The term developed industrial lands includes both lands wholly or partially utilized for industrial related purposes; these lands may have additional development capacity. The regional supply of larger (greater than 20 acres) vacant industrial properties was predominantly located in Richmond, Delta / TFN, Surrey / White Rock, and Ridge Meadows. Surrey / White Rock and the Langleys had a significant number of smaller (under 5 acres) properties. METRO VANCOUVER 2010 INDUSTRIAL LANDS INVENTORY Page 29
137 4.4 Revised 2005 Inventory Based on the refined data and definitions applied to the 2005 inventory (see section 2.3), the net change from the original 2005 inventory to the revised 2005 inventory was 931 acres, however within this was a reduction of 209 acres of vacant lands and an increase of 1,140 acres of developed lands. This refinement to the 2005 inventory allows for the comparison of the 2005 results with the 2010 results. Table 4-10: 2005 Original and 2005 Revised Inventory and Net Change Original 2005 Revised 2005 Net Change Industrial Land Industrial Land Original 2005 vs Revised 2005 Industrial Land Status (acres) (acres) (acres) Vacant 6,859 6,650 (209) Developed 19,230 20,370 1,140 Total Industrial Land 26,089 27, The following table shows the 2005 inventory (revised) for the region: total 27,000 acres (10,900 ha), of which 20,400 acres (8,200 ha) were developed and 6,600 acres (2,700 ha) were vacant. Table 4-11: Distribution of Industrial Lands by Subregion, 2005 (Revised) Developed Vacant Total Industrial Land Industrial Land Industrial Land Regional Subregion (Acres) (Acres) (Acres) Share North Shore , % Vancouver 1, , % Burnaby / New West. 3, , % Northeast Sector 2, , % Richmond 3,243 1,244 4, % Delta / TFN 2, , % Surrey / White Rock 3,628 2,564 6, % Langleys 1, , % Ridge - Meadows , % Metro Vancouver 20,370 6,650 27, % Note: The term vacant industrial lands includes lands planned for future industrial use, but not currently utilized for industrial activity; this may include properties with non-industrial uses, as well as properties having environmental and other constraints on development. The term developed industrial lands includes both lands wholly or partially utilized for industrial related purposes; these lands may have additional development capacity. Appendix C includes the revised 2005 inventory tables by municipality and subregion. All other references in this study to the 2005 inventory are to the revised 2005 numbers. METRO VANCOUVER 2010 INDUSTRIAL LANDS INVENTORY Page 30
138 4.5 Change in Inventory Between The refined methodology used in 2010 was applied to determine the revised 2005 inventory to allow for direct comparison of results and assessment of changes over the period. Using consistent methodology, between 2005 and 2010, there was a net increase in industrial land in the region of 1,226 acres; this comprised a notable net increase in the amount of developed lands (1,242 acres), and a minor net decrease in the amount of vacant lands (16 acres). This represented a net 4.5% increase in the size of the industrial land inventory over the period. The percentage of the total inventory that was developed was nearly equal in both years, at 76%. This total does not consider the change in profile / location / quality of the inventory over the period. Table 4-12: Net Change In Regional Industrial Land Inventory Between Revised Net Change Industrial Land Industrial Land 2005 vs 2010 Industrial Land Status (acres) (acres) (acres) Vacant 6,650 6,634 (16) Developed 20,370 21,612 1,242 Total Industrial Land 27,020 28,246 1,226 It is important to note that these are the net changes in areas between the two periods. Within these changes, there were both significant additions to the inventory and significant deletions, as well as many other smaller changes. The reason that the total inventory was higher in 2010 than in 2005 is due to the total additions to the inventory exceeding the total removals from the inventory for the period. Further, the net change in the vacant land inventory was negligible because other vacant lands, such as in Tsawwassen First Nation, Delta and Maple Ridge, were added to the land inventory during this period. If there had not been a number of significant additions over the period, the net change in total inventory would have been negative. Of the 2005 vacant industrial land inventory, by ,314 acres had become developed. Further, of the 2005 developed industrial land inventory, by acres had become vacant. This provides for a gross change of 1,314 acres over the period, and a net change of 1,141 acres. Within the subregions, the change in inventory is shown in the following table. The largest net increases in developed land were in Richmond and Surrey/White Rock, thus reducing the supply of vacant industrial lands in these subregions. Adding to the supply of vacant industrial lands was Delta/TFN. METRO VANCOUVER 2010 INDUSTRIAL LANDS INVENTORY Page 31
139 Table 4-13: Net Change In Industrial Land Inventory by Subregion, Net Change Net Change Net Change Developed Vacant Total Industrial Land Industrial Land Industrial Land Subregion (Acres) (Acres) (Acres) North Shore 16 (16) - Vancouver 5 (6) (1) Burnaby / New West. 46 (47) (1) Northeast Sector 53 (54) (1) Richmond 309 (309) - Delta / TFN Surrey / White Rock 413 (271) 142 Langleys 186 (104) 82 Ridge - Meadows Metro Vancouver 1,242 (16) 1,226 Note: The term vacant industrial lands includes lands planned for future industrial use, but not currently utilized for industrial activity; this may include properties with non-industrial uses, as well as properties having environmental and other constraints on development. The term developed industrial lands includes both lands wholly or partially utilized for industrial related purposes; these lands may have additional development capacity. The following table shows the major / notable industrial land additions over the 2005 to 2010 period. This included the Tsawwassen First Nations (332 acres), Pitt Meadows Airport Area (188 acres), and Tilbury Delta (185 acres). These represented new lands (both developed and vacant) in the industrial inventory, although most of the lands added to the inventory were vacant as of Table 4-14: Notable Industrial Land Additions, Developed Vacant Total Industrial Land Industrial Land Industrial Land Areas (Acres) (Acres) (Acres) Tsawwassen First Nation Pitt Meadows (Airport Area) Delta (Tilbury) Delta (Gravel Pit) Maple Ridge (northeast) Langley Township (Willoughby) Total Acres ,047 The following table shows the major / notable industrial land deletions over the 2005 to 2010 period. This included significant removals in the Surrey Campbell Heights area (231 acres) due to refinement of their OCP / NCP regarding environmental constrains, the Surrey South Fraser Perimeter Road ROW (200 acres), and Fraser Mills in Coquitlam (65 acres). These represent removed lands (both developed and vacant) from the industrial inventory. METRO VANCOUVER 2010 INDUSTRIAL LANDS INVENTORY Page 32
140 Table 4-15: Notable Industrial Land Deletions, Developed Vacant Total Industrial Land Industrial Land Industrial Land Areas (Acres) (Acres) (Acres) Surrey (Campbell Heights - topography/environmental) Surrey (South Fraser Perimeter Road Right-of-Way) Coquitlam (Fraser Mills) Delta (South Fraser Perimeter Road Right-of-Way) Coquitlam (Gravel Pit) Burnaby (Brentwood Town Centre) Langley Township (Golden Ears Right-of-Way) Total Acres METRO VANCOUVER 2010 INDUSTRIAL LANDS INVENTORY Page 33
141 4.6 Pre-2005 Industrial Lands Inventories The methodologies for earlier industrial land inventories in Metro Vancouver, such as the ones in 1996 and 1981, were different and less comprehensive than the more recent inventories. A general discussion is presented below. The numbers from the 1996 study and earlier are an order of magnitude comparison. As shown in the following table, in 1981, there were an estimated 11,200 acres (4,500 ha) of developed industrial land in the region (current Metro Vancouver boundaries). The industrial land supply in 1996 was estimated at 29,900 acres (12,100 ha) in Metro Vancouver. The developed industrial land inventory was estimated at 18,500 acres (7,500 ha), and the vacant industrial land was 11,400 acres (4,600 ha). In 2005, the developed industrial land supply was approximately 20,400 acres (8,200 ha) and the vacant industry supply was 6,600 acres (2,700 ha), for a total of 27,000 acres of industrial lands. In 2010, there were approximately 28,200 acres (11,400 ha) of industrial land in Metro Vancouver; 21,600 acres developed, and 6,600 acres vacant. Table 4-16: Comparison of Industrial Land Inventories Amount of Industrial Land (acres) (Revised) 2010 Vacant Industrial Land n/a 11,407 6,650 6,634 Developed Industrial land 11,159 18,508 20,370 21,612 Total Industrial Land n/a 29,914 27,020 28,246 Note: Due to the different methodologies for completing the 1996 inventories, the data sets should not be compared quantitatively only at an order of magnitude level. Based on these limited inventories, it appears that the inventory of developed industrial lands has increased over the past three decades. The net developed inventory increased by an annual average of 490 acres for the period, 210 acres for the period, and 250 acres for the period. This indicates that there has been a strong, although declining, demand for additional developed industrial lands. The vacant inventory data for the earlier two periods are less dependable. For at least the period, the total vacant inventory stayed approximately the same; however, although the inventory total was approximately similar, the lands within this inventory may have changed. METRO VANCOUVER 2010 INDUSTRIAL LANDS INVENTORY Page 34
142 4.7 Industrial Land Absorption Over the 2005 to 2010 period, there was a net 1,242 acre increase in lands that were identified as developed which can be considered absorbed. This can be attributed to previously vacant (or used for other purposes) lands that were developed (as defined in this study) and added to the industrial inventory of developed lands, minus any developed industrial lands that were removed from the inventory over this time. This represented on average a net annual absorption rate of approximately 250 acres for the five year period. However it is important to note that this absorption of land represents industrial lands as defined in this study. Lands that went from a vacant classification to a developed classification may have actually only become associated with industrial activity, including outdoor storage, rather than the construction of an industrial building. The following figure shows the location of lands that were absorbed during the 2005 to 2010 period. The text labels within each sub-area note the net amount of industrial land absorbed over the period, and the percent of the regional total this represents. These lands which became developed over the five year period were distributed throughout the region, with significant areas in Surrey, Richmond, and the Langleys. METRO VANCOUVER 2010 INDUSTRIAL LANDS INVENTORY Page 35

143 Figure 4-10: Map of 2005 Vacant Lands in Metro Vancouver that Developed by 2010 METRO VANCOUVER 2010 INDUSTRIAL LANDS INVENTORY Page 36
2011 Census Bulletin #4 Dwellings & Structure Type in Metro Vancouver
 2011 Census Bulletin #4 Dwellings & Structure Type in Metro Vancouver Regional Dwelling Count According to the 2011 Census figures recently released by Statistics Canada, there were 891,340 occupied private
Date: April 15, 2016 Meeting Date: May 6, Park for Other Land to be used for Park Purposes Bylaw No. 1233, 2016 ;
 Section G 1.1 To: From: Regional Parks Committee Renato Jadrijev, Senior Property Negotiator, Financial Services Chris Plagnol, Director, Board and Information Services/Corporate Officer, Legal and Legislative
Metro Vancouver's 2011 Generalized Land Use by Municipality (Net Land Area - excluding dedicated road right-of-way and water bodies)
") METRO VANCOUVER Land Percent Share Land Use Category Area (ha) of METRO Total Agriculture 48,822 17.1% Airport/Airstrip 1,577 0.6% Cemetery 292 0.1% Commercial 2,980 1.0% Harvesting and Research 8,630
METRO VANCOUVER Land Percent Share Land Use Category Area (ha) of METRO Total Agriculture 48,822 17.1% Airport/Airstrip 1,577 0.6% Cemetery 292 0.1% Commercial 2,980 1.0% Harvesting and Research 8,630
Market Update March 2017
 Market Update March 2017 The following charts provide statistics for detached townhouses and condos for areas included in the Real Estate Board of Greater as well as the Fraser Valley Real Estate Board.
Metro Vancouver Purpose-Built Rental Housing Inventory and Risk Analysis. Profile for the District of West Vancouver
 Metro Vancouver Purpose-Built Rental Housing Inventory and Risk Analysis Profile for the District of West Vancouver May 2012 Prepared for: Metro Vancouver By: Coriolis Consulting Corp. Table of Contents
Home sale and listing activity continue to chart a steady path for the region s housing market
 News Release FOR IMMEDIATE RELEASE: Home sale and listing activity continue to chart a steady path for the region s housing market VANCOUVER, B.C. April 2, home sales in Greater Vancouver outpaced last
2016 Census Bulletin Changing Composition of the Housing Stock
 Metro Vancouver s Role Every five years, the Census of Canada provides benchmark data that is instrumental in analyzing and evaluating local government planning policies and services. Representing member
Vancouver Real Estate Wave 2 July 26, 2016
 Vancouver Real Estate Wave 2 July 26, 2016 (T-DENOTES TRACKING, N-DENOTES NEW) T-1. First of all, please indicate the specific Metro Vancouver municipality in which you live: Burnaby Coquitlam Delta and
SPECIAL COUNCIL MEETING AGENDA December 12, 2017 Following Council Workshop Blaney Room 1 st Floor, Maple Ridge City Hall
 City of Maple Ridge SPECIAL COUNCIL MEETING AGENDA December 12, 2017 Following Council Workshop Blaney Room 1 st Floor, Maple Ridge City Hall 1.0 CALL TO ORDER 2.0 APPROVAL OF THE AGENDA 3.0 REPORTS AND
Condominiums and townhomes in high demand across Metro Vancouver
 News Release FOR IMMEDIATE RELEASE: Condominiums and townhomes in high demand across Metro Vancouver VANCOUVER, BC May 2, Demand for condominiums and townhomes continues to drive the Metro Vancouver* housing
Annual (2013) Review of the Surrey Official Community Plan
 Review of the Surrey Official Community Plan") CORPORATE REPORT NO: R118 COUNCIL DATE: JUNE 23, 2014 REGULAR COUNCIL TO: Mayor & Council DATE: June 23, 2014 FROM: General Manager, Planning and Development FILE: 6440-01 SUBJECT: Annual (2013) Review
CORPORATE REPORT NO: R118 COUNCIL DATE: JUNE 23, 2014 REGULAR COUNCIL TO: Mayor & Council DATE: June 23, 2014 FROM: General Manager, Planning and Development FILE: 6440-01 SUBJECT: Annual (2013) Review
Prospective home buyers remain on the sidelines in March
 News Release FOR IMMEDIATE RELEASE: Prospective home buyers remain on the sidelines in VANCOUVER, BC April 2, Metro Vancouver* home sales dipped to the lowest levels seen in in more than three decades.
News Release FOR IMMEDIATE RELEASE:
 News Release FOR IMMEDIATE RELEASE: Home buyers remain active despite reduced selection VANCOUVER, B.C. February 3, 2015 The first month 2015 saw home sale activity above historical norms, while the number
Metro Vancouver continues to experience above-average demand and below-average supply
 News Release FOR IMMEDIATE RELEASE: Metro Vancouver continues to experience above-average demand and below-average supply VANCOUVER, BC December 4, Metro Vancouver* saw modest home listing changes and
October sales were 28.5 per cent below the 10-year October sales average of 2,700.
 News Release Housing market sees slight changes in Vancouver, B.C. November 2, The Greater Vancouver housing market saw a slight increase in the number home sales, a slight reduction in the number listings,
Metro Vancouver home buyers compete for fewer home listings
 News Release FOR IMMEDIATE RELEASE: Metro Vancouver home buyers compete for fewer home listings VANCOUVER, B.C. October 2, Conditions continue to favour home sellers across *Metro Vancouver s housing market.
Date: May 15, 2014 Meeting Date: May 23, Corporation of Delta Proposed Amendment to Metro Vancouver 2040: Shaping our Future for Southlands
 Section G 1.1 To: From: GVRD Board of Directors Allan Neilson, General Manager, Planning, Policy and Environment Department Elisa Campbell, Director of Regional and Strategic Planning Planning, Policy
ATTACHMENT 2: CONSULTATION UPDATE NO. 3 PART 3 LANDOWNER ENGAGEMENT
 ATTACHMENT 2: CONSULTATION UPDATE NO. 3 PART 3 LANDOWNER ENGAGEMENT TABLE OF CONTENTS 1.0 INTRODUCTION... 1 Page 1.1 Purpose of Update... 1 1.2 Program Scope (May 1 to December 31, 2014)... 1 2.0 COMPONENTS
4.0. Residential. 4.1 Context
 4. 0Residential 4.1 Context In 1986, around the time of Burnaby s last Official Community Plan, the City had a population of 145,000 living in 58,300 residential units. By 1996, there were 179,000 people
Housing market conditions continue to favour home buyers
 News Release FOR IMMEDIATE RELEASE: Housing market conditions continue to favour home buyers VANCOUVER, BC March 4, The Metro Vancouver* housing market saw increased supply from home sellers and below
Home sales remain at record levels across Metro Vancouver
 News Release FOR IMMEDIATE RELEASE: Home sales remain at record levels across Metro Vancouver VANCOUVER, BC May 3, Last month was the highest selling on record for Metro Vancouver.* Residential property
Low supply continues to limit Metro Vancouver home buyers
 News Release FOR IMMEDIATE RELEASE: Low supply continues to limit Metro Vancouver home buyers VANCOUVER, BC March 2, Reluctance amongst Metro Vancouver* home sellers is impacting sale and price activity
News Release FOR IMMEDIATE RELEASE:
 News Release FOR IMMEDIATE RELEASE: Demand remains elevated across the Metro Vancouver housing market VANCOUVER, BC June 2, Metro Vancouver* homes continue to sell at an unprecedented rate in communities
News Release FOR IMMEDIATE RELEASE:
 News Release FOR IMMEDIATE RELEASE: Home buyers remain active across Metro Vancouver VANCOUVER, BC July 5, Home buyers continue to compete for homes listed for sale across the Metro Vancouver housing market.
Reduced demand is allowing housing supply to accumulate
 News Release FOR IMMEDIATE RELEASE: Reduced demand is allowing housing supply to accumulate VANCOUVER, BC June 4, Home buyer demand continues to decline across the Metro Vancouver* housing market. The
Metro Vancouver housing market off to a quieter start than last year
 News Release FOR IMMEDIATE RELEASE: Metro Vancouver housing market f to a quieter start than last year VANCOUVER, BC February 2, 2017 Home sales and listings trends are below long-term averages in the
Date: September 17, 2018 Meeting Date: October 5, Progress Update on the 2018 Regional Parking Study Household Survey
 To: From: Raymond Kan, Senior Planner, Regional Planning 5.4 Date: September 17, 2018 Meeting Date: October 5, 2018 Subject: Progress Update on the 2018 Regional Parking Study Household Survey RECOMMENDATION
Home listings at four-year October high as sales remain below typical levels
 News Release FOR IMMEDIATE RELEASE: Home listings at four-year high as sales remain below typical levels VANCOUVER, BC November 2, Home sale activity across Metro Vancouver* remained below long-term historical
Fewer home sales and listings in the first quarter of 2018
 News Release FOR IMMEDIATE RELEASE: Fewer home sales and listings in the first quarter VANCOUVER, BC April 4, Home buyers and sellers were less active in Metro Vancouver* throughout the first quarter.
News Release FOR IMMEDIATE RELEASE:
 News Release FOR IMMEDIATE RELEASE: Metro Vancouver home sales set record pace in VANCOUVER, B.C. July 3, Last month was the highest selling, and the second highest overall monthly total, on record for
Home sale and listing activity dip below historical averages in October
 News Release FOR IMMEDIATE RELEASE: Home sale and listing activity dip below historical averages in VANCOUVER, BC November 2, Reduced home sale and listing activity are changing market dynamics in communities
Ry from BC Residential Report
 Ry from BC Residential Report 1 P a g e BC Housing develops and administers a wide range of initiatives supporting different housing options across British Columbia (BC). In partnership with the private
Home sales down, listings up across Metro Vancouver
 News Release FOR IMMEDIATE RELEASE: Home sales down, listings up across Metro Vancouver VANCOUVER, BC May 2, The Metro Vancouver* housing market saw fewer home buyers and more home sellers in. The Real
Steady trends continue in the Greater Vancouver housing market
 News Release FOR IMMEDIATE RELEASE: Steady trends continue in the Greater Vancouver housing market VANCOUVER, B.C. February 4, 2014 The first month 2014 saw home sale and listing totals outpace historical
News Release FOR IMMEDIATE RELEASE:
 News Release FOR IMMEDIATE RELEASE: Market activity picks up in VANCOUVER, BC June 2, Home buyer activity returned to near record levels across the Metro Vancouver* housing market in. Residential property
Competition continues to drive Metro Vancouver s housing market
 News Release FOR IMMEDIATE RELEASE: Competition continues to drive Metro Vancouver s housing market VANCOUVER, B.C. September 2, Metro Vancouver* home buyers spent the summer months searching for their
INVENTORY POLICY For Real Property
 INVENTORY POLICY For Real Property (Consolidated Revenue Fund Entities) Page 1-10 CONTENTS 1. TITLE... 3 2. OVERVIEW... 3 3. PURPOSE... 3 4. POLICY STATEMENT... 3 5. APPLICATION... 7 6. EVALUATION AND
180 acres of Development Land in CentrePort for Sale
 PERIMETER HIGHWAY Future Lands New Opportunity CN RAIL LINE Chief Peguis Extension ROUTE 90 General Logistics Park Recreation/ Open Space Brookside Business Park PERIMETER HIGHWAY Municipal Boundary Manufacturing
INVENTORY POLICY For Real Property
 INVENTORY POLICY For Real Property (Broader Public Sector Entities) Page 1-12 CONTENTS 1. TITLE... 3 2. OVERVIEW... 3 3. PURPOSE... 3 4. POLICY STATEMENT... 3 5. APPLICATION... 7 6. EVALUATION AND REVIEW...
News Release FOR IMMEDIATE RELEASE:
 News Release FOR IMMEDIATE RELEASE: Metro Vancouver sees fewer home sales and more listings in VANCOUVER, BC August 2, Home buyer activity returned to more typical summer levels in Metro Vancouver* last
Burquitlam-Lougheed Neighbourhood Plan Market Analysis Findings and Lessons Learned
 Burquitlam-Lougheed Neighbourhood Plan Market Analysis Findings and Lessons Learned Doc. # 1999397 Realistic and Strategic Approach In order to capitalize on the opportunity to draw investment into the
Last month s sales were the second lowest February total in the region since 2001 and 30.9 per cent below the 10-year sales average for the month.
 News Release FOR IMMEDIATE RELEASE: Home sales continue at below average pace VANCOUVER, B.C. March 4, Home sale activity has trended below historical averages for a full year in the Greater Vancouver
October sales were 28.5 per cent below the 10-year October sales average of 2,700.
 News Release Housing market sees slight changes in Vancouver, B.C. November 2, The Greater Vancouver housing market saw a slight increase in the number home sales, a slight reduction in the number listings,
SENIORS HOUSING REPORT British Columbia
 H o u s i n g M a r k e t I n f o r m a t i o n SENIORS HOUSING REPORT C a n a d a M o r t g a g e a n d H o u s i n g C o r p o r a t i o n Date Released: 2014 Highlights The demand for seniors housing
Home sale and listing activity reach historical norms in 2014
 News Release FOR IMMEDIATE RELEASE: Home sale and listing activity reach historical norms in VANCOUVER, B.C. January 5, 2015 It was a typical year for the Metro Vancouver housing market in certain respects.
CHAPTER 2 VACANT AND REDEVELOPABLE LAND INVENTORY
 CHAPTER 2 VACANT AND REDEVELOPABLE LAND INVENTORY CHAPTER 2: VACANT AND REDEVELOPABLE LAND INVENTORY INTRODUCTION One of the initial tasks of the Regional Land Use Study was to evaluate whether there is
Mixed Income Transit-Oriented Rental Housing Study Transit Ridership
 Mixed Income Transit-Oriented Rental Housing Study Transit Ridership Margaret Eberle SENIOR HOUSING PLANNER Housing Central Conference November 216 Activity 2: Transit Ridership Effects 3,, Do mixed-income
A Bylaw to Authorize the Sale and Exchange of a Portion of Derby Reach Regional Park for Other Land to be Used for Park Purposes
 GREATER VANCOUVER REGIONAL DISTRICT SALE AND EXCHANGE OF A PORTION OF DERBY REACH REGIONAL PARK FOR OTHER LAND TO BE USED FOR PARK PURPOSES BYLAW NO. 1233, 2016 A Bylaw to Authorize the Sale and Exchange
How Does the City Grow?
 This bulletin summarizes information from the City of Toronto s Land Use Information System II, providing an overview of the development projects received by the City Planning Division between January
Metro Vancouver Region
 In The December Metro Vancouver Region December 2014 1 Prepared for the Planning, Policy and Environment Department of Metro Vancouver by: Mark Robbins - KM Consulting Kathleen Zimmerman - AgResults Consulting
Subject: Affordable Housing Reserve Fund Policy Bylaw No. 3866, 2008
 For Council Our File: 10-5040-20/AFFHOU/2008-1 Doc #: 727285.v1 To: From: City Manager General Manager Planning and Development Subject: Affordable Housing Reserve Fund Policy Bylaw No. 3866, 2008 For:
Produced by. State of the Market Quarterly Market Research Report
 Produced by 4 State of the Market Quarterly Market Research Report Cover Design by Sponsored by Table of Contents - UDI State of the Market Quarterly Publication ( ) 4 Population.. 7 1.1 Metro Vancouver
Land Value Estimates and Forecasts for Reston. Prepared for Reston Community Center April 2013
 Land Value Estimates and Forecasts for Reston Prepared for Reston Community Center April 2013 LAND VALUE ESTIMATES AND FORECASTS FOR RESTON COMMUNITY CENTER Purpose of the Analysis RCLCO (Robert Charles
KENNEDY SQUARE 128th & 88th Avenue, Surrey FOR LEASE
 KENNEDY SQUARE 128th & 88th Avenue, Surrey FOR LEASE 37,780 VPD along 88th High exposure retail Professional offices 66 parking stalls FOR MORE INFORMATION CONTACT WILL HALL STATHIS SAVVIS 604. 545. 0636
KENNEDY SQUARE 128th & 88th Avenue, Surrey FOR LEASE
 KENNEDY SQUARE 128th & 88th Avenue, Surrey FOR LEASE 37,780 VPD along 88th High exposure retail Professional offices 66 parking stalls FOR MORE INFORMATION CONTACT WILL HALL STATHIS SAVVIS 604. 545. 0636
Home buyer demand depends on property type
 News Release FOR IMMEDIATE RELEASE: Home buyer demand depends on property type VANCOUVER, BC February 2, Attached and apartment homes are in demand across Metro Vancouver* while detached home buyers are
Metro Vancouver home sales surpass 4,000 for third consecutive month
 News Release FOR IMMEDIATE RELEASE: Metro Vancouver home sales surpass 4,000 for third consecutive month VANCOUVER, B.C. June 2, It continues to be a competitive spring market for Metro Vancouver home
Metro Vancouver homes sales down across all property types
 News Release FOR IMMEDIATE RELEASE: Metro Vancouver homes sales down across all property types VANCOUVER, BC December 4, Home buyer demand remains below long-term historical averages in the Metro Vancouver*
City of Maple Ridge. Rental Housing Program: Secondary Suite Update and Next Steps
 City of Maple Ridge TO: Her Worship Mayor Nicole Read MEETING DATE: September 19, 2017 and Members of Council FROM: Chief Administrative Officer MEETING: Council Workshop SUBJECT: Rental Housing Program:
News Release FOR IMMEDIATE RELEASE
 News Release FOR IMMEDIATE RELEASE Greater Vancouver housing market holds steady and favours sellers in VANCOUVER, B.C. June 2, Home sales remained at typical springtime levels on the Multiple Listing
ALBERTA GRAZING LEASE 2005 IN-KIND COST SURVEY RESULTS
 ALBERTA GRAZING LEASE 2005 IN-KIND COST SURVEY RESULTS NOVEMBER 15, 2007 2007 Redstone Management Consulting Ltd. 1 INTRODUCTION ALBERTA GRAZING LEASE 2005 IN-KIND COST SURVEY RESULTS Redstone Management
Demand for homes continues to outpace supply in Metro Vancouver
 News Release FOR IMMEDIATE RELEASE: Demand for homes continues to outpace supply in Metro Vancouver VANCOUVER, BC April 4, A shortage residential property listings coupled with strong demand, particularly
Steady sales and diminished listings characterize 2017 for the Metro Vancouver housing market
 News Release FOR IMMEDIATE RELEASE: Steady sales and diminished listings characterize for the Metro Vancouver housing market VANCOUVER, BC January 3, 2018 After reaching record levels in 2015 and 2016,
Last month s sales were 33.5 per cent above the 10-year sales average for the month.
 News Release FOR IMMEDIATE RELEASE: Summer heat doesn t slow home buyer activity VANCOUVER, B.C. August 5, Metro Vancouver home sales were more than a third above the 10-year average in, while the number
News Release FOR IMMEDIATE RELEASE
 News Release FOR IMMEDIATE RELEASE Greater Vancouver housing market hits summer lull VANCOUVER, B.C. August 2, Residential property sales in Greater Vancouver remained at a 10-year low in, while the number
8Land Use. The Land Use Plan consists of the following elements:
 8Land Use 1. Introduction The Land Use Plan consists of the following elements: 1. Introduction 2. Existing Conditions 3. Opportunities for Redevelopment 4. Land Use Projections 5. Future Land Use Policies
News Release FOR IMMEDIATE RELEASE:
 News Release FOR IMMEDIATE RELEASE: Spring months bring balance to Greater Vancouver housing market VANCOUVER, B.C. June 4, While the number home sales in Greater Vancouver continued to trend below the
STATE OF THE MARKET. Ballistic Arts '-.:7MEDIA STUDIOS INC. TERRA114i\tJ QUARTERLY MARKET RESEARCH REPORT URBAN ANALYTICS SPONSORED BY PRODUCED BY
 STATE OF THE MARKET QUARTERLY MARKET RESEARCH REPORT SPONSORED BY TERRA114i\tJ COVER DESIGN BY Ballistic Arts '-.:7MEDIA STUDIOS INC PRODUCED BY URBAN ANALYTICS Table of Contents UDI State of the Market
Metro Vancouver home sales decline below historical averages in 2018
 News Release FOR IMMEDIATE RELEASE: Metro Vancouver home sales decline below historical averages in VANCOUVER, BC January 3, 2019 Metro Vancouver* home sales in were the lowest annual total in the region
VANCOUVER, BC March 2, 2018 Metro Vancouver* home sales dipped below the longterm historical average in February.
 News Release FOR IMMEDIATE RELEASE: Home buyers were less active in VANCOUVER, BC March 2, Metro Vancouver* home sales dipped below the longterm historical average in. The Real Estate Board Greater Vancouver
Last month s sales were 28.7 per cent below the 10-year June sales average.
 News Release FOR IMMEDIATE RELEASE: Home seller supply grows as demand declines VANCOUVER, BC July 4, With home sale activity dipping below long-term historical averages, the supply homes for sale in Metro
METRO VANCOUVER REGIONAL DISTRICT HOUSING COMMITTEE
 METRO VANCOUVER REGIONAL DISTRICT HOUSING COMMITTEE Minutes of the Regular Meeting of the Metro Vancouver Regional District (MVRD) Housing Committee held at 1:09 p.m. on Friday, June 9, 2017 in the 2nd
Existing Land Use. Typical densities for single-family detached residential development in Cumberland County: 1
 Existing Land Use A description of existing land use in Cumberland County is fundamental to understanding the character of the County and its development related issues. Economic factors, development trends,
Steady trends continue in the Greater Vancouver housing market
 News Release Steady trends continue in the Greater Vancouver housing market VANCOUVER, B.C. December 3, Consistent home sale and listing activity has allowed balanced market conditions to prevail in the
VANCOUVER, BC December 2, 2016 Home buyer and seller activity remains near historical averages in the Metro Vancouver* housing market.
 News Release FOR IMMEDIATE RELEASE: Home sales and listings just below 10-year average VANCOUVER, BC December 2, Home buyer and seller activity remains near historical averages in the Metro Vancouver*
Home sale activity improves but remains below historical averages
 News Release FOR IMMEDIATE RELEASE: Home sale activity improves but remains below historical averages VANCOUVER, B.C. April 3, Lower levels both supply and demand in recent months are holding home prices
Spring delivers greater balance to Greater Vancouver housing market
 News Release FOR IMMEDIATE RELEASE: Spring delivers greater balance to Greater Vancouver housing market VANCOUVER, B.C. May 2, A closer relationship between home buyer demand and the supply homes for sale
News Release FOR IMMEDIATE RELEASE:
 News Release FOR IMMEDIATE RELEASE: Home buyer demand stays below historical averages in VANCOUVER, BC September 5, The Metro Vancouver 1 housing market continues to experience reduced demand across all
An Assessment of Sydney s Industrial Land Supply. A shortage of developable land has the potential to impact occupier location strategies
 An Assessment of Sydney s Industrial Land Supply A shortage of developable land has the potential to impact occupier location strategies At 4Q17 3 years 4.1% 37% 4 years Gross-take up above 1 million sqm
METHODOLOGY GUIDE VALUING LANDS IN TRANSITION IN ONTARIO. Valuation Date: January 1, 2016
 METHODOLOGY GUIDE VALUING LANDS IN TRANSITION IN ONTARIO Valuation Date: January 1, 2016 August 2017 August 22, 2017 The Municipal Property Assessment Corporation (MPAC) is responsible for accurately assessing
News Release FOR IMMEDIATE RELEASE:
 News Release FOR IMMEDIATE RELEASE: Demand for condominiums continues to outstrip supply VANCOUVER, BC July 5, The imbalance between supply and demand in the condominium market is creating home buyer competition
Table of Contents. Appendix...22
 Table Contents 1. Background 3 1.1 Purpose.3 1.2 Data Sources 3 1.3 Data Aggregation...4 1.4 Principles Methodology.. 5 2. Existing Population, Dwelling Units and Employment 6 2.1 Population.6 2.1.1 Distribution
ACRE DEVELOPMENT SITE OFFERING MEMORANDUM PLAINFIELD, ILLINOIS UNIQUE INDUSTRIAL OR MIXED-USE DEVELOPMENT OPPORTUNITY
 235 CHARLES PLAINFIELD, ILLINOIS UNIQUE INDUSTRIAL OR MIXED-USE DEVELOPMENT OPPORTUNITY OFFERING MEMORANDUM ACRE DEVELOPMENT SITE GREG PACELLI Director Land Advisory Group Greg.Pacelli@colliers.com T +1
Table of Contents. Title Page # Title Page # List of Tables ii 6.7 Rental Market - Townhome and Apart ment Rents
 RESIDENTIAL MONITORING REPORT 2013 Table of Contents Title Page # Title Page # List of Tables ii 6.7 Rental Market - Townhome and Apart ment Rents 21 List of Figures iii 7.0 Other Housing Demands and Trends
Paragraph 47 National Planning Policy Framework. rpsgroup.com/uk
 To boost significantly the supply of housing, local planning authorities should use their evidence base to ensure that their Local Plan meets the full, objectively assessed needs for market and affordable
Greater Vancouver residential property sale and listing activity below 10-year averages in November
 News Release Greater Vancouver residential property sale and listing activity below 10-year averages in Vancouver, B.C. December 4, Over the past six months, the Greater Vancouver housing market has seen
Table of Contents. UDI State of the Market Quarterly Publication (Q4 2017).. 4 Population Economic Indicators Economic Indicators...
.. 4 Population Economic Indicators Economic Indicators...") -217 Table of Contents UDI State of the Market Quarterly Publication ( 217).. 4 Population... 8 1.1 Metro Vancouver Population 27 Present 1.2 Metro Vancouver Population Growth Rate (%yoy) 1.3 British Columbia
-217 Table of Contents UDI State of the Market Quarterly Publication ( 217).. 4 Population... 8 1.1 Metro Vancouver Population 27 Present 1.2 Metro Vancouver Population Growth Rate (%yoy) 1.3 British Columbia
Forecast of Tax Revenues for Reston Community Center Reston, Virginia. Prepared for Reston Community Center March 2013
 Forecast of Tax Revenues for Reston Community Center Reston, Virginia Prepared for Reston Community Center March 2013 TAX BASE AND REVENUES FORECASTS FOR RESTON COMMUNITY CENTER Purpose of the Analysis
0.7 % 0.7 % 0.7 % 1.4 % 1,223. RENTAL MARKET REPORT Vancouver CMA $1,013 $1,159. Date Released: The overall vacancy rate *...
 Housing Market Information RENTAL MARKET REPORT Canada Mortgage and Housing Corpor ation Date Released: 2016 The overall vacancy rate *... DECREASED to Below CMA 0.7 % Similar to CMA Above CMA The average
METRO VANCOUVER INDUSTRIAL REVIEW JANUARY 19, 2017
 METRO VANCOUVER INDUSTRIAL REVIEW JANUARY 19, 2017 PANELISTS: BETH BERRY, BEEDIE DEVELOPMENT GROUP LEE HESTER, JLL JEFF MILLER, OXFORD PROPERTIES MODERATORS: CHRIS MACCAULEY, CBRE JASON KISELBACH, CBRE
July home sale activity increases in Greater Vancouver
 News Release home sale activity increases in Greater Vancouver VANCOUVER, B.C. August 2, Sunny weather did not slow the pace home sale activity in. Last month was the highest selling month the year in
Q Table of Contents
 218 -218 Table of Contents UDI State of the Market Quarterly Publication ( 218).. 4 Population... 8 1.1 Metro Vancouver Population 28 Present 1.2 Metro Vancouver Population Growth Rate (%yoy) 1.3 British
Contents Lists of Figures and Tables xi About the Author xiii Foreword xv Acknowledgments xvi Part I Introduction
 CHAPTER # Contents Lists of Figures and Tables... xi About the Author... xiii Foreword...xv Acknowledgments...xvi Part I Introduction... 1 1 Overview of Land Valuation Assignments and Adjustment Procedures...
City of Regina Underutilized Land Study External Stakeholder Report
 City of Regina Underutilized Land Study External Stakeholder Report March 2018 Developed by: Introduction The City of Regina has undertaken an Underutilized Land Study. This study investigated potential
News Release FOR IMMEDIATE RELEASE:
 News Release FOR IMMEDIATE RELEASE: sales exceed historical average VANCOUVER, BC November 2, Metro Vancouver* home sales exceeded typical historical levels in with the majority concentrated in the townhouse
News Release FOR IMMEDIATE RELEASE
 News Release FOR IMMEDIATE RELEASE Housing market factors indicate stability in recent months VANCOUVER, B.C. October 4, home sales in Greater Vancouver were consistent with activity experienced in the
News Release FOR IMMEDIATE RELEASE:
 News Release FOR IMMEDIATE RELEASE: More supply and less demand seen across Metro Vancouer housing market VANCOUVER, BC October 2, The supply homes for sale continued to increase across the Metro Vancouer*
News Release FOR IMMEDIATE RELEASE
 News Release FOR IMMEDIATE RELEASE Home sales remain steady in Greater Vancouver VANCOUVER, B.C. November 2, Greater Vancouver home sales have remained steady over the past four months, indicating stability
News Release FOR IMMEDIATE RELEASE
 News Release FOR IMMEDIATE RELEASE Buyer s market conditions continue in Greater Vancouver VANCOUVER, B.C. September 2, Conditions in the Greater Vancouver housing market continued to favour buyers in.
NEW HOMES REGISTRY REPORT
 December 218 British Columbia s Monthly NEW HOMES REGISTRY REPORT Leading Housing Market Indicator for B.C. Registered new homes data are a leading indicator of housing and economic 1 activity in British