An Early 2017 Peak. Orange County Housing Report: August 13, Good Afternoon!
|
|
|
- Job Palmer
- 5 years ago
- Views:
Transcription


, the median sales price has risen by 5.5%, and since 2012 has risen by 80%.")


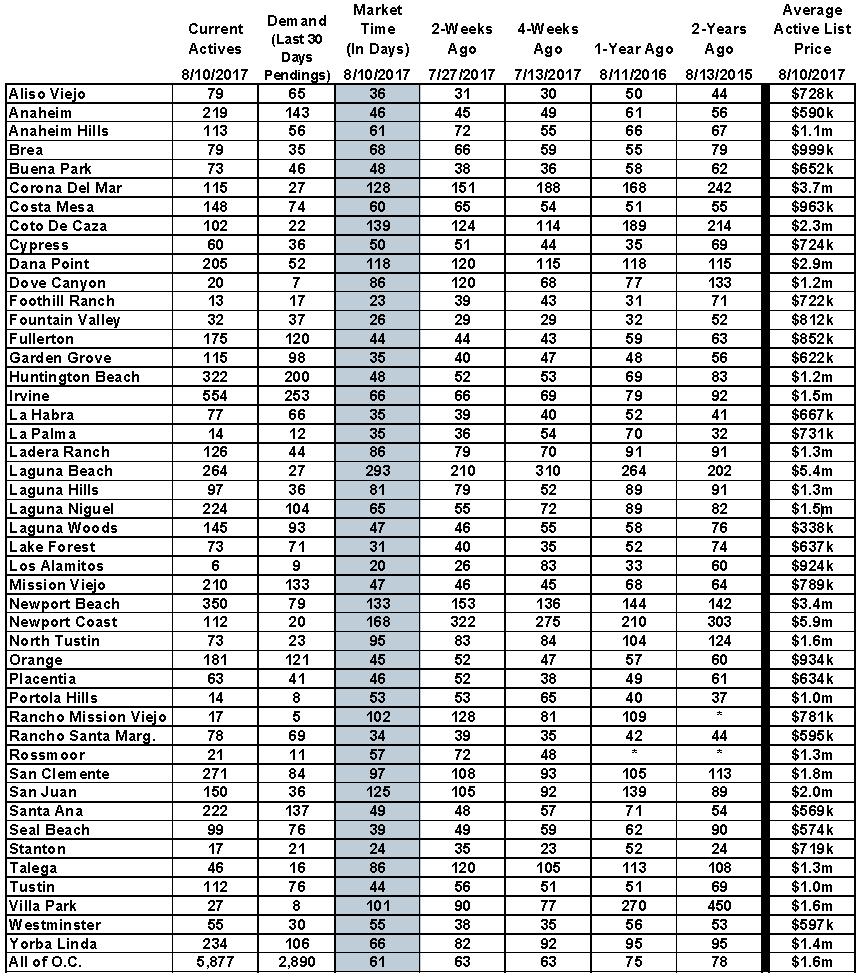
1 Orange County Housing Report: An Early 2017 Peak August 13, 2017 Good Afternoon! A low inventory peak means a hot seller s market for quite some time. Active Inventory Peak: the active inventory has been low for years, but this year it has been exceptionally low. The Orange County housing market has been frustrating buyers for years now and 2017 has proved to be especially frustrating. With 7% fewer FOR SALE signs this year compared to last year, there just have not been enough homes to satiate the voracious appetite of buyers. As a result of low inventory and off-the-chart demand, Orange County homes have appreciated non-stop since In the past year alone (July '17 over July '16), the median sales price has risen by 5.5%, and since 2012 has risen by 80%. Even with a rising median sales price, the historically low interest rate environment is keeping homes affordable. And, interest rates are projected to remain low for the rest of the year and into 2018 as well. An anemic inventory is only going to fuel future appreciation. Buyers will continue to compete with limited choices and multiple offers will persist, especially in the lower ranges, homes priced below $750,000. The inventory will remain low for quite some time because the active listing inventory peaked about a month ago, not quite reaching the 6,000 home mark. For perspective, the active inventory needs to remain above 8,000 homes for quite some time in order for the housing market to move from a seller s market to a balanced market, one that does not favor a buyer or seller.

2 In the past couple of weeks, the active inventory shed 90 homes and now totals 5,877. The peak occurred a month ago at 5,983 homes. Last year s peak was at 7,329 homes, 22% higher, or 1,346 more FOR SALE signs than this year. There are significantly fewer homes on the market throughout Orange County. The difference is substantial in certain areas of the county. For example, in Aliso Viejo there are 40% fewer homes on the market today compared to 2016 at this time. There are 79 available homes compared to 131. It was challenging finding a home last year, but this year has been significantly worse. With the exception of four areas, Corona del Mar, Cypress, Dana Point, and Portola Hills, there simply are not enough homes on the market compared to a year ago today. This year s peak is the lowest peak since Reports On Housing started tracking the local housing market back in Keeping that in mind, where will the Orange County housing market go from here? First, the active inventory will continue to drop though the end of the year, picking up steam in September. By that point, housing will have moved onto the Autumn Market when fewer homeowners will opt to place their homes on the market with the best time of the year to sell, the Spring and Summer Markets, officially in the rearview mirror. With such a low peak, the expected seasonal drop in the inventory from now until New Year s will result in a very anemic start to It may dip to the record lows of 2013, when there were only 3,161 homes to start the year. Quite simply, there were not enough homes to keep up with the strong demand and bidding wars escalated during the spring. That could be the case this coming year in spite of high prices. Additionally, the low interest rate environment will help fuel another crazy start to the Orange County housing market. Demand: Demand increased by 2% in the past couple of weeks. Demand, the number of homes placed into escrow within the prior month, increased by 55 pending sales, or 2%, in the past two-weeks and now totals 2,890. Demand is either near the same or considerably higher in every price range except


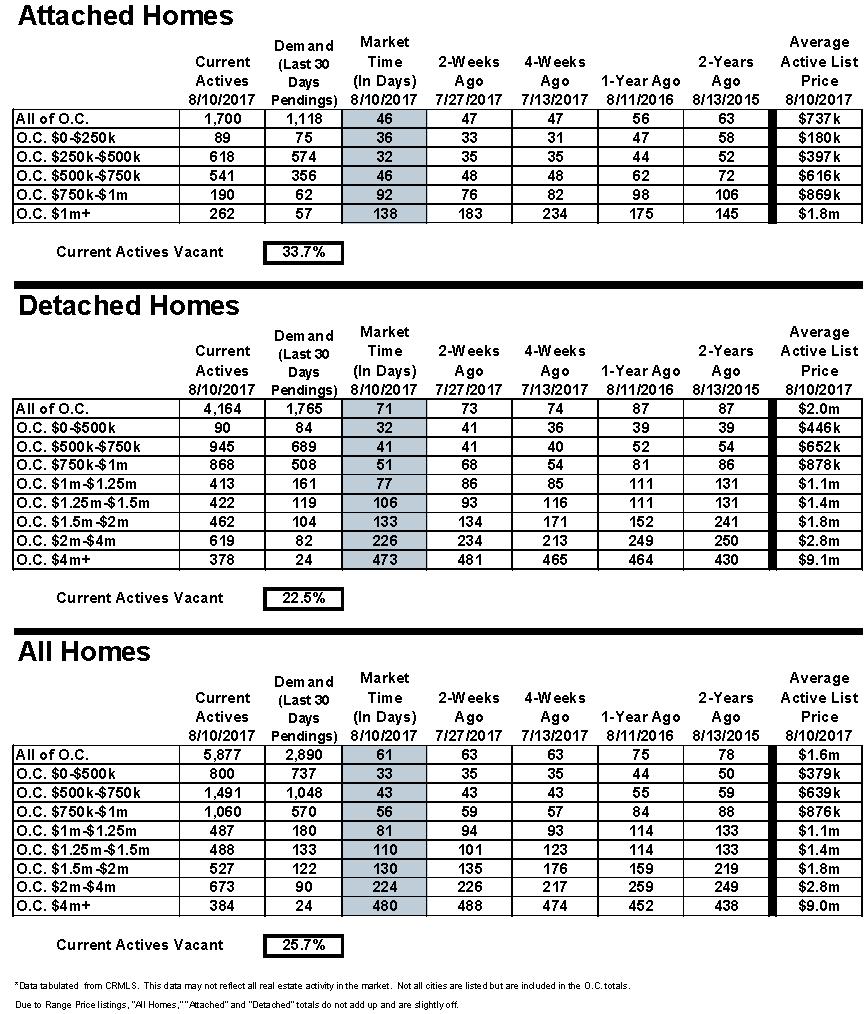
3 for properties priced below $500,000. With 41% fewer homes available below $500,000 compared to this time last year, it is no wonder that demand is off by 20% year over year in this range. Last year at this time, demand was at 2,935 pending sales, 45 more than today. The expected market time was at 75 days. The current expected market time dropped from 63 days two weeks ago to 61 today. At 61 days, the market is not quite a HOT seller s market, but a tepid seller s market with muted appreciation (60 to 90 days). Luxury End: Luxury demand dropped by 1% in the past couple of weeks and the inventory increased by only 7 homes. In the past two weeks, demand for homes above $1.25 million decreased from 373 to 369 pending sales, a 1% drop, the. The luxury home inventory increased from 2,065 homes to 2,072, nearly the same. The luxury end is not evolving that much right now. For homes priced between $1.25 million and $1.5 million, the expected market time increased from 101 to 110 days. For homes priced between $1.5 million to $2 million, the expected market time dropped from 135 to 130 days. In addition, for homes priced above $2 million, the expected market time decreased from 280 days to 278 days. At 278 days, a seller would be looking at placing their home into escrow around mid-may of next year.

4 Orange County Housing Market Summary: The active listing inventory decreased by 90 homes in the past couple of weeks, and now totals 5,877, a 2% drop. It officially reached a peak a month ago and is now slowly dropping. The inventory never reached 6,000 homes this year. Last year, there were 7,295 homes on the market, 1,418 more than today. There are 41% fewer homes on the market below $500,000 today compared to last year at this time and demand is down by 20%. Fewer and fewer homes and condominiums are now priced below $500,000. This price range is slowly disappearing. Demand, the number of pending sales over the prior month, increased by 55 homes in the past couple of weeks, and now totals 2,890. The average pending price is $844,699. The average list price for all of Orange County remained at $1.6 million. This number is high due to the mix of homes in the luxury ranges that sit on the market and do not move as quickly as the lower end. For homes priced below $750,000, the market is HOT with an expected market time of just 39 days. This range represents 39% of the active inventory and 62% of demand. For homes priced between $750,000 and $1 million, the expected market time is 56 days, a hot seller s market (less than 60 days). This range represents 18% of the active inventory and 19% of demand. For homes priced between $1 million to $1.25 million, the expected market time is 81, a tepid seller s market with very little appreciation. For luxury homes priced between $1.25 million and $1.5 million, the expected market time increased from 101 days to 110. For homes priced between $1.5 million to $2 million, the expected market time decreased from 135 to 130 days. For luxury homes priced above $2 million, the expected market time decreased from 280 to 278 days. The luxury end, all homes above $1.25 million, accounts for 36% of the inventory and only 13% of demand. The expected market time for all homes in Orange County dropped in the past couple of weeks from 63 days to 61 days, a tepid seller s market (60 to 90 days). From here, we can expect the market time to slowly rise as housing transitions into the Autumn Market.
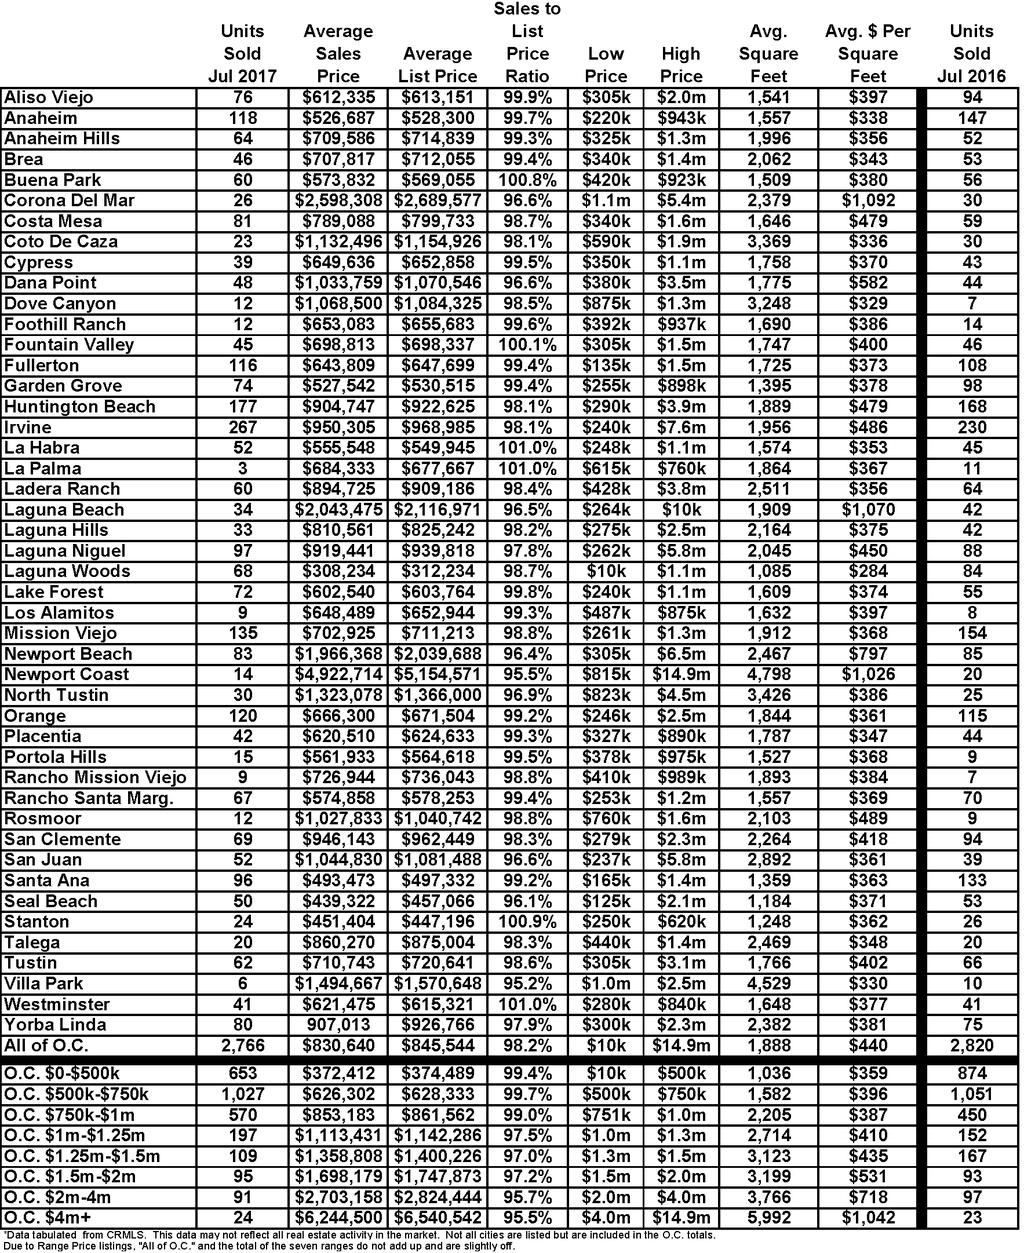
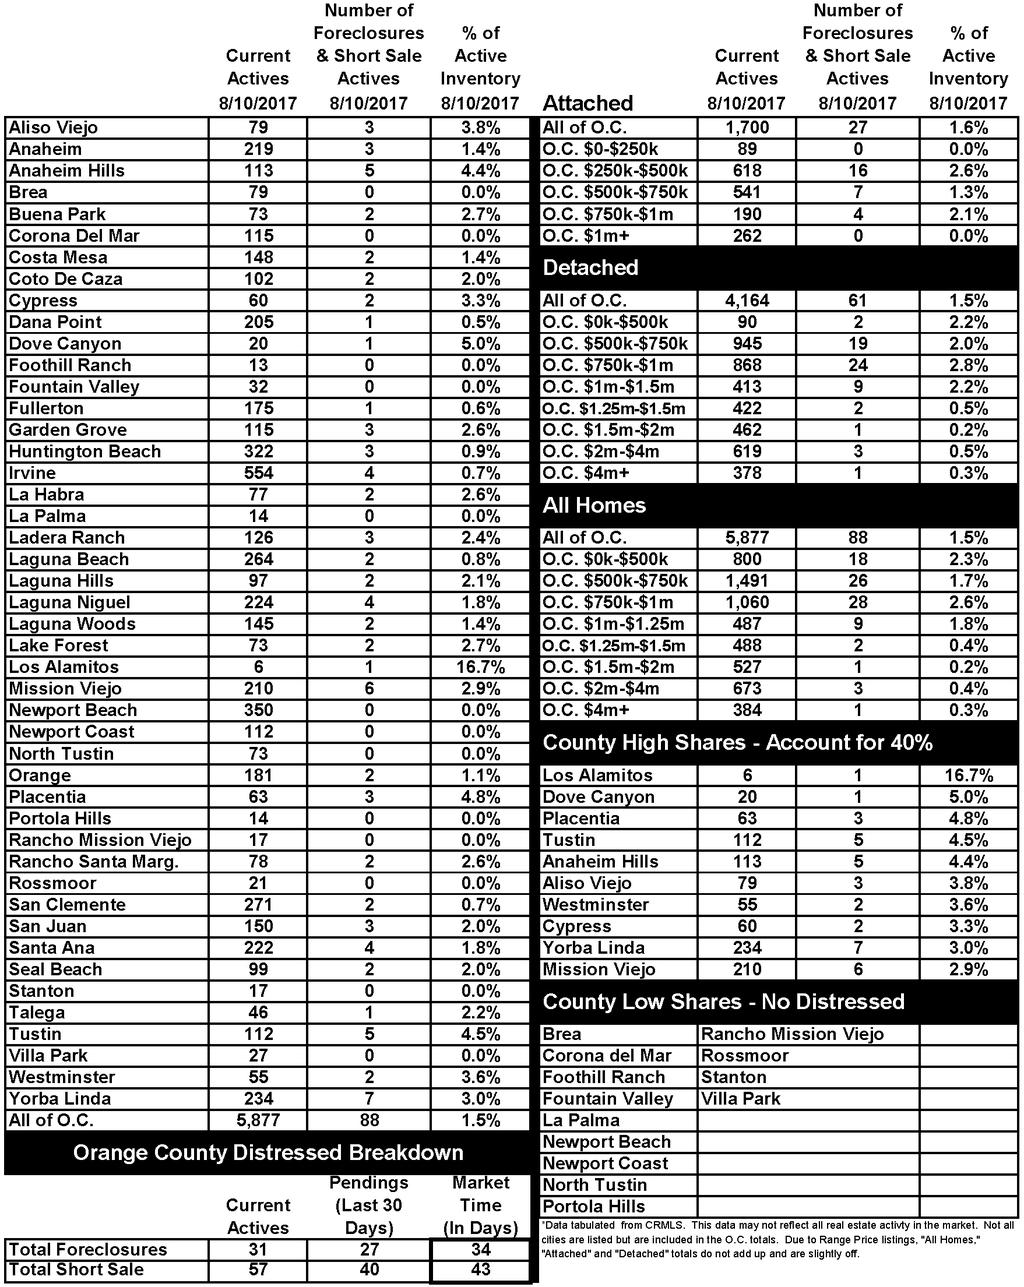
5 Distressed homes, both short sales and foreclosures combined, make up only 1.5% of all listings and 2.3% of demand. There are only 31 foreclosures and 57 short sales available to purchase today in all of Orange County, that s 88 total distressed homes on the active market, identical to two weeks ago. Last year there were 130 total distressed sales, 47% more than today. There were 2,766 closed sales in July, a 14% drop over June 2017 and a 1.9% decrease over July The sales to list price ratio was 98.2% for all of Orange County. Foreclosures accounted for just 0.8% of all closed sales and short sales accounted for 0.8%. That means that 98.4% of all sales were good ol fashioned equity sellers. Have a great week. Sincerely, Steven Thomas Quantitative Economics and Decision Sciences Copyright Steven Thomas, - All Rights Reserved. This report may not be reproduced in whole or part without express written permission by author.
6
7
8
9
10
Orange County Housing Report: I m Going to Wait to Buy. October 8, Good Afternoon!
 Orange County Housing Report: I m Going to Wait to Buy October 8, 2017 Good Afternoon! Many potential buyers are unaware that there is a significant cost in waiting to purchase. Cost of Waiting: Today
Orange County Housing Report: OC Housing is Sizzling. February 26, Good Afternoon!
 Orange County Housing Report: OC Housing is Sizzling February 26, 2017 Good Afternoon! With a very limited inventory, the Orange County housing market is extremely hot and values are on the rise. Hot Housing
Orange County Housing Report: Surf s Up!!! January 29, Good Afternoon!
 Orange County Housing Report: Surf s Up!!! January 29, 2017 Good Afternoon! For sellers, the conditions are perfect and there is no need to wait until the Spring Market to sell. Hot Housing Market: With
Orange County Housing Report
 Orange County Housing Report NOT ANYTIME SOON! November 19, 2017 With an unrelenting lack of supply of homes FOR SALE, it will not be a buyer s market anytime soon. Not a Buyer s Market: Since 2012, the
Orange County Housing Report: On Your Mark, Get Set, Go!!! January 28, Good Afternoon!
 Orange County Housing Report: On Your Mark, Get Set, Go!!! January 28, 2018 Good Afternoon! With the holidays behind us, the 2018 Orange County housing market is beginning to rev its engine. Heating Up
Orange County Housing Report: Like a Model Home. November 4, Good morning!
 Orange County Housing Report: Like a Model Home November 4, 2018 Good morning! Buyers expectations in the ideal home have evolved, so sellers need to price accordingly. Carefully Pricing: Sellers must
Orange County Housing Report: Too Much Noise. March 11, Good Afternoon!
 Orange County Housing Report: Too Much Noise March 11, 2018 Good Afternoon! Everybody seems to have an opinion about the direction of the housing market. Ignore the Noise: From talk of a housing bubble
Orange County Housing Report
 Orange County Housing Report THE 6-YEAR DROUGHT February 25, 2018 There have been far fewer homeowners selling their homes annually ever since the start of the Great Recession. Lack of Sellers: In the
Orange County Housing Report: OC Housing Mid Year Update. June 21, Hello there,
 Orange County Housing Report: OC Housing Mid Year Update June 21, 2014 Hello there, The first two quarters of 2014 are in the rearview mirror and this year is unquestionably different from prior years.
The Coldwell Banker Carlson Real Estate Market Report
 The Coldwell Banker Carlson Real Estate Market Report 2017 Year-End Stowe Area Report Our 2017 Year-End Market Report uses market-wide data, based on transactions that closed in 2017 in the Multiple Listing
DATA FOR JANUARY Published Feburary 16, Sales are down -14.0% month-over-month. The year-over-year comparison is up +2.5%.
 Permission is granted only to ARMLS Subscribers for reproduction with attribution on to ARMLS COPYRIGHT 2018. For questions regarding this publication contact Brand@ARMLS.com. DATA FOR JANUARY 2018 - Published
2015 First Quarter Market Report
 2015 First Quarter Market Report CAAR Member Copy Expanded Edition Charlottesville Area First Quarter 2015 Highlights: Median sales price for the region was up 5.1% over Q1-2014, rising from $244,250 to
nd Quarter Market Report
 2015 2 nd Quarter Market Report The voice of real estate in Central Virginia CAAR Member Copy Expanded Edition Charlottesville Area 2 nd Quarter 2015 Highlights: Closed sales in the Greater Charlottesville
NORTHERN VIRGINIA MARCH 2017
 STATPAK NORTHERN VIRGINIA MARCH 2017 McEnearney.com MARKET IN A MINUTE A SUMMARY OF MARKET CONDITIONS FOR FEBRUARY 2017 Contract activity in February 2017 was up 4.0% from February 2016, and there were
Year to Date (thru June)
") CAAR Market Report 2009 Mid-Year Published by the Charlottesville Area Association of REALTORS Where Are We Now? The pace of home purchases in the Charlottesville area continues to improve from the dismal
CAAR Market Report 2009 Mid-Year Published by the Charlottesville Area Association of REALTORS Where Are We Now? The pace of home purchases in the Charlottesville area continues to improve from the dismal
PRINCE GEORGE S COUNTY FEBRUARY 2018
 STATPAK PRINCE GEORGE S COUNTY FEBRUARY 2018 McEnearney.com MARKET IN A MINUTE A SUMMARY OF MARKET CONDITIONS FOR JANUARY 2018 Contract activity in January 2018 was up 20.9% from January 2017, and there
MONTGOMERY COUNTY JULY 2018
 STATPAK MONTGOMERY COUNTY JULY 2018 McEnearney.com MARKET IN A MINUTE A SUMMARY OF MARKET CONDITIONS FOR JUNE & FIRST HALF 2018 Contract activity in June 2018 was up 1.2% from June 2017, solely because
STATPAK MARKET IN A MINUTE A SUMMARY OF MARKET CONDITIONS FOR JULY McEnearney.com CONTRACTS URGENCY INDEX INVENTORY INTEREST RATES AFFORDABILITY
 STATPAK WASHINGTON, DC AUGUST 2018 McEnearney.com MARKET IN A MINUTE A SUMMARY OF MARKET CONDITIONS FOR JULY 2018 Contract activity in July 2018 was up just 0.5% from July 2017. Through the first seven
MARKET AREA UPDATE Report as of: 1Q 2Q 3Q 4Q
 MARKET AREA UPDATE Report as of: 1Q 2Q 3Q 4Q Year: 2013 Market Area (City, State): Arlington, Virginia Provided by (Company / Companies): McEnearney Associates, Inc. Realtors What are the most significant
STATPAK MARKET IN A MINUTE A SUMMARY OF MARKET CONDITIONS FOR JANUARY McEnearney.com CONTRACTS URGENCY INDEX INVENTORY INTEREST RATES
 STATPAK LOUDOUN COUNTY FEBRUARY 2018 McEnearney.com MARKET IN A MINUTE A SUMMARY OF MARKET CONDITIONS FOR JANUARY 2018 Contract activity in January 2018 was down just 2.0% from January 2017, but that is
MONTGOMERY COUNTY APRIL 2018
 STATPAK MONTGOMERY COUNTY APRIL 2018 McEnearney.com MARKET IN A MINUTE A SUMMARY OF MARKET CONDITIONS FOR MARCH 2018 Contract activity in March 2018 was down 6.0% from March 2017, and there were decreases
MONTGOMERY COUNTY MAY 2018
 STATPAK MONTGOMERY COUNTY MAY 2018 McEnearney.com MARKET IN A MINUTE A SUMMARY OF MARKET CONDITIONS FOR APRIL 2018 Contract activity in April 2018 was up just 0.9% from, but there were increases in four
STATPAK MARKET IN A MINUTE A SUMMARY OF MARKET CONDITIONS FOR JUNE & FIRST HALF McEnearney.com CONTRACTS URGENCY INDEX INVENTORY INTEREST RATES
 STATPAK LOUDOUN COUNTY JULY 2018 McEnearney.com MARKET IN A MINUTE A SUMMARY OF MARKET CONDITIONS FOR JUNE & FIRST HALF 2018 Contract activity in June 2018 was up 5.1% from June 2017. Through the first
The Desert Housing Report. Coachella Valley Median Detached Home Price March March 2019 $392,000 $415,000
 Median Price $450,000 $400,000 $350,000 $300,000 $250,000 $200,000 $150,000 Coachella Valley Median Detached Home Price March 2002 - $392,000 $415,000 CV Detached Median Price Summary 4% Growth Curve The
STATPAK MARKET IN A MINUTE A SUMMARY OF MARKET CONDITIONS FOR FEBRUARY McEnearney.com CONTRACTS URGENCY INDEX INVENTORY INTEREST RATES
 STATPAK LOUDOUN COUNTY MARCH 2018 McEnearney.com MARKET IN A MINUTE A SUMMARY OF MARKET CONDITIONS FOR FEBRUARY 2018 Contract activity in February 2018 was almost unchanged, up just 0.2% from February
Contents. off the fence. It s a good life!
 I hope you enjoy the latest edition of Brian Buffini s Real Estate Report. The goal of this piece is to help you stay educated on today s market and position yourself as a true professional and your clients
Monthly Market Watch for the Prescott Quad City Area. Provided by Keller Williams Check Realty Statistics from August 2012 Prescott MLS
 August 2012 Monthly Market Watch for the Prescott Quad City Area Provided by Keller Williams Check Realty Statistics from August 2012 Prescott MLS Report Overview: This report includes MLS data for the
Q SOUTHWEST REGION
 Quarterly Indicators SOUTHWEST REGION Monthly Snapshot Includes the Durango Area Association of REALTORS, Four Corners Board of REALTORS, Pagosa Springs Area Association of REALTORS and the San Luis Valley
Provided by Keller Williams Realty Professional Partners Statistics from September 2010 MLS
 Monthly Market Watch for Maricopa County An overview of what is happening in the Maricopa County real estate market (using September 2010 statistics) Report overview: This report includes MLS data for
STATPAK MARKET IN A MINUTE A SUMMARY OF MARKET CONDITIONS FOR JULY McEnearney.com CONTRACTS URGENCY INDEX INVENTORY INTEREST RATES AFFORDABILITY
 STATPAK LOUDOUN COUNTY AUGUST 2017 McEnearney.com MARKET IN A MINUTE A SUMMARY OF MARKET CONDITIONS FOR JULY 2017 Contract activity in July 2017 was down 8.7% from July 2016, and there were decreases in
STATPAK MARKET IN A MINUTE A SUMMARY OF MARKET CONDITIONS FOR APRIL McEnearney.com CONTRACTS URGENCY INDEX INVENTORY INTEREST RATES
 STATPAK WASHINGTON, DC MAY 2018 McEnearney.com MARKET IN A MINUTE A SUMMARY OF MARKET CONDITIONS FOR APRIL 2018 Contract activity in April 2018 was up 9.4% from April 2017, and four of the six price categories
Denver Realtor Reviews: Denver Real Estate Market Statistics July 2016
 Author: Denver Realtor Christopher Gibson Date: August 5, 2016 Denver Realtor Reviews: Denver Real Estate Market Statistics July 2016 The average price for a home in Denver was $406,413 at the end of July
STATPAK MARKET IN A MINUTE A SUMMARY OF MARKET CONDITIONS FOR AUGUST McEnearney.com CONTRACTS URGENCY INDEX INVENTORY INTEREST RATES
 STATPAK WASHINGTON, DC SEPTEMBER 2017 McEnearney.com MARKET IN A MINUTE A SUMMARY OF MARKET CONDITIONS FOR AUGUST 2017 Contract activity in August 2017 was up 4.9% from August 2016, and there were increases
PRINCE GEORGE S COUNTY AUGUST 2018
 STATPAK PRINCE GEORGE S COUNTY AUGUST 2018 McEnearney.com MARKET IN A MINUTE A SUMMARY OF MARKET CONDITIONS FOR JULY 2018 Contract activity in July 2018 was up 19.7% from July 2017, and through the first
California Housing Market Update. Monthly Sales and Price Statistics January 2018
 California Housing Market Update Monthly Sales and Price Statistics January 2018 Sales Started with a Slight Decrease California, Jan. 2018 Sales: 388,800 Units, -2.9% YTD, -2.9% YTY 700,000 600,000 500,000
Pikes Peak area housing Market Statistics (As of: 9/30/2018)
") $156,25 $184, $174,697 $177,2 $21,53 $185,83 $173, $178,29 $172,25 $212,75 $21,95 $226,692 $197,5 $199, $196, $28, $25, $223,95 $216,75 $29,527 $234,9 $218,82 $229,74 $235,518 $231,457 $255, $259,11 $269,98
$156,25 $184, $174,697 $177,2 $21,53 $185,83 $173, $178,29 $172,25 $212,75 $21,95 $226,692 $197,5 $199, $196, $28, $25, $223,95 $216,75 $29,527 $234,9 $218,82 $229,74 $235,518 $231,457 $255, $259,11 $269,98
February 2016 Loudoun County Market Trends Report Contracts and sales activity jump double-digits; Inventories down 15.5 percent
 FOR IMMEDIATE RELEASE Contact: Christine Windle 703-777-2468, cwindle@dullesarea.com Sponsored by: Access National Bank Tom Ciolkosz, (703) 871-1045, tciolkosz@accessnationalbank.com Patty Foster, 703-871-1014,
DATA FOR JULY Published August 16, Sales are down -7.7% month-over-month. The year-over-year comparison is up +6.7%. ARMLS STAT JULY 2018
 Permission is granted only to ARMLS Subscribers for reproduction with attribution on to ARMLS COPYRIGHT 2018. For questions regarding this publication contact Brand@ARMLS.com. DATA FOR JULY 2018 - Published
Minneapolis St. Paul Residential Real Estate Index
 University of St. Thomas Minneapolis St. Paul Residential Real Estate Index Welcome to the latest edition of the UST Minneapolis St. Paul Residential Real Estate Index. The University of St Thomas Residential
STATPAK MARKET IN A MINUTE A SUMMARY OF MARKET CONDITIONS FOR OCTOBER McEnearney.com CONTRACTS URGENCY INDEX INVENTORY INTEREST RATES
 STATPAK LOUDOUN COUNTY NOVEMBER 2018 McEnearney.com MARKET IN A MINUTE A SUMMARY OF MARKET CONDITIONS FOR OCTOBER 2018 Contract activity in October 2018 was down 7.6% from last October and was down in
Volume III Edition I 2011 Year end Recap What will 2012 Bring? Financing for Canadians Where are Canadians Buying in the Greater Phoenix area?
 The Realtors Canadians Trust www.arizonaforcanadians.com Volume III Edition I 2011 Year end Recap What will 2012 Bring? Financing for Canadians Where are Canadians Buying in the Greater Phoenix area? As
February Kansas City Regional Real Estate Market Report
 February 2012 Kansas City Regional Real Estate Market Report Average Sales Price The average existing home sale price in February 2012 was $132,115. February 2012 existing home sale price ($132,115) is
Single Family Sales Maine: Units
 Maine Home Connection 19 Commercial St Portland, Maine 04101 MaineHomeConnection.com Office: (207) 517-3100 Email: Info@MaineHomeConnection.com For the fourth consecutive year, Maine home sales set a new
The Greater Reno-Tahoe Real Estate Report
 February, 2018February, 2018 February, 2018 Issue The Greater Reno-Tahoe Real Estate Report Housing Market Trends for: Reno, Sparks, Carson City, Carson Valley, Lake Tahoe, Dayton, and Fernley A FREE monthly
Scott Market Report Stronger Sales Continue
 June 20 Scott Market Report Stronger Sales Continue The Outer Banks real estate market is seeing good signs in most market segments. After a somewhat slow start to 20, sales agreements picked up significantly
PRINCE GEORGE S COUNTY JULY 2018
 STATPAK PRINCE GEORGE S COUNTY JULY 2018 McEnearney.com MARKET IN A MINUTE A SUMMARY OF MARKET CONDITIONS FOR JUNE & FIRST HALF 2018 Contract activity in June 2018 was up 16.4% from June 2017, and through
Real Estate Market Report November 2011
 Real Estate Market Report November 2011 For Sale 29744 Ski Ranch St. Murrieta, CA 92563 For Sale 38659 Vista Rock Dr. Murrieta, CA 92563 For Sale 39180 Anchor Bay #B Murrieta, CA 92563 For Sale 39779 Chambray
WISCONSIN WEST NORTHEAST SOUTH CENTRAL SOUTHEAST
 WISCONSIN The RE/MAX INTEGRA, Midwest s Springboard into Summer Housing Market Report analyzes the latest trends and economic conditions of the residential real estate market throughout Wisconsin. Individual
Market Trends Generated on 04/24/2018 Page 1 of Alpaca St, South El Monte, CA , Los Angeles County.
 9743 Alpaca St, South El Monte, CA 91733-3028, Los Angeles County Pricing Trends Median Sale Price to Current Value - Tax The percentage of properties that have increased or decreased in value based on
DATA FOR MAY Published June 23, Sales are up +11.3% month-over-month. The year-over-year comparison shows an increase of +11.1%.
 Permission is granted only to ARMLS Subscribers for reproduction with attribution on to ARMLS COPYRIGHT 2017. For questions regarding this publication contact Brand@ARMLS.com. DATA FOR MAY 2017 - Published
2013 Year-End Market Report
 2013 Year-End Market Report The voice of real estate in Central Virginia CAAR Member Copy Expanded Edition Charlottesville Area Year-End 2013 Highlights: Yearly home sales in Greater Charlottesville were
DATA FOR MAY Published June 15, Sales are up +10.3% month-over-month. The year-over-year comparison is up +2.8%. ARMLS STAT MAY 2018
 Permission is granted only to ARMLS Subscribers for reproduction with attribution on to ARMLS COPYRIGHT 2018. For questions regarding this publication contact Brand@ARMLS.com. DATA FOR MAY 2018 - Published
Pikes Peak area housing Market Statistics (As of: 2/28/2018)
") Jan-1-1 -1-1 Jan-2-2 -2-2 Jan-3-3 -3-3 -4-4 -4-5 -5-5 -6-6 -6-7 -7-7 -8-8 -8-9 -9-9 -1-1 -1-11 -11-11 -12-12 -12-13 -13-13 -14-14 -14-15 -15-15 -16-16 -16-17 -17-17 Jan-1-1 -1-1 Jan-2-2 -2-2 Jan-3-3 -3-3
Jan-1-1 -1-1 Jan-2-2 -2-2 Jan-3-3 -3-3 -4-4 -4-5 -5-5 -6-6 -6-7 -7-7 -8-8 -8-9 -9-9 -1-1 -1-11 -11-11 -12-12 -12-13 -13-13 -14-14 -14-15 -15-15 -16-16 -16-17 -17-17 Jan-1-1 -1-1 Jan-2-2 -2-2 Jan-3-3 -3-3
MONTGOMERY COUNTY JANUARY 2019 MARKET IN A MINUTE A SUMMARY OF MARKET CONDITIONS FOR DECEMBER & 4TH QUARTER 2018
 STATPAK MONTGOMERY COUNTY JANUARY 2019 McEnearney.com MARKET IN A MINUTE A SUMMARY OF MARKET CONDITIONS FOR DECEMBER & 4TH QUARTER 2018 Contract activity in December 2018 was down 10.1% from December 2017
DATA FOR DECEMBER Published January 23, Sales are up.01% month-over-month. The year-over-year comparison is at +0.5%.
 Permission is granted only to ARMLS Subscribers for reproduction with attribution on to ARMLS COPYRIGHT 2017. For questions regarding this publication contact Brand@ARMLS.com. DATA FOR DECEMBER 2017 -
Monthly Indicators. Quick Facts - 6.6% + 8.3% - 0.6%
 Monthly Indicators A RESEARCH TOOL PROVIDED BY NORTH TEXAS REAL ESTATE INFORMATION SYSTEMS, INC. 2018 New residential real estate activity has been relatively slow in the first quarter of 2018, yet housing
Monthly Market Watch for Maricopa County An overview of what is happening in the Maricopa County real estate market
 Monthly Market Watch for Maricopa County An overview of what is happening in the Maricopa County real estate market Provided by Susan Kraemer of Prudential Arizona Properties Report overview: This report
See Full Corridor Study Volumes I and II as separate attachments.
 See Full Corridor Study Volumes I and II as separate attachments. See Housing Values 2000-2010 and 2000-2013 as separate attachments. 2013 2 nd Quarter and Mid-Year Market Report The voice of real estate
Monthly Indicators % % % Activity Overview New Listings Pending Sales. Closed Sales. Days on Market Until Sale. Median Sales Price
 Monthly Indicators 2018 Residential real estate activity has been relatively slow in the first quarter of 2018, yet housing is proving its resiliency in a consistently improving economy. Some markets have
Volume II Edition III Mid Summer update
 The Realtors Canadians Trust www.arizonaforcanadians.com Volume II Edition III Mid Summer update In This Edition What is happening in the market today? Where is the market heading? The Buying Process Our
THE REAL ESTATE BOARD OF NEW YORK
 THE REAL ESTATE BOARD OF NEW YORK REAL ESTATE BROKER CONFIDENCE INDEX FIRST QUARTER 2018 EXECUTIVE SUMMARY The Real Estate Board of New York s (REBNY) Real Estate Broker Index for the first quarter of
DATA FOR OCTOBER Published November 14, Sales are down -0.8% month-over-month. The year-over-year comparison is at 4.1%.
 Permission is granted only to ARMLS Subscribers for reproduction with attribution on to ARMLS COPYRIGHT 2017. For questions regarding this publication contact Brand@ARMLS.com. DATA FOR OCTOBER 2017 - Published
THINGS TO CONSIDER WHEN SELLING YOUR HOUSE
 THINGS TO CONSIDER WHEN SELLING YOUR HOUSE SPRING 2017 EDITION TABLE OF CONTENTS 3 5 REASONS TO SELL THIS SPRING WHAT S HAPPENING IN THE HOUSING MARKET? 5 LACK OF LISTINGS SLOWING DOWN THE HOUSING MARKET
OCTOBER 2018 Harrisonburg & Rockingham County Real Estate Market Report
 OCTOBER 218 Real Estate Market Report An analysis of real estate activity through September 3, 218 provided courtesy of Scott P. Rogers, Funkhouser Real Estate Group Five Bedroom City Home with Finished
MARKET IN A MINUTE A SUMMARY OF MARKET CONDITIONS FOR SEPTEMBER & 3rd QUARTER 2017
 STATPAK LOUDOUN COUNTY OCTOBER 2017 McEnearney.com MARKET IN A MINUTE A SUMMARY OF MARKET CONDITIONS FOR SEPTEMBER & 3rd QUARTER 2017 Contract activity in September 2017 was up just 0.6% from September
STATPAK MARKET IN A MINUTE A SUMMARY OF MARKET CONDITIONS FOR MAY McEnearney.com CONTRACTS URGENCY INDEX INVENTORY INTEREST RATES AFFORDABILITY
 STATPAK WASHINGTON, DC JUNE 2017 McEnearney.com MARKET IN A MINUTE A SUMMARY OF MARKET CONDITIONS FOR MAY 2017 Contract activity in May 2017 was up 2.9% from May 2016, and there were increases for the
DATA FOR FEBRUARY Published March 20, Sales are up +19.6% month-over-month. The year-over-year comparison is down -7.3%.
 Permission is granted only to ARMLS Subscribers for reproduction with attribution on to ARMLS COPYRIGHT 2019. For questions regarding this publication contact Brand@ARMLS.com. DATA FOR FEBRUARY 2019 -
HOUSING REPORT WASHTENAW JUNE 2018
 WASHTENAW JUNE 2018 Winning The Deal Available listings have been down over 30% from 2 years ago. The shortage of move-in-ready listings has created a feeding frenzy that heats up when sharp new listings
November 2018 Montgomery County Market Trends Report Median sales price reaches highest November level in 10 years
 FOR IMMEDIATE RELEASE Contact: Bobette Banks 301-590-8764 Director of Communications Greater Capital Area Association of REALTORS bbanks@gcaar.com November 2018 Montgomery County Market Trends Report Median
KEY WEST GOLF CLUB Su M Tu W
 Su M Tu W 2 3 4 8 9 5 6 7 8 22 23 24 25 29 3 Th F Sa Sunday, April 5 6 7 28 2 3 4 9 2 2 26 27 28 TABLE OF CONTENTS Charts and Commentary.. Pages -2 Market Summary Table.. Page 3 Glossary... Page 4 3 Southard
Annual Report on the Charleston Area Housing Market FOR RESIDENTIAL REAL ESTATE ACTIVITY FROM THE CHARLESTON TRIDENT ASSOCIATION OF REALTORS MLS
 Annual Report on the Charleston Area Housing Market FOR RESIDENTIAL REAL ESTATE ACTIVITY FROM THE CHARLESTON TRIDENT ASSOCIATION OF REALTORS MLS FOR RESIDENTIAL REAL ESTATE ACTIVITY FROM THE CHARLESTON
Prescott Area Association of REALTORS
 MARKET DATA REPORT Prescott Area Association of REALTORS Provided for the month of (928) 445-2663 3719 Karicio Lane Prescott, AZ 86303 Listings Trends The key metrics for residential inventory (single-family
DATA FOR FEBRUARY Published March 22, Sales are up +13.6% month-over-month. The year-over-year comparison is up +7.4%.
 Permission is granted only to ARMLS Subscribers for reproduction with attribution on to ARMLS COPYRIGHT 2018. For questions regarding this publication contact Brand@ARMLS.com. DATA FOR FEBRUARY 2018 -
SARETSKY. month in review j u ly re al es tate
 SARETSKY re al es tate month in review j u ly 2 0 1 8 It s more than just a summer heat wave impacting the prized Vancouver Real Estate market. A rough first half of 2018, which witnessed sales sink to
NORTHERN VIRGINIA NOVEMBER 2017
 STATPAK NORTHERN VIRGINIA NOVEMBER 2017 McEnearney.com MARKET IN A MINUTE A SUMMARY OF MARKET CONDITIONS FOR OCTOBER 2017 Contract activity in October 2017 was up 3.8% from October 2016, and there were
DATA FOR SEPTEMBER Published October 13, Sales are down -9.7% month-over-month. The year-over-year comparison is at 0%.
 Permission is granted only to ARMLS Subscribers for reproduction with attribution on to ARMLS COPYRIGHT 2017. For questions regarding this publication contact Brand@ARMLS.com. DATA FOR SEPTEMBER 2017 -
Real Estate Market Report December 2013
 Real Estate Market Report December 2013 A comprehensive report on the SW Riverside County real estate market. www.swriversidecountyhomes.com December, 2013 In December, The real estate market ended the
Housing Price Forecasts. Illinois and Chicago PMSA, June 2012
 Housing Price Forecasts Illinois and Chicago PMSA, June 2012 Presented To Illinois Association of REALTORS From R E A L Regional Economics Applications Laboratory, Institute of Government and Public Affairs
MARCH 2019 Harrisonburg & Rockingham County Real Estate Market Report
 MARCH 219 Real Estate Market Report An analysis of real estate activity through February 28, 219 provided courtesy of Scott P. Rogers, Funkhouser Real Estate Group Spacious Four Bedroom Brick Colonial
things to consider if you are selling your house
 things to consider if you are selling your house KEEPINGCURRENTMATTERS.COM WINTER 2012 EDITION PAGE TABLE OF CONTENTS 1 3 5 7 9 House Prices: Where They Will Be in the Spring Understanding the Impact OF
2017 RESIDENTIAL REAL ESTATE MARKET REPORT
 2017 RESIDENTIAL REAL ESTATE MARKET REPORT Published January 26, 2018 Our market reports have been focused on the effects of low inventory on our housing market and for good reason. December 2017 marked
Released: June Commentary 2. The Numbers That Drive Real Estate 3. Recent Government Action 9. Topics for Home Buyers, Sellers, and Owners 11
 Released: June 2011 Commentary 2 The Numbers That Drive Real Estate 3 Recent Government Action 9 Topics for Home Buyers, Sellers, and Owners 11 Brought to you by: KW Research Commentary The U.S. housing
Real Estate Market Report September 2013
 Real Estate Market Report September 2013 A comprehensive report on the SW Riverside County real estate market. www.swriversidecountyhomes.com September, 2013 In September, Home sales were up 9.7% from
Shadow inventory in Texas
 With the national and local real estate markets turning positive, questions remain about the shadow inventory that was supposed to be holding down the market. Concerns over shadow inventory re-entering
FEBRUARY 2019 Harrisonburg & Rockingham County Real Estate Market Report
 FEBRUARY 219 Real Estate Market Report An analysis of real estate activity through January 31, 219 provided courtesy of Scott P. Rogers, Funkhouser Real Estate Group Immaculate Brick Highland Park Colonial
Bonita Springs-Estero Association of REALTORS
 MARKET DATA REPORT Bonita Springs-Estero Association of REALTORS Provided for the month of (239) 992-6771 http://bearflorida.point2agent.com./ 25300 Bernwood Drive Suite 1 Bonita Springs, FL 34135 Listings
Charlottesville Housing Market Report Year-End (Published by the Charlottesville Area Association of REALTORS )
") Charlottesville Housing Market Report - 2009 Year-End (Published by the Charlottesville Area Association of REALTORS ) This Quarterly Market Report is produced by the Charlottesville Area Association of
Charlottesville Housing Market Report - 2009 Year-End (Published by the Charlottesville Area Association of REALTORS ) This Quarterly Market Report is produced by the Charlottesville Area Association of
Sarasota/Manatee Housing Market Still Tipped Toward Sellers
 FOR IMMEDIATE RELEASE Realtor Association of Sarasota and Manatee Contact: Kathy Roberts (941) 952-343 kathy@myrasm.com Sarasota/Manatee Housing Market Still Tipped Toward Sellers SARASOTA, Fla. (May 24,
Scottsdale Area Association of REALTORS MARKET DATA REPORT. September Scottsdale Area Association of REALTORS
 Scottsdale Area Association of REALTORS MARKET DATA REPORT Scottsdale Area Association of REALTORS 8600 E Anderson Dr, Suite 200 Scottsdale, AZ 85255 SAARonline.com 480-945-2651 info@saaronline.com Listings
North Central Jersey Association of REALTORS
 MARKET DATA REPORT North Central Jersey Association of REALTORS Provided for the month of (973) 425-0110 http://ncjar.com/ 910 Mt Kemble Ave Morristown, NJ 07960 Listings Trends The key metrics for residential
Select Portfolio Management, Inc May 20, 2016
 Select Portfolio Management, Inc 26800 Aliso Viejo Parkway Suite 150 Aliso Viejo, CA 92656 949-975-7900 800-445-9822 info@selectportfolio.com www.selectportfolio.com Homeownership Page 1 of 5, see disclaimer
Coachella Valley Median Detached Home Price April April 2017
 The Desert Housing Report Median Price $450,000 $400,000 Coachella Valley Median Detached Home Price April 2002 - $349,000 $389,000 $350,000 $300,000 $250,000 $200,000 $150,000 CV Detached Median Price
Market Report Summary 2006 Northwest Arkansas. Prepared By Judy Luna. Copyright 2007 Judy Luna
 Market Report Summary 26 Northwest Arkansas Prepared By Judy Luna Copyright 27 Judy Luna Northwest Arkansas Market Area For the purposes of this report, the Northwest Arkansas market area includes Washington
Minneapolis St. Paul Residential Real Estate Index
 University of St. Thomas Minneapolis St. Paul Residential Real Estate Index Welcome to the latest edition of the UST Minneapolis St. Paul Residential Real Estate Index. The University of St Thomas Residential
Austin-area home prices set August record, outpace household income growth in August 2015
 Austin-area home prices set August record, outpace household income growth in August 2015 Market Reports Austin Board of REALTORS releases real estate statistics for August 2015 AUSTIN, Texas September
Greater Lansing Association of REALTORS
 MARKET DATA REPORT Greater Lansing Association of REALTORS Provided for the month of (517) 323-4090 http://www.lansing-realestate.com/ 4039 Legacy Parkway Suite 100 Lansing, MI 48911 Listings Trends Active
Monthly Indicators - 7.4% + 5.6% % Activity Overview New Listings Pending Sales. Closed Sales. Days on Market Until Sale. Median Sales Price
 Monthly Indicators 218 Rising home prices, higher interest rates and increased building material costs have pressured housing affordability to a ten-year low, according to the National Association of Home
February 2018 Montgomery County Market Trends Report Closed sales dip while median sales price reaches highest February mark since 2007
 FOR IMMEDIATE RELEASE Contact: Bobette Banks 301-590-8764 Director of Communications Greater Capital Area Association of REALTORS bbanks@gcaar.com February 2018 Montgomery County Market Trends Report Closed
THINGS TO CONSIDER WHEN SELLING YOUR HOUSE SPRING 2017 EDITION
 THINGS TO CONSIDER WHEN SELLING YOUR HOUSE SPRING 2017 EDITION TABLE OF CONTENTS 3 5 REASONS TO SELL THIS SPRING WHAT S HAPPENING IN THE HOUSING MARKET? 5 LACK OF LISTINGS SLOWING DOWN THE HOUSING MARKET
May 2016 Loudoun County Market Trends Report Homes selling twice as fast as 2015 with re-emergence of seller s market
 FOR IMMEDIATE RELEASE Contact: Christine Windle 703-777-2468 Dulles Area Association of REALTORS cwindle@dullesarea.com Sponsored by: Access National Bank Tom Ciolkosz, (703) 871-1045, tciolkosz@accessnationalbank.com