Orange County Housing Report: Surf s Up!!! January 29, Good Afternoon!
|
|
|
- Imogene Warner
- 5 years ago
- Views:
Transcription

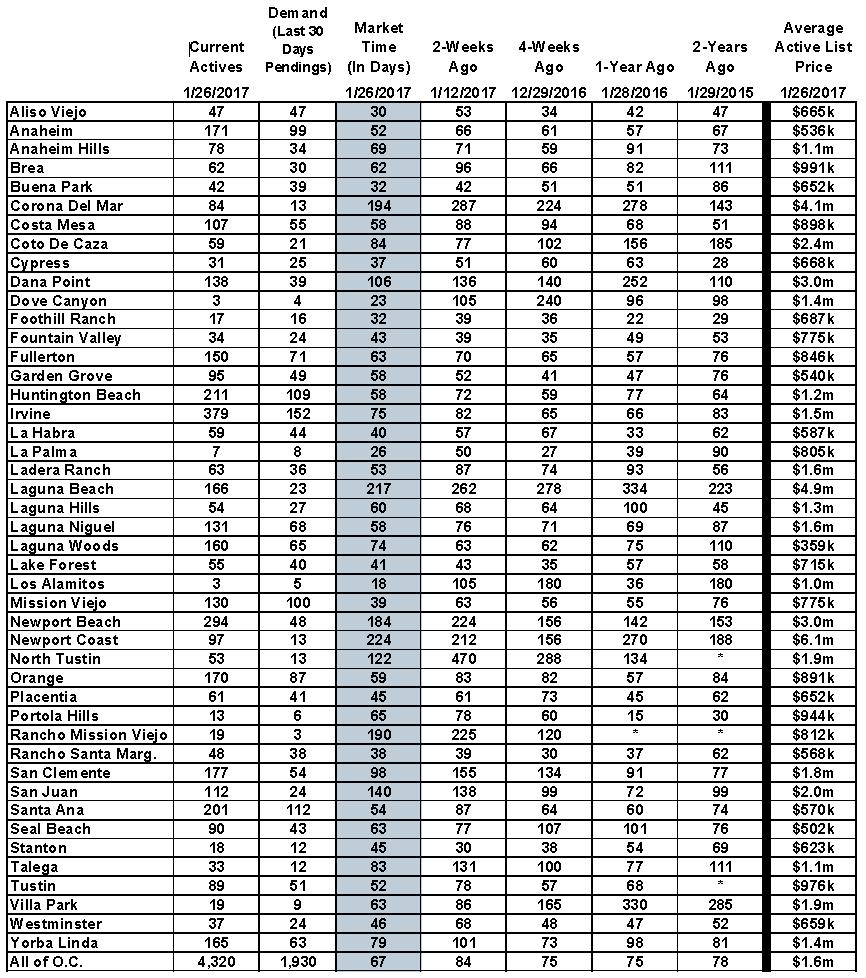
1 Orange County Housing Report: Surf s Up!!! January 29, 2017 Good Afternoon! For sellers, the conditions are perfect and there is no need to wait until the Spring Market to sell. Hot Housing Market: With a very low supply and incredibly HOT demand, the conditions are perfect for selling. Living in Southern California, surf s up is a phrase used to describe when the waves at the beach are worth surfing. In describing the Orange County housing market and whether or not right now is a good time to sell a home, yes, surf s up! If you are a homeowner who wants to sell, but you are waiting for the Spring Market because that s when the conditions are the best for selling a home, there s actually no need to wait. So, grab your surfboard, contact a professional REALTOR, jump in the water, and start paddling to the swells Surf s Up! After a slow start to housing due to very few homeowners placing their homes on the market at the beginning of the month, everything that is coming on the market now is flying off the market almost as quick as the FOR SALE sign is placed in the front yard. The only complaint in the real estate trenches is that there are simply not enough homes on the market right now. Everything priced below $1.5 million is experiencing a HOT market, and it s scorching below $750,000. The market run has officially hit the five-year mark, and this is the second best start behind the blazing hot 2013 market. Why are the conditions so favorable compared to the last few years? Current demand is extremely strong and the active inventory is at exceptionally anemic levels. Compared to last year, there are 11% fewer homes on the market right now, and 19% fewer than 2015; yet, demand (new pending sales over the prior month) is almost identical to And, today s demand has been muffled with fewer homes coming on the market so far this year. The expected market time (the time it would take to list a home today and then place it into escrow) dropped from 84 days two weeks ago to 67 days today. This is because the supply of homes actually dropped slightly while demand, new pending sales, exploded. The only thing keeping demand from being even higher today is the lack of inventory. Sellers who are opting to sell now, versus waiting until later in the spring, are totally taking advantage of a market ripe for the pickings. As long as a home is priced closed to its Fair Market Value and is in good condition, it will fly off the market with multiple offers. Carefully pricing will result in selling at, or even higher, than the asking price. Stretching the price too much will result in wasting the most valuable market time, the first few weeks after coming on the market. For those opting to wait until the spring, there will undoubtedly be more buyers looking to purchase, but there will also be an enormous increase in the number of sellers. With increased demand comes increased supply. Who knows what the market will be like in 90-days. With the new presidential administration, it is hard to predict where housing will be a few months from now. One thing is 100% certain, right now the conditions are perfect for selling. Cowabunga dude, surf s up!!!

2 Active Inventory: Due to a spike in demand and fewer homes coming on the market, the inventory actually dropped a bit in the past two weeks. Since January 1 st, there have been 6% fewer homes that were placed on the market compared to last year at this time. Remarkably, there were 7% fewer homes last year compared to So, this year there are even more homeowners who are opting not to sell even though the conditions are perfect. In the past two weeks, the active listing inventory has shed 56 homes, or 1%, and now totals 4,320. This is typically the time of year when more homes are finally coming on the market. The holidays are officially way behind us; it is time to for homeowners to shake off the holiday buzz and not opt to wait until the Spring Market, taking advantage of current wave of pent up demand. The lack of new sellers hitting the market could be due to a wait and see attitude regarding the new Trump administration. Regardless, there will be a significant increase in supply in February. Stay tuned Last year at this time there were 4,841 homes on the market, 12% more. Two years ago there were 1,011 more homes on the market, or 23% more


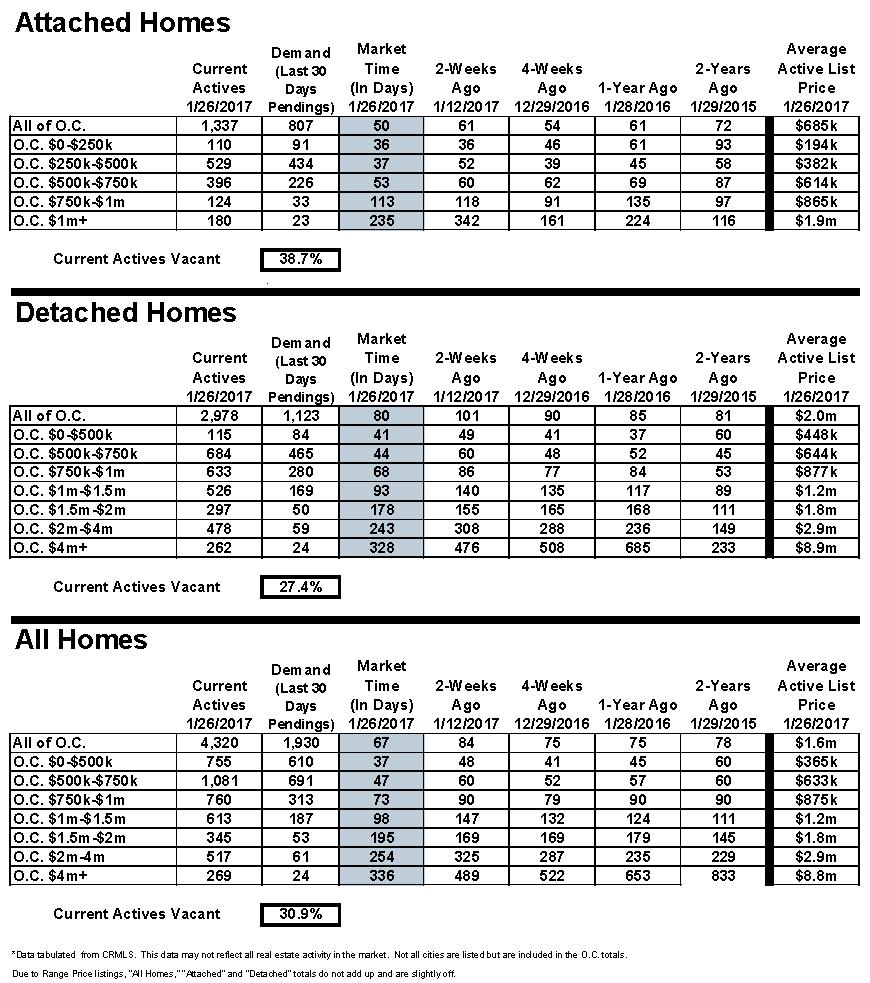
3 Demand: Demand skyrocketed in the past couple of weeks. As is typical for this time of the year, buyers are chomping at the bit and are eager to move on from the doldrums of the Holiday Market that brings very few choices and not a lot of fresh inventory. Buyers know that is about to change, even though it has been slow going for January. Demand, the number of homes placed into escrow within the prior month, increased by 368 pending sales in the past couple of weeks, or 24%, and now totals 1,930. Finally, the resilient Orange County housing engine is revving its supercharged engine and will continue to skyrocket as more inventory hits the market. Last year at this time there were 6 more pending sales compared to today, totaling 1,936. The big difference this year, the near identical demand is being done with fewer homes on the market. Luxury End: Demand is way up, while the luxury inventory is only up slightly. Demand is up for Orange County s luxury home market with 46 additional pending sales compared to last year at this time; however, there is more competition. The luxury inventory is up by 65 homes. That extra competition translates to more seller who are not successful on a monthly basis. Also, a lot of the luxury activity is taking place within the $1 million to $1.5 million price range. For homes priced between $1 million to $1.5 million, the inventory is down by 26 homes compared to last year, and demand is up by 33 pending sales. Yet, above $1.5 million, the inventory is up by 91 homes, and demand is up by only 13.

4 In the past two weeks, demand for homes above $1 million increased from 245 to 325 pending sales, a 33% rise, its highest level since mid-december. The luxury home inventory increased from 1,705 homes to 1,744, its highest level since mid-december as well. The expected market time decreased in the past couple of weeks from 209 to 165 days. For homes priced between $1 million to $1.5 million, the expected market time in the past couple of weeks decreased from 147 days to 98 days. For homes priced between $1.5 million to $2 million, the expected market time increased from 169 to 195 days. For homes priced above $2 million, the expected market time dropped from 370 days to 277 days. At 277 days, a seller would be looking at placing their home in escrow around the beginning of November. Orange County Housing Market Summary: The active listing inventory dropped by 56 homes in the past couple of weeks, a 1% drop, and now totals 4,320. The drop was unprecedented for this time of the year and is most likely due to fewer homes coming on the market so far in 2017, down 6% from last year. The inventory should increase from here, peaking sometime during the summer. There are 32% fewer homes on the market below $500,000 compared to last year at this time and demand is down by 16%. Fewer and fewer homes and condominiums can now be found priced below $500,000. It is the price range that is slowly disappearing. Demand, the number of pending sales over the prior month, skyrocketed by 24% in the past couple of weeks, adding an additional 368 and now totals 1,930. Today s demand is almost identical to last year when there were just 6 additional pending sales. The average pending price is $871,107. The average list price for all of Orange County is $1.6 million, identical to two weeks ago. This number is so high due to the mix of homes in the luxury ranges that sit on the market. For homes priced below $750,000, the market is HOT with an expected market time of just 42 days. This range represents 42% of the active inventory and 67% of demand. For homes priced between $750,000 and $1 million, the expected market time is 73 days, a slight seller s market (between 60 and 90 days). This range represents 18% of the active inventory and 16% of demand. For luxury homes priced between $1 million to $1.5 million, the expected market time is at 98 days, dropping by 49 in the past couple of weeks. For homes priced between $1.5 million to $2 million, the expected market time increased from 169 to 195 days. For luxury homes priced above $2 million, the expected market time decreased from 370 to 277 days. The luxury end, all homes above $1 million, accounts for 40% of the inventory and only 17% of demand.
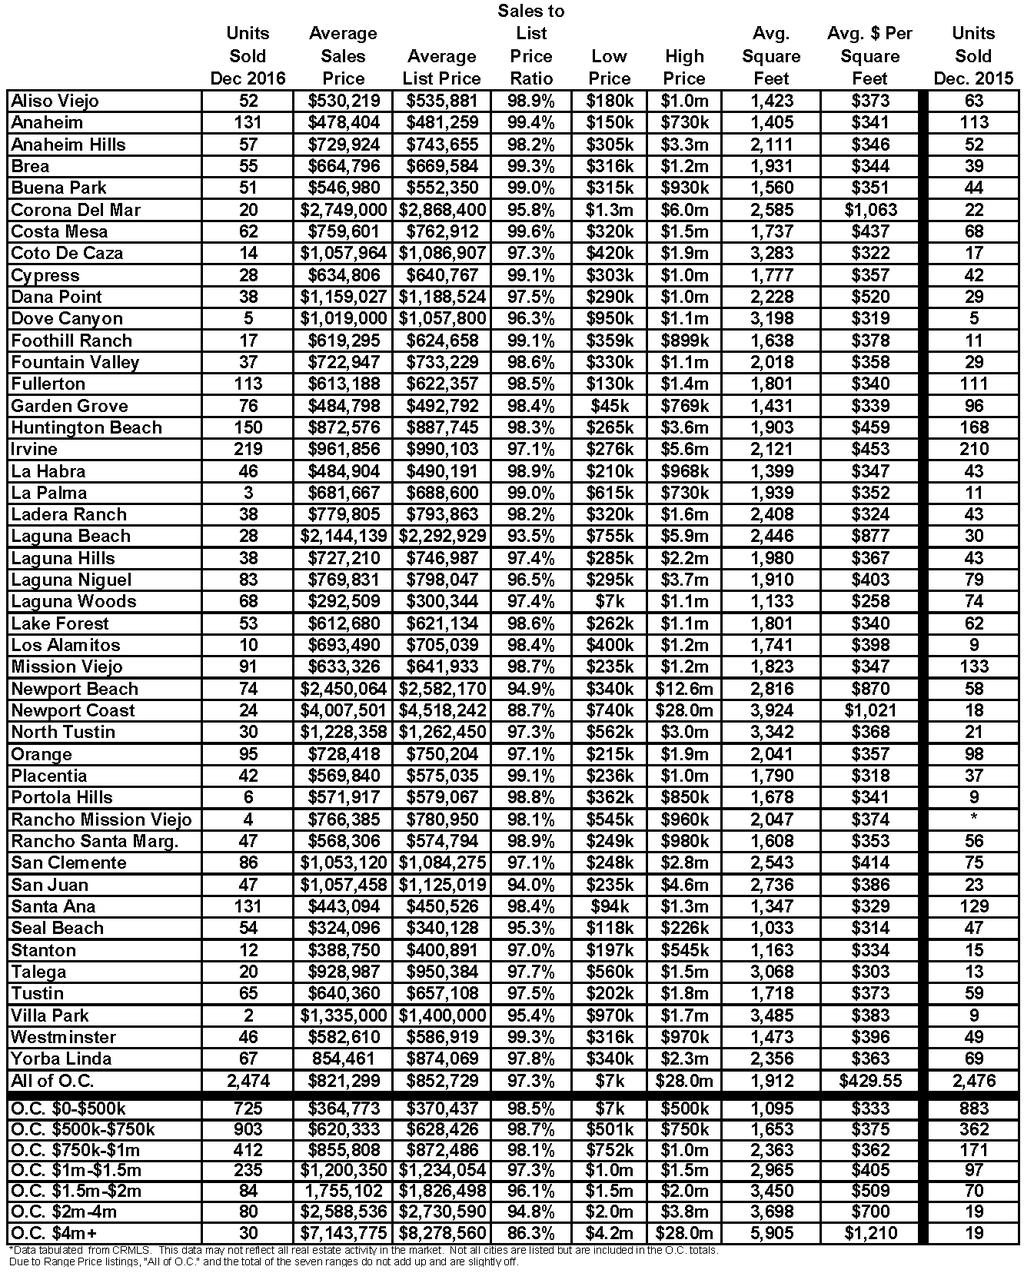
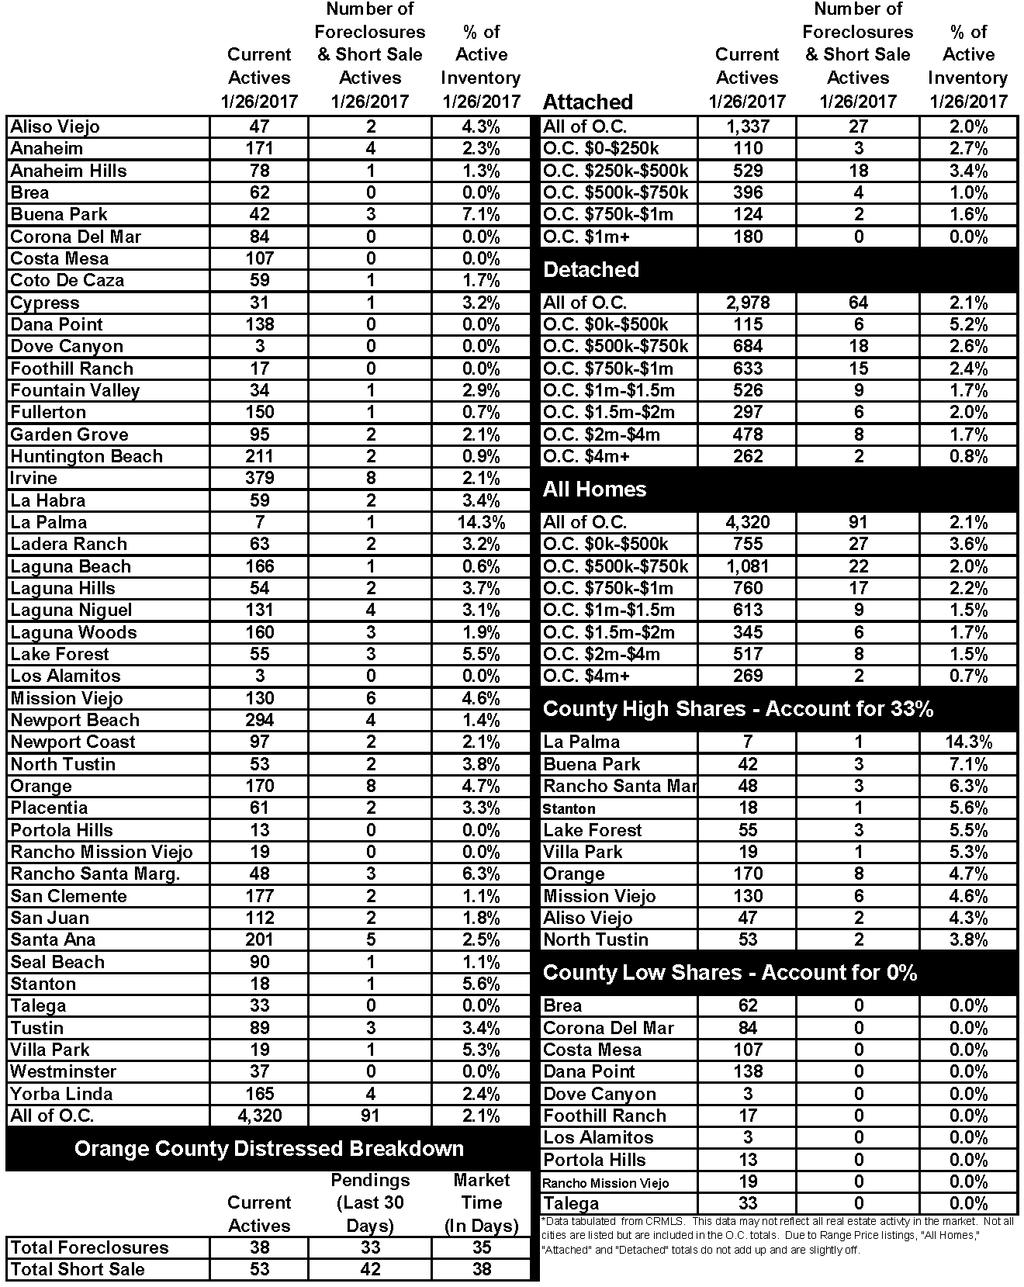
5 The expected market time for all homes in Orange County drastically dropped in the past couple of weeks from 84 to 67, a slight seller s market (between 60 and 90 days). Distressed homes, both short sales and foreclosures combined, make up only 2.1% of all listings and 3.9% of demand. There are 38 foreclosures and 53 short sales available to purchase today in all of Orange County, that s 91 total distressed homes on the active market, 21 fewer than two weeks ago and the lowest total since prior to the Great Recession. Last year there were 159 total distressed sales, 74% more. There were 2,474 closed sales in December, a 1% increase from November, and nearly identical to the 2,746 sales that closed in December The sales to list price ratio was 97.3% for all of Orange County. Foreclosures accounted for just 1.25% of all closed sales and short sales accounted for 1.25% as well. That means that 97.5% of all sales were good ol fashioned equity sellers. Have a great week. Sincerely, Steven Thomas Quantitative Economics and Decision Sciences Copyright Steven Thomas, - All Rights Reserved. This report may not be reproduced in whole or part without express written permission by author.
6
7
8
9
10
Orange County Housing Report: OC Housing is Sizzling. February 26, Good Afternoon!
 Orange County Housing Report: OC Housing is Sizzling February 26, 2017 Good Afternoon! With a very limited inventory, the Orange County housing market is extremely hot and values are on the rise. Hot Housing
An Early 2017 Peak. Orange County Housing Report: August 13, Good Afternoon!
 Orange County Housing Report: An Early 2017 Peak August 13, 2017 Good Afternoon! A low inventory peak means a hot seller s market for quite some time. Active Inventory Peak: the active inventory has been
Orange County Housing Report: On Your Mark, Get Set, Go!!! January 28, Good Afternoon!
 Orange County Housing Report: On Your Mark, Get Set, Go!!! January 28, 2018 Good Afternoon! With the holidays behind us, the 2018 Orange County housing market is beginning to rev its engine. Heating Up
Orange County Housing Report: Like a Model Home. November 4, Good morning!
 Orange County Housing Report: Like a Model Home November 4, 2018 Good morning! Buyers expectations in the ideal home have evolved, so sellers need to price accordingly. Carefully Pricing: Sellers must
Orange County Housing Report: I m Going to Wait to Buy. October 8, Good Afternoon!
 Orange County Housing Report: I m Going to Wait to Buy October 8, 2017 Good Afternoon! Many potential buyers are unaware that there is a significant cost in waiting to purchase. Cost of Waiting: Today
Orange County Housing Report: Too Much Noise. March 11, Good Afternoon!
 Orange County Housing Report: Too Much Noise March 11, 2018 Good Afternoon! Everybody seems to have an opinion about the direction of the housing market. Ignore the Noise: From talk of a housing bubble
Orange County Housing Report
 Orange County Housing Report NOT ANYTIME SOON! November 19, 2017 With an unrelenting lack of supply of homes FOR SALE, it will not be a buyer s market anytime soon. Not a Buyer s Market: Since 2012, the
Orange County Housing Report
 Orange County Housing Report THE 6-YEAR DROUGHT February 25, 2018 There have been far fewer homeowners selling their homes annually ever since the start of the Great Recession. Lack of Sellers: In the
Orange County Housing Report: OC Housing Mid Year Update. June 21, Hello there,
 Orange County Housing Report: OC Housing Mid Year Update June 21, 2014 Hello there, The first two quarters of 2014 are in the rearview mirror and this year is unquestionably different from prior years.
Year to Date (thru June)
") CAAR Market Report 2009 Mid-Year Published by the Charlottesville Area Association of REALTORS Where Are We Now? The pace of home purchases in the Charlottesville area continues to improve from the dismal
CAAR Market Report 2009 Mid-Year Published by the Charlottesville Area Association of REALTORS Where Are We Now? The pace of home purchases in the Charlottesville area continues to improve from the dismal
DATA FOR OCTOBER Published November 14, Sales are down -0.8% month-over-month. The year-over-year comparison is at 4.1%.
 Permission is granted only to ARMLS Subscribers for reproduction with attribution on to ARMLS COPYRIGHT 2017. For questions regarding this publication contact Brand@ARMLS.com. DATA FOR OCTOBER 2017 - Published
August 2015 Washington, DC Market Trends Report Limited supply, high demand continue pushing prices to record highs
 FOR IMMEDIATE RELEASE Contact: Bobette Banks 301-590-8764 Director of Communications Greater Capital Area Association of REALTORS bbanks@gcaar.com August 2015 Washington, DC Market Trends Report Limited
Single Family Sales Maine: Units
 Maine Home Connection 19 Commercial St Portland, Maine 04101 MaineHomeConnection.com Office: (207) 517-3100 Email: Info@MaineHomeConnection.com For the fourth consecutive year, Maine home sales set a new
THINGS TO CONSIDER WHEN SELLING YOUR HOUSE
 THINGS TO CONSIDER WHEN SELLING YOUR HOUSE SPRING 2017 EDITION TABLE OF CONTENTS 3 5 REASONS TO SELL THIS SPRING WHAT S HAPPENING IN THE HOUSING MARKET? 5 LACK OF LISTINGS SLOWING DOWN THE HOUSING MARKET
The Coldwell Banker Carlson Real Estate Market Report
 The Coldwell Banker Carlson Real Estate Market Report 2017 Year-End Stowe Area Report Our 2017 Year-End Market Report uses market-wide data, based on transactions that closed in 2017 in the Multiple Listing
2007 Sales (thru September)
") Third Quarter Market Report Challenges, Opportunities, and Surprises, Oh My! By Dave Phillips, CEO Charlottesville Area Association of REALTORS Someone named Anonymous once said, "Many an opportunity is
Third Quarter Market Report Challenges, Opportunities, and Surprises, Oh My! By Dave Phillips, CEO Charlottesville Area Association of REALTORS Someone named Anonymous once said, "Many an opportunity is
FOR IMMEDIATE RELEASE Contact: Bobette Banks Director of Communications Greater Capital Area Association of REALTORS
 FOR IMMEDIATE RELEASE Contact: Bobette Banks 301-590-8764 Director of Communications Greater Capital Area Association of REALTORS bbanks@gcaar.com November 2015 Washington, DC Market Trends Report Median
THINGS TO CONSIDER WHEN SELLING YOUR HOUSE SPRING 2017 EDITION
 THINGS TO CONSIDER WHEN SELLING YOUR HOUSE SPRING 2017 EDITION TABLE OF CONTENTS 3 5 REASONS TO SELL THIS SPRING WHAT S HAPPENING IN THE HOUSING MARKET? 5 LACK OF LISTINGS SLOWING DOWN THE HOUSING MARKET
DATA FOR MAY Published June 15, Sales are up +10.3% month-over-month. The year-over-year comparison is up +2.8%. ARMLS STAT MAY 2018
 Permission is granted only to ARMLS Subscribers for reproduction with attribution on to ARMLS COPYRIGHT 2018. For questions regarding this publication contact Brand@ARMLS.com. DATA FOR MAY 2018 - Published
Monthly Indicators. Activity Snapshot % + 8.0% % Activity Overview New Listings Pending Sales. Closed Sales. Days on Market Until Sale
 Monthly Indicators 2018 Many sellers and builders are in a good position for financial gains, as the economy continues to favor putting existing homes on the market and building new homes for sale. While
nd Quarter Market Report
 2015 2 nd Quarter Market Report The voice of real estate in Central Virginia CAAR Member Copy Expanded Edition Charlottesville Area 2 nd Quarter 2015 Highlights: Closed sales in the Greater Charlottesville
Monthly Market Watch for the Prescott Quad City Area. Provided by Keller Williams Check Realty Statistics from August 2012 Prescott MLS
 August 2012 Monthly Market Watch for the Prescott Quad City Area Provided by Keller Williams Check Realty Statistics from August 2012 Prescott MLS Report Overview: This report includes MLS data for the
THE REAL ESTATE BOARD OF NEW YORK
 THE REAL ESTATE BOARD OF NEW YORK REAL ESTATE BROKER CONFIDENCE INDEX FIRST QUARTER 2018 EXECUTIVE SUMMARY The Real Estate Board of New York s (REBNY) Real Estate Broker Index for the first quarter of
Provided by Keller Williams Realty Professional Partners Statistics from September 2010 MLS
 Monthly Market Watch for Maricopa County An overview of what is happening in the Maricopa County real estate market (using September 2010 statistics) Report overview: This report includes MLS data for
HOUSING REPORT WASHTENAW DECEMBER 2018
 WASHTENAW DECEMBER 218 Washtenaw County Don t Delay Prices and Interest Rates Rising A shortage of affordable listings combined with rising interest rates will continue to give mid and entry-level buyers
2015 First Quarter Market Report
 2015 First Quarter Market Report CAAR Member Copy Expanded Edition Charlottesville Area First Quarter 2015 Highlights: Median sales price for the region was up 5.1% over Q1-2014, rising from $244,250 to
Connecticut Full Year Housing Report
 Connecticut 2014 Full Year Housing Report As 2014 Closes, Increasing Market Confidence Predicts a Solid Start to 2015 With an influx of Millennial, Gen X and Baby Boomer buyers, a strong spring market
Scott Market Report Stronger Sales Continue
 June 20 Scott Market Report Stronger Sales Continue The Outer Banks real estate market is seeing good signs in most market segments. After a somewhat slow start to 20, sales agreements picked up significantly
HOUSING REPORT WASHTENAW SEPTEMBER 2018
 WASHTENAW SEPTEMBER 2018 Washtenaw County Recovery Run How Much Longer? This month marks the 10-year anniversary of the market peak prior to the burst of the housing bubble. The nationwide median home
Monthly Indicators % + 6.9% - 1.7% Market Overview New Listings Pending Sales. Closed Sales. Days on Market Until Sale. Median Sales Price
 Monthly Indicators 2016 We are in the thick of an exciting period of home buying and selling, often with quick multiple offers that are near, at or even above asking price, depending on the factors of
DATA FOR JULY Published August 16, Sales are down -7.7% month-over-month. The year-over-year comparison is up +6.7%. ARMLS STAT JULY 2018
 Permission is granted only to ARMLS Subscribers for reproduction with attribution on to ARMLS COPYRIGHT 2018. For questions regarding this publication contact Brand@ARMLS.com. DATA FOR JULY 2018 - Published
rd Quarter Market Report
 2012 3 rd Quarter Market Report The voice of real estate in Central Virginia CAAR Member Copy Expanded Edition Charlottesville Area 3 rd Quarter 2012 Highlights: Overall sales in Greater Charlottesville
More Inventory Means More Choices for Buyers
 FOR IMMEDIATE RELEASE Realtor Association of Sarasota and Manatee Contact: Kathy Roberts (941) 952-343 kathy@myrasm.com More Inventory Means More Choices for Buyers SARASOTA, Fla. (March 22, 217) The combined
DATA FOR DECEMBER Published January 23, Sales are up.01% month-over-month. The year-over-year comparison is at +0.5%.
 Permission is granted only to ARMLS Subscribers for reproduction with attribution on to ARMLS COPYRIGHT 2017. For questions regarding this publication contact Brand@ARMLS.com. DATA FOR DECEMBER 2017 -
Weekly Market Activity Report
 Weekly Market Report A RESEARCH TOOL FROM THE MINNEAPOLIS AREA ASSOCIATION OF REALTORS BROUGHT TO YOU BY THE UNIQUE DATA-SHARING TRADITIONS OF THE REALTOR COMMUNITY For Week Ending July 8, 2017 Publish
Charlottesville Housing Market Report Year-End (Published by the Charlottesville Area Association of REALTORS )
") Charlottesville Housing Market Report - 2009 Year-End (Published by the Charlottesville Area Association of REALTORS ) This Quarterly Market Report is produced by the Charlottesville Area Association of
Charlottesville Housing Market Report - 2009 Year-End (Published by the Charlottesville Area Association of REALTORS ) This Quarterly Market Report is produced by the Charlottesville Area Association of
See Full Corridor Study Volumes I and II as separate attachments.
 See Full Corridor Study Volumes I and II as separate attachments. See Housing Values 2000-2010 and 2000-2013 as separate attachments. 2013 2 nd Quarter and Mid-Year Market Report The voice of real estate
FEBRUARY 2019 Harrisonburg & Rockingham County Real Estate Market Report
 FEBRUARY 219 Real Estate Market Report An analysis of real estate activity through January 31, 219 provided courtesy of Scott P. Rogers, Funkhouser Real Estate Group Immaculate Brick Highland Park Colonial
Released: February 8, 2011
 Released: February 8, 2011 Commentary 2 The Numbers That Drive Real Estate 3 Recent Government Action 10 Topics for Home Buyers, Sellers, and Owners 13 Brought to you by: KW Research Commentary Gradual
Volume II Edition III Mid Summer update
 The Realtors Canadians Trust www.arizonaforcanadians.com Volume II Edition III Mid Summer update In This Edition What is happening in the market today? Where is the market heading? The Buying Process Our
GREY HIGHLANDS REAL ESTATE MARKET REPORT: 2 ND QUARTER 2017
 GREY HIGHLANDS REAL ESTATE MARKET REPORT: 2 ND QUARTER 2017 We re Proud And Grateful To Have Recently Been Chosen As ROYAL LEPAGE S 2016 BROKERAGE OF THE YEAR For Ontario GREY HIGHLANDS REAL ESTATE MARKET
things to consider if you are selling your house
 things to consider if you are selling your house KEEPINGCURRENTMATTERS.COM WINTER 2012 EDITION PAGE TABLE OF CONTENTS 1 3 5 7 9 House Prices: Where They Will Be in the Spring Understanding the Impact OF
DATA FOR MAY Published June 23, Sales are up +11.3% month-over-month. The year-over-year comparison shows an increase of +11.1%.
 Permission is granted only to ARMLS Subscribers for reproduction with attribution on to ARMLS COPYRIGHT 2017. For questions regarding this publication contact Brand@ARMLS.com. DATA FOR MAY 2017 - Published
DATA FOR JANUARY Published Feburary 16, Sales are down -14.0% month-over-month. The year-over-year comparison is up +2.5%.
 Permission is granted only to ARMLS Subscribers for reproduction with attribution on to ARMLS COPYRIGHT 2018. For questions regarding this publication contact Brand@ARMLS.com. DATA FOR JANUARY 2018 - Published
May 2016 Washington, DC Market Trends Report Listings continue to move quickly as sales climb nearly 14 percent
 FOR IMMEDIATE RELEASE Contact: Bobette Banks 301-590-8764 Director of Communications Greater Capital Area Association of REALTORS bbanks@gcaar.com May 2016 Washington, DC Market Trends Report Listings
DATA FOR FEBRUARY Published March 20, Sales are up +19.6% month-over-month. The year-over-year comparison is down -7.3%.
 Permission is granted only to ARMLS Subscribers for reproduction with attribution on to ARMLS COPYRIGHT 2019. For questions regarding this publication contact Brand@ARMLS.com. DATA FOR FEBRUARY 2019 -
February Kansas City Regional Real Estate Market Report
 February 2012 Kansas City Regional Real Estate Market Report Average Sales Price The average existing home sale price in February 2012 was $132,115. February 2012 existing home sale price ($132,115) is
Weekly Market Activity Report
 Weekly Market Report A RESEARCH TOOL FROM THE MINNEAPOLIS AREA ASSOCIATION OF REALTORS BROUGHT TO YOU BY THE UNIQUE DATA-SHARING TRADITIONS OF THE REALTOR COMMUNITY For Week Ending February 24, 2018 Publish
Annual Report on the Charleston Area Housing Market FOR RESIDENTIAL REAL ESTATE ACTIVITY FROM THE CHARLESTON TRIDENT ASSOCIATION OF REALTORS MLS
 Annual Report on the Charleston Area Housing Market FOR RESIDENTIAL REAL ESTATE ACTIVITY FROM THE CHARLESTON TRIDENT ASSOCIATION OF REALTORS MLS FOR RESIDENTIAL REAL ESTATE ACTIVITY FROM THE CHARLESTON
February 2016 Loudoun County Market Trends Report Contracts and sales activity jump double-digits; Inventories down 15.5 percent
 FOR IMMEDIATE RELEASE Contact: Christine Windle 703-777-2468, cwindle@dullesarea.com Sponsored by: Access National Bank Tom Ciolkosz, (703) 871-1045, tciolkosz@accessnationalbank.com Patty Foster, 703-871-1014,
Shadow inventory in Texas
 With the national and local real estate markets turning positive, questions remain about the shadow inventory that was supposed to be holding down the market. Concerns over shadow inventory re-entering
Austin-area home prices set August record, outpace household income growth in August 2015
 Austin-area home prices set August record, outpace household income growth in August 2015 Market Reports Austin Board of REALTORS releases real estate statistics for August 2015 AUSTIN, Texas September
Reasons to consider buying a New Construction home?
 Reasons to consider buying a New Construction home? It s only January 20, 2017 and the real estate market in San Diego is already buzzing! New listings are hitting the market daily, and many are going
February 2018 Montgomery County Market Trends Report Closed sales dip while median sales price reaches highest February mark since 2007
 FOR IMMEDIATE RELEASE Contact: Bobette Banks 301-590-8764 Director of Communications Greater Capital Area Association of REALTORS bbanks@gcaar.com February 2018 Montgomery County Market Trends Report Closed
Monthly Indicators. Monthly Snapshot. April % % + 4.7%
 Monthly Indicators For residential real estate activity in the state of New Jersey 2018 Monthly Snapshot Many sellers and builders are in a good position for financial gains, as the economy continues to
SARETSKY. month in review j u ly re al es tate
 SARETSKY re al es tate month in review j u ly 2 0 1 8 It s more than just a summer heat wave impacting the prized Vancouver Real Estate market. A rough first half of 2018, which witnessed sales sink to
DATA FOR SEPTEMBER Published October 13, Sales are down -9.7% month-over-month. The year-over-year comparison is at 0%.
 Permission is granted only to ARMLS Subscribers for reproduction with attribution on to ARMLS COPYRIGHT 2017. For questions regarding this publication contact Brand@ARMLS.com. DATA FOR SEPTEMBER 2017 -
One of the benefits of preparing Bozeman, Montana,
 BOZEMAN, MONTANA REAL ESTATE MARKET REPORT FIRST QUARTER 18 SINGLE FAMILY HOMES PRICED $5, AND ABOVE AND 5-ACRE (+) VACANT LAND IN MLS AREAS DOWNTOWN AND CITY BOZEMAN AND GREATER BOZEMAN AREA FROM JANUARY
June 2018 Montgomery County Market Trends Report Median sales price reaches highest June level on record
 FOR IMMEDIATE RELEASE Contact: Bobette Banks 301-590-8764 Director of Communications Greater Capital Area Association of REALTORS bbanks@gcaar.com June 2018 Montgomery County Market Trends Report Median
GUIDE. The Shields Team of Keller Williams Realty (423)
") GUIDE The Shields Team of Keller Williams Realty (423) 896-1232 www.tricityrealestateforsale.com theshieldsteam@gmail.com Shields Team At The Shields Team, we also love real estate--the land, the homes,
GUIDE The Shields Team of Keller Williams Realty (423) 896-1232 www.tricityrealestateforsale.com theshieldsteam@gmail.com Shields Team At The Shields Team, we also love real estate--the land, the homes,
PRINCE GEORGE S COUNTY FEBRUARY 2018
 STATPAK PRINCE GEORGE S COUNTY FEBRUARY 2018 McEnearney.com MARKET IN A MINUTE A SUMMARY OF MARKET CONDITIONS FOR JANUARY 2018 Contract activity in January 2018 was up 20.9% from January 2017, and there
Sell Your House in DAYS Instead of Months
 Sell Your House in DAYS Instead of Months No Agents No Fees No Commissions No Hassle Learn the secret of selling your house in days instead of months If you re trying to sell your house, you may not have
TUCSON and SOUTHERN ARIZONA
 TUCSON and SOUTHERN ARIZONA MID-Year Housing Report (520) 840-0963 MathewRodriguez@LongRealty.com 2018 Mid-Year Housing Report INVENTORY Housing market trends For the overall real estate market in Tucson
Monthly Indicators - 6.4% % + 5.2%
 ly Indicators A RESEARCH TOOL PROVIDED BY THE GREENWOOD ASSOCIATION OF REALTORS 2013 Quick Facts The S&P/Case-Shiller Home Price Index recently showed that home prices in 20 major metropolitan areas had
California Housing Market Update. Monthly Sales and Price Statistics January 2018
 California Housing Market Update Monthly Sales and Price Statistics January 2018 Sales Started with a Slight Decrease California, Jan. 2018 Sales: 388,800 Units, -2.9% YTD, -2.9% YTY 700,000 600,000 500,000
2017 RESIDENTIAL REAL ESTATE MARKET REPORT
 2017 RESIDENTIAL REAL ESTATE MARKET REPORT Published January 26, 2018 Our market reports have been focused on the effects of low inventory on our housing market and for good reason. December 2017 marked
DATA FOR NOVEMBER Published December 20, Sales are down -9.3% month-overmonth. comparison is down -7.9%. ARMLS STAT NOVEMBER 2018
 Permission is granted only to ARMLS Subscribers for reproduction with attribution on to ARMLS COPYRIGHT 2018. For questions regarding this publication contact Brand@ARMLS.com. DATA FOR NOVEMBER 2018 -
ECONOMIC CURRENTS. Vol. 5 Issue 2 SOUTH FLORIDA ECONOMIC QUARTERLY. Key Findings, 2 nd Quarter, 2015
 ECONOMIC CURRENTS THE Introduction SOUTH FLORIDA ECONOMIC QUARTERLY Economic Currents provides an overview of the South Florida regional economy. The report presents current employment, economic and real
The Everbach Group - Realty Executives Associates - - Copyright 2018 All Rights Reserved
 Blount County Market Overview Research Provided by Jason Everbach and Vicki Everbach August 2018 The Blount County real estate market hot-streak continues making August another excellent month! The average
MARKET AREA UPDATE Report as of: 1Q 2Q 3Q 4Q
 MARKET AREA UPDATE Report as of: 1Q 2Q 3Q 4Q Year: 2013 Market Area (City, State): Arlington, Virginia Provided by (Company / Companies): McEnearney Associates, Inc. Realtors What are the most significant
Monthly Market Watch for Maricopa County An overview of what is happening in the Maricopa County real estate market
 Monthly Market Watch for Maricopa County An overview of what is happening in the Maricopa County real estate market Provided by Susan Kraemer of Prudential Arizona Properties Report overview: This report
May 2016 Loudoun County Market Trends Report Homes selling twice as fast as 2015 with re-emergence of seller s market
 FOR IMMEDIATE RELEASE Contact: Christine Windle 703-777-2468 Dulles Area Association of REALTORS cwindle@dullesarea.com Sponsored by: Access National Bank Tom Ciolkosz, (703) 871-1045, tciolkosz@accessnationalbank.com
Bay Area home prices leap amid signs market calming
 Real Estate Bay Area home prices leap amid signs market calming More sellers jumping in to list house, easing tight inventory Rohan Smith, The Chronicle Ryan Huntsberger (right) and another staging designer
2013 Housing Market Forecast. SILVAR: Los Gatos/Saratoga District October 10, 2012 Leslie Appleton-Young, Vice President & Chief Economist
 2013 Housing Market Forecast SILVAR: Los Gatos/Saratoga District October 10, 2012 Leslie Appleton-Young, Vice President & Chief Economist What we saw from the roof.. C.A.R. NAR THE ECONOMY Recent Housing
ECONOMIC CURRENTS. Vol. 4, Issue 3. THE Introduction SOUTH FLORIDA ECONOMIC QUARTERLY
 ECONOMIC CURRENTS THE Introduction SOUTH FLORIDA ECONOMIC QUARTERLY Vol. 4, Issue 3 Economic Currents provides an overview of the South Florida regional economy. The report presents current employment,
2013 Year-End Market Report
 2013 Year-End Market Report The voice of real estate in Central Virginia CAAR Member Copy Expanded Edition Charlottesville Area Year-End 2013 Highlights: Yearly home sales in Greater Charlottesville were
Annual Report on the Charleston Area Housing Market FOR RESIDENTIAL REAL ESTATE ACTIVITY FROM THE CHARLESTON TRIDENT ASSOCIATION OF REALTORS MLS
 Annual Report on the Charleston Area Housing Market FOR RESIDENTIAL REAL ESTATE ACTIVITY FROM THE CHARLESTON TRIDENT ASSOCIATION OF REALTORS MLS Annual Report on the Charleston Area Housing Market FOR
May 2017 Montgomery County Market Trends Report Median sales price increases 5.8 percent; active listings drop 11.8 percent
 FOR IMMEDIATE RELEASE Contact: Bobette Banks 301-590-8764 Director of Communications Greater Capital Area Association of REALTORS bbanks@gcaar.com May 2017 Montgomery County Market Trends Report Median
Minneapolis St. Paul Residential Real Estate Index
 University of St. Thomas Minneapolis St. Paul Residential Real Estate Index Welcome to the latest edition of the UST Minneapolis St. Paul Residential Real Estate Index. The University of St Thomas Residential
March 2016 Washington, DC Market Trends Report March sales represent a 12 percent increase; top the five-year March average
 FOR IMMEDIATE RELEASE Contact: Bobette Banks 301-590-8764 Director of Communications Greater Capital Area Association of REALTORS bbanks@gcaar.com March 2016 Washington, DC Market Trends Report March sales
NORTHERN VIRGINIA MARCH 2017
 STATPAK NORTHERN VIRGINIA MARCH 2017 McEnearney.com MARKET IN A MINUTE A SUMMARY OF MARKET CONDITIONS FOR FEBRUARY 2017 Contract activity in February 2017 was up 4.0% from February 2016, and there were
OCTOBER 2018 Harrisonburg & Rockingham County Real Estate Market Report
 OCTOBER 218 Real Estate Market Report An analysis of real estate activity through September 3, 218 provided courtesy of Scott P. Rogers, Funkhouser Real Estate Group Five Bedroom City Home with Finished
The Corcoran Report 4Q16 MANHATTAN
 The Corcoran Report 4Q16 MANHATTAN Contents Fourth Quarter 2016 4/7 12/23 3 Overview 8 9 10 Market Wide 11 Luxury 24 2 Sales / Days on Market 3 Inventory / Months of Supply 4 5 Market Share Resale Co-ops
Volume III Edition I 2011 Year end Recap What will 2012 Bring? Financing for Canadians Where are Canadians Buying in the Greater Phoenix area?
 The Realtors Canadians Trust www.arizonaforcanadians.com Volume III Edition I 2011 Year end Recap What will 2012 Bring? Financing for Canadians Where are Canadians Buying in the Greater Phoenix area? As
September 2017 Washington, DC Market Trends Report September median sales price drops 6.4 percent but still near record high
 FOR IMMEDIATE RELEASE Contact: Bobette Banks 301-590-8764 Director of Communications Greater Capital Area Association of REALTORS bbanks@gcaar.com September 2017 Washington, DC Market Trends Report September
Oahu Real Estate December 2014 Year End Report
 Oahu Real Estate December 2014 Year End Report By: Mike Gallagher Real Estate, Inc. In order to view the next large Excel Spread depicting all Areas around Oahu and how they performed over twelve months
Contents. off the fence. It s a good life!
 I hope you enjoy the latest edition of Brian Buffini s Real Estate Report. The goal of this piece is to help you stay educated on today s market and position yourself as a true professional and your clients
DATA FOR APRIL Published May 15, Sales are down -4.4% month-over-month. The year-over-year comparison is up +3.7%. ARMLS STAT APRIL 2018
 Permission is granted only to ARMLS Subscribers for reproduction with attribution on to ARMLS COPYRIGHT 2018. For questions regarding this publication contact Brand@ARMLS.com. DATA FOR APRIL 2018 - Published
Monthly Indicators % % - 2.5% Activity Overview New Listings Pending Sales. Closed Sales. Days on Market Until Sale. Median Sales Price
 Monthly Indicators 2019 It is worthwhile to mention the weather when discussing residential real estate for the state of New York for 2019, because this month has turned in some impressively cold and snowy
If you are planning to undertake a move in the coming
 trebtalk Buying a new home BY BILL JOHNSTON If you are planning to undertake a move in the coming months, you have probably considered whether to choose new or resale housing. Both options have advantages.
Economic Highlights. Payroll Employment Growth by State 1. Durable Goods 2. The Conference Board Consumer Confidence Index 3
 August 26, 2009 Economic Highlights Southeastern Employment Payroll Employment Growth by State 1 Manufacturing Durable Goods 2 Consumer Spending The Conference Board Consumer Confidence Index 3 Real Estate
FOR IMMEDIATE RELEASE Contact: Bobette Banks Director of Communications Greater Capital Area Association of REALTORS
 FOR IMMEDIATE RELEASE Contact: Bobette Banks 301-590-8764 Director of Communications Greater Capital Area Association of REALTORS bbanks@gcaar.com April 2016 Washington, DC Market Trends Report Sales and
Monthly Indicators + 4.3% + 6.5% % Market Overview New Listings Pending Sales. Closed Sales. Days on Market Until Sale. Median Sales Price
 Monthly Indicators 2019 It is worthwhile to mention the weather when discussing residential real estate for large portions of the U.S. for 2019, because this month has turned in some impressively cold,
2016 Housing Market Strong
 FOR IMMEDIATE RELEASE Realtor Association of Sarasota and Manatee Contact: Kathy Roberts (941) 952-343 kathy@myrasm.com 216 Housing Market Strong SARASOTA, Fla. (February 9, 217) According to recent data
May 2016 Montgomery County Market Trends Report Double-digit gains in closed sales, exceeding the five-year May average
 FOR IMMEDIATE RELEASE Contact: Bobette Banks 301-590-8764 Director of Communications Greater Capital Area Association of REALTORS bbanks@gcaar.com May 2016 Montgomery County Market Trends Report Double-digit
Ridgefield. Interpreting the Market. Real Estate Report 2016 Mid Year Review. karlamurtaugh.com
 Ridgefield Real Estate Report 2016 Mid Year Review Interpreting the Market karlamurtaugh.com 203.856.5534 REAL ESTATE REPORT 2016 MID YEAR REVIEW Ridgefield Real Estate 2016 Mid Year Review Sales During
MARCH 2019 Harrisonburg & Rockingham County Real Estate Market Report
 MARCH 219 Real Estate Market Report An analysis of real estate activity through February 28, 219 provided courtesy of Scott P. Rogers, Funkhouser Real Estate Group Spacious Four Bedroom Brick Colonial
The Desert Housing Report. Coachella Valley Median Detached Home Price March March 2019 $392,000 $415,000
 Median Price $450,000 $400,000 $350,000 $300,000 $250,000 $200,000 $150,000 Coachella Valley Median Detached Home Price March 2002 - $392,000 $415,000 CV Detached Median Price Summary 4% Growth Curve The
Housing Supply Overview
 Housing Supply Overview A Research Tool Provided by the Greater San Diego Association of REALTORS December 2017 Quick Facts + 18.1% + 2.1% - 2.3% Inventory was again a driving metric in residential real
Monthly Indicators + 0.5% + 3.7% + 4.0%
 Monthly Indicators A RESEARCH TOOL PROVIDED BY NORTH TEXAS REAL ESTATE INFORMATION SYSTEMS, INC. 2018 Many sellers and builders are in a good position for financial gains, as the economy continues to favor