Orange County Housing Report: Like a Model Home. November 4, Good morning!
|
|
|
- Alexia Russell
- 5 years ago
- Views:
Transcription


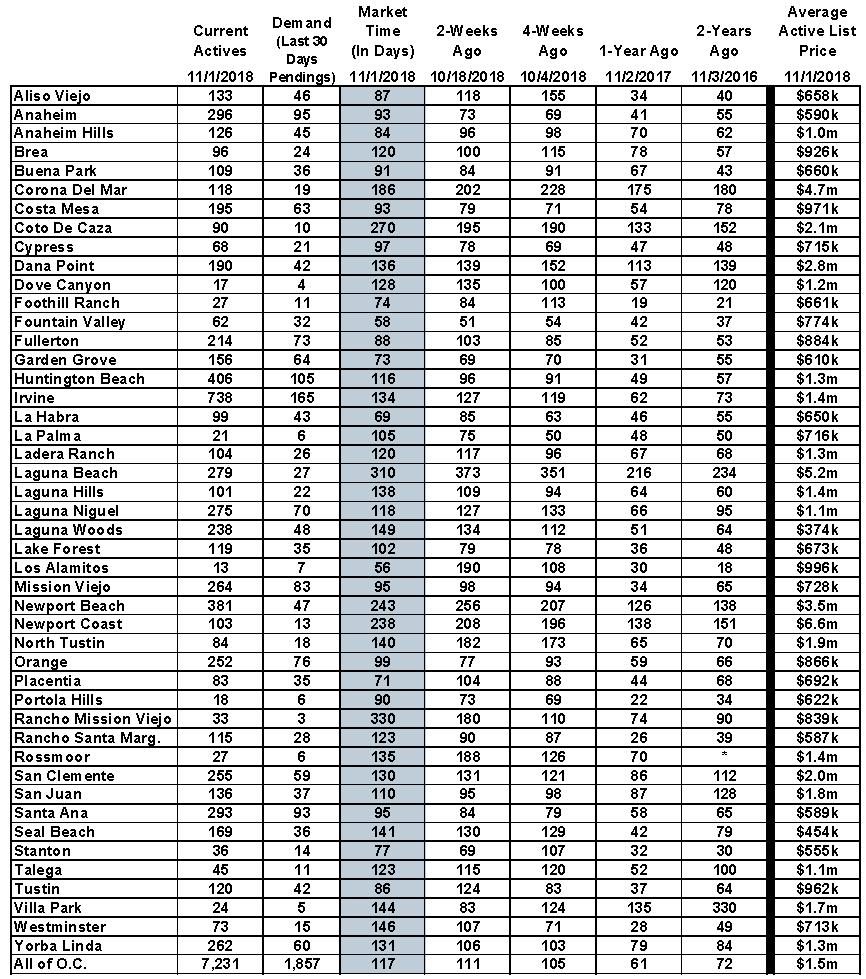
1 Orange County Housing Report: Like a Model Home November 4, 2018 Good morning! Buyers expectations in the ideal home have evolved, so sellers need to price accordingly. Carefully Pricing: Sellers must price according to their location, condition, upgrades, updates, décor, and overall appeal. Prior to this year, there was not a lot of thought that went into pricing a home. Since 2012, sellers stretched their asking prices and home values soared. It seemed that every time a home sold, it was a new record for the neighborhood. New sellers would come on the market, take a look at the comparable sales, add a little bit more, and then they sifted through multiple offers. They often settled for purchase prices above their asking prices. Sellers were in control as buyers tripped over each other to secure their piece of the American Dream. With higher prices and a dramatic rise in interest rates this year, housing has slowed considerably. Interest rates have risen from 3.9% in November 2017 to nearly 5% today. Combine that with annual appreciation around 5% and monthly mortgage payments have increased by 19%. As a result, demand is down 23% compared to last year and the active listing inventory is 48% higher. Due to the sharp increase in supply and a striking drop in demand, the Expected Market Time for Orange County has increased to levels not seen since The Expected Market Time has grown from 54 days in April to 117 days today, a Balanced Market (between 90 to 120
2 days). It is knocking on the door of a Buyer s Market (over 120-days) for the first time since January The 117-day height was last reached in July 2011, over seven years ago. Last year at this time, it was at 61 days, a Seller s Market (less than 90-days). Sellers no longer get away with stretching the asking price. In fact, they must be extremely careful in pricing or they will not find success. It is not as easy as pricing it right at the most recent comparable sale either. Rarely are two homes completely identical. There is a lot more that goes into the value of a home: location, condition, upgrades, updates, décor, and overall appeal. Buyers today are much different than buyers of past markets. Buyers used to overlook some deferred maintenance and lack of upgrades and updates. They focused on the bones of a home, the floorplan, and location. They were not afraid of a home that required a little bit of elbow grease. Today, buyers want a home that is turnkey, ready to go. They want it to look like a model home. What happened? Quite simply, it was Chip and Joanna Gaines. HGTV s hit show, Fixer Upper, about home design and renovation, starred Chip and Joanna Gaines and aired for five years, from 2013 to its final season this year. This show, along with the overabundance of real estate related reality shows, changed buyers expectations and approach to real estate. Buyers now know the approximate cost, time, and hassle in improvements, updates, and remodels that go into a home. These real estate show carefully displayed the purchase price, the cost to upgrade, and the time it took to complete the project. The result was always a spectacular home that left the viewer wanting to move in. This is where the expectations and desire for the perfect, turnkey home originated from. Today s buyer wants a home to look like a model. When it falls short, buyers subtract from value. If a home needs carpet, the walls are scuffed and dirty, the kitchen is outdated, the yard needs work, the patio is cracked, the light fixtures are old, the bathrooms are dated, and there is plenty of deferred maintenance, buyers will subtract heavily from value. Many buyers will just skip these homes altogether and wait for a home to come along that is already done and ready for immediate occupancy. To find success, sellers must price their homes carefully considering the comparable sales and factoring in a home s condition and overall appeal. The closer a home looks to a model, the faster it will sell. Pricing a home at the last comparable sale, yet it needs a lot of work, will simply not sell in today s market. As a result, sellers have a choice. They can either invest in their home and update it prior to placing it on the market; or, they can adjust the price to reflect the work that needs to be done. Buyers will also subtract for the hassle to do it themselves. With the market knocking on the door of a buyer s market, price is everything. Active Inventory: The active listing inventory dropped by 1% in the past two-weeks. The active listing inventory continues to bounce around the 7,200 mark. Originally, it looked as if the inventory had reached a peak at the end of September when it reached 7,207, and then two weeks later dropped to 7,201. It was the first time in 2018 that the inventory went down. Then, on October 18, it climbed to 7,292, adding 91 homes. Today, two weeks later, it dropped to 7,231, shedding 61 homes, or 1%. So, it appears as if the peak has been reached and the inventory will fall for the remainder of the year. Typically, the active listing inventory peaks in July or August, but this year there was a two-month delay. The inventory is normally dropping like a rock during this time of the year. The active listing inventory drops for the remainder of the year after peaking, but a peak this late in the year will not allow enough time to drop much. The net result will be a lot more homes on the market to start 2019 compared to recent years. Last year at this time, there were 4,878 homes on the market, 2,373 fewer. That means that there are 48% more homes available today. The year over year difference continues to grow every week. The trend of more homes on the market year over year is here to stay.


3 Demand: Demand dropped 6% in the past two-weeks. In the past two-weeks, demand, the number of pending sales over the prior month, decreased by 117 pending sales, a 6% drop, unusually high for this time of the year. Typically, demand remains flat until Thanksgiving and then dramatically plunges for the remainder of the year, the Holiday Market. Demand now totals 1,857, the lowest demand reading for the start to November since The current market slowdown is because of muted demand. Last year at this time, demand was at 2,409 pending sales, 30% more than today, or 552 additional pending sales. The expected market time, the amount of time it would take for a home that comes onto the market today to be placed into escrow down the road, increased from 111 to 117 days in the past two-weeks, a Balanced Market (between 90 and 120 days). Last year, the expected market time was at 61 days, substantially different than today. Luxury End: The luxury housing market improved slightly. In the past two-weeks, demand for homes above $1.25 million increased by 2 pending sales, a 0.8% increase, and now totals 260. It remains at levels last seen at the end of January. The luxury home inventory decreased by 16 homes and now totals 2,147, a 1% drop. The overall expected market time for homes priced above $1.25 million decreased from 252 to 248 days over the past two-weeks. Year over year, luxury demand is down by 65 pending sales, or 20%, and the active luxury listing inventory is up by an additional 435 homes, or 25%. The expected market time last year was at 158 days, significantly better than today. For homes priced between $1.25 million and $1.5 million, the expected market time increased from 152 to 175 days. For homes priced between $1.5 million and $2 million, the expected market time increased from 207 to 212 days. For homes

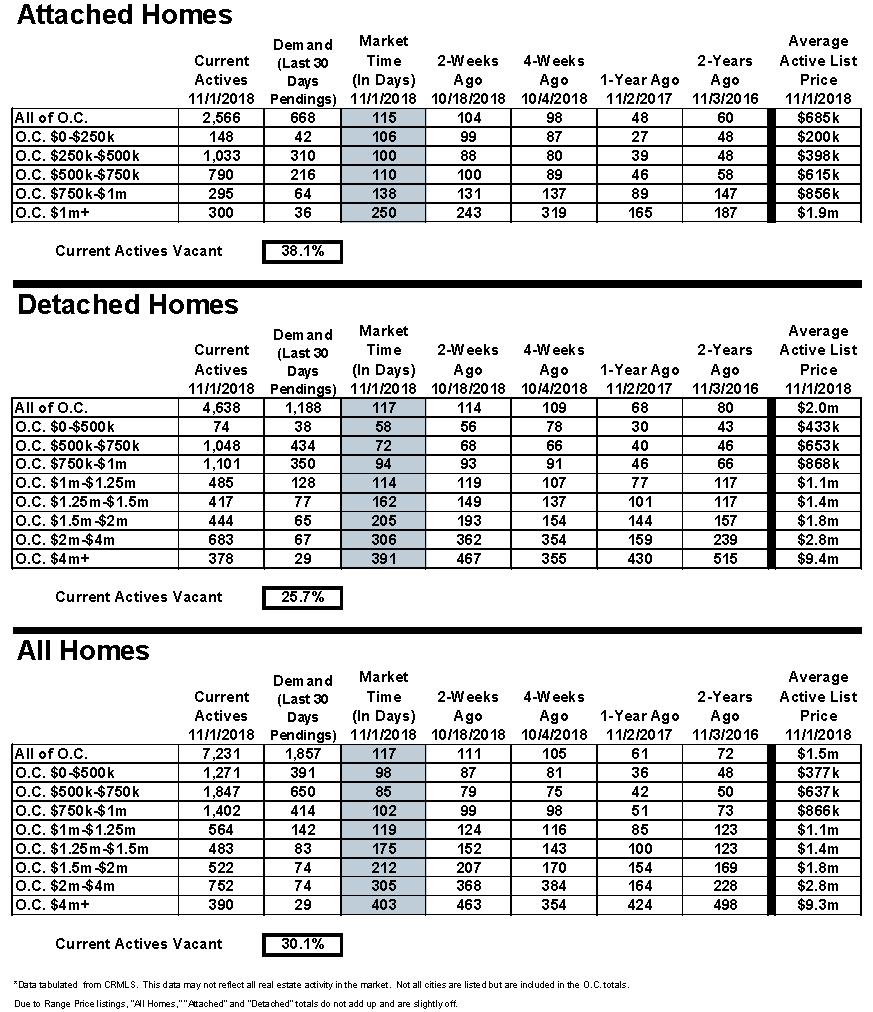
4 priced between $2 million and $4 million, the expected market time decreased from 368 to 305 days. For homes priced above $4 million, the expected market time decreased from 463 to 403 days. At 403 days, a seller would be looking at placing their home into escrow around the middle of December Orange County Housing Market Summary: The active listing inventory decreased by 61 homes in the past two weeks and now totals 7,231. The inventory most likely reached a peak for 2018 two-weeks ago. Normally it peaks between July and August. Last year, there were 4878 homes on the market, 2,353 fewer than today. So far this year, 13% fewer homes have come on the market below $500,000 compared to last year, and there have been 26% fewer closed sales. Fewer and fewer homes and condominiums are now priced below $500,000. This price range is slowly vanishing. Demand, the number of pending sales over the prior month, decreased in the past two-weeks by 117 pending sales, and now totals 1,857. Demand peaked in mid-may at 2,726 pending sales. Last year, there were 2,409 pending sales, 30% more than today. The average list price for all of Orange County remained at $1.5 million over the past two-weeks. This number is high due to the mix of homes in the luxury ranges that sit on the market and do not move as quickly as the lower end. For homes priced below $750,000, the market is a Balanced Market (between 90 and 120 days) with an expected market time of 90 days. This range represents 43% of the active inventory and 56% of demand. For homes priced between $750,000 and $1 million, the expected market time is 102 days, a Balanced Market. This range represents 19% of the active inventory and 22% of demand. For homes priced between $1 million to $1.25 million, the expected market time is 119 days, also a Balanced Market. For luxury homes priced between $1.25 million and $1.5 million, the expected market time increased from 152 to 175 days. For homes priced between $1.5 million and $2 million, the expected market time increased from 207 to 212 days. For luxury homes priced between $2 million and $4 million, the expected market time decreased from 368 to 305 days. For luxury homes priced above $4 million, the expected market time decreased from 463 to 403 days. The luxury end, all homes above $1.25 million, accounts for 30% of the inventory and only 14% of demand.
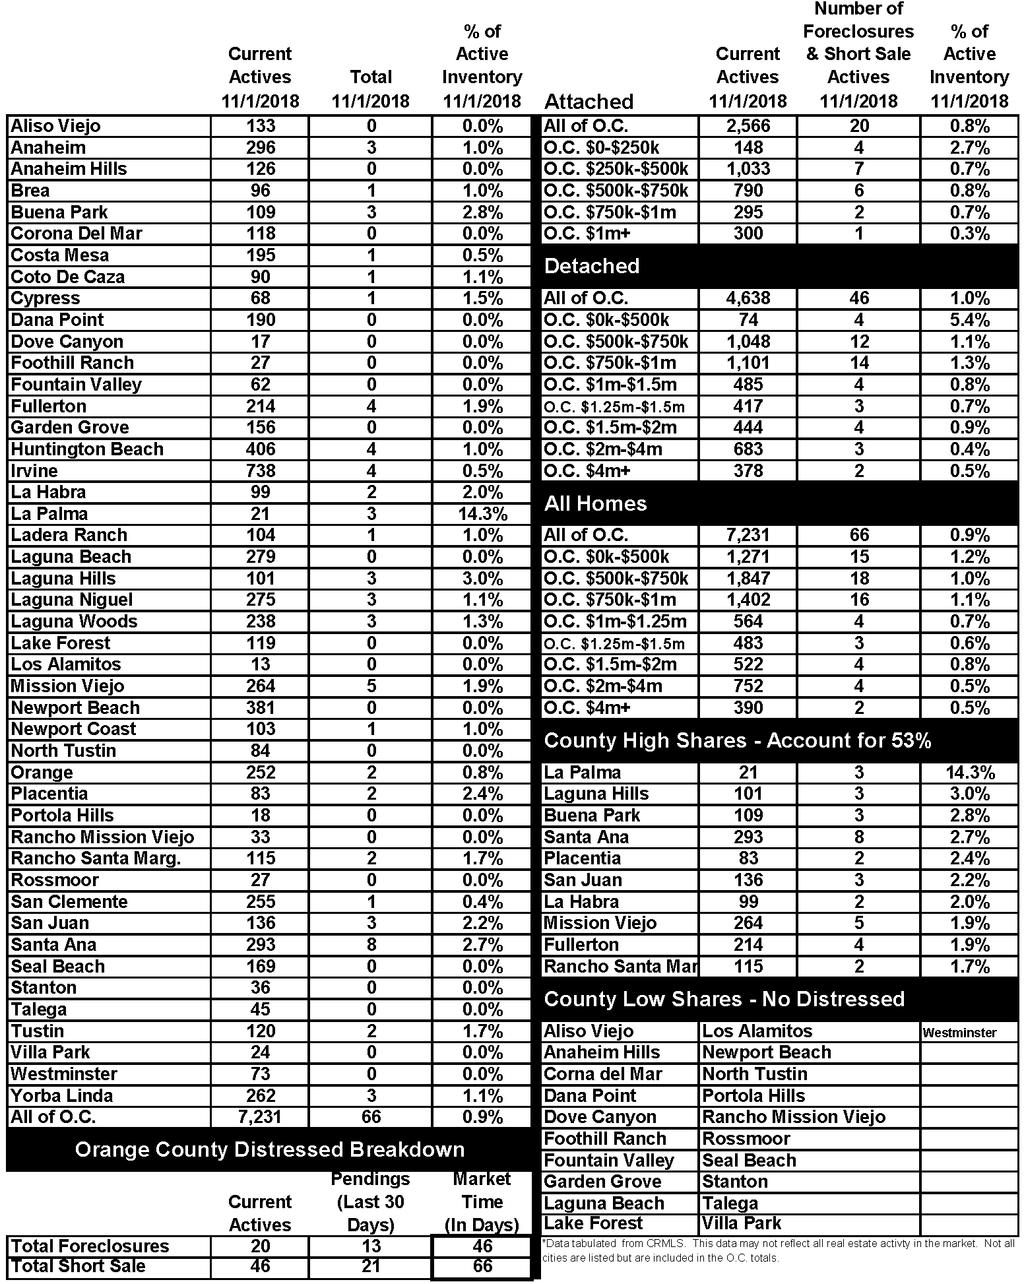
5 The expected market time for all homes in Orange County increased from 111 to 117 days, a Balanced Market (between 90 to 120 days). It was at 61 days last year. Distressed homes, both short sales and foreclosures combined, made up only 0.9% of all listings and 1.8% of demand. There are only 20 foreclosures and 46 short sales available to purchase today in all of Orange County, 66 total distressed homes on the active market, down by four from two-weeks ago. Last year there were 58 total distressed homes on the market, nearly identical to today. There were 2,090 closed residential resales in September, 24% fewer than September 2017 s 2,746. September marked a 25% drop over August The sales to list price ratio was 96.9% for all of Orange County. Foreclosures accounted for just 0.4% of all closed sales, and short sales accounted for 0.3%. That means that 99.3% of all sales were good ol fashioned sellers with equity. Have a great week. Sincerely, Steven Thomas Quantitative Economics and Decision Sciences Copyright Steven Thomas, Reports On Housing - All Rights Reserved. This report may not be reproduced in whole or part without express written permission by author.
6
7

8
9
10
Orange County Housing Report: I m Going to Wait to Buy. October 8, Good Afternoon!
 Orange County Housing Report: I m Going to Wait to Buy October 8, 2017 Good Afternoon! Many potential buyers are unaware that there is a significant cost in waiting to purchase. Cost of Waiting: Today
Orange County Housing Report: OC Housing is Sizzling. February 26, Good Afternoon!
 Orange County Housing Report: OC Housing is Sizzling February 26, 2017 Good Afternoon! With a very limited inventory, the Orange County housing market is extremely hot and values are on the rise. Hot Housing
An Early 2017 Peak. Orange County Housing Report: August 13, Good Afternoon!
 Orange County Housing Report: An Early 2017 Peak August 13, 2017 Good Afternoon! A low inventory peak means a hot seller s market for quite some time. Active Inventory Peak: the active inventory has been
Orange County Housing Report: Surf s Up!!! January 29, Good Afternoon!
 Orange County Housing Report: Surf s Up!!! January 29, 2017 Good Afternoon! For sellers, the conditions are perfect and there is no need to wait until the Spring Market to sell. Hot Housing Market: With
Orange County Housing Report
 Orange County Housing Report NOT ANYTIME SOON! November 19, 2017 With an unrelenting lack of supply of homes FOR SALE, it will not be a buyer s market anytime soon. Not a Buyer s Market: Since 2012, the
Orange County Housing Report: On Your Mark, Get Set, Go!!! January 28, Good Afternoon!
 Orange County Housing Report: On Your Mark, Get Set, Go!!! January 28, 2018 Good Afternoon! With the holidays behind us, the 2018 Orange County housing market is beginning to rev its engine. Heating Up
Orange County Housing Report: Too Much Noise. March 11, Good Afternoon!
 Orange County Housing Report: Too Much Noise March 11, 2018 Good Afternoon! Everybody seems to have an opinion about the direction of the housing market. Ignore the Noise: From talk of a housing bubble
Orange County Housing Report
 Orange County Housing Report THE 6-YEAR DROUGHT February 25, 2018 There have been far fewer homeowners selling their homes annually ever since the start of the Great Recession. Lack of Sellers: In the
Orange County Housing Report: OC Housing Mid Year Update. June 21, Hello there,
 Orange County Housing Report: OC Housing Mid Year Update June 21, 2014 Hello there, The first two quarters of 2014 are in the rearview mirror and this year is unquestionably different from prior years.
HOUSING REPORT WASHTENAW DECEMBER 2018
 WASHTENAW DECEMBER 218 Washtenaw County Don t Delay Prices and Interest Rates Rising A shortage of affordable listings combined with rising interest rates will continue to give mid and entry-level buyers
The Coldwell Banker Carlson Real Estate Market Report
 The Coldwell Banker Carlson Real Estate Market Report 2017 Year-End Stowe Area Report Our 2017 Year-End Market Report uses market-wide data, based on transactions that closed in 2017 in the Multiple Listing
Volume II Edition III Mid Summer update
 The Realtors Canadians Trust www.arizonaforcanadians.com Volume II Edition III Mid Summer update In This Edition What is happening in the market today? Where is the market heading? The Buying Process Our
Year to Date (thru June)
") CAAR Market Report 2009 Mid-Year Published by the Charlottesville Area Association of REALTORS Where Are We Now? The pace of home purchases in the Charlottesville area continues to improve from the dismal
CAAR Market Report 2009 Mid-Year Published by the Charlottesville Area Association of REALTORS Where Are We Now? The pace of home purchases in the Charlottesville area continues to improve from the dismal
2015 First Quarter Market Report
 2015 First Quarter Market Report CAAR Member Copy Expanded Edition Charlottesville Area First Quarter 2015 Highlights: Median sales price for the region was up 5.1% over Q1-2014, rising from $244,250 to
Charlottesville Housing Market Report Year-End (Published by the Charlottesville Area Association of REALTORS )
") Charlottesville Housing Market Report - 2009 Year-End (Published by the Charlottesville Area Association of REALTORS ) This Quarterly Market Report is produced by the Charlottesville Area Association of
Charlottesville Housing Market Report - 2009 Year-End (Published by the Charlottesville Area Association of REALTORS ) This Quarterly Market Report is produced by the Charlottesville Area Association of
MARCH 2019 Harrisonburg & Rockingham County Real Estate Market Report
 MARCH 219 Real Estate Market Report An analysis of real estate activity through February 28, 219 provided courtesy of Scott P. Rogers, Funkhouser Real Estate Group Spacious Four Bedroom Brick Colonial
HOUSING REPORT WASHTENAW SEPTEMBER 2018
 WASHTENAW SEPTEMBER 2018 Washtenaw County Recovery Run How Much Longer? This month marks the 10-year anniversary of the market peak prior to the burst of the housing bubble. The nationwide median home
Sell Your House in DAYS Instead of Months
 Sell Your House in DAYS Instead of Months No Agents No Fees No Commissions No Hassle Learn the secret of selling your house in days instead of months If you re trying to sell your house, you may not have
STATPAK MARKET IN A MINUTE A SUMMARY OF MARKET CONDITIONS FOR JANUARY McEnearney.com CONTRACTS URGENCY INDEX INVENTORY INTEREST RATES
 STATPAK LOUDOUN COUNTY FEBRUARY 2018 McEnearney.com MARKET IN A MINUTE A SUMMARY OF MARKET CONDITIONS FOR JANUARY 2018 Contract activity in January 2018 was down just 2.0% from January 2017, but that is
THINGS TO CONSIDER WHEN SELLING YOUR HOUSE
 THINGS TO CONSIDER WHEN SELLING YOUR HOUSE SPRING 2017 EDITION TABLE OF CONTENTS 3 5 REASONS TO SELL THIS SPRING WHAT S HAPPENING IN THE HOUSING MARKET? 5 LACK OF LISTINGS SLOWING DOWN THE HOUSING MARKET
The Greater Reno-Tahoe Real Estate Report
 February, 2018February, 2018 February, 2018 Issue The Greater Reno-Tahoe Real Estate Report Housing Market Trends for: Reno, Sparks, Carson City, Carson Valley, Lake Tahoe, Dayton, and Fernley A FREE monthly
nd Quarter Market Report
 2015 2 nd Quarter Market Report The voice of real estate in Central Virginia CAAR Member Copy Expanded Edition Charlottesville Area 2 nd Quarter 2015 Highlights: Closed sales in the Greater Charlottesville
2007 Sales (thru September)
") Third Quarter Market Report Challenges, Opportunities, and Surprises, Oh My! By Dave Phillips, CEO Charlottesville Area Association of REALTORS Someone named Anonymous once said, "Many an opportunity is
Third Quarter Market Report Challenges, Opportunities, and Surprises, Oh My! By Dave Phillips, CEO Charlottesville Area Association of REALTORS Someone named Anonymous once said, "Many an opportunity is
FEBRUARY 2019 Harrisonburg & Rockingham County Real Estate Market Report
 FEBRUARY 219 Real Estate Market Report An analysis of real estate activity through January 31, 219 provided courtesy of Scott P. Rogers, Funkhouser Real Estate Group Immaculate Brick Highland Park Colonial
MARKET AREA UPDATE Report as of: 1Q 2Q 3Q 4Q
 MARKET AREA UPDATE Report as of: 1Q 2Q 3Q 4Q Year: 2013 Market Area (City, State): Arlington, Virginia Provided by (Company / Companies): McEnearney Associates, Inc. Realtors What are the most significant
THE REAL ESTATE BOARD OF NEW YORK
 THE REAL ESTATE BOARD OF NEW YORK REAL ESTATE BROKER CONFIDENCE INDEX FIRST QUARTER 2018 EXECUTIVE SUMMARY The Real Estate Board of New York s (REBNY) Real Estate Broker Index for the first quarter of
Provided by Keller Williams Realty Professional Partners Statistics from September 2010 MLS
 Monthly Market Watch for Maricopa County An overview of what is happening in the Maricopa County real estate market (using September 2010 statistics) Report overview: This report includes MLS data for
MONTGOMERY COUNTY JANUARY 2019 MARKET IN A MINUTE A SUMMARY OF MARKET CONDITIONS FOR DECEMBER & 4TH QUARTER 2018
 STATPAK MONTGOMERY COUNTY JANUARY 2019 McEnearney.com MARKET IN A MINUTE A SUMMARY OF MARKET CONDITIONS FOR DECEMBER & 4TH QUARTER 2018 Contract activity in December 2018 was down 10.1% from December 2017
GUIDE. The Shields Team of Keller Williams Realty (423)
") GUIDE The Shields Team of Keller Williams Realty (423) 896-1232 www.tricityrealestateforsale.com theshieldsteam@gmail.com Shields Team At The Shields Team, we also love real estate--the land, the homes,
GUIDE The Shields Team of Keller Williams Realty (423) 896-1232 www.tricityrealestateforsale.com theshieldsteam@gmail.com Shields Team At The Shields Team, we also love real estate--the land, the homes,
MONTGOMERY COUNTY JULY 2018
 STATPAK MONTGOMERY COUNTY JULY 2018 McEnearney.com MARKET IN A MINUTE A SUMMARY OF MARKET CONDITIONS FOR JUNE & FIRST HALF 2018 Contract activity in June 2018 was up 1.2% from June 2017, solely because
Monthly Market Watch for the Prescott Quad City Area. Provided by Keller Williams Check Realty Statistics from August 2012 Prescott MLS
 August 2012 Monthly Market Watch for the Prescott Quad City Area Provided by Keller Williams Check Realty Statistics from August 2012 Prescott MLS Report Overview: This report includes MLS data for the
1 Q M A NH AT TA N M A R K E T R E P O R T
 1Q2018 MANHATTAN M A R K E T R E P O R T INTRODUCTION M A N H A T T A N S A L E S R E P O R T Q 1 2 0 1 8 : THE NECESSITY OF BALANCE The first quarter of 2018 was a balancing act supported by declines
DATA FOR OCTOBER Published November 14, Sales are down -0.8% month-over-month. The year-over-year comparison is at 4.1%.
 Permission is granted only to ARMLS Subscribers for reproduction with attribution on to ARMLS COPYRIGHT 2017. For questions regarding this publication contact Brand@ARMLS.com. DATA FOR OCTOBER 2017 - Published
ARLA Members Survey of the Private Rented Sector
 Prepared for The Association of Residential Letting Agents ARLA Members Survey of the Private Rented Sector Second Quarter 2014 Prepared by: O M Carey Jones 5 Henshaw Lane Yeadon Leeds LS19 7RW June, 2014
PRINCE GEORGE S COUNTY FEBRUARY 2018
 STATPAK PRINCE GEORGE S COUNTY FEBRUARY 2018 McEnearney.com MARKET IN A MINUTE A SUMMARY OF MARKET CONDITIONS FOR JANUARY 2018 Contract activity in January 2018 was up 20.9% from January 2017, and there
NORTHERN VIRGINIA MARCH 2017
 STATPAK NORTHERN VIRGINIA MARCH 2017 McEnearney.com MARKET IN A MINUTE A SUMMARY OF MARKET CONDITIONS FOR FEBRUARY 2017 Contract activity in February 2017 was up 4.0% from February 2016, and there were
DATA FOR FEBRUARY Published March 20, Sales are up +19.6% month-over-month. The year-over-year comparison is down -7.3%.
 Permission is granted only to ARMLS Subscribers for reproduction with attribution on to ARMLS COPYRIGHT 2019. For questions regarding this publication contact Brand@ARMLS.com. DATA FOR FEBRUARY 2019 -
MARKET IN A MINUTE A SUMMARY OF MARKET CONDITIONS FOR SEPTEMBER & 3rd QUARTER 2017
 STATPAK LOUDOUN COUNTY OCTOBER 2017 McEnearney.com MARKET IN A MINUTE A SUMMARY OF MARKET CONDITIONS FOR SEPTEMBER & 3rd QUARTER 2017 Contract activity in September 2017 was up just 0.6% from September
things to consider if you are selling your house
 things to consider if you are selling your house KEEPINGCURRENTMATTERS.COM WINTER 2012 EDITION PAGE TABLE OF CONTENTS 1 3 5 7 9 House Prices: Where They Will Be in the Spring Understanding the Impact OF
STATPAK MARKET IN A MINUTE A SUMMARY OF MARKET CONDITIONS FOR FEBRUARY McEnearney.com CONTRACTS URGENCY INDEX INVENTORY INTEREST RATES
 STATPAK LOUDOUN COUNTY MARCH 2018 McEnearney.com MARKET IN A MINUTE A SUMMARY OF MARKET CONDITIONS FOR FEBRUARY 2018 Contract activity in February 2018 was almost unchanged, up just 0.2% from February
DATA FOR JULY Published August 16, Sales are down -7.7% month-over-month. The year-over-year comparison is up +6.7%. ARMLS STAT JULY 2018
 Permission is granted only to ARMLS Subscribers for reproduction with attribution on to ARMLS COPYRIGHT 2018. For questions regarding this publication contact Brand@ARMLS.com. DATA FOR JULY 2018 - Published
FIRST TIME HOMEBUYERS SEMINAR
 FIRST TIME HOMEBUYERS SEMINAR Everything you need to know to make buying your first home easy and affordable. : Logo Tax deductions Stable housing costs Appreciation on your investment Gain equity You
Real Estate Market Report November 2011
 Real Estate Market Report November 2011 For Sale 29744 Ski Ranch St. Murrieta, CA 92563 For Sale 38659 Vista Rock Dr. Murrieta, CA 92563 For Sale 39180 Anchor Bay #B Murrieta, CA 92563 For Sale 39779 Chambray
Real Estate Market Report May 2014
 Real Estate Market Report May 2014 A comprehensive report on the SW Riverside County real estate market. www.swriversidecountyhomes.com May, 2014 In May, Home prices continue to rise this month. Home prices
BONDREPORT QTR BONDNEWYORK.COM
 BONDREPORT QTR 4 2018 BONDREPORT QTR 4 2018 WELCOME TO THE 23RD EDITION OF THE BOND REPORT Looking back on 2018, the year can perhaps best be described as a consistent movement towards corrections. After
LEVERAGING THE LATEST HOUSING MARKET TRENDS TO HELP DISTRESSED HOMEOWNERS Renwood RealtyTrac LLC
 LEVERAGING THE LATEST HOUSING MARKET TRENDS TO HELP DISTRESSED HOMEOWNERS WHAT WE LL COVER A bit about RealtyTrac Where have all the foreclosures gone? Markets bucking the downward trend Shadow inventory?
STATPAK MARKET IN A MINUTE A SUMMARY OF MARKET CONDITIONS FOR OCTOBER McEnearney.com CONTRACTS URGENCY INDEX INVENTORY INTEREST RATES
 STATPAK LOUDOUN COUNTY NOVEMBER 2018 McEnearney.com MARKET IN A MINUTE A SUMMARY OF MARKET CONDITIONS FOR OCTOBER 2018 Contract activity in October 2018 was down 7.6% from last October and was down in
STATPAK MARKET IN A MINUTE A SUMMARY OF MARKET CONDITIONS FOR JUNE & FIRST HALF McEnearney.com CONTRACTS URGENCY INDEX INVENTORY INTEREST RATES
 STATPAK LOUDOUN COUNTY JULY 2018 McEnearney.com MARKET IN A MINUTE A SUMMARY OF MARKET CONDITIONS FOR JUNE & FIRST HALF 2018 Contract activity in June 2018 was up 5.1% from June 2017. Through the first
MONTGOMERY COUNTY APRIL 2018
 STATPAK MONTGOMERY COUNTY APRIL 2018 McEnearney.com MARKET IN A MINUTE A SUMMARY OF MARKET CONDITIONS FOR MARCH 2018 Contract activity in March 2018 was down 6.0% from March 2017, and there were decreases
May 2016 Loudoun County Market Trends Report Homes selling twice as fast as 2015 with re-emergence of seller s market
 FOR IMMEDIATE RELEASE Contact: Christine Windle 703-777-2468 Dulles Area Association of REALTORS cwindle@dullesarea.com Sponsored by: Access National Bank Tom Ciolkosz, (703) 871-1045, tciolkosz@accessnationalbank.com
THE CONSUMERS GUIDE TO REAL ESTATE STAGING
 THE CONSUMERS GUIDE TO REAL ESTATE STAGING Definition of Staging Real Estate Staging is the act of preparing and showcasing residential or commercial property for sale. It is a systematic and coordinated
The Corcoran Report 4Q16 MANHATTAN
 The Corcoran Report 4Q16 MANHATTAN Contents Fourth Quarter 2016 4/7 12/23 3 Overview 8 9 10 Market Wide 11 Luxury 24 2 Sales / Days on Market 3 Inventory / Months of Supply 4 5 Market Share Resale Co-ops
Volume III Edition I 2011 Year end Recap What will 2012 Bring? Financing for Canadians Where are Canadians Buying in the Greater Phoenix area?
 The Realtors Canadians Trust www.arizonaforcanadians.com Volume III Edition I 2011 Year end Recap What will 2012 Bring? Financing for Canadians Where are Canadians Buying in the Greater Phoenix area? As
Real Estate Market Report December 2013
 Real Estate Market Report December 2013 A comprehensive report on the SW Riverside County real estate market. www.swriversidecountyhomes.com December, 2013 In December, The real estate market ended the
OCTOBER 2018 Harrisonburg & Rockingham County Real Estate Market Report
 OCTOBER 218 Real Estate Market Report An analysis of real estate activity through September 3, 218 provided courtesy of Scott P. Rogers, Funkhouser Real Estate Group Five Bedroom City Home with Finished
Released: February 8, 2011
 Released: February 8, 2011 Commentary 2 The Numbers That Drive Real Estate 3 Recent Government Action 10 Topics for Home Buyers, Sellers, and Owners 13 Brought to you by: KW Research Commentary Gradual
STATPAK MARKET IN A MINUTE A SUMMARY OF MARKET CONDITIONS FOR JULY McEnearney.com CONTRACTS URGENCY INDEX INVENTORY INTEREST RATES AFFORDABILITY
 STATPAK LOUDOUN COUNTY AUGUST 2017 McEnearney.com MARKET IN A MINUTE A SUMMARY OF MARKET CONDITIONS FOR JULY 2017 Contract activity in July 2017 was down 8.7% from July 2016, and there were decreases in
See Full Corridor Study Volumes I and II as separate attachments.
 See Full Corridor Study Volumes I and II as separate attachments. See Housing Values 2000-2010 and 2000-2013 as separate attachments. 2013 2 nd Quarter and Mid-Year Market Report The voice of real estate
May 2016 Washington, DC Market Trends Report Listings continue to move quickly as sales climb nearly 14 percent
 FOR IMMEDIATE RELEASE Contact: Bobette Banks 301-590-8764 Director of Communications Greater Capital Area Association of REALTORS bbanks@gcaar.com May 2016 Washington, DC Market Trends Report Listings
THINGS TO CONSIDER WHEN SELLING YOUR HOUSE SPRING 2017 EDITION
 THINGS TO CONSIDER WHEN SELLING YOUR HOUSE SPRING 2017 EDITION TABLE OF CONTENTS 3 5 REASONS TO SELL THIS SPRING WHAT S HAPPENING IN THE HOUSING MARKET? 5 LACK OF LISTINGS SLOWING DOWN THE HOUSING MARKET
SARETSKY. month in review j u ly re al es tate
 SARETSKY re al es tate month in review j u ly 2 0 1 8 It s more than just a summer heat wave impacting the prized Vancouver Real Estate market. A rough first half of 2018, which witnessed sales sink to
Property: Park Place at Chatham Unit:202 Listing Price $435,000 PRICE REDUCED! 1,192 sq ft 2 Bedrooms, 2 Full Bathrooms
 Available Apartments Please feel free to give us a call anytime to book a personal tour of Park Place Chatham and learn more about Wise Living and our Independent Living Communities. 508-945-5291 Property:
Residential September 2010
 Residential September 2010 Karl L. Guntermann Fred E. Taylor Professor of Real Estate Adam Nowak Research Associate For the first time since March, house prices turned down slightly in August (-2 percent)
Single Family Sales Maine: Units
 Maine Home Connection 19 Commercial St Portland, Maine 04101 MaineHomeConnection.com Office: (207) 517-3100 Email: Info@MaineHomeConnection.com For the fourth consecutive year, Maine home sales set a new
CITI HABITATS. Manhattan Residential Sales Market Report
 Manhattan Residential Sales Market Report Contents 4/7 12/17 3 8 9 10 Market Wide 4 Sales / Days on Market 5 / Months of Supply 6 7 Market Share Resale Co-ops Resale Condos New Developments 11 Luxury Neighborhoods
MONTGOMERY COUNTY MAY 2018
 STATPAK MONTGOMERY COUNTY MAY 2018 McEnearney.com MARKET IN A MINUTE A SUMMARY OF MARKET CONDITIONS FOR APRIL 2018 Contract activity in April 2018 was up just 0.9% from, but there were increases in four
1 st Quarter 2015 Asheville and Buncombe County Real Estate Market Analysis
 1 st Quarter 2015 Asheville and Buncombe County Real Estate Market Analysis This report examines the Asheville and Buncombe County residential real estate market through the end of the 1 st quarter of
Monthly Indicators - 7.4% + 5.6% % Activity Overview New Listings Pending Sales. Closed Sales. Days on Market Until Sale. Median Sales Price
 Monthly Indicators 218 Rising home prices, higher interest rates and increased building material costs have pressured housing affordability to a ten-year low, according to the National Association of Home
CAAR Market Report 2010 Mid-Year Published by the Charlottesville Area Association of REALTORS
 CAAR Market Report 2010 Mid-Year Published by the Charlottesville Area Association of REALTORS Where Are We Now? The pace of home purchases in the Charlottesville market area showed a significant increase
Home Seller s Guide. How to get top dollar for your home when selling
 Home Seller s Guide How to get top dollar for your home when selling A real estate transaction is one of the biggest financial transactions most people will do in a lifetime. Understanding the sales process
WASHINGTON MARKET SNAPSHOT October 2016
 WASHINGTON MARKET SNAPSHOT October 2016 Western Washington housing market still strong, but some see signs of rebalancing. (NWMLS) Puget Sound (King, Kitsap, Pierce, & Snohomish Counties) Single Family
NOVEMBER 2018 Harrisonburg & Rockingham County Real Estate Market Report
 NOVEMBER 218 Real Estate Market Report An analysis of real estate activity through October 31, 218 provided courtesy of Scott P. Rogers, Funkhouser Real Estate Group Custom-Built Highland Park Home with
DATA FOR SEPTEMBER Published October 13, Sales are down -9.7% month-over-month. The year-over-year comparison is at 0%.
 Permission is granted only to ARMLS Subscribers for reproduction with attribution on to ARMLS COPYRIGHT 2017. For questions regarding this publication contact Brand@ARMLS.com. DATA FOR SEPTEMBER 2017 -
2015 Spring Market trends report
 2015 Spring Market trends Report National Summary Low inventory in Vancouver and Toronto continue to drive prices as buyers find themselves in competition over the low supply of single-family homes. The
Scott Market Report Stronger Sales Continue
 June 20 Scott Market Report Stronger Sales Continue The Outer Banks real estate market is seeing good signs in most market segments. After a somewhat slow start to 20, sales agreements picked up significantly
Contents. off the fence. It s a good life!
 I hope you enjoy the latest edition of Brian Buffini s Real Estate Report. The goal of this piece is to help you stay educated on today s market and position yourself as a true professional and your clients
Monthly Market Watch for Maricopa County An overview of what is happening in the Maricopa County real estate market
 Monthly Market Watch for Maricopa County An overview of what is happening in the Maricopa County real estate market Provided by Susan Kraemer of Prudential Arizona Properties Report overview: This report
Reasons to consider buying a New Construction home?
 Reasons to consider buying a New Construction home? It s only January 20, 2017 and the real estate market in San Diego is already buzzing! New listings are hitting the market daily, and many are going
Real Estate Market Report November 2013
 Real Estate Market Report November 2013 A comprehensive report on the SW Riverside County real estate market. www.swriversidecountyhomes.com November, 2013 In November, The number of homes that sold since
BONDREPORT QTR BONDREPORT QTR BONDNEWYORK.COM
 BONDREPORT QTR 4 2017 WELCOME TO THE 19 TH EDITION OF THE BOND REPORT It has been quite the year on many fronts, and by all indications, 2017 has no intention of going quietly. The market has continued
Market Report Miami Q2 2013
 Market Report Q2 at a Glance $ $219,000 Median Price Median price jumped 25.1% since last year and last quarter. This was the largest year over year median price gain since 2012Q1. Average price increased
CAAR Market Report 2010 First Quarter Published by the Charlottesville Area Association of REALTORS
 CAAR Market Report 2010 First Quarter Published by the Charlottesville Area Association of REALTORS Where Are We Now? In the first quarter of 2010, the Charlottesville real estate market continued the
SARETSKY. month in review. re al es tate
 SARETSKY re al es tate month in review june 2018 As the Vancouver Real Estate market heads into the dog days of summer, it is desperately trying to shake an abnormally sluggish first half. To suggest sales
DATA FOR JANUARY Published Feburary 16, Sales are down -14.0% month-over-month. The year-over-year comparison is up +2.5%.
 Permission is granted only to ARMLS Subscribers for reproduction with attribution on to ARMLS COPYRIGHT 2018. For questions regarding this publication contact Brand@ARMLS.com. DATA FOR JANUARY 2018 - Published
TUCSON and SOUTHERN ARIZONA
 TUCSON and SOUTHERN ARIZONA MID-Year Housing Report (520) 840-0963 MathewRodriguez@LongRealty.com 2018 Mid-Year Housing Report INVENTORY Housing market trends For the overall real estate market in Tucson
DATA FOR DECEMBER Published January 23, Sales are up.01% month-over-month. The year-over-year comparison is at +0.5%.
 Permission is granted only to ARMLS Subscribers for reproduction with attribution on to ARMLS COPYRIGHT 2017. For questions regarding this publication contact Brand@ARMLS.com. DATA FOR DECEMBER 2017 -
Real Estate Market Report September 2013
 Real Estate Market Report September 2013 A comprehensive report on the SW Riverside County real estate market. www.swriversidecountyhomes.com September, 2013 In September, Home sales were up 9.7% from
MonthlyStatistics AUGUST 2017
 MonthlyStatistics AUGUST 2017 FOR IMMEDIATE RELEASE September 1, 2017 VIREB Housing Market Continues to Sizzle NANAIMO, BC The Vancouver Island Real Estate Board (VIREB) reports that single-family home
How Selling Your House to a Real Estate Investor Stacks Up Against Your Other Options
 How Selling Your House to a Real Estate Investor Stacks Up Against Your Other Options Pros, cons, costs, and timeline of each option So, you need to sell your house. Selling in a market like today s can
Real Estate Market Report December 2011
 Real Estate Market Report December 2011 For Sale 29744 Ski Ranch St. Murrieta, CA 92563 For Sale 38659 Vista Rock Dr. Murrieta, CA 92563 For Sale 30075 Corte Tolano Temecula, CA 92591 For Sale 39779 Chambray
HOUSING REPORT WASHTENAW JUNE 2018
 WASHTENAW JUNE 2018 Winning The Deal Available listings have been down over 30% from 2 years ago. The shortage of move-in-ready listings has created a feeding frenzy that heats up when sharp new listings
DATA FOR MAY Published June 15, Sales are up +10.3% month-over-month. The year-over-year comparison is up +2.8%. ARMLS STAT MAY 2018
 Permission is granted only to ARMLS Subscribers for reproduction with attribution on to ARMLS COPYRIGHT 2018. For questions regarding this publication contact Brand@ARMLS.com. DATA FOR MAY 2018 - Published
Annual Report On Our National Real Estate Market
 A TWINCITIESPROPERTYFINDER.COM RESOURCE Annual Report On Our National Real Estate Market 1 Contents Industry Facts 3 Mortgage Stats 4 Distressed Properties & Price Information 5 Today s Buyer 6 First-Time
NORTHERN VIRGINIA NOVEMBER 2017
 STATPAK NORTHERN VIRGINIA NOVEMBER 2017 McEnearney.com MARKET IN A MINUTE A SUMMARY OF MARKET CONDITIONS FOR OCTOBER 2017 Contract activity in October 2017 was up 3.8% from October 2016, and there were
Prescott Area Association of REALTORS
 MARKET DATA REPORT Prescott Area Association of REALTORS Provided for the month of (928) 445-2663 3719 Karicio Lane Prescott, AZ 86303 Listings Trends The key metrics for residential inventory (single-family
Minneapolis St. Paul Residential Real Estate Index
 University of St. Thomas Minneapolis St. Paul Residential Real Estate Index Welcome to the latest edition of the UST Minneapolis St. Paul Residential Real Estate Index. The University of St Thomas Residential
The Corcoran Report 3Q17 MANHATTAN
 The Corcoran Report 3Q17 MANHATTAN Contents Third Quarter 2017 4/7 12/23 3 Overview 8 9 10 Market Wide 11 Luxury 24 4 Sales / Days on Market 5 Inventory / Months of Supply 6 7 Market Share Resale Co-ops
Tax Sale Sniper Basic Training
 Tax Sale Sniper Basic Training Establishing Property Values and Maximum Bids Rick Dawson / DeedGrabber.com Inc PO Box 3348 Munster IN 46321 800-242-5410 Copyright Rick Dawson/DeedGrabber.com Inc All rights
HONORABLE CITY COUNCIL FROM: CITY MANAGER DEPARTMENT: PLANNING AND COMMUNITY ENVIRONMENT DATE: MAY 7, 2007 CMR: 227:07
 TO: HONORABLE CITY COUNCIL FROM: CITY MANAGER DEPARTMENT: PLANNING AND COMMUNITY ENVIRONMENT DATE: MAY 7, 2007 CMR: 227:07 SUBJECT: PRESERVATION OF THE BELOW MARKET RATE UNIT AT 502 THAIN WAY IN BARRON
STATPAK MARKET IN A MINUTE A SUMMARY OF MARKET CONDITIONS FOR AUGUST McEnearney.com CONTRACTS URGENCY INDEX INVENTORY INTEREST RATES
 STATPAK WASHINGTON, DC SEPTEMBER 2017 McEnearney.com MARKET IN A MINUTE A SUMMARY OF MARKET CONDITIONS FOR AUGUST 2017 Contract activity in August 2017 was up 4.9% from August 2016, and there were increases