Feng shui Boosting property sales amid challenging times PG4 SMALL UNITS, big challenges Mass-market shoebox rents dip 3.
|
|
|
- Grant Mills
- 5 years ago
- Views:
Transcription

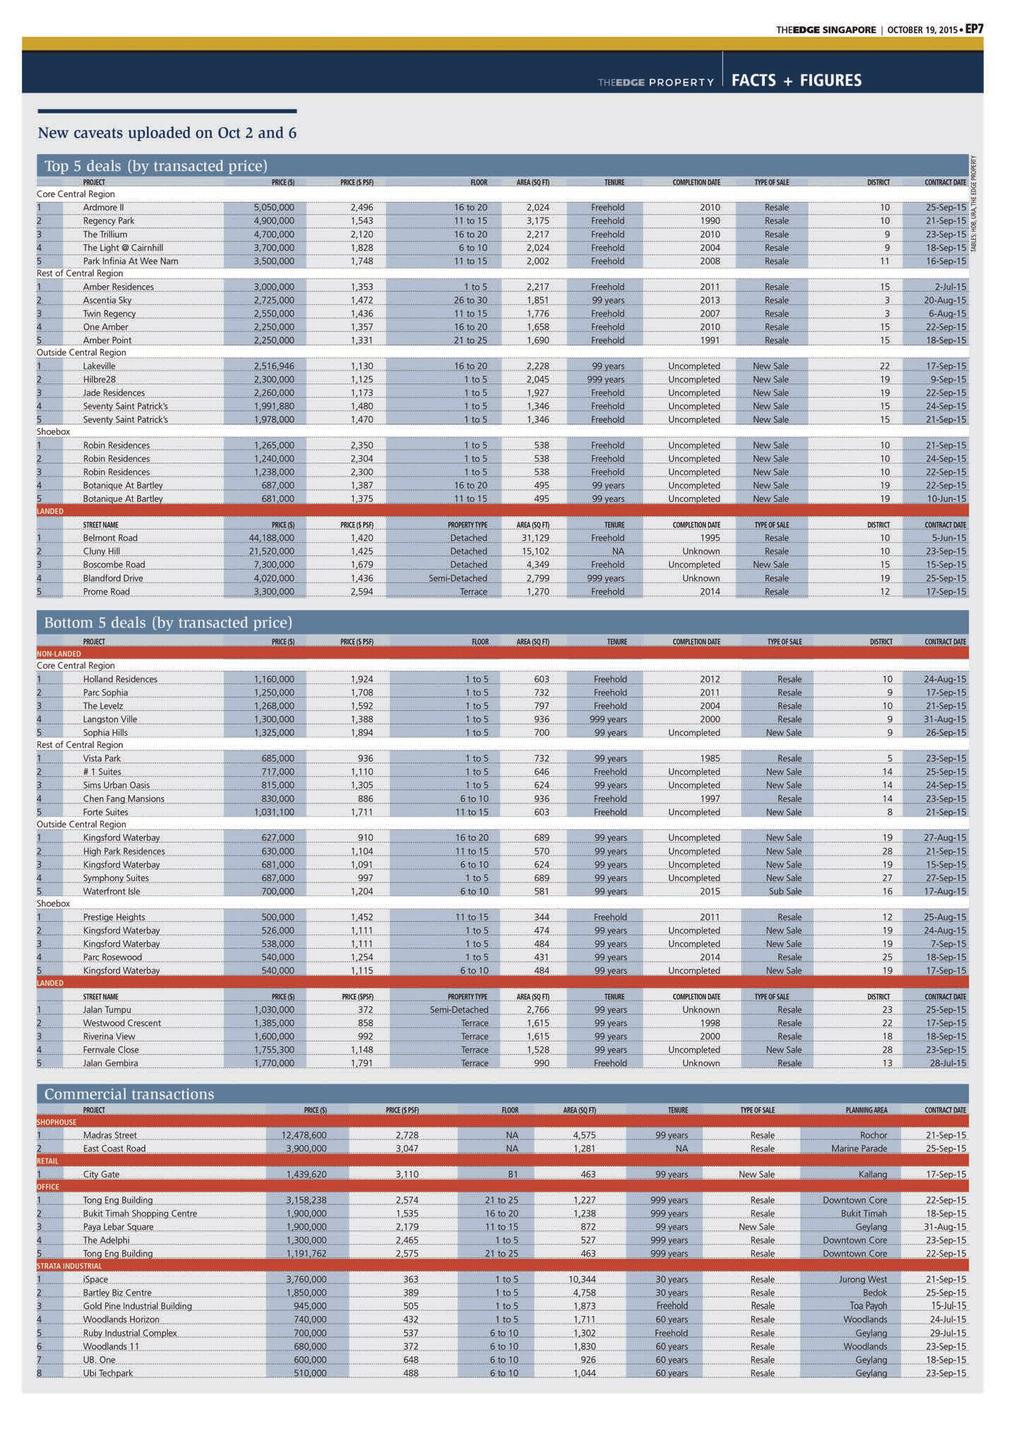
1 THE WEEK OF OCTOBER 19, A PULLOUT WITH MCI (P) 046/03/2015 PPS 1519/09/2012 (022805) Visit TheEdgeProperty.com to find properties, research market trends and read the latest news MAKE BETTER DECISIONS Risk and opportunity Outlook for the prime residential market PG2 Feng shui Boosting property sales amid challenging times PG4 Deal watch Ardmore II unit sold below $2,500 psf PG8 SMALL UNITS, big challenges Mass-market shoebox rents dip 3.5% in 3Q2015 BY LIN ZHIQIN Preliminary estimates indicate that rents for shoebox units dipped 1.9% quarter-on-quarter in 3Q2015. Mass- market shoebox units led the decline as monthly rents fell 3.5% or $73 from $2,089 in 2Q2015, to $2,016 in 3Q2015. On a brighter note, shoebox rents in the city fringe stayed unchanged from the last quarter at $2,380 per month. In the high-end segment, monthly shoebox rents fell 2.1% or $59 from $2,815 in 2Q2015, to $2,756 in 3Q2015 (see Table 1). Shoebox units in the mass market continue to face strong competition from HDB flats for tenants. For the same rents, tenants could get a three-room HDB unit with two bedrooms and share their rental expenses with a flatmate. Based on HDB subletting contracts, the island-wide monthly rents for HDB flats averaged $1,958 for three-room units and $2,297 for fourroom ones in 3Q2015. On the other hand, shoebox units in the high-end and cityfringe segments are more attractive, particularly to tenants who work in the CBD as they can save on commuting costs and time. At the same time, they offer value alternatives to bigger units. Table 1 Mass-market shoebox units lead rental decline MONTHLY RENT ($ PSF) DECLINE SEGMENT 3Q2013 2Q2015 3Q2015 3Q2013 TO 2Q2015 TO URA RENTAL INDEX 2Q2015 (%) 3Q2015 (%) (LAST PEAK TO 2Q2015) (%) High end 3,445 2,815 2, City fringe 2,767 2,387 2, Mass market 2,552 2,089 2, The analysis was based on a basket of properties tracked by The Edge Property. The figures differ slightly from those in our previous article owing to changes in the basket. Shoebox units are defined as private non-landed homes that are up to 550 sq ft in size in this article. High-end segment refers to the Core Central Region (CCR), while the city fringe and mass market refer to the Rest of Central Region (RCR) and Outside Central Region (OCR), respectively. Between 3Q2013 s peak and today, shoebox rents have fallen around 18% or $500 from $2,905 to $2,371 per month. Segment- wise, monthly rents for shoebox units have fallen 20% in the high-end submarket, 14% in the city fringe and 22% in the mass market. In comparison, rents for non-shoebox units have been more resilient. The URA rental index for private non-landed homes fell 7.2% in the high-end segment, 3.1% in the city fringe and 6.7% in the mass market between the last peak and 2Q2015. The soft rental market continues to dent the profitability of shoebox transactions. Based on URA caveat data, 8% of CONTINUES ON PAGE EP4


2 EP2 THEEDGE SINGAPORE OCTOBER 19, 2015 THEEDGE PROPERTY PROPERTY TAKE If you wish to contribute columns, please write in to EDITORIAL EDITOR Ben Paul CITY & COUNTRY SECTION EDITOR Cecilia Chow DEPUTY SECTION EDITOR Michael Lim THE EDGE PROPERTY HEAD OF RESEARCH Feily Sofi an ANALYSTS Esther Hoon, Lin Zhiqin, Tan Chee Yuen Are there prospects for the prime residential market? COPY-EDITING DESK Elaine Lim, Evelyn Tung, Chew Ru Ju, Tan Gim Ean, Choy Wai Fong PHOTO EDITOR Samuel Isaac Chua PHOTOJOURNALIST Bryan Tay EDITORIAL COORDINATOR Rahayu Mohamad DESIGN DESK Tan Siew Ching, Christine Ong, Monica Lim, Nik Edra, Mohd Yusry, Henry Lee ADVERTISING + MARKETING HEAD Edward Stanislaus GROUP SALES MANAGER Cecilia Kay SENIOR MANAGER Windy Tan MANAGERS Mabel Wong, Danna Pusta, Elaine Tan THE EDGE PROPERTY GROUP SALES MANAGER Cowie Tan SENIOR MANAGERS Diana Lim, Cheryann Yeo, Ken Tan EVENTS MARKETING SENIOR MANAGER Sivam Kumar DIGITAL MARKETING ASSISTANT Tim Jacobs COORDINATOR Nor Aisah Bte Asmain CIRCULATION MARKETING MANAGER Coleman Lim OPERATIONS MANAGER Cesar Banzuela De Jesus, Jr EXECUTIVES Gerald Aw, Hannah Wong, Malliga Muthusamy CORPORATE CHIEF EXECUTIVE OFFICER Ben Paul MANAGING DIRECTOR Edward Stanislaus CORPORATE AFFAIRS DIRECTOR Ng Say Guan PUBLISHER The Edge Publishing Pte Ltd 150 Cecil Street #08-01 Singapore Tel: (65) Fax: (65) PRINTER KHL Printing Co Pte Ltd 57 Loyang Drive Singapore Tel: (65) Fax: (65) We welcome your comments and criticism: propertyeditor.sg@ bizedge.com Pseudonyms are allowed but please state your full name, address and contact number for us to verify. FUN FACT The maximum building height allowed in Singapore is 280m. Tanjong Pagar Centre has obtained special permission to be built up to 290m. Districts 9, 10 and 11 in Singapore are considered home to the most prime residential properties on the island. Over the past few years, high-end properties have been hit hard by a series of government cooling measures. The capital value of luxury prime residential property has dropped some 20% since its peak in 2011, while developer sales in prime districts fell 68%, from 1,302 units in 2011 to 422 in 2014 (see Chart 1). Foreigners accounted for a significant portion of private housing buyers in prime districts, but the introduction of the additional buyer s stamp duty (ABSD) in December 2011 and its upward revision in January 2013 has slowed demand from them. In 2011, 31% of transactions of non-landed homes in prime districts were by foreigners, but they accounted for only 16% of the non-landed sales volume in 2014, having been deterred by the 15% ABSD imposed. Over the last three years, these measures, as well as the total debt servicing ratio (TDSR), have also reduced purchases by Singaporeans and permanent residents in the prime districts, with volume falling 50% to 55%. Both local and foreign investors have been significantly affected by the cooling measures, resulting in a considerable fall in prices and transaction volume in the prime districts. Chart 1 Developer sales volume in prime districts Number of units Number of units 4,500 4,000 3,500 3,000 2,500 2,000 1,500 1, Unsold stock significant, but expected to ease gradually The slow demand and low transaction volume arising from the cooling measures have led to an oversupply of residential units in the prime districts. Slow developer sales have meant that many new projects are completed with unsold stock. This has led to the number of completed but unsold units almost doubling from 715 units in 2Q2012 to 1,420 units in 2Q2015 (see Chart 2). However, the moderation in new launches has kept the 1,221 launched but unsold units in 2Q2015 quite similar to the 1,194 units in 2Q2012. The lack of collective sales since 2012 and the focus of government residential land sales on non-prime locations have reduced the number of potential new developments in prime districts. Consequently, the number of units with sale prerequisites that are yet to be launched has almost halved, from 4,047 units in 2Q2012 to 2,044 units in 2Q2015. The current unsold supply, comprising completed and unsold units, units launched but unsold and units with sale prerequisites yet to be launched, amounts to 4,685 units. It is a considerable quantum compared with the takeup of 422 units in 2014, but appears manageable if the market eventually normalises at the 10-year average take-up of 2,196 units per annum. A soft rental market deters investors In the past few years, there was a trend towards a higher number of new completions in the prime districts. The number of units completed between Chart 2 Chart 3 Unsold units* in prime districts 7,000 6,000 5,000 4,000 3,000 2,000 1,000 URA, JLL RESEARCH URA, JLL RESEARCH BY ONG TECK HUI 2011 and 2014 was 22% higher than that in the preceding four years. This widened the supply for leasing significantly, while rental demand from expatriates has been stagnating. For example, the number of employment passes issued by the Ministry of Manpower increased only marginally by 2% from 175,400 in 2011 to 178,900 in 2014, owing to policy tightening on the intake of foreign workers. The consequence is a decline in rents during this period, with prime-market monthly rents dropping about 25%, from $5.23 psf in 2Q2011 to $3.93 psf in 2Q2015. The challenging leasing market and reduced rental returns would be another deterrent to investors looking at the prime residential market. Prime residential prices in Singapore have become more attractive relative to other global cities As Singapore globalised, many investors were attracted to its prime residential market, taking into account sound economic fundamentals, political stability, a reliable legal framework and market transparency. This has led to the city-state being compared with London, New York, Hong Kong, Tokyo and other global cities as potential destinations for real estate investment. We compared high-end residential prices in these four cities with those in Singapore from 2007 to 2015, in US dollar terms (see Chart 3). In 2007, prices in Hong Kong were 41% higher than those in Singapore, but the gap in 2015 has jumped to 165%. In 2007, before the global financial crisis, the price gap between prime central London and Singapore properties was 70%, but it narrowed to 34% in 2010, as the British pound weakened during that period. However, in the past few years, the prime central London market strengthened, while Singapore s prime market weakened, leading to prices in the city-state lagging those in London by 92%. In New York, prime residential prices were 48% higher than those in Singapore in 2008, but with the downturn in the US, they dropped to slightly below prime prices in Singapore in However, a recovery in the New York market in the past few years led to its prices leading Singapore s by 82%. On the back of a stronger Japanese yen previously, Tokyo prime residential prices were on average about 30% higher than Singapore s between 2009 and A weakening of the Japanese yen in the recent few years narrowed the price gap to 14% in Outlook Demand in the prime residential market will continue to be impeded by the cooling measures, while the economic slowdown and the rise in interest rates could be additional dampeners. The soft rental market is another negative factor, as investors will be deterred by challenging leasing conditions and weak rental returns. Prices are expected to soften into 2016, although they could stabilise when the cooling measures are relaxed. While the oversupply in the prime segment is significant, owing to the recent low level of transactions, it appears manageable when the market recovers and take-up normalises. A comparison with other global cities shows the price gap between the prime residential market of Singapore and those of Hong Kong, London and New York has widened significantly. Prime residential prices in Singapore have become relatively more attractive, but investors remain wary, as the ABSD raises the cost of entry and there is limited scope for price appreciation while the cooling measures remain in place. However, should positive outcomes arise from policy changes, a recovery in the prime residential market could yield good investment returns, considering the extent that it has been suppressed. E Ong Teck Hui is national director, research & consultancy, JLL Singapore. He can be reached at teckhui.ong@ ap.jll.com. Prime residential price gap between Singapore and other major cities in US dollar terms Price gap % Hong Kong, 165% London, 92% New York, 82% JLL RESEARCH, THE CORCORAN REPORT 1Q10 2Q10 3Q10 4Q10 1Q11 2Q11 3Q11 4Q11 1Q12 2Q12 3Q12 4Q12 1Q13 2Q13 3Q13 4Q13 1Q14 2Q14 3Q14 4Q14 1Q15 2Q15 Not launched but with prerequisites for sale Launched but unsold Completed and unsold *Excludes potential projects without prerequisites for sale Tokyo, 14% H2015

3 THEEDGE SINGAPORE OCTOBER 19, 2015 EP3


4 EP4 THEEDGE SINGAPORE OCTOBER 19, 2015 THEEDGE PROPERTY FENG SHUI Three ways feng shui can boost property sales BY ANTHONY LEE The slew of cooling measures has dampened sales activities in recent years. With leads becoming scarce and valuable, here are three ways realtors can use feng shui to boost sales in a challenging market. Choose a good day for viewing Ethnic Chinese often consult the Tong Sheng to pick an auspicious date and time for special occasions, such as weddings, moving to a new house or opening a business. Realtors and businessmen can similarly make use of the Tong Sheng to set a favourable appointment date and time to boost their chances of closing a deal. The simplest way would be to identify the unfavour able day and time that would be incompatible with the realtor s and his client s zodiac (see calendar). There is a more advanced way of identifying the most auspicious appointment date and time, but we will not discuss that here. Declutter the property Clutter interferes with the flow of qi or energy around a property. A home with a balanced qi brings peace and tranquillity to those who step into its space. Leaving footwear around the doorstep will hinder the flow of positive qi into the property. Shoes and slippers should be properly stored in a shoe rack to enhance the flow of qi and wealth into the house. Avoid having the kitchen door facing the main door This layout may lead to loss of wealth. However, the problem can be easily countered by installing a curtain over the kitchen door. E Timings for business appointments OTHER ZODIACS OCTOBER 2015 DAY CONFLICTING* 9AM TO 11AM TO 1PM TO 3PM TO 5PM TO 7PM TO ZODIAC 10.59AM 12.59PM 2.59PM 4.59PM 6.59PM 8.59PM 15 Thur Horse 16 Fri Goat 17 Sat Monkey 18 Sun Rooster 19 Mon Dog 20 Tues Pig 21 Wed Rat 22 Thur Ox 23 Fri Tiger 24 Sat Rabbit 25 Sun Dragon 26 Mon Snake 27 Tues Horse 28 Wed Goat 29 Thur Monkey 30 Fri Rooster 31 Sat Dog NOVEMBER 2015 CONFLICTING* 9AM TO 11AM TO 1PM TO 3PM TO 5PM TO 7PM TO ZODIAC 10.59AM 12.59PM 2.59PM 4.59PM 6.59PM 8.59PM 1 Sun Pig 2 Mon Rat 3 Tues Ox 4 Wed Tiger 5 Thur Rabbit 6 Fri Dragon 7 Sat Snake 8 Sun Horse 9 Mon Goat 10 Tues Monkey 11 Wed Rooster 12 Thur Dog 13 Fri Pig 14 Sat Rat Auspicious date/time for business appointments Inauspicious date/time for business appointments * Conflicting zodiac avoid making business appointments LEE METAPHYSICS LEE METAPHYSICS ILLUSTRATION BY SHAY YEONG Anthony Lee is a feng shui consultant at Lee Metaphy sics Consulting, with more than 10 years experience. He can be reached at leemeta physics@gmail.com. Avoid having the kitchen door facing the main door Install curtain over kitchen door if it faces the main door COVER STORY Shoebox landlords have holding power as units affordable Table 2 FROM PAGE EP1 residential shoebox units (15 of 185 transactions) were sold at a loss in the secondary market. In comparison, only 3% (eight of 307 transactions) of shoebox units were sold at a loss in 2013 and 7% (14 of 215 transactions) in 2014 (see chart). In the city fringe, the average loss for unprofitable shoebox transactions has risen from $31,080 (5%) in 2014 to $60,395 (10%) year to date. Similarly, those in the mass market rose from $25,509 (4%) to $79,112 (13%) over the same period. Bucking the trend was the high-end segment. The average loss for its unprofitable transactions pared down to 6% (see Table 2). The trend echoes the relative rental resi lience in the various market segments. But the average gain per profitable trans action has generally diminished from last year s. Bigger losses and smaller profits MARKET SEGMENT PERIOD LOSS ($/%) GAIN ($/%) CCR ,079/18 130,409/ to date 59,053/6 119,126/15 RCR ,080/5 133,908/ to date 60,395/10 109,253/19 OCR ,509/4 108,556/ to date 79,112/13 104,228/20 Nonetheless, shoebox landlords have strong holding power owing to the affordability of the units. According to JLL, only six shoebox units were listed for auction in 3Q2015, down from nine in the same period last year. We do not expect [a] significant increase in such units put up in 2016 and perhaps one to two more units in 4Q2015, says JLL head of auction Mok Sze Sze. E Chart No of unprofitable shoebox transactions on the rise


5 THEEDGE SINGAPORE OCTOBER 19, 2015 EP5

6 EP6 THEEDGE SINGAPORE OCTOBER 19, 2015
7


8 EP8 THEEDGE SINGAPORE OCTOBER 19, 2015 THEEDGE PROPERTY DEAL WATCH Third unit at Ardmore II sold below $2,500 psf this year Prices of high-end non-landed homes softened by another 1.3% q-o-q in 3Q2015, says URA BY TAN CHEE YUEN A 2,024 sq ft high-floor unit in Ardmore II was sold for $5.05 million ($2,496 psf) in September, based on caveats listed by the Urban Redevelopment Authority (URA). The price was slightly below The Edge Fair Value of $2,530 psf. The sale represented the third value deal in the project this year. In September, a mid-floor unit changed hands for the same price as the subject property. Another mid-floor unit was sold for $4.7 million ($2,323 psf) in March. Based on URA caveats, prices last touched the $2,500 psf level in December 2011 and March 2012 when comparable units were sold at $2,574 psf and $2,570 psf respectively. Ardmore II is a luxury freehold development in District 10 that was completed in Prices in the 118-unit project hovered between $2,800 psf and $3,000 psf in 2013 (see Table 1). No caveat was lodged in According to flash estimates by the URA, prices of non-landed homes in the high-end segment, or Core Central Region, softened by another 1.3% q-o-q in 3Q2015, putting it at 9% below their peak in 1Q2013. A location scan of properties within 500m of Ardmore II shows potential value deals at below $2,000 psf, or just over $2,000 psf. Gross rental yields were generally between 2.2% and 2.6% (see Table 2). E Scan the QR code for value deals in Ardmore II and nearby projects Table 1 Table 2 Transaction volume and prices in Ardmore II (2011 to 2015) YEAR SALES VOLUME PRICE RANGE (UNITS) ($ PSF) ,574 to 2, ,520 to 2, ,841 to 2, ,323 to 2,866 Location scan of properties within 500m of Ardmore II PROJECT NAME TENURE COMPLETION AVERAGE SALES AVERAGE RENTAL RENTAL PRICE VOLUME RENT VOLUME YIELD ($ PSF) ($ PSF PM) (%) The Draycott Freehold , Draycott Freehold ,900 1 The Arc at Draycott Freehold , St Regis Residences Singapore 999 years , Orion Freehold , The Claymore Freehold , Ardmore II Freehold , Ardmore Park Freehold , As we are not party to the contract between the client and agent, we are not able to verify information provided by the agent Edge Fair Value is a tool on TheEdgeProperty. com to determine the fair value of a property Location scan tool is a search engine for property data around a specific landmark. It is available on TheEdgeProperty.com for registered users. Please write in to propertyeditor. sg@bizedge.com to request for access. FACTS + FIGURES New caveats uploaded on Oct 2 and 6 Most profitable deals NON-LANDED PROJECT DISTRICT AREA (SQ FT) SOLD ON SALES PRICE ($) BOUGHT ON PURCHASE PRICE ($) PROFIT ($) PROFIT (%) HOLDING PERIOD (YEARS) 1 Park Infinia At Wee Nam 11 2, Sep-15 3,500, Oct-05 1,862,190 1,637, Amber Point 15 1, Sep-15 2,250, Jan-02 1,050,000 1,200, The Trillium 9 2, Sep-15 4,700, Apr-07 3,528,000 1,172, Country Esquire 20 1, Sep-15 1,900, Feb ,000 1,150, Twin Regency 3 1,776 6-Aug-15 2,550, Nov-06 1,400,000 1,150, Tanglin Park 10 1, Sep-15 2,350, Jan-00 1,515, , Trevose Park 11 2, Sep-15 3,323, Feb-10 2,525, , Kovan Melody 19 1, Sep-15 1,670, Mar , , Urbana 9 1, Sep-15 2,350, May-09 1,680, , Westmere 22 1, Sep-15 1,170, Sep , , LANDED 1 Detached/Belmont Road 10 31,129 5-Jun-15 44,188, Jul-09 30,500,000 13,688, Terrace/Jalan Kemaman 12 1, Sep-15 3,228,000 2-Oct ,000 2,688, Terrace/Duku Road 15 1, Sep-15 2,600, Apr-97 1,080,000 1,520, Semi-Detached/Blandford Drive 19 2, Sep-15 4,020, Aug-12 3,100, , Terrace/Jalan Gembira Jul-15 1,770,000 6-Jan , , TABLES: Non-profitable deals PROJECT DISTRICT AREA (SQ FT) SOLD ON SALES PRICE ($) BOUGHT ON PURCHASE PRICE ($) LOSS ($) LOSS (%) HOLDING PERIOD (YEARS) 1 The Cairnhill 9 2, Sep-15 3,700,000 5-Oct-10 5,400,000 1,700, Ardmore II 10 2, Sep-15 5,050, Aug-07 6,100,000 1,050, One Shenton 1 1, Sep-15 2,360, Oct-07 3,386,880 1,026, The Sixth Avenue Residences 10 1, Sep-15 1,500, Jan-10 1,871, , Terrace/Waringin Park 14 1, Aug-15 2,000, Dec-14 2,200, , The Marina Bay Sep-15 1,445, Dec-07 1,635, , Lagoon View 15 1, Sep-15 1,280, Jul-07 1,400, , Prestige Heights Aug , Nov ,000 75, The Tropica 18 1, Sep , May-12 1,025,000 75, Palm Spring Sep-15 1,458, Sep-11 1,500,000 42, Terrace/Jalan Kampong Chantek 21 3,778* 17-Sep-15 2,180, Dec-10 2,188,000 8, Tables compiled by Tan Chee Yuen *Refers to strata area. Otherwise, area stated for shophouses and landed properties refer to land area.
Private Residential Market REAL ESTATE DATA TREND Q3 2018
 Private Residential Market REAL ESTATE DATA TREND Q3 2018 Duo Residences Page 1 Notwithstanding the recent property cooling measures, the private residential market remained resilient in Q3 Sentiment in
Based on HDB data, there have been three. City View s boon Hefty gains for DBSS sellers. Home design Grab attention with a dash of red PG 6
 THE WEEK OF FEBRUARY 22, 2016 716 A PULLOUT WITH MCI (P) 046/03/2015 PPS 1519/09/2012 (022805) Visit TheEdgeProperty.com to find properties, research market trends and read the latest news MAKE BETTER
When Will Singapore s Private Residential Leasing Market Turn Around? June 2016
 When Will Singapore s Private Residential Leasing Market Turn Around? June 2016 Rents have been declining in all sub-markets The Urban Redevelopment Authority s (URA) rental index for private homes has
PRIVATE RESIDENTIAL PRICE STAYED STABLE DESPITE COOLING MEASURES AND UNCERTAIN EXTERNAL ENVIRONMENT IN Q3 SINGAPORE RESEARCH RESIDENTIAL
 RESEARCH RESIDENTIAL Q3 218 RESIDENTIAL MARKET SNAPSHOT All Private Residential Property Price Index 149.7 8.8% increase yoy Total Transaction Volume* (Q3 218) 5,812 units 28% decrease yoy *Transaction
OFFICE AND RETAIL STRATA MARKETS REMAINED MUTED, WHILE SHOPHOUSES RECEIVED SUSTAINED BUYING INTEREST IN H1 2017
 H1 21 BIANNUAL RESEARCH BULLETIN SINGAPORE COMMERCIAL SALES OFFICE AND RETAIL STRATA MARKETS REMAINED MUTED, WHILE SHOPHOUSES RECEIVED SUSTAINED BUYING INTEREST IN H1 21 Strata-Titled Offices: Total transaction
SITTING ON GOLDMINE THE LANDED HOUSING SEGMENT
 MAR 214 / ISSUE 11 SQUARE FOOT RESEARCH PTE. LTD. Phone: +65 6223 2163 Website: www.squarefoot.com.sg The private landed residential segment has outperformed its non landed counterpart for 12 consecutive
How low can it go? MARCH A study on the price trends and the impact of various government policies on the Executive Condominium market
 P ROP ERT Y HERALD How low can it go? A study on the price trends and the impact of various government policies on the Executive Condominium market Introduction Executive Condominium (EC) is a hybrid of
REAL ESTATE DATATREND Private Residential Market
 REAL ESTATE DATATREND Private Residential Market Keener Sense of Real Estate Market bottom in sight 28 th July 2017 Longest losing streak in prices continues The longest losing streak of Singapore private
California Housing Market Update. Monthly Sales and Price Statistics November 2018
 California Housing Market Update Monthly Sales and Price Statistics November 2018 Home Sales: Largest Decline Since 2014 California, November 2018 Sales: 381,400 Units, -4.6% YTD, -13.4% YTY 700,000 600,000
California Housing Market Update. Monthly Sales and Price Statistics October 2018
 California Housing Market Update Monthly Sales and Price Statistics October 2018 Sales Had the 2 nd Largest Drop in the Last 6 Months California, October 2018 Sales: 397,060 Units, -3.7% YTD, -7.9% YTY
Property. Mashreq. Economic Overview. Wealth Gauge.
 Economic Overview United Arab Emirates has continued to benefit from surging confidence, safeheaven status, rising population and stable world class real estate market opportunities. The macroeconomic
BRISBANE HOUSING MARKET STUDY
 BRISBANE HOUSING MARKET 2018 STUDY Executive Summary Brisbane s residential market, especially the detached houses segment has risen steadily over the last year due to the rise in population, falling unemployment
PERSPECTIVE. Private Residential (Landed) Market Review & Outlook. Prices continued to decline 2Q 2015
 Market Review & Outlook. Prices continued to decline 2Q 2015") PERSPECTIVE 2015 Private Residential (Landed) Market Review & Outlook Prices continued to decline Prices continued their decline in the second quarter of 2015, falling 1.0% quarter-on-quarter (QoQ) and
PERSPECTIVE 2015 Private Residential (Landed) Market Review & Outlook Prices continued to decline Prices continued their decline in the second quarter of 2015, falling 1.0% quarter-on-quarter (QoQ) and
Contents SEPTEMBER 2009
 Contents Two Tier Market:...1 Overview & Commentary: The National Picture...2 Overview & Commentary: The Regional Picture...3 Overview & Commentary: Supply...3 Property Prices (National)...4 National Bedroom
California Housing Market Update. Monthly Sales and Price Statistics December 2018
 California Housing Market Update Monthly Sales and Price Statistics December 2018 Sales Reached the Lowest Level since Jan 2015 California, December 2018 Sales: 372,260 Units, -5.2% YTD, -11.6% YTY 700,000
Presented by Corporate Visions Pte Ltd
 Our Vision : To be the leading consultancy in commercial and industrial properties Our Mission: To provide professional, value-added and cost effective business space solutions Presented by Corporate Visions
Presented by Corporate Visions Pte Ltd
 Our Vision : To be the leading consultancy in commercial and industrial properties Our Mission: To provide professional, value-added and cost effective business space solutions Presented by Corporate Visions
San Francisco Bay Area to Marin, San Francisco, and San Mateo Counties Housing and Economic Outlook
 San Francisco Bay Area to 019 Marin, San Francisco, and San Mateo Counties Housing and Economic Outlook Bay Area Economic Forecast Summary Presented by Pacific Union International, Inc. and John Burns
PROPERTY INSIGHTS Q1 Snapshot
 PROPERTY INSIGHTS Singapore Quarter 1, 2018 2018 Q1 Snapshot Residential market on the upturn Prices of private residential properties rose significantly in. How do the other market segments fare? Singapore
California Housing Market Update. Monthly Sales and Price Statistics September 2018
 California Housing Market Update Monthly Sales and Price Statistics September 2018 Sales Had the Largest Decline since March 2014 California, September 2018 Sales: 382,550 Units, -3.3% YTD, -12.4% YTY
Industrialists and landlords to brace for challenges in 2016
 Research & Forecast Report SINGAPORE INDUSTRIAL Q1 2016 Industrialists and landlords to brace for challenges in 2016 Doreen Goh Associate Director, Research and Advisory Leasing activities in the industrial
Property. Mashreq. Economic Overview. Wealth Gauge
 Wealth Gauge Volume 23 November 2015 Economic Overview In spite of the dip in Global Oil prices the GDP for 2015 grew at 3.5. The UAE economic growth is expected to slow down and grow at 2.9 in 2016 driven
Economic Spotlight September 1, 2009
 Economic Spotlight September 1, 29 Update on Alberta s Housing Market Summary Alberta s housing market is beginning to show signs of recovery. Housing starts have rebounded from March lows and activity
Housing Bulletin Monthly Report
 January 21 1 Housing Bulletin Monthly Report Most new homes built in second half of 29 25, 2, 15, 1, 5, Dec 7 Jan 8 Feb 8 mar 8 apr 8 Alberta s 29 housing starts increased 72.8 per cent over 28, suggesting
DUBAI HOUSING MARKET STUDY 2017
 DUBAI HOUSING MARKET STUDY 217 Executive Summary Dubai residential market has been a story of increased supply and unsold stock resulting in declining prices over the last three years. Soft price corrections
Housing Bulletin Monthly Report
 October 21 1 Housing Bulletin Monthly Report Housing Starts show Slight improvement in September CANADA Housing Starts 2, 15, 1, 5, Sep 8 Oct 8 Nov 8 Dec 8 Preliminary Housing Starts in Alberta and Canada
San Francisco Bay Area to Santa Clara & San Benito Counties Housing and Economic Outlook
 San Francisco Bay Area to 019 Santa Clara & San Benito Counties Housing and Economic Outlook Bay Area Economic Forecast Summary Presented by Pacific Union International, Inc. and John Burns Real Estate
Singapore has imposed an extra stamp duty of 10% on homes bought by foreigners in early December 2011.
 In the past few years, property prices in Malaysia have appreciated dramatically between 20% and 80% whether in major cities or smaller towns and depending on specific location. This development can be
California Housing Market Update. Monthly Sales and Price Statistics August 2018
 California Housing Market Update Monthly Sales and Price Statistics August 2018 Sales Declined for the 4 th Consecutive Month California, August 2018 Sales: 399,600 Units, -2.1% YTD, -6.6% YTY 700,000
PROPERTY INSIGHTS. Market Overview. Purchase sentiment improved. Singapore Quarter 2, Residential price indices
 PROPERTY INSIGHTS Singapore Quarter 2, 2012 Market Overview Purchase sentiment improved While lingering concerns over the eurozone debt problems continued to plague occupier sentiment in Q2 2012, purchase
PROPERTY INSIGHTS. Market Overview. Mixed outlook across all sectors. Singapore Quarter 3, Resale non-landed residential price indices
 PROPERTY INSIGHTS Singapore Quarter 3, 2014 Market Overview Mixed outlook across all sectors Based on advanced estimates by the Ministry of Trade and Industry (MTI), the Singapore economy grew moderately
DETACHED MULTI-UNIT APPROVALS
 HIA New Home Sales DETACHED MULTI-UNIT APPROVALS SALES MULTI-UNIT DETACHED A monthly update on the sales of new homes December 217 TAX BURDEN TAKES TOLL ON New Home Sales during 217 Sales still post modest
SINGAPORE FOCUS II HOUSING: VOLUME DOWN, PRICES HOLDING UP SO FAR
 HOUSING: VOLUME DOWN, PRICES HOLDING UP SO FAR By Elaine Khoo & Wesley Chong From UOB Country & Credit Risk Management 214 new home sales volume has been dismal, falling 51% YoY to 7,316 units, levels
TIS THE SEASON. How to bottom fish for property deals
 THE WEEK OF DECEMBER 7, 2015 706 A PULLOUT WITH MCI (P) 046/03/2015 PPS 1519/09/2012 (022805) Visit TheEdgeProperty.com to find properties, research market trends and read the latest news MAKE BETTER DECISIONS
PROPERTY INSIGHTS. Market Overview. Residential sales maintained its momentum in Q Citigold Private Client. Singapore Quarter 1, 2017
 Citigold Private Client PROPERTY INSIGHTS Singapore Quarter 1, 2017 Residential sales maintained its momentum in Q1 2017 Market Overview Singapore s GDP is expected to grow by 2.5% y-o-y in Q1 2017, based
CHINA AND HONG KONG RESIDENTIAL MARKETS. by Knight Frank and Holdways 10 December 2014
 CHINA AND HONG KONG RESIDENTIAL MARKETS by Knight Frank and Holdways 10 December 2014 CHINA S ECONOMY, POLICIES AND IMPACT ON DEVELOPERS Presented by Helen Liu General Manager, Beijing Holdways Information
PROPERTY INSIGHTS. Market Overview. Increase in residential sales amid weaker market in Singapore Quarter 4, 2015
 PROPERTY INSIGHTS Singapore Quarter 4, 215 Increase in residential sales amid weaker market in 215 Market Overview Property investment sales in Singapore in Q4 were boosted by the Government Land Sales
Economic Highlights. Payroll Employment Growth by State 1. Durable Goods 2. The Conference Board Consumer Confidence Index 3
 August 26, 2009 Economic Highlights Southeastern Employment Payroll Employment Growth by State 1 Manufacturing Durable Goods 2 Consumer Spending The Conference Board Consumer Confidence Index 3 Real Estate
Housing Bulletin Monthly Report
 February 21 1 Housing Bulletin Monthly Report Housing Starts 25, 2, 15, 1, 5, Alberta Housing Starts up 5 per cent from 29 From February 29 to 21, preliminary housing starts increased 82.7 per cent across
Hong Kong Office MarketView
 1995 1996 1997 1998 1999 2000 2001 2002 2003 2004 2005 2006 2007 2008 2009 2010 2011 2012 2013 2014 2015 2016 2017 2018 2019 2020 Hong Kong Office MarketView Q1 2013 Global Research and Consulting OVERALL
California Housing Market Update. Monthly Sales and Price Statistics May 2018
 California Housing Market Update Monthly Sales and Price Statistics May 2018 Sales Lost Momentum as Mortgage Rates Continued to Climb California, May 2018 Sales: 409,270 Units, +0.3% YTD, -4.6% YTY 700,000
TEXAS HOUSING INSIGHT
 TEXAS HOUSING INSIGHT JAMES P. GAINES CHIEF ECONOMIST WESLEY MILLER RESEARCH ASSISTANT BAILEY CUADRA RESEARCH ASSISTANT LUIS B. TORRES RESEARCH ECONOMIST TECHNICAL REPORT 2 1 2 0 OCTOBER 2017 TR Contents
PropertyGuru Property Market Outlook 2018
 PropertyGuru Property Market Outlook 2018 PropertyGuru Property Market Outlook 2018 The PropertyGuru Property Market Outlook report is published annually and uses a wide scope of proprietary and public
San Francisco Bay Area to Napa County Housing and Economic Outlook
 San Francisco Bay Area to 019 Napa County Housing and Economic Outlook Bay Area Economic Forecast Summary Presented by Pacific Union International, Inc. and John Burns Real Estate Consulting, LLC On Nov.
Growing at a Slower Pace
 2Q 2012 market overview research & forecast report hong kong retail market colliers international HONG KONG Growing at a Slower Pace Hong Kong s inbound tourism growth remained resilient, rising 14% YoY
Rightmove House Price Index
 Rightmove House Price Index The largest monthly sample of residential property prices October 2018 National edition Under embargo for 00.01 hours, Monday 15 th October 2018 Subdued prices provide first-time
HOUSING MARKET OUTLOOK Calgary CMA
 H o u s i n g M a r k e t I n f o r m a t i o n HOUSING MARKET OUTLOOK Calgary CMA C a n a d a M o r t g a g e a n d H o u s i n g C o r p o r a t i o n Date Released: Fall 2011 NEW HOME MARKET Total housing
Residential Commentary Sydney Apartment Market
 Residential Commentary Sydney Apartment Market April 2017 Executive Summary Sydney Apartment Market: Key Indicators 14,200 units are currently under construction in Inner Sydney with completion expected
PROPERTY INSIGHTS Q2 Snapshot. Singapore Quarter 2, Singapore Quarter 2, 2018
 PROPERTY INSIGHTS Singapore Quarter 2, 2018 Singapore Quarter 2, 2018 2018 Q2 Snapshot Singapore s economy grew by 4.4 per cent in Q1 2018, largely driven by the manufacturing sector, which expanded by
Housing Bulletin Monthly Report
 August 21 Housing Bulletin Monthly Report 1 C a n a da s P r e li m i n a ry H o u s i n g S ta r t s s l i p i n J u ly Preliminary Housing St arts in Albert a* and Canada* July 28 to July 21 25, Canada
APAC REALTY POSTS DOUBLE-DIGIT GROWTH IN NET PROFIT FOR 9M FY2018
 APAC REALTY POSTS DOUBLE-DIGIT GROWTH IN NET PROFIT FOR 9M FY2018 Total revenue jumped 26.3% to S$342.1 million in 9M FY2018, mainly due to the increase in brokerage income from the resale and rental of
Democratising Property Investments
 Democratising Property Investments What I wish to share today 1. Property sector outlook 2. How theedgeproperty.com can help you make better property investment decisions Property Sector Outlook The property
NATIONAL ASSOCIATION of REALTORS RESEARCH DIVISION. Prepared for Florida REALTORS
 NATIONAL ASSOCIATION of REALTORS RESEARCH DIVISION Prepared for Florida REALTORS NATIONAL ASSOCIATION OF REALTORS RESEARCH DIVISION Page 1 Page 3 Page 4 Page 6 Page 7 Page 8 Page 9 Page 10 Page 11 Page
Manhattan Residential Rental Market Report
 Manhattan Residential Rental Market Report Second Quarter 217 Second Quarter 217 This report follows overall conditions in the Manhattan rental market during June as well as throughout the second quarter
METROPOLITAN TRACT PERFORMANCE REPORT For the Quarter Ended December 31, 2007
 F-5 METROPOLITAN TRACT PERFORMANCE REPORT For the Quarter Ended December 31, 2007 Finance, Audit & Facilities Committee March 20, 2008 CONSOLIDATED METROPOLITAN TRACT PROPERTIES Quarterly Summary Quarterly
Released: June Commentary 2. The Numbers That Drive Real Estate 3. Recent Government Action 9. Topics for Home Buyers, Sellers, and Owners 11
 Released: June 2011 Commentary 2 The Numbers That Drive Real Estate 3 Recent Government Action 9 Topics for Home Buyers, Sellers, and Owners 11 Brought to you by: KW Research Commentary The U.S. housing
This Month in Real Estate
 Keller Williams Research This Month in Real Estate Released: June 11, 2009 Commentary. The Numbers That Drive Real Estate Recent Government Action. Research for Buyers and Sellers. 2 4 10 13 1 Green Shoots
Executive Condominiums
 Residential I Singapore REAL ESTATE DATATREND Executive Condominiums Keener Sense of Real Estate EC buyers options to dwindle in 2017 13 th April 2016 Synopsis EC market off to a good start Unsold inventory
Asking Price Index Released 12/02/16 February 2016
 EMBARGOED UNTIL 12/02/16 HOME.CO UK ASKING PRICE INDEX February 2016 Released: 12/02/2016 1 of 6 Asking Price Index Released 12/02/16 February 2016 England Prices Take a Spring Leap Headlines England prices
Summary of JREI Global Property Value/Rent Indices (No. 10, Apr. 2018)
") May 29, 2018 Japan Real Estate Institute (JREI) JREI-kenkyu-madoguchi@imail.jrei.jp Summary of JREI Global Property Value/Rent Indices (No. 10, Apr. 2018) We are pleased to release a summary of the results
May 29, 2018 Japan Real Estate Institute (JREI) JREI-kenkyu-madoguchi@imail.jrei.jp Summary of JREI Global Property Value/Rent Indices (No. 10, Apr. 2018) We are pleased to release a summary of the results
Rambutan Road Report by Justin, HP: Property Summary Sheet Latest Avg PSF: $897 psf (Apr 10)
") Unit Pricing Selected Address Property Summary Sheet : 23 Rambutan Road #02-01 (1038sqft) Unit Transacted : $ 774,380 ($ 746 psf) on Apr 1, 1997 Median Price^ based on current listings : $ 1,035,924 ($
Unit Pricing Selected Address Property Summary Sheet : 23 Rambutan Road #02-01 (1038sqft) Unit Transacted : $ 774,380 ($ 746 psf) on Apr 1, 1997 Median Price^ based on current listings : $ 1,035,924 ($
Housing market feels the chill as oversupply continues Feb. 2019
 February 19 19 MONTHLY STATISTICS PACKAGE Housing market feels the chill as oversupply continues 19, March 1, 19 The effects of Calgary s economic climate continue to create weak sales activity and elevated
UNITAS CONSULTANCY. Dubai: Yield Fallacy Q A GLOBAL CAPITAL PARTNERS GROUP COMPANY
 UNITAS CONSULTANCY A GLOBAL CAPITAL PARTNERS GROUP COMPANY Q3 2017 Dubai: Yield Fallacy This document is provided by Unitas Consultancy solely for the use by its clients. No part of it may be circulated,
PROPERTY ANALYSIS REPORT - SUMMARY. #03-08, Vida, 5 Peck Hay Road, (S)
") - SUMMARY This report is designed to help buyers, sellers and industry experts to make better informed property decisions. It includes detailed analysis of the property, sales prices, rental prices, investment
- SUMMARY This report is designed to help buyers, sellers and industry experts to make better informed property decisions. It includes detailed analysis of the property, sales prices, rental prices, investment
REAL ESTATE SENTIMENT INDEX 1 st Quarter 2016
 About Real Estate Sentiment Index (RESI) The Real Estate Sentiment Index (RESI) is jointly developed by the Real Estate Developers Association of Singapore (REDAS) and the Department of Real Estate (DRE),
THE ANNUAL SPRING REAL
 The Great Housing Price Showdown Last January China s central government finally introduced measures strong enough to slow housing price increases. Speculators, developers, local governments and simple
Hong Kong Office MarketView
 Core Fringe Core Midtown Decentralised Core Fringe Core Kowloon East Decentralised Hong Kong Office MarketView Q2 2013 Global Research and Consulting OVERALL HONG KONG Rents +0.3% q-o-q CENTRAL Rents -0.2%
Qatar Real Estate Market Overview. Cityscape, March 2017
 Qatar Real Estate Market Overview Cityscape, March 217 Qatar Real Estate Market Overview Introduction Overview The fall in oil prices, which started in 214, started to have an impact the real estate market
THE REAL ESTATE GROUP
 The Manhattan Rental Market Report March 2008 Table of Contents Letter from Our Chief Operating Officer 3 A Quick Look 4 Mean Citywide Rental Prices 8 Citywide Price Trends 10 Neighborhood Price Trends
Profile of International Home Buyers in Florida
 Profile of International Home Buyers in Florida Research Division National Association of REALTORS 2009 Prepared for the Florida Association of REALTORS 2009 National Association of REALTORS Profile of
HONG KONG Luxury Residential Monthly Report
 RESEARCH AUGUST 2011 HONG KONG Luxury Residential Monthly Report PRICES STABLE DESPITE MARKET UNREST Sentiment in the local residential sales market remained lukewarm in July. Government measures to cool
September bounce in house price sentiment
 Knight Frank/Markit House Price Sentiment Index (HPSI) SEPTEMBER 2012 September bounce in house price sentiment Key headlines for September UK households perceive that the value of their home declined
Property Barometer Q2 2012
 Property Barometer Q2 2012 Measuring the Property Market Analysis by Annette Hughes, DKM Economic Consultants Contents 3 Introduction + Highlights 4 Market analysis 8 County by County Analysis: Market
BONDREPORT QTR BONDREPORT QTR BONDNEWYORK.COM
 BONDREPORT QTR 4 2017 WELCOME TO THE 19 TH EDITION OF THE BOND REPORT It has been quite the year on many fronts, and by all indications, 2017 has no intention of going quietly. The market has continued
Bureau of Business Research Webinar Series October 2016
 Bureau of Business Research Webinar Series October 2016 Presented by Eric Thompson W.W. Marshall Associate Professor of Economics Director, Bureau of Business Research Outline Importance of Affordable
PROPERTY ANALYSIS REPORT - SUMMARY. #13-09, Pebble Bay, 132 Tanjong Rhu Road, (S)
") - SUMMARY This report is designed to help buyers, sellers and industry experts to make better informed property decisions. It includes detailed analysis of the property, sales prices, rental prices, investment
- SUMMARY This report is designed to help buyers, sellers and industry experts to make better informed property decisions. It includes detailed analysis of the property, sales prices, rental prices, investment
Rightmove House Price Index
 Rightmove House Price Index The largest monthly sample of residential property prices January 2018 London edition Asking prices down 1.4% in London this month as sellers tempt New Year buyers New-to-market
STABLE OCCUPANCY DESPITE RAMPED UP SUPPLY
 COLLIERS QUARTERLY RESIDENTIAL MANILA Q3 2018 20 NOVEMBER 2018 Joey Roi Bondoc Manager Research Philippines +(632) 858 9057 Joey.Bondoc@colliers.com STABLE OCCUPANCY DESPITE RAMPED UP SUPPLY Summary &
2013 Arizona Housing Market Mid-Year Report
 2013 Arizona Housing Market Mid-Year Report This mid-year market report outlines the latest trends in Arizona real estate. The housing market hit bottom in mid to late 2011, and has been in recovery mode
REAL ESTATE SENTIMENT INDEX 1 st Quarter 2014
 About Real Estate Sentiment Index (RESI) The Real Estate Sentiment Index (RESI) is jointly developed by the Real Estate Developers Association of Singapore (REDAS) and the Department of Real Estate (DRE),
AAug ugust 2017
 August 17 17 Housing recovery a balancing act Growth in new listings outpaced sales preventing inventory declines City of Calgary, September 1, 17 Sales posted a modest gain in August, but a rise in new
Property. Mashreq. Economic Overview. Wealth Gauge. Exceptional. Individual.
 Exceptional. Individual. Volume 14 October Economic Overview United Arab Emirates has continued to benefit its safe-heaven status. The economic recovery has been strong which is well supported by tourism,
ECONOMIC CURRENTS. Vol. 3, Issue 1. THE SOUTH FLORIDA ECONOMIC QUARTERLY Introduction
 ECONOMIC CURRENTS THE SOUTH FLORIDA ECONOMIC QUARTERLY Introduction Economic Currents provides an overview of the South Florida regional economy. The report contains current employment, economic and real
The Market Watch Monthly Housing Report. Coachella Valley Median Detached Home Price Dec Dec 2016
 The Market Watch Monthly Housing Report Median Price $450,000 Coachella Valley Median Detached Home Price Dec 2002 - Dec 2016 $400,000 $350,000 $300,000 $339,930 $340,000 $250,000 $200,000 $150,000 CV
Rightmove House Price Index
 Rightmove House Price Index The largest monthly sample of residential property prices February 2019 London edition Under embargo for 00.01 hours, Monday 18 th February 2019 London s new sellers test higher
Sector Report. Singapore Developers. 3 Oct 16, 8.15am/11.15am Morning Call/Webinar
 3 Oct 16, 8.15am/11.15am Morning Call/Webinar Sector Report Singapore Developers Disclaimer The information contained in this presentation has been obtained from public sources which Phillip Securities
Housing Bulletin Monthly Report
 December 21 1 Housing Bulletin Monthly Report Alberta Housing Starts Fall in November 21 Canada Housing Starts 25 2 15 1 5 8 NOV 8 DEC 8 Preliminary Housing Starts in Alberta* and Canada* November 28 to
LUXURY MARKET REPORT. - May
 LUXURY MARKET REPORT - May 2018 - www.luxuryhomeing.com THIS IS YOUR LUXURY MARKET REPORT MAP OF LUXURY RESIDENTIAL MARKETS Welcome to the Luxury Report, your guide to luxury real estate market data and
Real Estate Foresight
 Real Estate Foresight Special Commentary on Executive Condominiums OrangeTee Research & Consultancy Email: research@orangetee.com Website: www.orangetee.com On July 30, tenders for three executive condominium
September 2016 RESIDENTIAL MARKET REPORT
 September 2016 RESIDENTIAL MARKET REPORT The real estate investment market in Japan has had an abundance of capital (both domestic & foreign) over the past couple of years. This, along with the low (now
MARKET STRATEGY VIEWPOINT U.S. Housing Decelerating
 Jan-01 Oct-01 Jul-02 Apr-03 Jan-0 Oct-0 Jul-05 Apr-0 Jan-07 Oct-07 Jul-08 Apr-09 Jan-10 Oct-10 Jul-11 Apr-12 Jan-13 Oct-13 Jul-1 Apr-15 Jan-1 Oct-1 Jul-17 Apr-18 U.S. Housing Decelerating August 27, 2018
Property. Mashreq. Economic Overview. Wealth Gauge.
 FOR THE PRIVILEGED FEW Mashreq Volume 12 August 20 Economic Overview As per National Bureau of Statistics, the economic growth in UAE for 20 stands at 5.2 which was well supported by Trade & Tourism, Hospitality
Residential December 2009
 Residential December 2009 Karl L. Guntermann Fred E. Taylor Professor of Real Estate Adam Nowak Research Associate Year End Review The dramatic decline in Phoenix house prices caused by an unprecedented
Rightmove House Price Index
 Rightmove House Price Index The largest monthly sample of residential property prices January 2018 National edition Busy start to 2018 with increased home-hunter activity Early traffic data indicates a
Weak sales persist in Calgary and beyond Jun. 2018
 June 218 MONTHLY STATISTICS PACKAGE City of Calgary Weak sales persist in Calgary and beyond 218 City of Calgary, July 3, 218 Many Canadian energyrelated municipalities within Alberta and Saskatchewan
REAL ESTATE SENTIMENT INDEX 3 rd Quarter 2014
 About Real Estate Sentiment Index (RESI) The Real Estate Sentiment Index (RESI) is jointly developed by the Real Estate Developers Association of Singapore (REDAS) and the Department of Real Estate (DRE),
Volume II Edition I Why This is a Once in a Lifetime Opportunity for Investors
 www.arizonaforcanadians.com Volume II Edition I Why This is a Once in a Lifetime Opportunity for Investors In This Edition How to make great investment returns in a soft market U.S. Financing for Canadians
Metropolitan Tract Performance Report for the Quarter Ended September 30, 2009
 VII. STANDING COMMITTEES F 4 B. Finance, Audit and Facilities Committee Metropolitan Tract Performance Report for the Quarter Ended September 30, 2009 Attachment Metropolitan Tract performance Report for
PROPERTY INSIGHTS Q2 Snapshot
 PROPERTY INSIGHTS Singapore Quarter 2, 2017 2017 Q2 Snapshot Residential market bottoming out The residential land bids are heating up and more private developments are considering collective sales. Is
Summary. Houston. Dallas. The Take Away
 Page Summary The Take Away The first quarter of 2017 was marked by continued optimism through multiple Texas metros as job growth remained positive and any negatives associated with declining oil prices