Richland Hills Trinity Railway Express (TRE) Station
|
|
|
- Norah Moody
- 6 years ago
- Views:
Transcription


")


1 Richland Hills Trinity Railway Express (TRE) Station Transit Oriented Development Plan
2 Richland Hills Trinity Railway Express (TRE) Station Transit Oriented Development (TOD) Plan June 2009
3 ACKNOWLEDGEMENTS North Central Texas Council of Governments Karla Weaver, AICP, Senior Transportation Planner Alma Martinez, Transportation Planner Staron Faucher, Transportation Planner Natalie Bettger, Senior Program Manager Emily Beckham, Grants Coordinator City of Richland Hills City Administration Mayor David L. Ragan James W. Quin, City Manager Michael H. Barnes, P.E., Public Works Director Denice Thomas, Planning Director Matthew Shaffstall, Economic Development City of Richland Hills City Council Mayor Pro Tem Jeff Ritter, Council Place 1 Council Member Kenney Davis, Council Place 2 Council Member Phil Heinze, Council Place 3 Council Member Don Acker, Council Place 4 Council Member Larry Marrs, Council Place 5 City of Richland Hills Planning and Zoning Commission Cleve Milner, Commissioner Curtis Whitfield, Commissioner Martha Strain, Commissioner Doug Guinn, Commissioner Ronny Region, Commissioner Greg Klarich, 1 st Alternate Kellie Starnes, 2 nd Alternate Fort Worth Transportation Authority Curvie Hawkins, Director of Planning Ken Frost, Vice President, Project Management Consultant Team URS Transit and Urban Design Studio: Tim Baldwin, AICP, URS Corporation Mark Leese, AIA, AICP, URS Corporation Krista Kahle, AICP, URS Corporation Jennifer Hall, AICP, URS Corporation Jennifer McNeil, AICP, URS Corporation Shari Frank, AICP, URS Corporation Andrea Snyder, URS Corporation Lonnie Blaydes, Lonnie E. Blaydes Consulting Dennis Wilson, Townscape, Inc. Jim Richards, Townscape, Inc. Annie Melton, AICP, Bowman-Melton Associates, Inc. Bud Melton, Bowman-Melton Associates, Inc. Shelly Poticha, Reconnecting America Brian Duffany, Economic Planning Systems Matthew Prosser, Economic Planning Systems Cover & Example Photos: URS and Philip Poole
4 TABLE OF CONTENTS Report Organization Executive Summary Plan Goals and Objectives Market Analysis Redevelopment Strategy Redevelopment Scenarios Phasing Plan Developer s Workshop Infrastructure Costs Economic and Fiscal Impacts Financing Strategies Conclusion Station Context Study Background Purpose of the Plan Region Local History Existing Land Uses and Character Existing Zoning Demographic Trends and Projections Relevant Plans TOD Principles Station Area/Transit Oriented Development Design Principles National and Regional Examples Station Typologies Station Area Analysis Market Analysis Redevelopment Strategy Opportunities and Constraints Public Process and Stakeholder Issues TOD Master Plan Vision TOD Master Plan Principles TOD Plan Alternatives North Study Area South Study Area Associative Examples Implementation Phasing Plan Infrastructure Costs Economic and Fiscal Impacts Financing Strategies Zoning for TOD Infrastructures Issues Roles and Responsibilities
5 6.8. Overcoming Barriers to TOD Conclusion Appendices Appendix A: Commercial Building Inventory Appendix B: Catalog of Implementation Tools and Funding Sources
6 FIGURES Figure 1-1: North Study Area TOD Concept...9 Figure 1-2: South Study Area Concept Scenario 1: Incorporate Existing Buildings, as possible...10 Figure 1-3: South Study Area Concept Scenario 2: Blank Slate remove existing buildings and redevelop the entire site...11 Figure 1-4: South Scenario 1 Phasing Plan...12 Figure 1-5: South Scenario 2 Phasing Plan...12 Figure 1-6: North Development Area Plan...13 Figure 2-1: Dallas-Fort Worth Regional Map...21 Figure 2-2: Route 41 Monthly Ridership...22 Figure 2-3: Richland Hills TRE Ridership...22 Figure 2-4: Station Area Photos...24 Figure 2-5: TOD Planning Area Map...25 Figure 2-6: Station Context Aerial Photo...26 Figure 2-7: Existing Zoning...27 Figure 2-8: 2030 Metropolitan Transportation Plan...31 Figure 2-9: SH-121 Interchange and Trail Connections...32 Figure 2-10: Regional Linkages Map...34 Figure 2-11: Station Area Linkages Map...35 Figure 2-12: Richland Hills Trail System Master Plan Map...36 Figure 2-13: Highway and Railroad ROW Corridor Trail...37 Figure 3-1: Impact of Proximity to Park...40 Figure 3-2: Fireclay Land Use Concept...48 Figure 3-3: Fireclay District Plan...49 Figure 3-4: Fireclay Developer's Rendering...50 Figure 3-5: 60th Ave MAX Station Context...50 Figure 3-6: NE 60th Ave at Glisan St...51 Figure 3-7: Arrowood Station Site...52 Figure 3-8: Proposed Arrowood TOD Site Plan...53 Figure 3-9: Arrowood Area Land Use Plan...53 Figure 3-10: Cedars TIF District Boundary Map...54 Figure 3-11: Cedars Station Area Projects...54 Figure 3-12: Southside on Lamar...55 Figure 3-13: Cedars Station Area Aerial View...55 Figure 4-1: Residential Market Area...59 Figure 4-2: Area Apartment Projects...61 Figure 4-3: Grocery Store Inventory, 3-Mile Radius...67 Figure 4-4: Big Box Inventory, 3-Mile Radius...68 Figure 4-5: Opportunities and Constraints...71 Figure 5-1: North Study Area TOD Concept...79 Figure 5-2: Station Area, South Study Area Scenario Figure 5-3: TRE Station and New Development, looking west...81 Figure 5-4: Burns Street, South Study Area Scenario
7 Figure 5-5: McQuire Street/Midway Road, South Study Area Scenario Figure 5-6: South Study Area Concept Scenario 1: Incorporate Existing Buildings, as possible...84 Figure 5-7: Station Area, South Study Area Scenario Figure 5-8: Burns and Belton Streets, South Study Area Scenario Figure 5-9: TRE Station and new development, view from SH- 121 looking south and east...87 Figure 5-10: McQuire Street/Midway Road, South Study Area Scenario Figure 5-11: South Study Area Concept Scenario 2: Blank Slate remove existing buildings and redevelop the entire site...89 Figure 5-12: Residential Examples...90 Figure 5-13: Retail and Office Examples...91 Figure 5-14: Retail and Parking Examples...92 Figure 6-1: South Scenario 1 Phasing Plan...93 Figure 6-2: South Scenario 2 Phasing Plan...94 Figure 6-3: North Development Area Plan...94 Figure 6-4: Inverted U-Rack Example Figure 6-5: Bike Locker Example Figure 6-6: Covered Bike Parking Example Figure 6-7: Shared Lane Marking and R-4-11 Signage Figure 6-8: Floodplain Trail Example Figure 6-9: Rail Trail Example Figure 6-10: Utility Easement Trail Example
8 TABLES Table 1-1: South Scenario 1 Development Totals by Phase.12 Table 1-2: South Scenario 2 Development Totals by Phase.12 Table 1-3: North Development Totals by Phase...13 Table 1-4: South Study Area Infrastructure Estimate...14 Table 1-5: North Study Area Infrastructure Estimate...14 Table 1-6: Development Area Program Scenario Table 1-7: Development Area Program Scenario Table 1-8: North Development Parcels Program...16 Table 1-9: Total Potential Property Tax...16 Table 1-10: Potential Property Tax Comparison...17 Table 2-1: Northeast Tarrant County Population Trends, Table 2-2: Northeast Tarrant County Housing Trends, Table 2-3: Station Area Household Income and Tenure, Table 2-4: Head of Household Age Distribution, Table 2-5: Population and Employment Forecast, 2010 and Table 3-1: Station Typologies...56 Table 4-1: Residential Sales by Type, Table 4-2: Profile of Selected Area Apartments, Units and Size...60 Table 4-3: Profile of Selected Area Apartments, Rent per Square Feet...61 Table 4-4: Metroplex Office Submarkets Inventory (Sq. Ft.), Table 4-5: 3-Mile Trade Area Total Personal Income, Table 4-6: 3-Mile Trade Area Resident Expenditure Potential, Table 4-7: 3-Mile Trade Area Retail Demand, Table 6-1: South Scenario 1 Development Totals by Phase.93 Table 6-2: South Scenario 2 Development Totals by Phase.94 Table 6-3: North Development Totals by Phase...94 Table 6-4: South Study Area Infrastructure Estimate...95 Table 6-5: North Study Area Infrastructure Estimate...95 Table 6-6: Richland Hills Market Assumptions...96 Table 6-7: Development Area Program Scenario Table 6-8: Development Area Program Scenario Table 6-9: North Development Parcels Program...99 Table 6-10: Total Potential Property Tax...99 Table 6-11: Potential Property Tax Comparison Table 6-12: Roles and Responsibilities of TOD Participants110 Table 6-13: Barriers to Transit Oriented Development
9 Report Organization The Richland Hills Trinity Railway Express (TRE) Station Transit Oriented Development (TOD) Plan includes the following sections. SECTION 1. Executive Summary The Executive Summary provides an overview of the entire TOD study, including the plan goals and objectives, market analysis, redevelopment strategy, and implementation considerations. SECTION 2. Station Context The Station Context is a summary of the study background, history of the area, and its various physical, economic, and demographic attributes, and their relationship to the plan. SECTION 3. TOD Principles The TOD Principles include characteristics of successful TOD, national and regional station area development examples, and station typologies. SECTION 4. Station Analysis The Station Analysis includes a market analysis, redevelopment strategy, summary of opportunities and constraints, description of the public process and stakeholder issues, and the TOD master plan vision and principles. SECTION 5. TOD Plan Alternatives Three TOD Alternatives are illustrated and described with plan and perspective drawings and photographs of associative examples of types of development. SECTION 6. Implementation The Implementation section includes a phasing plan; infrastructure considerations; economic and fiscal impacts; financial strategies; zoning for TOD; identification of roles and responsibilities; suggestions for overcoming barriers to TOD; and conclusion. SECTION 7. Appendices The Appendices include a detailed commercial building inventory and a catalog of implementation tools and funding sources. 6
10 1. Executive Summary The Richland Hills Trinity Railway Express (TRE) Station is a major regional transportation hub for buses, trains, and automobiles. It serves an important role in the NCTCOG s transportation strategy to reduce automobile trips in the region. While the station serves this function efficiently, it falls short of realizing its potential as a catalyst for community building. For it to become a more complete asset to the surrounding community, it requires not just a few improvements, but a more complete transformation into a mixed use town center that includes retail, offices, and residential dwelling units. The following report describes a vision for the Richland Hills TRE transit station area in which residents of nearby townhomes and apartments can take their daily walk to the station, on the way stopping to drop off their dry-cleaning, fill a prescription, enjoy a cup of coffee, and read the morning paper. At the end of the day they can pick up a few groceries at the corner drugstore and take a bicycle ride on one of the connections to the Trinity Greenbelt and Veloweb regional trail system. The Richland Hills Trinity Railway Express (TRE) Station Transit-Oriented Development (TOD) Plan identifies opportunities for sustainable redevelopment of the industrial park surrounding the Richland Hills Trinity Railway Express (TRE) station area. The station area vision supports the evolution of the area toward a special district with high-end business and residential tenants. The Richland Hills TRE station development will serve the surrounding neighborhoods as well. Currently, local residents must drive to SH-121 and Precinct Line to find many of the amenities that the station area could provide. In the future, many of those car trips will be replaced by shorter walking or bicycling trips to the Richland Hills station. The transit oriented development described in this report would add value to the southwest Richland Hills neighborhoods by transforming what used to be a utilitarian necessity into a true community asset. The Plan is predicated on several long range planning assumptions such as a growing market for infill development close to transit, and a willingness on the part of the City to become an active partner in the redevelopment. The Plan focuses on the economic feasibility of development scenarios as defined by a public involvement process that generated specific goals and objectives for the site, including sustainability and livability. The Plan provides a vision and goals for the area over the next 20 years. The hope is that the entire industrial park eventually redevelops into a special district containing a mix of uses Plan Goals and Objectives The Plan s overall purpose is to create a compelling redevelopment vision for the site that includes a viable and sustainable mixed-use community. Within that purpose, the goals and objectives of the Plan include: Create a sustainable community, a mixed use neighborhood with a sense of place Create gateways at key locations Create a network of civic open spaces, parks, and plazas Realign Burns to Trinity intersection Add cross streets for improved connectivity Renovate streets as complete streets Improve connectivity at the perimeter of and within the study area Include a mix of land uses 7
11 1.2. Market Analysis Retail The station area is not a competitive location for any substantial amount of retail development. The maximum amount of retail space that could be expected in the station area would be approximately 30,000 square feet. This would be ground floor mixed use space that could be configured to accommodate a variety of retail, service commercial, and small office uses. It should be a gateway feature, close to the station platform and parking to maximize visibility and pedestrian access. If combined with a small amount of office space, total ground floor mixed use space should be no more than approximately 40,000 square feet. Residential The market analysis did not reveal any obvious trends indicating demand or market support for higher density housing in the station area in the short term (next 5 years). While the access to transit is an amenity for this site, it is not currently enough of an amenity to overcome the local market conditions which do not strongly favor mixed use or medium to high density residential development. Residential development is therefore a long term (10+ year) development opportunity. In the future, some portion of higher density for-sale housing such as townhomes or flats could be included in the project. The highest densities, potentially 40 to 60 units per acre, should be concentrated near the station platform within the ¼ mile walking distance. This achieves two purposes: it concentrates potential transit riders close to the platform, and it increases land values and overall revenues which will be needed to fund additional costs such as structured parking and demolition. Residential densities could taper to the periphery of the study area, and take advantage of planned trail and open space connections. Office The most likely office development opportunities in the Richland Hills station area include a small amount of office space, approximately 10,000 to 20,000 square feet, as part of a larger mixed use project. This space could be flexible to accommodate retail, service, or office users. It is also possible that a single office user desiring a location with direct transit access could be accommodated in the station area Redevelopment Strategy Incentives Extensive land assembly will be needed in order to create functional development parcels. Incentives and financing tools such as tax increment financing, special improvement districts, and public-private partnerships or joint development will likely be needed to catalyze redevelopment. As funds become available, the City could consider purchasing properties adjacent to the station platform. The City could provide low cost land to a developer with repayment (a portion or full) tied to a development agreement or the sale of residential units. Lowering the cost of land assembly reduces some of the risk for a potential developer. Haltom City and North Richland Hills are being proactive in acquiring land in potential TOD locations. Placemaking In order to overcome the influence of the surrounding land use context, a large enough project must be created to project its own identity and establish the location as a place. The redevelopment and TOD planning efforts should address the entire planning area. In addition to concentrating density near the station platform, the redevelopment efforts should address other placemaking elements such as neighborhood parks, 8
12 plazas, streetscaping and landscaping, and trail and open space connections. Strategic Opportunities Tremendous regional access along SH-121 and Loop 820. Direct access to regional transit and major employment centers in downtown Fort Worth, downtown Dallas, and points between the two. The chance to take advantage of relatively inexpensive land values and a low-cost housing market to promote infill residential and supportive development around the station. For people who would live in this area and work in downtown Fort Worth, the study area is the last large redevelopment site inside Loop 820, before the traffic congestion begins. The future widening of SH-121 and the interchange at Handley-Ederville presents an opportunity to turn this underpass into a pedestrian gateway that better connects the areas north and south of the interchange. The proposed Veloweb is an opportunity to provide regional bicycle access to the study area and to enhance its desirability as a place in which to live. The open space to the southwest of the study area is a potential amenity for future development on the site. Even though the transmission line ROW is an obstacle to development, it also is an opportunity to provide open space internal to the site and a buffer between highway-oriented uses and residential uses to the west. The visibility of the site from SH-121 is an opportunity to advertise the site and its redevelopment. Parking demand from the TRE patrons, both current and future, will require creative thinking in developing new public and private parking facilities. Joint development opportunities should be explored Redevelopment Scenarios North Study Area This plan highlights commercial infill opportunities in the northern portion of the TOD study area: two parcels behind the McDonald s restaurant at the northeast corner of Handley- Ederville Road and SH-121, and two parcels on the west side of Handley-Edervillle Road. Additionally, possible commercial redevelopment is shown along Baker Boulevard on the site of the former Sam s Club store and other nearby parcels. The floodplain west of the shopping center redevelopment provides a long-term north-south trail opportunity. A mid-block utility easement north of Tower Street provides a possible future east-west trail link to the powerline easement west of Handley Ederville Road. Figure 1-1: North Study Area TOD Concept 9
13 South Scenario 1 Incorporate existing buildings, as possible This scheme focuses on redevelopment and reuse of existing buildings now used for warehousing and distribution. In this scenario, it is strongly recommended that developers consider ways in which existing structures can be integrated into the architecture of new development so that the juxtaposition of the old and new can create unexpected residential, commercial and live/work opportunities. The reuse of the warehouses represents an opportunity to develop a funky ambience in the midst of a post World War II suburban landscape that could set Richland Hills apart in the metroplex as a unique and viable destination. Figure 1-2: South Study Area Concept Scenario 1: Incorporate Existing Buildings, as possible Scenario 1 has six principal parts. From east to west, they include: Retail mixed use along the Handley-Ederville Road frontage; Transmission line/open space/trail corridor; Small pocket parks and neighborhood open spaces; Upgrades to the existing street grid with many existing warehouses retained for live/work uses and parking, and new infill townhouses constructed to fill gaps in the street wall; New narrow mews, or skinny street, in the abandoned railroad ROW spur between Burns and Belton Streets; and Clusters of new townhouses at the west end of the redevelopment area and along McQuire Street/Midway Road. South Scenario 2 Remove existing buildings and redevelop the entire site This scheme assumes more of a blank slate approach to redevelopment, with the removal of most existing buildings and a larger number of modifications to the street grid. This approach provides additional control and predictability for the developer(s), yet runs the risk of the redevelopment being overly uniform and less innovative. Scenario 2 has six principal parts. From east to west, they include: Retail mixed use along the Handley-Ederville Road frontage; Transmission line/open space/trail corridor; Large neighborhood park; Wide boulevards with recreational medians on Burns and Belton Streets, with a new skinny street running along the abandoned railroad ROW between them; 10
14 New street grid with blocks of residential development punctuated by neighborhood retail opportunities at building entrances (located at the termini of a series of north-south streets that connect the north tier of blocks back to McQuire Street/Midway Road); and Townhouses at the west end of the redevelopment area arranged around a central open space, and a neighborhood park. Figure 1-3: South Study Area Concept Scenario 2: Blank Slate remove existing buildings and redevelop the entire site 1.5. Phasing Plan Both scenarios for the redevelopment of the south portion of the TOD study area can be built out in a similar phased approach. Initial development (5-10 years) would occur in the immediate vicinity of the station, along Handley-Ederville Road near the SH-121 interchange and the realigned portion of Burns Street. Mid-term development (10-15 years) would spread to the south, along Handley-Ederville Road to McQuire Street/Midway Road and on both sides of Belton Street. Long-term development (15-20 years) would spread west, between SH-121 and McQuire Street/Midway Road to the Big Fossil Creek corridor. The two scenarios differ in terms of possible residential product types depicted and the intensity of commercial and retail development. Scenario 1 includes more 2-story townhouses and live/work units, which are often well-suited for ownership housing. In contrast, Scenario 2 depicts a greater number of flats and 2-story courtyard residential buildings, which are often an attractive configuration for rental housing. Scenario 2 also shows a greater intensity of commercial and retail development along Handley-Ederville Road, with three 2- story buildings wrapping parking structures. The following diagrams and tables illustrate the phasing sequences and provide estimated development totals for each scenario. 11
15 Figure 1-4: South Scenario 1 Phasing Plan Figure 1-5: South Scenario 2 Phasing Plan Table 1-1: South Scenario 1 Development Totals by Phase Scenario 1 Phase 1 Phase 2 Phase 3 Total # Units or # Units or # Units or # Units or Product Type Sq. Ft. Sq. Ft. Sq. Ft. Sq. Ft. Table 1-2: South Scenario 2 Development Totals by Phase Scenario 2 Phase 1 Phase 2 Phase 3 Total # Units or # Units or # Units or # Units or Product Type Sq. Ft. Sq. Ft. Sq. Ft. Sq. Ft. Residential Townhomes Condo (Live/work, Reuse Res) Flats (Rental) Subtotal Commercial Retail 99,000 55,000 13, ,600 Office 83, , ,440 Subtotal 182,000 55,000 39, ,040 Residential Townhomes Condo (Live/work) Flats and Courtyard Res (Rental) Subtotal Commercial Retail 70, ,000 36, ,000 Office 70, ,000 24, ,000 Subtotal 140, ,000 60, ,000 12
16 Figure 1-6: North Development Area Plan 1.6. Developer s Workshop Following the third and final public meeting, a developer s workshop was held to preview the two scenarios to a number of local developers and designers who specialize in TOD development to provide a 'peer review' of the ideas and concepts presented in the draft TOD report. In general, the designers and planners preferred Scenario 1 while the developers preferred Scenario 2. The designers and planners liked that in Scenario 1, the reuse of the warehouses represents opportunities to develop a funky ambience that could set the redevelopment apart as a unique and viable destination while the developers saw problems with the existing configuration of buildings. In Scenario 2, the developers saw an opportunity to establish an image and identity for the project that is strong enough to overcome the site s present image and other disadvantages. Table 1-3: North Development Totals by Phase North Development Area Product Type # Rooms Product Type Sq. Ft. Lodging Commercial Hotel 180 Retail 135,000 Commercial/Office Infill 50,000 Subtotal (# rooms) 180 Subtotal (sq. ft.) 185,000 13
17 1.7. Infrastructure Costs Order-of-magnitude estimates of infrastructure development costs were developed. It is expected that these concept-level estimates will be refined as the TOD plans are carried forward. The south study area cost estimate is based on Scenario 1; costs for Scenario 2 are assumed to be similar. Table 1-5: North Study Area Infrastructure Estimate North Study Area Length (ft) Cost/ lin.ft. Cost Wesley Way realignment at Baker/Labadie 700 $800 $560,000 Total $560,000 Table 1-4: South Study Area Infrastructure Estimate Length South Study Area (ft) Cost/ lin.ft. Cost 1.8. Economic and Fiscal Impacts Phase 1 Burns St realignment west of Handley-Ederville 700 $800 $560,000 Burns St upgrade west of realignment portion 1100 $400 $440,000 Belton St upgrade 500 $500 $250,000 RR ROW street upgrade 650 $300 $195,000 New Street connecting Burns & Belton 700 $600 $420,000 Subtotal $1,865,000 Phase 2 Belton St upgrade 1500 $400 $600,000 RR ROW street upgrade (Mews) 1200 $300 $360,000 New Street connecting RR ROW & Belton 340 $600 $204,000 New Street Connecting Belton & Midway 800 $600 $480,000 Subtotal $1,644,000 South Area Development Scenarios 1 and 2 for the TOD study area south of the TRE station are three-phased programs. Scenario 1 shows a total build-out of 626 residential units, 167,600 square feet of retail space, and 108,440 square feet of office space. The estimated market value of this scenario is $133 million, as shown in Table 1-6. Scenario 2 shows a total build-out of approximately 608 residential units, 241,000 square feet of retail space, and 229,000 square feet of office space. The estimated market value of this scenario is $134 million, as shown in Table 1-7. Phase 3 Burns upgrade 1600 $400 $640,000 RR ROW street upgrade (Mews) 850 $300 $255,000 New Street connecting Burns & RR ROW 300 $700 $210,000 Subtotal $1,105,000 Total $4,614,000 14
18 Table 1-6: Development Area Program Scenario 1 Table 1-7: Development Area Program Scenario 2 Product Type # Units or Sq. Ft. Value per Unit Total Market Value Product Type # Units/ Sq. Ft. Value per Unit Total Market Value Phase 1 Residential Townhomes 69 $175,000 $12,075,000 Condo (Live/work, Reuse Res) 55 $150,000 $8,250,000 Flats (Rental) 0 $103,000 $0 Subtotal 124 $20,325,000 Commercial Retail 99,000 $125 $12,375,000 Office 83,000 $150 $12,450,000 Subtotal 182,000 $24,825,000 Total Phase 1 $45,150,000 Phase 2 Residential Townhomes 123 $175,000 $21,525,000 Condo (Live/work, Reuse Res) 27 $150,000 $4,050,000 Flats (Rental) 0 $103,000 $0 Subtotal 150 $25,575,000 Commercial Retail 55,000 $125 $6,875,000 Office 0 $150 $0 Subtotal 55,000 $6,875,000 Total Phase 2 $32,450,000 Phase 1 Residential Townhomes 0 $175,000 $0 Condo (Live/work, Reuse Res) 38 $150,000 $5,700,000 Flats and Courtyard Res (Rental) 94 $103,000 $9,682,000 Subtotal 132 $15,382,000 Commercial Retail 70,000 $125 $8,750,000 Office 70,000 $150 $10,500,000 Subtotal 140,000 $19,250,000 Total Phase 1 $34,632,000 Phase 2 Residential Townhomes 0 $175,000 $0 Condo (Live/work, Reuse Res) 0 $150,000 $0 Flats and Courtyard Res (Rental) 188 $103,000 $19,364,000 Subtotal 188 $19,364,000 Commercial Retail 135,000 $125 $16,875,000 Office 135,000 $150 $20,250,000 Subtotal 270,000 $37,125,000 Total Phase 2 $56,489,000 Phase 3 Residential Townhomes 120 $175,000 $21,000,000 Condo (Live/work, Reuse Res) 102 $150,000 $15,300,000 Flats (Rental) 130 $103,000 $13,390,000 Subtotal 352 $49,690,000 Commercial Retail 13,600 $125 $1,700,000 Office 25,440 $150 $3,816,000 Subtotal 39,040 $5,516,000 Total Phase 3 $55,206,000 Phase 3 Residential Townhomes 35 $175,000 $6,125,000 Condo (Live/work, Reuse Res) 61 $150,000 $9,150,000 Flats and Courtyard Res (Rental) 192 $103,000 $19,776,000 Subtotal 288 $35,051,000 Commercial Retail 36,000 $125 $4,500,000 Office 24,000 $150 $3,600,000 Subtotal 60,000 $8,100,000 Total Phase 3 $43,151,000 Scenario 1 - Total Value $132,806,000 Source: URS; Economic & Planning Systems Scenario 2 - Total Value $134,272,000 Source: URS; Economic & Planning Systems 15
19 North Area Development The study area north of the TRE station is a smaller infill or redevelopment area separated from the core station area. The development program for this area is therefore less than what can be supported in the core station area. The proposed north area development program includes 135,000 square feet of retail space, a 180-room limited service hotel, and several small commercial infill buildings totaling 50,000 square feet. The public financing possibilities and needs are less for the north study area because of the smaller market value of $60 million and fewer infrastructure needs. Table 1-8: North Development Parcels Program Product Type # Units/ Sq. Ft. Value per Unit Market Value Table 1-9: Total Potential Property Tax Potential Scenario Market Value Tax Rate 1 Property Tax (per year) Scenario 1 Phase 1 $45,150, $207,329 Phase 2 $32,450, $149,010 Phase 3 $55,206, $253,506 Total Potential Property Tax $132,806,000 $609,845 Scenario 2 Phase 1 $34,632, $159,030 Phase 2 $56,489, $259,397 Phase 3 $43,151, $198,149 Total Potential Property Tax $134,272,000 $616,577 North Development Area Retail 135,000 $125 $16,875,000 Commercial Infill 50,000 $125 $6,250,000 Hotel 180 $203,000 $36,540,000 Total $59,665,000 North Development Area Retail 2 $16,875, $77,490 Commercial Infill $6,250, $28,700 Hotel $36,540, $167,792 Total Potential Property Tax $59,665,000 $273,982 Source: URS; Economic & Planning Systems Planning Area Property Tax Estimates For planning purposes, the potential total annual property tax generated by each development scenario for the south area is approximately $600,000. The development plan for the north parcels generates approximately $275,000 of property tax per year at build-out. 1 Property Tax Rate for the City of Richland Hills Source: Economic & Planning Systems Public Financing Options For the parcels in the southern planning area, the yearly property tax generated in 2008 was approximately $70,000. The difference between the base property tax and the estimated revenues at build-out is approximately $550,000 in property tax increment. $550,000 per year in revenue would support $4 to $5 million in bond proceeds. Tax increment revenues could also be used to reimburse a developer for public improvements eligible for public financing. 16
20 Table 1-10: Potential Property Tax Comparison Potential Scenario Market Value Tax Rate 1 Property Tax (per year) Scenario 1 Existing Conditions $14,847, $68,178 Plan Buildout $132,806, $609,845 Difference (Proposed - Current) $541,667 Scenario 2 Existing Conditions $14,847, $68,178 Plan Buildout $134,272, $616,577 Difference (Proposed - Current) $548,399 1 Property Tax Rate for the City of Richland Hills Source: City of Richland Hills; Economic & Planning Systems 1.9. Financing Strategies The most promising implementation mechanisms for TOD at the Richland Hills TRE station are: Public Improvement District (PID) or Municipal Management District (MMD), Tax Increment Financing (TIF) and Tax Increment Reinvestment Zone (TIRZ), the NCTCOG Brownfields Revolving Loan Fund, and the NCTCOG Sustainable Development Funding Program, explained in more detail below: Public Improvement District (PID) A PID may levy and collect special assessments on property within the city. A PID may be formed to perform a wide variety of public improvements. improvements that are located inside and outside the district. Tax Increment Financing (TIF) and Tax Increment Reinvestment Zone (TIRZ) Under a TIF, the property owner pays taxes on the full value of the property and the taxing entities pay into the TIF Fund the taxes attributed to the added value of the property due to the new development. TIF Bonds may be issued for a maximum of 20 years and may be used to pay for public improvements associated with a development including but not limited to parking, infrastructure, land acquisition, and utilities. NCTCOG Brownfields Revolving Loan Fund The NCTCOG Brownfields Revolving Loan Fund provides loans to local governments to clean up sites that would serve as potential transit-oriented developments. NCTCOG Sustainable Development Funding Program The NCTCOG Sustainable Development Funding Program provides grants to local governments for construction projects that will reduce auto emissions and support sustainable communities. Eligible projects include construction projects that provide public infrastructure in the public right-of-way and can be used to support private vertical development, such as pedestrian amenities, landscaping, intersection improvements, lighting, street construction, traffic signalization, etc., and planning projects such as market, housing, and economic analyses, transit station planning, Transit Oriented Development (TOD) Planning (subdivision regulations, creation of new code/zoning regulations, master planning, updates to pedestrian and/or bicycle plans, etc.), among others. Municipal Management District (MMD) An MMD allows commercial property owners to enhance a defined business area. The district has the power to levy an ad valorem property tax for wastewater, drainage, road, or mass transit 17
21 1.10. Conclusion While the long-term outlook for the redevelopment of the site is strong, in the short term, the site would have difficulty overcoming certain constraints, including: Existing zoning and existing land uses (heavy industrial) will make it difficult to market new uses to potential developers without significant incentives from the City. The existing industrial buildings don t have ideal configurations, clearances or character to consider for adaptive reuse. The best course may be to remove them and begin with a clean slate. Major property owner(s) may or may not be interested in selling off all or part of the property in the near future. The retail trade area initially will not support significant new retail development other than transit-complementary retail uses (coffee, dry cleaning, day care). The physical barriers of SH-121 to the north, the city limits of Fort Worth to the east, and the floodplain/landfill to the west, limit the extent of development and continuity to other parts of the region including the residential areas to the immediate north. Large existing commercial, retail, and hotel development in the vicinity of North East Mall will limit the potential for significant new retail in the station area. Some of these barriers will disappear over time. And others may be mitigated by the development strategy. However, the participants that attended the developer s workshop noted that: The future of this node is phenomenal over the long term (25 years or more). Richland Hills is midway between Downtown Fort Worth and CentrePort/DFW Airport, so it is well located in relation to major regional activity centers. (Currently 2/3 of the ridership is going to Dallas.) The station is the last major exit before east-bound traffic hits the congestion at the I-820/SH-121 interchange. There is a great long term opportunity for mixed use once transit service is frequent enough or tied into a wellconnected network of regional transit to induce development pressure. Office development will be a strong local market as the area grows. Residential development is important for long-term sustainability. But will not likely be a major initial driver for development. For long term sustainability, residential land use is essential. It creates a built in market for transit ridership, and for retail and office uses. However, the market analysis suggests that residential development is a long term (10+ years) opportunity. In the meantime, the City should work to position the site for future redevelopment by: Encouraging TRE express service to stop at the station. Encouraging the completion of the The Oncor Trail, part of NCTCOG s regional Veloweb, and the Fossil Creek Trail under SH 121. These are important assets that help to mitigate the physical isolation of the site. Development is an issue of timing. In the long term there will be a mixed use market. In the interim the City and land owners should explore employment intensive uses including light manufacturing, green technology manufacturing, educational and/or health facilities, small business incubation and training 18
22 activities that will attract larger numbers of people to the site, then start to introduce mixed use elements such as retail, office and housing. The City may want to consider moving city hall and other civic uses here to give the city an identity off a major regional highway and to provide a major civic focus for the area. It is important that the Richland Hills station and associated development (and all stations along the TRE line) are unique and that stations do not compete for the same market. Once the threshold at which residential development is feasible is reached, and the site undergoes major changes, visibility from Hwy 121 and Loop 820 will shorten the time that it takes to change public perceptions about the site. It will quickly develop momentum. Ultimately, the redevelopment of the site will undoubtedly be a blend of the two scenarios. While the majority of the existing warehouse buildings are demolished in order for the developer to establish the project s identity and to establish the location in the public s mind, certain patterns and remnants of the existing architecture will be retained to contribute to the character and sense of place of the development. Financing strategies should be diverse and extensive to adapt to dynamic development options and financing mechanisms. To accomplish the redevelopment of the site, Richland Hills should create an Urban Redevelopment Authority (URA) and borrow against future property and sales tax revenues in the designated and Tax Increment Reinvestment Zone to help provide financing for redevelopment projects. At the appropriate time, the City should consider applying for NCTCOG Brownfields Revolving Loan funds, and NCTCOG Sustainable Development Fund grant funds. Finally, the developer should be encouraged to establish a Public Improvement District to provide for the ongoing maintenance and operations of streetscape elements and other pedestrian amenities. There should also be a mechanism to provide for the management and marketing of the district. 19
23 2. Station Context 2.1. Study Background This plan identifies opportunities for sustainable redevelopment of the industrial park surrounding the Richland Hills Trinity Railway Express (TRE) station area. The station area vision is to support the evolution of a special district with high-end business and residential tenants. Planning for the Richland Hills station area began in the spring of 2004, when students from the School of Urban and Public Affairs at the University of Texas at Arlington developed concepts for the redevelopment of the station area. The plan generated interest in redeveloping the area with emphasis on retail, as a means to increase revenues for the city. In 2005 the North Central Texas Council of Governments (NCTCOG) issued a call for projects for its grant program designed to encourage sustainable development around mixed-use developments and transit stations in the region. In 2006, the City of Richland Hills applied for and received a Sustainable Development Grant from NCTCOG. In the spring of 2008, the consultant team was hired and worked from the fall of 2008 to early 2009 to prepare this plan. The plan includes the identification of short- and long-term strategies that can be implemented in Richland Hills to achieve sustainable development in and around the Richland Hills Trinity Railway Express (TRE) station. The City wishes to comprehensively plan sustainable development in the corridor leading to the TRE station, especially the Handley-Ederville Road corridor and the intersection of SH-121 and Handley-Ederville Road Purpose of the Plan The development concepts contained in the Richland Hills Trinity Railway Express (TRE) Station Transit-Oriented Development Plan are general in nature and provide an overall framework to create a distinctive and sustainable development within the study area. The plan is intended to give the latitude needed to pursue unforeseen opportunities that will certainly arise and to respond to new challenges. The plan also gives enough direction to guide day-to-day decision-making related to land use decisions, public investments, and development opportunities. The Plan focuses on the economic feasibility of development scenarios as defined by the public involvement process. The public involvement process generated specific goals and objectives for the site that include sustainability and livability. The Plan provides a vision and goals for the area over the next 20 years. The hope is that the entire industrial park eventually redevelops into a special district containing a mix of uses. The Plan supplements and is subject to existing regulatory controls, including zoning and development standards adopted by the City of Richland Hills. It addresses issues and provides guidance that is more refined and specific than can be done at a citywide level. The City may choose to adopt the Plan as an official planning document, as a supplement to the City s Comprehensive Plan, or incorporate various components and recommendations into the existing Comprehensive Plan. 20
24 2.3. Region The city of Richland Hills, encompassing approximately 3.9 square miles in Northeast Tarrant County, borders the northeast corner of Fort Worth. It is approximately 15 miles from the Dallas/Fort Worth International Airport, approximately eight miles from downtown Fort Worth, and less than 30 miles from downtown Dallas. The city fronts State Highway 183, State Highway 121, and State Highway 26. Easy access is provided to each via Interstate 820. The Trinity Railway Express (TRE), a commuter rail service jointly operated by Dallas Area Rapid Transit (DART) and the Fort Worth Transportation Authority (FWTA), connects Richland Hills to downtown Fort Worth and Dallas. The western terminus of the TRE is the Texas & Pacific (T&P) Station in downtown Fort Worth. The line proceeds east to the Fort Worth Intermodal Transportation Center, Richland Hills, Hurst/Bell, CentrePort/DFW Airport, West Irving, South Irving, Medical/Market Center, Victory Station/American Airlines Center, and Dallas Union Station. Figure 2-1: Dallas-Fort Worth Regional Map 21
25 The Richland Hills TRE station opened in 2000 and is adjacent to the confluence of Loop 820 and SH-121. There are 364 surface parking spaces at the station and approximately 705 commuter rail boardings each weekday. 1 The North Central Texas Council of Governments (NCTCOG) projects the Richland Hills TRE Station to be the second busiest stop on the line between Fort Worth and Irving. The TRE offers approximately hourly service (40-minute peak, up to 110- minute off-peak), six days a week. Travel times from Richland Hills are 16 minutes to downtown Fort Worth, 17 minutes to CentrePort/DFW Airport, and 49 minutes to Dallas Union Station (Figure 2-1). The station is also served by two bus routes. Route 40, a crosstown route, connects areas south of the station, including Riverbend Business Park, and terminates at Woodhaven Shopping Center. Route 41 provides local Rider Request bus service throughout Richland Hills. The Route 41 monthly bus ridership numbers increased an average of 6 percent during the first seven months of the 2009 fiscal year (October 2008 through April 2009), averaging about 3,340 boardings per month (Figure 2-2). Route 41 gets a strong percentage of its ridership from school related trips; therefore, ridership is normally lower during the non-school summer months. TRE commuter rail ridership was also up over the same period by an average of 7 percent. Average monthly commuter rail ridership at the Richland Hills TRE Station was around 15,780 for the first seven months of the 2009 fiscal year, an average monthly increase of more than 1,100 passengers compared to 2008 (Figure 2-3). 2 4,500 4,000 3,500 3,000 2,500 2,000 1,500 1, October November December January February March April May June July August Sept FY2005 FY2006 FY2007 FY2008 FY ,000 20,000 15,000 10,000 5,000 0 Figure 2-2: Route 41 Monthly Ridership October November December January February March April May June FY2005 FY2006 FY2007 FY2008 FY2009 July August September Figure 2-3: Richland Hills TRE Ridership 1 TRE average weekday boardings, TRE commuter rail and Route 41 data, October 2007 to September
26 2.4. Local History TRE began service between Dallas and South Irving in December The initial 10-mile rail line was expanded to 34 miles, eventually reaching the two downtown Fort Worth stations in December Today, the TRE operates almost 50 trains each weekday. A similar service was offered by the second-oldest interurban commuter rail line in Texas, the Northern Texas Traction Company, when it began traveling between Fort Worth and Dallas in This interurban line followed a more southerly route, compared to today's Trinity Railway Express (TRE). The line's power generating plant and workshops were located just east of Fort Worth in the town of Handley (between downtown Fort Worth and Arlington along SH-180, later annexed into the city of Fort Worth). By 1913 elegant interurban electric cars traveled the 35-mile route at speeds up to 70 mph and visitors flocked to an amusement park called Lake Erie (later absorbed by the northern part of Lake Arlington). However, the rise of the automobile and the beginning of the Depression led to a decline in passenger rail traffic; service on this interurban line ended in Richland Hills, located approximately five miles north of Handley, was born during the unprecedented period of suburban expansion following the Second World War. The City of Richland Hills was incorporated in It absorbed the neighboring town of Richland Park in 1953 and expanded to its current boundaries by the late 1950s. By the early 1980s local governments began strategizing for the reintroduction of interurban rail service. An objective of the 1983 Richland Hills Comprehensive Plan is to Encourage the development of passenger rail service between Fort Worth and Dallas with a passenger station in Richland Hills. 3 The discontinuation of freight rail service on the Chicago, Rock 3 City of Richland Hills Comprehensive Plan, 1983, p. II-4. Island and Gulf Railroad, which ran through the industrial portions of Richland Hills, made it a good candidate for what later became the interurban TRE commuter rail route Existing Land Uses and Character Richland Hills is home to roughly 8,100 residents residing primarily in neighborhoods with large single-family lots. Much of the housing stock dates to the 1950s and 1960s. Now midway through a generational home ownership change, renewal, renovation, and rebuilding are top priorities for the City and residents. The TOD study area includes two blocks of single-family housing west of Handley-Ederville Road. This residential enclave is separated from other nearby homes by the 200-foot wide power line right-of-way. Previous City plans have explored commercial redevelopment possibilities for all or portions of this residential area. However, the multiple property owners and the narrow lot depth are significant obstacles to any market-driven commercial redevelopment efforts. It is likely that the area will remain residential for the foreseeable future. Most of Richland Hills' 320 businesses are small commercial and industrial enterprises. Many businesses are located within the TOD study area in Midway Business Park and Richland Industrial Park, two of the top twenty largest industrial parks in Tarrant County. Richland Industrial Park, surrounding the TRE station south of SH-121, is generally characterized by larger warehouses, some of which appear vacant. A diverse range of smaller businesses is clustered north of SH-121 in the 1.5 million-square foot Midway Industrial Park. Midway Business Park enjoys healthy occupancy rates and in recent years, completed landscaping and signage improvements. Additional commercial and retail properties within the TOD study area include businesses fronting Handley-Ederville Road and Baker Boulevard (SH-183). At 11.8 acres, the former 23


 TRE commuter")

27 Sam's Club location on Baker Boulevard is the largest parcel in the study area. A commercial building inventory for the entire TOD study area is included as Appendix A. The inventory is a detailed atlas of existing buildings that includes GoogleMaps street view photographs and parcel information from the Tarrant County Assessor District. A B C D E F Figure 2-4: Station Area Photos A & B) Richland Hills TRE Station Platform; C) TRE commuter parking; D) Burns Street, looking east; E) Advanced Chemical Logistics, 7101 Burns Street (Richland Industrial Park); F) TRE railroad crossing and SH-121 interchange, looking north on Handley-Ederville Road 24


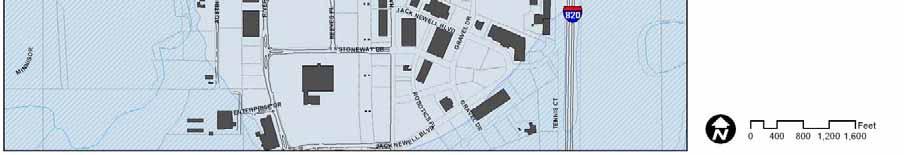
28 Figure 2-5: TOD Planning Area Map 25


29 Figure 2-6: Station Context Aerial Photo 26

30 2.6. Existing Zoning Most properties in the station TOD study area, including Richland Industrial Park south of the station and Midway Industrial Park north of the station, are zoned I-1, Light Industrial. Properties south of Midway Road are zoned I-2, Heavy Industrial. Residential properties west of Handley- Ederville Road are zoned R-1, Single Family Residential. Along Baker Boulevard (SH-183), properties are zoned C-2 and C-3, General and General Multi-Story Commercial. I-1, Light Industrial, is intended to accommodate non-nuisance uses such as wholesale, fabrication of materials, specialized manufacturing and research. While I-2, Heavy Industrial, allows for a wider range of industrial uses. Both C-2, General Commercial, and C-3, Multi- Story General Commercial, accommodate retail, service and office uses that are city-wide and regional in significance. The C-3 uses are more narrowly defined and the C-3 height limit allows buildings up to 90 feet (or 6 stories) versus the 50- foot height limit in C-2. R-1, Single Family Residential, is the predominant single-family housing district in the city. Development is limited primarily to single-family dwellings and certain limited community and recreation facilities. The commercial and industrial zone districts expressly prohibit most residential land uses. The non-residential districts in the study area require a 25-foot minimum Front Yard and a 15-foot minimum Side Yard (Street Side). Figure 2-7: Existing Zoning 27
31 2.7. Demographic Trends and Projections Trends This section presents an analysis of demographic trends and forecasts influencing the station area. The potential for TOD in the station area is related to regional growth patterns and local and regional real estate market conditions. The analysis focuses on Northeast Tarrant County and the ½ mile radius station area. The City of Richland Hills population was 8,300 in There has been only minimal growth in the City, with an increase of 168 people between 2000 and 2007, or an average of 0.3 percent per year (Table 2-1). By contrast, North Richland Hills added 8,400 people from 2000 to 2007 at an annual rate of 2.0 percent. Euless added 7,400 people at 2.2 percent growth per year during this period. Keller added over 10,000 people with 4.7 percent annual growth. Richland Hills has approximately 3,390 housing units (Table 2-2). The City s housing stock grew by 58 units from 2000 to 2007 (8 units per year on average). The majority of the housing construction in Northeast Tarrant County is occurring in Euless, Keller, North Richland Hills, and Grapevine. These outer suburbs in Northeastern Tarrant County are well located between Dallas and Fort Worth employment centers, and still have large areas of land available for new development and are therefore capturing a larger share of the regional housing market. Richland Hills is a mature landlocked suburb, as reflected in its slower growth rates. For the older landconstrained suburbs inside Loop 820, transit stations will provide opportunities to spur infill development and redevelopment as the regional transit access becomes increasingly valuable and raises property values over time. Table 2-1: Northeast Tarrant County Population Trends, Change Change Tarrant County # Ann. % # Ann. % City of Fort Worth 447, , ,850 87, % 152, % Northeast Bedford 43,762 47,152 49,050 3, % 1, % Colleyville 12,724 19,636 22,150 6, % 2, % Euless 38,149 46,005 53,400 7, % 7, % Grapevine 29,198 42,059 45,550 12, % 3, % Haltom City 32,856 39,018 39,400 6, % % Haslet 795 1,134 1, % % Hurst 33,574 36,273 38,500 2, % 2, % Keller 13,683 27,345 37,700 13, % 10, % N. Richland Hills 45,895 55,635 64,050 9, % 8, % Richland Hills 7,978 8,132 8, % % Watauga 20,009 21,908 24,150 1, % 2, % Subtotal 278, , ,650 65, % 39, % Arlington/SE 285, , ,950 85, % 55, % Other/West/Unincorporated 58,496 10,371 5,725-48, % -4, % Split Cities 17,839 28,289 47,150 10, % 18, % Tarrant County Total 1,088,134 1,289,005 1,550, , % 261, % Source: NCTCOG; Economic & Planning Systems 28
32 Table 2-2: Northeast Tarrant County Housing Trends, Table 2-3: Station Area Household Income and Tenure, Change Tarrant County # Ann. # Ann. % Income City of Fort Worth 211, ,277 60,242 8, % Northeast Bedford 21,113 22, % Colleyville 6,549 7, % Euless 20,027 23,653 3, % Grapevine 16,486 18,179 1, % Haltom City 15,716 16, % Haslet % Hurst 14,729 15, % Keller 9,215 12,827 3, % N. Richland Hills 21,601 25,033 3, % Richland Hills 3,333 3, % Watauga 7,275 8, % Subtotal 136, ,675 16,229 2, % Arlington/SE 143, ,206 21,449 3, % Reported Jurisdictions Total 491, ,158 97,920 13, % Other/Unincorp./Split Cities 74,592 87,399 12,807 1, % Tarrant County Total Change 565, , ,727 15, % Source: NCTCOG; Economic & Planning Systems 1/2-Mile Radius Avg. Household Income $41,384 $43,154 Household Size Percent Owner Occupied Units 64% 64% Percent Renter Occupied Units 36% 36% Richland Hills Avg. Household Income $48,760 $52,787 Household Size Percent Owner Occupied Units 70% 68% Percent Renter Occupied Units 30% 32% Tarrant County Avg. Household Income $60,112 $69,050 Household Size Percent Owner Occupied Units 61% 63% Percent Renter Occupied Units 39% 37% In Richland Hills, approximately 68 percent of households own their home (Table 2-3). Since 2000, the proportion of owners and renters has remained stable. There was a 2 percent increase in renters from 2000 to 2007, reflecting the conversion of a small number of homes from owner-occupied to rental units. The average household income in the City is $53,000, compared to $69,000 in Tarrant County. The half-mile station area and the City of Richland Hills as a whole have a smaller average household size of 2.36 and 2.44 as compared to 2.70 in the rest of Tarrant County. Source: Claritas, Economic & Planning Systems In the 2007, the average age of the heads of households in Richland Hills was 51.9, which was much higher than the Tarrant County average of Thirty six percent of the heads of households in Richland Hills are over the age of 60, which is significantly higher than the 21 percent found in the rest of Tarrant County (Table 2-4). 29
33 Table 2-4: Head of Household Age Distribution, Age Age of of Householder Head of Household Richland Hills 15 to 24 years 4% 4% 25 to 34 years 14% 15% 35 to 44 years 21% 18% 45 to 59 years 25% 27% 60 to 69 years 13% 14% 70 to 79 years 14% 12% 80 years or older 9% 10% Total 100% 100% Avg. Average Age Age of Head of Householder of Tarrant County 15 to 24 years 7% 7% 25 to 34 years 21% 19% 35 to 44 years 26% 23% 45 to 59 years 27% 30% 60 to 69 years 9% 11% 70 to 79 years 7% 6% 80 years or older 3% 3% Total 100% 100% Avg. Average Age Age of Head of Householder of Source: Claritas; Economic & Planning Systems Future Growth Richland Hills' residential acreage is nearly fully developed. The City anticipates that some newer housing units and some higher-density townhomes will replace portions of the older housing inventory. An analysis of available land indicated a 30-year future maximum population of not more than 10,000 residents, compared to the city's current estimated population of 8, Reflecting Richland Hills' landlocked status, NCTCOG forecasts little change for population and household growth in the Richland Hill Station Area between 2010 and 2030 (Table 2-5). By contrast, the population of the Dallas-Fort Worth metropolitan area is expected to grow 44% in the 20-year period. NCTCOG projects a modest 8% increase in employment for the Richland Hills Station Area. The study area's current employment base of more than 12,000 outnumbers residents (8,300). By 2030, NCTCOG projects that businesses in the station area will add over 1,000 additional jobs. Table 2-5: Population and Employment Forecast, 2010 and Change Richland Hills Station Area (1-mile radius) Population 3,544 3, % Households 1,407 1, % Employment 12,895 13, % Dallas-Fort Worth (10-county urban area) Population 6,328,200 9,107,900 44% Households 2,350,300 3,396,100 44% Employment 3,897,000 5,416,700 39% Source: NCTCOG The dominant growth pattern in the Metroplex has been outward, to the extent that the Dallas and Fort Worth area suburbs are converging. The Metroplex continues to expand in all directions, depending on continued roadway expansions and automobile mobility to support new development. 4 Richland Hills Master Park, Recreation and Open Space Plan, 2006, p
34 However, many planning and policy experts believe that in the coming years a number of factors will converge to change growth patterns and real estate buyer/renter preferences. Commuting distances and related congestion are reaching a point where commute times from the more distant suburbs are greater than one hour. This impacts quality of life, and makes these areas less appealing to homebuyers. NCTCOG s 2030 Metropolitan Transportation Plan estimates that the Dallas- Fort Worth transportation system has $58.6 billion in unfunded needs. 5 This has heightened the importance of regional transportation and growth strategies emphasizing mass transit and multimodal connectivity to reduce automobile trips. Figure 2-8: 2030 Metropolitan Transportation Plan Fuel prices are also expected to continue to increase as global demand from developing nations grows with domestic demand. The expected price increases will make long commutes by car more costly and distant suburbs less affordable, as a result. TOD Implications Residential demand is likely to shift to closer-in locations with good access to employment, shopping, services, and recreation and entertainment amenities. Because of the high level of regional accessibility created by transit stations, areas around stations (new and existing) will become more appealing and more valuable for residential and employment development, spurring TOD. TOD sites are not expected to meet all of the regional housing demand. TOD can be part of a larger regional growth strategy that concentrates density in appropriate areas with access to transit, employment, and services. TOD will provide mature suburbs with transit stations with opportunities for redevelopment and revitalization. While the long-term outlook for TOD is strong, in the short term, TOD sites by themselves cannot overcome adverse real estate market conditions. There are many high quality TOD projects in the Metroplex, including Downtown Plano, Mockingbird Station, and others. There are also new development concepts emerging in Tarrant County, such as Home Town in North Richland Hills, and Southlake Town Square. These projects are successful because of strong real estate market fundamentals, positive locations, site specific attributes and context, and strong surrounding demographics, often assisted by strong government subsidies and support. 5 NCTCOG. Mobility 2030: The Metropolitan Transportation Plan for the Dallas-Fort Worth Area,
35 2.8. Relevant Plans Handley-Ederville Road/SH-121 Interchange Improvements Running through the TOD study area, SH-121 is slated for improvements as part of TxDOT's North Tarrant Express project, a regionally supported managed lane system. The improvements along SH-121 and at the Handley-Ederville Road interchange are part of Segment 4, the expansion of East I-820 from the north interchange at SH-121 south to Randol Mill Road in Fort Worth. An environmental assessment for Segment 4 Figure 2-9: SH-121 Interchange and Trail Connections was approved in March Construction could begin on Northeast Loop 820 (Segment 1) in 2009 at the earliest; however, timing for the start of construction of the remaining segments is yet to be determined. In anticipation of the highway improvements, the 2003 Richland Hills Trail System Master Plan recommends that when the overpass and intersection are redesigned in coordination with TxDOT, the needs of the trail system and vehicle traffic be more closely assessed and accommodated in the new construction. The Trail System Master Plan suggests the following pedestrian enhancements to the interchange: Cross walks and associated paved waiting areas; Pedestrian crossing signals and controls; and Repurposing the northbound to southbound Texas turn around by eliminating motor vehicle traffic and designating this right of way for trail route use only. 6 Current efforts are underway by the City of Richland Hills to add additional sidewalk connections along the Handley- Ederville corridor. The City was awarded a $1 million grant from the North Central Texas Council of Governments in a 2006 Local Air Quality Call for Projects to promote pedestrian connections to the TRE station and to provide for connections from the TRE station north along Handley-Ederville to Pine Park Drive, west to Rosebud Drive. Proposed Burns Street/Trinity Boulevard Realignment at Handley-Ederville Road The Regional Transportation Council programmed CMAQ funds for intersection improvements from Burns Street/Trinity Boulevard to Handley-Ederville Road, which will result in minor parking expansion at the Richland Hills station. The T plans to realign Burns Street in the vicinity of the station, routing it south to better align with the existing intersection of Trinity Boulevard and Handley-Ederville Road. The proposed realignment creates a larger land area next to the existing TRE parking lot. In the short term, this area could be added to the existing surface parking lot, resulting in up to 117 additional parking spaces. 7 In the long term, this area could become a developable parcel. The realignment of Burns Street is key to making transit oriented development work. It will significantly improve access to the site and alleviate some of the traffic issues experienced at the SH-121 interchange. 6 Richland Hills Trail System Master Plan, 2003, pp. 2.19, Fort Worth Transit Authority. Strategic Parking Plan, March
36 1983 Richland Hills Comprehensive Plan Efforts to stimulate redevelopment and foster TOD in the TRE station vicinity are supportive of the following land use goals and objectives from the 1983 City of Richland Hills Comprehensive Plan. 8 To have orderly and timely land development which provides for compatible land use arrangement, is cognizant of energy conservation, encourages positive social impacts, provides for alternative living styles and reinforces the development of a strong industrial base and a healthy commercial district. Encourage cooperation between private enterprise and the public sector in the planned development of underutilized areas of the city. Yet the comprehensive plan also strives to protect the city s industrial base by selecting a commercial and industrial future land use alternative and maintaining a friendly and helpful posture toward the industrial sector. 9 The Comprehensive Plan expresses a strong dislike for a transient population and instead supports single family and low density residential development. 10 The strong reluctance for apartments is tempered by an acknowledgement of the fiscal advantages of denser housing and/or a strong commercial tax base over the costs of servicing larger lot single family housing. Ultimately, the Comprehensive Plan states that, The emphasis on a design of a project, the quality of construction and the amenities offered with the design may be far more indicative of an acceptable development than zoning density Richland Hills Strategic Action Plan The 1996 Strategic Action Plan is the product of a comprehensive planning process undertaken by the City. The plan aims to maintain a very high quality of life for Richland Hills neighborhoods and business districts. Major goals relevant to TOD include: Targeting markets for in-fill of underutilized commercial and industrial districts; 12 Fostering strong community identity with gateways, parkways and civic spaces; Promoting high quality design and landscaping at the commuter rail station; and Creating a system of pedestrian connections to the rail station. 13 The plan labels Handley-Ederville Road a defining corridor and calls for gateway features near SH-121 and special landscaping/streetscape, including street trees and sidewalks up to Baker Boulevard. 14 Regional Trail Plans The regional Veloweb is a 644-mile designated off-street trail network that is planned to provide bicycle and pedestrian connections in the Dallas-Fort Worth metroplex. The Veloweb alignment, updated in the NCTCOG Mobility 2030 Plan, is a series of small off-road trails designed for use primarily by fastmoving bicyclists. The Veloweb is also designed to encourage concurrent pedestrian transportation use City of Richland Hills Comprehensive Plan, 1983, p. II-2. 9 Ibid., at pp. IV-15, VII Ibid., at pp. III-9, XI Ibid., at p. XI City of Richland Hills Strategic Action Plan, 1996, p. I Ibid., at p. I Ibid., at pp. II-6, 9, 10; III-7, NCTCOG. Mobility 2030: The Metropolitan Transportation Plan for the Dallas-Fort Worth Area, 2007, Chapter 15. Pedestrian/Bicycle System. 33
37 Figure 2-10: Regional Linkages Map 34
38 Figure 2-11: Station Area Linkages Map 35


39 Current plans call for an extension of the existing West Fork Trinity River trail from its current terminus at Randol Mill Road and Woodhaven Boulevard in Fort Worth. The trail would continue east along the river for approximately 1.5 miles and then head north along the existing power line corridor into Richland Hills and through the TOD study area. At SH-121 the trail would turn east and closely follow the TRE alignment for several miles before joining up with completed trails east of Greenbelt Road in Arlington. The regional Veloweb also designates much of the Richland Hills TOD study area a Bicycle and Pedestrian Transportation District. The regional and station area views of proposed bicycle trail connections (Figure 2-10 and Figure 2-11) are based in the NCTCOG Mobility 2030 Plan, the Richland Hills Trails System Master Plan, the consultant team s assessment of the feasibility of trail connections indicated by these plans, and the consultant team s recommendations for pedestrian and bicycle access within and to the study area. For a detailed description of the modifications, see Pedestrian/Bicycle Connections in Section 6.6, Infrastructures Issues Richland Hills Trail System Master Plan The 2003 Trail System Master Plan provides a concept design for a trail system to serve the citizens of Richland Hills. The proposed trails make use of existing power line corridors that run north-south and east-west through the city, two drainage corridors along Calloway Creek and Big Fossil Creek, and designated on-street routes to connect to public facilities and planned trails in neighboring communities. In the TOD study area, off-street concrete trails are proposed along the south side of SH-121, between the highway and the TRE railroad corridor, with an on-street connection from the TRE station north under SH-121, where the trail continues west along the north side of the service road to the north/south power line corridor located one block west of Handley- Ederville Road. At the intersection of SH-121 and Handley- Ederville Road, proposed additions include cross walks and associated paved waiting areas, pedestrian signals, and the designation of the Texas turn around for trail use only. 16 These proposed trail improvements are designated Priority #1 in the City's ranking of projects seeking Congestion Mitigation & Air Quality matching funds. Figure 2-12: Richland Hills Trail System Master Plan Map 16 Richland Hills Trail System Master Plan (2003), p
40 (The equestrian trail illustrated in the City's 2003 Trail System Master Plan should be carefully reviewed for feasibility and safety prior to considering implementation.) Figure 2-13: Highway and Railroad ROW Corridor Trail 2006 Richland Hills Master Park, Recreation and Open Space Plan A key goal of the recent Master Park, Recreation and Open Space Plan is the utilization of portions of the Big Fossil Creek Floodway as a recreation area. The floodway borders the western edge of the city and passes through the western tip of the TOD study area. A 124-acre portion of the floodway, located north of SH-121, could possibly accommodate a low flow town lake and recreational uses such as golfing, radio and free flight model airplane fields, equestrian trails and exercise area, and walking trails Richland Hills Economic Redevelopment Plan The TOD study area includes three of the seven target sites identified in the 2006 Economic Redevelopment Plan. Plan recommendations for these areas are as follows. Properties in/around the TRE station, fronting Handley- Ederville Road: Suggested uses for the site include convenience store/service retail, fast food restaurant, live/work lofts (residential/industrial), and kiosk retail. Site advantages include few landowners; proximity to the station, SH-121, and a proposed trail route; good highway visibility and traffic volumes; and future improved access to Loop 820. Identified obstacles include existing zoning and land uses; the TXU utility easement, and infrastructure delay (Trinity Boulevard extension). 18 Properties at the northeast corner of Handley-Ederville Road and the SH-121 frontage road: Suggested uses for the site include convenience service/retail, fast food restaurant, townhouses, and possibly kiosk retail. Site advantages include access to SH-121; proximity to business park and proposed trail route; and freeway visibility. Identified obstacles include existing zoning and land uses; multiple property owners; and drainage mitigation Richland Hills Master Park, Recreation and Open Space Plan, 2006, p Ibid., at p Ibid., at p
41 Baker Boulevard/SH-183 and I-820/SH-121: Suggested uses for the site include big box retail, strip retail/service, restaurant, and fast food. Site advantages include regional visibility, portal entry location, few property owners, and large lots. Identified obstacles include existing zoning and infrastructure. 20 The plan notes that the City's primary objective is to stimulate retail development. Retail demand can be grown by supporting professional office development in sectors such as aviation, medical and biomedical, finance, high tech, and general small business office users. 21 Additionally, the City will have a greater chance of attracting retail and sales tax generating businesses if the City chooses to allow more dense development in certain areas. The City may want to consider live/work lofts or owner-occupied brownstones as part of a larger planned development incorporating a number of uses. 22 The TIRZ will finance infrastructure improvements, sidewalks, curb and gutter, drainage improvements, utility improvements, lighting and signage, and landscaping. Baker Boulevard Tax Increment Reinvestment Zone The Baker Boulevard TIRZ (established in 2009) runs the length of Baker Boulevard from Loop 820 to Boulevard 26 and the west side of Rufe Snow from Baker to Boulevard 26. The redevelopment of Baker Boulevard has been a long-stated goal of the City and tax increment financing is a way to implement the 2006 Economic Redevelopment Plan by financing infrastructure improvements that will attract new development. The plan describes three sub-districts along Baker Boulevard: a traditional retail market district at the west end, an urban boulevard main street district between Rufe Snow and Handley-Ederville, and a traditional retail merchant district east of Handley-Ederville. 20 Ibid., at p Ibid., at p Ibid., at p
42 3. TOD Principles Transit oriented development (TOD) is a form of development that is conducive to increased use of transit by residents. This usually implies dense development around mass transit stations that provides a range of destinations within walking distance, including multifamily homes, shops, and workplaces. 23 Efficiency and Effectiveness of Public Investment Numerous studies have shown that TOD improves the efficiency and effectiveness of transit service and other public investments: 24 TODs increase the use of transit by nearby populations by 20-40%. 25 About 40% of people who live in TODs choose to reside near transit because they are regular riders. 26 Depending on local circumstances, TOD can help reduce local governments overall infrastructure costs of expanding water lines, sewer lines, and roads by up to 25% through more compact infill development. 27 Transit ridership rates at mixed use suburban employment centers are on average 5% to 10% higher than they are at single-use employment centers. 28 A doubling of density is associated with nearly a 60% increase in transit boardings. 29 Grid-like street patterns and pedestrian-friendly designs have been associated with transit-usage levels that are as much as 20% higher than usage levels at typical suburban subdivision designs. 30 A new federal study to measure the connection between TOD and trip generation found an average of 44% fewer daily vehicle trips than estimated by the Institute for Transportation Engineers (ITE) Trip Manual at 17 residential TODs around the US. 31 Case studies suggest that the superior transportation performance of TODs allows for a reduction in parking ratios and an increase in housing density between 20% and 30%, which can help to lower housing costs. 32 Impact on Value Creation and Retention Numerous studies of cities across the U.S. have shown that both residential and commercial development values are greater when located in proximity to rail stations. 33 The value premium varies according to the level of service (frequency) and the destinations accessible from the station. Recent national survey data indicate that 59% of transit trips are work related; therefore, a transit system that provides good access to major employment centers is likely to have better potential to support higher land values. 34 Depending on these factors, 23 TCRP Report 123: Understanding How Individuals Make Travel and Location Decisions: Implications for Public Transportation, Washington, D.C.: Transportation Research Board, National Research Council, Berger, G. Defining the Societal Benefits of Transit, Statewide Transit-Oriented Development Study: Factors for Success in California, CalTrans: Cervero, R. and M. Duncan. Residential Self-Selection and Rail Commuting: A Nested Logit Analysis. Working Paper, Institute of Urban and Regional Development, University of California: Berkeley, CA, Factors for Success in California 28 Cervero, R. Mixed Land Uses and Commuting: Evidence from the American Housing Survey, Transportation Research A, Vol. 30 No. 5 (1996). 29 Cervero, R. and J. Zupan, Regional Transit Corridors: The Land Use Connection, TCRP Project H-1, Cervero R. Built Environments and Mode Choice: Toward a Normative Framework, Transportation Research D, Vol. 7 (2002). 31 TCRP Report 128: Effects of TOD on Housing, Parking, and Travel, Washington, D.C.: Transportation Research Board, National Research Council, Ibid., at p Center for Transit-Oriented Development. Capturing the Value of Transit, FTA CA , November A Profile of Public Transportation Passenger Demographics and Travel Characteristics Reported in On-Board Surveys. American Public Transportation Association,
43 the influence of light rail compared to commuter rail may be indistinguishable. Additionally, Anecdotal evidence suggests that transit oriented development retains its value during a recession better than other properties. 35 Dallas-specific studies by the University of North Texas have found the following measurable increases in property values near DART light rail stations: Between 1999 and 2007, $4.26 billion in development projects along rail lines were attributable to the proximity of DART. 36 Properties near DART light rail stations recorded valuation increases about 25% greater than neighborhoods in a control group not served by DART between 1994 and Between 1997 and 2001, median values of residential properties increased 32.1% near DART stations compared to 19.5% in non-dart areas. Between 1997 and 2001, median values of office buildings near DART stations increased 24.7% versus 11.5% for non- DART properties. 37 Value creation can also be enhanced, along with creating a sense of place or neighborhood through the introduction of open space and trails. A study conducted in the DFW area demonstrated the value of public open space. 38 Homes adjacent to public open space sold at a 23% premium over properties that were more than a quarter mile away. There continues to be a sliding premium over that distance (Figure 3-1). Figure 3-1: Impact of Proximity to Park 3.1. Station Area/Transit Oriented Development Design Principles A successful TOD preserves and builds upon the project area s strengths while positioning it for a vital future. Described below are basic planning and design principles developed by Townscape, Inc (part of the consultant team) that support each unique project and assure an enduring and engaging urban realm. 35 Jackson, M. For new offices it s all about the ride, The Denver Post, 6 November Clower, Terry L. et al. Assessment of the Potential Fiscal Impacts of Existing and Proposed Transit-Oriented Development in the Dallas Rapid Transit Service Area, Center for Economic Development and Research, University of North Texas, November UNT Center for Economic Development and Research, DART Light Rail s Effect on Taxable Property Valuations and Transit-Oriented Development, January Massachusetts Institute of Technology Center for Real Estate and School Of Architecture. Based on MLS Data for 3,400 Home Re-sales Near 15 Neighborhood Parks Across DFW, by Andrew Ross Miller,

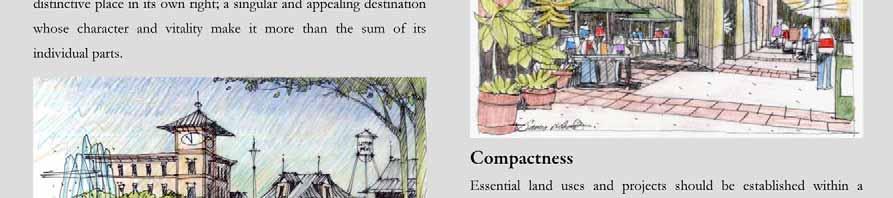
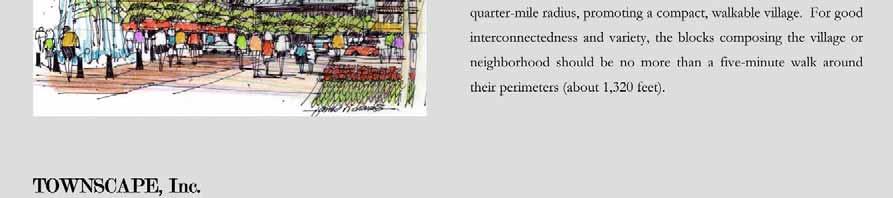
44 41


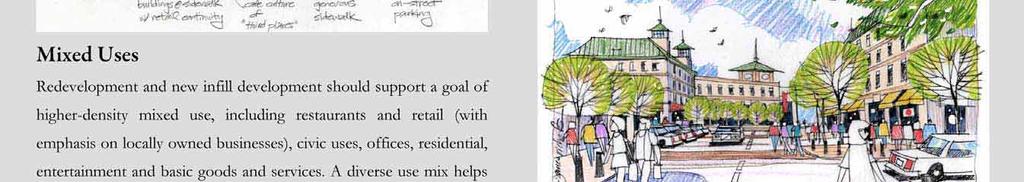

45 42


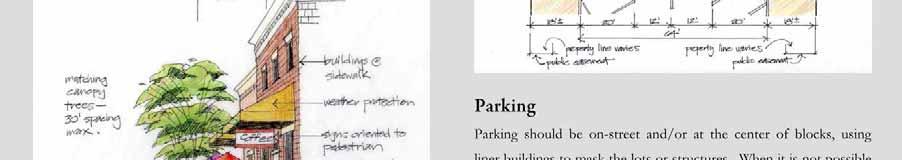
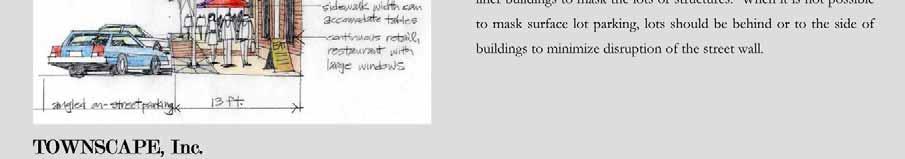
46 43


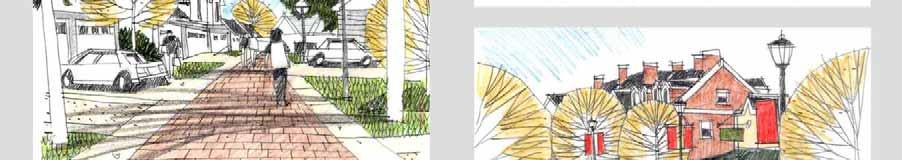
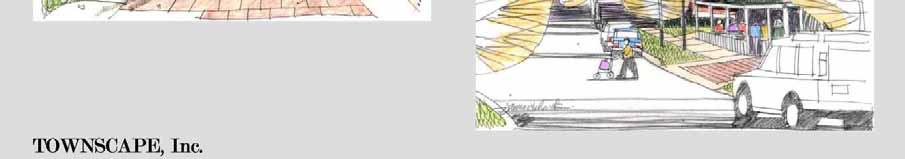
47 44


48 45


49 46


50 47

51 3.2. National and Regional Examples Several examples of TOD projects in former industrial areas have been implemented in various parts of the country. While not all these examples match the specific characteristics of the Richland Hills study area, they provide guidance on the types and scale of development that can occur in similar industrial areas. Fireclay District, Murray North TRAX Station, Murray, Utah The Murray North 4500 South Station opened in 1999 with the Sandy/Salt Lake TRAX light rail line. A 20-minute ride from City Center in Salt Lake City, Utah, the station is near the intersection of two major arterials, S. State Street and 4500 South. Located in an industrial area of the city of Murray, approximately a half mile east of Interstate 15, the station has 235 surface parking spaces and is served by three bus routes. The 19-mile, 23-station TRAX system, which currently carries more than 55,000 riders a day, will be expanded over the next decade with 26 additional miles of light rail, 88 miles of heavy commuter rail line and nearly 40 extra station stops. Murray is a 12-square mile mature suburb south of Salt Lake City. Home to about 34,000 residents in 2000, Murray s population is slightly older than the regional average, with somewhat smaller households. Murray s household income is also slightly lower than the region s, yet there it has a higher rate of homeownership. Murray has been characterized as a stable, aging community that is positioned to capture new younger households as older residents transition out of their existing homes. A 2002 transportation and land use study by Envision Utah looked at the Murray North 4500 South Station as a TOD case study. 39 This planning effort brought together businesses, residents, local officials, developers and other key stakeholders to develop conceptual land use plans. The case study noted that many of the industrial activities then located in the vicinity of the TRAX station were either marginal, or would become marginal over the long term. The study assumed that most of the adjacent large commercial and industrial parcels would be available for future redevelopment. Regional economic trends suggested that some future office development may be viable in the area. However, the study recommended that office uses be concentrated to create a critical mass and that the viability of mixed use office and residential buildings be reassessed relative to local market conditions closer to the time of construction of a particular project. The consensus land use concept included: Mixed use development of offices over smaller-scale retail within a walkable core area around the intersection of Main and Fireclay Streets, one block east and north of the station; Creation of a walkable east/west axis lined with mixed use buildings across the Figure 3-2: Fireclay Land Use Concept site s entirety; Property consolidation and development of an 39 Envision Utah South Murray North Station, Wasatch Front TOD Guidelines, 2002, pp


52 employment center or business park west of the TRAX and Union Pacific Railroad corridors; Local and community serving retail uses near the major arterials, S. State Street and 4500 South; Development of a parkway along Big Cottonwood Creek in the northern portion of the study area; and New housing opportunities radiating north and west from the station core and capitalizing on the amenity of Big Cottonwood Creek. Acting on the case study recommendations, Murray City adopted a TOD-friendly General Plan in 2003 and then updated its zoning ordinance to accommodate mixed use development in the station vicinity, an area which had formerly been designated Manufacturing General Conditional. The transit development ordinance allows narrower streets, encourages trees and pocket parks, and supports increased densities. 40 In 2005 Developers of a 97-acre redevelopment project known as the Fireclay District began collaborating with the City to address environmental and infrastructure concerns. The Fireclay District includes the abandoned Simpson Steel and Morgan or Hanover Smelting Works. The sites are listed on the EPA's database of potential hazardous sites, called the Comprehensive Environmental Response, Compensation and Liability Information System (CERCLIS). Although there was no groundwater contamination, developers used a voluntary cleanup program, which is allowed through a 1997 state law, to pay the state for cleanup of metals in the soil. The first stage of cleanup included 15 acres east of the TRAX corridor. The second phase will be 14.5 acres west of the corridor. 41 After determining the area blighted, the Murray City Redevelopment Agency approved the use of up to $38.9 million in RDA funds (tax revenue generated from future development to pay for improvements on the site) to spur development at the site over a 20-year period. $1.4 million was designated for environmental cleanup and $1.5 million for reconfiguration of TRAX parking and bus operations to accommodate an adjoining community plaza. Additional funds were earmarked for lengthening a sewer line and widening and improving Fireclay Avenue as a sewer-line easement Schneider, K. Rail Line Drives Utah Development, New York Times, 22 April Nielson-Stowell, A. Smelter Site Cleanup: Murray Hopes to Turn Ex-Industrial Ground into Developments, Deseret Morning News, 15 May Ibid. Figure 3-3: Fireclay District Plan 49


53 In late 2007, after spending two years assembling land, Hamlet Homes broke ground on the first development in the Fireclay District. 43 Fireclay is a 30-acre $150 million project by one of the region s largest homebuilders. 44 Plans call for: 238 condominiums; 96 townhomes; More than 250,000 square feet of retail and office space in three- and four-story structures; and Almost six acres of open space. Figure 3-4: Fireclay Developer's Rendering A 19-minute ride from the Airport and 22-minute ride from Pioneer Square in downtown Portland, the station is located on the boundary between the Center and Rose City Park neighborhoods, near the intersection of two major arterials, NE Glisan Street and NE 60 th Avenue, immediately north of Interstate 84. The area surrounding the station and north of Interstate 84 is characterized by large industrial and warehouse uses. South of the station and Interstate 84 are mature, middle-class Residential units range from 800 to 1,800 square feet and include live/work townhomes that provide office space on the ground floor with living quarters above. Hamlet Homes plans to install high-speed fiber connectivity to all units and offer free TRAX passes for the first year. 45 Center Commons, NE 60th Avenue MAX Station, Portland, Oregon Five miles east of downtown Portland, the Northeast 60 th Avenue Station opened in 1998 on the Eastside MAX Blue Line to Hillsboro. Three years later, in 2001, the Red Line also began operating in the Eastside corridor, providing a connection between City Center and Portland International Airport. 43 Fireclay, Hamlet Homes, 44 Tsuchiya, A. Fireclay Project Hits the Ground Running, Murray Journal, 13 February Huish Stum, J. Transit Comes Close to Home, Utah Business Magazine, 1 February Figure 3-5: 60th Ave MAX Station Context 50

54 neighborhoods. The station area is served by three Tri-Met bus routes. There is no parking at the station; however, the 4.9-acre TOD infill site operated as an informal park-and-ride before development of the Center Commons project. 46 The TOD site previously contained a vacant one-story 58,000- square foot office building and a large surface parking lot owned by the Oregon Department of Transportation (ODOT). In the early 1980s the City of Portland adopted transitsupportive zoning as part of its Transit Station-Area Planning Program. In 1994 the City of Portland began hosting neighborhood meetings and exploring TOD options for the site. The following year the City s redevelopment agency studied the feasibility of using state Transportation Growth Management funds to develop the site and in 1996 the Portland Development Commission (PDC) purchased the parcel for fair market value from ODOT. 47 (The PDC is an urban renewal authority, similar to a TIF or TIRZ district in Texas.) Obstacles to TOD on this site and in the area included inadequate sidewalks, congested arterial streets, nearby industrial uses, no precedent for high density or mixed uses in the neighborhood, low nearby commercial rents that limited the market for new construction, and a station location next to a noisy freeway. 48 Lennar Affordable Communities (LAC) was selected as the master developer for the project in Three years later, the Metro (regional government) TOD program purchased the site from PDC for about $1 million (the appraisal value), subdivided the parcel, and established TOD easements for pedestrian paths to the station. Changing market conditions reduced the total land value to $250,000 before development parcels were sold to the three separate development entities that made up the LAC team. Subsequent environmental remediation, paid for by the developer and ODOT, involved the removal of surface soil contamination and asbestos and the recycling of the vacant concrete building as site fill. 49 Construction began in 1999 and was complete by Total costs were $30 million. Funding came from low-income housing tax credits, state of Oregon tax exempt bonds, a PDC loan, a Fannie Mae loan, general partner equity, and an FTA grant. Additionally, income-qualifying households received a 10-year transit oriented property tax abatement from the city of Portland because of the development's proximity to the MAX light rail system. 50 With 314 housing units, the development is primarily residential. The final mix of uses includes: 51 Four apartment buildings containing 172 units of affordable housing for seniors; 60 two-, three-, and fourbedroom affordable family units; and 56 market rate units; 26 three-story condominium townhouses targeted Figure 3-6: NE 60th Ave at Glisan St primarily for first time homeowners; An on-site day care facility and a play area; and 46 TCRP Report 102: Transit-Oriented Development in the United States: Experiences, Challenges, and Prospects, Washington, D.C.: Transportation Research Board, National Research Council, 2004, pp Ibid. 48 Ibid. 49 Ibid. 50 Ibid. 51 Metro. Center Commons TOD Profile, 51
 is a recognized problem.")
55 One ground-floor commercial space, initially leased by H&R Block. Surveys of residents indicate high levels of transit use: 46% of work trips and 32% of non-work trips are on transit. However, the project s low parking ratio (0.6 spaces per unit, all above ground, some in podiums) is a recognized problem. Parking spills over into surrounding neighborhoods and guest parking is inadequate. 52 Problems were encountered with the marketability of the residential mix. Although the market-rate apartments were quickly leased, the senior-designated apartments were less attractive, as many seniors indicated that they disliked living in proximity to families with children. The 26 townhomes were also problematic as 12 remained unsold one year after they went on the market. Although the townhomes were relatively inexpensive and of high quality compared with other townhouse/condominium locations, possible reasons for the slow sales include: A location too distant from downtown Portland to be attractive to young buyers; Too many townhouses built at once, as a concession to neighbors who favored owner-occupied units; and A contemporary design aesthetic and three-story configuration that may have had limited appeal and been problematic for seniors and families with children. 53 The Center Commons private development partners have struggled financially and some concede that the project may have tried to accomplish too much on a small site. Nevertheless, the project is a notable example of TOD infill in a freeway-adjacent site that was not well connected to other major activity centers and that had no recent precedent for mixed uses or infill. Center Commons transformed an underutilized property into a mixed use development that has since been a catalyst for revitalization in the immediate neighborhood. 54 Arrowood Station Area Development, Lynx Light Rail, Charlotte, North Carolina The LYNX Light Rail Blue Line (South Corridor) in Charlotte, North Carolina opened November of The 9.6 mile corridor runs from Uptown Charlotte south to I-485, Charlotte s Outer Belt. The southern portion of the Blue Line runs through and ends in an industrial area. Two stops from the I-485 terminus, Arrowood Station has 289 surface parking spaces and is served by two bus routes. 55 Figure 3-7: Arrowood Station Site 52 Ibid. 53 Ibid. 54 Ibid


56 The Arrowood Station area is flanked on its eastern and western edges by stable suburban neighborhoods and some single story office industrial uses. The South Square Park shopping center, immediately adjacent to the LRT station, has a vacant big box with redevelopment potential. Other large commercial sites in the vicinity are also attractive redevelopment sites with lower land assemblage obstacles. One greenfield site southwest of the station has attracted developer interest in residential TOD. 56 Plans call for open space, initial development of townhomes at the neighborhood core, and future higher density development closer to the station and the rail corridor. the South Corridor beyond the scope of transit construction. Meanwhile, the Charlotte-Mecklenburg Planning Commission sponsored station area planning and zoning changes to allow transit oriented development. 57 Figure 3-8: Proposed Arrowood TOD Site Plan In 2005, two years prior to the opening of the corridor, the City of Charlotte took a proactive approach toward planning for transit oriented development in the Blue Line station areas. A $50 million bond was issued for infrastructure improvements in 56 Harris Development Group, LLC. Figure 3-9: Arrowood Area Land Use Plan 57 Arrowood Station Area Overview, October orridor/arrowood.pdf 53


57 Cedars Station Area Development, DART Light Rail, Dallas, Texas The Cedars Station is located at the intersection of Belleview Street and Wall Street on the DART Red and Blue light rail lines. This station is a south of the Convention Center and Union Station. The Cedars Station was initially surrounded by industrial uses, located in an area that was declining physically and losing tenants, similar to the Richland Hills study area. Over time, the neighborhood has evolved into a vibrant area. The Cedars Tax Increment Financing (TIF) District was created in 1992 by the City of Dallas to redevelop and stabilize the Cedars area and to reverse the decline of the area s tax base. 58 Projects within the TIF District that have accessed TIF funding include completed row home projects, condominium low and high rises (under construction), and an approved hotel. Other projects also within the TIF District yet not using TIF funding include completed apartments, the Dallas Police Headquarters, a restaurant and lofts. Nearby projects adjacent to the TIF District include the completed South Side on Lamar lofts, three restaurant/clubs, and the planned Dallas County Community College District Offices. 59 Figure 3-11: Cedars Station Area Projects Buzz Condominiums, Dallas Police Headquarters, Beat Condominiums Figure 3-10: Cedars TIF District Boundary Map 58 Cedars TIF District FY 2007 Annual Report. 59 Ibid. 54


58 Cedars Station helped to invigorate redevelopment in the area. The Sears Roebuck & Company Catalog Merchandise Center, located three blocks southwest of Cedar Station, closed its doors in This 10-story complex was renovated into a 455- Figure 3-12: Southside on Lamar unit loft live and work center with specialty retail, dining, entertainment, and art studios and galleries and became known as South Side on Lamar. 60 The zoning for the area was Cedars Station 2 The Beat Condominiums 3 Dallas Police Headquarter changed to allow flexibility in uses, which then allowed for the redevelopment of the Sears building. The developers received a ten year Historic Tax Abatement to help finance the project Station Typologies An understanding of the range of commuter rail station typologies is important for determining the possible scale of future TOD in the vicinity of the Richland Hills Station. Commuter rail stations can be loosely classified into six categories based on the anticipated function and level of activity at and around each station (Table 3-1). Station types include Neighborhood, Main Street, Town Center, Urban Center, Regional Destination, and Commuter. Today the Richland Hills TRE station most closely matches the Commuter station typology. The primary transit function is to serve as a capture station for commuters. The station offers connections to a crosstown bus route (Route 40) and the Richland Hills Rider Request service (Route 41) and is located in an industrial area. However, future TOD and redevelopment in the vicinity could contribute to an evolution in station type. For instance, mixed use development with residential and local and commuter-serving commercial/employment/civic uses could form the basis of a future Town Center station typology. 4 South Side on Lamar Figure 3-13: Cedars Station Area Aerial View Rail Volution, Building Livable Communities with Transit, San Francisco, CA, October
.")
 Grapevine - Main Street (future SW2NE) Main street walk-up station. Feeder and local bus service; kiss-and-ride drop off; and small park-and-ride (if any).")
. Town Center Mockingbird (DART) Sub-regional destination and capture station for commuters. District circulator; feeder, local and express bus service; kiss-and-ride; and parkand-ride.")
59 Table 3-1: Station Typologies TYPE EXAMPLE(S) TRANSIT CONNECTIVITY STATION AREA CHARACTER Neighborhood Morrell (DART) Neighborhood walk-up station. Local bus service, kiss-and-ride drop off, and small park-and-ride (if any). Residential area (multi-family, townhome, and small lot single family) with some neighborhood civic and commercial uses (local and commuter-serving retail; likely less than 50,000 square feet). Main Street Downtown Plano (DART) Grapevine - Main Street (future SW2NE) Main street walk-up station. Feeder and local bus service; kiss-and-ride drop off; and small park-and-ride (if any). Ideal location for mixed use redevelopment with diverse residential options (including residential above retail and multifamily) as well as local civic, employment and commercial (including retail infill). Town Center Mockingbird (DART) Sub-regional destination and capture station for commuters. District circulator; feeder, local and express bus service; kiss-and-ride; and parkand-ride. Mixed use town center development with diverse residential options (including multifamily and townhomes) as well as local and commuter-serving commercial/employment/civic uses (likely more than 50,000 square feet of retail). 56

 Medical/Market (DART/TRE) Major regional destination.")

60 TYPE EXAMPLE(S) TRANSIT CONNECTIVITY STATION AREA CHARACTER Urban Center T&P Station (TRE) Fort Worth ITC (TRE) Dallas Union Station (DART) Major regional destination. District circulator; feeder, local and express bus service; kiss-and-ride; and some park-and-ride. Possible intermodal facility/transit hub. Employment emphasis, with more than 250,000 square feet of employment, office and civic uses; and at least 50,000 square feet of retail and entertainment. Complementary residential uses include multi-family, lofts and townhomes. Regional Destination Victory Station (DART/TRE) Medical/Market (DART/TRE) Major regional destination. District circulator; feeder, local and express bus service; kiss-and-ride; and some park-and-ride. University, campus, sports facility, or special events center; or prime employment, retail, entertainment and civic center. Complementary residential uses include multi-family and lofts. Commuter Richland Hills (TRE) Parker Road (DART) Capture station for commuters. Feeder, local and express bus service; kiss-and-ride; and park-andride. Non-residential commercial or industrial area or edge of a residential neighborhood. 57
61 4. Station Area Analysis The following sections include an analysis of the TOD study area s market conditions and a redevelopment strategy; opportunities and constraints; public process and stakeholder issues; study objectives; and financing strategies Market Analysis This market analysis is limited to residential, office, and retail/commercial uses as these can be developed to be compatible with TOD and are the uses most typically found in TODs. Entertainment uses can also be part of a TOD, but were not evaluated in this market analysis. Industrial development was not considered as it traditionally requires larger sites and streets to accommodate heavy trucks. This is challenging for pedestrian circulation and concentrating development near station platforms. There is an abundance of low cost industrial land in the Metroplex, meaning that the station area would not be competitive for industrial development in this more costly redevelopment setting. defined market area was chosen to include areas within approximately three miles of the station with similar housing stock and demographic characteristics. This includes Richland Hills, and portions of Haltom City, Hurst, and North Richland Hills. Further south in Fort Worth, there is a concentration of industrial development signifying a break in the residential market boundary. South of this, residential development relates more to the I-30 corridor than to the TRE or Highway 121 corridor. Residential This overview of the residential real estate market is presented to document market conditions surrounding the station and in northeast Tarrant County. The findings of this analysis will inform a determination of the housing types recommended for the TOD plan. An approximate market area was defined to describe market conditions. The market area is bounded by Highway 377, the Richland Hills city limits, Trinity Road to the south, Precinct Line Road to the east, Highway 183 and Loop 820 to the north, and Rufe Snow Drive to the west (Figure 4-1). Market areas are somewhat arbitrary, but are often based on geographic features such as major roadways, neighborhood boundaries, and other geographic features. For this study, the 58

62 Figure 4-1: Residential Market Area For Sale Housing The number of sales of existing homes from in Richland Hills was small compared to neighboring communities. Between 2003 and 2007, Richland Hills averaged 85 sales per year, compared to 364, 508, and 840 in Haltom City, Hurst and North Richland Hills, respectively. There has been an increase in the number of home sales each year in Richland Hills with 103 in 2007, compared to the 64 sales in Despite the increase in sales over this time period, the home prices have remained the same, with the average home price increasing less than 1 percent between 2003 and 2007 (Table 4-1). Based on new residential building permit data, the majority of new for-sale single family home development occurring in Tarrant County is in North Richland Hills, Grapevine, Euless, Keller and east of Fort Worth in Arlington. Over the last few years, the only major new residential development near the Richland Hills station was the Lakes of River Trails, which is just east of the station area along Trinity Blvd. at Precinct Line Road. The Lakes of River Trails is a 2,250 unit, single family home development just east of Loop 820. Prices for units range from $150,000 to $260,000, or $80 to $125 a square foot. This development is large enough to create a place and identity needed to establish a desirable location for residential development. New construction prices in the area are 40% higher than the existing home sale prices which indicates that the market area can support higher values for new homes. No new for-sale attached developments were identified in the market area, making it difficult to judge market support for these housing types in the short term. 59
63 Table 4-1: Residential Sales by Type, Ann. % Annual City Change Average Richland Hills Number of Sales % 85 Avg. Sales Price $98,019 $91,255 $94,361 $100,673 $101,678 $106, % $97,197 Average Sq. Ft. 1,554 1,568 1,575 1,653 1,702 1, ,610 Avg. Price per Sq. Ft. $63 $58 $60 $61 $60 $63-1.3% $60 Haltom City Number of Sales % 364 Avg. Sales Price $89,873 $89,566 $90,429 $95,171 $92,985 $91, % $91,605 Average Sq. Ft. 1,500 1,473 1,513 1,517 1,536 1, ,508 Avg. Price per Sq. Ft. $60 $61 $60 $63 $61 $57 0.3% $61 Hurst Number of Sales % 508 Avg. Sales Price $134,838 $143,444 $150,522 $147,902 $156,263 $153, % $146,594 Average Sq. Ft. 1,841 1,904 1,963 1,887 1,933 1, ,906 Avg. Price per Sq. Ft. $73 $75 $77 $78 $81 $78 2.5% $77 North Richland Hills Number of Sales , % 840 Avg. Sales Price $146,398 $154,388 $163,860 $175,188 $180,759 $182, % $164,119 Average Sq. Ft. 2,156 2,070 2,086 2,119 2,143 2, ,115 Avg. Price per Sq. Ft. $68 $75 $79 $83 $84 $84 5.6% $78 1 Sales for 2008 are through July. Source: North Texas Real Estate Information Systems; Economic & Planning Systems Multifamily Development There has been a significant amount of new multifamily construction in northeast Tarrant County. For example, in North Richland Hills several mixed use developments are planned which include large portions of multifamily housing. In the past 10 years North Richland Hills has permitted over 2,300 multifamily units, a number almost equal to the number of single family units that have been permitted in the same time period. Within three miles of the station there are a significant number of apartment units, 4,250 (Figure 4-2). In addition to this existing stock, there has been an increase in apartment construction activity in the area. Apartment vacancy rates throughout the Dallas-Fort Worth area have been relatively low, which points to a demand for apartments. The apartment vacancy rate at the end of 2008 in the Dallas-Fort Worth area was 8.6 percent. 62 The majority of the apartment buildings that are within Richland Hills or close to the TRE station were built in the late 1960s or in the 1970s. The age and quality of the apartment projects are evident in the rental rates. The apartment projects in the area have an average rent of $661, as compared to the Metro area average rent of $ The Raintree apartment project in Richland Hills was built in 1979 and has an average rent of $645, which is lower than the other surrounding projects (Table 4-2). Table 4-2: Profile of Selected Area Apartments, Units and Size Rent ID Name Year Built Units Studio 1 Bed 2 Bed 3 Bed Average Primary Competitive Projects 1 Appian Way $484 $677 $792 $617 2 Barrington Crossing $660 $750 $950 $787 3 Country View $445 $579 $695 $557 4 Oaktree Village Plantation West $622 $ $700 6 Raintree $420 $545 $710 $840 $645 7 Towne Oaks $473 $517 $755 $880 $659 Average 1,261 $446 $545 $703 $831 $661 Source: Economic & Planning Systems 62 M/PF Yeildstar, Inc 63 Ibid. 60
64 The current average rent per square foot for the area apartment projects, $0.66 a square foot, is lower than the Dallas-Fort Worth area average of $.88 per square foot (Table 4-3). The disparity of rents between the Dallas-Forth Worth area average and the local projects may predominantly be due to the age and quality of the apartment buildings in the area. Table 4-3: Profile of Selected Area Apartments, Rent per Square Feet Rent per Square Foot ID Name Year Built Units Studio 1 Bed 2 Bed 3 Bed Average Primary Competitive Projects 1 Appian Way $0.67 $0.62 $0.59 $ Barrington Crossing $0.74 $0.64 $0.71 $ Country View $0.64 $0.56 $0.54 $ Oaktree Village Plantation West $0.77 $ $ Raintree $0.82 $0.70 $0.63 $0.67 $ Towne Oaks $0.81 $0.69 $0.61 $0.60 $0.65 Average 1,261 $0.81 $0.70 $0.63 $0.62 $0.66 Source: Economic & Planning Systems Residential Development Potentials The market analysis did not reveal any obvious trends indicating demand or market support for higher density housing in the station area in the short term (next five years). The station area is located in a primarily industrial area without any immediately adjacent residential context. Also, there is little market momentum in this location, as measured by new development activity in the market area. It will therefore be challenging to establish this location for residential development. However, in the future there may be a stronger focus on infill and redevelopment in Tarrant County; proximity to transit will increasingly be considered a factor in creating successful development. Figure 4-2: Area Apartment Projects 61
65 The site currently competes with other TOD locations as well as other infill development locations. While the access to transit is an amenity for this site, it is not currently enough of an amenity to overcome the local market conditions which do not strongly favor mixed use or medium to high density residential development. Residential development is therefore a long term (10+ year) development opportunity. Considering the site s surrounding industrial context and nearby major roadways, multifamily housing is a likely housing type that would be developed as part of a TOD. In the future, some portion of higher density for-sale housing such as townhomes or flats could be included in the project. The highest densities, potentially 40 to 60 units per acre, should be concentrated near the station platform within the ¼ mile walking distance. This achieves two purposes: it concentrates potential transit riders close to the platform, and it increases land values and overall revenues which will be needed to fund additional costs such as structured parking and demolition. Residential densities could taper to the periphery of the study area, and take advantage of planned trail and open space connections. Medium density townhomes (14 to 18 units per acre) and stacked flats (20 to units per acre) could also be part of a redevelopment plan. Office This section describes general office market trends in the Fort Worth and the Northeast Fort Worth submarket. This analysis provides a framework for determining office development potentials around the station. Dallas/Fort Worth Office Market The Metroplex office market is dominated by Dallas County with million square feet of inventory. By comparison, Tarrant County has 16.2 million square feet of office space. Most of the regional office activity is occurring in the northern parts of Tarrant County and in western Dallas County east of DFW airport. For example, the Las Colinas submarket east of DFW has 21 million square feet of inventory and captured 16 percent of the Metroplex market activity. The LBJ Freeway and Central Expressway submarkets are also highly competitive large submarkets, with 19.9 and 11.9 million square feet of inventory, respectively. These locations tend to attract larger corporate office users who seek attractive landscaped office park settings typically separated from industrial uses. Northeast Submarket The station area is located in the Northeast Fort Worth Submarket which is a small submarket with only 1.7 million square feet of inventory reported by published broker statistics (Table 4-4). The Northeast Submarket has not been competitive for higher profile or flagship corporate buildings. It is more attractive to back office and customer service tenants that seek lower cost locations. Despite being a small submarket, the Northeast Submarket has added 680,000 square feet in the last four years which is nearly 14 percent of total office growth in the Metroplex. Office Development Potentials The most likely office development opportunities in the Richland Hills station area include a small amount of office space, approximately 10,000 to 20,000 square feet, as part of a larger mixed use project. This space could be flexible to accommodate retail, service, or office users. It is also possible that a single office user desiring a location with direct transit access could be accommodated in the station area. The station area is not judged to be a competitive location for major office development at this time. Corporate office users look for more attractive locations separated from industrial uses and closer to upper market housing. The Las Colinas, Central Expressway, LBJ Freeway, and Dallas and Fort Worth Central Business Districts are currently the preferred locations for corporate office users. The vast areas of industrial uses in 62
66 the Richland Hills station area and in adjacent Fort Worth detract from the image of this location for major office development. Furthermore, the surrounding housing stock does not support the highly educated labor force that office developers and companies seek. Table 4-4: Metroplex Office Submarkets Inventory (Sq. Ft.), % of Inventory Submarket Change Change Dallas CBD 30,832,660 32,254,370 26,676,751 26,587,456 26,714,939-4,117, % Ft. Worth CBD 9,290,301 9,177,862 8,591,370 7,639,195 8,025,921-1,264, % CBD Subtotal 40,122,961 41,432,232 35,268,121 34,226,651 34,740,860-5,382, % Central Expressway 10,590,893 10,958,500 11,240,272 11,419,802 11,891,195 1,300, % East Dallas 2,554,854 3,089,850 4,155,122 4,363,303 4,729,102 2,174, % Far North Dallas 23,667,546 25,602,755 27,378,748 29,623,204 30,283,194 6,615, % LBJ Freeway 18,428,311 20,946,874 21,146,463 20,131,791 19,923,102 1,494, % Las Colinas 20,592,822 20,298,602 20,158,369 19,903,893 21,404, , % Lewisville/Denton 2,825,266 3,596,801 3,767,826 3,925,924 4,446,759 1,621, % Mid Cities 10,644,107 12,638,551 13,292,535 13,285,216 13,598,695 2,954, % North Fort Worth 1,596,856 1,389,228 2,032,529 2,256,663 2,342, , % NE Fort Worth 1,032,718 1,249,581 1,538,549 1,538,549 1,711, , % Preston Center 3,384,365 3,548,554 3,657,484 3,747,927 3,720, , % Richardson/Plano 10,646,831 12,204,087 11,797,163 12,262,982 12,905,801 2,258, % South Fort Worth 3,692,616 4,212,202 4,543,957 3,891,939 4,118, , % SW Dallas 1,055,951 1,260,141 1,429,785 1,387,868 1,428, , % Stemmons Freeway 8,225,591 9,182,277 10,081,731 9,269,085 9,587,295 1,361, % Uptown/Turtle Creek 8,423,472 8,313,557 8,329,392 8,259,781 8,279, , % Total 167,485, ,923, ,818, ,494, ,112,324 17,627, % Change Over Previous 12,438, , ,468 5,617,746 Source: CB Richard Ellis; Economic & Planning Systems 63
67 Retail The purpose of the retail analysis is to identify potential anchor uses for the station area. It is difficult to attract retail development to a mixed use project without an anchor unless there is a much higher level of existing urban density than is currently present in Richland Hills. A retail expenditure analysis for a three mile retail trade area around the station was conducted (Table 4-5). Expenditure potential is measured by multiplying the per capita income of the trade area by the trade area population. The expected population growth in the trade area in the next 10 to 15 years is over 17,000 people. This equates to $408 million in new personal income potential in the trade area by the year Consumer expenditure patterns by store type from the Census of Retail Trade for Texas are applied to the total personal income growth in the trade area. The result is household expenditure potential by store type for the trade area (Table 4-6). The expected growth in retail expenditure potential for the trade area between 2008 and 2020 is $122 million. Expenditure potential by store type is divided by average sales per square foot figures for each store type to estimate the demand for new retail space in the trade area. The analysis suggests that approximately 415,000 square feet of new retail space is supportable in a three mile radius over the next 10 to 15 years (Table 4-7). The majority of this demand will be north of SH-121, closer to the expected residential growth in North Richland Hills. Table 4-5: 3-Mile Trade Area Total Personal Income, Change Location # Ann. % 3 - Mile Radius Population 72,000 75,000 82,000 90,000 18, % Per Capita Income $22,717 $22,717 $22,717 $22, % Total Personal Income ($000s) $1,635,624 $1,703,775 $1,862,794 $2,044,530 $408, % Source: Claritas; Economic & Planning Systems 64
68 Table 4-6: 3-Mile Trade Area Resident Expenditure Potential, Resident Expenditure Potential Pct. Of Resident Expenditure Potential Growth Store Type TPI ($000s) ($000s) ($000s) ($000s) ($000s) ($000s) ($000s) Total Personal Income $1,635,624 $1,703,775 $1,862,794 $2,044,530 $227,170 $181,736 $408,906 Convenience Goods Supermarkets / Grocery 6.5% $106,341 $110,772 $121,111 $132,927 $14,770 $11,816 $26,585 Specialty Food Stores 0.1% $2,434 $2,536 $2,772 $3,043 $338 $270 $609 Convenience Stores 0.3% $4,696 $4,892 $5,348 $5,870 $652 $522 $1,174 Beer, Wine, & Liquor Stores 0.4% $6,413 $6,680 $7,303 $8,016 $891 $713 $1,603 Health and Personal Care 2.2% $35,801 $37,293 $40,774 $44,752 $4,972 $3,978 $8,950 Total Convenience Goods 9.5% $155,685 $162,172 $177,308 $194,607 $21,623 $17,298 $38,921 Shopper's Goods General Merchandise Department Stores & Other General Merch. 1.6% $25,834 $26,910 $29,422 $32,292 $3,588 $2,870 $6,458 Discount Dept. & Supercenters 1.6% $25,863 $26,941 $29,455 $32,329 $3,592 $2,874 $6,466 Total General Merchandise 3.2% $51,697 $53,851 $58,877 $64,621 $7,180 $5,744 $12,924 Clothing & Accessories 2.7% $43,349 $45,155 $49,369 $54,186 $6,021 $4,817 $10,837 Furniture & Home Furnishings 1.5% $24,377 $25,392 $27,762 $30,471 $3,386 $2,709 $6,094 Sporting Goods, Hobby, Book, & Music Stores 1.2% $19,056 $19,850 $21,702 $23,820 $2,647 $2,117 $4,764 Electronics & Appliances 1.4% $22,772 $23,721 $25,935 $28,465 $3,163 $2,530 $5,693 Miscellaneous Retail 1.3% $21,866 $22,778 $24,903 $27,333 $3,037 $2,430 $5,467 Total Shopper's Goods 11.2% $183,116 $190,746 $208,549 $228,895 $25,433 $20,346 $45,779 Eating and Drinking 5.5% $90,440 $94,208 $103,001 $113,050 $12,561 $10,049 $22,610 Building Material & Garden 3.7% $60,130 $62,636 $68,482 $75,163 $8,351 $6,681 $15,033 Total Retail Goods 29.9% $489,372 $509,762 $557,340 $611,715 $67,968 $54,375 $122,343 Source: 2002 Census of Retail Trade; Economic & Planning Systems 65
69 Table 4-7: 3-Mile Trade Area Retail Demand, Store Type Supportable Square Feet Sales Per SqFt Net New Sq. Ft. Convenience Goods Supermarkets / Grocery $ , , , ,300 66,400 Specialty Food Stores $350 7,000 7,200 7,900 8,700 1,700 Convenience Stores $300 15,700 16,300 17,800 19,600 3,900 Beer, Wine, & Liquor Stores $250 25,700 26,700 29,200 32,100 6,400 Health and Personal Care $ , , , ,000 35,800 Total Convenience Goods 457, , , , ,200 Shopper's Goods General Merchandise Department Stores & Other General Merch. $ , , , ,200 25,900 Discount Dept. & Supercenters $350 73,900 77,000 84,200 92,400 18,500 Total General Merchandise 177, , , ,600 44,400 Clothing & Accessories $ , , , ,800 30,900 Furniture & Home Furnishings $250 97, , , ,900 24,400 Sporting Goods, Hobby, Book, & Music Stores $300 63,500 66,200 72,300 79,400 15,900 Electronics & Appliances $250 91,100 94, , ,900 22,800 Miscellaneous Retail $250 87,500 91,100 99, ,300 21,800 Total Shopper's Goods 640, , , , ,200 Eating and Drinking $ , , , ,200 90,400 Building Material & Garden $ , , , ,500 50,100 Total Retail Goods 1,660,400 1,729,300 1,890,700 2,075, ,900 Source: 2002 Census of Retail Trade; Economic & Planning Systems 66

70 Retail Development Potentials While the expenditure forecast shows demand for new retail space, the estimated demand figures cannot be considered as a gross total. They must be analyzed by store category, as there is not enough demand in some categories to support new stores. The existing inventory of competitive retail development patterns must also be considered. Convenience Goods The forecast shows that there is a demand for 114,000 square feet of convenience goods space in the next 10 to 15 years (Table 4-7). This is enough demand to support a new supermarket. With an anchor such as a grocery store, it would be possible to attract enough ancillary retail and eating and drinking space to create a small town center development. There also appears to be a gap in the locations of grocery stores in the trade area (Figure 4-3). There are six major grocery stores within three miles of the station, but all of them are over two miles from the station. There also is lack of grocery stores on the east side of the trade area. However, the station location is not considered a good site for a grocery store. The site is disconnected from the residents that would be served by the grocery store by two major highways. Grocery store operators prefer locations on arterial corners in the direction of the drive home. Despite the gap in grocery store coverage, any growth in residential housing near the station will be small in comparison to the growth occurring near the edges of the trade area, which represents the majority of the demand for new convenience goods retail space. The majority of the existing trade area population is north of SH-121. The more immediate area east and west of Loop 820 and south of SH-121 is more sparsely populated. Therefore it is unlikely that a grocer could be attracted to the station site. Figure 4-3: Grocery Store Inventory, 3-Mile Radius 67
. The North East Mall in Hurst is 2.5 miles from the site and contains 1.")
71 Shopper s Goods The retail demand analysis doesn t show enough demand in any one shopper s goods category to support new stores in the trade area, especially when the existing competitive retail inventory is considered. There is a major concentration of regional large format retail within the trade area (Figure 4-4). The North East Mall in Hurst is 2.5 miles from the site and contains 1.7 million square feet of retail space. The mall was built 1971, but was recently renovated and has an outdoor lifestyle center adjacent to the enclosed portion of the mall. The drawing power of this agglomeration of retail along SH- 121 and Loop 820 will preclude any significant retail development in the station area. Eating and Drinking There will be an estimated demand for 86,400 square feet of new eating and drinking space within the 3-mile radius retail trade area over the next 10 to 15 years. There will be strong competition for this new space from the area around the North East Mall. New eating and drinking space will likely locate near any new residential development within the trade area. The station area has the potential to attract some of this space if enough residential density is created at the station. Figure 4-4: Big Box Inventory, 3-Mile Radius 68
72 Summary of Retail Development Potentials Based on the site s location and configuration, competitive retail development patterns, and the retail expenditure analysis, it has been determined that the station area is not a competitive location for any substantial amount of retail development. The maximum amount of retail space that could be expected in the station area would be approximately 30,000 square feet. More retail could be achieved at the site if an anchor could be found; however this is unlikely given the competitive retail node at Highway 121 and Loop 820. This would be ground floor mixed use space that could be configured to accommodate a variety of retail, service commercial, and small office uses. Ideally, it should be double loaded on opposite sides of a street as a gateway feature in the project, close to the station platform and parking to maximize visibility and pedestrian access. If combined with a small amount of office space, total ground floor mixed use space should be no more than approximately 40,000 square feet Redevelopment Strategy TOD Influence Area The market analysis focused on the planning area south of SH-121 bounded by Handley-Ederville Road on the east, McGuire Street on the south and SH-121 to the north/ northwest. Redevelopment in this area is more directly influenced by the station compared to the planning area north of SH-121. Walkability and access by alternative modes (bicycles and pedestrians, primarily) is a key component of TOD. However, SH-121 creates a barrier to pedestrian access from the north. Improving north-south street connections (other than Handley-Ederville Road) across SH-121 is not likely to be practical or cost effective. Therefore, the potential to expand the area of TOD influence north of SH-121 is limited. Redevelopment south of SH-121 can be oriented much closer to the station platform so that the station becomes integrated with the future neighborhood. Incentives This redevelopment plan is predicated on several long range planning assumptions such as a growing market for infill development close to transit, and a willingness on the part of the City to become an active partner in the redevelopment. Extensive land assembly will be needed in order to create functional development parcels. Incentives and financing tools such as tax increment financing, special improvement districts, and public-private partnerships or joint development will likely be needed to catalyze redevelopment. As funds become available, the City could consider purchasing properties adjacent to the station platform. The City could provide low cost land to a developer with repayment (a portion or full) tied to a development agreement or the sale of residential units. Lowering the cost of land assembly reduces some of the risk for a potential developer. Haltom City and North Richland Hills are being proactive in acquiring land in potential TOD locations. Placemaking In order to overcome the influence of the surrounding land use context, a large enough project must be created to project its own identity and establish the location as a place. The redevelopment and TOD planning efforts should address the entire planning area. In addition to concentrating density near the station platform, the redevelopment efforts should address other placemaking elements such as neighborhood parks, plazas, streetscaping and landscaping, and trail and open space connections. 69
73 4.3. Opportunities and Constraints The following is a summary narrative of opportunities and constraints in the station study area, based on interviews with stakeholders and discussion by citizens during the public meetings. Opportunities Tremendous regional access along SH-121 and Loop 820. Direct access to regional transit and major employment centers in downtown Fort Worth, downtown Dallas, and points between the two. The chance to take advantage of relatively inexpensive land values and a low-cost housing market to promote infill residential and supportive development around the station. For people who would live in this area and work in downtown Fort Worth, the study area is the last large redevelopment site inside Loop 820, before the traffic congestion begins. The future widening of SH-121 and the interchange at Handley-Ederville presents an opportunity to turn this underpass into a pedestrian gateway that better connects the areas north and south of the interchange. The proposed Veloweb is an opportunity to provide regional bicycle access to the study area and to enhance its desirability as a place in which to live. The open space to the southwest of the study area is a potential amenity for future development on the site. Even though the transmission line ROW is an obstacle to development, it also is an opportunity to provide open space internal to the site and a buffer between highway-oriented uses and residential uses to the west. The visibility of the site from SH-121 is an opportunity to advertise the site and its redevelopment. Parking demand from the TRE patrons, both current and future, will require creative thinking in developing new public and private parking facilities. Joint development opportunities should be explored. Constraints Existing zoning and existing land uses (heavy industrial) will make it difficult to market new uses to potential developers without significant incentives from the City. Major property owner(s) that may or may not be interested in selling off all or part of the property in the near future. A retail trade area that initially would not support significant new retail development other than transit-complementary retail uses (coffee, dry cleaning, day care). The physical barriers of SH-121 to the north, the city limits of Fort Worth to the east, and the floodplain/landfill to the west, limit the extent of development and continuity to other parts of the region including the residential areas to the immediate north. Large existing commercial, retail, and hotel development in the vicinity of North East Mall, which could limit the potential for significant new retail in the station area. 70

74 Figure 4-5: Opportunities and Constraints 71
75 4.4. Public Process and Stakeholder Issues Three public meetings were held on the project and its proposals: on September 16, 2008 at the Richland Hills Community Center; on November 3, 2008, at City Hall; and on March 31, 2009, at the Richland Hills Community Center. At the first meeting, the consultants introduced the project and presented the opportunities and constraints of the study area. At the second meeting, the consultants presented a preliminary concept for phased redevelopment of the south area and the bicycle trails that are planned for the region. At the third meeting, the consultants presented the final plan recommendations. In addition, a developer panel discussion was held on April 1, Several developers familiar with the area reviewed the plan alternatives and offered feedback. Discussion at the public meetings and with the developer panel was generally positive and focused on practical issues, as summarized below. September 16, 2008 Public Meeting How to balance parking needs? How to initiate mixed use development in an undeveloped area surrounded by commercial and warehouse areas? What types of project can serve as a seed project? Which comes first, business or residential? Don t we need business to attract residents? Industrial image is tough. What are strategies to work with industrial/warehouses owners to improve the appearance of their properties? Need to improve truck traffic routing. How long will it take to get redevelopment started? Could the Sam s Club property be used as bus stop/transit parking with shuttle service to the TRE? What have other communities done? We need businesses to generate revenues for the City. SH-121 is congested during the day. How many employees are within the study area? Need affordable (workforce housing) for immediate area employees. What would happen if single family homes in the residential area in the NW quadrant were updated with more bedrooms, baths (currently 2/1 mostly)? What kind of funding is available for this? On-street TRE parking in residential area is a potential problem. Concern about new sidewalks (on Handley-Ederville north of SH-121) affecting parking and privacy. Suggest fence or cinderblock privacy walls along the west ROW line of Handley-Ederville. Number 1 issue is parking need a parking garage for the TRE over the long term. November 3, 2008 Public Meeting How would semi-trucks back into the existing warehouse? Where will residents park? What about the need for a quiet zone in the TOD? Would noise be a problem? Ground vibration from trains can sometimes be felt from 1,000 feet away; dishes on the shelf rattle. Sidewalks are needed for walkability. 72
76 Some additional right of way acquisition may be needed on some streets in order to provide complete streets. In 20 years, would there be development to the East (in Fort Worth) and in the northeast study quadrant? What are Fort Worth s plans for the neighboring area? What will development in southwest quadrant mean for Richland Hills taxpayers? What about traffic impact of all those new residents? There is not even a grocery store in Richland Hills. The SH-121 intersection is totally congested during rush hours. Problem now is four sets of signals and TRE gates that are not synchronized. We need relief from the I-820 and SH-121 intersection. I-820 needs to be widened. Concerned about traffic congestion impact if Burns Rd. is realigned and retail is developed. Land is for sale at too high a price for strip retail. How will people be encouraged to walk, bike, shop locally and use the train? The City should construct a noise barrier wall along the west side of Handley-Ederville to protect residences from the effects of industrial traffic. Currently, auto drivers traveling north on Wesley cut through the defunct Sam s parking lot to get to the traffic signal at LaBadie and turn left onto Baker. The City should realign Wesley Way to intersect Baker Boulevard at Labadie Drive and maybe this would create the possibility of providing a curb cut to the property to the west and enable the redevelopment of the Sam s Club property. How many years to get it done? Does the City want to commit funds to help get things started? We need a timetable for development. Need to find out where The T is on realignment of Burns Road. What kind of partnership can the City create with developers of mixed use development? What was the time factor for the NCTCOG-funded Handley- Ederville sidewalks? Would like to see phased debt, an operational analysis, and a business plan that maintains revenue. How to facilitate redevelopment of the Sam s warehouse? Intersection of Baker and Wesley/Labadie needs to be addressed. March 31, 2009 Public Meeting How would you incorporate the existing warehouses into new development? What about the 80% of Richland Hills sales tax that is produced from the existing development? Can a TIF be created that would be a partnership between the City and private sector? Can stimulus money be used to start this project? Can the gateway be made big enough to see it when looking west from Loop 820? What about the Oncor trail and the Fossil Creek Trail? 73
77 April 1, 2009 Developer Panel Discussion A developer s workshop was held to preview the plan to a number of local developers and designers who specialize in TOD development to provide a 'peer review' of the ideas and concepts presented in the draft TOD report. Participants included: Jack Wierzenski, DART Director of TOD Paris Rutherford, Icon Partners Philip Poole, Townsite Art Lomenick, Trammell Crow, and Shelley Poticha, Executive Director, Reconnecting America Comments from the workshop fell into the following categories: The Market The future of this node is phenomenal over the long term (25 years or more). Richland Hills is midway between Downtown Fort Worth and CentrePort/DFW Airport, so it is well located in relation to major regional activity centers. (Currently 2/3 of the ridership is going to Dallas). There is a great long term opportunity for mixed use, but the transit service currently is not frequent enough or tied into a well-connected network of regional transit for there to be great development pressure for this area. Development is an issue of timing. In the long term there will be a mixed use market. In the short and medium term explore employment intensive uses including light manufacturing, green technology manufacturing, educational and/or health facilities, small business incubation and training activities that will attract larger numbers of people to the site. Then start to introduce mixed use elements such as retail, office and housing. Need to make sure that the Richland Hills station and associated development (and all stations along the TRE line) are unique and that stations do not cannibalize on each other in terms of market. Office development will be a strong local market as the area grows, and residential will not likely be a major driver for development (but is important for long-term sustainability). Need to ask the question: What is going to make someone live here? Needs a critical mass before it will be successful a hook. The future TRE express service could change the calculus for Richland Hills. There should be a consideration for the express service to stop in the City. The Plan The existing industrial buildings don t have ideal configurations, clearances or character to consider for adaptive reuse, so the best course is likely to tear them down. Consider moving city hall and other civic uses here to give the city an identity off a major regional highway and to provide a major civic focus for the area. In longer term, consider moving parking further from station so that riders pass through walkable development between station and parking. Visibility from Hwy 121 and Loop 820 will be important. The Oncor Trail is part of NCTCOG s regional Veloweb; and the Fossil Creek Trail under SH 121 is part of the City s trail plan. 74
78 Implementation Strategy Don t design buildings yet, rather o Land-bank. From a development point of view, it is advantageous to have land being held by a public entity that can carry the land cost and release it for development in a way that helps lower development costs. o Indentify financial tools. o Do development codes which include density and land use objectives after land-banking. Need to put all the tools in place so that the future of all sites is predictable. The value of Legacy Town Center is that strong development codes were in place. Overcome the municipal boundary with Fort Worth to include the entire TOD area. Work with Fort Worth to reinforce the TOD area in terms of use, density and connectivity Look at a 3-5 year plan that focuses on putting tools in place and attracting employment/training intensive uses. Putting zoning in place and showing a development plan will likely drive up property values. Public-Private Partnerships A lot of public investment will be required to make the area attractive to residents. Garland is spending $12m as catalyst to attract the Trammel Crow mixed use project TOD Master Plan Vision The Richland Hills Trinity Railway Express (TRE) Station is a major regional transportation hub for buses, trains, and automobiles. It serves an important role in the NCTCOG s transportation strategy to reduce automobile trips. While the station serves this function efficiently, it falls short of realizing its potential as a catalyst for community building. For it to become a more complete asset to the surrounding community, it requires not just a few improvements, but a more complete transformation into a mixed use town center that includes retail, offices, and residential dwelling units. At present it is a park-and-ride parking lot at the front of a large single-use industrial park. It is designed for moving people quickly and efficiently. The industrial park has seen better days and, with global trends in the industrial sector, is now losing tenants and declining physically. In recent years, new development has bypassed the station area and has gone to North Richland Hills, Hurst, and other nearby towns. This has occurred in spite of the station being the last major exit before east-bound traffic hits the congestion at the I-820/SH-121 interchange. The following sections describe a vision for the Richland Hills TRE transit station area in which residents of nearby townhomes and apartments can take their daily walk to the station, on the way stopping to drop off their dry-cleaning, fill a prescription, enjoy a cup of coffee, and read the morning paper. At the end of the day they could pick up a few groceries at the corner drugstore and take a bicycle ride on one of the connections to the Trinity Greenbelt and Veloweb regional trail system. The Richland Hills TRE station development will serve the surrounding neighborhoods as well. Currently, local residents must drive to SH-121 and Precinct Line to find many of the amenities that the station area could provide. In the future, many of those car trips will be replaced by shorter walking or bicycling trips to the Richland Hills station. The new transit 75
79 oriented development around the station will add value to the southwest Richland Hills neighborhoods north of SH-121 transforming what used to be a utilitarian necessity into a true community asset TOD Master Plan Principles Based on discussions with staff and officials from NCTCOG, the City of Richland Hills, and The T, and with local stakeholders, several basic principles and factors guided the development of this plan. Objectives Create a sustainable community, a mixed use neighborhood with a sense of place o o o o Retain portions of the existing warehouse development and use it to create a unique ambiance and character Line retrofitted warehouses with new uses that provide a street wall to frame the public space and support active street life Take advantage of views of the site from SH-121, while at the same time buffering the interior of the site from the impacts of train traffic Create a plan that has a viable and self contained first phase that includes an opportunity to create a parking structure that is shared by The T and new development o Continue successful build-out in subsequent phases of development Create gateways at key locations o Handley-Ederville and Trinity Boulevard o Handley-Ederville and McQuire/Midway o McQuire/Midway and Austin Road Create a network of civic open spaces, parks, and plazas o Maintain and embellish the transmission line right-ofway primarily as open space o Connect to regional bike and pedestrian trails Realign Burns to Trinity intersection o Improved regional access o Improved connectivity o Rename Burns to Trinity (is a better place name) o Possibly incorporate Trinity in the name of the development Add cross streets for improved connectivity o Improves internal connectivity o Creates a way to have phases that are self contained Renovate streets as complete streets o Street trees o Bicycle lanes o Detached sidewalks o Parking o Pedestrian lighting, street furniture, etc. Improve connectivity at the perimeter of and within the study area o Improve regional access for bicycles and automobiles o Improve north-south pedestrian access underneath SH-121 (planned and in process) 76
80 Land Uses to Include in the Plan Transit Facilities Retail, office and lodging businesses, along with a possible conference center For-sale townhouses and rental housing Open space and outdoor gathering places, i.e., parks or squares, or plazas Other uses, such as daycare, cultural/educational, community theater, library, trail head, and/or bicycle facilities Replacement of existing TRE surface parking, with possible shared parking in a joint-development parking structure Accessibility Preferences Burns Street is realigned to meet Trinity Boulevard where it intersects Handley-Ederville Road. Burns Street is realigned with Austin Street at McQuire Street/Midway Road. Belton Street is realigned to intersect Handley-Ederville at Sand Street. 77
81 5. TOD Plan Alternatives The development potential for the TRE station area is based more on an analysis of the site s surrounding land use context than on the market conditions in the station area. As previously noted, the market analysis did not identify any clear indications of near-term development pressures that would facilitate redevelopment of the station area. The possible development scenarios described in this section therefore represent planning visions of the station area s potential North Study Area Two new commercial infill opportunities exist behind the McDonald s restaurant at the northeast corner of Handley- Ederville Road and the SH-121 Service Road North. There also are new infill building opportunities on the west side of Handley-Edervillle, north of the existing residential uses, on the two vacant parcels. On-street bicycle accommodation in the North Study Area would include bikeway improvements along Wesley and Dogwood Park, then south along Handley-Ederville beneath the SH-121 underpass. The floodplain west of the shopping center redevelopment provides a long-term north-south trail opportunity. Another east-west trail opportunity follows a mid-block utility easement between Whitehall Street and Tower Streets, linking the floodplain and the shopping center development to the trail running north-south in the powerline easement west of Handley Ederville Road. Additional streetscape improvements could enhance Tower Street s attractiveness as a pedestrian linkage. 78
82 Figure 5-1: North Study Area TOD Concept 79


83 5.2. South Study Area Scenario 1 Description Incorporate existing buildings, as possible This scheme focuses on redevelopment and reuse of existing buildings now used for warehousing and distribution. It is strongly recommended that developers consider ways in which existing structures can be integrated into the architecture of new development so that the juxtaposition of the old and new can create unexpected residential, commercial and live/work opportunities. The reuse of the warehouses represents an opportunity to develop a funky ambience in the midst of a post World War II suburban landscape that could set Richland Hills apart in the metroplex as a unique and viable destination. This scheme has six principal parts. Going from east to west, they include: Retail mixed use along the Handley-Ederville Road frontage; Transmission line/open space/trail corridor; Small pocket parks and neighborhood open spaces; Upgrades to the existing street grid with many existing warehouses retained for live/work uses and parking, and new infill townhouses constructed to fill gaps in the street wall; New narrow mews, or skinny street, in the abandoned railroad ROW spur between Burns and Belton Streets; and Clusters of new townhouses at the west end of the redevelopment area and along McQuire Street/Midway Road. The area immediately around the TRE station platform presents the opportunity to develop innovative joint-use facilities that will benefit both transit riders and area employees and residents. To begin, Burns Street is shown realigned to Trinity Boulevard for improved connectivity and access eastwest across Handley-Ederville Road. This realignment also improves traffic flow and connectivity to the TRE station. Figure 5-2: Station Area, South Study Area Scenario 1 80
84 The existing surface parking facility immediately south of the TRE platform would remain relatively intact for the foreseeable future as this is the primary parking facility for TRE patrons. In addition, the existing surface parking at the northeast corner of Handley-Ederville Road and SH-121 would remain in place until market conditions would allow redevelopment in the area. The vacant parcel at the northwest corner of Burns and Handley-Ederville, just to the south of the easternmost parking lot, would be available to The T or the City to purchase for surface parking expansion in the near term. However, as market conditions allow, The T would be in a position to work with a developer on a shared-use parking structure with retail on the first floor and one to two floors of office or residential above, wrapped around a proposed future parking structure. This high-visibility gateway mixed use facility would be a signature entrance to the TOD area due to its location at the corner of Handley-Ederville and SH-121. It could include small retail facilities such as coffee shops, dry cleaners, day care, or other activities to benefit transit users and local employees and residents. In addition, it could be used by The T for a passenger information and ticket purchasing facility, or the City could include a police substation Figure 5-3: TRE Station and New Development, looking west 81

85 or other public facility in the structure. Mixed uses would benefit The T because it could sell the development rights for the property, and the City would benefit from added sales tax revenues derived from any commercial activities that take place in the facility. Continuing west from the station on Burns, the street straightens out to follow the current street ROW alignment. Marking this transition and forming an entry to the neighborhood, there are opportunities for signature landmarks on both sides of the street. On the north side of Burns and directly west of the TRE station, there is a good location for a ground-floor neighborhood retail/restaurant space with commercial office and taller architecture features above, with a landmark clock tower at the southeast corner serving local residents, employees, and transit users alike. On the south side of Burns, a façade retrofit could be applied to the existing structure to transform the building to act as an entry focal point for traffic approaching from east on Trinity Boulevard. Farther west, two large existing warehouses sit back from the north side of Burns. The plan shows developing 2-story residential townhouses in the gap between the warehouses and the street. The back half of these two warehouses is used as parking for residents, businesses and visitors; the front 25 feet is a row of live-work studios. There is an alley between the townhouses and the live-work studios to provide access to garages under the townhouses. At key intersections along Burns, there are opportunities for neighborhood ground-floor retail spaces (4,000 square feet). In the gap between the two warehouses, there are townhouses wrapped around the sides of the warehouses and along the north property line, creating a small park space with townhouses on three sides. A similar arrangement is shown farther to the west, at the west end of the west warehouse. The other smaller warehouses are approached in the same spirit: residential infill development and parking lots are placed between buildings in ways that maintain the continuity of the street wall. Figure 5-4: Burns Street, South Study Area Scenario 1 The abandoned railroad spur ROW located half way between Burns and Belton is transformed into a narrow mews (skinny street) reminiscent of a British back street or lane, traditionally lined with carriage house dwellings. This narrow street would be just wide enough for two cars passing and a bike lane (no on-street parking). 82
86 New townhouses are shown along McQuire Street/Midway Road in clusters wrapped around central open spaces. At the west edge of the redevelopment area, the area on both sides of Big Fossil creek, between Midway and the railroad tracks, is public open space. Bordering the open space to the east is a cluster of 3-story residential flats, with one 4-story structure anchoring the west end of the straight portion of Burns, before the street curves and continues south. At McQuire/Midway Burns Street is realigned to connect with Austin Road. This realignment allows possible future residential development on Austin (south of McQuire/Midway) to be connected to the larger redevelopment and the TRE station. Figure 5-5: McQuire Street/Midway Road, South Study Area Scenario 1 Throughout the redevelopment area, on-street bikeways provide multimodal connections and generous streetscaping create a pleasant pedestrian realm. An off-street trail is planned along the railroad ROW on the north edge of the redevelopment area, providing a connection from the future trail along Big Fossil Creek to the Richland Hills TRE station and the planned trail continuing northeast in the railroad ROW. Another north-south off-street trail is provided in the power line corridor, west of Handley-Ederville Road. This trail would continue south to connect to the Trinity River trail system, and north, through the improved SH-121 interchange and along the power line corridor, through the entire city of Richland Hills. 83
87 Figure 5-6: South Study Area Concept Scenario 1: Incorporate Existing Buildings, as possible 84


; and")

88 Scenario 2 Description Blank Slate remove existing buildings and redevelop the entire site This scheme assumes more of a blank slate approach to redevelopment, with the removal of most existing buildings and a larger number of modifications to the street grid. This approach provides additional control and predictability for developers, yet runs the risk of the redevelopment being overly uniform and less innovative. This scheme has six principal parts. Going from east to west, they include: Retail mixed use along the Handley-Ederville Road frontage; Transmission line/open space/trail corridor; Large neighborhood park; Wide boulevards with recreational medians on Burns and Belton Streets, with a new skinny street running along the abandoned railroad ROW between them; New street grid with blocks of residential development punctuated by neighborhood retail opportunities at building entrances (located at the termini of a series of north-south streets that connect the north tier of blocks back to McQuire Street/Midway Road); and Townhouses at the west end of the redevelopment area arranged around a central open space, and a neighborhood park. The west side of Handley-Ederville is lined with commercial development, with retail lining parking structures, one of which could be jointly developed and used by a developer and The T. In this blank slate scenario a small surface parking lot for emergency vehicles and a small number of handicapped spaces is retained close to the TRE station platforms. Most of Figure 5-7: Station Area, South Study Area Scenario 2 the parking is assumed in joint-use parking structures, including on land The T now owns and proposes to buy at the corner of Handley-Ederville and SH-121. Directly behind and to the west of the commercial buildings is the Oncor transmission line open space and trail connection 85
89 that is augmented with small adjoining areas of open space that carry through the rest of the development. Marking the transition from the curved Burns Street/Trinity Boulevard realignment to the straight portion of Burns, there are opportunities for taller, landmark buildings and architectural features to signal entries into the neighborhood. Farther west, Burns Street has a generously wide landscaped median so that it functions as a grand outdoor space and jogging trail and is the linear town green in the middle of the north half of the neighborhood. It should be at least 100 in width, with minimal interruptions, and have a perimeter running path paved with crushed granite. Belton Street also has a long, wide median that similarly functions as the outdoor living room where recreation and exercise take place in the south half of the neighborhood. In contrast, the abandoned railroad spur ROW located half way between Burns and Belton is transformed into a skinny street, just wide enough to accommodate two cars passing and a bike lane (and no parking). Burns and Belton Streets both function as long roundabouts/one-way couplets. Building entrances on the northerly side of Burns are lined up with the centerlines of the northsouth cross streets. Several new north-south streets have been added to provide a high level of connectivity within the development. Figure 5-8: Burns and Belton Streets, South Study Area Scenario 2 86
90 Figure 5-9: TRE Station and new development, view from SH-121 looking south and east The blocks between Burns Street and SH-121 form a near solid wall that blocks railroad and highway noise from reaching the interior of the development. Parking is located along the backs of these blocks so that, if a parking structure is warranted, it can be used to block railroad and highway noise. Anchoring the west end of the straight portion of Burns, before the street bends and continues south, there is an opportunity for a signature retail and commercial office building. 87
91 Block sizes in the middle section of the redevelopment are approximately 340 by 240. These blocks are sized to accommodate 2-story courtyard residential buildings or more dense residential development wrapping interior parking structures, if desired. A large neighborhood park anchors the railroad spur ROW and Belton corridors at McQuire/Midway. West of the park, at the northeast corner of Burns and McQuire/Midway, there is an opportunity for residential flats in a larger 4-story structure. Across Burns Street to the west, there is an opportunity for a 1-story freestanding neighborhood retail building (12,000 square feet). Farther west, between McQuire/Midway and SH- 121, is a cluster of townhomes wrapped around a central open space. Garages line the north edge to block traffic and railroad noise. In this scenario, every opportunity to realign internal streets to align with streets at the perimeter is taken: Burns is connected to Trinity at Handley-Ederville, Burns is connected to Austin at McQuire/Midway, and Belton is connected to Sand Street at Handley-Ederville. As with Scenario 1, the added benefit of realigning Burns at McQuire/Midway, is that someday it may connect to possible future residential development on Austin south of McQuire/Midway. As in Scenario 1, the area on both sides of Big Fossil creek, between Midway and the railroad tracks, is public open space. Off-street trails, on-street bikeways, and generous streetscaping create attractive multimodal alternatives for moving within and through the redevelopment area. Figure 5-10: McQuire Street/Midway Road, South Study Area Scenario 2 88
92 Figure 5-11: South Study Area Concept Scenario 2: Blank Slate remove existing buildings and redevelop the entire site 89

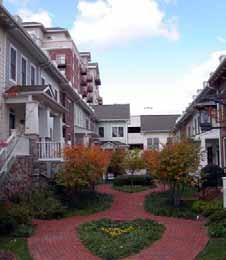

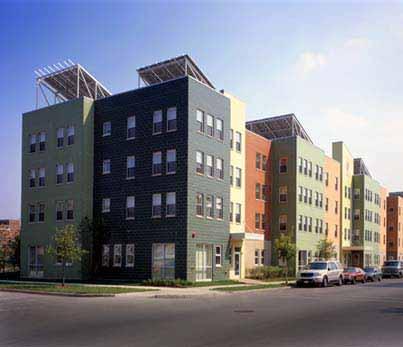


93 5.3. Associative Examples Residential Figure 5-12: Residential Examples 90


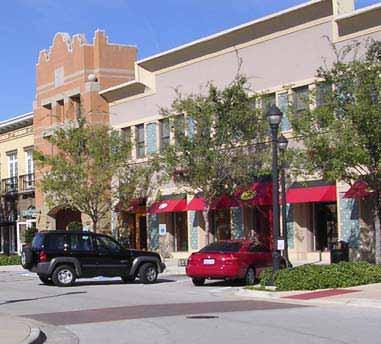
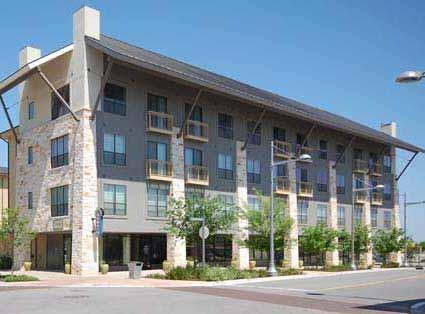
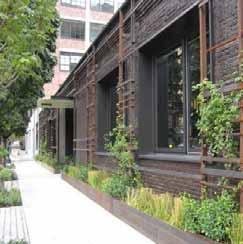
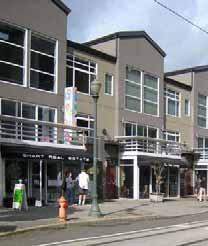
94 Retail and Office Figure 5-13: Retail and Office Examples 91


95 Retail and Parking Figure 5-14: Retail and Parking Examples Cover & Associative Example Photos: URS and Philip Poole 92
96 6. Implementation Following sections outline key considerations for successful implementation of the vision presented in this TOD plan: phasing, economic and fiscal impacts, future infrastructure and zoning, roles and responsibilities, and barriers to TOD Phasing Plan Both scenarios for the redevelopment of the south portion of the TOD study area can be built out in a similar phased approach. Initial development (5-10 years) would occur in the immediate vicinity of the station, along Handley-Ederville Road near the SH-121 interchange and the realigned portion of Burns Street. Mid-term development (10-15 years) would spread to the south, along Handley-Ederville Road to McQuire Street/Midway Road and on both sides of Belton Street. Long-term development (15-20 years) would spread west, between SH-121 and McQuire Street/Midway Road to the Big Fossil Creek corridor. The scenarios differ in terms of possible residential product types depicted and the intensity of commercial and retail development. Scenario 1 includes more 2-story townhouses and live/work units, which are often well-suited for ownership housing. In contrast, Scenario 2 depicts a greater number of flats and 2-story courtyard residential buildings, which are often an attractive configuration for rental housing. Scenario 2 also shows a greater intensity of commercial and retail development along Handley-Ederville Road, with three 2-story buildings wrapping parking structures. The following diagrams and tables illustrate the phasing sequences and provide estimated development totals for each scenario. Figure 6-1: South Scenario 1 Phasing Plan Table 6-1: South Scenario 1 Development Totals by Phase Scenario 1 Phase 1 Phase 2 Phase 3 Total Product Type # Units or Sq. Ft. # Units or Sq. Ft. # Units or Sq. Ft. # Units or Sq. Ft. Residential Townhomes Condo (Live/work, Reuse Res) Flats (Rental) Subtotal Commercial Retail 99,000 55,000 13, ,600 Office 83, , ,440 Subtotal 182,000 55,000 39, ,040 93
97 Figure 6-2: South Scenario 2 Phasing Plan Table 6-2: South Scenario 2 Development Totals by Phase Scenario 2 Phase 1 Phase 2 Phase 3 Total # Units or # Units or # Units or # Units or Product Type Sq. Ft. Sq. Ft. Sq. Ft. Sq. Ft. Residential Townhomes Condo (Live/work) Flats and Courtyard Res (Rental) Subtotal Commercial Retail 70, ,000 36, ,000 Office 70, ,000 24, ,000 Subtotal 140, ,000 60, ,000 Figure 6-3: North Development Area Plan Table 6-3: North Development Totals by Phase North Development Area Product Type # Rooms Product Type Sq. Ft. Lodging Commercial Hotel 180 Retail 135,000 Commercial/Office Infill 50,000 Subtotal (# rooms) 180 Subtotal (sq. ft.) 185,000 94
98 In the north portion of the TOD study area, opportunities for redevelopment are more limited. The citizen-proposed hotel and neighborhood shopping center redevelopment proposed along Baker Boulevard could occur in conjunction with, or following completion of, the possible reconfiguration of the Wesley Way/Labadie Drive at the Baker Boulevard intersection. Infill development along Handley-Ederville Road and in the southern portion of the existing business park is assumed to occur on a site-by-site basis, as the market dictates Infrastructure Costs For the purposes of this study, the project team compiled preliminary order-of-magnitude estimates of infrastructure development costs for the north and south study areas, based on interviews with engineers in the area who are familiar with current costs of development infrastructure. The estimated unit costs (linear feet of roadway) are considered to be generic and will have to be refined once street sections are defined following a thorough traffic analysis and urban design based on a redevelopment proposal by a developer. The project team expects that these concept-level estimates will be refined as the TOD plans are carried forward. The south study area cost estimate is based on Scenario 1; costs for Scenario 2 are assumed to be similar. Table 6-4: South Study Area Infrastructure Estimate South Study Area Length (ft) Cost/ lin.ft. Cost Phase 1 Burns St realignment west of Handley-Ederville 700 $800 $560,000 Burns St upgrade west of realignment portion 1100 $400 $440,000 Belton St upgrade 500 $500 $250,000 RR ROW street upgrade 650 $300 $195,000 New Street connecting Burns & Belton 700 $600 $420,000 Subtotal $1,865,000 Phase 2 Belton St upgrade 1500 $400 $600,000 RR ROW street upgrade (Mews) 1200 $300 $360,000 New Street connecting RR ROW & Belton 340 $600 $204,000 New Street Connecting Belton & Midway 800 $600 $480,000 Subtotal $1,644,000 Phase 3 Burns upgrade 1600 $400 $640,000 RR ROW street upgrade (Mews) 850 $300 $255,000 New Street connecting Burns & RR ROW 300 $700 $210,000 Subtotal $1,105,000 Total $4,614,000 Table 6-5: North Study Area Infrastructure Estimate North Study Area Length (ft) Cost/ lin.ft. Cost Wesley Way realignment at Baker/Labadie 700 $800 $560,000 Total $560,000 95
99 6.3. Economic and Fiscal Impacts Public Financing in Texas Texas Urban Renewal Authority (URA) statutes (Texas Statutes Tax Code, Chapter 311) allow municipalities to create URAs to borrow against future property and sales tax revenues in designated zones to help provide financing for redevelopment projects. The financing municipality can designate a contiguous geographic area as a reinvestment zone where certain conditions exist that substantially arrest or impair the sound growth of the municipality. Municipalities can only use public financing where private development is unable on its own to redevelop the designated zone. The municipality can request the use of all property taxes generated within the zone, within all taxing districts, with the consent of each taxing district. The amount of public monies that could be used to finance redevelopment is the difference between the property tax revenue collected the year the reinvestment zone is created and the total potential property tax generated once the zone is redeveloped. Market Assumptions The potential tax revenue a reinvestment district can generate is estimated based on possible market values in the proposed redevelopment plan. The proposed development scenarios for the City of Richland Hills TOD area include a mixture of forsale and for-rent multifamily residential units, office space, supporting retail space, and a limited service hotel. In order to determine the market values for these proposed uses, assumptions on market values for single units must be determined. The market assumptions created for this project are based on rental rates and sales prices in northeast Tarrant County. New development pricing and resales were considered. To determine the market values for apartments, office and retail space, and hotel rooms, a potential net operating income (NOI) for each use was determined using market rents, a vacancy factor, and an income capitalization rate of 9 percent (Table 6-6). Table 6-6: Richland Hills Market Assumptions Rent Value Use Per Sq. Ft. Per Unit Residential Townhomes --- $175,000 Condos --- $150,000 Flats/Apartments 1 $1.10 $103,000 Office 2 $17.00 $150/sq. ft. Retail/Commercial 2 $14.00 $125/sq. ft. Hotel 3 $52.14 $203,000 1 Estimated using market rent, 1,000 sq. ft. average unit size, 30% operating expenses and vacancy, and a 9% capitalization rate. 2 Estimated using market rent, 10% vacancy, and a 9% capitalization rate. 3 Estimated at a $100 average daily rate, 50% for vacancy and operating expenses, and a 9% capitalization rate. Source: Economic & Planning Systems 96
100 South Area Development Scenarios 1 and 2 for the TOD study area south of the TRE station are three-phased programs. Scenario 1 shows a total buildout of 626 residential units, 167,600 square feet of retail space, and 108,440 square feet of office space. Using market assumptions (Table 6-6), the estimated market value of this scenario is $133 million (Table 6-7). Scenario 2 shows a total buildout of approximately 608 residential units, 241,000 square feet of retail space, and 229,000 square feet of office space. The estimated market value of this scenario is $134 million (Table 6-8). 97
101 Table 6-7: Development Area Program Scenario 1 Table 6-8: Development Area Program Scenario 2 Product Type # Units or Sq. Ft. Value per Unit Total Market Value Product Type # Units/ Sq. Ft. Value per Unit Total Market Value Phase 1 Residential Townhomes 69 $175,000 $12,075,000 Condo (Live/work, Reuse Res) 55 $150,000 $8,250,000 Flats (Rental) 0 $103,000 $0 Subtotal 124 $20,325,000 Commercial Retail 99,000 $125 $12,375,000 Office 83,000 $150 $12,450,000 Subtotal 182,000 $24,825,000 Total Phase 1 $45,150,000 Phase 2 Residential Townhomes 123 $175,000 $21,525,000 Condo (Live/work, Reuse Res) 27 $150,000 $4,050,000 Flats (Rental) 0 $103,000 $0 Subtotal 150 $25,575,000 Commercial Retail 55,000 $125 $6,875,000 Office 0 $150 $0 Subtotal 55,000 $6,875,000 Total Phase 2 $32,450,000 Phase 1 Residential Townhomes 0 $175,000 $0 Condo (Live/work, Reuse Res) 38 $150,000 $5,700,000 Flats and Courtyard Res (Rental) 94 $103,000 $9,682,000 Subtotal 132 $15,382,000 Commercial Retail 70,000 $125 $8,750,000 Office 70,000 $150 $10,500,000 Subtotal 140,000 $19,250,000 Total Phase 1 $34,632,000 Phase 2 Residential Townhomes 0 $175,000 $0 Condo (Live/work, Reuse Res) 0 $150,000 $0 Flats and Courtyard Res (Rental) 188 $103,000 $19,364,000 Subtotal 188 $19,364,000 Commercial Retail 135,000 $125 $16,875,000 Office 135,000 $150 $20,250,000 Subtotal 270,000 $37,125,000 Total Phase 2 $56,489,000 Phase 3 Residential Townhomes 120 $175,000 $21,000,000 Condo (Live/work, Reuse Res) 102 $150,000 $15,300,000 Flats (Rental) 130 $103,000 $13,390,000 Subtotal 352 $49,690,000 Commercial Retail 13,600 $125 $1,700,000 Office 25,440 $150 $3,816,000 Subtotal 39,040 $5,516,000 Total Phase 3 $55,206,000 Phase 3 Residential Townhomes 35 $175,000 $6,125,000 Condo (Live/work, Reuse Res) 61 $150,000 $9,150,000 Flats and Courtyard Res (Rental) 192 $103,000 $19,776,000 Subtotal 288 $35,051,000 Commercial Retail 36,000 $125 $4,500,000 Office 24,000 $150 $3,600,000 Subtotal 60,000 $8,100,000 Total Phase 3 $43,151,000 Scenario 1 - Total Value $132,806,000 Source: URS; Economic & Planning Systems Scenario 2 - Total Value $134,272,000 Source: URS; Economic & Planning Systems 98
102 North Area Development The study area north of the TRE station is a smaller infill or redevelopment area separated from the core station area. The development program for this area is therefore less than what can be supported in the core station area. The proposed north area development program includes 135,000 square feet of retail space, a 180-room limited service hotel, and several small commercial infill buildings totaling 50,000 square feet. The public financing possibilities and needs are less for the north study area because of the smaller market value of $60 million and fewer infrastructure needs. Table 6-9: North Development Parcels Program Product Type # Units/ Sq. Ft. Value per Unit Market Value Property tax is estimated by multiplying estimated market values by the City s tax rate of The potential total annual property tax generated by each development scenario is approximately $600,000, using conservative market value estimates (Table 6-10). The development plan for the north parcels generates approximately $275,000 of property tax per year at buildout. Table 6-10: Total Potential Property Tax Potential Scenario Market Value Tax Rate 1 Property Tax (per year) Scenario 1 Phase 1 $45,150, $207,329 Phase 2 $32,450, $149,010 Phase 3 $55,206, $253,506 Total Potential Property Tax $132,806,000 $609,845 North Development Area Retail 135,000 $125 $16,875,000 Commercial Infill 50,000 $125 $6,250,000 Hotel 180 $203,000 $36,540,000 Total $59,665,000 Source: URS; Economic & Planning Systems Scenario 2 Phase 1 $34,632, $159,030 Phase 2 $56,489, $259,397 Phase 3 $43,151, $198,149 Total Potential Property Tax $134,272,000 $616,577 Planning Area Property Tax Estimates Property tax revenue for the south planning area generated by the two development scenarios at buildout is estimated for planning and implementation considerations. At this point, extensive land assembly and infrastructure improvements are needed to catalyze redevelopment, meaning that the timing of redevelopment is uncertain. These estimates should therefore be seen as a tool to estimate the level of development density needed to finance public improvements such as structured parking, additional utilities, public spaces, or roadway improvements. North Development Area Retail 2 $16,875, $77,490 Commercial Infill $6,250, $28,700 Hotel $36,540, $167,792 Total Potential Property Tax $59,665,000 $273,982 1 Property Tax Rate for the City of Richland Hills Source: Economic & Planning Systems 99
103 Public Financing Options To determine the amount of yearly property tax revenue that can be used towards public financing or tax increment financing (TIF), the amount of tax generated by the existing development before redevelopment (i.e., base) is subtracted from the total potential tax generated at buildout. For the parcels in the southern planning area, the yearly property tax generated in 2008 was approximately $70,000 (Table 6-11). By subtracting the $70,000 base property tax from the estimated revenues at buildout, the difference is approximately $550,000 in property tax increment. The incremental new property tax represents the revenue that could be used to support financing, such as a small bond issue. The $550,000 per year in revenue would support $4 to $5 million in bond proceeds. Tax increment revenues could also be used to reimburse a developer for public improvements eligible for public financing. The City could also seek to include the tax base generated by other taxing agencies in the reinvestment area. The tax revenues generated by the other tax agencies would increase the amount of revenue. The other taxing agencies would have to agree to forego the new property tax generated from redevelopment and allow the revenue to be used for public financing. Tarrant County collects the largest amount of property tax from the parcels in the reinvestment area. The use of sales and use tax generated from the redevelopment could also be used for public financing. These revenues were not estimated given the uncertainty of the timing and character of commercial redevelopment. Other options for the City include using property tax revenues to pay back a developer for public infrastructure created to facilitate redevelopment, or it could choose to not charge the additional property tax to the developer/owner of the redeveloped parcels as a way to entice development. Table 6-11: Potential Property Tax Comparison Potential Scenario Market Value Tax Rate 1 Property Tax (per year) Scenario 1 Existing Conditions $14,847, $68,178 Plan Buildout $132,806, $609,845 Difference (Proposed - Current) $541,667 Scenario 2 Existing Conditions $14,847, $68,178 Plan Buildout $134,272, $616,577 Difference (Proposed - Current) $548,399 1 Property Tax Rate for the City of Richland Hills Source: City of Richland Hills; Economic & Planning Systems 6.4. Financing Strategies A comprehensive catalog of potential financing mechanisms and assistance programs was compiled for this TOD plan. Some of the most promising implementation mechanisms for TOD at the Richland Hills TRE station are described below. (Additional reference details such as contact details and specific information resources can be found in Appendix B.) Public Improvement District (PID) or Municipal Management District (MMD) State law (Chapter 372, Local Government Code) allows any city to levy and collect special assessments on property within the city. A Public Improvement District may be formed to perform any of the following improvements: 100
104 Water, wastewater, health and sanitation, or drainage improvements; Street and sidewalk improvements; Mass transit improvements; Parking improvements; Library improvements; Park, recreation, and cultural improvements; Landscaping and other aesthetic improvements; Art installation; Creation of pedestrian malls; Similar improvements; Supplemental safety services for the improvement of the district, including public safety and security services; and/or Supplemental business-related services for the improvement of the district. A Municipal Management District is a relatively new economic development tool that allows commercial property owners to enhance a defined business area. The district has the power to levy an ad valorem property tax for wastewater, drainage, road, or mass transit improvements that are located inside and outside the district. (Chapter 375, Local Government Code). Tax Increment Financing (TIF) and Tax Increment Reinvestment Zone (TIRZ) Authorized under Chapter 311 of the Texas Tax Code, political subdivisions may create TIF Reinvestment Zones in order to use the increased tax value of land from a proposed development toward financing of the public improvements in the reinvestment zone. TIF Districts assist in financing development of unimproved or blighted land by dedicating the real estate property tax increment to be generated by the built project to a TIF Fund for payment of the principal and interest on TIF bonds. Under a TIF, the property owner pays taxes on the full value of the property and the taxing entities pay into the TIF Fund the taxes attributed to the added value of the property due to the new development. TIF Bonds may be issued for a maximum of 20 years and may be used to pay for public improvements associated with a development including but not limited to parking, infrastructure, land acquisition, and utilities. A TIF Reinvestment Zone must meet certain criteria for designation, including substandard/blighted conditions or open area due to obsolete platting or deterioration, or otherwise result from a petition of 50% of property owners in the district. The municipality establishes the TIF Reinvestment Zone and other taxing entities approve agreements to participate in the TIF District and set forth the percentage of tax increment they are willing to dedicate to the TIF Fund, up to a maximum of 100%. A TIF Board, consisting of 9 to 15 members, is established with representatives from the participating taxing entities and other representatives as set forth in the TIF statute. Tarrant County TIF Districts include the Baker Boulevard TIF District in Richland Hills, established in 2009, the Downtown Euless TIF District, the Grapevine Mills TIF District, the Southlake TIF District and the Downtown Fort Worth TIF District. Other TIF Districts under consideration include the Fort Worth South TIF District. NCTCOG Brownfields Revolving Loan Fund The NCTCOG Transportation Department s Sustainable Development Program has received a $3 million EPA Brownfields Revolving Loan Fund grant from which the Sustainable Development Program will provide loans to local governments to clean up sites that would serve as potential 101
105 transit-oriented developments, though other sites will be considered. A limited amount of funds may be available for subgrants. NCTCOG Sustainable Development Funding Program The purpose of the North Central Texas Council of Governments (NCTCOG) funding program is to reduce auto emissions and support sustainable communities in the North Central Texas region. The program is designed to foster growth and development in and around historic downtowns and Main Streets, infill areas, and passenger rail lines and stations. Eligible projects include construction projects that provide public infrastructure in the public right-of-way and can be used to support private vertical development, such as pedestrian amenities, landscaping, intersection improvements, lighting, street construction, traffic signalization, etc., and planning projects such as market, housing, and economic analyses, transit station planning, Transit Oriented Development (TOD) Planning (subdivision regulations, creation of new code/zoning regulations, master planning, updates to pedestrian and/or bicycle plans, etc.), among others. Through the Sustainable Development Funding Program, the NCTCOG has awarded approximately $80 million to local governments for infrastructure improvements, landbanking, and planning studies. The upcoming 2009 Call for Projects opened April 1, 2009 and grant applications are due October 2, There will be $40 million available for infrastructure and $1M available for planning studies Zoning for TOD The existing commercial and industrial zone districts covering the TOD study area expressly prohibit most residential land uses. These zone districts also require a 25-foot minimum Front Yard and a 15-foot minimum Side Yard (Street Side). General station area design principles mixed uses, an engaging street wall, careful siting of parking, compactness, third places, minding the details, and others described earlier are not supported by the existing Richland Hills zoning. New transit-supportive, form-based zoning is necessary to allow the redevelopment envisioned in this TOD plan. Appropriate transit-supportive, form-based zoning removes regulatory barriers to TOD and redevelopment within the study area. Zoning for a mix of land uses, higher densities and building heights, careful placement of parking, and a strong street wall, provides assurance to potential developers as to the City s vision for the future of the station area. Transitsupportive, form-based zoning more effectively accommodates complex projects and removes some of the uncertainty and costs otherwise born by developers in areas where entitlements are not already in place. Many cities use hybrid zoning codes that combine key features of form-based zoning codes with conventional zoning requirements. For the study area, the City of Richland Hills should consider incorporating the following key provisions into its zoning code: Use: Allow (or encourage) mixed use (residential + retail and/or office) Front setback: Build-to line at front (zero front yard setback) or minimum of 50% at the front property line Maximum height: 60 feet Maximum FAR: None, consider a minimum FAR of 2.0 Minimum glazed area, primary street frontage: 30 to 60% Parking requirements: o Multifamily: 1 to 1.5 cars per dwelling unit; or 2 cars per 3 DU s; or 1 to 2.5 cars per dwelling unit depending on the number of bedrooms 102
106 o Live/Work: 1 car per dwelling unit o Retail: 1 car per 250 to 400 SF; or 1 car per 500 SF, first floor; and 1 car per 1000 SF above first floor, or above 2000 SF o Properties closest to the TRE station: reduced parking requirements o Shared parking: reduced parking requirements Diversity: Offer incentives for diversity of housing in terms of price, type, affordability, etc. A district-wide urban design framework plan that identifies how buildings are to address the street, for example, key building locations that are required to respond to the street layout, i.e. buildings that occupy focal point locations and are required to have retail on the first floor and have architectural façades that are symmetrical or otherwise focus the space of the street. For the south TOD study area in particular, new zoning standards must: Encourage higher-intensity mixed land uses. High-quality TOD cannot be achieved in Richland Hills under existing use-based zone districts. A mix of land uses higher density residential, employment, basic goods and services, restaurants and retail (with emphasis on locally owned businesses) as well as careful attention to the public realm and the siting of buildings, are essential to fostering a distinctive destination. A diverse use mix helps insure activity beyond traditional business hours. Support the importance of Burns Street as an attractive multimodal neighborhood Main Street. Burns should have moderate traffic speeds, shared lane markings for bicyclists, on-street parking, and generous sidewalks and streetscaping. Provide a neighborhood entry at the east end of Burns Street. With the new connection to Trinity Boulevard, Burns Street will be reinforced as the neighborhood s front door, and appropriate attention must be paid to gateway buildings west of Handley-Ederville Road at the point where Burns straightens. Taller landmark structures with unique architectural detailing and active street-level retail will serve as an entry focal point. Anchor the west end of Burns Street. The long, straight portion of Burns Street must be anchored by a taller, attractive building at the west end that serves as focal point before the street curves and continues south. Allow narrow alleys, mews and skinny streets. Alleys are appropriate in residential areas and between existing warehouses and new townhouses. A mews or skinny street in proposed for the abandoned railroad spur ROW between Burns and Belton Streets. Narrow street cross sections (wide enough for vehicles to pass, but with no onstreet parking) are important for maintaining a intimate residential character and for reinforcing a special sense of place that clearly contrasts with the surrounding large-scale post-wwii suburban landscape. Utilize build-to lines, rather than setbacks. Specifying buildto lines rather than minimum setbacks will assure consistent street walls throughout the redevelopment area. New and redeveloped buildings should generally be placed at the sidewalk to give streets and blocks a comfortable sense of enclosure. Also important is a consistent visual texture for the street wall, created by complementary arrangements of floor lines, window and doors openings and other features. Assure compact blocks. Blocks within the redevelopment area should be no more than a five-minute walk around their perimeters (about 1,320 feet). This helps to promote a compact, walkable neighborhood with good interconnectedness and variety. 103
107 Carefully manage parking. Parking should be on-street and/or at the center of blocks, using liner buildings to mask the lots or structures. When impossible to mask surface lot parking, lots should be behind or to the side of buildings to minimize disruption of the street wall. Provide flexibility. The city s regulatory framework should be flexible enough to allow the unfolding of a diverse and stimulus-rich environment over time. Within the neighborhood it is important to encourage diverse and detailed architectural facades; preserve key views; allow engaging signage and sidewalk commerce; and provide attractive furnishings, colorful plantings, public art and other points of detail Infrastructures Issues Automobile Parking and TOD Parking issues always become prevalent in any passenger rail or TOD planning effort primarily due to the concern caused within existing neighborhoods about parking demands and conflicts around the station or development. In the case of the Richland Hills TOD project, the City has a unique opportunity to start from scratch; since no mixed use development currently exists, the evolution of a parking plan to serve the needs of both the transit station and the surrounding development can be handled in a carefully phased and coordinated manner. Extensive research exists related to parking management practices in general and parking policies around TOD projects in particular. One of the best summaries of parking management around TOD is contained in The New Transit Town: Best Practices in Transit-Oriented Development (2004). That publication lists several suggested strategies for managing parking around TOD, including: Configure parking so it does not dominate the site by orienting parking away from pedestrian paths, behind buildings, or in structures or underground, which frees up developable land that might otherwise have been required for parking. Charge for parking where appropriate to encourage use of other modes and provide a revenue source. Reduce off-street parking requirements since most zoning codes do not reflect the true nature of TOD and its need for reduced parking. Off-street parking can often be reduced by up to 30 percent in TOD projects, but changes in parking requirements should be based on the specific needs of the local development. Other strategies in this area include establishing maximum parking requirements (instead of minimums), requiring landscaped reserves that can be converted to parking in the future, and formation of a transportation management organization that can work with local businesses and serve as a broker for underutilized parking facilities. Protect neighborhoods by developing parking plans for those areas most affected by transit or TOD parking through the use of residential parking permits and time restrictions and development of overflow parking contingency plans during peak periods or special events. Utilize on-street parking to reduce off-street parking needs, provide short-term access to local businesses, and provide traffic calming improvements. Unbundle parking from the sale or lease of residential or commercial units; this way, tenants or buyers pay for only what they need, and any excess parking can be sold or leased to others. Create parking districts in larger areas around TODs with municipal parking facilities funded by in-lieu fees and annual maintenance fees. 104
108 Recent research has shown that parking demand at TOD projects is often significantly less than that required by traditional development. In one study of BART stations in the San Francisco Bay area, researchers noted that residential units at TODs had an average of 1.66 people and 1.24 vehicles per household, compared with 2.4 people and 1.64 vehicles for households located in the same census tract but not at the TOD site. 64 A more recent study showed that TOD projects have significantly lower per-unit auto trip generation (in some cases, up to 50% fewer daily auto trips) than non- TOD developments; by implication, this means that TOD projects can result in lowered parking requirements than those found in traditional developments. 65 The recently-adopted City of Dallas Form Districts ordinance makes the following allowances for parking reductions within one-half mile of a rail transit station: 66 A parking reduction of two percent for properties located within a 1,321- to 2,640-foot walking distance of a rail transit station. A parking reduction of 15 percent for properties located within a 601- to 1,320-foot walking distance of a rail transit station. A parking reduction of 25 percent for properties located within a 600-foot walking distance of a rail transit station. Parking reductions help to reduce development costs. Structured parking is expensive (roughly three times as expensive as surface parking) and generally not done unless land values are so high that it is more feasible to build a 64 Robert Cervero, California s Transit Village Movement, Journal of Public Transportation, Vol. 1, No. 1, Center for Urban Transportation Research, Effects of TOD on Housing, Parking, and Travel, Transit Cooperative Research Program Report 128, City of Dallas Form District ordinance, Sec. 51A Parking Reductions, p structure than to acquire the amount of land required for the same amount of parking on the surface. Surface parking runs about $5,000 per car space, while a car space in a parking structure runs between $15,000 (in a three- or four-story structure and $20,000 (in a two-story structure). (Underground parking runs $30,000 to $40,000 per car space.) Land values in Richland Hills are not high enough at this time to make structured parking feasible as an alternative to surface parking. To get around this, another strategy involves the use of shared parking with joint development. Many transit agencies work with local developers or municipalities to build a joint-use facility where a certain portion is devoted to free or paid transit parking and the remainder is available for commercial or residential purposes. In addition, these facilities can be focused on the specific temporal needs of each use. For example, in Broomfield, Colorado, the Regional Transportation District built a shared-use parking facility next to a new events center that provides parking for transit patrons during weekdays but is available for paid parking for events center attendees at nights and on weekends. In the Dallas area, DART s TOD Guidelines aim to help the public envision the development opportunities within DART station areas. 67 The guidelines explain that parking at suburban stations may consist of surface lots or structured parking shared by uses. At the beginning phases of transitoriented development at stations, DART recommends allowing surface parking at slightly higher ratios, then gradually reducing rates to maximum allowances as development intensifies. The ultimate goal is to shift into structured parking in station areas to allow intensive use of land. To accomplish this, the DART guidelines state that park-andride parking should be reasonably convenient to the station, 67 DART. Transit-Oriented Development (TOD) Guidelines, August


109 but should not preclude immediately adjacent transit-oriented development. Careful platform and infrastructure placement and orientation, in anticipation of reallocating surface parking spaces, allows the eventual incorporation of transit oriented uses. Bicycle Parking Throughout the TOD study area short-term bicycle parking, for 2 hours or less, should be provided in highly visible locations within 50 feet of all major building entrances. Racks must support the frame of the bike, not just a wheel. Racks should not obstruct pedestrian traffic flow. They should be anchored in the pavement. Figure 6-4: Inverted U- Rack Example The inverted U-Rack supports two bicycles, is low cost and preferred by cyclists. They can be installed in groups where additional parking is needed. Secure long-term bike parking should be provided for transit users, residents, and employees. This may be a bike locker or covered parking in a secure area for multiple users either indoors or out. Bikes and Transit A transit stop normally draws riders within a 10-minute (halfmile) walking distance. At a modest riding speed a cyclist can travel three or four times that distance in the same time, increasing the transit catchment area about ten-fold. Bicycle access tends to be particularly important in suburban areas where densities are moderate and destinations are dispersed. 68 Bicycles that are clean are permitted on Trinity Railway Express (TRE) vehicles when space is available. There are no time constraints on when bicycles may be brought on board as long as they do not impact the safety of other passengers. Cyclists may not block the operator s cab when it is occupied. TRE reserves the right to relocate or remove any bicycle that obstructs or has a negative impact on its operations or passengers. The T allows bikes inside buses as space allows if the bus bike racks are full or if there is no bike rack. Figure 6-5: Bike Locker Example Bike Lockers at transit are usually provided through a rental contract. Figure 6-6: Covered Bike Parking Example Covered bike racks provide sun/rain protection. 68 Victoria Transport Policy Institute, TDM Encyclopedia, Bike/Transit Integration, (accessed 1/5/09). 106
110 Bike parking racks are available at the Richland Hills TRE station; however, the T does not have bike lockers. As facilities for non-motorized access to the TRE station are developed, it is recommended that a passenger survey be taken to determine whether customers either currently access the station by bike or would do so in the future, and what type of bike parking would meet their needs. Some bicyclists, especially those with expensive bicycles, may be interested in renting a bike locker when they have no need to continue their journey by bike after disembarking from the train. DART, for example, currently has bike lockers which are available for rent at $15 for three months or for $45 for a year. Bicyclists with low-cost bicycles are usually comfortable locking them to racks; however, racks should be covered to protect them from rain and searing sun. Pedestrian/Bicycle Connections Regional Trails are intended to serve intercity routes and NCTCOG has established guidelines for these Veloweb trails. 69 While every section of the Veloweb may not achieve all the elements described below, each is an important consideration in providing favorable bikeways for utilitarian trips. NCTCOG recommends that local governments conduct planning to ensure connectivity between the Veloweb and roadways or trails in their jurisdictions. Primary design considerations of the Veloweb include: Minimum 12-foot width for heavily traveled multiuse trails; 16- to 24-foot Veloweb sections may be warranted along portions of the Veloweb experiencing high peak pedestrian volumes due to the proximity to transit stations, sporting events, and/or other major venues; 69 NCTCOG. Mobility 2030: The Metropolitan Transportation Plan for the Dallas-Fort Worth Area, 2007, Chapter 15. Pedestrian/Bicycle System., page 174. Veloweb sections should be sized with a pedestrian level of service analysis to meet those demands; Markings and travel speed signs to meet minimum safety standards for bicycle traffic; Long-lasting impervious surface; Grade separated crossing of roadways with significant traffic flows; A design speed of 25 miles per hour; Traffic circle intersections with minor roadways where conflicts are a concern; Few, if any, signalized or stop sign intersections; Easy access from roadways, particularly on-street bikeways; and Easy access to common trip destinations. The 2003 City of Richland Hills Trail System Master Plan depicts 10 foot wide trails, an appropriate width for most suburban trails. On-Street Bikeways Richland Hill s Trail System Master Plan shows on street trail route connectors (on-street bikeways) along residential streets, recommending only signage indicating these on-street routes are intended to serve as trail connectors. This study proposes the use of on-street bike lanes (with lane markings that define the dedicated lane) within the TOD Plan study area, where space allows. Where there is not sufficient space for on-street bike lanes, this study recommends shared lane markings (SLMs). While use of SLMs is currently categorized as experimental by FHWA and final approval for use is anticipated in 2009, projects are currently being implemented. The SLM is to be positioned within the lane where the bicyclist is anticipated to ride. With on-street 107
, is recommended to be placed in proximity to the SLMs to alert motorists to expect bicyclists, and to educate bicyclists where")
111 parking, it is placed a minimum of 11 from the curb, or centered in a standard 12 lane where no parking is allowed. Another currently experimental sign, the Bikes May Use Full Lane (R4-11), is recommended to be placed in proximity to the SLMs to alert motorists to expect bicyclists, and to educate bicyclists where to most safely position themselves within the lane. Figure 6-7: Shared Lane Marking and R-4-11 Signage Other potential on-street bikeway improvement tools should be considered as part of a future citywide integrated nonmotorized mobility and access plan. Possible improvements include bike lanes, the shared lane marking, bike routes with or without on-street markings, cycle paths, and side paths. The interface between off-road and on-road bikeways and sidewalks will be critical to a safe and seamless system. The Trail System Master Plan also shows SH-183 (Baker Boulevard) as an on-street bikeway. NCTCOG s 2004 traffic count data show Baker as having more than 25,000 vehicles per day west of Loop 820. It is a 4-lane road with shoulders which could currently be signed for bicyclists, at least between Wesley Way, a newly proposed bikeway in this study, and Crites Street/Allena Street to the planned Fossil Creek Trail. The Trail System Master Plan shows the Baker on-street route extending to Dreeben on the west, however the Baker/SH-26 interchange split east of Dreeben eliminates westbound access to Dreeben. We recommend moving the on-street route from Dreeben to Crites, where both eastbound and westbound cyclists can access a connector street to the planned Fossil Creek Trail (Figure 2-10 and Figure 2-11). Other recommendations include: Place the trail indicated along the south side of SH 121 to allow for equestrians. Consider modifications to the Veloweb alignment to relate to the TOD area connections. Update the Citywide Trail Plan prior to initiating implementation. This should include a study of the feasibility of connecting these trails to others. The planned trails that the consultant team thought feasible are shown the on the Regional Linkages Map and Station Area Linkages Map (Figure 2-10 and Figure 2-11). Add an off-street trail spur to Rosebud Park to the adopted trail plan. 108


112 Floodplain, Rail, and Utility Easement Trails Figure 6-8: Floodplain Trail Example Concrete trails are most durable and require the least maintenance, especially in floodplains. Figure 6-9: Rail Trail Example This rail trail sits between the highway and Cottonbelt railroad in Grapevine, Texas Roles and Responsibilities Successful TOD projects require a collaboration of all participants primarily the local government, the transit agency, and real estate developers. All three must form a partnership to allow TOD projects to overcome the regulatory, market, and other issues that usually make TOD implementation difficult. One of the best guides to participant responsibilities was developed by the Regional Transportation District in Denver; that agency s Strategic Plan for Transit Oriented Development, approved by that agency s Board of Directors in That document noted: Each party plays a unique role: the transit agency as the infrastructure transit builder, local governments as the development regulator, and real estate developers as the actual builders and financiers of development. Other participants in the process include the regional MPO, chambers of commerce, and local community stakeholders, but the primary responsibility for TOD implementation rests on those three primary entities. The key responsibilities of local government, developers, and transit agencies are outlined on the following page (Table 6-12). Figure 6-10: Utility Easement Trail Example ONCOR allows pedestrian access on their right of way, but nothing of a permanent nature such as drainage, etc. ONCOR criteria require a 25 foot setback from poles. 109
North Central Texas Council of Governments
 North Central Texas Council of Governments 2 3 4 5 6 7 8 Types of Development/Development Monitoring Key Principles of City Planning Housing Employment Land Use/Building Codes/Zoning Design/Public Amenities
Chapter 5: Testing the Vision. Where is residential growth most likely to occur in the District? Chapter 5: Testing the Vision
 Chapter 5: Testing the Vision The East Anchorage Vision, and the subsequent strategies and actions set forth by the Plan are not merely conceptual. They are based on critical analyses that considered how
Bylaw No , being "Official Community Plan Bylaw, 2016" Schedule "A" DRAFT
 Bylaw No. 2600-2016, being "Official Community Plan Bylaw, 2016" Schedule "A" Urban Structure + Growth Plan Urban Structure Land use and growth management are among the most powerful policy tools at the
Downtown Plano. Creating a Transit Village
 Downtown Plano Creating a Transit Village Residential Growth Pattern Downtown Plano Plano 1891 Plano 1971 Downtown Plano Downtown Plano Avenue J Avenue J Summary of Problems Eroding economic position Physical
APPENDIX D: DEFINITIONS
 D APPENDIX D: DEFINITIONS Terms used throughout the 2040 Comprehensive Plan should be interpreted using the definitions provided in this appendix. For interpretation of any term not defined, defer to the
When the Plan is not Enough
 When the Plan is not Enough Christine Maguire, AICP, EDFP Redevelopment Manager Planning & Community Development 1 Rail~Volution 2012 When the Plan is Not Enough: Garland, TX 16 October 2012 About the
Chapter 10: Implementation
 Chapter 10: Introduction Once the Comprehensive Plan has been adopted by the City of Oakdale, the City can begin to implement the goals and strategies to make this vision a reality. This chapter will set
City of Westminster
 http://daniels.du.edu/faculty-research/franklin-l-burns-schoolof-real-estate-and-construction-management/events/ City of Westminster DU Executive Real Estate Round Table August 2016 City of Westminster
6 NE 130TH STREET STATION TOD POTENTIAL
 6 NE 130TH STREET STATION TOD POTENTIAL Key Findings TOD potential for the NE 130th Street Station is limited, primarily because of the predominant single-family development pattern in this area. The two
Draft for Public Review. The Market and Octavia Neighborhood Plan
 Draft for Public Review The Market and Octavia Neighborhood Plan San Francisco Planning Department As Part of the Better Neighborhoods Program December 00 . Housing People OBJECTIVE.1 MIXED-USE RESIDENTIAL
2015 Downtown Parking Study
 2015 Downtown Parking Study City of Linden Genesee County, Michigan November 2015 Prepared by: City of Linden Downtown Development Authority 132 E. Broad Street Linden, MI 48451 www.lindenmi.us Table of
MEMORANDUM Main Concepts
 MEMORANDUM DATE February 5, 2016 TO FROM SUBJECT David Bischoff City of Gilroy Bruce Brubaker and Seung Hong, PlaceWorks Draft Alternative Land Use and Circulation Scenarios This memorandum summarizes
Planning Justification Report
 Planning Justification Report Kellogg s Lands City of London E&E McLaughlin Ltd. June 14, 2017 Zelinka Priamo Ltd. Page i TABLE OF CONTENTS Page No. 1.0 2.0 2.1 2.2 3.0 4.0 5.0 5.1 5.2 5.3 5.4 5.5 5.6
Downtown Development Focus Area: I. Existing Conditions
 Downtown Development Focus Area: I. Existing Conditions The Downtown Development Focus Area is situated along Route 1, south of the train tracks, except for the existing Unilever property. It extends west
Department of Planning & Zoning
 Department of Planning & Zoning M E M O R A N D U M TO: Brian Wismer, Planning Commission Chairman FROM: Bill Johnston, City Planner SUBJECT: DATE: Tuesday, 1 September 2015 FINDINGS Mr. Floyd Anderson,
Generic Environmental Impact Statement. Build-Out Analysis. City of Buffalo, New York. Prepared by:
 Generic Environmental Impact Statement Build-Out Analysis City of Buffalo, New York 2015 Prepared by: TABLE OF CONTENTS 1.0 INTRODUCTION 1 2.0 METHODOLOGY 2 3.0 EXISTING LAND USE 3 4.0 EXISTING ZONING
CITY OF COLD SPRING ORDINANCE NO. 304
 CITY OF COLD SPRING ORDINANCE NO. 304 AN ORDINANCE AMENDING THE CITY CODE OF COLD SPRING BY ADDING SECTIONS 555 AND 510 PERTAINING TO PAYMENT-IN-LIEU-OF-PARKING THE CITY COUNCIL OF THE CITY OF COLD SPRING,
Poughkeepsie City Center Revitalization Plan
 Purpose and Need Purpose Increase job and educational opportunities for all residents Maximize fiscal productivity of downtown land uses Diversify retail mix Eliminate surface and building vacancies Create
Broadway Corridor Framework Plan Pearl District Business Association November 10, 2015
 Broadway Corridor Framework Plan Pearl District Business Association November 10, 2015 Opportunity Central City Growth 2035 ~21,500 new households ~42,500 new jobs USPS Site Redevelopment ~2,400 new households
PLANNING AND REGULATING HOUSING OPTIONS FOR CHANGING DEMOGRAPHICS
 PLANNING AND REGULATING HOUSING OPTIONS FOR CHANGING DEMOGRAPHICS New Partners for Smart Growth Conference February 2017 HOUSING MARKETS Significant increase in rental housing Offset robust single-family
Jasper 115 Street DC2 Urban Design Brief
 Jasper 115 Street DC2 Urban Design Brief Greenlong Construction Ltd. Stantec Consulting Ltd. 2017 Overview The proposed rezoning application supports the development of two mixed-use high-rise buildings
LITTLE MOUNTAIN ADJACENT AREA REZONING POLICY
 LITTLE MOUNTAIN ADJACENT AREA REZONING POLICY JANUARY 2013 CONTENTS 1.0 INTENT & PRINCIPLES...1 2.0 APPLICATION...2 3.0 HOUSING TYPES, HEIGHT & DENSITY POLICIES...3 3.1 LOW TO MID-RISE APARTMENT POLICIES...4
Land Use. Land Use Categories. Chart 5.1. Nepeuskun Existing Land Use Inventory. Overview
 Land Use State Comprehensive Planning Requirements for this Chapter A compilation of objectives, policies, goals, maps and programs to guide the future development and redevelopment of public and private
CPC CA 3 SUMMARY
 CPC-2009-3955-CA 2 CONTENTS Summary Staff Report Conclusion 3 4 7 Appendix A: Draft Ordinance A-1 Attachments: 1. Land Use Findings 2. Environmental Clearance 1-1 2-1 CPC-2009-3955-CA 3 SUMMARY Since its
Enlightened Urbanism: A Model for Development of Vacant Buildings Downtown
 Enlightened Urbanism: A Model for Development of Vacant Buildings Downtown Amanda Phelps What is needed is not a new utopia... but rather a blueprint for a better reality. 1 O.M. Ungers San Antonio is
North Hills Apartments
 North Hills Apartments 5000-5032 CLOYCE CT N o r t h R i c h l a n d H i l l s, T X 7 6 1 8 0 NORTH RICHLAND HILLS, TX 76180 1 O F F E R I N G M E M O R A N D U M Exclusively Listed By Danny McQuaid Associate
The New Starts Grant and Affordable Housing A Roadmap for Austin s Project Connect
 The New Starts Grant and Affordable Housing A Roadmap for Austin s Project Connect Created for Housing Works by the Entrepreneurship and Community Development Clinic at the University of Texas School of
7. IMPLEMENTATION STRATEGIES
 7. IMPLEMENTATION STRATEGIES A. GENERAL APPROACH FOR IMPLEMENTATION Implementing the plan will engage many players, including the Municipality of Anchorage (MOA), the Government Hill Community Council,
Upcoming Apartment Projects with No On-Site Parking Frequently Asked Questions June 2012
 Upcoming Apartment Projects with No On-Site Parking Frequently Asked Questions June 2012 Recent proposals to construct apartment buildings with no on-site parking along many of Portland s commercial streets
1.0 INTRODUCTION PURPOSE OF THE CIP VISION LEGISLATIVE AUTHORITY Municipal Act Planning Act...
 April 2017 TABLE OF CONTENTS 1.0 INTRODUCTION... 1 2.0 PURPOSE OF THE CIP... 1 3.0 VISION... 1 4.0 COMMUNITY IMPROVEMENT PROJECT AREA..3 5.0 LEGISLATIVE AUTHORITY... 3 5.1 Municipal Act... 3 5.2 Planning
PARRAMORE OAKS FRAMEWORK PLANNED DEVELOPMENT
 PARRAMORE OAKS FRAMEWORK PLANNED DEVELOPMENT Presented by Mark Cechman, AICP Paul S. Lewis, FAICP Review Process Pre- Application meeting August 11, 2016 Attended by representatives of: City Planning Transportation
DRAFT FOR DISCUSSION PURPOSES ONLY. Port Credit Local Area Plan Built Form Guidelines and Standards DRAFT For Discussion Purposes
 Port Credit Local Area Plan Built Form Guidelines and Standards DRAFT For Discussion Purposes 1 Local Area Plan - Project Alignment Overview Directions Report, October 2008 (General Summary Of Selected
From Policy to Reality
 From Policy to Reality Updated ^ Model Ordinances for Sustainable Development 2000 Environmental Quality Board 2008 Minnesota Pollution Control Agency Funded by a Minnesota Pollution Control Agency Sustainable
Salem HNA and EOA Advisory Committee Meeting #6
 Salem HNA and EOA Advisory Committee Meeting #6 Residential Land Policies Employment Land Policies Policy Discussions with the Committee Outcome of today s meeting Direction from this Committee on proposed
Provide a diversity of housing types, responsive to household size, income and age needs.
 8 The City of San Mateo is a highly desirable place to live. Housing costs are comparably high. For these reasons, there is a strong and growing need for affordable housing. This chapter addresses the
PRELIMINARY PROJECT PLAN AND REINVESTMENT ZONE FINANCING PLAN FOR PROPOSED TAX INCREMENT REINVESTMENT ZONE NO. 1, CITY OF OAK RIDGE NORTH
 PRELIMINARY PROJECT PLAN AND REINVESTMENT ZONE FINANCING PLAN FOR PROPOSED TAX INCREMENT REINVESTMENT ZONE NO. 1, CITY OF OAK RIDGE NORTH DECEMBER 15, 2014 TABLE OF CONTENTS 1. Overview 1.1 Background...
Eastern Corridor Planning Area Workshop No April 2016
 Eastern Corridor Planning Area Workshop No. 3 28 April 2016 Agenda 1. Visual Aids 2. Guiding Principles 3. Preferred Alternative Concept Plan 4. Fiscal Impact Analysis 5. Findings 6. Recommendations 7.
Land Use Planning Analysis. Phase 2 Drayton Valley Annexation Proposal
 Land Use Planning Analysis Phase 2 Drayton Valley Annexation Proposal Prepared for Town of Drayton Valley Prepared by Mackenzie Associates Consulting Group Limited March, 2011 TABLE OF CONTENTS 1.0 INTRODUCTION...
CITY OF FARMERSVILLE CITIZEN ADVISORY COMMITTEE AGENDA November 17, :30 P.M. 1, COUNCIL CHAMBERS, CITY HALL
 I. PRELIMINARY MATTERS CITY OF FARMERSVILLE CITIZEN ADVISORY COMMITTEE AGENDA November 17, 2014 6:30 P.M. 1, COUNCIL CHAMBERS, CITY HALL Call to Order, Roll Call, Prayer and Pledge of Allegiance Welcome
Community & Infrastructure Services Committee
 REPORT TO: DATE OF MEETING: September 12, 2016 Community & Infrastructure Services Committee SUBMITTED BY: Alain Pinard, Director of Planning, 519-741-2200 ext. 7319 PREPARED BY: Natalie Goss, Senior Planner,
DRAFT Plan Incentives. Part A: Basic Discount
 DRAFT 2030 Plan Incentives July 26, 2006 Part A: Basic Discount In order for a development to be eligible for any 2030 Land Resource Management Plan Discounts it must be located in the Urban Corridor and
Technical Report 7.1 MODEL REPORT AND PARKING SCENARIOS. May 2016 PARKING MATTERS. Savannah GA Parking Concepts PARKING MATTERS
 Savannah GA Parking Concepts PARKING MATTERS A Strategic Plan for Parking + Mobility in Savannah PARKING MATTERS Technical Report 7.1 MODEL REPORT AND PARKING SCENARIOS Prepared for the Chatham County-Savannah
Detroit Neighborhood Housing Markets
 Detroit Neighborhood Housing Markets Market Study 2016 In 2016, Capital Impact s Detroit Program worked with local and national experts to determine the residential market demand across income levels for
ARTICLE 3: Zone Districts
 ARTICLE 3: Zone Districts... 3-1 17.3.1: General...3-1 17.3.1.1: Purpose and Intent... 3-1 17.3.2: Districts and Maps...3-1 17.3.2.1: Applicability... 3-1 17.3.2.2: Creation of Districts... 3-1 17.3.2.3:
density framework ILLUSTRATION 3: DENSITY (4:1 FSR) EXPRESSED THROUGH BUILT FORM Example 1
 EXPRESSED THROUGH BUILT FORM Example 1") density framework 4 ILLUSTRATION 3: DENSITY (4:1 FSR) EXPRESSED THROUGH BUILT FORM INTRODUCTION The Downtown Core Area contains a broad range of building forms within its relatively compact area. These
density framework 4 ILLUSTRATION 3: DENSITY (4:1 FSR) EXPRESSED THROUGH BUILT FORM INTRODUCTION The Downtown Core Area contains a broad range of building forms within its relatively compact area. These
Appendix A: Guide to Zoning Categories Prince George's County, Maryland
 Appendix A: Guide to Zoning Categories Prince George's County, Maryland RESIDENTIAL ZONES 1 Updated November 2010 R-O-S: Reserved Open Space - Provides for permanent maintenance of certain areas of land
Residential Intensification in Established Neighbourhoods Study (RIENS)
") Residential Intensification in Established Neighbourhoods Study (RIENS) EXECUTIVE SUMMARY In December 2015, the City of Kitchener retained Meridian Planning Consultants to undertake the Residential Intensification
Residential Intensification in Established Neighbourhoods Study (RIENS) EXECUTIVE SUMMARY In December 2015, the City of Kitchener retained Meridian Planning Consultants to undertake the Residential Intensification
Sherwood Forest (Trinity) Housing Corporation. Urban Design Brief
 Housing Corporation. Urban Design Brief") Sherwood Forest (Trinity) Housing Corporation Sherwood Place Affordable Housing Apartments Trinity Presbyterian Church Orchard Park Nursery School 590 Gainsborough Road, London Urban Design Brief REVISED
Sherwood Forest (Trinity) Housing Corporation Sherwood Place Affordable Housing Apartments Trinity Presbyterian Church Orchard Park Nursery School 590 Gainsborough Road, London Urban Design Brief REVISED
LAKE MERRITT STATION AREA PLAN
 LAKE MERRITT STATION AREA PLAN Emerging Plan Open House Summary October 2011 2 1 Introduction The City of Oakland, Bay Area Rapid Transit (BART), and the Peralta Community College District, through a grant
Table of Contents. Concept Plan Overview. Statement of Compliance with Design Guidelines. Statement of Compliance with Comprehensive Plan
 Table of Contents Concept Plan Overview Statement of Compliance with Design Guidelines Statement of Compliance with Comprehensive Plan Developer s Program Market Objective Benefit to Local Businesses Benefit
CASE SUMMARY Conditional District Zoning Modification Planning Commission January 9, 2013 CD M1212
 CASE SUMMARY Conditional District Zoning Modification Planning Commission January 9, 2013 CD-3-109-M1212 Jim Diepenbrock, Associate Planner jim.diepenbrock@wilmingtonnc.gov 910-341-3257 Staff recommendation
forwarddallas! Development Code Amendments Approach Quality of Life Committee Briefing June 11, 2007
 1 forwarddallas! Development Code Amendments Approach Quality of Life Committee Briefing June 11, 2007 2 Project Background The forwarddallas! Comprehensive Plan provides the foundation and launching pad
12 REGIONAL CENTRES AND CORRIDORS PROGRAM UPDATE
 Clause No. 12 in Report No. 11 of was adopted, without amendment, by the Council of The Regional Municipality of York at its meeting held on June 26, 2014. 12 REGIONAL CENTRES AND CORRIDORS PROGRAM UPDATE
RD:SSL:JMD 11/23/2015 RESOLUTION NO.
 RD:SSL:JMD 11/23/2015 RESOLUTION NO. A RESOLUTION OF THE COUNCIL OF THE CITY OF SAN JOSE AMENDING THE NORTH SAN JOSE AREA DEVELOPMENT POLICY RELATED TO REDUCED TRAFFIC IMPACT FEES TO (1) EXTEND THE DEADLINE
Transit-Oriented Development Specialized Real Estate Services
 COLLIERS INTERNATIONAL Transit-Oriented Development Specialized Real Estate Services Accelerating success. Colliers International transit-oriented development GROUP P. 1 2 transit-oriented development
Place Type Descriptions Vision 2037 Comprehensive Plan
 Place Type Descriptions Vision 2037 Comprehensive Plan The Vision 2037 Comprehensive Plan establishes a range of place types for Oxford, ranging from low intensity (limited development) Rural and Natural
The Cannery Marketplace Narrative. Purpose: Site Design Approach: Cannery Commerce District 10/18/2017
 The Cannery Marketplace Narrative Cannery Commerce District 10/18/2017 Purpose: A number of entitlements are being requested for the Cannery Marketplace inclusive of a Master Conditional Use Permit (Master
Creative Approaches to Land Acquisition
 2007 Legislative Session Review CALIFORNIA TRANSIT ASSOCIATION JANUARY/FEBRUARY 2008 Creative Approaches to Land Acquisition Result From Creative Approaches to Land Acquisition It should not surprise anyone
Glendale Housing Development Project Plan
 Glendale Housing Development Project Plan Draft for Public Review May 29, 2015 Table of Contents I. Introduction... 1 II. Description of Project... 1 A. Boundary of Housing Development Project... 1 B.
Chapter 4: Housing and Neighborhoods
 Chapter 4: Housing and Neighborhoods Introduction Medina is a growing community that provides a variety of housing types and neighborhood styles while protecting and enhancing the City s open spaces and
DEPARTMENT OF COMMUNITY PLANNING, HOUSING AND DEVELOPMENT Planning Division
 DEPARTMENT OF COMMUNITY PLANNING, HOUSING AND DEVELOPMENT Planning Division #1 Courthouse Plaza, 2100 Clarendon Boulevard, Suite 700 Arlington, VA 22201 TEL 703.228.3525 FAX 703.228.3543 www.arlingtonva.us
Existing Conditions: Economic Market Assessment
 Existing Conditions: Economic Market Assessment Introduction The US 24/40 Corridor Study examined existing conditions as they related to economic and commercial market assessments, existing land use, and
Missing Middle Housing Types Showcasing examples in Springfield, Oregon
 Missing Middle Housing Types Showcasing examples in Springfield, Oregon MissingMiddleHousing.com is powered by Opticos Design Illustration 2015 Opticos Design, Inc. Missing Middle Housing Study Prepared
MERIDEN TOD A NEW TRANSIT-ORIENTED DEVELOPMENT DISTRICT ZONING REGULATION FOR MERIDEN. Greater Meriden Chamber & Connecticut Bar Association
 A NEW TRANSIT-ORIENTED DEVELOPMENT DISTRICT ZONING REGULATION FOR MERIDEN PRESENTATION TO Greater Meriden Chamber & Connecticut Bar Association 25 September 2013 Dominick J. Caruso, AICP Director of Planning
Chapter 7 Riverfront District
 Chapter 7 Riverfront District Downtown Capital District Master Plan Trenton, New Jersey Riverfront District Trenton will reclaim its connection with the Delaware River to enhance the experience of living,
Downtown Brampton and Queen Street Corridor: Residential and Commercial Projects
 Downtown Brampton and Queen Street Corridor: Residential and Commercial Projects What Makes a Great Downtown The economic and cultural vitality of the city depends on a robust downtown and central corridor.
You ve adopted a form-based code Congratulations! Now what?
 You ve adopted a form-based code Congratulations! Now what? Waves of Change Texas APA Conference 2013 Galveston, Texas Erin Jones, Director of Planning, City of Rowlett Arti Harchekar, Consulting Urban
Palmerton Area Comprehensive Plan
 DRAFT Palmerton Area Comprehensive Plan Bowmanstown Borough, Lower Towamensing Township, Palmerton Borough and Towamensing Township Carbon County, Pennsylvania Draft - With Minor Revisions - March 2008
4.13 Population and Housing
 Environmental Impact Analysis Population and Housing 4.13 Population and Housing 4.13.1 Setting This section evaluates the impacts to the regional housing supply and population growth associated with implementation
Downtown Brampton and Queen Street Corridor: Residential and Commercial Projects
 Downtown Brampton and Queen Street Corridor: Residential and Commercial Projects What Makes a Great Downtown The economic and cultural vitality of the city depends on a robust downtown and central corridor.
DESCRIPTION OF THE DISTRICT
 DESCRIPTION OF THE DISTRICT The project plan for City of Wausau, Tax Increment District #11 has been prepared in compliance with Wisconsin Statutes Chapter 66.1105(4). The plan establishes the need for
MONROE WARD REZONING SUMMARY. October 2018
 MONROE WARD REZONING SUMMARY October 2018 WHY IS THE CITY REZONING MONROE WARD? In July of 2017 Richmond City Council adopted The Pulse Corridor Plan, a corridor-long planning document that outlines steps
URBAN INFILL HOUSING OPTIONS
 URBAN INFILL HOUSING OPTIONS 1. Table of Contents Introduction (2-3) Downtown Specific Plan Goals (4-5) What is Higher Density Housing? (6) What is Floor Area Ratio (FAR) and Why is FAR Important to Urban
Housing. Approved and Adopted by City Council November 13, City Council Resolution City Council Resolution
 5 Housing Approved and Adopted by City Council November 13, 2018 Chapter 5 Housing 5.1 City Council Resolution 2018-096 5.2 Fontana General Plan CHAPTER 5 Housing This chapter of the General Plan Update
SERVICE & IMPROVEMENT PLAN AND ASSESSMENT PLAN:
 DOWNTOWN MIDLAND MANAGEMENT DISTRICT SERVICE & IMPROVEMENT PLAN AND ASSESSMENT PLAN: 2010-2019 August 25, 2009 Table of Contents 1. Introduction...1 2. Background: The First Five Years...2 3. Service &
EXHIBIT 1 PROJECT DESCRIPTION AND DESCRIPTION OF REQUESTED AREA VARIANCES REDEVELOPMENT OF 201 ELLICOTT STREET
 EXHIBIT 1 PROJECT DESCRIPTION AND DESCRIPTION OF REQUESTED AREA VARIANCES REDEVELOPMENT OF 201 ELLICOTT STREET I. PROJECT DESCRIPTION: Ciminelli Real Estate Corporation (the Applicant ) is seeking area
Attachment A First Submittal JAZB Safety Zones A and B
 Attachment A First Submittal JAZB Safety Zones A and B Attachment B Second Submittal JAZB Safety Zones A and B Attachment C Flying Cloud Airport (FCM) Draft Airport Zoning Ordinance Social and Economic
Summary. Draft Redevelopment Plan Summary Flowery Branch Tax Allocation District # 1:
 Summary Draft Redevelopment Plan Summary Flowery Branch Tax Allocation District # 1: Flowery Branch Tax Allocation District Old Town and Commercial Gateways 1 Public Hearing Presentation November 21, 2007
Planning Justification Report for 324 York Street
 Planning Justification Report for 324 York Street June 1 2018 This Planning Justification Report demonstrates how the continued use of the subject lands as a commercial surface area parking lot accords
Using Performance Measures to Improve Parking Policies & Livability
 Using Performance Measures to Improve Parking Policies & Livability UTCM Conference Performance Measures for Livable Communities Valerie Knepper Metropolitan Transportation Commission SF Bay Area 7 Million
PLANNING AND IMPLEMENTING TOD: KEY FACTORS FOR SUCCESS. Sujata Srivastava Knowledge Corridor TOD Workshop June 5, 2013
 PLANNING AND IMPLEMENTING TOD: KEY FACTORS FOR SUCCESS Sujata Srivastava Knowledge Corridor TOD Workshop June 5, 2013 6-year old partnership dedicated to improving practice through technical assistance,
PINELLAS COUNTY COMPREHENSIVE PLAN
 PINELLAS COUNTY COMPREHENSIVE PLAN Future Land Use Map (FLUM) Category Descriptions and Rules Amended March 17, 2009 (Ordinance 09-17) Amended March 16, 2010 (Ordinance 10-18) Amended October 26, 2010
City of Winnipeg Housing Policy Implementation Plan
 The City of Winnipeg s updated housing policy is aligned around four major priorities. These priorities are highlighted below: 1. Targeted Development - Encourage new housing development that: a. Creates
GETTING IT BUILT: OVERCOMING THE IMPLEMENTATION BARRIERS TO SMART GROWTH
 GETTING IT BUILT: OVERCOMING THE IMPLEMENTATION BARRIERS TO SMART GROWTH February 15, 2014 New Partners for Smart Growth Dena Belzer Challenges to Implementing Smart Growth The Typical Smart Growth Vision
Impacts of a New Transit Service on Property Values
 Impacts of a New Transit Service on Property Values Bruce Hyde, Land Use Educator, UConn CLEAR Christy Rubenstein, Senior Policy Analyst, PSC What new commuter rail service will not do for property values
2401 Wilson Boulevard General Land Use Plan Amendment Study
 2401 Wilson Boulevard General Land Use Plan Amendment Study Long Range Planning Committee Meeting Presentation Compendium March 29, 2011 Department of Community Planning, Housing and Development GLUP Amendment
Charlottesville Planning Commission, Neighborhood Associations & News Media
 CITY OF CHARLOTTESVILLE A World Class City Department of Neighborhood Development Services City Hall Post Office Box 911 Charlottesville, Virginia 22902 Telephone 434-970-3182 Fax 434-970-3359 www.charlottesville.org
Route 6 Corridor Study Bristol Planning Commission Meeting #1. May 25, 2016 FITZGERALD & HALLIDAY, INC. Innovative Planning, Better Communities
 Route 6 Corridor Study Bristol Planning Commission Meeting #1 May 25, 2016 FITZGERALD & HALLIDAY, INC. Innovative Planning, Better Communities Today s Agenda 1. Introductions 2. Study overview Scope Schedule
The Onawa and CHAT Report
 The Onawa and CHAT Report Black Hills Energy A Community Housing Assessment Team Study Amy Haase, AICP March 10, 2014 Population Change Onawa, 1960-2010 3,500 3,000 3,176 3,154 3,283 2,936 3,091 2,998
GOALS, OBJECTIVES, AND STRATEGIES
 GOALS, OBJECTIVES, AND STRATEGIES What follows is a series of goals, recommendations and actions that reflect the themes outlined in the Mineral Springs Vision Plan (incorporated into this document as
CONNECTING ARLINGTON S POLICY FRAMEWORK TO THE RESIDENTIAL PARKING WORKING GROUP
 CONNECTING ARLINGTON S POLICY FRAMEWORK TO THE RESIDENTIAL PARKING WORKING GROUP Contents Arlington County Development and Growth Goals... 1 Master Transportation Plan Policies Related to Multi Family
TASK 2 INITIAL REVIEW AND ANALYSIS U.S. 301/GALL BOULEVARD CORRIDOR FORM-BASED CODE
 TASK 2 INITIAL REVIEW AND ANALYSIS U.S. 301/GALL BOULEVARD CORRIDOR FORM-BASED CODE INTRODUCTION Using the framework established by the U.S. 301/Gall Boulevard Corridor Regulating Plan (Regulating Plan),
Village of Perry Zoning Ordinance Update Draft Diagnostic Report
 Village of Perry Zoning Ordinance Update Draft Diagnostic Report Background The Village of Perry began work on a new comprehensive plan in 2014. After a year of committee meetings and public outreach,
Analysis of Infill Development Potential Under the Green Line TOD Ordinance
 Analysis of Infill Development Potential Under the Green Line TOD Ordinance Prepared for the Los Angeles County Second Supervisorial District Office and the Department of Regional Planning Solimar Research
Town of Bethlehem 20/20 Advisory Committee. Committee Meeting March 14, 2008 Elsmere Fire House, Poplar Drive 7:45 9:30 a.m.
 Town of Bethlehem 20/20 Advisory Committee Committee Meeting March 14, 2008 Elsmere Fire House, Poplar Drive 7:45 9:30 a.m. Agenda 1. Co-Chair Report Terri Egan and Ken Ringler 2. Town of Bethlehem Comp
Ann Arbor Downtown Zoning Evaluation
 Ann Arbor Downtown Zoning Evaluation Options Workbook ENP & Associates in cooperation with the City of Ann Arbor September, 2013 Photo Courtesy of Andrew Horne, February 9, 2013 Introduction Thank you
Appendix B: Housing Element Sites Inventory and Detailed Analysis
 Appendix B: 2015-2023 Housing Element Sites Inventory and Detailed Analysis Redwood City General This page intentionally left blank. Redwood City General Site Identifier Assessor Parcel Number General
Kinzie Industrial Corridor
 Mayor Emanuel s Industrial Corridor Modernization Kinzie Industrial Corridor Fulton Market Innovation District Plan Implementation September 19, 2017 Rahm Emanuel, Mayor David Reifman, Commissioner Dept.
Community Advisory Committee (CAC) Meeting #7 West Anaheim Youth Center May 26, 2016
 Meeting #7 West Anaheim Youth Center May 26, 2016") Community Advisory Committee (CAC) Meeting #7 West Anaheim Youth Center May 26, 2016 1 Project Team City: David Belmer Planning and Building Director Jonathan Borrego, AICP Planning Services Manager Gustavo
Community Advisory Committee (CAC) Meeting #7 West Anaheim Youth Center May 26, 2016 1 Project Team City: David Belmer Planning and Building Director Jonathan Borrego, AICP Planning Services Manager Gustavo
PALM BEACH COUNTY PLANNING, ZONING AND BUILDING DEPARTMENT ZONING DIVISION
 PALM BEACH COUNTY PLANNING, ZONING AND BUILDING DEPARTMENT ZONING DIVISION Application No.: W-2014-00288 Application Name: O Reilly Auto Parts Control No.: 2013-00286 Applicant: Hutton Growth Blue Sky