Property Values Report Spring Mentone Mordialloc Parkdale
|
|
|
- Scarlett Tate
- 6 years ago
- Views:
Transcription


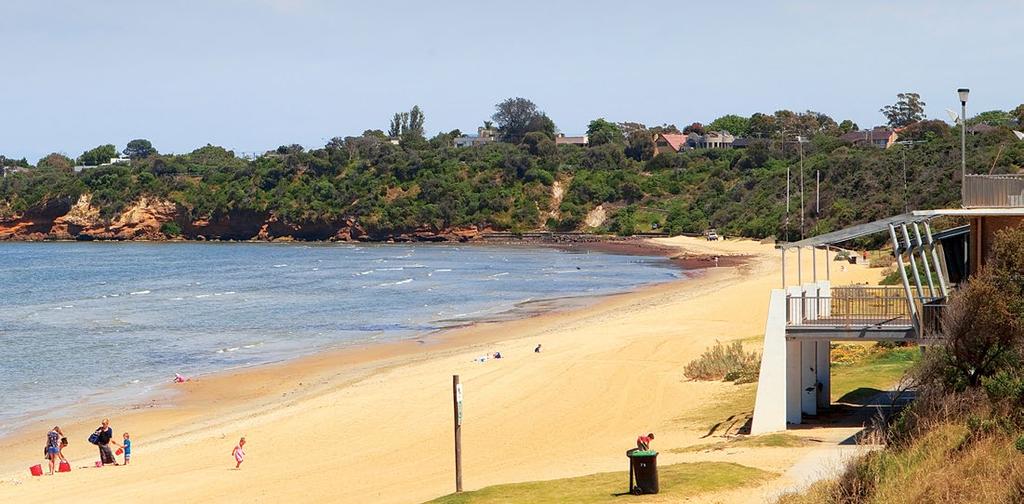
1 Property Values Report Spring 2017 Mentone Mordialloc Parkdale
2 Welcome to the Spring edition of our Property Values Report, a summary of property sales and related information, delivered to you exclusively by Buxton. We are committed to providing our clients with accurate, credible, relevant market information and have worked in partnership with independent real estate data specialists Property Analytics* to develop this report. The statistics within are designed to give you a deeper understanding of how the residential real estate market is performing across Melbourne, in this region and within your specific neighbourhood. Prices up and still rising. Melbourne property prices have risen steadily since 2012 meaning the growth phase we re in has spanned nearly 5 years. During this time home values have risen by nearly 60% (CoreLogic). Only Sydney has experienced more growth at 79%. The main and most obvious driver of price growth has been low interest rates. The RBA dropped the Target Cash Rate on 8 separate occasions since mid 2012 and have kept them at a record low 1.5% for the last year. Obviously cheap finance spurs investor demand and lifts buyer s budgets. But a second important price growth driver has emerged over the last couple years - low supply of established houses. The ABS has reported year-on-year decreases in Melbourne house transactions in each of the last 6 quarters (the yet to be released June quarter figures will likely make it 7 quarters). For nearly 2 years sales volumes have been decreasing while sales values have been increasing - this is a pretty unusual trend. What we see normally is sales volumes moving broadly in-line with sales values. Generally, more people are willing to list their property for sale when prices are on the rise as opposed to when prices are flat or decreasing. Look at the graph of Melbourne Metropolitan Houses Sales and Median Prices see how trends have reversed in recent times. What does this mean? At its most basic, real estate is about supply and demand. When supply of houses for sale is high but demand from purchasers is subdued, prices stagnate or decrease. When supply of houses for sale is low but demand from purchasers is strong, prices increase sometimes dramatically. Let s assume that you re a young family looking to upsize into your 2nd house or maybe your kids have (finally!) moved out and you re looking to downsize into your final home. Are you comfortable with selling your existing home before finding your new one? Or purchasing your new house before selling your existing? Chances are you want to avoid the pressure of having to find a place within a few weeks and the idea of renting and moving twice doesn t appeal much. So you may be inclined to wait, and delay selling until you find something. That, in a nutshell, is the conundrum facing many people in today s market. It s a bit of a self fulfilling cycle fewer people are listing because fewer people are listing. It s also subtly changing the role of selling agents as we re increasingly being asked to help would be vendor clients find a place to purchase. Good agents recognise that their job is more than simply selling property and gaining commissions, it s about assisting clients throughout their real estate journey. At Buxton we re proud to share industry leading market information such as this report and having sold over 9,000 properties collectively over the last 3 years we re uniquely positioned to help clients find their future property. While interest rates remain at record lows we expect property prices to continue to rise, albeit, perhaps at a lower rate. Moving into Spring more properties will be offered to the market and we look forward to helping thousands of clients. Don t hesitate to contact your local office for more market information, an up to date market appraisal or to discuss your particular needs. Melbourne Metropolitan House Sales and Median Prices 70,000 60,000 50,000 40,000 30,000 20, Number of Houses Sold Median House Price 2017 $800,000 $700,000 $600,000 $500,000 $400,000 $300,000 Interest Rates and Melbourne Metropolitan House Prices % is the Victoria wide Auction Clearance Rate over the last 12 months (Source: Source: REIV) 13.7% is how much median property prices have increased in Melbourne over the last 12 months (Source: Corelogic) 1.50% is the current RBA Target Cash Rate and November 2010 is the last time the RBA has increased the Target Cash Rate Standard Variable Interest Rates 2015 MAY (5) (10) % Melbourne House Prices (Source: Source: RBA) 135,296 residential property transactions have taken place Victoria wide over the last 12 months (Source: Source: REIV) * Property Analytics ( provides independent statistical information to real estate professionals throughout Victoria and New South Wales.

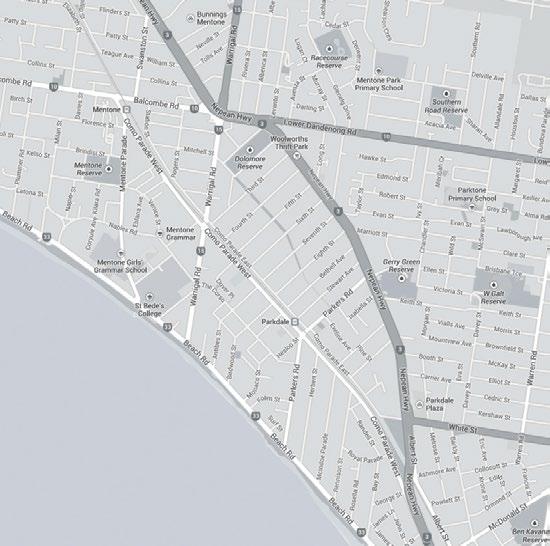
3 Mentone and local neighbourhood property values Houses: 2017 Units / Townhouses: 2017 Area Bedroom 4+ Bedroom All Houses Area Bedroom 3+ Bedroom All Units Latrobe Rd Oak Avenue Number Sold Median $1,440,000 $1,710,000 $1,573,000 Highest $2,948,000 $1,890,000 $2,948,000 Median 3 yr % change 67* 30* 69* Number Sold Median $510,000 $965,000 $545,000 Highest $900,000 $1,620,000 $1,620,000 Median 3 yr % change Voltri St Area Bedroom 4+ Bedroom All Houses Area Bedroom 3+ Bedroom All Units Charman Rd 2 3 Number Sold Median $1,100,000 $1,457,500 $1,217,500 Highest $1,530,000 $2,832,500 $2,832,500 Median 3 yr % change Area Bedroom 4+ Bedroom All Houses Number Sold Median $535,000 $868,750 $600,000 Highest $5,170,000 $1,500,000 $5,170,000 Median 3 yr % change Area Bedroom 3+ Bedroom All Units Balcombe Rd 4 Number Sold Median $1,025,000 $830,000 $887,500 Highest $1,250,000 $1,125,000 $1,250,000 Median 3 yr % change 51-8* 8 Number Sold Median $525,000 $783,000 $707,500 Highest $1,710,000 $1,105,000 $1,710,000 Median 3 yr % change Warrigal Rd 6 Lower Dandenong Rd 7 Area Bedroom 4+ Bedroom All Houses Number Sold median $856,250 $1,150,000 $902,500 Highest $1,063,000 $1,300,000 $1,300,000 Median 3 yr % change 31* 35* 32 Area Bedroom 4+ Bedroom All Houses Number Sold Median $1,292,500 $1,650,000 $1,570,000 Highest $1,950,000 $3,500,000 $3,500,000 Median 3 yr % change Area Bedroom 3+ Bedroom All Units Number Sold Median $450,000 $859,000 $617,500 Highest $690,000 $1,207,000 $1,207,000 Median 3 yr % change -11* 43* 14* Area Bedroom 3+ Bedroom All Units Number Sold Median $580,000 $1,220,000 $602,500 Highest $967,500 $1,425,000 $1,425,000 Median 3 yr % change 33 40* 29 Como Parade West Nepean Hwy Warren Rd 8 Area Bedroom 4+ Bedroom All Houses Number Sold Median $1,295,000 $1,475,500 $1,346,000 Highest $1,625,000 $1,715,000 $1,715,000 Median 3 yr % change 41* 17* 41 Area Bedroom 3+ Bedroom All Units Number Sold Median $641,000 $930,000 $863,000 Highest $951,000 $1,450,000 $1,450,000 Median 3 yr % change 44* 33 72* Beach Rd Area Bedroom 4+ Bedroom All Houses Area Bedroom 3+ Bedroom All Units 5 Number Sold Median $1,010,000 $1,215,000 $1,110,000 Highest $1,430,000 $1,845,000 $1,845,000 Median 3 yr % change Number Sold Median $610,000 $823,000 $665,000 Highest $715,000 $1,177,500 $1,177,500 Median 3 yr % change 42* White St Area Bedroom 4+ Bedroom All Houses Number Sold Median $825,000 $962,500 $892,500 Highest $1,282,000 $1,115,000 $1,282,000 Median 3 yr % change 28 32* 34 Area Bedroom 3+ Bedroom All Units Number Sold Median $425,000 $813,500 $628,000 Highest $568,000 $1,320,000 $1,320,000 Median 3 yr % change -4* 58* 30* 9 Boundary Rd Area Bedroom 4+ Bedroom All Houses Number Sold Median $850,000 $1,230,000 $1,089,000 Highest $1,405,000 $1,600,000 $1,600,000 Median 3 yr % change Area Bedroom 3+ Bedroom All Units Number Sold Median $476,500 $781,500 $620,000 Highest $661,000 $1,265,000 $1,265,000 Median 3 yr % change Area Bedroom 4+ Bedroom All Houses Area Bedroom 3+ Bedroom All Units Number Sold Median $1,597,500 $1,860,000 $1,785,000 Highest $2,150,000 $3,033,000 $3,033,000 Median 3 yr % change 34* 20* 23* Number Sold Median $560,000 $690,000 $560,000 Highest $805,000 $830,000 $830,000 Median 3 yr % change 36* -31* -23* Buxton has divided the map on this page into 10 different property value areas. To find out the median house value in your neighbourhood, simply locate your street on this map to discover which area your property is in, then look up the relevant chart. Data shown is for the financial year ending 30 June, *Median Value Increase in 3 years % figure is statistically unreliable due to insufficient sales volumes.
4 Median sale prices by suburb in the last 3 years Did you know... Median Value 3 Year % Change Houses Aspendale 32 Beaumaris 25 Cheltenham 39 Mentone 32 Mordialloc 32 Parkdale 46 Units / Townhouses Aspendale 20 Beaumaris -2 Cheltenham 22 Mentone 22 Mordialloc Aspendale - 78 sold Aspendale - 42 sold $962,000 $692,500 $811,000 $626,000 $730,000 $578,000 $600,000 $800,000 $1,000,000 $500,000 $600,000 $700,000 Beaumaris sold Black Rock - 79 sold $1,520,000 $1,035,500 $1,400,000 $835,000 $1,213,751 $805,000 $1,000,000 $1,400,000 $1,8000,000 $600,000 $900,000 $1,200,000 Cheltenham sold Cheltenham sold $1,045,000 $637,500 $880,000 $552,500 $749,790 $521,915 $600,000 $850,000 $1,100,000 $400,000 $550,000 $700,000 Mentone sold Mentone sold $1,120,000 $600, days is the average for property on the market in the Melbourne metropolitan area (June Source: REIV). $600k is the maximium price where first home buyers pay no stamp duty (Source: REIV) June vacancy rates for Melbourne Metropolitan were 2.2% and regional Victoria were 2.5% (Source: REIV) Melbourne Metropolitan average gross rental yield is 2.7% (Source: REIV) The number of properties listed for sale in July 2017: Melbourne Metropolitan - 27,184. Regional Victoria - 21,372. (Source: REIV) Property ownership in Victoria 29% 37% 33% Greater Melbourne 27% 34% 40% Regional Victoria The Standard Variable lending rate for investors is 0.6% higher than the Standard variable owner/occupier rate. (Source: RBA) Owned Outright Mortgaged Rented Property ownership data sourced from the Australian Bureau of Statistics (Census 2011) Parkdale 23 $932,500 $850,000 $700,000 $950,000 $1,200,000 Mordialloc - 73 sold $1,027,500 $880,000 $780,000 $600,000 $900,000 $1,200,000 $525,000 $490,000 $400,000 $500,000 $600,000 Mordialloc sold $619,000 $535,000 $475,500 $400,000 $550,000 $700,000 $1,544 is the average weekly earnings (May Source: ABS) $440 is the median weekly rent for houses in metropolitan Melbourne and $310 for regional Victoria. $420 is the median weekly rent for units or townhouses in metropolitan Melbourne and $248 for regional Victoria. Parkdale sold Parkdale sold (June Source: REIV) (June Source: REIV) $1,270,000 $670,002 $1,010,000 $582,000 $871,750 $800,000 $1,050,000 $1,300,000 About median values $546,000 $500,000 $600,000 $700,000 The median value is a more reliable figure than an average price. This is used as an indicator of price trends in a particular area. That s why median prices are used by Buxton, the Real Estate Institute of Victoria and the Valuer General. Simply, the average price is obtained by adding up the value of all sales and dividing that figure by the number of sales. The median average is the middle price when all sales are arranged in order from highest to lowest. Data shown is for the financial year ending 30 June, Please note that figures relate to sales of individual residential properties only, and exclude sales of multiple dwellings in single transactions (e.g. blocks of units), vacant land, and commercial real estate. The data on these pages also includes Valuer General data and because of the delay in receiving it, the 2017 data may be missing some sales taking place towards the end of the financial year. Also be aware that if any area has aparticularly low number of sales during any period, this may unfairly influence the trend. Whilst every care has been taken to confirm the accuracy of the information presented, neither the authors, editors or publishers can be responsible for errors or omissions or for any consequences from application of the information given. Population predictions 9, population predictions are properties have million for Greater Melbourne 2026 been sold by the and million for regional Victoria. Buxton Real Estate 2021 Group over the last 3 financial years Greater Melbourne Regional Victoria 0 2 Million 4 Million 6 Million
5 Property Values Report Spring 2017 If you are considering selling and would like to achieve the highest price possible, contact a Mentone local area expert for an up to date market appraisal. Wesley Belt Mathew Cox Emily Whitehead Amy Todisco Marie Anderson Aidan Oke Guy Shannon Travis Day Zac Damiani
Property Values Report Spring Ballarat including suburbs and surrounding areas
 Property Values Report Spring 2017 Ballarat including suburbs and surrounding areas Welcome to the Spring edition of our Property Values Report, a summary of property sales and related information, delivered
Property Values Report Autumn Mentone Mordialloc Parkdale
 Property Values Report Autumn 2017 Mentone Mordialloc Parkdale Welcome to the Autumn edition of our Property Values Report, a summary of property sales and related information, delivered to you exclusively
Buxton Property Values Report Spring Albert Park Middle Park Port Melbourne South Melbourne Southbank St Kilda West
 Albert Park Middle Park Port Melbourne South Melbourne St Kilda West Property Values Report Spring 2016 Changing buyer mix set to shape Spring property market Welcome to the Spring edition of our Property
Autumn 2018 Ballarat Area Property Values Report
 Autumn 2018 Property Values Report Alfredton, Bakery Hill, Golden Point, Ballarat Central, Ballarat East, Eureka, Ballarat North, Invermay Park, Black Hill, Soldiers Hill, Canadian, Delacombe, Lake Gardens,
Autumn 2018 Geelong Area Property Values Report
 Autumn 2018 Geelong Area Property Values Report Bell Park, Bell Post Hill, Belmont, Breakwater, Corio, Drumcondra, Geelong, Geelong East, Geelong South, Geelong West, Grovedale, Hamlyn Heights, Herne Hill,
RESIDENTIAL RESEARCH MARKET ACTIVITY REPORT FOR AUSTRALIAN CAPITAL CITIES & REGIONAL CENTRES
 RESIDENTIAL RESEARCH MARKET ACTIVITY REPORT FOR AUSTRALIAN CAPITAL CITIES & REGIONAL CENTRES Feb-17 May-17 Aug-17 Nov-16 Feb-17 May-17 The official cash rate target remained at 1.5 on 1 August 2017. Domestic
Creswick Property Factsheet
 Creswick Property Factsheet 1st Half 2018 OVERVIEW Creswick, located 129km north west of Melbourne is 430m above sea level. A population of 3,170 was recorded in the 2016 ABS census. The area provides
Hunter Valley Property Factsheet
 Hunter Valley Property Factsheet 1st Half 2018 *IMAGE* 6.5cm HIGH 10.6cm WIDE OVERVIEW The Hunter Valley is 2 hours north of Sydney and is also just 40 minutes from Newcastle. The region is well-known
Special Report. Australia s Cheapest Suburbs with the Greatest Potential for Capital Growth. For more reports head to
 Demand Supply Ratio Market Report Special Report Australia s Cheapest Suburbs with the Greatest Potential for Capital Growth Market: Australia Created by: hotspotcentral.com.au Contact: t: 1300 200 340
MONTHLY RESEARCH BULLETIN SEPTEMBER 2016
 MONTHLY RESEARCH BULLETIN SEPTEMBER 2016 ABOUT REIV The Real Estate Institute of Victoria has been the peak professional association for the Victorian real estate industry since 1936. Over 2,000 real estate
RESIDENTIAL RESEARCH MARKET ACTIVITY REPORT FOR AUSTRALIAN CAPITAL CITIES & REGIONAL CENTRES
 RESIDENTIAL RESEARCH MARKET ACTIVITY REPORT FOR AUSTRALIAN CAPITAL CITIES & REGIONAL CENTRES Sep-16 Mar-17 Mar-17 Jun-17 Sep-16 Mar-17 The official cash rate target remained at 1.5 on 6 June 2017. Domestic
Suburb Profile Report. Paddington, 2021 NSW
 Suburb Profile Report Paddington, 2021 NSW October 2018 About Sound Property Group Sound Property Group is a property investment and education company specialised in sourcing strategic real estate opportunities,
Residential Commentary - Perth Apartment Market
 Residential Commentary - Perth Apartment Market March 2016 Executive Summary The Greater Perth apartment market has attracted considerable interest from local and offshore developers. Projects under construction
Domain Rental Report September Quarter 2016
 Domain Rental Report September Quarter 2016 Dr Andrew Wilson Chief Economist for Domain.com.au Key findings House rents in Sydney, Melbourne, Brisbane, Adelaide and Darwin all remain steady Canberra is
Bankwest Future of Business: Focus on Real Estate
 Bankwest Future of Business: Focus on Real Estate 2018 Contents Key insights Industry overview What s driving industry growth? Spotlight on Australia Spotlight on Western Australia What does the future
Ashmore & Molendinar Property Factsheet
 Ashmore & Molendinar Property Factsheet 1st Half 2018 OVERVIEW Ashmore is a suburb in Gold Coast, located 5 kilometer west of Surfers Paradise. In the 2016 census, Ashmore recorded a population of 11,910
7224 Nall Ave Prairie Village, KS 66208
 Real Results - Income Package 10/20/2014 TABLE OF CONTENTS SUMMARY RISK Summary 3 RISC Index 4 Location 4 Population and Density 5 RISC Influences 5 House Value 6 Housing Profile 7 Crime 8 Public Schools
Dual Income Property Strategy
 Dual Income Property Strategy Contents: WHAT IS A DUAL INCOME PROPERTY PAGE 4 ADVANTAGES PAGE 6 DISADVANTAGES PAGE 8 CASE STUDY PAGE 10 IMPORTANT CONSIDERATIONS PAGE 14 FREQUENTLY ASKED QUESTIONS PAGE
Property Report. Tasmania
 Property Report Tasmania Upgraders & investors reap rewards Welcome to this edition of the Westpac/ Property Report, a first hand look at how Australia s residential property market is performing on a
Ingleburn Property Factsheet
 Ingleburn Property Factsheet 1st Half 2018 OVERVIEW Ingleburn is a suburb situated approx. 44 kilometres from the Sydney CBD. This small hub is an ideal location for families and professionals due to its
MONTHLY RESEARCH BULLETIN DECEMBER 2016
 MONTHLY RESEARCH BULLETIN DECEMBER 2016 ABOUT REIV The Real Estate Institute of Victoria has been the peak professional association for the Victorian real estate industry since 1936. Over 2,000 real estate
What s Next for Commercial Real Estate Leveraging Technology and Local Analytics to Grow Your Commercial Real Estate Business
 What s Next for Commercial Real Estate Leveraging Technology and Local Analytics to Grow Your Commercial Real Estate Business - A PUBLICATION OF GROWTH MAPS- TABLE OF CONTENTS Intro 1 2 What Does Local
Alexandria Property Factsheet
 Alexandria Property Factsheet 1st Half 2018 OVERVIEW Alexandria is an inner-eastern Sydney suburb located approx. 4km south of the Sydney CBD. Formerly recognised as an industrial suburb, it is now growing
Housing market report
 Australian capital cities and Gold Coast residential property market ruary Prepared by Australian Property Monitors The housing market is up and running in with increased buyer activity and seller confidence.
Housing market report
 Capital city market report Prepared August Dr Andrew Wilson, Senior Economist Australian Property Monitors Buyer momentum rises through mid-winter housing markets National overview Buyer and seller momentum
City of Lonsdale Section Table of Contents
 City of Lonsdale City of Lonsdale Section Table of Contents Page Introduction Demographic Data Overview Population Estimates and Trends Population Projections Population by Age Household Estimates and
Suburb Profile Report
 Prepared on: Prepared for: 3 September 08 Sample Report COLLINGWOOD.4km Distance from GPO 8.5k Population 3.6% 5 year population change 9 years Average length of ownership The size of Collingwood is approximately.3
Toowoomba Property Factsheet
 Toowoomba Property Factsheet 1st Half 2018 OVERVIEW Located 125 kilometres west of Brisbane s CBD, Toowoomba is the main urban centre for the Toowoomba Regional area. In 2016 the labour force (59.6%) was
UDIA WA PROPERTY MARKET STATISTICS
 UDIA WA PROPERTY MARKET STATISTICS OCTOBER 217 1 IN THIS ISSUE KEY TRENDS INDUSTRY UPDATE 3 4 ECONOMY RESIDENTIAL LAND DEVELOPMENT RESIDENTIAL PROPERTY SETTLEMENTS RESIDENTIAL PROPERTY MARKET RESIDENTIAL
RP Data chart pack. November 2014
 RP Data chart pack November 2014 Macro housing market indicators 2 Residential real estate underpins Australia's wealth Residential Real Estate $5.6 Trillion Australian Superannuation $1.8 Trillion Australian
CoreLogic RP Data Property Market Indicator Summary All data to week ending 30 August 2015
 Final week of winter returns high auction volumes and a strong clearance rate For the last week of winter, the preliminary auction clearance rate was 75.4 per cent, with 2,583 auctions held across Australia
Quarterly Review The Australian Residential Property Market and Economy
 Quarterly Review The Australian Residential Property Released January 2018 Contents Introduction 3 Housing Market 4 Mortgage Lending 11 Housing Supply 17 Demographic Overview 20 Household Finances 22 National
Property Report. Victoria
 Property Report Victoria Upgraders & investors reap rewards Welcome to this edition of the Westpac/ Property Report, a first hand look at how Australia s residential property market is performing on a
million dwellings nationwide, according to CoreLogic data.
 PROPERTY REPORT Welcome to The Agency s first quarter property report for 2018. Nationally, we are in quite a different property market when compared to recent years. Despite the moderation in key capital
RP Data Housing market update. October 2014
 RP Data Housing market update October 2014 Residential real estate absolutely underpins Australia s wealth position Residential Real Estate $5.6 Trillion Australian Superannuation $1.5 Trillion $1.8 Trillion
HOUSING AFFORDABILITY
 HOUSING AFFORDABILITY (RENTAL) 2016 A study for the Perth metropolitan area Research and analysis conducted by: In association with industry experts: And supported by: Contents 1. Introduction...3 2. Executive
DETACHED MULTI-UNIT APPROVALS
 HIA New Home Sales DETACHED MULTI-UNIT APPROVALS SALES MULTI-UNIT DETACHED A monthly update on the sales of new homes December 217 TAX BURDEN TAKES TOLL ON New Home Sales during 217 Sales still post modest
BRISBANE HOUSING MARKET STUDY
 BRISBANE HOUSING MARKET 2018 STUDY Executive Summary Brisbane s residential market, especially the detached houses segment has risen steadily over the last year due to the rise in population, falling unemployment
Comparative Market Analysis
 Comparative Market Analysis Generated by: Mark Attard FinancePath ACL 388674 Level 1, Suite 9 The Central, 1Ricketts Road Mt Waverley, VIC 3149 Mobile: Email: Phone: 0408 233 200 mattard@financepath.com.au
ESTIMATED RENTAL VALUE REPORT. 22 Seabrook Avenue Rosebud VIC 3939
 ESTIMATED RENTAL VALUE REPORT Prepared on: 3 2 2 1,228m 2 State, and Commonwealth Governments. All rights reserved. Page 2 u PROPERTY DETAILS Here we summarise the property s key details (which are accurate
Rental housing still not affordable
 For Immediate Release Monday, 25 th September 2006 Registered Office 55 Johnston Street Fitzroy 3065 Admin 9419 5577 Fax 9416 0513 ACN 081 348 227 ABN 36 081 348 227 Rental housing still not affordable
Property report 7/15-23 Redondo Street Ningi QLD 4511
 Property report 7/15-23 Redondo Street Ningi QLD 4511 Prepared for: Prepared on: Prepared by: Phone: Email: Paul Jabbor Derek Andrew Potter 0475958253 andrew.potter@nab.com.au 2 2 1 261m 2 u Property details
Domain Rental Report June Quarter 2015
 Domain Rental Report June Quarter 2015 Dr Andrew Wilson Senior Economist for the Domain Group Key findings Rents remain at or near record levels in most Australian capital cities house rents surge 1.9
Special Report. Australia s Cheapest Suburbs with the Greatest Potential for Capital Growth. For more reports head to
 Special Report Australia s Cheapest Suburbs with the Greatest Potential for Capital Growth Market: Australia Compilation date: May 2013 Created by: Redwerks Pty Ltd Contact: 1300 200 340 For more reports
Comparative Market Analysis
 Australian Buyers Agent Services L29 Chifley Tower, Sydney, NSW, 2000 Ph: 1300 319 809 Comparative Market Analysis Contact Details Australian Buyers Agent Services Mobile: 1300 319 809 Email: info@austbas.com.au
ARLA Members Survey of the Private Rented Sector
 Prepared for The Association of Residential Letting Agents ARLA Members Survey of the Private Rented Sector Second Quarter 2014 Prepared by: O M Carey Jones 5 Henshaw Lane Yeadon Leeds LS19 7RW June, 2014
Estimating National Levels of Home Improvement and Repair Spending by Rental Property Owners
 Joint Center for Housing Studies Harvard University Estimating National Levels of Home Improvement and Repair Spending by Rental Property Owners Abbe Will October 2010 N10-2 2010 by Abbe Will. All rights
Individual Property Report. Cambooya Toowoomba, QLD 4358, Australia
 Individual Property Report Address: Cambooya Toowoomba, QLD 4358, Australia Contents Your Property Risk Summary Property Details Suburb Metrics Market Overview Equity Risk Factors Cash Flow Risk Rating
Domain.com.au House Price Report December Quarter 2015
 Domain.com.au House Price Report December Quarter 2015 Dr Andrew Wilson Senior Economist for Domain.com.au Key findings Record drop in Sydney median house prices over the December quarter Melbourne and
Scott Market Report Stronger Sales Continue
 June 20 Scott Market Report Stronger Sales Continue The Outer Banks real estate market is seeing good signs in most market segments. After a somewhat slow start to 20, sales agreements picked up significantly
Signs that the housing market may be peaking
 National Media Release: 21 October, 2015 Market movement s data released today show which markets are moving out of peak cycles. Signs suggesting that Australia s housing market may be moving through the
Australia Residential MarketView
 Australia Residential MarketView Q3 2013 NATIONAL HOUSE BUILDING APPROVAL 5.3% (SEPT 13 Y-O-Y) NATIONAL NON HOUSE BUILDING APPROVALS 19.7% (SEPT 13 Y-O-Y) QUARTERLY NATIONAL HOUSE CAPITAL VALUES 0.5% (SEPT
If you've been thinking of making an Australian property investment recently, here is some critical information
 If you've been thinking of making an Australian property investment recently, here is some critical information There is an 18-20 year real estate cycle as outlined by Phil Anderson in his book The Secret
CITY OF GREATER GEELONG LGA GROWTH OVERVIEW FUTURE DEVELOPMENTS**
 Number of Sales Median Price OVERVIEW As the second largest city in Victoria, Geelong provides an alternate option for those looking for an affordable city lifestyle outside of Melbourne. Geelong has developed
Snapshot Adelaide Apartment Market
 Snapshot Adelaide Apartment Market December 215 Executive Summary Our View The Adelaide apartment market is undergoing considerable growth, particularly in the CBD where around 4 apartments will complete
Top 10 Predictions Perth
 Perth Data for the Quarter Ending July 2014 #1 Secret Harbour Houses 6173 * 5.27% pa. 0.89% 7.92% 2.41% 9+ %pa. 8+ %pa. Sale Count 90 Median Value $501,500 5 years 8 years Median Rent $500 /wk Jul 14-Aug
MARKET WATCH: Dakota County
 MARKET WATCH: Dakota County Trends in the unsubsidized multifamily rental market Minnesota Housing Partnership OCTOBER 2018 Across the Twin Cities, the growing ranks of renter households are facing an
UDIA WA PROPERTY MARKET STATISTICS
 UDIA WA PROPERTY MARKET STATISTICS FEBRUARY 218 1 IN THIS ISSUE KEY TRENDS INDUSTRY UPDATE 3 4 ECONOMY RESIDENTIAL LAND DEVELOPMENT RESIDENTIAL PROPERTY SETTLEMENTS RESIDENTIAL PROPERTY MARKET RESIDENTIAL
The Greater Reno-Tahoe Real Estate Report
 February, 2018February, 2018 February, 2018 Issue The Greater Reno-Tahoe Real Estate Report Housing Market Trends for: Reno, Sparks, Carson City, Carson Valley, Lake Tahoe, Dayton, and Fernley A FREE monthly
High Level Summary of Statistics Housing and Regeneration
 High Level Summary of Statistics Housing and Regeneration Housing market... 2 Tenure... 2 New housing supply... 3 House prices... 5 Quality... 7 Dampness, condensation and the Scottish Housing Quality
TOWNHOUSES FOR SALE. Off The Plan. 6A Ebb St Aspendale. 15 Charlotte Road Beaumaris. 52A Ardoyne St Black Rock Bluff Rd Black Rock
 6A Ebb St Aspendale Residence 24sq. Land 265sqm DELUXE DUPLEX $1,190,000 This home showcases the best of contemporary design and offers timeless style and functionality. Soon to be constructed this townhouse
Appendix 1: Gisborne District Quarterly Market Indicators Report April National Policy Statement on Urban Development Capacity
 Appendix 1: Gisborne District Quarterly Market Indicators Report April 2018 National Policy Statement on Urban Development Capacity Quarterly Market Indicators Report April 2018 1 Executive Summary This
UDIA WA PROPERTY MARKET STATISTICS
 UDIA WA PROPERTY MARKET STATISTICS MAY 218 1 IN THIS ISSUE KEY TRENDS INDUSTRY UPDATE 3 4 ECONOMY RESIDENTIAL LAND DEVELOPMENT RESIDENTIAL PROPERTY SETTLEMENTS RESIDENTIAL PROPERTY MARKET RESIDENTIAL CONSTRUCTION
Housing market report
 Capital city market report Prepared September Dr Andrew Wilson, Senior Economist Australian Property Monitors No sign of winter pause as housing markets gather strength into spring National overview Buyer
RP Data chart pack. September 2014
 RP Data chart pack September 2014 Macro housing market indicators 2 Residential real estate absolutely underpins Australia s wealth position Residential Real Estate $5.5 Trillion Australian Superannuation
Demographics - Beaumaris
 Hodges PH: 03 9589 6077 FAX: 03 9589 1597 Demographics - Beaumaris SUBURB Beaumaris MUNICIPALITY Bayside MEDIAN AGE 44 DATES : 01/07/2015 and 31/07/2015 PROPERTY TYPE : Residential (All Types) SALE TYPE
*IMAGE* 6.5cm HIGH 10.6cm WIDE
 Number of Sales Median Price *IMAGE* 6.5cm HIGH 1.6cm WIDE Hobart OVERVIEW and it s surrounds have never experienced price growth quite like we are seeing. Demand is being driven by young owner/occupiers
RESIDENTIAL MARKET REPORT MARCH QUARTER 2017
 RESIDENTIAL MARKET REPORT MARCH QUARTER 2017 EXECUTIVE SUMMARY RESIDENTIAL LAND MARKET - VICTORIA The established house and vacant land markets across Greater Melbourne continued to remain buoyant in the
EDITION 1 GEELONG REGIONAL CENTRE REVIEW GEELONG 2017 MARCH
 2017 EDITION 1 GEELONG REGIONAL CENTRE REVIEW 2017 MARCH GEELONG GEELONG AT A GLANCE OVERVIEW MAJOR GOVERNMENT FUNDED PROJECTS National Disability Insurance Agency Headquarters / Department of Human Services
Buy-to-let: A bright outlook?
 Buy-to-let: A bright outlook? Ian Boden, Aldermore Mortgages April 2016 FOR INTERMEDIARY USE ONLY Aldermore Bank PLC is authorised by the Prudential Regulation Authority and regulated by the Financial
City Futures Research Centre
 Built Environment City Futures Research Centre Estimating need and costs of social and affordable housing delivery Dr Laurence Troy, Dr Ryan van den Nouwelant & Prof Bill Randolph March 2019 Estimating
CoreLogic RP Data November Rental Index Results
 Rental Review Snapshot Released: December 3, 2015 Capital city rental growth lowest on record over the past twelve months Weekly rents across the combined capital city measure were unchanged in November
Bargara Property Factsheet
 Bargara Property Factsheet 1st Half 2018 OVERVIEW Bargara* is located in the Bundaberg Region of south-east Queensland, approximately 384km north of Brisbane s CBD. Over the last 7 years the population
CoreLogic RP Data June Rental Index Results
 Rental Review Snapshot Released: July 10, 2015 & recorded the greatest annual increases in weekly rents while rents in, & continue to decline. capital city rental rates fell by -0.2% in June The rate of
Top Performing Suburbs National July 2018
 Top Performing Suburbs National July 2018 Welcome Welcome to the National Top Performing Suburbs Report for July 2018. The CoreLogic Top Performing Suburbs Report identifies those suburbs and towns that
UDIA WA PROPERTY MARKET STATISTICS
 UDIA WA PROPERTY MARKET STATISTICS JUNE 218 1 IN THIS ISSUE KEY TRENDS INDUSTRY UPDATE ECONOMY RESIDENTIAL LAND DEVELOPMENT RESIDENTIAL PROPERTY SETTLEMENTS RESIDENTIAL PROPERTY MARKET RESIDENTIAL CONSTRUCTION
ARLA Members Survey of the Private Rented Sector
 Prepared for The Association of Residential Letting Agents & the ARLA Group of Buy to Let Mortgage Lenders ARLA Members Survey of the Private Rented Sector Fourth Quarter 2010 Prepared by: O M Carey Jones
LOCATION. Masterclass Online. Featuring: The Suburb Selector Software
 LOCATION Masterclass Online Featuring: The Suburb Selector Software 2016 I Your Success Australia PTY LTD www.yourpropertysuccess.com.au Disclaimer: The information in these courses are based on the personal
BONDREPORT QTR BONDNEWYORK.COM
 BONDREPORT QTR 4 2018 BONDREPORT QTR 4 2018 WELCOME TO THE 23RD EDITION OF THE BOND REPORT Looking back on 2018, the year can perhaps best be described as a consistent movement towards corrections. After
RESIDENTIAL MARKET REPORT SEPTEMBER QUARTER 2016
 RESIDENTIAL MARKET REPORT SEPTEMBER QUARTER 2016 EXECUTIVE SUMMARY RESIDENTIAL MARKET - VICTORIA The established house and vacant land markets have remained buoyant through to the September quarter 2016.
Comparative Market Analysis
 Paul Pappas, Suite 2, Level 2, 88 Pitt Street, Sydney NSW 2000 Ph: 02 9231 0511 Comparative Market Analysis Report Powered by Contact Details Paul Pappas Mobile: 0411 877 662 Email: paul.pappas@mortgagechoice.com.au
Australian home size hits 22-year low
 Australian home size hits 22-year low CommSec Home Size Trends Report Economics November 16 2018 The average floor size of an Australian home (houses and apartments) has fallen to a 22-year low. Data commissioned
ADDRESSING HOUSING AFFORDABILITY IN AUSTRALIA:
 ADDRESSING AFFORDABILITY IN AUSTRALIA: Increase the supply of affordable rental housing Improve housing affordability through tax reform Improve rent assistance Set benchmarks for all levels of government
DATA FOR SEPTEMBER Published October 13, Sales are down -9.7% month-over-month. The year-over-year comparison is at 0%.
 Permission is granted only to ARMLS Subscribers for reproduction with attribution on to ARMLS COPYRIGHT 2017. For questions regarding this publication contact Brand@ARMLS.com. DATA FOR SEPTEMBER 2017 -
Using Historical Employment Data to Forecast Absorption Rates and Rents in the Apartment Market
 Using Historical Employment Data to Forecast Absorption Rates and Rents in the Apartment Market BY CHARLES A. SMITH, PH.D.; RAHUL VERMA, PH.D.; AND JUSTO MANRIQUE, PH.D. INTRODUCTION THIS ARTICLE PRESENTS
CAAR Market Report 2010 Mid-Year Published by the Charlottesville Area Association of REALTORS
 CAAR Market Report 2010 Mid-Year Published by the Charlottesville Area Association of REALTORS Where Are We Now? The pace of home purchases in the Charlottesville market area showed a significant increase
Special Property Hotspot Report
 Special Property Hotspot Report Australia s Cheapest Suburbs with the Greatest Potential for Capital Growth for 2015 Market: Australia Created by: hotspotcentral.com.au Contact: t: 1300 200 340 For more
Property Report. Queensland
 Property Report National overview Taken as a whole, the Australian property market has cooled over recent months though in a market as diverse as ours, there are pockets of growth even amid quieter conditions.
THE SECRET AGENT REPORT VOLUME 43 - MAY 2016 SECRETAGENT.COM.AU TRUE CAPITAL GROWTH
 THE SECRET AGENT REPORT VOLUME 43 - MAY 2016 SECRETAGENT.COM.AU TRUE CAPITAL GROWTH The Inside Perspective 3 TRUE CAPITAL GROWTH by Richard Rossman 8 MARKET REVIEW by Richard Rossman " is what you pay.
Property Research Report: Capital growth opportunities in Morayfield, Queensland
 Property Research Report: Capital growth opportunities in Morayfield, Queensland www.freedom360.com.au 1300 001 070 By Todd Polke Property investor and strategic wealth coach Introduction Capital growth
RESIDENTIAL RESEARCH A REVIEW OF KEY RESIDENTIAL INDICATORS ACROSS MAJOR AUSTRALIAN CITIES
 RESIDENTIAL RESEARCH A REVIEW OF KEY RESIDENTIAL INDICATORS ACROSS MAJOR AUSTRALIAN CITIES Aug-17 Feb-18 Aug-18 Economic growth was recorded at 3.1 growth in March 2018. Unemployment across Australia was
THE AGGREGATE 2ND QUARTER 2017 TOWNRESIDENTIAL.COM A COMPREHENSIVE QUARTERLY ANALYSIS OF THE MANHATTAN MARKET BY TOWN RESIDENTIAL
 THE AGGREGATE TM 2ND QUARTER 2017 A COMPREHENSIVE QUARTERLY ANALYSIS OF THE MANHATTAN MARKET BY TOWN RESIDENTIAL Q2 2017 INTRODUCTION Welcome to The Aggregate, the quarterly residential market report published
australia s 106 Hot suburbs, up to 128% rental growth! annual best rental report exclusive! How we found our mega bargains!
 annual best rental report Property contents May 2012 $9.95 (GST incl.) exclusive! $9.95 (GST incl.) australia s BEST RENTAL suburbs 106 Hot suburbs, up to 128% rental growth! How we found our mega bargains!
Property Report. Western Australia
 Property Report Western Australia National overview Taken as a whole, the Australian property market has cooled over recent months though in a market as diverse as ours, there are pockets of growth even
RESIDENTIAL MARKET ANALYSIS
 RESIDENTIAL MARKET ANALYSIS RMLS Student Fellow Master of Real Estate Development Candidate Many of the single family housing trends in the second quarter of 2017 bounced upwards following a continuation
Property Report. South Australia
 Property Report National overview Today s climate of low interest rates coupled with property values that in some regions have fallen by 10% over the past 18 months, are giving first home buyers and entry
HOME PRICES OVER THE LAST YEAR
 HOME PRICES OVER THE LAST YEAR Every quarter, the Federal Housing Finance Agency (FHFA) reports on the year-over-year changes in home prices. Below, you will see that prices are up year-over-year in every
The State of Renters & Their Homes
 FORECLOSURES FINDING #14 The number of pre-foreclosure notices issued to one- to four-unit properties and condominiums in 2015 fell from the previous year. Pre-foreclosure notices for one- to four-unit
Cycle Monitor Real Estate Market Cycles Third Quarter 2017 Analysis
 Cycle Monitor Real Estate Market Cycles Third Quarter 2017 Analysis Real Estate Physical Market Cycle Analysis of Five Property Types in 54 Metropolitan Statistical Areas (MSAs). Income-producing real
Suburb Profile Report
 Prepared on: Prepared for: Prepared by: Phone: Email: TBAS Buyers Agents Rodney McLoughlin 048 474 304 rodney@thebuyersagencysydney.com.au BELLEVUE HILL 4.7km Distance from GPO 0.7k Population 0.5% 5 year