Intrametropolitan Patterns of Foreclosed Homes: ZIP-Code-Level Distributions of Real-Estate-Owned (REO) Properties during the U.S.
|
|
|
- Noah Bryant
- 6 years ago
- Views:
Transcription


1 Community Affairs Discussion Paper No April 21, 2009 Intrametropolitan Patterns of Foreclosed Homes: ZIP-Code-Level Distributions of Real-Estate-Owned (REO) Properties during the U.S. Mortgage Crisis Dan Immergluck Federal Reserve Bank of Atlanta: Community Affairs 1000 Peachtree Street NE Atlanta, GA P: 404/ F: 404/ W:
2 Abstract During the mortgage crisis, community developers, policymakers, and others have become increasingly concerned about the extent to which lender-owned homes, often called real-estate-owned or REO properties, have accumulated in their neighborhoods and communities. REO properties are usually vacant and, especially when geographically concentrated, can have destabilizing impacts on neighborhoods and communities. However, due to data challenges, little systematic research has been done on the intrametropolitan distributions of such properties, especially across different metropolitan regions. This paper describes the accumulation of REO within different parts of metropolitan areas as of November First, the urban-versus-suburban distribution of REO is found to vary significantly across metropolitan areas. In general, in traditionally weak-market metros many of which had substantial REO levels before the advent of the national mortgage crisis REO tend to be relatively concentrated in central cities. Conversely, in regions where REO accumulated more recently and in those with high central-city housing prices, REO tend to be somewhat more suburbanized. Second, while ZIP codes with high REO densities are disproportionately located in central cities, this pattern varies significantly across metropolitan areas. In particular, in the formerly hot-market regions where home values have declined rapidly, a large majority of ZIP codes with severe REO levels are suburban. Finally, among suburban ZIP codes, those with long commute times experienced larger increases in REO over the November 2006 to 2008 period than those with shorter commute times. The paper concludes with some broad implications for community development policy and planning. About the Author Dan Immergluck is a visiting scholar in community affairs at the Federal Reserve Bank of Atlanta and an associate professor of City and Regional Planning at the Georgia Institute of Technology. Beyond his work on foreclosures, Immergluck conducts research on housing markets, fair lending, community development finance, and related public policies. At Georgia Tech, he teaches courses in housing policy, real estate finance, and research methods. Immergluck publishes regularly in scholarly journals and has testified before Congress, the Federal Reserve Board, and state and local legislatures. Acknowledgments The author thanks Todd Greene, Karen Leone de Nie, Todd Swanstrom, and Geoff Smith for comments on an earlier version of this paper. All errors, omissions, and opinions remain the author s responsibility. Jared Yarsevich provided excellent research assistance in creating the GIS maps in Appendix A. The views expressed here are the author s and not necessarily those of the Federal Reserve Bank of Atlanta or the Federal Reserve System. Comments to the author are welcome at daniel.immergluck@atl.frb.org.
3 Introduction In addition to causing financial and social hardship for families and individuals, foreclosures can have negative effects on neighborhoods, cities, or metropolitan regions. One key concern among policymakers and community developers is the extent to which lender-owned homes, often called real-estate-owned or REO properties, accumulate in different local housing markets and, especially, within different neighborhoods or parts of metropolitan areas. Growing inventories of REO properties which are typically vacant in a community may become not just a symptom of housing market decline, but an impediment to recovery. A particular concern regarding the accumulation of REO in a local market involves the negative effects of vacant homes. 1 Foreclosed properties can have a negative effect on the value of nearby properties and are associated with higher levels of crime (Harding, Rosenblatt, and Yao, 2008; Immergluck and Smith, 2006). Moreover, the costs to local government of dealing with the negative effects of vacant REO can be significant (Apgar and Duda, 2005). These spillover costs are expected to be significantly greater if REO properties are geographically concentrated in certain neighborhoods, become blighted, or sit vacant for substantial periods of time (Mallach, 2008). 2 Even if REO properties are not blighted or associated with criminal behavior or social disorder in a particular neighborhood, an increasing amount of REO inventory in a small area might discourage price stabilization and the return of even moderate levels of home purchase activity and financing. Although they pose serious challenges for cities and neighborhoods, REO properties can also present opportunities for community developers and policymakers to turn the homes into a source of long-term affordable housing or to redevelop what can sometimes be relatively low-cost land and building stock. The growth of REO properties has prompted a variety of policy and programmatic responses, first by many local governments and nonprofits and more recently at the federal level with the advent of the Neighborhood Stabilization Program (NSP). The NSP, which was authorized in the 2008 Housing and Economic Recovery Act, provides $3.92 billion in funding over eighteen 1 Not all REO properties are vacant, or vacant during the entire REO period. In states that provide tenants with protection against immediate eviction upon foreclosure, non-owner-occupied rental properties that go into foreclosure are particularly likely to be occupied during some or all of the REO period. However, in most states, lenders are able to evict tenants fairly quickly after taking possession of a foreclosed property. Conversely, some properties in foreclosure may become vacant prior to entering REO status. 2 It is important to point out that just because a lender sells an REO property does not necessarily mean that it has been returned to some productive use that is beneficial to a community. Properties may continue to sit vacant or may be purchased by bottom feeders, who may not rehabilitate dilapidated properties. In the longer term, properties may even become tax delinquent and abandoned. The analysis in this paper does not address the nature or disposition of the property after it exits REO status. See Coulton, Schramm, and Hirsh (2008) for an excellent analysis of post-reo properties in the Cleveland area. 1
4 months to state and local governments for neighborhood recovery from vacant, foreclosed properties. 3 A second round of $2 billion in NSP funding was included in the federal stimulus package passed in early NSP funds can be used for a variety of purposes related to neighborhood recovery and stabilization, including the purchase and redevelopment of vacant properties by governmental or quasigovernmental entities such as land banks, the demolition of dilapidated properties, or the financing of home purchase activity. Despite the attention and policy response aimed at the problems of vacant, foreclosed homes, data on REO properties in the United States are generally quite scarce, especially in a form that is highly comparable across different localities or regions. A previous discussion paper described inter-metropolitan patterns of REO properties across the U.S. (Immergluck, 2008). The focus of this paper is to examine intra-metropolitan REO patterns and to determine the extent to which these patterns vary across different metropolitan regions or types of metropolitan regions. The Data Although researchers have increasingly focused their attention on foreclosure-related issues in recent years, the paucity of comprehensive, cross-market data on REO properties has made it difficult to gain a strong understanding of the REO problem since the advent of the mortgage crisis, especially because the problem has affected a wide variety of neighborhoods, cities and regions. A good deal of important research has been and is being conducted on foreclosure and REO patterns at the level of particular neighborhoods, cities, or regions. Much can be learned from these studies, and they will remain crucial to understanding local markets, to identifying differences among various markets, and, especially, to developing local responses. However, much less work has systematically examined foreclosure or REO patterns across metropolitan areas or within a wide variety of different metropolitan areas. 4 This situation is partly due to the scarcity or expense of generally comparable data that covers multiple regions or states. Data on foreclosures and post-foreclosure properties, including REO, are not compiled on a regular, uniform basis by any public agency at a multistate level. Public real estate records can be used in many places to identify lender-owned properties, although the process can be quite labor 3 For more detail on the Neighborhood Stabilization Program see Mallach (2008). 4 Some work has been done on intrametropolitan differences in REO concentrations. See Initiative for a Competitive Inner City (2008) for an example. 2
5 intensive, and the quality and accessibility of such data vary across local jurisdictions (Newman, 2008). Some firms purchase or assemble local property records data and/or foreclosure notices or filings and compile them for resale. These data can be quite expensive, and due to variations in state laws and local property records, the uniformity of these data is sometimes limited. In any one locality or region, the best data on REO property may well be local or state property records or private real estate listing data. Due to the need for comparable data across regions, this paper utilizes a large, private national database of mortgages, the Lender Processing Services Inc. (LPS) Applied Analytics data set (formerly referred to as the McDash Analytics data set), to describe REO levels at the ZIP code level the smallest geographic level available in the LPS data. The LPS data are compiled from mortgage servicing firms that collect mortgage payments for investors and lenders and that handle the associated REO. By late 2008, nine of the top ten servicers and a total of sixteen firms provided data to LPS. The data set includes monthly information, including REO status, on more than 100 million loans, including over 30 million loans that are currently active. The LPS data set does not capture all mortgages, and it significantly under represents the subprime market. As a whole, participating LPS servicers service both prime/near-prime (including Alt-A ) and subprime loans, though their volume disproportionately under represents subprime loans. Therefore, most measures in this paper are prepared after applying state-level weights to the LPS-derived data. These weights were calculated by comparing loan volumes by loan type in the LPS data to those in the Mortgage Bankers Association s National Delinquency Survey (NDS), a widely utilized data set collected from approximately 120 lenders and servicers that, while not providing the needed detail that the LPS data do, provides a more comprehensive measure of the size and composition of the mortgage market (Mortgage Bankers Association, 2007). This approach is described in more detail in Appendix B. To account for variations across ZIP codes in the number of properties that could potentially be lender-owned, REO densities are used, in which the estimates of total REO are divided by the estimated number of mortgageable properties in a ZIP code. This number is estimated by combining data from the 2000 census, aggregated at the ZIP code level, with 2007 ZIP code population estimates from ESRI, a leading geographic information systems software and data provider and the developer of ArcInfo and ArcGIS computer mapping software. Mortgageable properties include one- to four-unit residential properties, including attached townhome units, as 3
6 well as condominiums. Counts of mortgageable property estimates from the 2000 census are projected forward to 2007 in direct proportion to increases in a ZIP code s population based on the ESRI estimates. The REO density measure has the advantage over a measure of REO as a share of outstanding loans because it indicates the prevalence of REO properties relative to single-family and condominium housing stock in the ZIP code. From a community development and neighborhood stabilization perspective, the REO density measure is generally a preferred measure of REO inventory. A Typology of Metropolitan REO Markets In the earlier discussion paper that this paper follows, a simple typology of metropolitan REO markets was developed using a form of cluster analysis that groups metropolitan statistical areas (MSAs) together that are similar on two key variables: 1) their initial (August 2006) REO level; and 2) changes in home values from August 2006 to August Using the same basic cluster analysis approach together with a slightly updated weighting procedure to calculate REO levels described in Appendix B a very similar classification of metropolitan REO markets is used here. The analysis results in three clusters of MSAs, which are described in Table 1 and illustrated in Figure 1. Metropolitan areas in the largest cluster, Type 1 MSAs, are characterized by initial REO densities that are close to the median of all the MSAs. This cluster is also characterized by relatively moderate changes in home values over the 2006 to 2008 period, especially compared to Type 3 MSAs. Many, but not all, of these MSAs are moderate in population size. Finally, the median increase in estimated total REO density was relatively low. Given these characteristics, Type 1 MSAs might more descriptively be called Low Initial REO Density and Stable Price MSAs. This cluster accounts for a majority (63 percent) of MSAs but only about 50 percent of the mortgageable properties in all of the MSAs. Type 2 MSAs include regions with relatively high initial estimated REO densities. This group includes many weak-market metros as well as some stable-market regions with relatively high foreclosure and REO levels in This cluster includes the Minneapolis, Atlanta, Detroit, Indianapolis, Memphis, Cleveland, and Denver metropolitan areas, among others. These MSAs are 5 See Immergluck,
7 Table 1. Cluster Analysis: MSAs Clustered by Initial REO Density and Change in Housing Price Index, 2006 to 2008 Type 1 MSAs: Low Initial REO Density & Stable Prices Type 2 MSAs: High Initial REO Density Type 3 MSAs: Low Initial REO Density & Large Price Decline All MSAs Number of MSAs in Cluster Median Level of REO per 10,000 Mortgageable Properties, 2006 Median Increase in REO per 10,000 Mortgageable Properties, Median Percentage Point Increase in FHFA Housing Price Index, Median Number of Mortgageable Properties, 2006 Total Number of Mortgageable Properties in Cluster MSAs, ,625 95, ,038 75,878 34,858,296 16,068,752 20,261,920 72,188,968 Note: Cluster analysis used Ward s Method with squared Euclidean distance measure; clustering variables were initial REO density and change in housing price index. Data sources: Lender Processing Services Inc. (LPS) Applied Analytics, American Community, Federal Housing Finance Agency (FHFA) Figure 1. Locations of MSAs by Type Type 1 MSAs Type 2 MSAs Type 3 MSAs 5
8 characterized by moderate changes in value (at least compared to Type 3 MSAs), significant levels of initial REO and substantial increases in REO density over the study period. Type 2 MSAs might be succinctly described as High Initial REO Density regions. This group accounts for 19 percent of the MSAs but 23 percent of total MSA mortgageable properties. Type 3 MSAs generally include metropolitan areas that had very low REO densities prior to the onset of the national mortgage crisis and experienced significant loss in property values over the two-year study period. This group includes all of the California MSAs as well as most of the other formerly hot-market metropolitan areas including Las Vegas, Phoenix, Washington, D.C., and Miami most of which have seen large increases in REO density. This cluster accounted for 18 percent of MSAs but 28 percent of mortgageable properties in all of the MSAs. This group might be described as Low Initial REO Density and Large Price Decline. Suburbanization of REO among Large MSAs One way to distinguish the intrametropolitan distributions of accumulated REO within different types of metropolitan areas is to measure the extent to which REO are located in suburban versus central city areas within a metropolitan region. Because ZIP codes are the smallest geographic unit available in the LPS data set and because they do not always follow municipal boundaries, ZIP codes are classified into three groups: those that are entirely suburban; those that lie 50 percent or less (by land area) outside the central city; and those that lie 50 percent or more within the central city. 6 The former group is labeled suburb-only, the second group is labeled <50% central city, and the last group is labeled >50% central city. Central cities are defined here as the largest single census-defined central city within each MSA. 7 To measure the extent to which REO properties are located in suburban versus central-city areas, a simple ratio is developed: the share of REO in an MSA located in suburb-only ZIP codes, divided by the corresponding share of all mortgageable properties in the MSA located in these same ZIP codes. This ratio is labeled the suburban REO share ratio. If REO properties are uniformly distributed across mortgageable properties in suburban versus central-city areas, on average, then 6 Post office box ZIP codes were excluded for all analyses in this paper. In the MSAs, 1,144 post office box ZIP codes were identified, accounting for 7 percent of MSA ZIP codes, and less than an estimated 0.1 percent of MSA mortgageable properties. See Appendix B for additional discussion. 7 The U.S. Census Bureau frequently identifies more than one central city per MSA. Thus, many places typically considered suburbs by many observers are classified as central cities by the Census Bureau. I use the term central city to mean largest or principal central city within the MSA. 6
9 the suburban REO ratio for the MSA is close to If REO are disproportionately located in central-city areas, this ratio is less than 1.00; if REO are disproportionately located in suburban areas, the ratio exceeds Table 2 provides the suburban REO share ratio for the fifty largest MSAs. It also breaks out the two components of this ratio, the share of REO in suburb-only ZIP codes (the numerator) and the share of mortgageable properties in these same ZIP codes (the denominator). Table 2 shows that for most large MSAs the suburban REO share ratio is below For only eleven MSAs, lead by Austin, San Diego, Seattle, and San Francisco, does the ratio exceed The median ratio is 0.90, and ten MSAs have ratios below Scanning the table closely suggests that many of the MSAs near the top of the list are metropolitan areas where central city housing costs and incomes tend to be relatively high compared to suburban levels. Values in many of these central cities held up relatively well, at least during the study period. Higher income homeowners in such places are more likely to be in a position to avoid foreclosure more easily. Moreover, properties that do enter REO in strong housing submarkets may be sold more quickly by lenders (Mallach, 2008). Figure 2 plots the suburban REO share ratio for the top fifty MSAs against the ratio of the median home value in the principal central city to the median home value for the MSA as a whole. In MSAs that lie above 1 on the horizontal axis, central-city housing, as a whole, tends to be more expensive than suburban housing. Figure 1 corroborates the pattern discussed in Table 1, i.e., where MSAs with higher-income/higher-priced central cities tend to have high suburban REO share ratios. Figure 1 shows a significant, positive association between relatively high central-city housing prices and high suburban REO share ratios. 8 What is perhaps more interesting about Figure 2 is the extent of variation in the suburban REO share ratio that is not explained by city-suburban housing price differentials. Some MSAs with similar city-suburban price differentials have quite different suburban REO share ratios. For example, Pittsburgh, Memphis, and Milwaukee all have similar city-suburban housing price ratios, in the 0.71 to 0.73 range. However, Memphis has a substantially higher suburban REO share ratio (0.66) than Milwaukee (0.50), and Pittsburgh s ratio (0.97) is even higher. Those MSAs lying significantly below the dashed linear regression line in Figure 2 generally have REO patterns that are less concentrated in suburb-only ZIP codes (and so more concentrated in central-city or part-central-city ZIP codes) than would be expected merely by looking at city- 8 The Pearson correlation coefficient between the two variables is
10 Table 2. Suburban REO Share Ratios for 50 Largest MSAs MSA Share of REO in Suburb-Only ZIP Codes (A) Share of Mortgageable Properties in Suburb- Only ZIP Codes (B) Suburban REO to Mortgageable Property Ratio (A/B) Austin-Round Rock, TX San Diego-Carlsbad-San Marcos, CA Seattle-Tacoma-Bellevue, WA San Francisco-Oakland-Fremont, CA Virginia Beach-Norfolk-Newport News, VA-N Portland-Vancouver-Beaverton, OR-WA Washington-Arlington-Alexandria, DC-VA-MD Dallas-Fort Worth-Arlington, TX Riverside-San Bernardino-Ontario, CA New York-Northern New Jersey-Long Island, NY-NJ-PA Las Vegas-Paradise, NV Tampa-St. Petersburg-Clearwater, FL Providence-New Bedford-Fall River, RI-MA Richmond, VA Phoenix-Mesa-Scottsdale, AZ Miami-Fort Lauderdale-Pompano Beach, FL Pittsburgh, PA Los Angeles-Long Beach-Santa Ana, CA Minneapolis-St. Paul-Bloomington, MN-WI Orlando-Kissimmee, FL Sacramento-Arden-Arcade-Roseville, CA San Antonio, TX Denver-Aurora, CO Oklahoma City, OK Kansas City, MO-KS Houston-Sugar Land-Baytown, TX Charlotte-Gastonia-Concord, NC-SC Boston-Cambridge-Quincy, MA-NH Cincinnati-Middletown, OH-KY-IN Rochester, NY St. Louis, MO-IL Philadelphia-Camden-Wilmington, PA-NJ-DE-MD Atlanta-Sandy Springs-Marietta, GA Columbus, OH Hartford-West Hartford-East Hartford, CT Baltimore-Towson, MD New Orleans-Metairie-Kenner, LA Louisville/Jefferson County, KY-IN Nashville-Davidson-Murfreesboro-Franklin, TN Birmingham-Hoover, AL Cleveland-Elyria-Mentor, OH Indianapolis-Carmel, IN Detroit-Warren-Livonia, MI Chicago-Naperville-Joliet, IL-IN-WI San Jose-Sunnyvale-Santa Clara, CA Memphis, TN-AR-MS Buffalo-Niagara Falls, NY Dayton, OH Jacksonville, FL Milwaukee-Waukesha-West Allis, WI Ratio > 1.00 Median = 0.90 Data sources: LPS Applied Analytics, ZIP code decennial census, ESRI 2007 ZIP code population estimates 8
11 Figure 2. Suburban REO Share Ratio versus Central-City-to-MSA Home Value Ratio, 50 Largest MSAs, November 2008 MSA Type Data sources: LPS Applied Analytics, 2007 American Community Survey, ZIP code decennial census, ESRI 2007 ZIP code population estimates * Ratio of suburb-only ZIP codes share of MSA REO to suburb-only ZIP codes share of MSA mortgageable properties. Note: Central city includes only the largest, or principal, central city in the MSA. 9
12 suburban housing price differentials. The MSAs lying significantly above the regression line generally have REO patterns that are more concentrated in suburban areas than is explained merely by the city-suburban housing price differential. More research is needed to understand other factors that may explain the city-suburban distribution of REO in MSAs. The Locations of ZIP Codes with High REO Densities In addition to understanding the broader central-city versus suburban distribution of REO across metropolitan areas, understanding where ZIP codes with high or very high levels of REO are located both across metropolitan regions and within them is also important. While ZIP codes are typically much larger than most conceptions of neighborhood, they do signal where neighborhoods with very high concentrations of REO tend to be located. A ZIP code with an REO density of 500 REO per 10,000 mortgageable properties, for example, will tend to contain some neighborhoods with even higher REO densities. A ZIP code with an REO density of 10 per 10,000 mortgageable properties is less likely to have very many neighborhoods within it that have high REO densities. Table 3 breaks out all MSA ZIP codes with at least 200 mortgageable properties into four levels of REO density as of November Low REO ZIP codes are those with fewer than 50 REO per 10,000 mortgageable properties; mod, or moderate, REO ZIP codes are those with 50 to 199 REO per 10,000 mortgageable properties; high REO ZIP codes are those with 200 to 599 REO per 10,000 properties; and severe ZIP codes are those with 600 or more REO per 10,000 properties. 9 Table 3 shows that central-city or part-central-city ZIP codes with high or severe REO levels account for approximately 3 percent of MSA ZIP codes but 15 percent of all REO properties in MSAs. Similarly, high or severe REO ZIP codes that are entirely suburban account for only 7 percent of all MSA ZIP codes but account for 34 percent of MSA REO. Together, high and severe REO ZIP codes (including those located entirely in suburbs or fully or partly in central cities) account for 49 percent of all MSA REO while accounting for only 10 percent of ZIP codes. 9 In calculating ZIP code REO densities, ZIP codes with fewer than 200 mortgageable properties in 2007 were excluded. (MSA ZIP codes contained an average of an estimated 4,423 mortgageable properties as of 2007.) In the 357 MSAs studied, the excluded ZIP codes amounted to 4.7 percent of more than 15,000 geographic ZIP codes with nonzero populations. These same ZIP codes accounted for just 0.12 percent of mortgageable properties in all MSA ZIP codes. 10
13 Table 3. REO Distribution across Central-City vs. Suburbs and REO Density, November 2008* City-Suburb Location and REO Density Level of ZIP Code Number of ZIP Codes % of All ZIP Codes Number of Estimated Total REO % of All MSA REO All or Part Central-City, Low or Mod REO 2,234 15% 80,008 12% All or Part Central-City, High or Severe REO 369 3% 96,802 15% Suburb-only, Low or Mod REO 10,919 75% 255,211 39% Suburb-only, High or Severe REO 955 7% 224,936 34% Total 14, % 656, % Table 4. ZIP Codes by MSA Type, Central-city-suburban Location, and REO Density* MSA Type All MSAs All ZIP Code ZIP Code Geography REO Density Level Geographies suburb only <50% central city >50% central city Low <50 per 10k properties 8,262 57% 6,995 59% % % Mod / 10k properties 4,891 34% 3,924 33% % % High / 10k properties 1,174 8% 858 7% 65 7% % Severe 600+ / 10k properties 150 1% 97 1% 5 1% 48 3% ZIP Codes in All MSAs 14, % 11, % % 1, % Type 1 Low Initial REO and Relatively Stable Prices Low <50 per 10k properties 6,157 75% 5,124 77% % % Mod / 10k properties 1,928 23% 1,466 22% % % High / 10k properties 141 2% 91 1% 6 1% 44 4% Severe 600+ / 10k properties 16 0% 2 0% 0 0% 14 1% ZIP Codes in Type 1 MSAs 8, % 6, % % % Type 2 High Initial REO Low <50 per 10k properties % % 60 25% 65 18% Mod / 10k properties 1,595 53% 1,292 53% % % High / 10k properties % % 33 14% % Severe 600+ / 10k properties 41 1% 17 1% 2 1% 22 6% ZIP Codes in Type 2 MSAs 3, % 2, % % % Type 3 Low Initial REO and Large Price Declines Low <50 per 10k properties 1,237 38% 1,128 41% 28 28% 81 24% Mod / 10k properties 1,368 43% 1,166 42% 44 44% % High / 10k properties % % 26 26% 90 26% Severe 600+ / 10k properties 93 3% 78 3% 3 3% 12 4% ZIP Codes in Type 3 MSAs 3, % 2, % % % * Includes only MSA ZIP codes with at least an estimated 200 mortgageable properties in Data sources: LPS Applied Analytics; ZIP code decennial census; ESRI 2007 ZIP code population estimates. 11
14 Table 4 disaggregates ZIP codes even further based on the level of their REO densities, their suburban versus central-city location, and the type of MSA within which they are located, using the MSA typology described in Table 1 and Figure 1. Table 4 indicates how, within each MSA type, ZIP codes in different locations (suburb-only; <50% central city; >50% central city) are distributed by REO density. The first column of numbers shows that relatively few ZIP codes in Type 1 MSAs (those with low initial REO density and relatively stable prices) have high or severe REO densities. Less than 3 percent of ZIP codes in Type 1 MSAs have high or severe REO densities. Conversely, approximately 17 percent of ZIP codes in Type 2 MSAs (those with initially high REO densities) had high REO densities in November 2008, and another 1 percent had severe densities. In Type 3 MSAs (those with initially low REO densities and large price declines), 16 percent of ZIP codes had high REO densities, and another 3 percent had severe densities. Overall, suburb-only ZIP codes tend to have lower REO densities than ZIP codes that lie partly or entirely in central cities. In Type 1 MSAs, where REO levels are comparatively quite modest, the share (23 percent) of suburb-only ZIP codes having above a low REO density was lower than the corresponding share (36 percent) in >50% central-city ZIP code areas. In Type 2 and Type 3 MSAs, overall REO levels are generally higher. In Type 2 MSAs, 32 percent of >50% central-city ZIP codes had high REO densities, and another 6 percent had severe REO densities. Meanwhile, only 15 percent of Type 2 suburb-only ZIP codes had high REO densities, and only 1 percent had severe densities. In Type 3 MSAs, 26 percent of >50% central-city ZIP codes had high REO densities, and another 4 percent had severe densities. In Type 3 suburb-only ZIP codes, only 14 percent of ZIP codes had high REO densities, and only 3 percent had severe REO densities. Table 4 indicates that, overall, high and severe REO ZIP codes are disproportionately located in principal central cities. At the same time, it would be incorrect to suggest that the problem of concentrated REO is only, or even primarily, a central-city problem. In fact, Table 3 shows that the raw number of high and severe ZIP codes that are suburb-only surpasses the raw number of high and severe ZIP codes that lie within or partly within central cities by a ratio of more than two-andone-half to one (955 to 369). Suburb-only high and severe REO ZIP codes also account for 2.3 times as many REO properties as central-city or part-central-city ZIP codes with high or severe REO densities (224,936 to 96,802). Seventy-three percent of high REO and 65 percent of severe REO ZIP codes are suburb-only ZIP codes. 12
15 The extent to which high or severe REO ZIP codes are in central-city versus suburban locations varies across different MSAs and across different types of MSAs. Figure 3 shows that in Type 1 MSAs most of the relatively few (16) severe REO ZIP codes are >50% central-city ZIP codes. In Type 2 and especially Type 3 MSAs, severe REO ZIP codes are much more likely to be suburban than is the case in Type 1 MSAs. Forty-one percent of severe REO ZIP codes in Type 2 MSAs and 84 percent of severe REO ZIP codes in Type 3 MSAs are suburb-only ZIP codes. Similarly, while 65 percent of high REO ZIP codes in Type 1 MSAs are suburb-only, this number increases to 71 percent in Type 2 MSAs and to 78 percent in Type 3 MSAs. Overall, in Type 2 and especially Type 3 MSAs, the problem of concentrated REO is both an urban and suburban problem. Of course, within these MSA groupings, some MSAs will exist where the problem is more urban and others where it is more suburban, as suggested by Table 1. Type 3 MSAs include most of what are often called the bubble markets, where housing prices escalated rapidly during the period and then dropped fairly precipitously from 2006 to Many of these areas saw rapid development in suburban areas during the height of this boom, fueled in part by higher-risk subprime and exotic loans. This situation may partly explain why these MSAs have seen a greater proportion of severe REO ZIP codes located in the suburbs than is the case for Type 2 MSAs. Figures A-1 and A-2 in Appendix A examine the patterns of concentrated REO in four particular MSAs Atlanta, Cleveland, San Diego, and Las Vegas. These MSAs were chosen for closer examination both because they are MSAs with high REO densities and also because their patterns of high and severe REO ZIP codes illustrate variations in intrametropolitan patterns across MSAs. Atlanta and Cleveland are both Type 2 MSAs while San Diego and Las Vegas are both Type 3 MSAs. San Diego ranks second in terms of the suburban REO share ratio among large MSAs (see Table 2) while Las Vegas is eleventh. Meanwhile, Atlanta ranks thirty-third and Cleveland ranks forty-first on this measure. Figure A-1 is generally consistent with these rankings but also shows specific clustering of REO concentrations in different parts of these MSAs. Figure A-1 shows that in Atlanta the severe REO ZIP codes are primarily located in the central city but many high REO ZIP codes are located throughout large parts of the southern suburbs, especially in several counties that are relatively close to the urban core. In Cleveland, high and severe REO ZIP codes are even more heavily concentrated on the east side of the city and in the eastern suburbs. Conversely, in San Diego, high REO ZIP codes are mostly located outside, 13
16 Figure 3. ZIP Code REO Density by Central-city vs. Suburban Location All MSAs 100% 80% 60% 40% 20% 9% 13% 6% 21% 7% 6% 85% 80% 73% 32% 3% 65% >50% central city <50% central city suburb-only 0% Low REO Mod REO High REO Severe REO n = 8,262 n=4,891 n=1,174 n=150 Type 1 MSAs 100% 80% 60% 40% 20% 0% 10% 16% 7% 8% 31% 4% 88% 83% 76% 65% 13% Low REO Mod REO High REO Severe REO n = 6,157 n=1,928 n=141 n=16 >50% central city <50% central city suburb-only Type 2 MSAs 100% 80% 60% 40% 20% 7% 10% 7% 9% 86% 81% 23% 6% 71% 54% 5% 41% >50% central city <50% central city suburb-only 0% Low REO Mod REO High REO Severe REO n = 868 n=1,595 n=515 n=41 Type 3 MSAs Data sources: LPS Applied Analytics, ZIP code census 2000, ESRI ZIP code population estimates Note: Excludes ZIP codes with less than 200 estimated mortgageable properties. 100% 80% 60% 40% 20% 0% 7% 2% 12% 3% 17% 13% 3% 5% 91% 85% 78% 84% Low REO Mod REO High REO Severe REO n = 1,237 n=1,368 n=518 n=93 >50% central city <50% central city suburb-only 14
17 and often far outside, the central city. In Las Vegas, many high REO ZIP codes are found both within and outside the city, although much of the core Las Vegas area has high or severe REO levels. The severe ZIP codes are located outside the city, however. Figure A-2 shows that, even in Atlanta and Cleveland, ZIP codes with large increases in REO are more widely distributed than the static levels shown in Figure A-1. This situation exists because many central-city and minority neighborhoods in these MSAs already had high REO levels in These levels increased but so did the levels of many suburban ZIP codes. As of November 2008, the REO levels in most of these ZIP codes had not yet caught up to those in many of the older urban or near-urban ZIP codes, but that could change over time. Table 5 lists the fifty MSAs with the largest share of ZIP codes falling into the high or severe REO categories. Flint, Michigan, had the highest share of ZIP codes falling into the high or severe categories, with twenty-one of twenty-two ZIP codes falling into these categories. In ten MSAs, at least one-half of the ZIP codes were at the severe or high REO level. In twenty-five MSAs, at least one-third of ZIP codes fell into these categories. For MSAs overall, the share was less than 10 percent. Many of the MSAs in Table 5 are Type 2 or Type 3. Michigan and California MSAs are disproportionately represented. Examples of other MSAs with high proportions of high or severe REO ZIP codes include Las Vegas, Phoenix, Minneapolis, Memphis, Atlanta, and Miami. When comparing levels of REO across ZIP codes in different states, keeping in mind that state foreclosure laws can affect REO levels is important. First, pre-foreclosure periods the time between foreclosure notice and the completion of the foreclosure sale range widely, with expected typical pre-foreclosure times running from 38 to 312 days (Cutts and Merrill, 2008). Longer pre-foreclosure periods can slow the accumulation of REO and give lenders more time to gear up for property sales activities. Moreover, by providing more time for borrowers to cure their loans, refinance, or sell their homes, new REO entrants may be reduced. At the same time, very long pre-foreclosure periods might result in properties being neglected or abandoned by owners well before the foreclosure process is completed and properties enter REO status (Apgar and Duda, 2005) Cutts and Merrill (2008) argue that both very short and very long pre-foreclosure periods can lead to higher foreclosure rates and suggest that a pre-foreclosure period of approximately 120 days will tend to minimize foreclosure, other things being equal. 15
18 Table 5. Top 50 MSAs by Percent of ZIP Codes with High or Severe REO Densities, November 2008* High REO ( /10k) Severe REO (600+/10k) Rank by % High and Severe MSA Number of % % High Rank by ZIP Codes* Severe or Severe % Severe Flint, MI MSA** % 95.5% 34 1 Modesto, CA MSA % 81.0% 3 2 Detroit-Warren-Livonia, MI MSA** % 74.4% 7 3 Las Vegas-Paradise, NV MSA % 73.5% 10 4 Stockton, CA MSA % 68.0% 2 5 Riverside-San Bernardino-Ontario, CA MSA % 62.6% 5 6 Jackson, MI MSA** % 62.5% 34 7 Merced, CA MSA % 60.0% 1 8 Vallejo-Fairfield, CA MSA % 54.5% 9 9 Grand Rapids-Wyoming, MI MSA** % 51.0% Lansing-East Lansing, MI MSA** % 48.6% Cape Coral-Fort Myers, FL MSA % 48.1% 6 12 Salinas, CA MSA % 47.6% Phoenix-Mesa-Scottsdale, AZ MSA % 44.4% 4 14 Muskegon-Norton Shores, MI MSA** % 41.7% El Centro, CA MSA % 40.0% 8 16 Bakersfield, CA MSA % 40.0% Madera, CA MSA % 40.0% Monroe, MI MSA** % 37.5% Sacramento-Arden-Arcade-Roseville, CA MSA % 36.8% Battle Creek, MI MSA** % 36.4% Minneapolis-St. Paul-Bloomington, MN-WI MSA** % 35.2% Fresno, CA MSA % 34.1% Ann Arbor, MI MSA** % 33.3% Reno-Sparks, NV MSA % 33.3% Greeley, CO MSA** % 32.0% San Diego-Carlsbad-San Marcos, CA MSA % 28.7% Atlanta-Sandy Springs-Marietta, GA MSA % 26.7% Memphis, TN-AR-MS MSA % 26.5% Miami-Fort Lauderdale-Pompano Beach, FL MSA % 26.4% Orlando-Kissimmee, FL MSA % 25.3% Cleveland-Elyria-Mentor, OH MSA % 23.9% Saginaw-Saginaw Township North, MI MSA** % 23.5% Yuba City, CA MSA % 22.2% Cheyenne, WY MSA** % 20.0% Port St. Lucie, FL MSA % 19.0% Akron, OH MSA % 18.6% Tucson, AZ MSA % 18.2% Naples-Marco Island, FL MSA % 17.6% San Francisco-Oakland-Fremont, CA MSA % 17.6% Denver-Aurora, CO MSA** % 17.2% Chicago-Naperville-Joliet, IL-IN-WI MSA % 16.1% Santa Barbara-Santa Maria-Goleta, CA MSA % 15.8% Milwaukee-Waukesha-West Allis, WI MSA % 15.4% Anderson, IN MSA % 15.4% Holland-Grand Haven, MI MSA** % 15.4% Santa Cruz-Watsonville, CA MSA % 15.4% Cincinnati-Middletown, OH-KY-IN MSA % 15.1% Hanford-Corcoran, CA MSA % 14.3% Napa, CA MSA % 14.3% * Includes only ZIP codes with at least an estimated 200 mortgageable properties in ** MSAs in states with post-sale redemption periods of more than one month. Data sources: LPS Applied Analytics, ZIP code decennial census, ESRI 2007 ZIP code population estimates 16
19 A component of some state foreclosure processes that is likely to have an even greater impact on REO levels than the pre-foreclosure period is the existence of a substantial post-sale redemption period. 11 Eleven states have post-sale redemption periods, but only seven of these are longer than 30 days. Michigan, Minnesota, and South Dakota are notable for having very long post-sale redemption periods, estimated at approximately 180 days, although some state laws allow for substantial loan-based variation in the redemption period, depending on the nature of the mortgage and vacancy status of the property (Cutts and Merrill, 2008). During the redemption period, borrowers usually have the right to occupy the property, although the extent to which borrowers remain in homes for substantial portions of the redemption period is unclear. Therefore, because REO status might be fundamentally different and have fundamentally different effects in states with long post-sale redemption periods, Table 5 indicates those MSAs with periods of longer than 30 days. Commuting Efficiency and REO Densities in Suburban Communities Some media reports and commentators have suggested that foreclosures and/or foreclosed properties have disproportionately affected sprawling, newer suburbs or exurbs that are far from job centers (Dougherty, 2009; Leinberger, 2008). The analysis above suggests that while a disproportionate share of high or severe REO ZIP codes are located in central cities, a fairly large majority of such ZIP codes are located outside of principal central cities. To understand more about whether REO have accumulated disproportionately in what some might call location-inefficient areas, suburb-only ZIP codes can be disaggregated by commute times, which capture an important component of location efficiency what might be termed commute efficiency. 12 One measure of commute effciency is the proportion of commuters in a ZIP code using automobiles who commute more than thirty minutes to work. The 2000 census provides this measure and, although job locations and commuting patterns have certainly changed some since 2000, these are the most recent, reliable data available at the ZIP code level and are expected to be highly correlated with 11 In a separate paper (Immergluck, 2009), I find that MSAs in states with longer pre-foreclosure periods tend to have lower metropolitan REO levels, after controlling for housing prices and economic conditions, but that longer post-sale redemption periods have a large, positive impact on REO levels. 12 Location efficiency is a broader notion than commute efficiency. The term is used by urban planners and others to describe neighborhoods or small areas where automobile travel among residents is relatively low, due to proximity to job centers and reduced commuting times, but also due to proximity to mass transit and nearby shopping and amenities, as well as high levels of overall walkability. 17
20 more recent commute times. ZIP codes were categorized into three groups by the percent of residents commuting more than thirty minutes: 1) short-commute, lying in the lowest quartile among all MSA ZIP codes (less than 26.2 percent); 2) moderate-commute, in the second or third quartile (26.2 to 48.5 percent); and 3) long-commute, lying in the fourth quartile (above 48.5 percent). Figure 4 breaks out the suburb-only ZIP codes (those shaded dark green in Figure 3) by REO level and then by commute efficiency. High and severe REO ZIP codes tend to fall disproportionately into the moderate- and, especially long-commute time categories. In Type 1 MSA suburbs, only 6 (6.5 percent) of 93 high or severe REO zip codes fell into the short-commute category, compared to 22 percent of low REO zip codes. Similarly, in Type 3 MSA suburbs, only 12 percent of high or severe REO zip codes fell into the short-commute category, compared to 17 percent of low REO zip codes. Similarly, in Type 3 MSA suburbs, only 12 percent of high or severe REO ZIP codes fell into the short-commute category, compared to 17 percent of low REO ZIP codes. A cursory glance at Figure 4 might suggest that the patterns in Type 2 MSAs are somewhat inconsistent with the patterns in Type 1 and 3 MSAs, but this is primarily an artifact of the small number (seventeen) of ZIP codes in the severe REO category in Type 2 MSAs. When high and severe REO categories are combined, approximately 13 percent of such ZIP codes fall into the short-commute category, similar to the corresponding share for Type 3 MSAs. A number of factors may have contributed to the disproportionate accumulation of REO in longer-commute ZIP codes. Some of these areas may have seen more development at the height of the subprime and high-risk lending boom, i.e., from 2003 to Beyond the acute problems with underwriting and lending practices during this period, these areas were more likely to have had more recent home buyers, who had less equity built up as prices began to turn down in late 2006 and Some observers have also suggested that the rapid escalation of gasoline prices during the early stages of the mortgage crisis may have contributed to more rapid defaults and price declines in such areas (Cortright, 2008). 18
21 Figure 4. Distribution of Suburb-Only ZIP Codes by REO Density Level and Commute Time, November % Type 1 MSAs 80% 60% 40% 20% 0% 26% 27% 45% 50% 52% 55% 48% 50% 22% 18% 7% Low REO Mod REO High REO Severe REO ZIP Code Commute Time (2000) Long-Commute Moderate-Commute Short-Commute n=5,123 n=1,466 n=91 n=2 Type 2 MSAs 100% 80% 60% 40% 28% 27% 52% 52% 35% 53% 18% 59% ZIP Code Commute Time (2000) Long-Commute Moderate-Commute 20% 0% 21% 21% 12% 24% Low REO Mod REO High REO Severe REO Short-Commute n=743 n=1,292 n=365 n=17 100% Type 3 MSAs 80% 60% 40% 26% 27% 31% 32% 57% 59% 57% 55% ZIP Code Commute Time (2000) Long-Commute Moderate-Commute 20% Short-Commute 0% 17% 15% 12% 13% Low REO Mod REO High REO Severe REO n=1,126 n=1,166 n=402 n=78 disproportionately Data sources: LPS Applied into Analytics, the ZIP moderate- code census and, 2000, especially ESRI ZIP code long-commute population estimates time categories. In Type 1 Note: Excludes ZIP codes with less than 200 estimated mortgageable properties. MSA suburbs, only six (6.5 percent) of ninety-three high or severe REO ZIP codes fell into 19
22 To take a first step at examining REO growth across long- versus short-commute suburb-only ZIP codes, while controlling for changes in housing prices, data from home purchase loans from the LPS data were used. 13 A two-year change in median sales price was computed across three-month sales periods: September through November 2006 and September through November Because home sales activity declined significantly over this period, many ZIP codes had few transactions in one or more of these periods, especially the latter one. Therefore, only ZIP codes that had at least 10 sales in the data in each of the two periods were included in this particular analysis. The ZIP codes examined here are suburb-only, short-commute or long-commute ZIP codes (top and bottom quartiles only). Moreover, they contain at least 200 mortgageable properties and had at least 10 home purchase loans in the LPS data in each of the three-month periods. This results in a total of approximately 1,400 ZIP codes. Figure 5 plots the change in REO density from November 2006 to November 2008 against the percent change in the median sale price for single-family homes from the initial three-month period to the ending three-month period. The plot is disaggregated by MSA type and by commute efficiency of the ZIP code. Only short- and long-commute ZIP codes categories are included in the comparison. The lines on the graphs are attempts to fit curves to the pattern of the data, using a technique called locally weighted polynomial regression. 14 The plots in Figure 5 suggest at least two things. First, they indicate that, not surprisingly, ZIP codes in Type 3 MSAs tended to see larger declines in median sales prices over the two-year period. This finding is expected as the change in MSA home values was one of the two clustering variables used in defining the three MSA types. However, the plots of Type 3 ZIP codes suggest that as price declines grew larger in magnitude (moving to the left on the x axis), the increase in REO was somewhat larger, on average, in the long-commute ZIP codes than in the short-commute ZIP codes. While more research is needed here, this finding is at least suggestive of the notion that at least in Type 3 MSAs foreclosures in neighborhoods located far from job centers may be more likely to either end up or stay longer in REO, or both. Suburbs located far from job centers, therefore, may tend to see a slower or more anemic absorption of REO properties than more commute-efficient areas. 13 Because physical characteristics (other than being single-family detached) of the actual homes are not available in the LPS data, this approach is limited. It only looks at changes in median home sales prices and does not control for changes in the size or other attributes of the homes sold at the two different points in time. 14 Also known as loess curve fitting. The weighting used was tri-cube; a minimum of 50 percent of points used was specified. 20
23 Figure 5. Change in REO Density vs. Change in ZIP Code Median Home Prices in Short-Commute versus Long-Commute Suburb-Only ZIP Codes, November 2008 Suburb-Only, Short-Commute ZIP Codes Suburb-only, Long-Commute ZIP Codes n=109 n=321 Change in Number of REO per 10,000 Mortgageable Properties, November 2006 to November 2008 n=121 n=222 n=330 n=300 Data sources: LPS Applied Analytics, ZIP code decennial census, ESRI 2007 ZIP code population estimates Notes: Excludes all ZIP codes with fewer than 10 home purchase loans in either September to November 2006 or September to November 2008 and excludes all ZIP codes with less than an estimated 200 mortgageable properties. Fit line is Loess curve, uniform weighting; 50% of observations minimum. 21
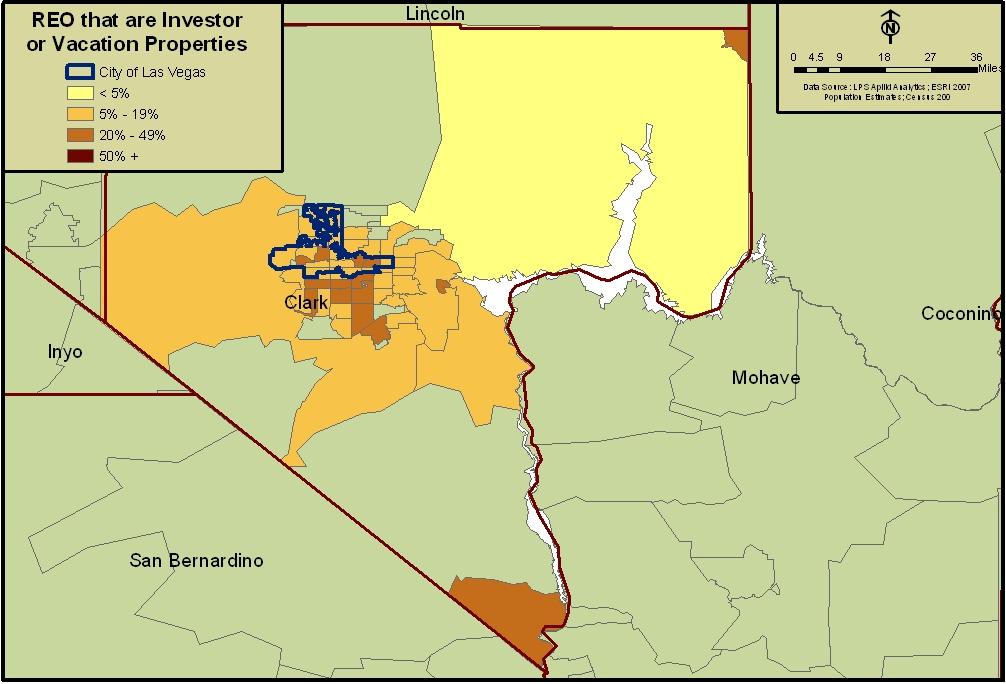
24 Other Characteristics of REO: Condominium/Townhomes and Investor/Vacation Properties Besides the intrametropolitan location of one- to four-unit REO properties, some other features of the REO stock vary significantly across MSAs. Two important characteristics include: 1) the number of properties that were not used as a primary residence; and 2) the extent of condominiums and townhomes among the local REO inventory. First, understanding the extent to which REO were investor/rental properties is important. (In most MSAs, the bulk of nonprimary-residence properties are investor/rental properties. Vacation properties are generally only substantial in tourism-oriented communities.) Investor REO properties may be more likely to need more rehabilitation prior to reoccupancy than owner-occupied properties, for example. Moreover, near-term policy responses might be targeted at rental properties to reduce vacancy problems. For example, Fannie Mae and Freddie Mac announced policies in late 2008 and early 2009 to allow tenants in foreclosed rental properties to remain in the homes during REO status on month-to-month leases. In addition to reducing the burden on the renters, such policies could reduce the negative impacts of the REO on local communities by keeping the properties occupied. Understanding the basic type of the housing units themselves that comprise the REO inventory in a community is important. Foreclosed townhomes and especially condominiums may have substantially different ramifications for neighborhoods and communities than foreclosed singlefamily homes. In high-rise condominiums in particular, the effect of numerous vacant REO properties may be somewhat more isolated and less likely to constitute a problem with physical blight. On the other hand, when particular condominium buildings or communities reach high levels of vacancy (perhaps from REO properties, but especially in newer buildings unsold units could also prove problematic), the financial solvency of the condominium association can be threatened as common-area costs have to be spread over fewer occupants. Figures 6 and 7 examine these characteristics for the fifty largest MSAs. Figure 6 plots the percent of estimated total REO properties (as of November 2008) that were formerly vacation or investor properties. Investor properties are generally rental properties. An important point to note here is that this figure includes only one- to four-unit properties. However, these properties constitute the majority of the rental housing stock in many metropolitan areas. 22
25 Figure 6. Percent of Total REO That Were (Formerly) Not Primary Residences, November 2008 Figure 7. Percent of Total REO That Were Condominiums/Townhomes, November 2008 Data sources: LPS Applied Analytics, ZIP code decennial census, ESRI 2007 ZIP code population estimates 23
26 Figure 6 shows that the proportion of REO inventory in late 2008 that were investor or vacation properties ranged from the San Jose MSA at 2 percent to the Austin MSA at 22 percent. 15 Moreover, the figure shows a fairly linear and declining relationship between the share of investor/vacation properties and the MSA median home value. One probable contributor to this relationship is that in higher cost markets rental housing is more likely to be concentrated in multifamily (five or more units) buildings. In such markets, while dispersed single family rental properties certainly exist, the economics of rental housing favor higher density, multifamily buildings as a means of supply. In many lower-cost housing markets, land prices and housing unit densities are lower. Therefore, the economics of single-family rental housing tend to be relatively more favorable at least in the sense that there tends to be less competition from multifamily rental properties. Thus, MSAs such as Cleveland, Rochester (NY), Buffalo, and other lower-cost markets tend to have higher percentages of one- to four-unit properties used as rentals than highercost MSAs. Differences in land use policy and other factors across cities, MSAs, and states can affect the supply of small rental properties. Moreover, variations in income levels, income inequality, and demographics affect the overall demand for rental housing in a locality. For example, the University of Texas is likely an important factor in explaining why the Austin MSA has such a large percentage of investor-owned REO. Younger populations, and especially students, are more likely to rent, so that areas with younger populations are likely to see lower homeownership rates. Figure A-3 plots the share of REO in November 2008 that were investor or vacation properties for Atlanta, Cleveland, San Diego, and Las Vegas. In Atlanta, investor/vacation REO were concentrated both in the central city and some inner suburban communities and in some outer suburban areas. Some of the latter locations are likely due to vacation homes rather than rental properties. In Cleveland, the shares of REO that were investor/vacation (predominantly the former) properties in many parts of the central city were quite high, at more than 20 percent. Given the overall high REO rate in many of these same areas, a relatively large percentage of REO in Cleveland overall are investor-rental properties. 15 Significant limitations exist to the data used here (and to most data on foreclosure and REO) in terms of identifying properties used as a primary residence. First, some properties may be purchased to be used as a primary residence but then later become used as a rental property or vacation home. There are also incentives (e.g., somewhat lower mortgage rates and property tax homestead exemptions) to claim a property is owner occupied. Thus, these data are likely to underestimate the extent to which properties are not effectively used as primary residences. 24
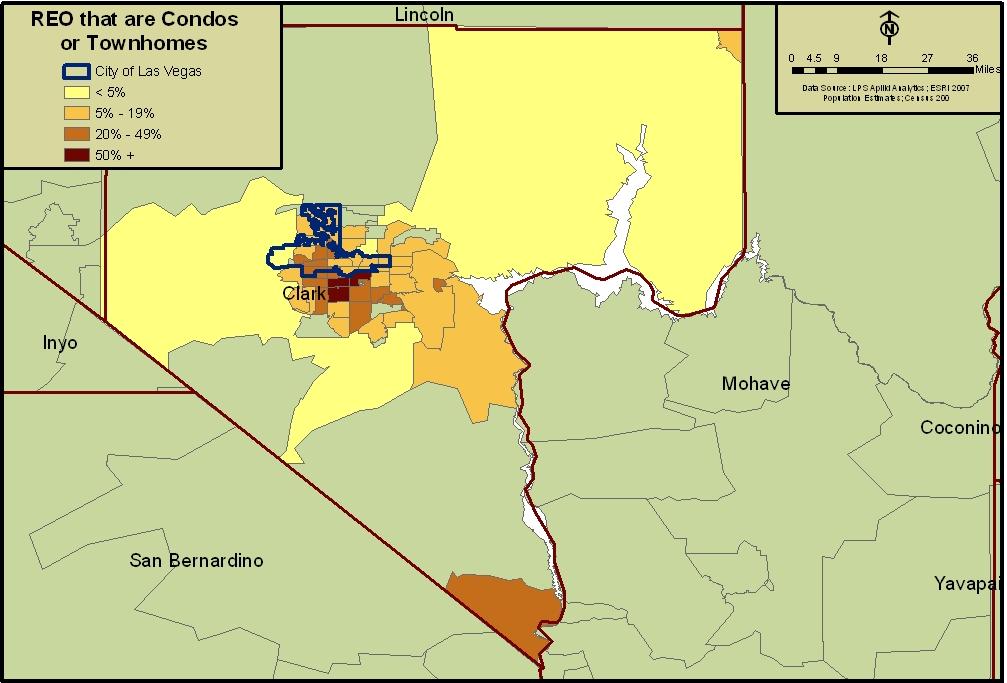
27 Figure 6 showed that San Diego had a relatively low percentage of REO that were investor/vacation properties. Figure A-3 is consistent with this, indicating that in many ZIP codes fewer than 5 percent of REO were investor/vacation homes. Generally somewhat higher levels of nonprimary-residence REO exist in the central city, but some of the highest levels were in outlying ZIP codes. Las Vegas is more like Atlanta and Cleveland in that a relatively large share of its REO was investor/vacation properties (see Figure 6). The areas in the Las Vegas MSA with relatively high nonprimary-residence REO tended to lie south of the central city. Figure 7 plots the share of total estimated REO that are condominiums or townhomes for the fifty largest MSAs. These shares range from a low of less than 1 percent in the Buffalo MSA to 38 percent in the Miami MSA. As might be expected, MSAs with higher housing costs tend to have higher shares of REO that are condominiums or townhomes due to the fact that these cities have seen much more townhome and condominium development over recent decades. In Atlanta, the areas with high percentages of REO that were condominiums or townhomes were concentrated along the affluent Midtown-Buckhead corridor on the north side of the city of Atlanta and in north suburban Fulton County. In Cleveland, by contrast, very little condominium or townhome REO is found in the central city, with scattered pockets of such activity in suburban areas. In San Diego, which has relatively high land values in and near its central city, condominiums and townhomes often constitute a large percentage of REO in many central-city and inner suburban ZIP codes, either in the percent range or over 50 percent. In Las Vegas, in many of the areas where large percentages of REO were investor/vacation properties especially just south of the central city many of the REO properties are condominiums or townhomes. Summary and Conclusions The fundamental purpose of this paper is to develop a better understanding of the intrametropolitan patterns of REO accumulation across a wide variety of metropolitan areas, or MSAs. The paper also identifies some differences in ZIP-code-level patterns across different types of MSAs. The primary findings include the following: As of late 2008, when accounting for the number of mortgageable properties in central cities versus suburbs, REO properties were disproportionately located in principal central cities as compared to suburban areas. Among the largest fifty MSAs, the suburban REO share ratio for all but eleven MSAs was below 1.0, with a median of 0.9. In MSAs with suburban REO share 25
28 ratios below 1.0, REO were disproportionately located in primary central cities. (See Table 2 and Figure 2.) The urban-suburban distribution of REO varies significantly across MSAs. One factor that is positively associated with higher suburban REO shares is the ratio of central-city to MSA housing values. In MSAs with higher housing costs, suburban REO levels tend to be higher, after controlling for the distribution of mortgageable properties. In MSAs such as San Francisco, Seattle, and Portland, with high central-city housing values compared to their suburbs, REO is disproportionately located in suburban ZIP codes while in MSAs such as Cleveland, Detroit, and Memphis, with much lower central-city housing values, REO is disproportionately located in the central city at fairly high rates. (See Figure 2.) Although REO properties are disproportionately concentrated in central cities, the problem of concentrated REO was not solely or even primarily a central-city problem. Due partly to the much larger aggregate volumes of mortgageable properties in suburban communities, the majority of REO were not located in central cities as of late More importantly, when looking at the number of ZIP codes with high or severe levels of REO a measure of submetropolitan areas with high REO concentrations the number of suburb-only ZIP codes in these categories outnumbered the number of central-city and part-central-city ZIP codes by a factor of more than 2.5 to 1. Suburb-only high and severe REO ZIP codes also accounted for 2.3 times as many REO properties as high and severe REO ZIP codes in central-city and partcentral-city ZIP codes. (See Table 3.) In general, Type 3 MSAs (low initial REO density and large price declines) which include many of what are often called the bubble markets, where housing prices escalated and then fell rapidly in recent years generally saw a greater concentration of severe REO ZIP codes in suburban areas than did Type 1 (low initial REO density and stable prices) or Type 2 (high initial REO density) MSAs. Many of these areas saw rapid development in suburban areas during the height of this boom, fueled in part by higher-risk subprime and exotic loans. (See Figure 3.) Among suburban ZIP codes, those with large proportions of residents commuting long distances tended to see larger increases in REO than shorter-commute ZIP codes. In Type 1 MSA suburbs, only six (6.5 percent) of ninety-three high or severe REO ZIP codes fell into the short-commute category, compared to 22 percent of low REO ZIP codes. In Type 2 and 3 MSA suburbs, only 12 to 13 percent of high or severe REO ZIP codes fell into the shortcommute category, compared to 21 and 17 percent of low REO ZIP codes, respectively. (See Figure 4.) 26
29 The percentages of one- to four-unit REO that were not primary residences were generally higher in lower-cost MSAs, such as Cleveland, Detroit, and Buffalo, where the composition of rental housing is much more single-family than multifamily oriented. Many of these rental properties are concentrated in central cities and low- or moderate-income areas, as shown in the maps of Atlanta and Cleveland in Figure A-3. (See Figure 6.) As might be expected, the condominium/townhome REO levels are generally higher in higher-cost MSAs, where these housing types are more prevalent. Maps in the appendix indicate that these REOs tend to be highly concentrated within metropolitan areas and may be concentrated in quite different locations. In Atlanta, for example, the concentrations are highest in the affluent north side of the city and just to the north of the city, while in Cleveland, concentrations are all entirely outside of the central city. (See Figure 7.) These findings are likely to have a wide variety of detailed implications for planning and policy regarding the recovery and stabilization of neighborhoods that have been heavily affected by the mortgage crisis and REO properties. The goal here is to understand patterns and variations in these patterns across MSAs and types of MSAs and to suggest some broad implications for policy and planning responses. These include the following: Policymakers, community developers, and others should be careful not to extrapolate too quickly from what is learned about foreclosure and REO patterns in one locality or region to another without first understanding the likely differences between the two areas. The analysis here suggests that the nature and geographic distributions of REO properties vary significantly across different metropolitan areas, although some common patterns exist within various metropolitan REO market types. The large numbers of high and severe REO ZIP codes in suburban communities and in many metropolitan areas that do not have highly established community development infrastructures suggest that many places may have a limited capacity to respond to growing REO problems. Many suburban communities have little governmental or nonprofit infrastructure or experience related to these types of housing or community development challenges and may be ill equipped to deal with problems of vacant properties (Swanstrom and Chapple, 2009). Some suburban planners or policymakers may also face significant local resistance to any redevelopment plans that seek to convert traditional low-density, owner-occupied residential properties to alternative uses, especially if the uses involve rental housing. Although more localized research is needed to inform particular state or local policy and planning, the disproportionate shares of high and severe REO ZIP codes with long commute 27
30 times suggests that policymakers, planners, and community developers should be careful in addressing the REO problems in such areas. It may be unwise to spend scarce resources attempting to redevelop residential patterns that may not be highly sustainable in the context of more conservative mortgage markets or higher long-term energy and transportation costs. The importance of understanding cross-market differences in REO patterns speaks to the need for federal policymakers to develop reliable, publicly available data that can be used to track foreclosure and REO activity and, to the degree possible, that are comparable across neighborhoods, localities, and states. The data used in this study are not generally available at reasonable costs for most researchers and policy analysts, are not entirely comprehensive, and depend on the voluntary participation of loan servicers. Data on loans entering foreclosure through the REO process could be required from all mortgagees via federal regulations, similar to the way loan origination data is reported and disclosed via the Home Mortgage Disclosure Act (HMDA). Moreover, the linking of mortgage origination data from HMDA through to the REO stage would be particularly helpful. If federal data prove politically infeasible, states could take the lead. More transparent and accessible data could be collected by states through state-level property record keeping. Currently in most states, lower-level jurisdictions typically counties collect and manage property records data, leading to a great deal of variability in the quality and accessibility of the data. Understanding the accumulation of REO inventories across and within metropolitan areas is important for formulating policies and informing community development practice regarding how to stabilize communities and neighborhoods that have been affected by surging foreclosures and vacant properties. More research will be needed to monitor whether the REO patterns identified in this study will hold over the longer term. As financial and housing markets recover more broadly, problems of geographically concentrated REO may decline in some places but persist in others. Moreover, changes in the types of loans entering foreclosure over time are likely to alter the nature and geography of new foreclosures and new REO. 28
31 Appendix A: Maps of REO Patterns in the Atlanta, Cleveland, Las Vegas, Miami, and San Diego MSAs Figure A-1. REO Density as of November 2008 Figure A-2. Change in REO Density, November 2006 to November 2008 Figure A-3. Percent of Total REO That Was Investor/Vacation Property, November 2008 Figure A-4. Percent of Total REO That Were Condominiums/Townhomes, November 2008 Data sources for maps: LPS Applied Analytics, ZIP code decennial census, ESRI 2007 ZIP code population estimates. Only ZIP codes with at least an estimated 200 mortgageable properties are included. A-1


32 Federal Reserve Bank of Atlanta, Community Affairs Discussion Paper Figure A-1. REO Density (REO per 10,000 mortgageable properties), November 2008 Cleveland Atlanta Las Vegas San Diego A-2


33 Figure A-2. Change in REO Density, November 2006 to November 2008 Atlanta Cleveland San Diego Las Vegas A-3


34 Figure A-3. Percent of Total REO That Were Investor/Vacation Properties, November 2008 Atlanta Cleveland San Diego Las Vegas A-4


35 Figure A-4. Percent of Total REO That Were Condominiums/Townhomes, November 2008 Atlanta Cleveland San Diego Las Vegas A-5
MAMA Risk Summary Data through 2011 Q3
 MAMA Risk Summary Data through 2011 Q3 Table of Contents Report Contents... 2 Summary... 3 MAMA Risk Summary Indicators for Largest 50 Metro Areas... 4 Home Prices Risk Indicator Summary Map... 6 Employment
Housing Affordability: Local and National Perspectives
 University of Pennsylvania ScholarlyCommons 2018 ADRF Network Research Conference Presentations ADRF Network Research Conference Presentations 11-2018 Housing Affordability: Local and National Perspectives
The U.S. Housing Confidence Index
 March 2018 www.pulsenomics.com 2014-2018 Pulsenomics LLC Pulsenomics, Housing Confidence Survey, and Housing Confidence Index are trademarks of Pulsenomics LLC. HCI Each Housing Confidence Index (HCI)
The Gains from Right to Rent
 The Gains from Right to Rent Dean Baker and Hye Jin Rho July 2009 Center for Economic and Policy Research 1611 Connecticut Avenue, NW, Suite 400 Washington, D.C. 20009 202-293-5380 www.cepr.net CEPR The
Joint Center for Housing Studies. Harvard University
 Joint Center for Housing Studies Harvard University Re-Weighting the Number of Households Undertaking Home Improvements in the 2013 American Housing Survey to Correct for Shifting Data Collection Periods
California s Housing Market: How Much Froth Is Out There?
 California s Housing Market: How Much Froth Is Out There? Conference Underwriter Polling Question: What Will Most Likely Occur to California s Housing Prices in the Next 2 Years? 1. Bubble Bursts 15% or
A SIMULATION: MEASURING THE EFFECT OF HOUSING STIMULUS PROGRAMS ON FUTURE HOUSE PRICES
 Research Brief April 2010 First American CoreLogic A SIMULATION: MEASURING THE EFFECT OF HOUSING STIMULUS PROGRAMS ON FUTURE HOUSE PRICES www.facorelogic.com 800.345.7334 2009 First American CoreLogic,
Foreclosures Continue to Bring Home Prices Down * FNC releases Q Update of Market Distress and Foreclosure Discount
 Foreclosures Continue to Bring Home Prices Down * FNC releases Q4 2011 Update of Market Distress and Foreclosure Discount The latest FNC Residential Price Index (RPI), released Monday, indicates that U.S.
VSIP POSITION LISTING American Federation of Government Employees
 HQ Washington, DC Office of Public Housing Investments Public Housing Revitalization Specialist GS 15 11 Public Housing Revitalization Specialist GS 14 14 Public Housing Revitalization Specialist GS 13
NATIONAL ASSOCIATION OF REALTORS RESEARCH DIVISION
 NATIONAL ASSOCIATION OF REALTORS RESEARCH DIVISION COMMERCIAL REAL ESTATE Positive Demand Overcomes Weak Economic Performance in 2014.Q1 George Ratiu Director, Quantitative & Commercial Research First
Is US Housing Over- or Under-Priced?
 January 4, 2011 Is US Housing Over- or Under-Priced? Some Historical Perspective by Gleb Nechayev CBRE Econometric Advisers Boston, Mass. Gleb.Nechayev@CBRE.com William C. Wheaton Department of Economics
Market Trends and Outlook
 Residential Remodeling Market Trends and Outlook Kermit Baker Remodeling Futures Conference April 3, 2012 Remodeling Market Overview 1. Home improvement spending totaled an estimated $290 billion last
LUXURY MARKET REPORT. - May
 LUXURY MARKET REPORT - May 2018 - www.luxuryhomeing.com THIS IS YOUR LUXURY MARKET REPORT MAP OF LUXURY RESIDENTIAL MARKETS Welcome to the Luxury Report, your guide to luxury real estate market data and
Housing Supply Restrictions Across the United States
 Housing Supply Restrictions Across the United States Relaxed building regulations can help labor flow and local economic growth. RAVEN E. SAKS LABOR MOBILITY IS the dominant mechanism through which local
STOCKTON, DETROIT, RIVERSIDE-SAN BERNARDINO POST TOP METRO FORECLOSURE RATES ACCORDING TO REALTYTRAC Q METROPOLITAN FORECLOSURE MARKET REPORT
 STOCKTON, DETROIT, RIVERSIDE-SAN BERNARDINO POST TOP METRO FORECLOSURE RATES ACCORDING TO REALTYTRAC Q3 2007 METROPOLITAN FORECLOSURE MARKET REPORT California, Florida and Ohio Cities Account for 17 of
LUXURY MARKET REPORT. - March
 LUXURY MARKET REPORT - March 2018 - www.luxuryhomeing.com THIS IS YOUR LUXURY MARKET REPORT MAP OF LUXURY RESIDENTIAL MARKETS Welcome to the Luxury Report, your guide to luxury real estate market data
Naturally Occurring Affordable Housing
 Naturally Occurring Affordable Housing NAAHL Annual Conference December 1, 2016 page 1 Slicing And Dicing Rental Housing U.S. Rental Housing Inventory By Units Rent Subsidized 3.3 Million 8% Market Rate
The Link Between Middle-Income Housing Affordability and Affordable Housing
 REBIC 2017 FORUM UNCC Downtown Charlotte Campus Wendell Cox 1 February 2017 The Link Between Middle-Income Housing Affordability and Affordable Housing The Link Between Middle-Income Housing Affordability
LUXURY MARKET REPORT. - March
 LUXURY MARKET REPORT - March 2018 - www.luxuryhomemarketing.com THIS IS YOUR LUXURY MARKET REPORT MAP OF LUXURY RESIDENTIAL MARKETS Welcome to the Luxury Market Report, your guide to luxury real estate
List of 2009 Round Allocations
 List of 2009 Round Allocations CDFI 601 Thirteenth Street, NW, Suite 200, South, Washington, DC 20005 (202) 622-8662 9 10 CDFI 601 Thirteenth Street, NW, Suite 200, South, Washington, DC 20005 (202) 622-8662
Recovery? Growth? Jobs? Capital Investment?
 Recovery? Growth? Jobs? Capital Investment? Turning the Corner? Presented by Dr. Ivan Miestchovich, Jr., Director Institute for Economic Development & Real Estate Research The University of New Orleans
REALTOR.COM MARKET OUTLOOK
 REALTOR.COM MARKET OUTLOOK Realtor.com Economics May 2018 MOST COMPETITIVE SEASON ON RECORD Key expectations from realtor.com Existing Home Sales Struggle to Break Out Supply: Inventory, Prices, Affordability
(904) (904)
 (904)") Press Release For more information: Media contact: Investor contact: Michelle Kersch Nancy Murphy (904) 854-5043 (904) 854-8640 michelle.kersch@lpsvcs.com nancy.murphy@lpsvcs.com LPS Home Price Index Report:
Press Release For more information: Media contact: Investor contact: Michelle Kersch Nancy Murphy (904) 854-5043 (904) 854-8640 michelle.kersch@lpsvcs.com nancy.murphy@lpsvcs.com LPS Home Price Index Report:
Facilitating Transfer of REO to Stabilize Neighborhoods. Racquel Reddie Community Development Director Southeast USA
 Facilitating Transfer of REO to Stabilize Neighborhoods Racquel Reddie Community Development Director Southeast USA 1 NCST - What We Do Creating the bridge to stronger neighborhoods The National Community
TARRANT COUNTY HOUSING ASSISTANCE OFFICE 2018 LANDLORD SEMINAR
 TARRANT COUNTY HOUSING ASSISTANCE OFFICE 2018 LANDLORD SEMINAR 1 HUD UPDATES 2 UNIFORM PHYSICAL CONDITION STANDARDS FOR VOUCHERS UPCS-V Improved method for Inspecting housing unit Reduce subjectivity to
More Savings for More Residents: Progress in Multifamily Housing Energy Efficiency
 More Savings for More Residents: Progress in Multifamily Housing Energy Efficiency Stefen Samarripas, Dan York, and Lauren Ross February 2017 Report U1702 American Council for an Energy-Efficient Economy
SPECIAL REPORT. Single-Family Rent Index: H Review
 SPECIAL REPORT Rent Index: H1 2018 Review FEBRUARY 2018 1 National Overview Single-family rentals make up one-half of all residential rentals but are an overlooked segment of the housing market. Much like
LUXURY MARKET REPORT. - February
 LUXURY MARKET REPORT - February 2018 - www.luxuryhomeing.com THIS IS YOUR LUXURY MARKET REPORT MAP OF LUXURY RESIDENTIAL MARKETS Welcome to the Luxury Report, your guide to luxury real estate market data
Release Date: May 21, 2009 March Key Characteristics
 Release Date: May 21, 2009 March 2009 Key Characteristics The RPX 25-MSA Composite has stabilized since January 2009, after being in virtual freefall for much of 2008. The Composite declined only 0.3 percent
RETAIL REPORT VIEWPOINT 2018 / COMMERCIAL REAL ESTATE TRENDS. By: Hugh F. Kelly, PhD, CRE IRR.COM AN INTEGRA REALTY RESOURCES PUBLICATION
 RETAIL REPORT VIEWPOINT 2018 / COMMERCIAL REAL ESTATE TRENDS By: Hugh F. Kelly, PhD, CRE Nowhere do we hear more discussion of disruption as in the retail property sector. Ecommerce has a powerful effect,
U.S. GDP (2012 Q Q2)
") U.S. GDP (2012 Q3 2014 Q2) U. S. Employment Employment Recovery Following the Last Two Downturns Rail Traffic: Containers Rail Traffic: Commodities Select Rail Traffic Residential Mortgages Pipeline of
U.S. GDP (2012 Q3 2014 Q2) U. S. Employment Employment Recovery Following the Last Two Downturns Rail Traffic: Containers Rail Traffic: Commodities Select Rail Traffic Residential Mortgages Pipeline of
Guide for Estimating Affordability and Cap Exclusions for 2018 Deliveries
 Guide for Estimating Affordability and Exclusions for 2018 Deliveries This is a reference guide for how the percentage excluded from the scorecard cap for an individual deal is calculated. The Multifamily
LUXURY MARKET REPORT. - January
 LUXURY MARKET REPORT - January 2018 - www.luxuryhomemarketing.com THIS IS YOUR LUXURY MARKET REPORT MAP OF LUXURY RESIDENTIAL MARKETS Welcome to the Luxury Market Report, your guide to luxury real estate
Municipal Finance: Conditions, Local Responses, and Outlook for the Future
 Municipal Finance: Conditions, Local Responses, and Outlook for the Future Chris Hoene, Director, Policy & Research, National League of Cities Michael A. Pagano, Dean, College of Urban Planning & Public
By several measures, homebuilding made a comeback in 2012 (Figure 6). After falling another 8.6 percent in 2011, single-family
. After falling another 8.6 percent in 2011, single-family") 2 Housing Markets With sales picking up, low inventories of both new and existing homes helped to firm prices and spur new single-family construction in 212. Multifamily markets posted another strong year,
2 Housing Markets With sales picking up, low inventories of both new and existing homes helped to firm prices and spur new single-family construction in 212. Multifamily markets posted another strong year,
ECONOMIC CURRENTS. Vol. 4, Issue 3. THE Introduction SOUTH FLORIDA ECONOMIC QUARTERLY
 ECONOMIC CURRENTS THE Introduction SOUTH FLORIDA ECONOMIC QUARTERLY Vol. 4, Issue 3 Economic Currents provides an overview of the South Florida regional economy. The report presents current employment,
U.S. Economic and Institutional Apartment Market Overview and Outlook. January 7, 2015
 U.S. Economic and Institutional Apartment Market Overview and Outlook January 7, 2015 Emerging Economic Trends Inflation Adjusted Crude Oil Prices In Alignment with Long-Term Average Price per Barrel (Nov.
IRVINE, Calif. May 8, 2014
 ALL-CASH SHARE OF U.S. RESIDENTIAL SALES REACHES NEW HIGH IN FIRST QUARTER EVEN AS INSTITUTIONAL INVESTOR SHARE OF SALES DROPS TO LOWEST LEVEL SINCE Q1 2012 May 5, 2014 By RealtyTrac Staff All-Cash Purchases
ECONOMIC COMMENTARY. Housing Recovery: How Far Have We Come? Daniel Hartley and Kyle Fee
 ECONOMIC COMMENTARY Number 13-11 October, 13 Housing Recovery: How Far Have We Come? Daniel Hartley and Kyle Fee Four years into the economic recovery, housing markets have fi nally started to improve.
OFFICE OF PERSONNEL MANAGEMENT. 5 CFR Part 531 RIN: 3206-AM88. General Schedule Locality Pay Areas
 This document is scheduled to be published in the Federal Register on 10/27/2015 and available online at http://federalregister.gov/a/2015-27380, and on FDsys.gov 6325-39 OFFICE OF PERSONNEL MANAGEMENT
Citi Global Property CEO Conference March 2016
 Citi Global Property CEO Conference March 2016 1 Table of Contents Company Overview 3 6 Multifamily Fundamentals 7 11 Camden s Portfolio 12 18 Real Estate Transactions 19 25 Capital Structure & Liquidity
(904) (904)
 (904)") Press Release For more information: Media contact: Investor contact: Michelle Kersch Nancy Murphy (904) 854-5043 (904) 854-8640 michelle.kersch@lpsvcs.com nancy.murphy@lpsvcs.com LPS' April HPI Report:
Press Release For more information: Media contact: Investor contact: Michelle Kersch Nancy Murphy (904) 854-5043 (904) 854-8640 michelle.kersch@lpsvcs.com nancy.murphy@lpsvcs.com LPS' April HPI Report:
Investor Presentation September 2014
 Investor Presentation September 2014 1 Forward-Looking Statements In addition to historical information, this presentation contains forward-looking statements under the federal securities law. These statements
Changing Geography of Improvement Spending
 Changing Geography of Improvement Spending The areas of the country hardest hit by the broader housing market slowdown where house prices and home sales have collapsed and where mortgage defaults and foreclosures
Black Knight Home Price Index Report: December Transactions U.S. Home Prices Down 0.1 Percent for the Month; Up 4.5 Percent Year-Over-Year
 Press Release For more information: Media contact: Michelle Kersch 904.854.5043 michelle.kersch@bkfs.com Black Knight Home Price Index Report: December Transactions U.S. Home Prices Down 0.1 Percent for
Pennsbury Professional Center 201 Woolston Drive Morrisville, PA
 Pennsbury Professional Center 201 Woolston Drive Morrisville, PA A VALUE-ADD MEDICAL OFFICE OPPORTUNITY WITH CONVENIENT ACCESS TO ROUTE 1 AND DENSE SURROUNDING POPULATION INVESTMENT SUMMARY Page 1 EXECUTIVE
Metropolitan Area Statistics
 Metropolitan Area Statistics Apartment Completions 1Q 2011 1Q 2012 % Chg Atlanta - - n/a Boston 133 39-71% Chicago - 20 n/a Cleveland - - n/a Columbus - 272 n/a Dallas-Ft. Worth 604 1,059 75% Denver 328
Investor Presentation February 2015
 Investor Presentation February 2015 1 Forward-Looking Statements In addition to historical information, this presentation contains forward-looking statements under the federal securities law. These statements
Cycle Monitor Real Estate Market Cycles
 Cycle Monitor Real Estate Market Cycles Second Quarter 0 Analysis August 0 Physical Market Cycle Analysis of All Five Major Property Types in More Than 0 MSAs. Economic and job growth continue at a moderate
MULTIFAMILY REPORT VIEWPOINT 2018 / COMMERCIAL REAL ESTATE TRENDS. By: Hugh F. Kelly, PhD, CRE IRR.COM AN INTEGRA REALTY RESOURCES PUBLICATION
 MULTIFAMILY REPORT VIEWPOINT 2018 / COMMERCIAL REAL ESTATE TRENDS By: Hugh F. Kelly, PhD, CRE Just when the upcycle for rental apartments seemed to be approaching its peak, along came the Tax Act of 2017,
National Property Type Cycle Locations. Retail 1st Tier Regional Mall. Industrial R&D Flex Retail Factory Outlet+1 Retail Neighborhood/Community
 Cycle Monitor Real Estate Market Cycles Third Quarter 0 Analysis November 0 Physical Market Cycle Analysis of All Five Major Property Types in More Than 0 MSAs. International turmoil, slow European Union
Cycle Forecast Real Estate Market Cycles Second Quarter 2018 Estimates
 Cycle Forecast Real Estate Market Cycles Second Quarter 20 Estimates The Congressional Budget Office (CBO) is forecasting Gross Domestic Product (GDP) at rates below 2.0% for the next 0 years and employment
Target Market Analysis - Background
 Target Market Analysis - Background Ø A primary tool for Placemaking analysis Ø Qualitative measure of market potential Ø Use of Cluster Analysis to determine likely target markets (ESRI: Tapestry & Experian:
Bank of America Accused of Racial Discrimination in 30 U.S. Metropolitan Areas and 201 Cities
 FOR IMMEDIATE RELEASE August 31, 2016 Contact: Pamela Bond (202) 898-1661 pbond@nationalfairhousing.org Bank of America Accused of Racial Discrimination in 30 U.S. Metropolitan Areas and 201 Cities Civil
MANAGEMENT PRESENTATION
 MANAGEMENT PRESENTATION SEPTEMBER 2014 RUF.U (USD) RUF.UN (CAD) RUF.DB.U (USD) Bear Creek Apartments, Dallas, TX AGENDA Valley Ranch Apartments, Dallas, TX 1. PURE ADVANTAGE Who we are 2. PURE PLAY What
Securitization Reports Update: The Outlook for U.S. Home Prices
 Securitization Global Markets Research North America United States Asset-Backed Securities 15 June 2009 Securitization Reports Update: The Outlook for U.S. Home Prices Market Update Table of contents Introduction...
(904) (904)
 (904)") Press Release For more information: Media contact: Investor contact: Michelle Kersch Nancy Murphy (904) 854-5043 (904) 854-8640 michelle.kersch@lpsvcs.com nancy.murphy@lpsvcs.com LPS Home Price Index Report:
Press Release For more information: Media contact: Investor contact: Michelle Kersch Nancy Murphy (904) 854-5043 (904) 854-8640 michelle.kersch@lpsvcs.com nancy.murphy@lpsvcs.com LPS Home Price Index Report:
The CoStar Office Report
 DCN:6155 The CoStar Office Report T H I R D Q U A R T E R 2 0 0 4 National Office Market Table of Contents Table of Contents.................................................................... A Methodology........................................................................
Zombie and Vacant Properties Remediation Initiative: Emerging Best Practices
 Zombie and Vacant Properties Remediation Initiative: Emerging Best Practices 1 Our Reach Office Locations Atlanta, GA Boston, MA Buffalo, NY Chicago, IL (LISC, NEF, NMSC) Cincinnati, OH Detroit, MI Duluth,
Real Estate Update. elearning series. Upcoming elearning series. Year-End Planning. September 16
 Real Estate Update Upcoming elearning series Year-End Planning September 16 Kevin Russell Senior Vice President, Sales & Account Management, Cartus Home Loans Renee Carnes-Rook Vice President, Real Estate
MANAGEMENT PRESENTATION JUNE Bear Creek Apartments, Dallas, TX
 MANAGEMENT PRESENTATION JUNE 2014 Bear Creek Apartments, Dallas, TX AGENDA Valley Ranch Apartments, Dallas, TX 1. PURE ADVANTAGE Who we are 2. PURE PLAY What we do 3. PURE STRATEGY How we do it 4. PURE
OFFICE OF PERSONNEL MANAGEMENT. 5 CFR Part 531 RIN 3206-AN64. General Schedule Locality Pay Areas
 This document is scheduled to be published in the Federal Register on 12/07/2018 and available online at https://federalregister.gov/d/2018-26519, and on govinfo.gov Billing Code: 6325-39-P OFFICE OF PERSONNEL
Black Knight Home Price Index Report: June Transactions U.S. Home Prices Up 0.8 Percent for the Month; Up 5.5 Percent Year-Over-Year
 For more information: Press Release Media contact: Michelle Kersch (904) 854-5043 michelle.kersch@bkfs.com Black Knight Home Price Index Report: June Transactions U.S. Home Prices Up 0.8 Percent for the
U.S. DEPARTMENT OF HUD 01/22/2014 STATE:CALIFORNIA ADJUSTED HOME INCOME LIMITS
 Bakersfield-Delano, CA MSA Chico, CA MSA El Centro, CA MSA Fresno, CA MSA Hanford-Corcoran, CA MSA Los Angeles-Long Beach, CA HUD Metro FMR Area 30% LIMITS 17150 19600 22050 24450 26450 28400 30350 32300
U.S. DEPARTMENT OF HUD 03/25/2015 STATE:CALIFORNIA ADJUSTED HOME INCOME LIMITS
 Bakersfield-Delano, CA MSA Chico, CA MSA El Centro, CA MSA Fresno, CA MSA Hanford-Corcoran, CA MSA Los Angeles-Long Beach, CA HUD Metro FMR Area 30% LIMITS 17450 19950 22450 24900 26900 28900 30900 32900
The Role of Construction, Housing, and Real Estate in Inner City Economic Development: Towards a National Research Agenda
 The Role of Construction, Housing, and Real Estate in Inner City Economic Development: Towards a National Research Agenda Professor Michael E. Porter Harvard Business School October 17, 2007 Philadelphia,
OUR DETAIL IS RETAIL.
 OUR DETAIL IS RETAIL. GILBERT GROUP ADVANTAGE Rooted with local knowledge and experience strengthened by national reach. PROPERTY MANAGEMENT PROJECT LEASING TENANT REPRESENTATION GILBERT GROUP ABOUT US
Multifamily Market Commentary December 2015 Single-Family Rental Sector Attracting Institutional Investment
 Multifamily Market Commentary December 2015 Single-Family Rental Sector Attracting Institutional Investment Prior to the Great Recession, the cratering of single-family home prices, and declines in the
(904) (904)
 (904)") Press Release For more information: Media contact: Investor contact: Michelle Kersch Nancy Murphy (904) 854-5043 (904) 854-8640 michelle.kersch@lpsvcs.com nancy.murphy@lpsvcs.com LPS Home Price Index Report:
Press Release For more information: Media contact: Investor contact: Michelle Kersch Nancy Murphy (904) 854-5043 (904) 854-8640 michelle.kersch@lpsvcs.com nancy.murphy@lpsvcs.com LPS Home Price Index Report:
Executive Summary. Trends. Hot Spots. Type Specific. Special Interest
 Changes in the economy and in financial markets have a tendency to provoke corresponding changes in fraud schemes as perpetrators learn how to game the system in new ways. see page 13 The Interthinx Fraud
U.S. DEPARTMENT OF HUD 04/11/2017 STATE: CALIFORNIA ADJUSTED HOME INCOME LIMITS
 Bakersfield, CA MSA Chico, CA MSA El Centro, CA MSA Fresno, CA MSA Hanford-Corcoran, CA MSA 30% LIMITS 13200 15050 16950 18800 20350 21850 23350 24850 VERY LOW INCOME 21950 25050 28200 31300 33850 36350
Increasing Foreclosures Could Hurt Demand for Homes, Slowing Housing Recovery
 Release Date: April 22, 2010 February 2010 Quinn W. Eddins, Director of Research New Radar Logic data packages are available at /productsservices_analytics.html Increasing Foreclosures Could Hurt Demand
The Subject Section. Chapter 2. Property Address
 Chapter 2 The Subject Section The SUBJECT section of the URAR introduces the appraisal assignment by presenting important information about the subject property. The SUBJECT section provides spaces for
HB , Appendix 5 PAGE 29 GUARANTEED HOUSING PROGRAM INCOME LIMITS
 HB - 1-3555, Appendix 5 PAGE 29 Bakersfield, CA MSA Chico, CA MSA El Centro, CA MSA Fresno, CA MSA VERY LOW INCOME 31300 31300 31300 31300 41300 41300 41300 41300 LOW INCOME 50100 50100 50100 50100 66150
The State of the Commercial Real Estate Industry: Mid-Year 2010 Retail Review & Outlook
 The State of the Commercial Real Estate Industry: Mid-Year 2010 Retail Review & Outlook Copyright 2010 CoStar Realty Information, Inc. No reproduction or distribution without permission. The following
National Foreclosure Report
 National Foreclosure Report FEBRUARY 2016 2.6% In February, the foreclosure inventory was down 2.6 percent from January 2016, representing 52 months of consecutive year-overyear declines. Job creation
County of Sonoma Agenda Item Summary Report
 Revision No. 20151201-1 County of Sonoma Agenda Item Summary Report Agenda Item Number: 32 (This Section for use by Clerk of the Board Only.) Clerk of the Board 575 Administration Drive Santa Rosa, CA
ECONOMIC CURRENTS. Vol. 5 Issue 2 SOUTH FLORIDA ECONOMIC QUARTERLY. Key Findings, 2 nd Quarter, 2015
 ECONOMIC CURRENTS THE Introduction SOUTH FLORIDA ECONOMIC QUARTERLY Economic Currents provides an overview of the South Florida regional economy. The report presents current employment, economic and real
Multifamily Market Commentary June 2017
 Multifamily Market Commentary June 2017 Multifamily Supply and Demand Varies by Metro Across the country, there are more than 630,000 new multifamily units currently underway with more than 400,000 of
Apartments: A $1.3 Trillion Market
 Apartments: A $1.3 Trillion Market A Research Report from the National Multi Housing Council Prepared by the Rosen Consulting Group Kenneth T. Rosen Susan U. Persin Daniel T. VanDyke Jeanine Kranitz This
Emerging Trends in Real Estate 2014
 Emerging Trends in Real Estate 2014 Emerging Trends is the industry s most predictive forecast 35th annual outlook Based on over 1,000 interviews and surveys of industry leaders Sponsored by PwC and the
$ FACTS ABOUT CALIFORNIA: WAGE HOUSING MOST EXPENSIVE AREAS WAGE RANKING
 STATE #3 * RANKING In California, the Fair Market Rent () for a two-bedroom apartment is $1,699. In order this level of and utilities without paying more than 30% of income on housing a household must
Cycle Monitor Real Estate Market Cycles Second Quarter 2018 Analysis
 Black Creek Research Cycle Monitor Real Estate Market Cycles Second Quarter 0 Analysis Real Estate Market Cycle analysis of five property types in Metropolitan Statistical Areas (MSAs). Important note:
Housing, Construction, and Remodeling Update. Toby Morrison Director of Insights Metrostudy October 12, 2013
 Housing, Construction, and Remodeling Update Toby Morrison Director of Insights Metrostudy October 12, 2013 New Home Sales (Units) "Pro-Worthy" R&R Projects New Homes Sales and Remodeling Are Firmly on
National Foreclosure Report
 National Foreclosure Report OCTOBER 20 1.5% In October, the foreclosure inventory was down 1.5 percent from September 20, representing 48 months of consecutive year-overyear declines. Improved economic
LPS Home Price Index Report: October Transactions U.S. Home Prices Up 0.3 Percent for the Month; Up 4.3 Percent Year-Over-Year
 Press Release For more information: Media contact: Investor contact: Michelle Kersch Nancy Murphy (904) 854-5043 (904) 854-8640 michelle.kersch@lpsvcs.com nancy.murphy@lpsvcs.com LPS Home Price Index Report:
Swimming Against the Tide: Forging Affordable Housing Opportunities from the Foreclosure Crisis
 Swimming Against the Tide: Forging Affordable Housing Opportunities from the Foreclosure Crisis Prepared for: Rethink. Recover. Rebuild. Reinventing Older Communities Philadelphia, PA May 14, 2010 George
U.S. MULTIFAMILY MARKETVIEW FIGURES Q4 2016
 U.S. MULTIFAMILY MARKETVIEW FIGURES Q4 2016 U.S. MULTIFAMILY MARKETVIEW Q4 2016 2016 DELIVERS IMPRESSIVE DEMAND AND NEW SUPPLY TOTALS Vacancy Rate 4.9% Net Absorption* 201,000 Units Rentable Completions*
City of Lonsdale Section Table of Contents
 City of Lonsdale City of Lonsdale Section Table of Contents Page Introduction Demographic Data Overview Population Estimates and Trends Population Projections Population by Age Household Estimates and
U.S. Multifamily MarketView
 U.S. Multifamily MarketView CBRE Global Research and Consulting VACANCY RATE.% NET ABSORPTION 7, Units RENTABLE COMPLETIONS 8,55 Units Y-o-Y RENT CHANGE.% Arrows indicate change from previous year. Total
Las Vegas Housing-Market Conditions
 Las Vegas Housing-Market Conditions The Center for Business and Economic Research Las Vegas Housing Market Searching for Bottom Volume 57, 4th The national housing market remained beset with problems in.
OVERVIEW OF RECENT/EXPECTED ECONOMIC/ HOUSING MARKET CONDITIONS
 OVERVIEW OF RECENT/EXPECTED ECONOMIC/ HOUSING MARKET CONDITIONS STRONG ECONOMIC FUNDAMENTALS *BUT* EXTRAORDINARY SHORT-TERM FACTORS RESULTING IN MAJOR SHIFTS IN TYPES OF HOUSING PRODUCTS AND GEOGRAPHICAL
August 15, Dear colleagues,
 August 15, 2016 Helen R. Kanovsky, General Counsel Regulations Division, Office of General Counsel Department of Housing and Urban Development 451 7 th Street, SW, Room 10276 20410-0500 Re: Establishing
Slicing, Dicing, and Scoping the Size of the U.S. Commercial Real Estate Market
 Slicing, Dicing, and Scoping the Size of the U.S. Commercial Real Estate Market Executive Summary. We use a Census approach to calculate the size of the built commercial real estate market in the United
Mortgage Giant Fannie Mae Accused of Racial Discrimination in 34 U.S. Metro Areas
 FAIR HOUSING OF MARIN 1314 Lincoln Avenue, San Rafael, CA 94901 (415) 457-5025 / TDD: (800) 735-2922 FOR IMMEDIATE RELEASE May 13, 2015 Contact: Contact: Caroline Peattie, Fair Housing of Marin - peattie@fairhousingmarin.com
ECONOMIC CURRENTS. Vol. 3, Issue 3 SOUTH FLORIDA ECONOMIC QUARTERLY. Introduction
 ECONOMIC CURRENTS THE Introduction SOUTH FLORIDA ECONOMIC QUARTERLY Economic Currents provides an overview of the South Florida regional economy. The report presents current employment, economic and real
Investor Presentation March 2017
 Investor Presentation March 2017 1 Table of Contents Company Overview & 2016 Highlights 3 6 Multifamily Fundamentals 7 11 Camden s Portfolio 12 21 Real Estate Transactions 22 28 Capital Structure & Liquidity
Economic Highlights. Payroll Employment Growth by State 1. Durable Goods 2. The Conference Board Consumer Confidence Index 3
 August 26, 2009 Economic Highlights Southeastern Employment Payroll Employment Growth by State 1 Manufacturing Durable Goods 2 Consumer Spending The Conference Board Consumer Confidence Index 3 Real Estate
LUXURY MARKET REPORT. - November
 LUXURY MARKET REPORT - November 2018 - www.luxuryhomeing.com THIS IS YOUR LUXURY MARKET REPORT MAP OF LUXURY RESIDENTIAL MARKETS Welcome to the Luxury Report, your guide to luxury real estate market data
Rural Development Single Family Housing Guaranteed Loan Program Indiana Income Limits per Household Size
 Rural Development Single Family Housing Guaranteed Loan Program Indiana Income Limits per Household Size WA ME OR CA NV ID AZ UT MT WY CO NM ND SD NE KS MN WI IA MO OK AR IL MS MI OH IN KY TN AL GA WV