John E. Husing IMPACT OF CALIFORNIA S HOUSING PRICES ON CONSTRUCTION WORKERS
|
|
|
- Marian Woods
- 5 years ago
- Views:
Transcription

1 John E. Husing IMPACT OF CALIFORNIA S HOUSING PRICES ON CONSTRUCTION WORKERS

2
3 IMPACT OF CALIFORNIA S HOUSING PRICES ON CONSTRUCTION WORKERS February 22, 2019 Final Report By John E. Husing, Ph.D. Economics & Politics, Inc. P.O. Box 8730 Redlands, CA (909) Phone john@johnhusing.com
4 AUTHOR John Husing Dr. John Husing is a research economist who has specialized in the study of Southern California s growing economy since For decades, he has produced city and county specific economic development strategies for the region s local government. With his significant understanding of San Bernardino and Riverside counties, he assists the Inland Empire Economic Partnership as its Chief Economist. Vice president and chief analyst for Politics and Economics, Husing has been a consultant to virtually every major governmental body in the inland region. Dr. Husing s has worked with the Southern California Association of Governments (SCAG) in helping develop its long-term employment forecast for the Regional Transportation Improvement Plan program. Because of the importance of the logistics industry to Southern California, SCAG has retained Economics & Politics, Inc. for on-going research exploring the interaction of goods movement between the region s ports, rail facilities, airports and logistics facilities. His success with this research led the ports of Los Angeles and Long Beach to contract with Dr Husing for the economic impact study of their Clean Truck Program. In 2007, the Los Angeles Times listed him as one of the 100 people wielding the most influence over Southern California. EDITOR Joel Kotkin Joel Kotkin (co-author) the RC Hobbs Presidential Fellow in urban futures at Chapman University and director of the Chapman Center for Demographics and Policy and executive director of the Center for Opportunity Urbanism in Houston, Texas. He is author of eight books and co-editor of the recently released Infinite Suburbia. He also serves executive editor of the widely read website and a regular contributor to the Orange County Register, Forbes.com, Real Clear Politics, the Daily Beast and the City Journal.
5 TABLE OF CONTENTS Authors... 2 Executive Summary... 5 Southern California... 5 SF Bay Area... 7 Commuting... 8 Summary... 9 Impact of California s Housing Prices on Construction Workers Single Family Median Priced Home Affordability Apartment Affordability Income Requirements Southern California Construction Workers Median Pay Occupations Able to Afford Median Priced Southern CA Homes Median Paid Occupations Ability to Afford First Time Homes Summary: All Southern California Construction Workers Estimated Union Workers by Occupation and County Pay For Union Workers by Occupation Ability To Afford Median Priced Homes at Union Pay Union Construction Workers Ability To Afford First Time Homes Summary Southern California Union Construction Workers San Francisco Bay Area Construction Workers Median Pay Estimated Union Workers by Occupation and County Pay For Union Workers by Occupation Construction Worker Comparison SF Bay Area Median Home Prices Construction Workers Able To Afford Median Homes SF Bay Area First Time Home Prices Construction Workers Able To Afford First Time Homes Union Construction Workers Able To Afford Median Price Homes Union Construction Workers Able To Afford First Time Lower Priced Homes. 63 Summary: Construction Workers Commuting Summary: Commuting Costs Summary Endnotes Impact of California s Housing Prices on Construction Workers 3
6 4 Chapman University
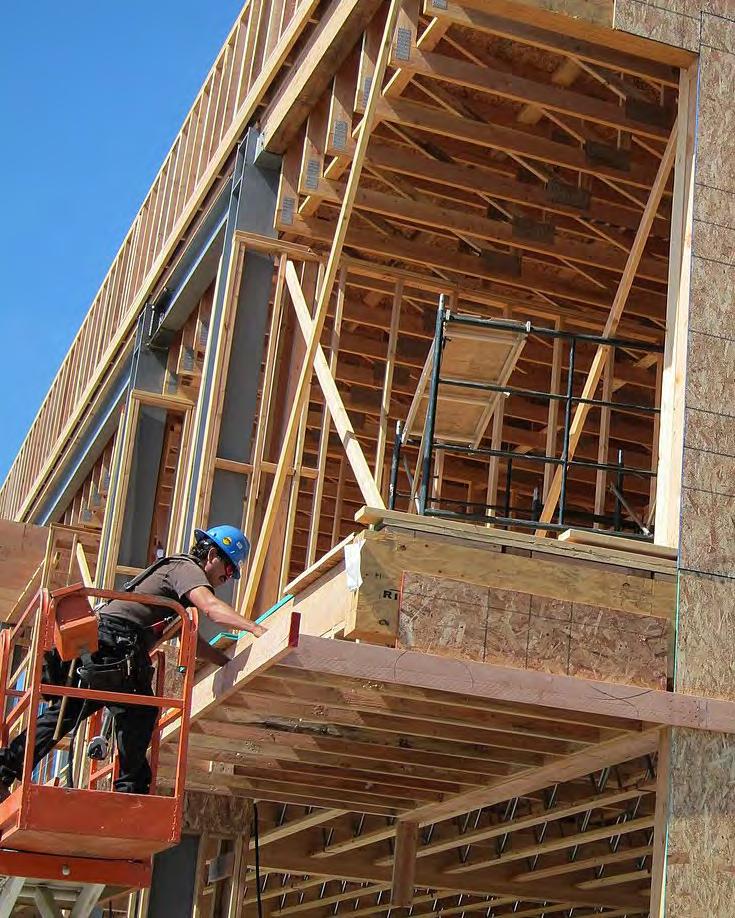
7 Lancaster California BLVD Construction EXECUTIVE SUMMARY This report takes a close look at the impact of California s very high residential prices on the ability of construction workers the very people who build our homes to afford to live within the markets where they are work. It does so by reviewing the number of workers and pay scales in 50 different construction occupations. It distinguishes between pay levels for all construction workers and those who are in unions. The research separately studies Southern California and the San Francisco (SF) Bay Area since real estate markets are subject to very different forces depending upon their geographic location. California s housing crisis largely stems from a serious shortage on the market s supply side. Thus, the California Department of Housing and Community Development estimates that builders around the state need to construct 180,000 homes every year. Instead, for the past ten years, the state has built an annual average below 80,000, which is less than half of the need. 1 Yet, demand is increasing both due to population growth and Millennials now in their child bearing years. The result has been rapidly rising prices. Importantly, housing supply remains restricted by the historic difficulty of getting projects through entitlement processes including the accelerating use of CEQA lawsuits to stop projects by local Not-In-My-Back-Yard (NIMBY) entities and environmental groups. Many see that trend as a distortion of a law designed to protect the environment, not stop residential building. Meanwhile, the recent focus on proposed mandates to cut greenhouse gases (GHG) emissions could result in reduced access to units in outlying markets. That would further limit supply given the state s failure, to date, of increasing access to housing in urban centers. Thus, builders told CARB that building within existing communities continues to be more costly and difficult than building on greenfield parcels at the edge of town. Upgrading civic infrastructure in existing communities is more costly and difficult to finance than building new infrastructure. They report that regulatory and fiscal reform is needed if a market-driven system like real-estate development is to produce desired results. 2 The impact of these difficulties is underscored in that depending on the market, only 18% to 23% of households can afford the median priced home where they live, be it Southern California s coastal counties or the San Francisco (SF) Bay Area. In those broad areas, only a fraction of the bottom 50% of homes can be afforded by 77% to 82% of local families. 3 Southern California In Southern California, the analysis began by looking at the very high residential prices for median priced homes in Los Angeles ($629,000), San Impact of California s Housing Prices on Construction Workers 5
8 Diego ($650,000) and Orange ($830,000) counties versus the Inland Empire ($362,500). It separately looks at the cost of lower priced first time homes in those counties: Los Angeles ($534,600), San Diego ($552,600) and Orange ($705,500) counties compared to the Inland Empire ($308,120). 4 Next, the report identifies the number of workers and pay scales in each of 50 construction occupations in each of seven southern markets (Imperial, Los Angeles, Orange, Inland Empire, San Diego, Santa Barbara, Ventura). 5 It does so to determine which workers in which markets could afford to buy these homes. For all workers, the median annual pay was used (half make more, half less). The weighted average was $54,116 for all 390,067 construction workers. For union construction workers, the 75th percentile pay level was used (25% make more, 75% less). For them, the weighted average was $73,258 for the estimated 73,720 workers (18.9% of such workers). In both cases, hourly rates from EDD were annualized assuming workers worked 8-hours a day, 5-days a week 52-weeks a year. This likely overestimated pay levels and biased the ability to afford homes to the high side. To determine if construction workers (union & non-union) in each occupation in each market could afford median priced homes in the four major Southern California markets, their median pay levels were compared to the income requirements to buy the homes in those markets. 6 Based upon this comparison, no construction worker from throughout the region could afford homes in Los Angeles, Orange or San Diego counties. Only a very few, primarily in management or inspection occupations, could afford the Inland Empire s median priced homes. Next, to see if construction workers (union & non-union) in each occupation in each market could afford the lower priced first time homes in the four major Southern California markets, the same comparison was made. It found that even at the lower prices in Los Angeles, Orange and San Diego counties, homes were still beyond the reach of all but a very few median paid construction workers. However, the Inland Empire s much lower price ($308,120) meant that about half the construction workers in the several counties could buy an affordable first time home in that market. This would require them to migrate inland from other Southern California locations. In the Inland Empire, affordable homes are far from its borders with the adjacent coastal counties, adding to commute times for workers who chose to migrate and drive to work. Union workers in each of the 50 occupations in the seven markets were then subjected to the same income and housing price comparisons. For median priced homes, the analysis showed that the better paid union construction workers could still not afford median priced homes in the coastal counties. In the Inland Empire, there were just 52 cases in 19 of 50 occupations with 34.1% of where Southern California s union workers could afford its median 6 Chapman University
9 priced home. For lower priced first time homes, the median income/price comparison showed that 71,316 of union workers (96.7%) from throughout Southern California could afford the Inland Empire s lower priced homes. In the other three markets, however, the shares able to afford these homes was far lower: Orange County (0.4%), San Diego County (14.0%) Los Angeles County (21.9%). 7 SF Bay Area Turning to the SF Bay Area, the analysis looked at the very high prices for median priced homes in the nine counties: San Francisco ($1,600,000), San Mateo ($1,600,000), Marin ($1,300,00), Santa Clara ($1,300,000), Alameda ($950,000), Napa ($729,500), Contra Costa ($660,000), Sonoma ($660,000) and Solano ($455,000) counties versus the northern Central Valley ($291,796). It also separately looked at the cost of lower priced first time homes in those counties: San Francisco ($1,360,000), San Mateo ($1,360,000), Marin ($1,105,00), Santa Clara ($1,105,000), Alameda ($807,500), Napa ($620,080), Contra Costa ($561,000), Sonoma ($561,000) and Solano ($386,750) counties versus the northern Central Valley ($248,028). 8 Looking at pay scales, the report found the number of workers and pay scales in each of 50 construction occupations in each of the area s nine counties. The pay information was again 2018 figures from EDD. The weighted median pay was $65,448 for all 164,210 SF Bay Area construction workers. Using the 75th percentile annual pay, the weighted union pay was $89,015 for the 31,269 union construction workers (19.0% of all construction workers). In both cases, hourly rates from EDD were annualized assuming workers worked 8-hours a day, 5-days a week 52-weeks a year. This also likely overestimated pay levels and biased the ability to afford homes to the high side. To determine if all construction workers (union & non-union) in each occupation in each market at these annualized pay levels, could afford the median priced homes in the nine markets, their incomes were compared to the CA Association of Realtors income requirements to buy them. Based upon this comparison, it was clear that except for a very few supervisors and inspectors in Solano County (4,440; 2.7% of workers), those earning the weighted median annual income in their occupations in the counties could not afford the homes. The picture changed in looking at the Central Valley, where there were 84 cases in 29 occupations with 80,080 SF Bay Area construction workers (48.8% of 164,210) able to afford the median priced home ($291,796). Given the distances to the Central Valley, as seen above with the Inland Empire, workers who might take advantage of this situation would face very long commutes. To determine if construction workers (union & non-union) in each occupation in each market could afford the SF Bay Area s lower priced first time Impact of California s Housing Prices on Construction Workers 7
10 homes, the same comparison was made for these less expensive homes. It found that no construction worker could afford the lower prices in San Francisco, San Mateo, Marin, Santa Clara and Alameda counties. Very small shares of workers could do so in Napa County (1.7%), Contra Costa and Sonoma counties (11.3%). Solano County s affordable homes could be bought by 80,020 or 48% of the SF Bay Area s construction workers but this would require many workers to migrate north across the Carquinez Bridge to that county. Meanwhile, most of the SF Bay Area s construction workers (158,080 of 164,210 or 96.3%) could afford the Central Valley s affordable home. Again, this raises the specter of long distance commutes for those who would migrate there. Income and median home price comparisons were also made for more highly paid union construction workers. Even in this case, no union worker could afford the median priced homes in San Francisco, San Mateo, Marin, Santa Clara, Alameda and Napa counties. For Contra Costa and Sonoma counties, there were two occupations with 378 workers (1.2%) in the region that could afford their median priced home. Solano County was a better situation with 50 cases in 16 occupations where 10,040 or 32.1% of the 31,269 union construction workers could afford the median home. For most workers, the choice was still a potential move to the Central Valley where 91.7% or 28,675 union workers from throughout the SF Bay Area could afford its median priced home. They worked in 37 of 50 occupations. Even with higher union pay and lower priced homes, no union workers was able to afford a home in San Francisco, San Mateo, Marin or Santa Clara counties. For Alameda County, it was just 378 of 31,269 union construction workers (1.2%). Shares were higher looking farther north: Napa County (27.8%), Contra Costa and Sonoma (46.2%). For Solano County, 91.3% or 28,556 union workers from the region could afford its lower priced homes. In contrast, nearly every union worker in the SF Bay Area could afford the $248,028 first time lower priced home in the Central Valley (98.5%). Commuting Finally, the analysis looked at the issue of commuting from the Inland Empire to the coastal counties of Southern California and from the Central Valley to the SF Bay Area. Ten cases were reviewed of long commutes, five at each end of the state. The distances of commutes and estimated round-trip drive times were calculated using Google Maps. The round trip times ranged from 2 hours 30 minutes (Lake Elsinore to Irvine) to 5 hours 20 minutes (Modesto to Palo Alto). This was the case despite assuming drivers left from 4:00 am to 5:00 am in the morning and returned at 3:00 pm in the afternoon to avoid the worst commuter hours. 8 Chapman University
11 AAA data on the cost of fuel, maintenance, wear and tear for driving pickup trucks as well as round trip counter mileage were used to calculate the daily cost of driving the assumed trips. No cost was assigned to the worker s driving time. Commuting was assumed for 5-days a week for 50 weeks. The least expensive assumed commute in the SF Bay Area region was from Tracy to Hayward at $8,036; the most expensive from Modesto to Palo Alto at $18,655. In Southern California, the least expensive assumed commute was from Lake Elsinore to Irvine at $9,635; the most expensive from Menifee to San Diego at $14,350. These were conservative estimates in that miles per gallon would likely be lower than AAA figures as most commuting would occur in heavy traffic. Given the role of CEQA in causing the housing crisis, to be very conservative, no cost was assigned to the added environmental damage of long commutes which according to studies would be considerable and negate much of the positive GHG reductions associated with the state s adopted planning policies. 9 Finally, the median incomes of all construction workers and those of union construction workers were used to calculate the extent that commuting costs would lower the net incomes of workers. For all workers, the result ranged from a 12.3% drop in income for those taking the Tracy to Hayward commute to 26.5% for workers facing the Menifee to San Diego drive. For union construction workers, the range was from a 9.0% drop in income for union construction workers taking the Tracy to Hayward commute to 19.6% for workers facing the Menifee to San Diego drive. 10 Summary The data studied in this report underscore the irony that construction workers regardless of their occupational specialty, and whether unionized or not, have essentially been priced out of buying homes in the very markets where they work, often building the homes they cannot afford. They are caught in this situation due to the extremely high prices for housing in Southern California s coastal counties and the SF Bay Area. This situation has been brought about by the shortage of new housing often resulting from the market s reaction to state laws and policies. For construction workers, their only options are to try and find first time lower priced affordable homes in often distant outlying markets like the Inland Empire and the Central Valley. The result will increasingly be very long, time consuming and expensive commutes with the commensurate wear and tear on their vehicles, themselves and the environment. The only exceptions are those who already own homes or have long term apartment leases. Impact of California s Housing Prices on Construction Workers 9

12 IMPACT OF CALIFORNIA S HOUSING PRICES ON CONSTRUCTION WORKERS In recent years, it has become increasingly clear that California and Southern California are in the midst of a worsening housing crisis. The demand for housing has increased as Millennials have moved into child bearing years, while the supply of housing has been restricted by the traditional difficulty of getting projects through city and county entitlement processes plus the accelerating use of CEQA lawsuits by neighbors wishing to stop projects. The result has been soaring residential prices and rents, particularly in the San Francisco (SF) Bay Area, Orange, Los Angeles, and San Diego counties. In those markets, significant numbers of workers can no longer afford places to live. This has caused a migration of workers inland to the Riverside and San Bernardino counties in Southern California and the Central Valley in Northern California. Even those markets are seeing prices move to higher levels. Single Family Median Priced Home Affordability In late 2018, the median price of single family homes (half of local families could afford; half not) by market was: SF Bay Area ($950,000), Orange ($830,000) San Diego ($650,000), Los Angeles ($629,000), Inland Empire ($362,500) and Central Valley ($300,000). This has created the dynamic where many households, including constrution workers, are often forced to migrate inland. By county, the savings for a coastal family moving to the Inland Empire was: Orange ($467,500), San Diego ($287,500) and Los Angeles ($266,500). Families migrating from the SF Bay Area to the Central Valley could save $650,000 (Exhibit 1). 10 Chapman University
 saved $287,500. Moving from Los Angeles ($534,600) saved $266,500.")
13 It was similar for lower priced first time homes. For households moving to the Inland Empire ($308,120) from Orange ($705,500), the saving was $397,380. Moving from San Diego ($552,500) saved $287,500. Moving from Los Angeles ($534,600) saved $266,500. It was $622,472 for families migrating from the SF Bay Area ($870,500) to the Central Valley ($248,028). Home prices at these levels have dramatically reduced the ability of local households in each market to afford local homes according to market level affordability statistics complies by the CA Association of Realtors (Exhibit 2): In first quarter 2012, 51% of Los Angeles County s households were able to afford the 50% of homes sold at the county s median priced home or below, a balanced market. By fourth quarter 2018, just 22% of the county s families could afford homes sold at the median price ($628,940). That meant that 78% of local households could not afford a significant share of the least expensive 50% of homes sold in the county. Those households could only buy the reduced share of homes selling at prices well under the median price. In San Diego County, the first quarter 2012 affordability rate was 46%, a slightly unbalanced market. By late 2018, only 23% of local households could afford to buy median priced homes ($650,000). The other 77% of local households could not afford a major share of the least expensive 50% of homes sold in the county. Also, those households could only buy the reduced share of dwellings selling at prices well under the median price. In Orange County, the share of households that could afford the median priced home was a relatively low 39% in 2012, already an Impact of California s Housing Prices on Construction Workers 11
14 unbalanced market. By late 2018, only 20% of local households could afford to buy median priced homes ($830,000). That meant that 80% of local households could not afford a very large share of the least costly 50% of homes sold in the county. A majority of the county s households could only afford the small share of homes selling well below the median price. In the SF Bay Area, by late 2018, only 18% of local households (not shown) could afford to buy median priced homes ($950,000). That meant that 82% of local households could not afford a very large share of the least costly 50% of homes sold in the county. A majority of the county s households could only afford the small share of homes selling well below the median price. In each of these cases, in late 2018, only people at the high end of the income distribution could afford the vast share of homes sold in Southern California s coastal counties. And, the inland counties were no longer total exceptions: By late 2018, the ability of Inland Empire households to afford the median home ($362,500) was down to 41%. The other 59% could only afford homes selling for prices below its median of $362,500. By late 2018, the ability of Central Valley households to afford the median home ($300,000) was down to 44%. The other 56% could only afford homes selling for prices below its median of $300,000. With buyers unable to pay for homes in coastal markets, prices have been bid up in traditionally affordable markets. Some have had no choice but to move, others want upscale homes they cannot afford in coastal markets. Thus, the inland counties nearest the SF Bay Area have the highest prices in the Central Valley: San Joaquin ($365,000) and Stanislaus ($312,000) versus Fresno ($269,000) and Madera ($264,000). In the Inland Empire, cities near coastal counties like Corona ($511,078) and Eastvale ($556,632) have much higher prices than fast growing cities deeper inland like Menifee ($362,312) and Beaumont ($355,757): These factors have contributed to inland counties like San Joaquin (10.7%) and Riverside (10.3%) leading California (6.9%) in population growth. Apartment Affordability A similar dynamic has shown up in apartment markets. In 2018, apartment rents averaged $2,267 in Los Angeles County. It was $2,035 in Orange County, $1,978 in San Diego County and $1,457 in the Inland Empire (Exhibit 3). Average coastal county rents were thus $521 to $810 a month higher than in the inland counties. This represented another incentive for families to migrate into the Inland Empire. 12 Chapman University
. These figures are well above the standard at which rents are found to be reasonable and affordable.")

15 In 2017, the American Community Survey found that in every Southern California market, over 56% of apartment dwelling families were putting in excess of 30% of their incomes into rent payments. It was 51% in the Bay Area (Exhibit 4). These figures are well above the standard at which rents are found to be reasonable and affordable. It again shows that the lack of housing supply is creating a serious problem for families by soaking up inordinate amounts of household incomes. Income Requirements The California Real Estate Association maintains two indices measuring the monthly payments by market, including taxes and insurance. They show the incomes needed to buy homes as well as the incomes needed to afford those payments. One is for the median priced home; the other is for the lower Impact of California s Housing Prices on Construction Workers 13

16 priced homes for first time buyers. Looking at the median priced homes shown on Exhibit 1, the following are the income needs (Exhibit 5): SF Bay Area (median income: $103,043) is the most difficult. Its extremely high median prices need an income of $202,650 to make $5,070 monthly payments for a $950,000 home. Orange County households (median income: $86,217) would need income of $177,050 to afford the $4,430 in monthly mortgage, tax and insurance payments for a $830,000 median priced home. San Diego County households (median income: $76,207) would need an income of $138,650 to cover the $3,470 in payments for a $650,000 median priced home. Los Angeles County households (median income: $65,006) would need to earn $134,160 to make monthly payments of $3,350 for a $629,000 median priced home. Inland Empire households (median income: $62,303) would need an income of $77,330 to make $1,930 in monthly payments for a $362,500 median priced house. Central Valley households (median income: $54,359) would need an income of $64,023 to make $1,602 in monthly payments on a $300,000 median priced home. Together, these figures show why many moderate and low income families are being forced to migrate from California s coastal counties into its inland counties. Assuming a buyer can find access to the affordable first time homes shown on Exhibit 1, the situation is better for potential buyers (Exhibit 6): 14 Chapman University

17 The SF Bay Area situation is again the most extreme. Its very high median price requires an income of $202,650 to make $4,360 monthly payments on an $870,500 entry level home. Orange County households would need an income of $114,400 to afford the $3,810 in monthly mortgage, tax and insurance payments for a $705,500 starter home. San Diego County households would need a income of $89,590 to cover the $2,990 payments for mortgages, taxes and insurance payments for a $552,500 beginning home. Los Angeles County households would need to earn $86,690 to make monthly payments of $2,890 on a $534,600 first time home. Inland Empire households would need an income of $49,970 to make monthly payments to pay $1,670 per month on a $308,120 beginning home. In the region, homes in that price range are found deep inside inland markets at cities like Banning and Hemet. Central Valley households would need an income of $41,365 to make monthly payments to pay $1,408 per month on a $248,028 beginning home. Southern California Construction Workers Given these income requirements, the question arises as to what share of construction workers can afford to buy homes. Further, to what extent does being a union member impact the analysis? Impact of California s Housing Prices on Construction Workers 15

18 To address these questions, the starting point is the 2017 California Employment Development Department (EDD) data on employment by occupational category, whether union or not, for workers with jobs in each of Southern California s metropolitan areas. Those include Imperial, Los Angeles, Orange, San Diego, Santa Barbara and Ventura counties plus the Inland Empire. Data were available for 390,867 workers in 50 different occupations (Exhibit 7). Exhibit 7. Number of Workers by Contruction Occupation, Southern California, Chapman University

19 Impact of California s Housing Prices on Construction Workers 17
 and MSA, 2017 UnionStats 2018 by Barry T. Hirsch and David A. Macpherson. In addition, the U.S. Bureau of Labor Statistics reported data on the share of each occupation that was unionized nationally.")

20 Source: Occupational Employment (May 2017) Data, Occupational Wage Survey, CA Employment Development Department; Union Membership, Coverage, Density and Employment by Combined Statistical Area (CSA) and MSA, 2017 UnionStats 2018 by Barry T. Hirsch and David A. Macpherson. In addition, the U.S. Bureau of Labor Statistics reported data on the share of each occupation that was unionized nationally. It was assumed that these levels applied to Southern California. To the extent that was true, 18.9% of construction workers were in unions. This compared to 8.3% of workers in all private sector occupations in Southern California Chapman University
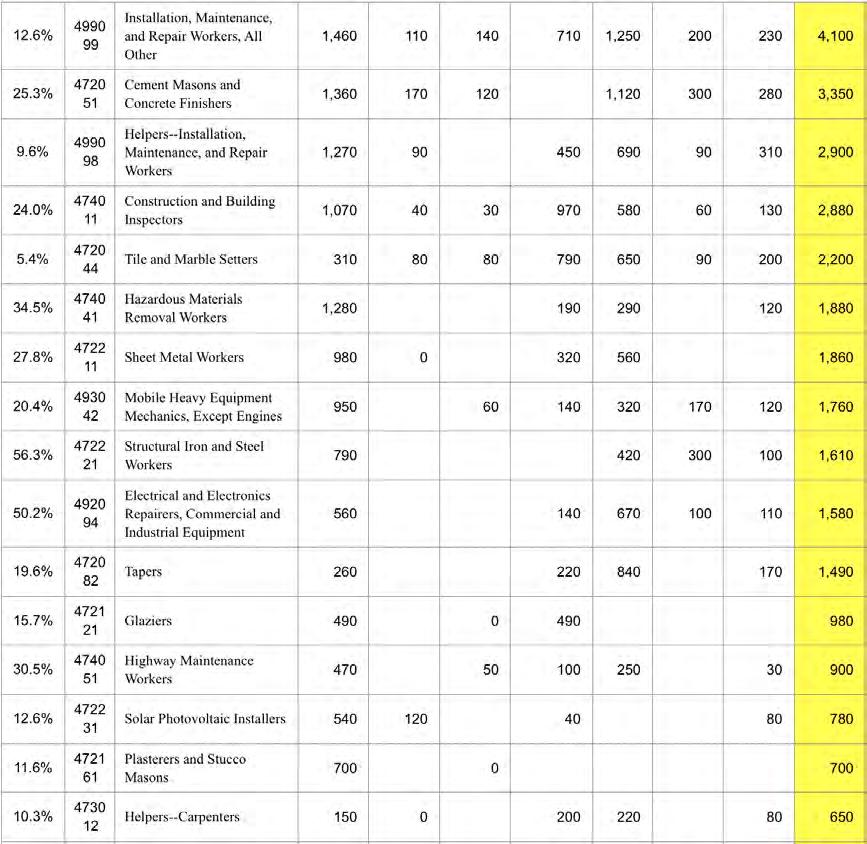
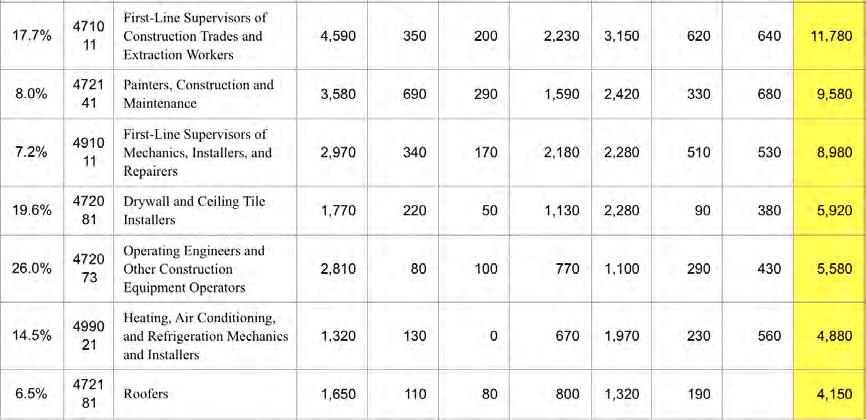
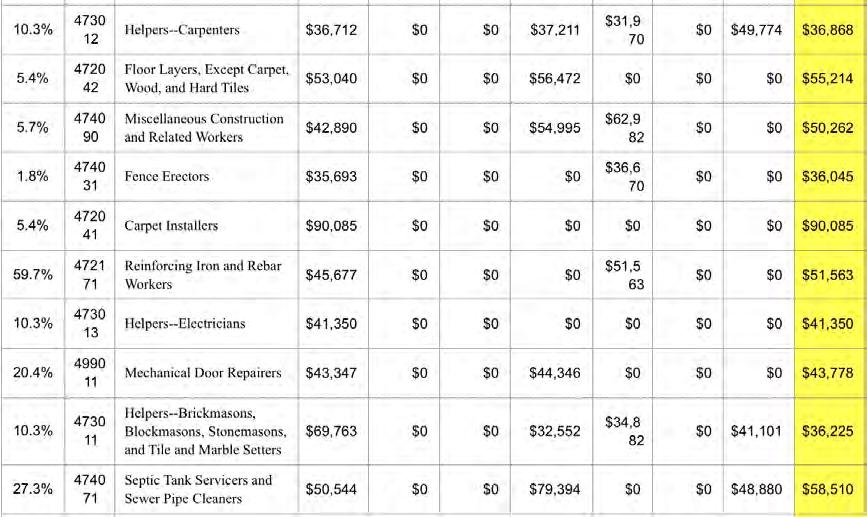
21 Reviewing these data, the 12 construction occupations in Southern California with over 10,000 workers in 2017 employed 299,040 construction workers or 76.5% of the 390,067 total: Construction Laborers 52, % Carpenters 50, % Electricians 34, % First-Line Supervisors of Construction Trades and Extraction Workers 29, % Plumbers, Pipefitters and Steamfitters 26, % First-Line Supervisors of Mechanics, Installers, and Repairers 21, % Painters, Construction and Maintenance 19, % Drywall and Ceiling Tile Installers 15, % Heating, Air Conditioning, and Refrigeration Mechanics and Installers 13, % Operating Engineers and Other Construction Equipment Operators 12, % Installation, Maintenance, and Repair Workers, All Other 11, % Cement Masons and Concrete Finishers 11, % TOTAL 299, % Median Pay EDD has also compiled wage hourly data on the median pay for each occupation in first quarter That is the level where 50% of workers in an occupation made more and 50% made less than their colleagues. These data were multiplied by 2,080 hours on the assumption that workers were employed 8-hours a day, 5-days a week, 52-weeks a year. Below, these pay scales are shown by occupation according to the number of workers in it for Southern California (Exhibit 8). For all 390,067 Southern California construction workers, the median annual pay, weighted by the number of workers in each occupation was $54,116. For the 12 largest occupations, it was $54,886. Construction Laborers 52,530 $39,594 Carpenters 50,900 $51,278 Electricians 34,660 $61,788 Impact of California s Housing Prices on Construction Workers 19

22 First-Line Supervisors of Construction Trades and Extraction Workers 29,520 $77,798 Plumbers, Pipefitters and Steamfitters 26,100 $53,321 First-Line Supervisors of Mechanics, Installers, and Repairers 21,080 $74,755 Painters, Construction and Maintenance 19,360 $43,366 Drywall and Ceiling Tile Installers 15,380 $50,755 Heating, Air Conditioning, and Refrigeration Mechanics and Installers 13,510 $55,309 Operating Engineers and Other Construction Equipment Operators 12,770 $73,345 Installation, Maintenance, and Repair Workers, All Other 11,910 $37,706 Cement Masons and Concrete Finishers 11,320 $52,145 TOTAL 299,040 $54,886 Exhibit 8. Median Annual Pay by Construction Occupation, Southern CA, Chapman University


23 Impact of California s Housing Prices on Construction Workers 21
24
 and MSA, 2017 UnionStats, 2018 by Barry T. Hirsch and David A. Macpherson. Median pay level is shown.")
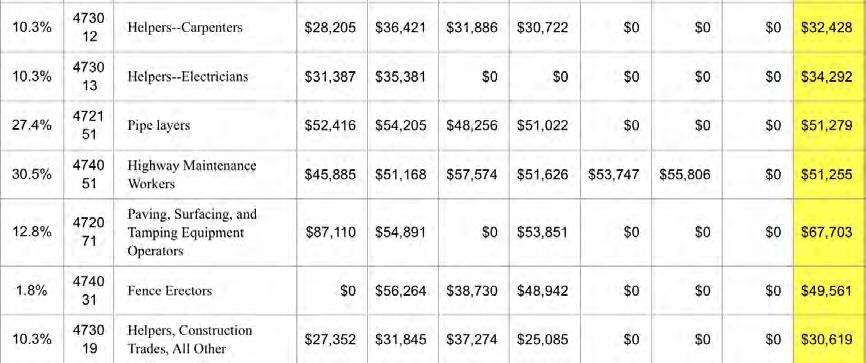
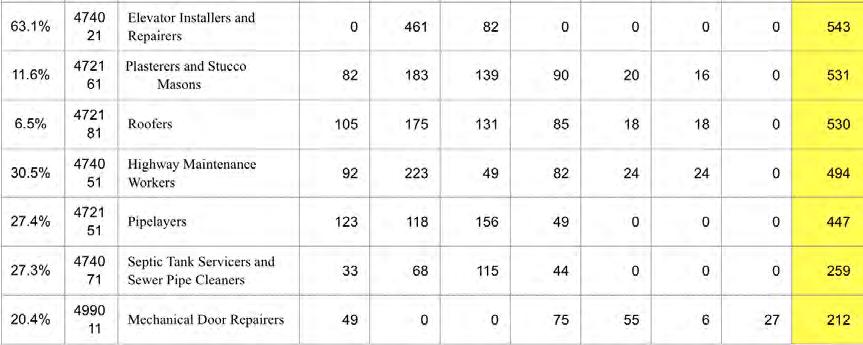
25 Source: Occupational Wage (2018-1st Quarter) Data, Occupational Wage Survey, CA Employment Development Department; Union Membership, Coverage, Density and Employment by Combined Statistical Area (CSA) and MSA, 2017 UnionStats, 2018 by Barry T. Hirsch and David A. Macpherson. Median pay level is shown. Occupations Able To Afford Median Priced Southern California Homes Given these data, the question arises as to the extent that workers in the various occupations working in each of the counties could afford the median priced homes in any of Southern California major markets. Incomes required to purchase median homes in four major markets were considered: Orange County $177,050 income for the median home ($830,000) San Diego County $138,650 income for the median home ($650,000) Los Angeles County $134,160 income for the median home ($628,840) Inland Empire $77,330 income for the median home ($362,500) Worker pay in each of the 50 construction occupations in the seven Southern California counties were reviewed: Orange County: No construction workers in any occupation had the $177,050 income to afford the $830,000 median priced home. San Diego County: No construction workers in any occupation had the $138,650 income to afford the median priced home. Los Angeles County: No construction workers in any occupation had the $134,160 income to afford the median priced home. Inland Empire: Only 7,520 tradesmen and 32,760 supervisors and inspectors from throughout Southern California could afford the $77,330 income needed to afford the median priced home. These 40,280 workers represented 10.3% of people in the construction industry: tradesmen (1.9%), supervisors and inspectors (8.4%). First-Line Supervisors of Construction Trades and Extraction Workers with jobs in Orange, San Diego and Ventura counties (13,920) Impact of California s Housing Prices on Construction Workers 23
26 First-Line Supervisors of Mechanics, Installers, and Repairers with jobs in Los Angeles and Orange counties (12,900) Operating Engineers and Other Construction Equipment Operators with jobs in Los Angeles and Orange counties (5,400). Construction and Building Inspectors with jobs in every county but Imperial (5,940) Paving, Surfacing, and Tamping Equipment Operators with Inland Empire jobs (660) Control and Valve Installers and Repairers, Except Mechanical Door with jobs in San Diego and Ventura counties (420) Elevator Installers and Repairers with jobs in Los Angeles County (730) Earth Drillers, Except Oil and Gas with jobs in the Inland Empire (310) Median Paid Occupations Ability To Afford First Time Homes A second question is the extent that workers in the various occupations in each of the counties could afford first time homes in any of Southern California major markets. Incomes required to purchase median homes in the four major markets were considered: Orange County $114,400 income for the median home ($705,500) San Diego County $89,590 income for the median home ($552,500) Los Angeles County $86,690 income for the median home ($534,600) Inland Empire $49,970 income for the median home ($308,120) Worker pay for each of the 50 occupations in the seven Southern California counties were reviewed: Orange County: Again, no construction workers in occupations in the southern counties had the $114,400 income to afford the $705,500 entry level priced home. San Diego County: There were two cases of 4,090 construction workers in occupations that had the $89,590 income needed to afford the entry level priced home. They represented 1.0% of the 390,867 construction workers: Construction and Building Inspectors in Los Angeles County and the Inland Empire (3,360) 24 Chapman University
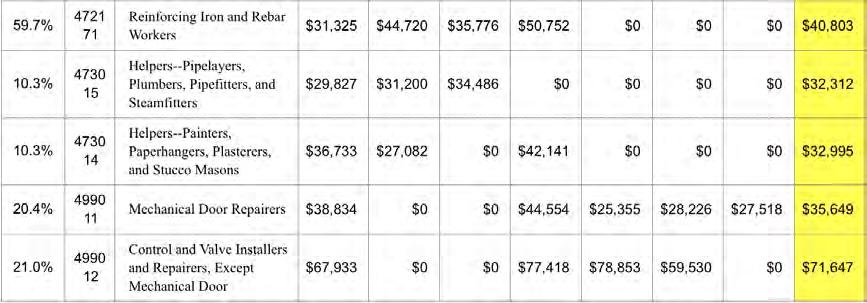
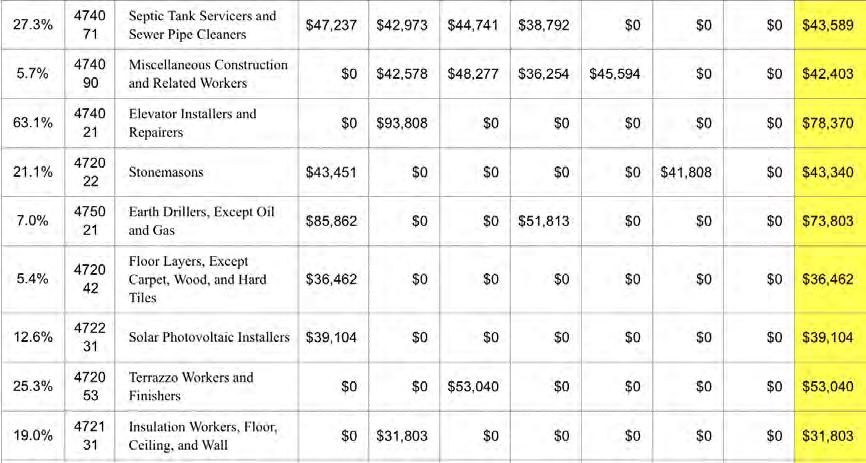
27 Elevator Installers and Repairers in Los Angeles County (730) Los Angeles County: There were three cases of 5,730 construction workers in occupations that had the $86,690 income needed to afford the entry level priced home. They represented 1.5% of the 390,867 construction workers: Construction and Building Inspectors Los Angeles and Orange counties and the Inland Empire (4,340) Elevator Installers and Repairers in Los Angeles County (730) Paving, Surfacing, and Tamping Equipment Operators in the Inland Empire (660) Inland Empire: There were 121 cases in which 230,740 construction workers in occupations had the $49,970 income needed to afford the entry level priced home. They represented workers in 30 of the 50 construction occupations and 59.0% of the 390,867 construction workers. The worked in several Southern California areas: Carpenters in all but Imperial County (36,940) Electricians in every county (34,660) First-Line Supervisors of Construction Trades and Extraction Workers in every county (29,520) Plumbers, Pipefitters, and Steamfitters in all but the Inland Empire (21,480) First-Line Supervisors of Mechanics, Installers, and Repairers in every county (21,080) Operating Engineers and Other Construction Equipment Operators in all but Imperial County (12,540) Heating, Air Conditioning, and Refrigeration Mechanics and Installers in Los Angeles, Orange, San Diego and Ventura counties (10,440) Drywall and Ceiling Tile Installers in Orange and San Diego counties and the Inland Empire (9,860) Cement Masons and Concrete Finishers in all but Orange and Imperial counties (7,830) Mobile Heavy Equipment Mechanics, Except Engines in every county (6,860) Construction and Building Inspectors in every county (5,970) Sheet Metal Workers in Los Angeles, San Diego, Santa Barbara counties and Inland Empire (5,020) Roofers in Los Angeles, Orange and Ventura counties (4,980) Structural Iron and Steel Workers in Los Angeles, San Diego counties and the Inland Empire (3,690) Electrical and Electronics Repairers, Commercial and Industrial Equipment in all but Imperial County (3,530) Impact of California s Housing Prices on Construction Workers 25
28 Brick masons and Block masons in all but Santa Barbara and Imperial counties (2,610) Tapers in San Diego County and the Inland Empire (2,240) Glaziers in Los Angeles, Orange and Santa Barbara counties (2,110) Paving, Surfacing, and Tamping Equipment Operators in Los Angeles and San Diego counties and the Inland Empire (1,620) Highway Maintenance Workers except in the Inland Empire and Imperial County (1,320) Pipe layers in Los Angeles, San Diego counties and the Inland Empire (1,060) Control and Valve Installers and Repairers, Except Mechanical Door in San Diego, Ventura, Santa Barbara counties and the Inland Empire (1,010) Plasterers and Stucco Masons in San Diego County (780) Elevator Installers and Repairers in Los Angeles County (730) Fence Erectors in Los Angeles County (710) Tile and Marble Setters in the Inland Empire (640) Carpet Installers in the Inland Empire (490) Earth Drillers, Except Oil and Gas in San Diego County and the Inland Empire (480) Reinforcing Iron and Rebar Workers in San Diego County (390) Terrazzo Workers and Finishers in Orange County (150) Summary: All Southern California Construction Workers Based upon this analysis, it is clear that except for a very few construction workers, primarily in management or inspection occupations, those earning the median annual income in their occupation could not afford the median priced homes in Los Angeles, Orange, or San Diego counties and even in the Inland Empire. This applies as well to lower priced entry level homes in Los Angeles, Orange and San Diego counties which remain out of reach for all but a very few median paid construction workers. However, the much lower price for an entry level home in the Inland Empire ($308,120) has created the ability for about half of construction workers in the several counties to buy a home. Most would have to migrate to it from their work in other Southern California counties. Here, it should be noted again that affordable Inland Empire homes tend to be farther from the borders of the adjacent coastal counties, adding to commute times for workers who chose to migrate and drive to work. 26 Chapman University
.")

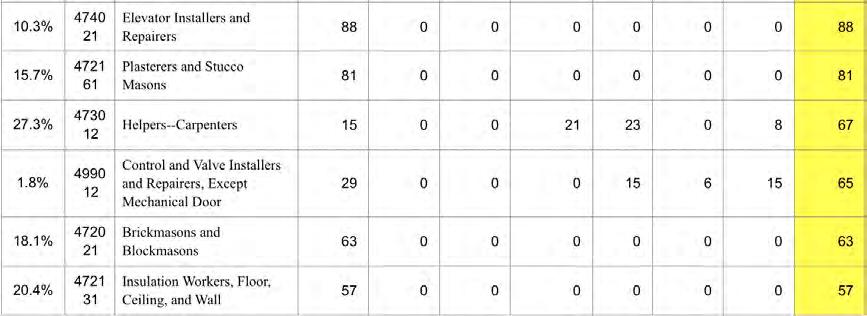
29 Estimated Union Workers by Occupation and County To estimate union membership by occupation, the national figures on the share of union workers in each occupation were used. Altogether, the result was an estimate of 73,720 union members or 18.9% of the total of 390,867 Southern California construction workers (Exhibit 9). Again, data on the occupations is shown in order of numerical importance. For each occupation, the information shows the number of estimated union workers with jobs in each of the seven Southern California counties. Exhibit 9. Estimated Union Construction Workers, Occupation, Southern CA, 2017 Impact of California s Housing Prices on Construction Workers 27

30 28 Chapman University


31 Source: National share of union workers multiplied by the number of workers in each occupation in each county. Reviewing these data, the heaviest concentration of Southern California union construction workers by occupation was in jobs with roughly 1,775 workers or higher. In 2017, they included 56,620 of the estimated 73,720 union construction workers or 76.8%: Electricians 12, % Carpenters 9, % Plumbers, Pipefitters, and Steamfitters 7, % Construction Laborers 5, % First-Line Supervisors of Construction Trades and Extraction Workers 5, % Operating Engineers and Other Construction Equipment Operators 3, % Drywall and Ceiling Tile Installers 3, % Impact of California s Housing Prices on Construction Workers 29

32 Cement Masons and Concrete Finishers 2, % Structural Iron and Steel Workers 2, % Heating, Air Conditioning, and Refrigeration Mechanics and Installers 1, % Sheet Metal Workers 1, % Electrical and Electronics Repairers, Commercial and Industrial Equipment 1, % TOTAL 56, % Pay For Union Workers by Occupation Given the estimated distribution of union workers by occupation, it was next necessary to estimate their pay levels. Here, the same 2018 source was the EDD data on pay scales by occupation. As union workers are assumed to earn more than the median income for their occupation, the information used was for the wage levels of workers making above 75% of those in their occupation (Exhibit 10). These data were multiplied by 2,080 hours on the assumption that workers were employed 8-hours a day, 5-days a week, 52- weeks a year. These pay scales are shown for each occupation according to the number of workers in it (Exhibit 10). For all 73,720 workers, the median annual pay, weighted by the number of workers in the occupation, the income was $73,258. Exhibit 10. Estimated Union Construction Worker Pay, Occupation, So. CA, Chapman University


33 Impact of California s Housing Prices on Construction Workers 31


34 Source: Occupational Wage (2018-1st Quarter) Data, Occupational Wage Survey, CA Employment Development Department; Union Membership, Coverage, Density and Employment by Combined Statistical Area (CSA) and MSA, 2017 UnionStats, 2018 by Barry T. Hirsch and David A. Macpherson. 75% pay threshold is shown. 32 Chapman University
35 For all 73,720 Southern California union construction workers, the estimated annual pay, weighted by the number of workers in each occupation was $73,258. For the 12 largest occupations, it was $74,719: Electricians 12,131 $80,913 Carpenters 9,213 $66,427 Plumbers, Pipefitters, and Steamfitters 7,151 $67,197 Construction Laborers 5,988 $56,155 First-Line Supervisors of Construction Trades and Extraction Workers 5,225 $97,119 Operating Engineers and Other Construction Equipment Operators 3,320 $93,361 Drywall and Ceiling Tile Installers 3,014 $76,857 Cement Masons and Concrete Finishers 2,864 $68,980 Structural Iron and Steel Workers 2,077 $81,663 Heating, Air Conditioning, and Refrigeration Mechanics and Installers 1,959 $70,097 Sheet Metal Workers 1,904 $70,893 Electrical and Electronics Repairers, Commercial and Industrial Equipment 1,772 $74,285 Largest 12 Employing Occupations 56,620 $74,719 Ability To Afford Median Priced Homes at Union Pay Given these data, the question arises as to the extent that better paid union workers in the various construction occupations in each of the counties could afford the median priced homes in any of Southern California major markets. Again, the incomes required to purchase median homes in four major markets were considered: Orange County $177,050 income for the median home ($830,000) San Diego County $138,650 income for the median home ($650,000) Los Angeles County $134,160 income for the median home ($628,840) Inland Empire $77,330 income for the median home ($362,500) Impact of California s Housing Prices on Construction Workers 33
36 Pay for each of the 50 occupations in the seven Southern California counties were considered: Orange County: No union member in any occupation had the $177,050 income to afford the $830,000 median priced home. San Diego County: No union construction worker in any occupation had the $138,650 income to afford the $650,000 median priced home. Los Angeles County: No union construction worker in any occupation had the $134,160 income to afford the$628,840 median priced home. Inland Empire: There were 52 cases of union construction workers in occupations that had the $77,330 income needed to afford the median priced home. They were in 19 occupations and included 25,140 workers or 34.1% of 73,720 estimated union workers in the construction industry: Electricians in Los Angeles, San Diego counties (6,566) First-Line Supervisors of Construction Trades and Extraction Workers in every county (5,225) Operating Engineers and Other Construction Equipment Operators in all but Santa Barbara, Imperial counties(3,164) Structural Iron and Steel Workers in Los Angeles, San Diego counties and the Inland Empire (2,077) First-Line Supervisors of Mechanics, Installers, and Repairers in all but Imperial County (1,508) Construction and Building Inspectors in every county (1,433) Drywall and Ceiling Tile Installers in Orange, Ventura counties and the Inland Empire (1,433) Heating, Air Conditioning, and Refrigeration Mechanics and Installers in Los Angeles County (800) Electrical and Electronics Repairers, Commercial and Industrial Equipment in Los Angeles, Ventura, Santa Barbara counties (633) Mobile Heavy Equipment Mechanics, Except Engines in Los Angeles County (622) Elevator Installers and Repairers in Los Angeles County (461) Sheet Metal Workers in Los Angeles, Santa Barbara counties (514) Control and Valve Installers and Repairers, Except Mechanical Door in San Diego, Ventura, Santa Barbara counties and the Inland Empire (212) Hazardous Materials Removal Workers in the Inland Empire(145) Glaziers in Orange and Santa Barbara counties (118) Tile and Marble Setters in the Inland Empire (87) 34 Chapman University
37 Paving, Surfacing, and Tamping Equipment Operators in the Inland Empire (84) Brick masons and Block masons in Ventura County (36) Earth Drillers, Except Oil and Gas in the Inland Empire (22) Union Construction Workers Ability To Afford First Time Homes Another question is the extent that union workers in the various occupations in each of the counties could afford the lower priced first time homes in any of Southern California major markets. Incomes required to purchase median homes in four areas were considered: Orange County $114,400 income for the median home ($705,500) San Diego County $89,590 income for the median home ($552,500) Los Angeles County $86,690 income for the median home ($534,600) Inland Empire $49,970 income for the median home ($308,120) Pay for each of the 50 occupations in the seven Southern California counties were considered: Orange County: Only one union occupation with 461 union workers yielded sufficient income to meet the $114,400 income to afford the $705,500 entry level priced home. It represented 0.6% of the 73,720 union construction workers. Elevator Installers and Repairers in Los Angeles County (461) San Diego County: There were 24 cases in 11 occupations with 10,309 union construction workers that had the $89,590 income needed to afford the $552,500 entry level priced home. It represented 14.0% of the 73,720 union construction workers: First-Line Supervisors of Construction Trades and Extraction Workers in Los Angeles, Orange, San Diego, Ventura counties (4,207) Operating Engineers and Other Construction Equipment Operators in Los Angeles, Orange counties and the Inland Empire (2,361) Construction and Building Inspectors in all but Imperial County (1,426) First-Line Supervisors of Mechanics, Installers, and Repairers in Los Angeles, Orange, Ventura counties (973) Impact of California s Housing Prices on Construction Workers 35
38 Mobile Heavy Equipment Mechanics, Except Engines in Los Angeles County (622) Elevator Installers and Repairers in Los Angeles County (461) Control and Valve Installers and Repairers, Not Mechanical Door in San Diego, Ventura counties (88) Paving, Surfacing, and Tamping Equipment Operators in the Inland Empire (84) Tile and Marble Setters in the Inland Empire (35) Electrical and Electronics Repairers, Commercial and Industrial Equipment in Ventura County (30) Earth Drillers, Except Oil and Gas in the Inland Empire (22) Los Angeles County: There were 28 cases in 12 occupations with 16,114 union construction workers in occupations that had the $86,690 income needed to afford the $534,600 entry level priced home. This represented 21.9% of the 73,720 union workers: First-Line Supervisors of Construction Trades and Extraction Workers in all but Santa Barbara and Imperial counties (5,117) Electricians in Los Angeles County (4,092) Operating Engineers and Other Construction Equipment Operators in all but Santa Barbara and Imperial counties (3,164) Construction and Building Inspectors in all but Imperial County (1,426) First-Line Supervisors of Mechanics, Installers, and Repairers in Los Angeles, Orange, Ventura counties (973) Mobile Heavy Equipment Mechanics, Except Engines in Los Angeles County (622) Elevator Installers and Repairers in Los Angeles County (461) Control and Valve Installers and Repairers, Not Mechanical Door in San Diego, Ventura counties (88) Paving, Surfacing, and Tamping Equipment Operators in the Inland Empire (84) Tile and Marble Setters in the Inland Empire (35) Electrical and Electronics Repairers, Commercial and Industrial Equipment in Ventura County (30) Earth Drillers, Except Oil and Gas in the Inland Empire (22) Inland Empire: There were 191 cases in 42 of 50 occupations with 71,316 construction workers earned at least the $49,970 income needed to afford the entry level priced home. They represented 96.7% of the 73,570 union construction workers: Electricians in every county (12,131) 36 Chapman University
39 Carpenters in every county (9,213) Plumbers, Pipefitters, and Steamfitters in every county (7,151) Construction Laborers in every county but Imperial (5,959) First-Line Supervisors of Construction Trades and Extraction Workers in every county (5,225) Operating Engineers and Other Construction Equipment Operators in every county (3,320) Drywall and Ceiling Tile Installers in every county but Santa Barbara, Imperial (3,014) Cement Masons and Concrete Finishers in every county but Santa Barbara (2,826) Structural Iron and Steel Workers in Los Angeles, San Diego counties and the Inland Empire (2,077) Heating, Air Conditioning, and Refrigeration Mechanics and Installers in every county (1,959) Sheet Metal Workers in every county but Imperial (1,904) Electrical and Electronics Repairers, Commercial and Industrial Equipment in every county (1,772) Painters, Construction and Maintenance in every county but Ventura and Imperial (1,491) First-Line Supervisors of Mechanics, Installers, and Repairers in every county (1,518) Installation, Maintenance, and Repair Workers, All Other in every county but Imperial (1,493) Construction and Building Inspectors in every county (1,433) Mobile Heavy Equipment Mechanics, Except Engines in every county (1,399) Hazardous Materials Removal Workers in Los Angeles, Orange and San Diego counties and the Inland Empire (911) Tapers in every county but Imperial (892) Reinforcing Iron and Rebar Workers in Los Angeles, San Diego counties and the Inland Empire (609) Glaziers (568) in every county but Ventura and Imperial Brick Masons and Block Masons in every county but Santa Barbara and Imperial (551) Elevator Installers and Repairers in Los Angeles County (461) Plasterers and Stucco Masons in every market but Inland Empire and Imperial County (449) Roofers in every county but Imperial (530) Highway Maintenance Workers in every county but Imperial (494) Impact of California s Housing Prices on Construction Workers 37
40 Pipe Layers in Los Angeles, Orange, San Diego counties and the Inland Empire (447) Septic Tank Servicers and Sewer Pipe Cleaners in Los Angeles, Orange counties, and the Inland Empire (216) Mechanical Door Repairers in every county but Los Angeles, Orange (212) Control and Valve Installers and Repairers, Except Mechanical Door in San Diego, Ventura, Santa Barbara counties and the Inland Empire (212) Paving, Surfacing, and Tamping Equipment Operators in Los Angeles, San Diego counties and the Inland Empire (207) Tile and Marble Setters in Orange, San Diego, Santa Barbara counties and the Inland Empire (107) Helpers-Brickmasons, Blockmasons, Stonemasons, & Tile & Marble Setters in San Diego County (25) Carpet Installers every county but Ventura and Imperial (179) Stonemasons in Santa Barbara County and the Inland Empire (156) Miscellaneous Construction and Related Workers in Los Angeles, Orange, Ventura counties (32) Terrazzo Workers and Finishers in Orange County(38) Earth Drillers, Except Oil and Gas in San Diego County and the Inland Empire (34) Solar Photovoltaic Installers in the Inland Empire (29) Insulation Workers, Floor, Ceiling, and Wall in Los Angeles County (29) Fence Erectors in Los Angeles, San Diego counties (19) Insulation Workers, Mechanical in San Diego County (23) The only sectors where no union workers in any county could qualify to buy the entry level Inland Empire home were: Helpers Installation, Maintenance, and Repair Workers Helpers Carpenters Helpers Electricians Helpers, Construction Trades, All Other Helpers Pipelayers, Plumbers, Pipefitters, and Steamfitters Helpers Painters, Paperhangers, Plasterers, and Stucco Masons Floor Layers, Except Carpet, Wood, and Hard Tiles Service Unit Operators, Oil, Gas, and Mining Summary Southern California Union Construction Workers 38 Chapman University San Diego Waterfront

41 Impact of California s Housing Prices on Construction Workers 39

42 Given the assumption that Southern California s unionized construction workers earn more than 75% of their colleagues, this analysis showed that there is still a problem in the ability of construction workers to afford homes in the coastal counties. Union members workers in construction occupations throughout the Southland could still not afford median priced homes in Los Angeles, Orange and San Diego Counties. Even for the Inland Empire s lower median price, union workers in just 19 of 50 occupations could do so. With lower priced first time homes, the situation changed somewhat in the coastal counties. Union construction workers in just one occupation could buy an affordable first time home in Orange County. Those in 11 occupations could do so in San Diego County. It was true for workers in 12 occupations with regards to Los Angeles County prices. The situation changed dramatically for the lower cost Inland Empire. There, over 95% of union workers in 42 of 50 occupations were able to afford lower priced first time homes. The difficulty is that the area s affordable homes are largely located deep inside the region, away from the areas adjacent to the coastal counties, making for very long commutes. San Francisco Bay Area Construction Workers A similar, if more dire, set of situations exists between the Bay Area and the northern portion of the Central Valley. To address housing affordability, the starting point was again the 2017 EDD data on employment by occupational category, whether union or not. Here, the data were compiled for the San Francisco (SF) Bay Area s nine counties (Alameda, Contra Costa, Marin, Napa, San Francisco, San Mateo, Santa Clara, Solano, Sonoma counties). Statistics were available for 164,210 SF Bay Area construction workers in 50 different occupations (Exhibit 11). In addition, the U.S. Bureau of Labor Statistics reported data on the share of unionization for each U.S. construction occupation was assumed to also apply to the SF Bay Area. As indicated earlier, to the extent that was true, Exhibit 11. Number of Workers by Construction Occupation, SF Bay Area, Chapman University
43
 and MSA, 2017 UnionStats 2018 by Barry T. Hirsch and David A. Macpherson.")
44 Source: Occupational Employment (May 2017) Data, Occupational Wage Survey, CA Employment Development Department; Union Membership, Coverage, Density and Employment by Combined Statistical Area (CSA) and MSA, 2017 UnionStats 2018 by Barry T. Hirsch and David A. Macpherson. 42 Chapman University
45 18.9% of construction workers were in unions. This compared to 8.0% of workers in all private sector occupations in the SF Bay Area market. 12 Reviewing these data, the heaviest concentration of SF Bay Area construction workers by occupation was in the 12 job categories with 4,100 workers or more. In 2017, they included 132,340 of the estimated 164,210 construction workers or 80.6%: Carpenters 25, % Construction Laborers 23, % Electricians 15, % Plumbers, Pipefitters, and Steamfitters 12, % First-Line Supervisors of Construction Trades and Extraction Workers 11, % Painters, Construction and Maintenance 9, % First-Line Supervisors of Mechanics, Installers, and Repairers 8, % Drywall and Ceiling Tile Installers 5, % Operating Engineers and Other Construction Equipment Operators 5, % Heating, Air Conditioning, and Refrigeration Mechanics and Installers 4, % Roofers 4, % Installation, Maintenance, and Repair Workers, All Other 4, % Median Pay 132, % EDD s hourly wage data on the median pay for each occupation in first quarter 2018 was next used. For clarity, that is the level where 50% of workers in an occupation made more and 50% made less than other workers in each job category. These data were multiplied by 2,080 hours on the assumption that workers were employed 8-hours a day, 5-days a week, 52-weeks a year. Below, these pay scales are shown by occupation according to the number of workers in it for the SF Bay Area (Exhibit 12). For all 164,210 construction workers in the region, the median annual pay weighted by the number of workers in each occupation was $65,448. For the 12 largest occupations, it was $67,264. The twelve occupations included: Carpenters 25,800 $64,289 Construction Laborers 23,080 $52,575 Impact of California s Housing Prices on Construction Workers 43

46 Electricians 15,960 $82,383 Plumbers, Pipefitters, and Steamfitters 12,530 $60,070 First-Line Supervisors of Construction Trades and Extraction Workers 11,780 $92,974 Painters, Construction and Maintenance 9,580 $55,167 First-Line Supervisors of Mechanics, Installers, and Repairers 8,980 $81,926 Drywall and Ceiling Tile Installers 5,920 $73,249 Operating Engineers and Other Construction Equipment Operators 5,580 $80,478 Heating, Air Conditioning, and Refrigeration Mechanics and Installers 4,880 $62,144 Roofers 4,150 $54,003 Exhibit 12. Median Pay by Construction Occupation, SF Bay Area, Chapman University


47 Impact of California s Housing Prices on Construction Workers 45
 and MSA, 2017 UnionStats, 2018 by Barry T.")


48 Source: Occupational Wage (2018-1st Quarter) Data, Occupational Wage Survey, CA Employment Development Department; Union Membership, Coverage, Density and Employment by Combined Statistical Area (CSA) and MSA, 2017 UnionStats, 2018 by Barry T. Hirsch and David A. Macpherson. 75% pay threshold is shown. Installation, Maintenance, and Repair Workers, All Other 4,100 $46,991 Estimated Union Workers by Occupation and County 46 Chapman University 132,340 $67,264 To estimate union membership by occupation, the national figures on the share of union workers in each occupation were used. Altogether, the result was an estimate of 31,269 union members or 19.0% of the total of 164,210 SF Bay Area construction workers in 2017 (Exhibit 13). As above, data on


49 Exhibit 13. Estimated Union Construction Workers, by Occupation, SF Bay Area, 2017 Impact of California s Housing Prices on Construction Workers 47

50 48 Chapman University

51 the occupations is shown in order of numerical importance. For each job category, the information shows the number of estimated union workers with jobs in each of the SF Bay Area s seven metropolitan areas. Reviewing these data, the heaviest concentration of SF Bay Area construction union workers by occupation was in 12 job categories with over 700 workers. In 2018, they included 25,037 of the estimated 31,269 union construction workers or 80.1%: Electricians 5, % Carpenters 4, % Plumbers, Pipefitters, and Steamfitters 3, % Construction Laborers 2, % First-Line Supervisors of Construction Trades and Extraction Workers 2, % Operating Engineers and Other Construction Equipment Operators 1, % Drywall and Ceiling Tile Installers 1, % Structural Iron and Steel Workers % Cement Masons and Concrete Finishers % Electrical and Electronics Repairers, Commercial and Industrial Equipment % Painters, Construction and Maintenance % Heating, Air Conditioning, and Refrigeration Mechanics and Installers % 25, % Pay For Union Workers by Occupation Given the distribution of union workers by occupation, their pay levels are next shown. The 2018 EDD data on pay by occupation were used assuming Impact of California s Housing Prices on Construction Workers 49

52 wages above 75% of those working in an occupation (Exhibit 14). Workers were again assumed to work 2,080 hours per year. Pay scales are shown for each occupation according to the number of workers in it from the exhibit above. For all 31,269 union construction workers, the median annual pay, weighted by the workers in each occupation, was $89,015 versus $65,448 for all construction workers. For the 12 largest occupations employing union workers, the weighted pay level was $92,040: Electricians 5,586 $109,069 Carpenters 4,670 $85,346 Plumbers, Pipefitters, and Steamfitters 3,433 $91,441 Construction Laborers 2,631 $65,302 First-Line Supervisors of Construction Trades and Extraction Workers 2,085 $118,931 Operating Engineers and Other Construction Equipment Operators 1,451 $94,299 Drywall and Ceiling Tile Installers 1,160 $107,439 Structural Iron and Steel Workers 906 $73,178 Cement Masons and Concrete Finishers 848 $64,238 Electrical and Electronics Repairers, Commercial and Industrial Equipment 793 $84,397 Painters, Construction and Maintenance 766 $71,297 Heating, Air Conditioning, and Refrigeration Mechanics and Installers 708 $83,483 25,037 $92,040 Exhibit 14. Estimated Union Construction Workers Pay, by Occupation, SF Bay Area, Chapman University

53 Impact of California s Housing Prices on Construction Workers 51

54 52 Chapman University
 than Southern California (390,867). However, they are better paid.")
55 Construction Worker Comparison Looking at the data on construction workers, union and non-union, in SF Bay Area s nine counties, several facts emerge. The area has fewer construction workers (164,210) than Southern California (390,867). However, they are better paid. For all construction workers, the median pay in the SF Bay Area was $65,448 versus $54,116 in the Southern California s counties. For union construction workers, the pay was $89,015 in the SF Bay Area compared to $73,259 in the southern counties. With higher home prices in the SF Bay Area and higher pay, the affordability for total and union construction workers needs to be addressed. SF Bay Area Median Home Prices In the nine SF Bay Area counties, median prices in third quarter 2018 were very high. They varied from $455,000 in Solano County to $1.6 million in both San Francisco and San Mateo counties (Exhibit 15). For the entire area, the median price was $950,000. This compared to a range of $362,500 to $830,000 in Southern California. According to the CA Real Estate Association, the annual incomes required by market to buy these median priced homes were as follows: San Francisco: $341,300 for monthly payments of $8,530 on the $1,600,000 median priced home San Mateo: $341,300 for monthly payments of $8,530 on the $1,600,000 median priced home Marin: $277,310 for monthly payments of $6,930 on the $1,300,000 median priced home Santa Clara: $277,310 for monthly payments of $6,930 on the $1,300,000 median priced home Impact of California s Housing Prices on Construction Workers 53
56 Alameda: $202,650 for monthly payments of $5,070 on the $950,000 median priced home Napa: $155,610 for monthly payments of $3,890 on the $729,500 median priced home Contra Costa $140,790 for monthly payments of $3,520 on the $660,000 median priced home Sonoma: $140,790 for monthly payments of $3,520 on the $660,000 median priced home Solano: $97,060 for monthly payments of $2,430 on the $455,000 median priced home Central Valley: $62,241 for monthly payments of 1,560 on the $291,796 median priced home Construction Workers Able To Afford Median Homes Looking at the array of incomes for all construction workers, union or not, the ability to purchase these homes by construction workers in the various markets was: San Francisco and San Mateo counties: No construction workers in any occupation in any county had the $341,300 income to afford the $1.6 million median priced home. Marin and Santa Clara counties: No construction workers in any occupation in any county had the $277,310 income to afford the $1.3 million median priced home. Alameda County: No construction worker in any occupation in any county had the $202,650 income to afford the $950,000 median priced home. Napa County: No construction worker in any occupation in any county had the $155,610 income to afford the $729,500 median priced home. Contra Costa and Sonoma counties: No construction worker in any occupation in any county had the $140,790 income to afford the $660,000 median priced home. Solano County: There were five cases in two occupational categories where 4,440 supervisors and inspectors earned the $97,060 income to afford the $455,000 median home: Front Line Supervisors in Construction Trades and Extraction in San Francisco, San Mateo (2,230) Construction and Building Inspectors in every county but Napa, Santa Clara, Solano (2,210) 54 Chapman University
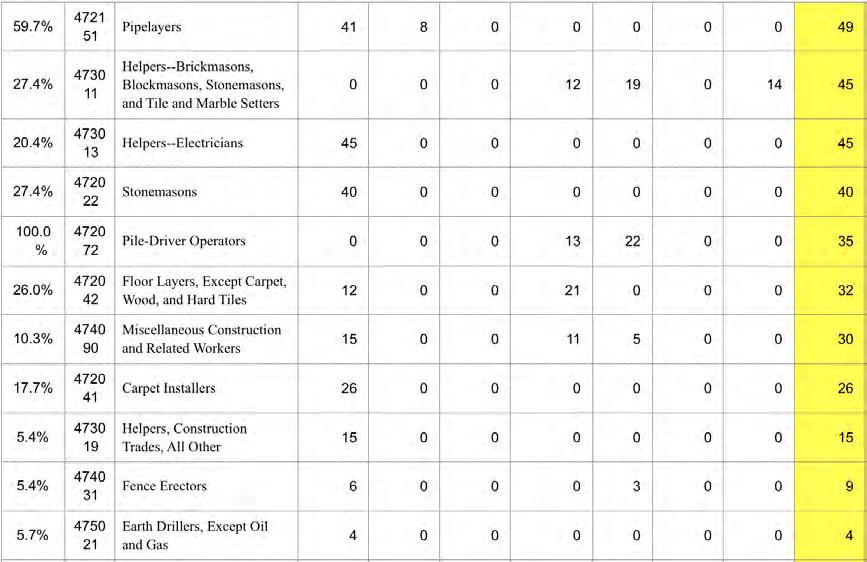
57 If Choosing to Migrate to the Central Valley for Median Priced Homes: In the adjacent seven county Central Valley, construction workers can find affordable homes if they chose to migrate inland. In that market, there were 84 cases in 29 occupations with 80,080 construction workers who could afford the $62,241 income needed for the $291,796 median priced home. That was 48.8% of the 164,210 construction workers. The workers by occupation and the counties in which they worked included: Carpenters in Alameda, Contra Costa, Napa, Marin, Sonoma (13,340) Electricians in every county (15,960) First-Line Supervisors of Construction Trades and Extraction Workers in every county (11,780) First-Line Supervisors of Mechanics, Installers, and Repairers in every county (8,980) Plumbers, Pipefitters, and Steamfitters in Alameda, Contra Costa, Solano, Sonoma (5,960) Operating Engineers and Other Construction Equipment Operators in every county (5,580) Drywall and Ceiling Tile Installers every county but Marin, Solano (4,790) Construction and Building Inspectors in every county (2,880) Heating, Air Conditioning, and Refrigeration Mechanics and Installers in Marin, Santa Clara, Sonoma (2,660) Mobile Heavy Equipment Mechanics, Except Engines in all counties but Marin, Napa, Sonoma (1,580) Tapers in every county but Marin, Napa, Solano (1,490) Electrical and Electronics Repairers, Commercial and Industrial Equipment in all counties by Marin, Napa, Sonoma (910) Highway Maintenance Workers in Alameda, Contra Costa, San Francisco, San Mateo (570) Sheet Metal Workers in Santa Clara (560) Glaziers in Napa, San Francisco, San Mateo (490) Carpet Installers in Alameda, Contra Costa (480) Control and Valve Installers and Repairers, Except Mechanical Door in Alameda, Contra Costa, Santa Clara, Solano, Sonoma (310) Brickmasons and Blockmasons in Alameda, Contra Costa (300) Insulation Workers, Floor, Ceiling, and Wall in Alameda, Contra Costa (300) Structural Iron and Steel Workers in Solano (300) Roofers in Solano (190) Pile-Driver Operators in Alameda, Contra Costa (150) Impact of California s Housing Prices on Construction Workers 55
 Miscellaneous Construction and Related Workers in Santa Clara (80) Earth Drillers, Except Oil and Gas in Alameda, Contra Costa (60) Pipelayers in Marin (30) Earth")
58 Elevator Installers and Repairers in Alameda, Contra Costa (140) Septic Tank Servicers and Sewer Pipe Cleaners in San Francisco, San Mateo (110) Paving, Surfacing, and Tamping Equipment Operators in San Francisco, San Mateo (100) Miscellaneous Construction and Related Workers in Santa Clara (80) Earth Drillers, Except Oil and Gas in Alameda, Contra Costa (60) Pipelayers in Marin (30) Earth Drillers, Except Oil and Gas in Alameda, Contra Costa (60) SF Bay Area First Time Home Prices In the nine counties, lower priced starter homes in third quarter 2018 were still very high. They varied from $386,750 in Solano County to $1.36 million in both San Francisco and San Mateo counties (Exhibit 16). For the entire area, the median price was $807,500. This compared to a range of $362,500 to $830,000 in Southern California. According to the CA Real Estate Association, by market, the annual incomes required to buy these lower priced first time homes were: San Francisco: $220,540 for monthly payments of $7,350 on $1,360,000 lower priced first home San Mateo: $220,540 for monthly payments of $7,350 on $1,360,000 lower priced first home Marin: $179,190 for monthly payments of $5,970 on $1,105,000 lower priced first home Santa Clara: $179,190 for monthly payments of $5,970 on $1,105,000 lower priced first home 56 Chapman University
59 Alameda: $130,940 for monthly payments of $4,360 on $807,500 lower priced first home Napa: $100,550 for monthly payments of $3,350 on $620,080 lower priced first time home Contra Costa $90,970 for monthly payments of $3,030 on $561,000 lower priced first time home Sonoma: $90,970 for monthly payments of $3,030 on $561,000 lower priced first time home Solano: $62,720 for monthly payments of $2,090 on $386,750 lower price first time home Central Valley: $40,213 for monthly payments of $1,368 on $248,028 lower priced first time home Construction Workers Able To Afford First Time Homes Looking at the array of incomes for all construction workers, union or not, the ability to purchase more affordable first time homes by construction workers in the various markets was: San Francisco and San Mateo counties: No construction worker in any occupation or county had the $220,540 income to afford the $1.36 million lower priced first time home. Marin and Santa Clara counties: No construction worker in any occupation or county had the $179,190 income to afford the $1.105 million lower priced first time home. Alameda County: No construction worker in any occupation or county had the $130,940 income to afford the $807,500 lower priced first time home. Napa County: There were three cases of building inspectors including 1.7% of construction workers with the $100,550 income to afford the $620,080 low priced first time home. Construction and Building Inspectors in Alameda-Contra Costa, San Francisco-San Mateo, Sonoma (2,790) Contra Costa and Sonoma counties: There were 13 cases in six occupational categories where 18,570 or 11.3% of 164,210 construction workers could earned the $90,970 income to afford the $561,000 lower priced first time home. Many were administrators and inspectors. The workers by occupation and counties in which they worked were: First-Line Supervisors of Construction Trades and Extraction Workers in Alameda, Contra Costa, Marin, San Francisco, San Mateo, Santa Clara (10,320) Impact of California s Housing Prices on Construction Workers 57
60 Electricians in San Francisco, San Mateo (3,280) Construction and Building Inspectors in every county but Napa, Solano (2,790) Drywall and Ceiling Tile Installers in Alameda, Contra Costa (1,770) Tapers in Alameda, Contra Costa (260) Pile-Driver Operators in Alameda, Contra Costa (150) Solano County: There were 83 cases in 28 occupational categories where 80,020 or 48.8% of construction workers could earned the $62,720 income to afford the $386,750 lower priced first time home. The workers by occupation and counties in which they worked were: Carpenters in Alameda, Contra Costa, Napa, Marin, Sonoma (13,340) Electricians in every county (15,960) First-Line Supervisors of Construction Trades and Extraction Workers in every county (11,780) First-Line Supervisors of Mechanics, Installers, and Repairers in every county (8,980) Plumbers, Pipefitters, and Steamfitters in Alameda, Contra Costa, Solano, Sonoma (5,960) Operating Engineers and Other Construction Equipment Operators in every county (5,580) Drywall and Ceiling Tile Installers every county but Marin, Solano (4,790) Construction and Building Inspectors in every county (2,880) Heating, Air Conditioning, and Refrigeration Mechanics and Installers in Marin, Santa Clara, Sonoma (2,660) Mobile Heavy Equipment Mechanics, Except Engines in all counties but Marin, Napa, Sonoma (1,580) Tapers in every county but Marin, Napa, Solano (1,490) Electrical and Electronics Repairers, Commercial and Industrial Equipment in all counties by Marin, Napa, Sonoma (910) Highway Maintenance Workers in Alameda, Contra Costa, San Francisco, San Mateo (570) Sheet Metal Workers in Santa Clara (560) Glaziers in Napa, San Francisco, San Mateo (490) Carpet Installers in Alameda, Contra Costa (480) Control and Valve Installers and Repairers, Except Mechanical Door in Alameda, Contra Costa, Santa Clara, Solano, Sonoma (310) Brickmasons and Blockmasons in Alameda, Contra Costa (300) Insulation Workers, Floor, Ceiling, and Wall in Alameda, Contra Costa (300) 58 Chapman University
61 Structural Iron and Steel Workers in Solano (300) Roofers in Solano (190) Pile-Driver Operators in Alameda, Contra Costa (150) Elevator Installers and Repairers in Alameda, Contra Costa (140) Septic Tank Servicers and Sewer Pipe Cleaners in San Francisco, San Mateo (110) Paving, Surfacing, and Tamping Equipment Operators in San Francisco, San Mateo (100) Miscellaneous Construction and Related Workers in Santa Clara (80) Pipelayers in Marin (30) If Choosing to Migrate to the Central Valley for First Time Homes: For those choosing to migrate to the seven county Central Valley, there were 169 cases in 44 of the 50 occupations in which 158,080 of 164,210 construction workers could afford the $40,213 income needed for the $248,028 lower priced first time home. That was 96.3% of all such workers. Only 6,130 SF Bay Area construction workers could not afford the Central Valley s affordable homes. The workers by occupation and counties in which they worked: Carpenters in every county (25,800) Construction Laborers in every county (23,080) Electricians in every county (15,960) Plumbers, Pipefitters, and Steamfitters in every county 12,530) First-Line Supervisors of Construction Trades and Extraction Workers in every county (11,780) Painters, Construction and Maintenance in every county 9,580) First-Line Supervisors of Mechanics, Installers, and Repairers in every county (8,980) Drywall and Ceiling Tile Installers in every county (5,700) Operating Engineers and Other Construction Equipment Operators in every county (5,580) Heating, Air Conditioning, and Refrigeration Mechanics and Installers in every county but Marin (4,880) Roofers in every county but Sonoma (4,150) Installation, Maintenance, and Repair Workers, All Other in every county but Napa, Solano (3,760) Cement Masons and Concrete Finishers in every county but San Francisco, San Mateo (3,350) Helpers Installation, Maintenance, and Repair Workers in Marin, San Francisco, San Mateo (540) Impact of California s Housing Prices on Construction Workers 59
62 Construction and Building Inspectors in every county (2,880) Tile and Marble Setters in every county (2,200) Hazardous Materials Removal Workers in Alameda, Contra Costa (1,280) Sheet Metal Workers in Alameda, Contra Costa, Santa Clara (1,540) Mobile Heavy Equipment Mechanics, Except Engines in every county but Marin (1,760) Structural Iron and Steel Workers in Alameda, Contra Costa, Santa Clara, Solano, Sonoma (1,610) Electrical and Electronics Repairers, Commercial and Industrial Equipment in every county but Napa, Marin (1,580) Tapers in every county but Napa, Marin, Solano (1,490) Glaziers in Alameda, Contra Costa, Napa, San Francisco, San Mateo (980) Highway Maintenance Workers in every county but Marin, Solano (900) Solar Photovoltaic Installers in Marin, San Francisco, San Mateo (240) Plasterers and Stucco Masons in Alameda, Contra Costa, Napa (700) Floor Layers, Except Carpet, Wood, and Hard Tiles in Alameda, Contra Costa, San Francisco, San Mateo 600) Miscellaneous Construction and Related Workers in Alameda, Contra Costa, San Francisco, San Mateo (530) Carpet Installers in Alameda, Contra Costa (480) Reinforcing Iron and Rebar Workers in Alameda, Contra Costa (440) Helpers Electricians in Alameda, Contra Costa (440) Mechanical Door Repairers in Alameda, Contra Costa (250) Helpers Brickmasons, Blockmasons, Stonemasons, and Tile and Marble Setters in Alameda, Contra Costa (140) Septic Tank Servicers and Sewer Pipe Cleaners in Alameda, Contra Costa (390) Control and Valve Installers and Repairers, Except Mechanical Door in Alameda, Contra Costa (310) Brickmasons and Blockmasons in Alameda, Contra Costa, Napa (300) Insulation Workers, Floor, Ceiling, and Wall in Alameda, Contra Costa (300) Paving, Surfacing, and Tamping Equipment Operators in Alameda, Contra Costa (270) Stonemasons in Alameda, Contra Costa (190) Pipelayers in Alameda, Contra Costa, Marin (180) Pile-Driver Operators in Alameda, Contra Costa 150) 60 Chapman University
63 Elevator Installers and Repairers in Alameda, Contra Costa (140) Helpers Carpenters in Sonoma (80) Earth Drillers, Except Oil and Gas in Alameda, Contra Costa (60) Union Construction Workers Able To Afford Median Price Homes Looking at the array of incomes for the more highly paid union construction workers employed in the various counties, the ability to purchase SF Bay Area median price homes was: San Francisco and San Mateo counties: No union construction worker in any occupation or county had the $341,300 income to afford the $1.6 million median priced home. Marin and Santa Clara counties: No construction worker in any occupation or county had the $277,310 income to afford the $1.3 million median priced home. Alameda County: No construction worker in any occupation or county had the $202,650 income to afford the $950,000 median priced home. Napa County: No construction worker in any occupation or county had the $155,610 income to afford the $729,500 median priced home. Contra Costa and Sonoma counties: There were two cases in two occupations with 378 workers that earned the $140,710 income to afford the $660,000 median priced home: Drywall and Ceiling Tile Installers in Alameda, Contra Costa (347) Construction and Building Inspectors in Sonoma (31) Solano County: There were 50 cases from 16 occupations where 10,040 union construction workers earned the $97,060 income to afford the $455,000 median priced home. They represented 32.1% of the 31,269 union construction workers: Electricians in Alameda, Contra Costa, Marin, San Francisco, San Mateo, Santa Clara (4,876) First-Line Supervisors of Construction Trades and Extraction Workers in every county (2,050) Operating Engineers and Other Construction Equipment Operators in every county Alameda, Contra Costa (731) Drywall and Ceiling Tile Installers in Alameda, Contra Costa, Santa Clara (794) Heating, Air Conditioning, and Refrigeration Mechanics and Installers in Marin (19) Impact of California s Housing Prices on Construction Workers 61

64 62 Chapman University
65 San Diego Cityscape Construction and Building Inspectors in every county but Napa (396) First-Line Supervisors of Mechanics, Installers, and Repairers in every county (647) Sheet Metal Workers in Santa Clara (156) Tapers in Alameda, Contra Costa (51) Highway Maintenance Workers in San Francisco, San Mateo (31) Glaziers in San Francisco, San Mateo (77) Elevator Installers and Repairers in Alameda, Contra Costa (88) Control and Valve Installers and Repairers, Except Mechanical Door in Alameda, Contra Costa, Santa Clara (44) Insulation Workers, Floor, Ceiling, and Wall in Alameda, Contra Costa (57) Carpet Installers in Alameda, Contra Costa (26) Union Members Choosing to Migrate to the Central Valley for Median Homes: For those migrating to the adjacent seven county Central Valley, there were 130 cases in 37 of 50 occupations with 28,675 construction workers who could afford the $62,241 income needed for the $291,796 median priced home. That was 91.7% of all such workers. Only 2,954 SF Bay Area construction workers could not afford the Central Valley s median. The workers by occupation and counties in which they worked: Electricians in every county (5,586) Carpenters in every county (4,670) Plumbers, Pipefitters, and Steamfitters in every county (3,433) Construction Laborers in every county but Napa, Sonoma (2,439) First-Line Supervisors of Construction Trades and Extraction Workers in every county (2,085) Operating Engineers and Other Construction Equipment Operators in every county (1,451) Drywall and Ceiling Tile Installers in Alameda, Contra Costa, Napa, San Francisco, San Mateo, Sonoma (1,100) Structural Iron and Steel Workers in every county Alameda, Contra Costa, Santa Clara, Solano (850) Cement Masons and Concrete Finishers in every county Alameda, Contra Costa, Santa Clara, Sonoma (698) Electrical and Electronics Repairers, Commercial and Industrial Equipment in very county but Marin, Napa (793) Painters, Construction and Maintenance in very county but Marin, Napa (685) Impact of California s Housing Prices on Construction Workers 63
66 Heating, Air Conditioning, and Refrigeration Mechanics and Installers in very county but Marin, Solano (674) Construction and Building Inspectors in every county (691) First-Line Supervisors of Mechanics, Installers, and Repairers in every county (647) Sheet Metal Workers in Alameda, Contra Costa, Santa Clara (428) Installation, Maintenance, and Repair Workers, All Other in Alameda, Contra Cost, Marin, San Francisco, San Mateo (287) Mobile Heavy Equipment Mechanics, Except Engines in very county but Marin (359) Tapers in Alameda, Contra Costa, San Francisco, San Mateo, Santa Clara, Sonoma (292) Helpers Installation, Maintenance, and Repair Workers in San Francisco, San Mateo (43) Highway Maintenance Workers in very county but Marin, Solano (275) Roofers in Marin, Santa Clara, Solano (105) Reinforcing Iron and Rebar Workers in Santa Clara (263) Glaziers in Napa, San Francisco, San Mateo (77) Pile-Driver Operators in Alameda, Contra Costa, San Francisco, San Mateo, Santa Clara (150) Tile and Marble Setters in Marin, San Francisco, San Mateo (82) Septic Tank Servicers and Sewer Pipe Cleaners in San Francisco, San Mateo (30) Solar Photovoltaic Installers in Sonoma (10) Elevator Installers and Repairers in Alameda, Contra Costa (88) Plasterers and Stucco Masons in Alameda, Contra Costa, Napa (81) Control and Valve Installers and Repairers, Except Mechanical Door in Alameda, Contra Costa, Santa Clara, Solano, Sonoma (65) Brickmasons and Blockmasons in Alameda, Contra Costa, Napa (63) Insulation Workers, Floor, Ceiling, and Wall in Alameda, Contra Costa (57) Pipelayers in Alameda, Contra Costa, Marin (49) Floor Layers, Not Carpet, Wood, Hard Tiles in Alameda, Contra Costa, San Francisco, San Mateo (32) Miscellaneous Construction and Related Workers in Santa Clara (5) Carpet Installers in Alameda, Contra Costa (26) Earth Drillers, Except Oil and Gas in Alameda, Contra Costa (4) 64 Chapman University
67 Union Construction Workers Able To Afford First Time Lower Priced Homes. Using the data on incomes in each occupation for the more highly paid union construction workers in the various counties, the ability to purchase SF Bay Area s lower priced first time homes was: San Francisco and San Mateo counties: No union construction worker in any occupation or county had the $220,540 income to afford the $1.36 million lower priced first time home. Marin and Santa Clara counties: No union construction worker in any occupation or county had the $179,190 income to afford the $1.105 million lower priced first time home. Alameda County: There were two cases in two occupations where 378 union construction workers had sufficient income to afford the $130,940 income for the $807,500 lower priced first time home: Drywall and Ceiling Tile Installers in Alameda, Contra Costa (347) Construction and Building Inspectors in Sonoma (31) Napa County: There were 29 cases in 12 occupations where 8,682 union construction workers had the $100,550 income to afford the $620,080 lower priced first time home. They represented 27.8% of the 31,269 such people. The workers by occupation and counties in which they worked were: Electricians in Alameda, Contra Costa, Marin, San Francisco, San Mateo, Santa Clara (4,876) First-Line Supervisors of Construction Trades and Extraction Workers in very county but Napa (1,791) Drywall and Ceiling Tile Installers in Alameda, Contra Costa (347) Heating, Air Conditioning, and Refrigeration Mechanics and Installers In Marin (19) Construction and Building Inspectors in very county but Napa, Solano (670) First-Line Supervisors of Mechanics, Installers, and Repairers in very county but Napa (647) Tapers in Alameda, Contra Costa (51) Highway Maintenance Workers in San Francisco, San Mateo (31) Glaziers in San Francisco, San Mateo (77) Elevator Installers and Repairers in Alameda, Contra Costa (88) Control and Valve Installers and Repairers, Except Mechanical Door in Alameda, Contra Costa (29) Insulation Workers, Floor, Ceiling, and Wall in Alameda, Contra Costa (57) Impact of California s Housing Prices on Construction Workers 65
68 Contra Costa and Sonoma counties: There were 51 cases in 20 occupational categories where 14,450 union construction workers could earned the $90,970 income to afford the $561,000 lower priced first time home. They made up 46.2% of the 31,269 union construction workers. The occupations and counties in which they worked were: Electricians in Alameda, Contra Costa, Marin, Napa, San Francisco, San Mateo, Santa Clara (4,949) Plumbers, Pipefitters, and Steamfitters in Alameda, Contra Costa, San Francisco, San Mateo, Sonoma (2,647) First-Line Supervisors of Construction Trades and Extraction Workers in every county (2,085) Operating Engineers and Other Construction Equipment Operators in Alameda, Contra Costa, San Francisco, San Mateo, Solano (1,006) Drywall and Ceiling Tile Installers in Alameda, Contra Costa, San Francisco, San Mateo, Santa Clara, Sonoma (1,090) Electrical and Electronics Repairers, Commercial and Industrial Equipment in Alameda, Contra Costa (281) Heating, Air Conditioning, and Refrigeration Mechanics and Installers in Marin, Santa Clara (305) Construction and Building Inspectors in very county but Napa (684) First-Line Supervisors of Mechanics, Installers, and Repairers in every county (647) Sheet Metal Workers in Santa Clara (156) Tapers in Alameda, Contra Costa, San Francisco, San Mateo (94) Highway Maintenance Workers in San Francisco, San Mateo (31) Glaziers in San Francisco, San Mateo (77) Pile-Driver Operators in San Francisco, San Mateo (150) Septic Tank Servicers and Sewer Pipe Cleaners in San Francisco, San Mateo (30) Elevator Installers and Repairers in Alameda, Contra Costa (88) Control and Valve Installers and Repairers, Except Mechanical Door in Alameda, Contra Costa, Santa Clara (44) Insulation Workers, Floor, Ceiling, and Wall in Alameda, Contra Costa (57) Miscellaneous Construction and Related Workers in Santa Clara (5) Carpet Installers in Alameda, Contra Costa (26) Solano County: There were 130 cases in 37 occupational categories where 28,556 union construction workers could earn the $62,720 income to afford the $386,750 lower priced first time home. They were 91.3% of the 31,269 union workers. Only 2,713 union construction members 66 Chapman University
69 could not afford the county s affordable homes. By occupation and county, they worked as follows: Electricians in every county (5,586) Carpenters in every county (4,670) Plumbers, Pipefitters, and Steamfitters in every county (3,433) Construction Laborers in very county but Marin, Sonoma (2,379) First-Line Supervisors of Construction Trades and Extraction Workers in every county (2,085) Operating Engineers and Other Construction Equipment Operators in every county (1,451) Drywall and Ceiling Tile Installers in very county but Marin, Solano (1,100) Structural Iron and Steel Workers in Alameda, Contra Costa, Santa Clara, Solano (850) Cement Masons and Concrete Finishers in Alameda, Contra Costa, Santa Clara, Sonoma (698) Electrical and Electronics Repairers, Commercial and Industrial Equipment in very county but Marin, Napa (793) Painters, Construction and Maintenance in Alameda, Contra Costa, San Francisco, San Mateo, Santa Clara, Sonoma (662) Heating, Air Conditioning, and Refrigeration Mechanics and Installers in very county but Napa, Solano (674) Construction and Building Inspectors in every county (691) First-Line Supervisors of Mechanics, Installers, and Repairers in every county (647) Sheet Metal Workers in Alameda, Contra Costa, Santa Clara (428) Installation, Maintenance, and Repair Workers, All Other in Alameda, Contra Costa, Marin, San Francisco, San Mateo (287) Mobile Heavy Equipment Mechanics, Except Engines in very county but Marin (359) Tapers in Alameda, Contra Costa, San Francisco, San Mateo, Santa Clara, Sonoma (292) Helpers Installation, Maintenance, and Repair Workers in San Francisco, San Mateo (43) Highway Maintenance Workers in very county but Marin, Solano (275) Roofers in Marin, Santa Clara, Solano (105) Reinforcing Iron and Rebar Workers in Santa Clara (263) Glaziers in Napa, San Francisco, San Mateo (77) Pile-Driver Operators in Alameda, Contra Costa, San Francisco, San Mateo, Santa Clara (150) Impact of California s Housing Prices on Construction Workers 67
70 Tile and Marble Setters in Marin, San Francisco, San Mateo (47) Septic Tank Servicers and Sewer Pipe Cleaners in San Francisco, San Mateo (30) Solar Photovoltaic Installers in Sonoma (10) Elevator Installers and Repairers in Alameda, Contra Costa (88) Plasterers and Stucco Masons in Alameda, Contra Costa, Napa (81) Control and Valve Installers and Repairers, Except Mechanical Door in Alameda, Contra Costa, Santa Clara, Solano, Sonoma (65) Brickmasons and Blockmasons in Alameda, Contra Costa, Napa (63) Insulation Workers, Floor, Ceiling, and Wall in Alameda, Contra Costa (57) Pipelayers in Alameda, Contra Costa, Marin (49) Floor Layers, Except Carpet, Wood, and Hard Tiles in Alameda, Contra Costa, San Francisco, San Mateo (32) Miscellaneous Construction and Related Workers in Santa Clara (5) Carpet Installers in Alameda, Contra Costa (26) Earth Drillers, Except Oil and Gas in Alameda, Contra Costa (4) If Union Members Chose to Migrate to the Central Valley for First Time Homes: In the seven county Central Valley, there were 177 cases in 43 of the 50 occupations in which 30,787 union construction workers could afford the $40,213 income needed for the $248,028 lower priced first time home. They represented 98.5% of all such workers. Only 482 SF Bay Area union construction workers could not afford the Central Valley s affordable homes. The workers by occupation and counties in which they worked: Electricians in every county (5,586) Carpenters in every county (4,670) Plumbers, Pipefitters, and Steamfitters in every county (3,433) Construction Laborers in every county (2,631) First-Line Supervisors of Construction Trades and Extraction Workers in every county (2,085) Operating Engineers and Other Construction Equipment Operators in every county (1,451) Drywall and Ceiling Tile Installers in very county but Marin (1,117) Structural Iron and Steel Workers in Alameda, Contra Costa, Santa Clara, Solano, Sonoma (906) Cement Masons and Concrete Finishers in very county but San Francisco, San Mateo (848) 68 Chapman University
71 Electrical and Electronics Repairers, Commercial and Industrial Equipment in very county but Marin, Napa (793) Painters, Construction and Maintenance in every county (766) Heating, Air Conditioning, and Refrigeration Mechanics and Installers in very county but Napa (708) Construction and Building Inspectors in every county (691) Hazardous Materials Removal Workers in Alameda, Contra Costa, Santa Clara, Sonoma (583) First-Line Supervisors of Mechanics, Installers, and Repairers in every county (647) Sheet Metal Workers in Alameda, Contra Costa, Santa Clara (428) Installation, Maintenance, and Repair Workers, All Other in every county (517) Mobile Heavy Equipment Mechanics, Except Engines in very county but Marin (359) Tapers in Alameda, Contra Costa, San Francisco, San Mateo, Santa Clara, Sonoma (292) Helpers Installation, Maintenance, and Repair Workers in Marin, San Francisco, San Mateo, Santa Clara (118) Highway Maintenance Workers in very county but Marin, Solano (275) Roofers in very county but Sonoma (270) Reinforcing Iron and Rebar Workers in Alameda, Contra Costa, Santa Clara (263) Glaziers in Alameda, Contra Costa, Napa, San Francisco, San Mateo (154) Pile-Driver Operators in Alameda, Contra Costa, San Francisco, San Mateo, Santa Clara (150) Tile and Marble Setters in every county (119) Septic Tank Servicers and Sewer Pipe Cleaners in Alameda, Contra Costa, San Francisco, San Mateo, Sonoma (106) Solar Photovoltaic Installer in Alameda, Contra Costa, Marin, San Francisco, San Mateo, Sonoma (98) Mechanical Door Repairers in Alameda, Contra Costa, San Francisco, San Mateo (90) Elevator Installers and Repairers in Alameda, Contra Costa (88) Plasterers and Stucco Masons in Alameda, Contra Costa, Napa (81) Helpers Carpenters in Alameda, Contra Costa, San Francisco, San Mateo, Santa Clara, Sonoma (67) Control and Valve Installers and Repairers, Except Mechanical Door in Alameda, Contra Costa, Santa Clara, Solano, Sonoma (65) Impact of California s Housing Prices on Construction Workers 69
72 Brickmasons and Blockmasons in Alameda, Contra Costa, Napa (63) Insulation Workers, Floor, Ceiling, and Wall in Alameda, Contra Costa (57) Pipelayers in Alameda, Contra Costa, Marin (49) Helpers Electricians in Alameda, Contra Costa (45) Floor Layers, Except Carpet, Wood, and Hard Tiles in Alameda, Contra Costa, San Francisco, San Mateo (32) Miscellaneous Construction and Related Workers in Alameda, Contra Costa, San Francisco, San Mateo, Santa Clara (30) Carpet Installers in Alameda, Contra Costa (26) Helpers, Construction Trades, All Other in Alameda, Contra Costa (15) Fence Erectors in Alameda, Contra Costa, Santa Clara (9) Earth Drillers, Except Oil and Gas in Alameda, Contra Costa (4) Summary: Construction Workers For construction workers generally, the high median prices in the SF Bay Area have shut them out of the ability to afford homes in eight of nine county markets. The lone exception was for only supervisor and inspector positions in Solano County. For those willing to migrate to the Central Valley, about half of workers could afford median homes in that market. For more highly paid union construction workers, this continues to apply to eight of nine counties. The exception was more outlying Solano County where about onethird of union construction workers could afford the median home. If union workers are willing to migrate to the Central Valley, over 90% of SF Bay Area union workers could afford that area s median home price. If lower priced first time homes can be found, construction workers generally could still not afford prices in six of the SF Bay Area counties. About one in ten could do so in Contra Costa and Sonoma. About half could afford first time homes in Solano County. If workers are willing to migrate to the Central Valley, over 95% of combined union and non-union workers could afford that area s median home price. In the case of union workers, affordable homes in the five largest counties would still be too expensive (San Francisco, San Mateo, Marin, Santa Clara, Alameda). About one-quarter of union workers could afford a lower priced home in Napa County. About half of union workers could do so in Contra Costa and Sonoma counties. Over 90% could do so in Solano county. If union workers are willing to migrate to the Central Valley for an affordable level home, almost all of SF Bay Area union workers could afford that area s median home price. 70 Chapman University
. They also ranked third among professions in their likelihood of being commuters (93.6%).")
73 Commuting According to data from the Census Bureau s 2014 American Community Survey released in late 2015, U.S. construction workers had the longest average one-way commute time of any occupation (33.4 minutes). They also ranked third among professions in their likelihood of being commuters (93.6%). These data are relevant to California s construction workers in that the cost of housing in Southern California s coastal counties and the SF Bay Area has essentially made it impossible for them to afford homes inside those markets. Many existing workers may be homeowners or renters in these markets today. However looking ahead, those seeking to quit renting as well as new workers entering the sector will be unlikely to be able to live near their work. In the south, construction workers can only afford to buy affordable homes deep inside the Inland Empire. In the SF Bay Area, they are increasingly having to look to the Central Valley for homes. Exhibit 17. Commuting by Occupation Source: 2014 American Community Survey data compiled by Priceconomics This means that California s construction workers, whether union or nonunion, are already long distance commuters or will be in the future. Looking at five examples of the drive times from the Southern California s coastal counties to the Inland Empire shows the problem in that part of the state. In each case, the one-way commutes are measured in hours not minutes. This, despite using early morning commute times (4:00 am or 5:00 am) and 3:00 pm return times outside typical commuter hours. The cities chosen are the areas of the Inland Empire in which population growth is the strongest and where new residents are likely to work in the coastal counties. The internal commute from Hesperia to Eastvale/So. Ontario is included as it is from the fast growing and affordable High Desert to the part of the Inland Empire adjacent to Los Angeles County: 13 Beaumont (S. Bernardino) to City of Industry (Los Angeles), 61.2 miles, 80 min. at 5:00 am. City of Industry to Beaumont at 3:00 pm, 100 min. Total: 180 minutes or 3 hours Lake Elsinore (Riverside) to Irvine (Orange), 47.0 miles 70 min. at Impact of California s Housing Prices on Construction Workers 71
74 5:00 am. Irvine to Lake Elsinore at 3:00 pm, 70 min. at 3:00 pm. Total 140 min. or 2 hours, 20 min. Menifee (Riverside) to San Diego,70 min. at 4:00 am. San Diego to Menifee, 120 min. at 3:00 pm. Total: 190 min. or 3 hours 10 min. Hesperia (San Bernardino) to Eastvale/So. Ontario (Riverside), 47.3 miles, 55 min. at 5 am. Eastvale/So. Ontario to Hesperia, 75 min. at 3:00 pm. Total 165 min. or 2 hour 45 min. San Bernardino to Los Angeles, 61.3 miles, 90 min. at 5:00 am. Los Angeles to San Bernardino, 120 min. Total: 210 min. or 3 hours 30 min. Similarly, five examples of the driving times to the SF Bay Area from the Central Valley are used to show the commuting difficulty in Northern California. In each case, the one-way commutes are also measured in hours not minutes. This, despite also using early morning commute times (4:00 am or 5:00 am) and 3:00 pm return times outside typical commuting hours. The internal commute from Fairfield to San Francisco is included as that city is located in somewhat affordable Solano County: Tracy (San Joaquin) to Hayward (Alameda), 39.2 miles, 70 min. at 5:00 am. Hayward to Tracy, 75 min. at 3:00 pm. Total: 145 min. or 2 hours 25 min. Stockton (San Joaquin) to San Jose (Santa Clara), 75.6 miles, 100 min. at 4:00 am. San Jose to Stockton at 3:00 pm, 140 min. Total: 240 minutes or 4 hours. Modesto (Stanislaus) to Palo Alto (San Mateo), 91.0 miles, 140 min. at 5:00 am. Palo Alto to Modesto, 180 min. at 3:00 pm. Total: 320 min. or 5 hours 20 min. Fairfield (Solano) to San Francisco, 47.4 miles, 65 minutes at 5:00 am. San Francisco to Fairfield, 100 min. at 3:00 pm. Total: 165 min. or 2 hours 45 min. Lodi (San Joaquin) to Concord (Contra Costa), 54.0 miles, 75 min. at 5:00 am. Concord to Lodi at 75 min. at 3:00 pm. Total 150 min. or 2 hours 30 min. Long commutes take a serious toll on the health of workers: 14 Studies have shown that long commutes negatively impact our physical health in several ways, including decreased cardiorespiratory fitness, weight gain, musculoskeletal pain, higher blood sugar levels, and increased blood pressure. Studies report that mega commuters have a lower perception of their personal wellness and tend to visit their primary care physician more frequently. 72 Chapman University
75 Studies show that many mega commuters, especially men, choose their commute over sleep. In addition, daily absences from home due to long distance commuters take a toll of families. These things said, workers often value their time sitting in traffic at zero. What can be measure is the out of pocket costs of their fuel consumption and the wear and tear on their vehicles. Here, the American Automobile Association (AAA) has conducted research on driving costs for years. Their research includes the cost of driving pickup trucks: Chevrolet Silverado 1500, Ford F-150,Nissan Titan, Ram 1500 and Toyota Tundra. For 2018, they found the cost to be $0.23 per mile for fuel and maintenance for driving over 20,000 miles a year, plus $0.18 per mile for depreciation, a total of $0.41 per mile: 15 Doubling the one-way miles shown in the ten examples above yields the daily round trip mileage for each trip. Using the $0.41 per mile cost for pickup trucks from AAA gives the cost of driving per day. Assuming driving occurs for five days a week, 50 weeks a year, the annual cost would be based upon 250 days. The results show the least expensive drive in the SF Bay Area region would be from Tracy to Hayward at $8,036; the most expensive from Modesto to Palo Alto at $18,655 per year. In Southern California, the least expensive drive would be from Lake Elsinore to Irvine at $9,635; the most expensive would be from Menifee to San Diego at $14,350. These are conservative estimates in that the miles per gallon would likely be lower as most commuting is in heavy traffic. Importantly, despite the environmental impact of longer, slower commutes, no cost of that impact is included in the analysis. To put these commuting costs into perspective, the annual weight median Exhibit 18. Operations & Ware & Tear Cost of Commuting by Pick-up Truck, 2018 Impact of California s Housing Prices on Construction Workers 73
76 pay across all occupations for construction workers was $65,448 in 2018 for the SF Bay Area and $54,116 in Southern California. If the commuting costs are deducted from these amounts it lowers the net pay to between $39,766 for the Menifee to San Diego commute to $57,412 for Tracy to Hayward. The share of income lost to commuting varies from 12.3% for Tracy to Hayward to 28.5% from Modesto to Palo Alto (Exhibit 19). The annual weight median pay across all occupations for union construction workers was $89,015 in the SF Bay Area and $73,259 in Southern California. If the commuting costs are deducted from these amounts it lowers the net pay to between $58,909 for the Menifee to San Diego commute to $80,979 for Tracy to Hayward. The share of income lost to commuting varies from 9.0% for Tracy to Hayward to 21.0% from Modesto to Palo Alto (Exhibit 19). Exhibit 19. Net Construction Earnings After Commuting Cost, All Workers Source: Economics & Politics, Inc. Summary: Commuting Costs If the housing shortage will cause housing prices continue to remain at their very high prices or continue rising in the SF Bay Area and the coastal counties of Southern California, it will have a detrimental impact on the lives of all construction workers as well as those in construction unions. Commuting will impact their health and lifestyles. The cost of driving will significantly lower their net incomes. 74 Chapman University
77 Exhibit 20. Net Construction Earnings After Commuting Cost, Union Workers Source: Economics & Politics, Inc. Note: The lowering of incomes due to commutes was not included in determining the ability of construction workers to afford homes. It was a consequence of them being forced to migrate inland if they wanted to buy homes or rent given the circumstances in nearby coastal areas. Summary In this report, a very detailed look was taken at the ability of construction workers, in 50 occupational specialties, whether unionized or not, to buy median priced or low priced first time homes in the markets where they work. It found very few cases in which they could afford to do so. They are caught in this situation because of extremely high housing prices in each of Southern California s three main coastal county markets and in each of the SF Bay Area s nine counties. This situation has been created by a shortage of new housing units that has often resulted from the residential market s reaction to state laws and policies. For the vast majority of construction workers looking to buy or rent dwelling units, their only options are to try and find first time lower priced affordable homes in often distant outlying markets such as the Inland Empire and the Central Valley. As a result, these workers already face, or will increasingly find themselves facing very long, time consuming and expensive commutes with the resulting wear and tear on their vehicles, themselves and the environment. The cost of commuting will also seriously reduce their disposable incomes. The only exceptions are those who already own homes or have long term apartment leases. Impact of California s Housing Prices on Construction Workers 75
78 ENDNOTES Progress Report, California s Sustainable Communities and Climate Protection Act, California Air Quality Resources Board (CARB), p Progress Report, CARB, p CA Association of Realtors Affordability Index (see page 2 discussion) 4 These data were from DataQuick which obtains its pricing information from county recorders offices. 5 The pay information on workers was derived from the CA Employment Development Department s (EDD) publication of pay scales by occupation, by market for The income requirements were taken from CA Association of Realtors data on income requirements. 7 Some families have a second working parent often in a lower wage sector. Making allowance for this would raise serious child care issues. According to the National Association of Child Care Resource & Referral Agencies, California s 2018 child care costs in at a licensed child care center were $16,542 (infant), $11,202 (4-year old), $3,736 (in school). For licensed family care homes, they were respectively $10,609; $9,984 and $3, Sacramento omitted as a special case since it is the state capitol Progress Report, CARB 10 The lowering of incomes due to commutes was not included in determining the ability of construction workers to afford homes. It was a consequence of them being forced to migrate inland if they wanted to buy homes or rent given the circumstances in nearby coastal areas. 11 Union Membership, Coverage, Density and Employment by Combined Statistical Area (CSA) and MSA, 2017, 2018 by Barry T. Hirsch and David A. Macpherson, UnionStats.com. 12 Union Membership, Coverage, Density and Employment by Combined Statistical Area (CSA) and MSA, 2017, 2018 by Barry T. Hirsch and David A. Macpherson, UnionStats.com 13 Times and distances from Google Maps 14 Are Mega Commutes Leading to More Stress Among Your Employees, Canopy Health, January 11, How Much Are You Really Paying to Drive?, American Automobile Association, Chapman University
79

80
California Economic Policy: Lawns and Water Demand in California
 California Economic Policy: Lawns and Water Demand in California Data Box and Appendix Ellen Hanak Matt Davis July 2006 Data Box: Using County Assessor Data to Measure Trends in Single Family Lot Sizes
INLAND EMPIRE REGIONAL INTELLIGENCE REPORT. School of Business. April 2018
 INLAND EMPIRE REGIONAL INTELLIGENCE REPORT April 2018 Key economic indicators suggest that the Inland Empire s economy will continue to expand throughout the rest of 2018, building upon its recent growth.
$ FACTS ABOUT CALIFORNIA: WAGE HOUSING MOST EXPENSIVE AREAS WAGE RANKING
 STATE #3 * RANKING In California, the Fair Market Rent () for a two-bedroom apartment is $1,699. In order this level of and utilities without paying more than 30% of income on housing a household must
QUARTERLY ECONOMIC REPORT. July 2018 QUARTERLY ECONOMIC REPORT 1 INLAND EMPIRE. In July 2018, there is a great deal of change in the forces impacting
 INLAND EMPIRE QUARTERLY ECONOMIC REPORT RIVERSIDE & SAN BERNARDINO COUNTIES, CALIFORNIA VOL. 30 NO. 3 JULY 2018 $5.00 INLAND EMPIRE QUARTERLY ECONOMIC REPORT MID-YEAR LOOK AT INLAND EMPIRE ECONOMIC DRIVERS
INVESTORS PURCHASE RECORD NUMBER OF FORECLOSURES AT AUCTION
 INVESTORS PURCHASE RECORD NUMBER OF FORECLOSURES AT AUCTION April Foreclosure Notices Drop from March Record Levels Discovery Bay, CA, May 12, 2009 ForeclosureRadar (www.foreclosureradar.com), the only
CALIFORNIA FORECLOSURE ACTIVITY MIXED
 CALIFORNIA FORECLOSURE ACTIVITY MIXED Foreclosure delays may be behind current peak in foreclosure activity Discovery Bay, CA, September 16, 2008 ForeclosureRadar (www.foreclosureradar.com), the only website
INLAND EMPIRE REGIONAL INTELLIGENCE REPORT
 INLAND EMPIRE REGIONAL INTELLIGENCE REPORT June 2016 EMPLOYMENT After a slow start to 2016, the Inland Empire s labor market returned to form, in recent job figures. Seasonally adjusted nonfarm employment
OVERVIEW OF RECENT/EXPECTED ECONOMIC/ HOUSING MARKET CONDITIONS
 OVERVIEW OF RECENT/EXPECTED ECONOMIC/ HOUSING MARKET CONDITIONS STRONG ECONOMIC FUNDAMENTALS *BUT* EXTRAORDINARY SHORT-TERM FACTORS RESULTING IN MAJOR SHIFTS IN TYPES OF HOUSING PRODUCTS AND GEOGRAPHICAL
Housing Affordability in California
 Housing Affordability in California Households with a High Housing Cost Burden: 2013 Definition: Estimated percentage of households that spend 30% or more of household income on housing costs. The U.S.
San Francisco Bay Area to Santa Clara and San Benito Counties Housing and Economic Outlook
 San Francisco Bay Area to 2020 Santa Clara and San Benito Counties Housing and Economic Outlook Economic Forecast Summary 2017 Presented by Pacific Union International, Inc. and John Burns Real Estate
LAS COLINAS 96.8 ACRES RESIDENTIAL LAND AVAILABLE FOR SALE
 STATE STREET RAMONA EXPRESSWAY LAS COLINAS 96.8 ACRES RESIDENTIAL LAND AVAILABLE FOR SALE LAS COLINAS 1. EXECUTIVE SUMMARY 2. PROPERTY INFORMATION TABLE OF CONTENTS 3. LOCATION INFORMATION 4. CONTACT INFORMATION
San Francisco Bay Area to Marin, San Francisco, and San Mateo Counties Housing and Economic Outlook
 San Francisco Bay Area to 2020 Marin, San Francisco, and San Mateo Counties Housing and Economic Outlook Economic Forecast Summary 2017 Presented by Pacific Union International, Inc. and John Burns Real
2008 Midyear Housing Forecast
 2008 Midyear Housing Forecast June 25, 2008 By Alan N. Nevin Chief Economist California Building Industry Association Executive Summary: Housing Production Falling Short of Earlier Forecasts Due to the
VALLE RESEDA 216 ACRES RESIDENTIAL LAND AVAILABLE FOR SALE
 N. SANDERSON AVENUE RAMONA EXPRESSWAY N. RAMONA BOULEVARD VALLE RESEDA 216 ACRES RESIDENTIAL LAND AVAILABLE FOR SALE 1. EXECUTIVE SUMMARY 2. PROPERTY INFORMATION TABLE OF CONTENTS 3. LOCATION INFORMATION
REGIONAL. Rental Housing in San Joaquin County
 Lodi 12 EBERHARDT SCHOOL OF BUSINESS Business Forecasting Center in partnership with San Joaquin Council of Governments 99 26 5 205 Tracy 4 Lathrop Stockton 120 Manteca Ripon Escalon REGIONAL analyst april
San Francisco Bay Area to Marin, San Francisco, and San Mateo Counties Housing and Economic Outlook
 San Francisco Bay Area to 019 Marin, San Francisco, and San Mateo Counties Housing and Economic Outlook Bay Area Economic Forecast Summary Presented by Pacific Union International, Inc. and John Burns
2019 Housing Market Forecast. Palos Verdes Peninsula AOR January 8, 2019 Jordan G. Levine Senior Economist
 2019 Housing Market Forecast Palos Verdes Peninsula AOR January 8, 2019 Jordan G. Levine Senior Economist Overview Good News: Economic fundamentals solid Homeownership still the dream Rates might not go
San Francisco Bay Area to Alameda and Contra Costa Counties Housing and Economic Outlook
 San Francisco Bay Area to 2020 Alameda and Contra Costa Counties Housing and Economic Outlook Economic Forecast Summary 2017 Presented by Pacific Union International, Inc. and John Burns Real Estate Consulting,
2016 ECONOMIC AND HOUSING MARKET FORECAST
 2016 ECONOMIC AND HOUSING MARKET FORECAST April 06, 2016 San Francisco Association of REALTORS Oscar Wei, Senior Economist of C.A.R. OVERVIEW Economic Outlook California Housing Market Outlook Regional
COLINAS DEL ORO ACRES MIXED-USE LAND AVAILABLE FOR SALE
 125.86 ACRES MIXED-USE LAND AVAILABLE FOR SALE 1. EXECUTIVE SUMMARY 2. PROPERTY INFORMATION TABLE OF CONTENTS 3. LOCATION INFORMATION 4. CONTACT INFORMATION 1EXECUTIVE SUMMARY 2 HIGHWAY 74 PERRIS CALIFORNIA
INDUSTRIAL QUICK STATS SUMMARY & OUTLOOK MARKET TRENDS VACANCY & NET ABSORPTION ECONOMIC STATS
 INLAND EMPIRE INDUSTRIAL FOURTH QUARTER 217 QUICK STATS Direct Vacancy 5.1% Overall Vacancy 5.3% Lease Rate NNN $.57 Gross Absorption Under Construction MARKET TRENDS Current Quarter 9,23,744 SF 16,31,563
4. HOUSEHOLD INCOME AND AFFORDABILITY
 4. HOUSEHOLD INCOME AND AFFORDABILITY The analysis of the Household and Affordability section relied primarily on data from the State Department of Housing and Community Development (HCD), California Tax
Legal Update for Public Works Officers League of California Cities
 Legal Update for Public Works Officers League of California Cities Presented by: Deborah Wilder, President Contractor Compliance and Monitoring, Inc. 635 Mariners Island Blvd, Suite 200 San Mateo, CA 94404
April 27, RE: CAO Proposal to Double the Documentary Transfer Tax (CF No )
") April 27, 2012 Honorable Councilmember Paul Krekorian, Chair, City Council Budget & Finance Committee Honorable Councilmember Tony Cárdenas Honorable Councilmember Mitchell Englander Honorable Councilmember
April 27, 2012 Honorable Councilmember Paul Krekorian, Chair, City Council Budget & Finance Committee Honorable Councilmember Tony Cárdenas Honorable Councilmember Mitchell Englander Honorable Councilmember
ECONOMIC REPORT. In 2011, the Inland Empire finally moved into growth mode adding INLAND EMPIRE QUARTERLY
 INLAND EMPIRE QUARTERLY ECONOMIC REPORT R I V E R S I D E & S A N B E R N A R D I N O C O U N T I E S, C A L I F O R N I A VOL. 24 NO. 1 JANUARY 2012 $5.00 What Is The Likely Future for the Inland Empire
Industrial Real Estate Portfolio
 Industrial Real Estate Portfolio Portfolio Coverage Page 7 6565 Echo Avenue, Reno, NV Property Summary Address: Size (SF): Office Finish: HVAC Space: Year Built: 2003 Site Area: 6565 Echo Avenue Reno,
Economic and Housing Market Outlook ( ) October 31, Contra Costa AOR
 October 31, Contra Costa AOR") Economic and Housing Market Outlook (2012 2013) Contra Costa AOR October 31, 2012 Oscar Wei Senior Research Analyst California Association of REALTORS Overview US and California Economies California Housing
Economic and Housing Market Outlook (2012 2013) Contra Costa AOR October 31, 2012 Oscar Wei Senior Research Analyst California Association of REALTORS Overview US and California Economies California Housing
Oakland Chamber of Commerce 2015 Economic Development Summit The Oakland Advantage. Garrick Brown. Commercial Market Overview
 Oakland Chamber of Commerce 2015 Economic Development Summit The Oakland Advantage Garrick Brown Commercial Market Overview Oakland Convention Center Oakland, CA March 20, 2015 Vice President, Research
Orange County AOR October 21, 2016 Leslie Appleton-Young Chief Economist & Vice President
 Orange County AOR October 21, 2016 Leslie Appleton-Young Chief Economist & Vice President lesliea@car.org Cadence of Accountability How did I do with last year s forecast? 2016 Story US economic and job
San Francisco Bay Area to Sonoma County Housing and Economic Outlook
 San Francisco Bay Area to 2020 Sonoma County Housing and Economic Outlook Economic Forecast Summary 2017 Presented by Pacific Union International, Inc. and John Burns Real Estate Consulting, LLC On Nov.
2018 Housing Market Outlook. Central Coast Realty Group Business Symposium February 22, 2018 Oscar Wei Senior Economist
 2018 Housing Market Outlook Central Coast Realty Group Business Symposium February 22, 2018 Oscar Wei Senior Economist Overview Economic Update California Housing Market Outlook Regional Housing Market
CBRE Houston ViewPoint
 CBRE Houston ViewPoint DOWNTOWN HOUSTON: THE NEW GATEWAY MARKET? by Sara R. Rutledge Director, Research and Analysis INTRODUCTION Investor interest from both domestic and foreign sources has revived in
Davis-Bacon Wage Survey
 Davis-Bacon Wage Survey Survey Data Sources- Wage and Fringe Benefit Data Surveys conducted by 5 Regional Offices Wage & fringe benefit data from construction contractors and other interested parties on
San Francisco Bay Area to Napa County Housing and Economic Outlook
 San Francisco Bay Area to 019 Napa County Housing and Economic Outlook Bay Area Economic Forecast Summary Presented by Pacific Union International, Inc. and John Burns Real Estate Consulting, LLC On Nov.
Briefing Book. State of the Housing Market Update San Francisco Mayor s Office of Housing and Community Development
 Briefing Book State of the Housing Market Update 2014 San Francisco Mayor s Office of Housing and Community Development August 2014 Table of Contents Project Background 2 Household Income Background and
Southern California Appraisal Institute Market Trends Seminar
 Southern California Appraisal Institute Market Trends Seminar February 1, 2018 1 #1 residential data provider Largest US geographic footprint including 890 CBSAs 2,483 Counties Metrostudy survey markets
MARKET WATCH SOUTHERN CALIFORNIA & PHOENIX
 SOUTHERN CALIFORNIA & PHOENIX COMMERCIAL REAL ESTATE MARKET FOURTH QUARTER 217 MARKET WATCH SOUTHERN CALIFORNIA & PHOENIX 1.888.659.DAUM WWW.DAUMCOMMERCIAL.COM D/AQ Corp. # 1129558 DAUM TABLE OF CONTENTS
Real gross domestic product California vs. United States
 Real gross domestic product California vs. United States Percent change, year ago 6 4 U.S. California 2 0-2 -4-6 2001 2002 2003 2004 2005 2006 2007 2008 2009 2010 2011 Source: Bureau of Economic Analysis.
2013 San Diego Economic Outlook. 29 th Annual Economic Roundtable Marney Cox Chief Economist San Diego Association of Governments January 25, 2013
 213 San Diego Economic Outlook 29 th Annual Economic Roundtable Marney Cox Chief Economist San Diego Association of Governments January 25, 213 US The Problem Slow Economic Growth Gross Domestic Product
San Francisco Bay Area to Santa Clara & San Benito Counties Housing and Economic Outlook
 San Francisco Bay Area to 019 Santa Clara & San Benito Counties Housing and Economic Outlook Bay Area Economic Forecast Summary Presented by Pacific Union International, Inc. and John Burns Real Estate
INDUSTRIAL QUICK STATS SUMMARY & OUTLOOK MARKET TRENDS VACANCY & NET ABSORPTION ECONOMIC STATS. Current Quarter. Direct Vacancy 2.
 ORANGE COUNTY INDUSTRIAL SECOND QUARTER 218 QUICK STATS Direct Vacancy 2.2% Overall Vacancy 2.5% Lease Rate NNN $.95 Gross Absorption Under Construction MARKET TRENDS Current Quarter 2,956,71 SF 1,367,18
Buckner Park. AVAILABLE FOR Lease. Industrial Buildings - Office & Warehouse Space. 4,670± SF to 31,834± SF (max contiguous available)
") Industrial Buildings - Office & Warehouse Space 4377 & 4381 N. Brawley Avenue - Fresno, California Buckner Park PropertY information 4,670± SF to 31,834± SF (max contiguous available) 24,345± SF available
Industrial Buildings - Office & Warehouse Space 4377 & 4381 N. Brawley Avenue - Fresno, California Buckner Park PropertY information 4,670± SF to 31,834± SF (max contiguous available) 24,345± SF available
Voluntary or Mandatory Inclusionary Housing? Production, Predictability, and Enforcement
 Voluntary or Mandatory Inclusionary Housing? Production, Predictability, and Enforcement November 2003 Business and Professional People for the Public Interest 25 E. Washington, Suite 1515 Chicago, IL
Santa Cruz County AOR Seascape Golf Club October 7, 2016 Leslie Appleton-Young Chief Economist & Vice President
 Santa Cruz County AOR Seascape Golf Club October 7, 2016 Leslie Appleton-Young Chief Economist & Vice President 12 Free Hours of Online CE Courses! 2016 C.A.R. Member Benefit Delivered 580,000+ Hours Take
$3,575,000 UNIQUE PURCHASE OPPORTUNITY 1407 TRUMAN STREET SAN FERNANDO, CA
 UNIQUE PURCHASE OPPORTUNITY NEWER CONSTRUCTION HIGH IMAGE CLASS A COLD STORAGE IN-FILL LOCATION IN SAN FERNANDO VALLEY, CA $3,575,000 TRUMAN STREET WORKMAN STREET 16,971 Square Feet Class A Building Strategic
AVAILABLE FOR LEASE Industrial Buildings - Office & Warehouse Space
 Industrial Buildings - Office & Warehouse Space Buckner Park 4,670± SF to 25,521± SF (max contiguous available) 36,000± SF available with additional development as indicated on the south side of business
OFFICE QUICK STATS SUMMARY & OUTLOOK MARKET TRENDS VACANCY & NET ABSORPTION ECONOMIC STATS
 INLAND EMPIRE OFFICE THIRD QUARTER 217 QUICK STATS Direct Vacancy 11.4% Overall Vacancy 11.7% Lease Rate FSG $1.83 Gross Absorption Under Construction MARKET TRENDS Current Quarter 529,634 SF 45,24 SF
AVAILABLE FOR LEASE Industrial Buildings - Office & Warehouse Space
 Industrial Buildings - Office & Warehouse Space Buckner Park 4,670± SF to 38,350± SF (max contiguous available) 24,345± SF available with additional development as indicated on the south side of business
INDUSTRIAL QUICK STATS SUMMARY & OUTLOOK MARKET TRENDS VACANCY & NET ABSORPTION ECONOMIC STATS
 ORANGE COUNTY INDUSTRIAL FOURTH QUARTER 217 QUICK STATS Direct Vacancy 2.3% Overall Vacancy 2.7% Lease Rate NNN $.91 Gross Absorption Under Construction MARKET TRENDS Current Quarter 4,283,991 SF 963,138
INDUSTRIAL QUICK STATS SUMMARY & OUTLOOK MARKET TRENDS VACANCY & NET ABSORPTION ECONOMIC STATS. Current Quarter. Direct Vacancy 2.
 LOS ANGELES NORTH INDUSTRIAL THIRD QUARTER 218 QUICK STATS Direct Vacancy 2.3% Overall Vacancy 2.6% Lease Rate NNN $1.1 Gross Absorption Under Construction MARKET TRENDS Current Quarter 1,632,564 SF 595,199
Rapid recovery from the Great Recession, buoyed
 Game of Homes The Supply-Demand Struggle Laila Assanie, Sarah Greer, and Luis B. Torres October 4, 2016 Publication 2143 Rapid recovery from the Great Recession, buoyed by the shale oil boom, has fueled
Research in Brief. August Rent Control Changes in California Posing Significant Uncertainty. ARA Research and Strategy. Research in Brief 1
 ARA Research and Strategy Research in Brief Authored By: Stanley L. Iezman Chairman & CEO siezman@aracapital.com Christopher Macke Managing Director, Research & Strategy cmacke@aracapital.com Maximilian
Contra Costa AOR October 26, 2016 Leslie Appleton-Young Chief Economist & Vice President
 Contra Costa AOR October 26, 2016 Leslie Appleton-Young Chief Economist & Vice President lesliea@car.org Cadence of Accountability How did I do with last year s forecast? 2016 Story US economic and job
NEW CLASS A INDUSTRIAL MANUFACTURING CAMPUS
 Placentia Ave W Placentia Ave 215 NEW CLASS A E Rider St N Perris Blvd W Rider St PERRIS COMMERCE CENTER FOR SALE OR LEASE NEW +/- 7,755 SQ. FT. BUILDING DON ARCHER VICE PRESIDENT 909 243 7600 TEL 714
Addressing the Impact of Housing for Virginia s Economy
 Addressing the Impact of Housing for Virginia s Economy A REPORT FOR VIRGINIA S HOUSING POLICY ADVISORY COUNCIL NOVEMBER 2017 Appendix Report 2: Housing the Commonwealth's Future Workforce 2014-2024 Jeannette
8023 Alhambra AVE South gate, CA
 8023 Alhambra AVE South gate, CA O F F E R I N G M E M O R A N D U M 2MATTHEWS REAL ESTATE INVESTMENT SERVICES 2 APARTMENT NAME CONTENTS 04 PROPERTY OVERVIEW 06 AREA OVERVIEW 10 FINANCIAL OVERVIEW 12 RENT
100% LEASED INDUSTRIAL BUILDING TOTALING 181,486 SF S. RIVERSIDE DR. MODESTO, CA
 100% LEASED INDUSTRIAL BUILDING TOTALING 181,486 SF 107 S. RIVERSIDE DR. MODESTO, CA EXECUTIVE SUMMARY Newmark Knight Frank is pleased to present the opportunity to purchase a 100% leased industrial building
CALIFORNIA ECONOMIC & MARKET OUTLOOK. October 29,2014 SILVAR Leslie Appleton-Young, Chief Economist
 2014-2015 CALIFORNIA ECONOMIC & MARKET OUTLOOK October 29,2014 SILVAR Leslie Appleton-Young, Chief Economist OVERVIEW Economic Outlook California Housing Market Outlook Housing Affordability Regional Market
November 1, 2016 Sacramento AOR Membership Meeting Oscar Wei, Senior Economist of C.A.R.
 November 1, 2016 Sacramento AOR Membership Meeting Oscar Wei, Senior Economist of C.A.R. Overview Economic Outlook California Housing Market Outlook Regional Housing Market Outlook 2017 Forecast Economic
BuildZoom & Urban Economics Lab Index. Quarterly Report: 2015 Q1
 BuildZoom & Urban Economics Lab Index Quarterly Report: 2015 Q1 BuildZoom & Urban Economics Lab Index: First Quarter 2015 Remodeling of existing homes is an indicator of economic health whose importance
Northern California. Industry Intelligence Report. Table of Contents. Powered by Beacon Economics. Apartment Trends. The Economy.
 Northern California Industry Intelligence Report Powered by Table of Contents The Economy Apartment Trends The Industry Northern California Renters The Legislative Housing Package Region in Focus: San
OFFICE QUICK STATS SUMMARY & OUTLOOK MARKET TRENDS VACANCY & NET ABSORPTION ECONOMIC STATS
 LOS ANGELES CENTAL/SOUTHEAST OFFICE THIRD QUARTER 218 QUICK STATS Direct Vacancy 14.7% Overall Vacancy 15.2% Lease Rate FSG $3.16 Gross Absorption Under Construction MARKET TRENDS Change from Last Quarter
FOR SALE FLOYD S STORES, INC.
 FOR SALE FLOYD S STORES, INC. RETAIL LOCATIONS: 3650 Chester Ave, Bakersfield, CA 2020 S Chester Ave, Bakersfield, CA 555 Walker St, Shafter, CA REAL ESTATE TO BE SOLD SEPARATELY B R A U N W O R L D B
6200 & 6240 BOX SPRINGS BLVD. RIVERSIDE, CA
 6200 & 6240 BOX SPRINGS BLVD. RIVERSIDE, CA HIGH IMAGE MULTI-TENANT INDUSTRIAL PARK 100% LEASED INDUSTRIAL INVESTMENT BUILDINGS TOTALING ±35,000 SQ.FT Multi-Tenant LOCATION OVERVIEW RIVERSIDE COUNTY RIVERISDE
Appraisers and Assessors of Real Estate
 http://www.bls.gov/oco/ocos300.htm Appraisers and Assessors of Real Estate * Nature of the Work * Training, Other Qualifications, and Advancement * Employment * Job Outlook * Projections Data * Earnings
APARTMENT MARKET SUPPLY AND DEMAND DATA. Prepared March 2012 PAGE 1
 APARTMENT MARKET SUPPLY AND DEMAND DATA Prepared March 2012 PAGE 1 SUMMARY OF MARKET CONDITIONS Inventory According to the 4 th quarter 2011 MFP report on the San Jose metro apartment market, the inventory
GREG BEDELL, CCIM Vice President, Investment Sales. CHRIS LINDHOLM Investment Sales & Land Specialist
 PRESENTED BY CHRIS LINDHOLM Investment Sales & Land Specialist T 909.230.4500 C 951.965.9021 chris@progressiverep.com CalDRE #02047355 GREG BEDELL, CCIM Vice President, Investment Sales T 909.230.4500
MSA OFFERING MEMORANDUM EQUITY INVESTMENT DVISORS. 401 East Arrow Highway, Glendora, CA 91740
 los angeles MSA 401 East Arrow Highway, Glendora, CA 91740 OFFERING MEMORANDUM Rich Lydon Managing Director 310.584.4540 rlydon@eiadv.com CA Lic. 01466991 EQUITY INVESTMENT DVISORS 201 Santa Monica Blvd.
1636 NORTH VENTURA AVENUE
 1636 NORTH VENTURA AVENUE VENTURA, CA 93001 OFFERING MEMORANDUM N O N - E N D O R S E M E N T A N D D I S C L A I M E R N O T I C E Non-Endorsements Marcus & Millichap is not affiliated with, sponsored
OFFICE QUICK STATS SUMMARY & OUTLOOK MARKET TRENDS VACANCY & NET ABSORPTION ECONOMIC STATS
 LOS ANGELES SAN GABRIEL VALLEY OFFICE SECOND QUARTER 218 QUICK STATS Direct Vacancy 11.1% Overall Vacancy 11.4% Lease Rate FSG $2.32 Gross Absorption Under Construction MARKET TRENDS Current Quarter 345,68
REALTOR.COM MARKET OUTLOOK
 REALTOR.COM MARKET OUTLOOK Realtor.com Economics May 2018 MOST COMPETITIVE SEASON ON RECORD Key expectations from realtor.com Existing Home Sales Struggle to Break Out Supply: Inventory, Prices, Affordability
>> Greater Los Angeles Retail Ends 2016 With Mixed Results
 Research & Forecast Report GREATER LOS ANGELES RETAIL Q4 2016 Accelerating success. >> Greater Los Angeles Retail Ends 2016 With Mixed Results Greater Los Angeles Retail Market The Los Angeles Basin retail
INDUSTRIAL QUICK STATS SUMMARY & OUTLOOK MARKET TRENDS VACANCY & NET ABSORPTION ECONOMIC STATS
 PHOENIX, ARIZONA INDUSTRIAL THIRD QUARTER 217 QUICK STATS Direct Vacancy 8.7% Overall Vacancy 9.% Lease Rate NNN $.54 Gross Absorption Under Construction MARKET TRENDS Current Quarter 5,991,128 SF 4,751,494
Industrial Market Review
 Q1 2012 industrial Stockton San JoAquin County, California research & forecast Report Industrial Market Review Momentum built-up from 2011 carried the industrial market into its fifth consecutive quarter
OFFICE QUICK STATS SUMMARY & OUTLOOK MARKET TRENDS VACANCY & NET ABSORPTION ECONOMIC STATS
 LOS ANGELES NORTH OFFICE FOURTH QUARTER 217 QUICK STATS Direct Vacancy 11.8% Overall Vacancy 12.5% Lease Rate FSG $2.75 Gross Absorption Under Construction MARKET TRENDS Current Quarter 1,6,941 SF 89,158
JOBS HOUSING NEXUS ANALYSIS
 APPENDIX E EXECUTIVE SUMMARY JOBS HOUSING NEXUS ANALYSIS Jobs Housing Nexus Analysis Report Prepared for the City of San Mateo Prepared by Kayesr Marston Associates, Inc. February 2003 EXECUTIVE SUMMARY
The New Housing Market and its Effect on Infrastructure Financing Capacity
 The New Housing Market and its Effect on Infrastructure Financing Capacity Economic & Planning Systems, Inc. NIFR 2009 November 6, 2009 1 Presentation Overview Housing Market Trends New Home Pricing Trends
Los Angeles Basin Retail Market Continues To Witness Decreasing Vacancy Rates
 RETAIL GREATER LOS ANGELES BASIN MARKET REPORT Continues To Witness Decreasing Vacancy Rates MARKET INDICATORS - VACANCY 6. NET ABSORPTION 588,800 CONSTRUCTION 3,312,470 RENTAL RATE $2.04 P NNN UNEMPLOYMENT
INDUSTRIAL QUICK STATS SUMMARY & OUTLOOK MARKET TRENDS VACANCY & NET ABSORPTION ECONOMIC STATS
 VENTURA COUNTY INDUSTRIAL FOURTH QUARTER 217 QUICK STATS Direct Vacancy 2.1% Overall Vacancy 2.4% Lease Rate NNN $.7 Gross Absorption Under Construction MARKET TRENDS Current Quarter 1,332,957 SF 774,362
100 Hegenberger Road Oakland, CA
 Owner User / Investment Opportunity 100 Hegenberger Road Oakland, CA Oakland Coliseum-Airport Investment Contacts: John Dolby Executive Director +1 510 267 6027 john.dolby@cushwake.com LIC #00670630 Dane
San Diego County Vol. XX, Issue I Rental Trends Executive Summary March 2007
 Real Estate Research and Consulting for over 25 years Vol. XX, Issue I Rental Trends Executive Summary Editor: Robert D. Martinez- Director of Research s institutional grade rental complexes experienced
SPON'S 2011 PRICE BOOKS UPDATE NR. 2. Editors. Publishers. INCORPORATING CHANGES UP TO 28 th FEBRUARY 2011
 Editors Davis Langdon, An AECOM Company MidCity Place 71 High Holborn London WC1V 6QS Tel: +44 (0) 20 7061 7000 Fax:+44 (0) 870 048 0789 e-mail: spons@davislangdon.com www.davislangdon.com www.aecom.com
The Impact of Market Rate Vacancy Increases Eleven-Year Report
 The Impact of Market Rate Vacancy Increases Eleven-Year Report January 1, 1999 - December 31, 2009 Santa Monica Rent Control Board April 2010 TABLE OF CONTENTS Summary 1 Vacancy Decontrol s Effects on
METROPOLITAN COUNCIL S FORECASTS METHODOLOGY JUNE 14, 2017
 METROPOLITAN COUNCIL S FORECASTS METHODOLOGY JUNE 14, 2017 Metropolitan Council s Forecasts Methodology Long-range forecasts at Metropolitan Council are updated at least once per decade. Population, households
1636 NORTH VENTURA AVENUE
 1636 NORTH VENTURA AVENUE VENTURA, CA 93001 OFFERING MEMORANDUM N O N - E N D O R S E M E N T A N D D I S C L A I M E R N O T I C E Non-Endorsements Marcus & Millichap is not affiliated with, sponsored
Inland Empire real estate trends: Interest rates likely to rise as pr...
 Comments 1 Recommend 0 Inland Empire real estate trends: Interest rates likely to rise as prices fall Download story podcast 08:16 PM PDT on Saturday, August 30, 2008 By LESLIE BERKMAN The Press-Enterprise
The Math Behind Development: Making Housing Work in the South Bay. October 11, 2018
 The Math Behind Development: Making Housing Work in the South Bay October 11, 2018 Today s Panelists Dan Baker Senior Vice President NorthMarq Capital David Garcia Policy Director UC Berkeley Terner Center
OFFICE QUICK STATS SUMMARY & OUTLOOK MARKET TRENDS VACANCY & NET ABSORPTION ECONOMIC STATS
 VENTURA COUNTY OFFICE THIRD QUARTER 217 QUICK STATS Direct Vacancy 13.9% Overall Vacancy 14.3% Lease Rate FSG $2.25 Gross Absorption Under Construction MARKET TRENDS Current Quarter 34,43 SF 18,112 SF
AFFORDABLE HOUSING 101 SUBSIDIZED HOUSING DEVELOPMENT AND FINANCING OVERVIEW. September 18, 2017 Housing Subcommittee
 1 AFFORDABLE HOUSING 101 SUBSIDIZED HOUSING DEVELOPMENT AND FINANCING OVERVIEW September 18, 2017 Housing Subcommittee Developing Subsidized Housing 2 The process and requirements of developing subsidized
The supply of single-family homes for sale remains
 Oh Give Me a (Single-Family Rental) Home Harold D. Hunt and Clare Losey December, 18 Publication 2218 The supply of single-family homes for sale remains tight in many markets across the United States.
Has The Office Market Reached A Peak? Vacancy. Rental Rate. Net Absorption. Construction. *Projected $3.65 $3.50 $3.35 $3.20 $3.05 $2.90 $2.
 Research & Forecast Report OAKLAND METROPOLITAN AREA OFFICE Q1 Has The Office Market Reached A Peak? > > Vacancy remained low at 5. > > Net Absorption was positive 8,399 in the first quarter > > Gross
Realty Executives Santa Clarita November 17, 2016 Leslie Appleton-Young Chief Economist & Vice President
 Realty Executives Santa Clarita November 17, 2016 Leslie Appleton-Young Chief Economist & Vice President lesliea@car.org Nobody had it priced in and the uncertainty Is absolutely enormous Every Wall Street
City and County of San Francisco
 City and County of San Francisco Office of the Controller - Office of Economic Analysis Residential Rent Ordinances: Economic Report File Nos. 090278 and 090279 May 18, 2009 City and County of San Francisco
Economy White Paper Series. California s Housing Crisis: Goals and Production in Southern California
 Economy White Paper Series California s Housing Crisis: Goals and Production in Southern California April 2019 Introduction Key Findings & Recommendations California is in the midst of a major housing
MEMORANDUM. Current Development Fees
 MEMORANDUM To: Edmund Sullivan, Santa Clara Valley Habitat Agency From: Robert D. Spencer, Urban Economics Date: February 28, 2018 Subject: FY 2018-19 Habitat Agency Development s Automatic Inflation Adjustment
4.13 Population and Housing
 Environmental Impact Analysis Population and Housing 4.13 Population and Housing 4.13.1 Setting This section evaluates the impacts to the regional housing supply and population growth associated with implementation
Santa Clara County Real Estate Market Overview Dynamics
 Santa Clara County Real Estate Market Overview Dynamics Data from sources deemed reliable, but may contain errors and subject to revision. All numbers should be considered approximate. Jan-90 Sep-90 May-91
San Diego s High-Price Housing Strains Economic Capacity S
 APRIL 2015 WWW.NUSINSTITUTE.ORG VOLUME TEN ISSUE TWO San Diego s High-Price Housing Strains Economic Capacity S ix years since the housing market hit bottom, the median price of homes sold in San Diego
Foreclosures Continue to Bring Home Prices Down * FNC releases Q Update of Market Distress and Foreclosure Discount
 Foreclosures Continue to Bring Home Prices Down * FNC releases Q4 2011 Update of Market Distress and Foreclosure Discount The latest FNC Residential Price Index (RPI), released Monday, indicates that U.S.
Virginia Real Estate
 Real Estate Economic Impact Analysis A special report from the and the George Mason University Center for Regional Analysis ABOUT THIS REPORT The real estate industry is recognized as a key contributor