November 1, 2016 Sacramento AOR Membership Meeting Oscar Wei, Senior Economist of C.A.R.
|
|
|
- Homer Dixon
- 6 years ago
- Views:
Transcription

1 November 1, 2016 Sacramento AOR Membership Meeting Oscar Wei, Senior Economist of C.A.R.
2 Overview Economic Outlook California Housing Market Outlook Regional Housing Market Outlook 2017 Forecast
3 Economic Outlook


4 Macro Economic Summary 2.9% 2.1% GDP 2016-Q3 5.0% Consumption 2016-Q3 1.7% Unemployment Job Growth
 $ 6% 5% 4% 3% 2% 1% 0% -1% -2% -3% -4% ANNUALLY QUARTERLY 2009 Largest Annual Drop since 1946 (-2.")
5 US GDP: Improve in Q3 after a Weak 1 st Half Consumer Spending Remained Solid; Net Exports Surged 2015: 2.6%; 2016 Q3: 2.9% ANNUAL PERCENT CHANGE, CHAIN-TYPE (2009) $ 6% 5% 4% 3% 2% 1% 0% -1% -2% -3% -4% ANNUALLY QUARTERLY 2009 Largest Annual Drop since 1946 (-2.8%) Q2-11 Q4-11 Q2-12 Q4-12 Q2-13 Q4-13 Q2-14 Q4-14 Q2-15 Q4-15 Q2-16 SERIES: GDP SOURCE: US Dept. of Commerce, Bureau of Economic Analysis
6 Unemployment Rates Near 8-year low September 2016: US 5.0% & CA 5.5% 14% US-CA CA US 12% 10% 8% 6% 4% 2% 0% -2% -4% SERIES: Unemployment Rate The U-6 rate covers the unemployed, underemployed and those who are not looking but who want a job SOURCE: US Bureau of Labor Statistics, CA Employment Development Division
 -6-8 SERIES: Total Nonfarm Employment SOURCE: US Bureau of Labor Statistics, CA Employment Development")
7 CA Jobs Growing Faster Than Nation Annual Percent Change California US CA 2.3% (9/16) US 1.7% (9/16) -6-8 SERIES: Total Nonfarm Employment SOURCE: US Bureau of Labor Statistics, CA Employment Development Division

8 California Non-farm Job Growth Recession Job Losses: 1.3 million, Since Jan 10: +2.2 million MONTH TO MONTH CHANGES 150, ,000 50, , , ,000 SERIES: Total Nonfarm Employment SOURCE: CA Employment Development Division
9 Unemployment rate by California Metro Area September 2016: California 5.5% Bakersfield Fresno MSA Stockton MSA Modesto Inland Empire Ventura Sacramento Los Angeles San Diego Oakland Orange County San Jose San Francisco 3.2% 5.5% 5.4% 5.2% 4.7% 4.4% 4.1% 3.8% 6.2% 7.5% 7.5% 8.3% 9.2% 0.0% 1.0% 2.0% 3.0% 4.0% 5.0% 6.0% 7.0% 8.0% 9.0% 10.0% SERIES: Total Nonfarm Employment SOURCE: CA Employment Development Division
 San Jose Sacramento Orange Modesto Oakland San Francisco Fresno MSA Inland Empire San Diego Stockton Bakersfield Los Angeles Ventura 1.2% 1.7% 1.6% 1.6% 2.2% 2.3% 2.9% 2.8% 2.8% 2.6% 2.6% 2.6% 3.")
10 Job Trends by California Metro Area September 2016: CA +2.3%, +379,800 (YTY) San Jose Sacramento Orange Modesto Oakland San Francisco Fresno MSA Inland Empire San Diego Stockton Bakersfield Los Angeles Ventura 1.2% 1.7% 1.6% 1.6% 2.2% 2.3% 2.9% 2.8% 2.8% 2.6% 2.6% 2.6% 3.6% 0.0% 0.5% 1.0% 1.5% 2.0% 2.5% 3.0% 3.5% 4.0% SERIES: Total Nonfarm Employment By Industry SOURCE: US Bureau of Labor Statistics, CA Employment Development Division

11 Consumer Confidence: Retreated from Recent High October 2016: INDEX, 100= SERIES: Consumer Confidence SOURCE: The Conference Board
12 Mortgage Rates: Still near Record Low January 2010 October MONTHLY WEEKLY 4 3 FRM ARM / / / / / / / / / / / SERIES: 30Yr FRM, 5Yr ARM SOURCE: Freddie Mac
13 Silver Lining for Economic Weakness and Uncertainty: Interest Rates Stay Low Treasury Yield - 10 Yr. Treasury Yield - 30 Yr. Treasury yield dropped to fresh low amid global bond rally Fed may raise rate in December, but long-term rates will remain low as foreign cash continues to flow into U.S. bond 07/05/16: 10 Yr. 1.37% 30 Yr. 2.14% Jan-62 Jan-64 Jan-66 Jan-68 Jan-70 Jan-72 Jan-74 Jan-76 Jan-78 Jan-80 Jan-82 Jan-84 Jan-86 Jan-88 Jan-90 Jan-92 Jan-94 Jan-96 Jan-98 Jan-00 Jan-02 Jan-04 Jan-06 Jan-08 Jan-10 Jan-12 Jan-14 Jan-16 SERIES: Treasury Yield 10 Yr., Treasury Yield 30 Yr. SOURCE: Yahoo Finance
14 California Housing Market Outlook
 2.0 1.8 1.6 1.4 1.2 1.0 0.8 0.6 0.4 0.2 0.0 1.6 1.3 0.7 1.1 0.")

15 Household Growth Decelerates But Still Solid in 2016 Annual Household Growth (Net Chg, In Millions) p SERIES: Annual Household Growth SOURCE: US Census Bureau Housing Vacancy Survey

16 Home Purchase Index Continued to Climb from Same Period of Last Year At the national level, consumer sentiment remains positive. Consumers have a fairly optimistic 12-month outlook on housing at the end of the summer home-buying season, supported by increased job confidence and more favorable expectations regarding their personal financial situations compared with this time last year, said Doug Duncan, senior vice president and chief economist at Fannie Mae. SERIES: Home Purchase Sentiment Index SOURCE: Fannie Mae
17 Millennials: American Dream is still Important 40% 35% 30% 25% 20% 15% Answer on a scale of 0 to 5, from 'No Challenge' to 'Significant Challenge' n: % 31% 25% 10% 5% 4% 6% 0% Not at All Important Of Little Importance Moderately Important Important Very Important How important is fulfilling the 'American Dream' to you? SERIES: 2016 Generations / Millennials Survey SOURCE: CALIFORNIA ASSOCIATION OF REALTORS
18 And Homeownership is part of it 20% 18% 16% 14% 12% 10% 18% 18% 16% 14% 12% 11% 10% 8% 6% 4% 2% 0% Owning a home A fulfilling job Having a family Education Seeing the world Helping others Becoming wealthy Which factors contribute to your ideal of the `American Dream` SERIES: 2016 Generations / Millennials Survey SOURCE: CALIFORNIA ASSOCIATION OF REALTORS

19 50% 45% 40% 35% Many Millennials Also Believe Buying a Home Is a Safe Investment 45% 37% 30% 25% 20% 15% 12% 10% 5% 0% 1% 5% Strongly Disagree Disagree Neighter Agree nor Disagree Agree Strongly Agree Q. Do you think home purchase is still a safe investment? SERIES: 2016 Generations / Millennials Survey SOURCE: CALIFORNIA ASSOCIATION OF REALTORS
20 Nearly ½ Renters Plan to Buy a Home No plans to buy 28% Not sure 24% In 5+ Years 11% 3-5 Years 14% In 2 Years 13% Within a year 9.6% Q. When do you plan to buy your next home? 0.0% 5.0% 10.0% 15.0% 20.0% 25.0% 30.0% 20
21 55% of Renters Have Made Preparations to Buy a Home No preparations 45% Searched for homes 34% Searched for home buying process information online 21% Spoken to a REALTOR 16% Consulted credit counselor/financial advisor 12.0% Pre-qualified with a lender 9.0% Other 1.0% Q. Have you made any of the following preparations to buy a home? Please select all that apply. 0% 5% 10% 15% 20% 25% 30% 35% 40% 45% 50% 21

22 Sellers - More than Half of All Sellers Plan to Buy Another Home 80% 70% 60% 50% 72% 63% 52% 46% 49% 48% 53% 52% 40% 39% 33% 38% 40% 30% 20% 10% 0% SERIES: 2016 Housing Market Survey SOURCE: CALIFORNIA ASSOCIATION OF REALTORS


23 Investor Buyers? Fewer than 2013, Still Have Demand in Lower-Priced Segments Demand for Investment Properties remained at the Lowest level since 2009 % to Total Sales 30% Investment/Rental Property Vacation/Second Home 25% 20% 15% 10% 5% 0% SERIES: 2016 Housing Market Survey SOURCE: CALIFORNIA ASSOCIATION OF REALTORS


24 Investor Strategy: Still Buying to Rent SERIES: 2016 Housing Market Survey SOURCE: CALIFORNIA ASSOCIATION OF REALTORS


25 9% 8% 8% International Buyers? Smaller Share than Before, Partly Because of Global Economic Slowdown The share of international buyers dropped to the lowest level in 9 years 8% 7% 6% 5% 6% 5% 6% 6% 6% 4% 3% 2% 1% 4% 3% 0% Q. Was the buyer an international buyer a person who was a citizen of another country who wished to purchase residential real estate in the U.S.? SERIES: 2016 Housing Market Survey SOURCE: CALIFORNIA ASSOCIATION OF REALTORS
26 Real Estate is Still Considered the Best Long Term Investment 26

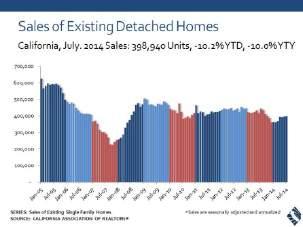
27 Demand Drivers Seem Solid, So Sales Should Be Up, Right? California, Sept Sales: 425,680 Units, -0.4% YTD, +0.8% YTY 700, , , , , , ,000 - Sep-15: 422,360 Sep-16: 425,680 *Sales are seasonally adjusted and annualized SERIES: Sales of Existing Single Family Homes SOURCE: CALIFORNIA ASSOCIATION OF REALTORS

28 Sales More Robust in Higher-Priced Segments Jan to September 2016 Sales 15% Year-to-Year % Chg 10% 5% 0% -5% -10% -15% -3% -2% 3% 8% 6% 9% 1% -20% -25% -21% $0 - $199k $200 - $299k $300 - $399k $400 - $499k $500 - $749k $750 - $999k $1,000 - $1,999k $2,000k+ SOURCE: CALIFORNIA ASSOCIATION OF REALTORS
29 Supply Remains an Issue, as Unsold Inventory Stays Below the Norm Sept. 2015: 3.6 Months; Sept. 2016: 3.5 Months Note: Unsold Inventory Index represents the number of months it would take to sell the remaining inventory for the month in question. The remaining inventory for the month is defined as the number of properties that were Active, Pending, and Contingent (when available) and divide the sum by the number of Sold properties for the month in question. SERIES: Unsold Inventory Index of Existing Single Family Homes SOURCE: CALIFORNIA ASSOCIATION OF REALTORS

30 Supply More Restricted at the More Affordable Price Ranges Sep-16 Sep-15 $1,000K $ K $ K $ K $ K $ K $0-199K Note: Unsold Inventory Index represents the number of months it would take to sell the remaining inventory for the month in question. The remaining inventory for the month is defined as the number of properties that were Active, Pending, and Contingent (when available) and divide the sum by the number of Sold properties for the month in question. SERIES: Unsold Inventory Index of Existing Single Family Homes SOURCE: CALIFORNIA ASSOCIATION OF REALTORS
31 Where is the inventory? Long-Time Homeowners are not moving as in the past Low rate on current mortgage Low property taxes Capital gains hit Where can I afford to go? Could not qualify for a mortgage today Remodel and stay Are we headed for the European Model where children inherit the home of their parents? One more thing Secular decline in marriage

32 Years Owned Home Before Selling 12 All Sellers SERIES: 2016 Housing Market Survey SOURCE: CALIFORNIA ASSOCIATION OF REALTORS
/Construction Industry Research")
33 Owners Investing in Staying Put? $ Billions Alterations/Additions Reach All-Time High & Gaining Steam Up 16% from 2015 YTD levels $3.9 Billion through July Year-to-Date Through July SOURCE: California Homebuilding Foundation (CHF)/Construction Industry Research Board (CIRB) Downloaded from Moody s Analytics

34 Boomers Not Moving as Often 71% of Californian s aged 55+ haven t moved since 1999 California Homeowners by Length of Tenure, % Under % 30% 25% 20% 24.4% 21.3% 24.0% 15% 10% 5% 0% 9.0% 14.2% 12.4% 11.0% 12.0% 10.7% 8.9% 7.3% 5.7% 0.9% 0.8% 1.9% 1978 & Earlier 1979 to to to to to to to 2013 SERIES: Distribution of Home Ownership by Year Moved In SOURCE: U.S. Census Bureau, 2013 American Housing Survey
 2016p: 98,300 total units Single Family Multi-Family")

35 Missing 65,000 New Units Annually : 95,822 (42,959 sf, 52,863 mf) 2016p: 98,300 total units Single Family Multi-Family Household Growth: 165,000/yr SERIES: California New Housing Permits SOURCE: Construction Industry Research Board

36 Three of the Top 10 Markets in Need of More Housing Constructions Are in California Top 10 Markets in Need of More Single-Family Housing Starts Metro Area # of permits required 1. New York 218, Dallas 132, San Francisco 127, Miami 118, Chicago 94, Atlanta 93, Seattle 73, San Jose, CA 69, Denver 67, San Diego 55,825 SOURCE: National Association of Realtors, Census Bureau
37 Most Underbuilt Counties in California 450, , , , , , , ,000 50,000 0 New Jobs vs. New Permits ( ) 381, , , , ,162 95,245 98, ,586 88,134 35,426 44,923 40,434 18,141 14,901 18,108 31,255 Jobs Permits 66,054 44,772 6,349 10,890 SOURCE: California Employment Development Department, Construction Industry Research Board
 SERIES: Nonfarm Job Growth, New Housing Permits, Existing Median Prices SOURCE: CA EDD, C.A.R., Construction Industry Research Board")
38 Underbuilding (New Jobs/New Permits) The More Underbuilding, the Higher the Price Growth CA Underbuilding and Price Growth ( ) % -20% 0% 20% 40% 60% 80% 100% 120% -2 Price Growth (%) SERIES: Nonfarm Job Growth, New Housing Permits, Existing Median Prices SOURCE: CA EDD, C.A.R., Construction Industry Research Board
39 Tight Supply Also Pushed up Home Prices, as onethird of Homes Were Sold above the Asking Price 60% 50% 40% % of Sales above Asking Price 33% 32% 10% 9% 8% 7% 6% Median Price Discount & Weeks on Market Med. Price Discount Med. Weeks on MLS % 5% 8 20% 10% Long Run Average = 20% 4% 3% 2% 1% 0%, 2.1 weeks % 0% 0 SERIES: 2016 Housing Market Survey SOURCE: CALIFORNIA ASSOCIATION OF REALTORS

40 California Median Price at Its Highest Level in Nearly Seven Years California, Sep. 2016: $514,320, -2.3% MTM, +6.1% YTY $700,000 $600,000 P: May-07 $594,530 Sep-15: $484,670 Sep-16: $514,320 $500,000 $400,000 T: Feb-09 $245,230-59% from peak $300,000 $200,000 $100,000 $- SERIES: Median Price of Existing Single Family Homes SOURCE: CALIFORNIA ASSOCIATION OF REALTORS


41 Net Cash Gain to Sellers Highest since 2007 $250,000 $200,000 $175,000 $150,000 $100,000 $50,000 $ Q. What was the net cash gain or net loss to the seller as a result of this sale? SERIES: 2016 Housing Market Survey SOURCE: CALIFORNIA ASSOCIATION OF REALTORS

42 Affordability Becomes Biggest Concern Decline in housing affordability 26% Lack of Inventory Inflated home prices 19% 18% Slow down in economic growth 11% Housing bubble Lending & financing Rising interest rates Policy & regulations 6.5% 6.2% 4.0% 1.7% Q: What is your biggest concern about the current real estate market? 0% 5% 10% 15% 20% 25% 30% SERIES: 2016 Housing Market Survey SOURCE: CALIFORNIA ASSOCIATION OF REALTORS

43 Housing Affordability peaked q prices v. low rates and income growth % OF HOUSEHOLDS THAT CAN BUY A MEDIAN-PRICED HOME 80% 70% 60% 50% 40% 30% 20% 10% 0% CA US California vs. U.S Annual Quarterly 57% 31% SERIES: Housing Affordability Index of Traditional Buyers SOURCE: CALIFORNIA ASSOCIATION OF REALTORS

44 Housing Affordability In CA: by county 2016-Q2: % able to purchase median-priced home SERIES: Housing Affordability Index of Traditional Buyers SOURCE: CALIFORNIA ASSOCIATION OF REALTORS

45 But Affordability Is Not Just a Monthly Mortgage Payment Issue, It s Also a Down Payment Issue Highest Down Pmt. in $ Since 2005, but lowest down pmt. in % in last 7 yrs. $90,000 $80,000 Median Down Payment % of Down Payment to Price $78,000 25% $70,000 20% $60,000 $50,000 18% 15% $40,000 $30,000 10% $20,000 5% $10,000 $ % SERIES: 2016 Annual Housing Market Survey SOURCE: California Association of REALTORS


46 Home Prices Chasing Rent Growth Both outpacing growth in earnings, and suggests that it s a supply issue California Los Angeles 35.0% 30.0% 30.0% 25.0% 25.0% 20.0% 20.0% 15.0% 10.0% 5.0% 15.0% 10.0% 5.0% 0.0% 0.0% -5.0% -5.0% -10.0% % Prices Rents Wages Prices Rents Wages SOURCE: California Association of REALTORS, Bureau of Labor Statistics, and RealFacts

47 San Francisco: Affordability & Jobs Drive Migration County Moved To/From Total Number Moved to San Francisco County Total Number Moved from San Francisco County Total Net Migration Alameda San Mateo Contra Costa Sonoma Marin Napa Solano Santa Clara
48 Homeownership Rates California vs. U.S. 9.4% gap in % CA US 70% 64% 60% 50% 54% 40% 30% 20% 10% 0% SERIES: Housing Affordability Index of Traditional Buyers SOURCE: CALIFORNIA ASSOCIATION OF REALTORS
49 Regional Housing Market
50 Central Valley Sales 3.7% YTD 8.4% YTY Median Price $290, % YTY UII NA NA Months MTM Days Price Per Sq Ft Sales To List Ratio


51 2016 Central Valley YTD Sales

52 2016 Central Valley Median Prices YTY
53 Sacramento County

54 2,500 Sales of Existing Detached Homes Sacramento County, Sep. 2016: 1,609 Units, +1.2% YTD, +2.9% YTY 2,000 1,500 1, SERIES: Sales of Existing Single Family Homes SOURCE: CALIFORNIA ASSOCIATION OF REALTORS
55 Sales of Existing Detached Homes Sacramento County, 2015: 17,143 Units, Up 11.4% YTY 25,000 ANNUALLY 20,000 15,000 10,000 5,000 0 SERIES: Sales of Existing Single Family Homes SOURCE: CALIFORNIA ASSOCIATION OF REALTORS

56 $450,000 $400,000 $350,000 $300,000 $250,000 $200,000 $150,000 $100,000 $50,000 $0 Median Price of Existing Detached Homes Sacramento County, Sep. 2016: $325,380, Up 12.3% YTY SERIES: Median Price of Existing Single Family Homes SOURCE: CALIFORNIA ASSOCIATION OF REALTORS

57 Unsold Inventory Index Sacramento County, September 2016: 2.6 Months Note: The Unsold Inventory Index represents the number of months it would take to deplete the remaining inventory at the end of a particular month with the sales rate of the month in consideration. Inventory includes listings with Active, Pending, and Contingent (when available) statuses. SERIES: Unsold Inventory Index of Existing Single Family Homes SOURCE: CALIFORNIA ASSOCIATION OF REALTORS
58 Folsom

59 Sales of Single Family Homes Folsom, September 2016: 94 Units +10.4% 2015, +1.2% 2016 YTD, +4.4% YTY SOURCE: Clarus Market Metrics
60 Median Price of Single Family Homes Folsom, September 2016: $466,000 Down 1.6% MTM, Up 6.8% YTY SOURCE: Clarus Market Metrics

61 For Sale Properties Folsom, September 2016: 263 Units -6.6% 2015, -9.4% 2016 YTD, -11.7% YTY Note: For Sale Properties represents the overall supply that exist throughout the entire month, including any listings that appear as Active any point in time during the month. SOURCE: Clarus Market Metrics
62 Elk Grove

63 Sales of Single Family Homes Elk Grove, September 2016: 242 Units +9.7% 2015, +4.4% 2016 YTD, +22.8% YTY SOURCE: Clarus Market Metrics
64 Median Price of Single Family Homes Elk Grove, September 2016: $372,500 Up 2.6% MTM, Up 9.6% YTY SOURCE: Clarus Market Metrics

65 For Sale Properties Elk Grove, September 2016: 641 Units +0.9% 2015, -8.8% 2016 YTD, -8.9% YTY Note: For Sale Properties represents the overall supply that exist throughout the entire month, including any listings that appear as Active any point in time during the month. SOURCE: Clarus Market Metrics
66 City of Sacramento
67 Sales of Single Family Homes City of Sacramento, September 2016: 809 Units +11.6% 2015, +0.7% 2016 YTD, +2.4% YTY SOURCE: Clarus Market Metrics

68 Median Price of Single Family Homes City of Sacramento, September 2016: $285,000 Down 1.7% MTM, Up 13.9% YTY SOURCE: Clarus Market Metrics

69 For Sale Properties City of Sacramento, September 2016: 2,561 Units -4.5% 2015, -7.1% 2016 YTD, +5.2% YTY Note: For Sale Properties represents the overall supply that exist throughout the entire month, including any listings that appear as Active any point in time during the month. SOURCE: Clarus Market Metrics
70 2017 Forecast
71 U.S. Economic Outlook p 2017f US GDP 1.6% 2.2% 1.7% 2.4% 2.6% 1.5% 2.2% Nonfarm Job Growth 1.2% 1.7% 1.7% 1.9% 2.1% 1.8% 1.4% Unemployment 8.9% 8.1% 7.4% 6.2% 5.3% 4.9% 4.7% CPI 3.1% 2.1% 1.5% 1.6% 0.1% 1.4% 2.1% Real Disposable Income, % Change 2.5% 3.2% -1.4% 2.7% 3.4% 2.7% 2.7% 30-Yr FRM 4.5% 3.7% 4.0% 4.2% 3.9% 3.6% 4.0% SERIES: U.S. Economic Outlook SOURCE: CALIFORNIA ASSOCIATION OF REALTORS
72 California Economic Outlook p 2017f Nonfarm Job Grow th Unemployment Rate Population Grow th Real Disposable Income, % Change 1.1% 2.4% 3.0% 2.2% 2.7% 2.3% 1.6% 11.8% 10.4% 8.9% 7.5% 6.2% 5.5% 5.3% 0.7% 0.7% 0.9% 0.9% 0.9% 1.0% 1.0% 3.5% 4.7% -1.1% 3.2% 3.6% 2.9% 3.5% SERIES: CA Economic Outlook SOURCE: CALIFORNIA ASSOCIATION OF REALTORS
73 California Housing Market Outlook p 2017f SFH Resales (000s) % Change 1.4% 4.1% -5.9% -7.8% 6.8% -0.4% 1.4% Median Price ($000s) $286.0 $319.3 $407.2 $446.9 $474.4 $503.9 $525.6 % Change -6.2% 11.6% 27.5% 9.8% 6.2% 6.2% 4.3% Housing Affordability Index 53% 51% 36% 30% 31% 33% 29% 30-Yr FRM 4.5% 3.7% 4.0% 4.2% 3.9% 3.6% 4.0% SERIES: CA Housing Market Outlook SOURCE: CALIFORNIA ASSOCIATION OF REALTORS
74 Central Valley Housing Market Outlook p 2017f SFH Resales % Change -7.1% 9.9% 3.7% 2.2% Median Price ($000s) $245.0 $265.6 $283.0 $294.6 Median Price % Change 13.0% 8.4% 6.6% 4.1% SERIES: Southern California Housing Market Outlook SOURCE: CALIFORNIA ASSOCIATION OF REALTORS
75 Key Takeaways Both CA home sales and prices will be up slightly in 2017 Fundamental demand drivers (jobs; rates; household formation) are solid Housing affordability an insurmountable hurdle for many CA will see accelerating out-migration of Millennials in search of housing they can afford
76 Lack of Affordability Biggest Challenge Mortagage rate increase, 10% Recession, 6% Lack of inventory, 28% Lack of affordability, 56% Q2 - What will be the biggest challenge for the housing market in 2017?


77 Stay connected with Research CARResearchGroup CARResearchInfo On.car.org/CARResearch Housingmatters.car.org

78


79 C.A.R. Innovators Workshop Program to find next BIG IDEA in Real Estate ANYONE can apply Not just for REALTORS You bring the IDEAS C.A.R. brings the: Product validation Advice/expertise Access to key assets Exposure & opportunity Relationships/network Apply NOW!!

80 Innovators Workshop Advisory Group (IWAG) Are you an EXPERT in your respective field? Join the IWAG Evaluate submissions Provide recommendations Drive innovation Get recognized Do you know an EXPERT in the field? Recommend them to us Apply for the IWAG NOW!!


81 Get Your WYR Gear! Car Magnet Coffee Mug $10/each Available now at store.car.org
82 Thank You This presentation can be found on Speeches & Presentations
2016 ECONOMIC AND HOUSING MARKET FORECAST
 2016 ECONOMIC AND HOUSING MARKET FORECAST April 06, 2016 San Francisco Association of REALTORS Oscar Wei, Senior Economist of C.A.R. OVERVIEW Economic Outlook California Housing Market Outlook Regional
2018 Housing Market Outlook. Central Coast Realty Group Business Symposium February 22, 2018 Oscar Wei Senior Economist
 2018 Housing Market Outlook Central Coast Realty Group Business Symposium February 22, 2018 Oscar Wei Senior Economist Overview Economic Update California Housing Market Outlook Regional Housing Market
Orange County AOR October 21, 2016 Leslie Appleton-Young Chief Economist & Vice President
 Orange County AOR October 21, 2016 Leslie Appleton-Young Chief Economist & Vice President lesliea@car.org Cadence of Accountability How did I do with last year s forecast? 2016 Story US economic and job
Contra Costa AOR October 26, 2016 Leslie Appleton-Young Chief Economist & Vice President
 Contra Costa AOR October 26, 2016 Leslie Appleton-Young Chief Economist & Vice President lesliea@car.org Cadence of Accountability How did I do with last year s forecast? 2016 Story US economic and job
Santa Cruz County AOR Seascape Golf Club October 7, 2016 Leslie Appleton-Young Chief Economist & Vice President
 Santa Cruz County AOR Seascape Golf Club October 7, 2016 Leslie Appleton-Young Chief Economist & Vice President 12 Free Hours of Online CE Courses! 2016 C.A.R. Member Benefit Delivered 580,000+ Hours Take
Economic and Housing Market Outlook ( ) October 31, Contra Costa AOR
 October 31, Contra Costa AOR") Economic and Housing Market Outlook (2012 2013) Contra Costa AOR October 31, 2012 Oscar Wei Senior Research Analyst California Association of REALTORS Overview US and California Economies California Housing
Economic and Housing Market Outlook (2012 2013) Contra Costa AOR October 31, 2012 Oscar Wei Senior Research Analyst California Association of REALTORS Overview US and California Economies California Housing
Realty Executives Santa Clarita November 17, 2016 Leslie Appleton-Young Chief Economist & Vice President
 Realty Executives Santa Clarita November 17, 2016 Leslie Appleton-Young Chief Economist & Vice President lesliea@car.org Nobody had it priced in and the uncertainty Is absolutely enormous Every Wall Street
2019 Housing Market Forecast. Palos Verdes Peninsula AOR January 8, 2019 Jordan G. Levine Senior Economist
 2019 Housing Market Forecast Palos Verdes Peninsula AOR January 8, 2019 Jordan G. Levine Senior Economist Overview Good News: Economic fundamentals solid Homeownership still the dream Rates might not go
CALIFORNIA ECONOMIC & MARKET OUTLOOK. October 29,2014 Contra Costa Association of REALTORS Leslie Appleton Young, Chief Economist
 2014 2015 CALIFORNIA ECONOMIC & MARKET OUTLOOK October 29,2014 Contra Costa Association of REALTORS Leslie Appleton Young, Chief Economist OVERVIEW Economic Outlook California Housing Market Outlook Housing
2013 Housing Market Forecast. SILVAR: Los Gatos/Saratoga District October 10, 2012 Leslie Appleton-Young, Vice President & Chief Economist
 2013 Housing Market Forecast SILVAR: Los Gatos/Saratoga District October 10, 2012 Leslie Appleton-Young, Vice President & Chief Economist What we saw from the roof.. C.A.R. NAR THE ECONOMY Recent Housing
CALIFORNIA ECONOMIC & MARKET OUTLOOK. October 29,2014 SILVAR Leslie Appleton-Young, Chief Economist
 2014-2015 CALIFORNIA ECONOMIC & MARKET OUTLOOK October 29,2014 SILVAR Leslie Appleton-Young, Chief Economist OVERVIEW Economic Outlook California Housing Market Outlook Housing Affordability Regional Market
Leslie Appleton-Young Chief Economist & Vice President
 Leslie Appleton-Young Chief Economist & Vice President 2017 Forecast Report Card 2016 Actual 2017 Forecast 2017 Projected SFH Resales (000s) 416.7 413.0 421.9 % Change 1.8% 1.4% 1.3% Median Price ($000s)
Real gross domestic product California vs. United States
 Real gross domestic product California vs. United States Percent change, year ago 6 4 U.S. California 2 0-2 -4-6 2001 2002 2003 2004 2005 2006 2007 2008 2009 2010 2011 Source: Bureau of Economic Analysis.
California Housing Market Update. Monthly Sales and Price Statistics September 2018
 California Housing Market Update Monthly Sales and Price Statistics September 2018 Sales Had the Largest Decline since March 2014 California, September 2018 Sales: 382,550 Units, -3.3% YTD, -12.4% YTY
California Housing Market Update. Monthly Sales and Price Statistics October 2018
 California Housing Market Update Monthly Sales and Price Statistics October 2018 Sales Had the 2 nd Largest Drop in the Last 6 Months California, October 2018 Sales: 397,060 Units, -3.7% YTD, -7.9% YTY
California Housing Market Update. Monthly Sales and Price Statistics May 2018
 California Housing Market Update Monthly Sales and Price Statistics May 2018 Sales Lost Momentum as Mortgage Rates Continued to Climb California, May 2018 Sales: 409,270 Units, +0.3% YTD, -4.6% YTY 700,000
California Housing Market Update. Monthly Sales and Price Statistics December 2018
 California Housing Market Update Monthly Sales and Price Statistics December 2018 Sales Reached the Lowest Level since Jan 2015 California, December 2018 Sales: 372,260 Units, -5.2% YTD, -11.6% YTY 700,000
California Housing Market Update. Monthly Sales and Price Statistics January 2018
 California Housing Market Update Monthly Sales and Price Statistics January 2018 Sales Started with a Slight Decrease California, Jan. 2018 Sales: 388,800 Units, -2.9% YTD, -2.9% YTY 700,000 600,000 500,000
California Housing Market Update. Monthly Sales and Price Statistics November 2018
 California Housing Market Update Monthly Sales and Price Statistics November 2018 Home Sales: Largest Decline Since 2014 California, November 2018 Sales: 381,400 Units, -4.6% YTD, -13.4% YTY 700,000 600,000
California Housing Market Update. Monthly Sales and Price Statistics August 2018
 California Housing Market Update Monthly Sales and Price Statistics August 2018 Sales Declined for the 4 th Consecutive Month California, August 2018 Sales: 399,600 Units, -2.1% YTD, -6.6% YTY 700,000
2013 CALIFORNIA HOUSING MARKET OUTLOOK. Santa Barbara AOR February 6, Leslie Appleton-Young, C.A.R. Chief Economist
 2013 CALIFORNIA HOUSING MARKET OUTLOOK Santa Barbara AOR February 6, 2013. Leslie Appleton-Young, C.A.R. Chief Economist 2013 New Member Benefit: 12 FREE Hours Online CE Courses C.A.R. s newest member
2018 Housing Market Outlook. California Desert Association of REALTORS October 19, 2017 Jordan G. Levine Economist
 2018 Housing Market Outlook California Desert Association of REALTORS October 19, 2017 Jordan G. Levine Economist jordanl@car.org Overview Post-Election Outlook Starting 2017 with a bang! Lots of uncertainty
MARKET OUTLOOK FOR SAN MATEO
 MARKET OUTLOOK FOR SAN MATEO Jonathan Smoke Chief Economist August 2, 2016 NATIONAL TRENDS 2 JOB CREATION REBOUNDED IN JUNE 229,000 jobs created by month in 2015; 172,000 average this year Employment and
U.S. Economic and Institutional Apartment Market Overview and Outlook. January 7, 2015
 U.S. Economic and Institutional Apartment Market Overview and Outlook January 7, 2015 Emerging Economic Trends Inflation Adjusted Crude Oil Prices In Alignment with Long-Term Average Price per Barrel (Nov.
2018 Housing Market Forecast. Contra Costa Association of REALTORS October 18, 2017 Joel Singer Chief Executive Officer
 2018 Housing Market Forecast Contra Costa Association of REALTORS October 18, 2017 Joel Singer Chief Executive Officer Economic Update Stronger Economic Growth in Q2 As Consumer Spending Improved 3.1%
REALTOR.COM MARKET OUTLOOK
 REALTOR.COM MARKET OUTLOOK Realtor.com Economics October 2018 AGENDA Economic and housing data and insights from realtor.com National Forecast How well did we predict 2018? U.S. Economic Trends GDP, Jobs
INLAND EMPIRE REGIONAL INTELLIGENCE REPORT. School of Business. April 2018
 INLAND EMPIRE REGIONAL INTELLIGENCE REPORT April 2018 Key economic indicators suggest that the Inland Empire s economy will continue to expand throughout the rest of 2018, building upon its recent growth.
2013 San Diego Economic Outlook. 29 th Annual Economic Roundtable Marney Cox Chief Economist San Diego Association of Governments January 25, 2013
 213 San Diego Economic Outlook 29 th Annual Economic Roundtable Marney Cox Chief Economist San Diego Association of Governments January 25, 213 US The Problem Slow Economic Growth Gross Domestic Product
Housing Price Forecasts. Illinois and Chicago PMSA, June 2012
 Housing Price Forecasts Illinois and Chicago PMSA, June 2012 Presented To Illinois Association of REALTORS From R E A L Regional Economics Applications Laboratory, Institute of Government and Public Affairs
Oakland Chamber of Commerce 2015 Economic Development Summit The Oakland Advantage. Garrick Brown. Commercial Market Overview
 Oakland Chamber of Commerce 2015 Economic Development Summit The Oakland Advantage Garrick Brown Commercial Market Overview Oakland Convention Center Oakland, CA March 20, 2015 Vice President, Research
Housing Price Forecasts. Illinois and Chicago PMSA, January 2018
 Housing Price Forecasts Illinois and Chicago PMSA, January 2018 Presented To Illinois Realtors From R E A L Regional Economics Applications Laboratory, Institute of Government and Public Affairs University
Metropolitan Area Statistics
 Metropolitan Area Statistics Apartment Completions 1Q 2011 1Q 2012 % Chg Atlanta - - n/a Boston 133 39-71% Chicago - 20 n/a Cleveland - - n/a Columbus - 272 n/a Dallas-Ft. Worth 604 1,059 75% Denver 328
REALTOR.COM MARKET OUTLOOK
 REALTOR.COM MARKET OUTLOOK Realtor.com Economics May 2018 MOST COMPETITIVE SEASON ON RECORD Key expectations from realtor.com Existing Home Sales Struggle to Break Out Supply: Inventory, Prices, Affordability
THE OUTLOOK FOR HOUSING IN ILLINOIS
 THE OUTLOOK FOR HOUSING IN ILLINOIS Jonathan Smoke Chief Economist January 25, 2017 NATIONAL TRENDS 2 2000.01 2000.05 2000.09 2001.01 2001.05 2001.09 2002.01 2002.05 2002.09 2003.01 2003.05 2003.09 2004.01
State of the Nation s Housing 2008: A Preview
 State of the Nation s Housing 28: A Preview Eric S. Belsky Remodeling Futures Conference April 15, 28 www.jchs.harvard.edu The Housing Market Has Suffered Steep Declines Percent Change Median Existing
Housing Price Forecasts. Illinois and Chicago PMSA, October 2014
 Housing Price Forecasts Illinois and Chicago PMSA, October 2014 Presented To Illinois Association of Realtors From R E A L Regional Economics Applications Laboratory, Institute of Government and Public
Metropolitan Area Statistics (1Q 2013)
") Metropolitan Area Statistics (1Q 2013) Apartment Completions 1Q 2012 1Q 2013 % Chg Atlanta 487 1,460 200% Boston 360 373 4% Chicago 611 92-85% Cleveland 7 54 671 Columbus - 459 n/a Dallas-Ft. Worth 1,327
Metropolitan Area Statistics (1Q 2013) Apartment Completions 1Q 2012 1Q 2013 % Chg Atlanta 487 1,460 200% Boston 360 373 4% Chicago 611 92-85% Cleveland 7 54 671 Columbus - 459 n/a Dallas-Ft. Worth 1,327
STATE OF THE MULTIFAMILY MARKET MACRO VIEW
 STATE OF THE MULTIFAMILY MARKET MACRO VIEW JEANETTE I. RICE, CRE AMERICAS HEAD OF MULTIFAMILY RESEARCH APRIL 19, 2018 Westchester/ Fairfield 2 JEANETTE I. RICE STATE OF U.S. MULTIFAMILY MARKET KEY INVESTMENT
Bay Area Real Estate Outlook Oakland, CA
 Bay Area Real Estate Outlook 2014 Oakland, CA September 12, 2013 Capital Markets Overview Dennis Williams Managing Director NorthMarq Capital September 2013 Key Themes of 2013 CMBS Delinquency has leveled
2019 Economic & Market Forecast. REImagine October 11, 2018 Leslie Appleton-Young SVP & Chief Economist
 2019 Economic & Market Forecast REImagine October 11, 2018 Leslie Appleton-Young SVP & Chief Economist 2008 The CA Housing Market Recovery 100% 90% 80% 70% 60% 50% 40% 30% 20% 10% 0% Equity Sales Short
NATIONAL ASSOCIATION of REALTORS RESEARCH DIVISION. Prepared for Florida REALTORS
 NATIONAL ASSOCIATION of REALTORS RESEARCH DIVISION Prepared for Florida REALTORS NATIONAL ASSOCIATION OF REALTORS RESEARCH DIVISION Page 1 Page 3 Page 4 Page 6 Page 7 Page 8 Page 9 Page 10 Page 11 Page
LUXURY MARKET REPORT. - March
 LUXURY MARKET REPORT - March 2018 - www.luxuryhomeing.com THIS IS YOUR LUXURY MARKET REPORT MAP OF LUXURY RESIDENTIAL MARKETS Welcome to the Luxury Report, your guide to luxury real estate market data
LUXURY MARKET REPORT. - March
 LUXURY MARKET REPORT - March 2018 - www.luxuryhomemarketing.com THIS IS YOUR LUXURY MARKET REPORT MAP OF LUXURY RESIDENTIAL MARKETS Welcome to the Luxury Market Report, your guide to luxury real estate
2016 MID-YEAR MARKET UPDATE June 23, Breanna Vanstrom, MBA, RCE Chief Executive Officer
 2016 MID-YEAR MARKET UPDATE June 23, 2016 Breanna Vanstrom, MBA, RCE Chief Executive Officer In 2015, Ada County surpassed $2 billion in total dollar volume sold. The first year since 2006. In May 2016,
2018 Real Estate Forecast Breakfast. Real Estate Market Update
 2018 Real Estate Forecast Breakfast Central Oregon Association of REALTORS Real Estate Market Update Paul C. Bishop, PhD, CBE Vice President, Research NATIONAL ASSOCIATION OF REALTORS February 22, 2018
San Francisco Bay Area to Santa Clara & San Benito Counties Housing and Economic Outlook
 San Francisco Bay Area to 019 Santa Clara & San Benito Counties Housing and Economic Outlook Bay Area Economic Forecast Summary Presented by Pacific Union International, Inc. and John Burns Real Estate
2017 RESIDENTIAL REAL ESTATE MARKET REPORT
 2017 RESIDENTIAL REAL ESTATE MARKET REPORT Published January 26, 2018 Our market reports have been focused on the effects of low inventory on our housing market and for good reason. December 2017 marked
National Housing Trends
 National Housing Trends 34% America s Choice of Best Long Term Investment 26% 17% 15% 6% Real Estate Stocks / Mutual Funds Gold Savings Accounts / CDs Bonds Gallup 2018 Total Existing Home Sales in thousands
Housing Price Forecasts. Illinois and Chicago PMSA, December 2015
 Housing Price Forecasts Illinois and Chicago PMSA, December 2015 Presented To Illinois Association of Realtors From R E A L Regional Economics Applications Laboratory, Institute of Government and Public
LUXURY MARKET REPORT. - May
 LUXURY MARKET REPORT - May 2018 - www.luxuryhomeing.com THIS IS YOUR LUXURY MARKET REPORT MAP OF LUXURY RESIDENTIAL MARKETS Welcome to the Luxury Report, your guide to luxury real estate market data and
San Francisco Bay Area to Marin, San Francisco, and San Mateo Counties Housing and Economic Outlook
 San Francisco Bay Area to 019 Marin, San Francisco, and San Mateo Counties Housing and Economic Outlook Bay Area Economic Forecast Summary Presented by Pacific Union International, Inc. and John Burns
Housing Price Forecasts. Illinois and Chicago PMSA, March 2018
 Housing Price Forecasts Illinois and Chicago PMSA, March 2018 Presented To Illinois Realtors From R E A L Regional Economics Applications Laboratory, Institute of Government and Public Affairs University
Economic Outlook in Uncertain Times
 Economic Outlook in Uncertain Times Lawrence Yun, Ph.D. Chief Economist NATIONAL ASSOCIATION OF REALTORS Presentation to Silicon Valley Association of REALTORS October 11, 2010 Federal Reserve FOMC Ben
Santa Clara County Real Estate Market Overview Dynamics
 Santa Clara County Real Estate Market Overview Dynamics Data from sources deemed reliable, but may contain errors and subject to revision. All numbers should be considered approximate. Jan-90 Sep-90 May-91
Housing and Economy Market Trends
 Housing and Economy Market Trends Mainstreet Organization Prices of single-family, detached homes in suburban Chicago increased 12.1 percent in May 2014 compared with the same period a year ago. Overall,
Zillow Group Uncovers
 Zillow Group Uncovers Economic Trends in MF Housing Svenja Gudell, Zillow Chief Economist @SvenjaGudell svenjag@zillow.com June 15-18, 2016 Moscone Convention Center San Francisco Rents continue to grow,
U.S. MULTIFAMILY MARKETVIEW FIGURES Q4 2016
 U.S. MULTIFAMILY MARKETVIEW FIGURES Q4 2016 U.S. MULTIFAMILY MARKETVIEW Q4 2016 2016 DELIVERS IMPRESSIVE DEMAND AND NEW SUPPLY TOTALS Vacancy Rate 4.9% Net Absorption* 201,000 Units Rentable Completions*
Commercial Real Estate Outlook
 Commercial Real Estate Outlook By Lawrence Yun, Ph.D. Chief Economist, National Association of REALTORS Presentation at Annual Conference of National Association of REALTORS Chicago, IL November 3, 2017
OVERVIEW OF RECENT/EXPECTED ECONOMIC/ HOUSING MARKET CONDITIONS
 OVERVIEW OF RECENT/EXPECTED ECONOMIC/ HOUSING MARKET CONDITIONS STRONG ECONOMIC FUNDAMENTALS *BUT* EXTRAORDINARY SHORT-TERM FACTORS RESULTING IN MAJOR SHIFTS IN TYPES OF HOUSING PRODUCTS AND GEOGRAPHICAL
LUXURY MARKET REPORT. - January
 LUXURY MARKET REPORT - January 2018 - www.luxuryhomemarketing.com THIS IS YOUR LUXURY MARKET REPORT MAP OF LUXURY RESIDENTIAL MARKETS Welcome to the Luxury Market Report, your guide to luxury real estate
Has The Office Market Reached A Peak? Vacancy. Rental Rate. Net Absorption. Construction. *Projected $3.65 $3.50 $3.35 $3.20 $3.05 $2.90 $2.
 Research & Forecast Report OAKLAND METROPOLITAN AREA OFFICE Q1 Has The Office Market Reached A Peak? > > Vacancy remained low at 5. > > Net Absorption was positive 8,399 in the first quarter > > Gross
By several measures, homebuilding made a comeback in 2012 (Figure 6). After falling another 8.6 percent in 2011, single-family
. After falling another 8.6 percent in 2011, single-family") 2 Housing Markets With sales picking up, low inventories of both new and existing homes helped to firm prices and spur new single-family construction in 212. Multifamily markets posted another strong year,
2 Housing Markets With sales picking up, low inventories of both new and existing homes helped to firm prices and spur new single-family construction in 212. Multifamily markets posted another strong year,
National Housing Trends
 National Housing Trends 34% America s Choice of Best Long Term Investment 26% 17% 15% 6% Real Estate Stocks / Mutual Funds Gold Savings Accounts / CDs Bonds Gallup 2018 Housing Affordability 197 Index
Housing Price Forecasts. Illinois and Chicago PMSA, May 2018
 Housing Price Forecasts Illinois and Chicago PMSA, May 2018 Presented To Illinois Realtors From R E A L Regional Economics Applications Laboratory, Institute of Government and Public Affairs University
Greater Lansing Association of REALTORS Regional Economic Update HOUSING MARKET OUTLOOK FOR 2018
 Greater Lansing Association of REALTORS Regional Economic Update HOUSING MARKET OUTLOOK FOR 2018 Paul C. Bishop, PhD, CBE Vice President, Research NATIONAL ASSOCIATION OF REALTORS January 11, 2018 Today
CONTINUED STRONG DEMAND
 Rental Housing Although slowing, renter household growth continued to soar in 13. The strength of demand has kept rental markets tight across the country, pushing up rents and spurring new construction.
San Francisco Housing Market Update
 San Francisco Housing Market Update California Economic and Housing Market Outlook The national economy maintained a healthy growth rate in the first quarter of 2005 and appeared to be settling in for
San Francisco Bay Area to Santa Clara and San Benito Counties Housing and Economic Outlook
 San Francisco Bay Area to 2020 Santa Clara and San Benito Counties Housing and Economic Outlook Economic Forecast Summary 2017 Presented by Pacific Union International, Inc. and John Burns Real Estate
Multifamily Market Commentary December 2015 Single-Family Rental Sector Attracting Institutional Investment
 Multifamily Market Commentary December 2015 Single-Family Rental Sector Attracting Institutional Investment Prior to the Great Recession, the cratering of single-family home prices, and declines in the
San Francisco Bay Area to Napa County Housing and Economic Outlook
 San Francisco Bay Area to 019 Napa County Housing and Economic Outlook Bay Area Economic Forecast Summary Presented by Pacific Union International, Inc. and John Burns Real Estate Consulting, LLC On Nov.
Housing and Mortgage Market Update
 Housing and Mortgage Market Update Views from the Top Frank E. Nothaft Vice President and Chief Economist January 8, 2015 Summary: Housing & Mortgage Market Outlook for 2015 Interest rates expected to
Nothing Draws a Crowd Like a Crowd: The Outlook for Home Sales
 APRIL 2018 Nothing Draws a Crowd Like a Crowd: The Outlook for Home Sales The U.S. economy posted strong growth with fourth quarter 2017 Real Gross Domestic Product (real GDP) growth revised upwards to
Ventura County. Economic Profile. November 2008
 Ventura County Economic Profile November 2008 The copyright laws of the United States (Title 17 U.S. Code) forbid the unauthorized reproduction of this report by any means, including facsimile or computerized
WESTCHESTER COUNTY MARKET OVERVIEW AND DEVELOPMENT TRENDS
 WESTCHESTER COUNTY MARKET OVERVIEW AND DEVELOPMENT TRENDS PACE LAND USE LAW CENTER ANNUAL CONFERENCE PRESENTED BY: WILLIAM V. CUDDY, JR. December, 2017 PAGE 0 MULTIFAMILY RESIDENTIAL AND ECONOMIC DEVELOPMENT
Market Trends and Outlook
 Residential Remodeling Market Trends and Outlook Kermit Baker Remodeling Futures Conference April 3, 2012 Remodeling Market Overview 1. Home improvement spending totaled an estimated $290 billion last
Metropolitan Indianapolis Board of REALTORS. Broker/Owner Meeting March 14, 2007
 Metropolitan Indianapolis Board of REALTORS Broker/Owner Meeting March 14, 2007 Tom Renkert Information Services Director MIBOR PropertyLinx 2 Implementation Time Line February 1-28 March 1 June 30 July
Housing Price Forecasts. Illinois and Chicago PMSA, July 2016
 Housing Price Forecasts Illinois and Chicago PMSA, July 2016 Presented To Illinois Association of Realtors From R E A L Regional Economics Applications Laboratory, Institute of Government and Public Affairs
Western Economic Developments
 IN THIS ISSUE F E D E R A L R E S E R V E B A N K O F S A N F R A N C I S C O Western Economic Developments Office market slumps, housing demand remains strong in District Figure, panel B: Commercial office
REALTOR.COM MARKET OUTLOOK
 REALTOR.COM MARKET OUTLOOK Realtor.com Economics January 2019 2019 Move, Inc. All rights reserved. Do not copy or distribute. AGENDA Economic and housing data and insights from realtor.com National Forecast
Housing Price Forecasts. Illinois and Chicago PMSA, March 2019
 Housing Price Forecasts Illinois and Chicago PMSA, March 2019 Presented To Illinois Realtors From R E A L Regional Economics Applications Laboratory, Institute of Government and Public Affairs University
INDUSTRIAL QUICK STATS SUMMARY & OUTLOOK MARKET TRENDS VACANCY & NET ABSORPTION ECONOMIC STATS. Current Quarter. Direct Vacancy 2.
 ORANGE COUNTY INDUSTRIAL SECOND QUARTER 218 QUICK STATS Direct Vacancy 2.2% Overall Vacancy 2.5% Lease Rate NNN $.95 Gross Absorption Under Construction MARKET TRENDS Current Quarter 2,956,71 SF 1,367,18
Housing Price Forecasts. Illinois and Chicago PMSA, August 2016
 Housing Price Forecasts Illinois and Chicago PMSA, August 2016 Presented To Illinois Association of Realtors From R E A L Regional Economics Applications Laboratory, Institute of Government and Public
HOUSING REPORT WASHTENAW SEPTEMBER 2018
 WASHTENAW SEPTEMBER 2018 Washtenaw County Recovery Run How Much Longer? This month marks the 10-year anniversary of the market peak prior to the burst of the housing bubble. The nationwide median home
Housing Price Forecasts. Illinois and Chicago PMSA, April 2018
 Housing Price Forecasts Illinois and Chicago PMSA, April 2018 Presented To Illinois Realtors From R E A L Regional Economics Applications Laboratory, Institute of Government and Public Affairs University
Multifamily National Report. February 2019
 Multifamily National Report February 2019 Multifamily Growth: No Signs of Slowing U.S. multifamily rents rose $2 in February to $1,426 and year-over-year growth remained at 3., as January was revised upward
INLAND EMPIRE REGIONAL INTELLIGENCE REPORT
 INLAND EMPIRE REGIONAL INTELLIGENCE REPORT June 2016 EMPLOYMENT After a slow start to 2016, the Inland Empire s labor market returned to form, in recent job figures. Seasonally adjusted nonfarm employment
SE Michigan Residential Real Estate Recovery Are we there yet or is it over?
 SE Michigan Residential Real Estate Recovery Are we there yet or is it over? Changing View of Residential Transactions Changing View of Residential Transactions 2015 Short Sales 3% Leases Bank 11% Owned
STRENGTHENING RENTER DEMAND
 5 Rental Housing Rental housing markets experienced another strong year in 2012, with the number of renter households rising by over 1.1 million and marking a decade of unprecedented growth. New construction
LUXURY MARKET REPORT. - February
 LUXURY MARKET REPORT - February 2018 - www.luxuryhomeing.com THIS IS YOUR LUXURY MARKET REPORT MAP OF LUXURY RESIDENTIAL MARKETS Welcome to the Luxury Report, your guide to luxury real estate market data
Positioned for Performance. j u n e Fine Arts Building Berkeley, CA
 Positioned for Performance j u n e 2009 Fine Arts Building Berkeley, CA Trump Place New York, NY 180 Riverside Equity Residential has a portfolio of high-quality assets focused in high-growth markets where
National Association of REALTORS COMMERCIAL REAL ESTATE OUTLOOK: 2015.Q3
 National Association of REALTORS : 2015.Q3 Commercial Real Estate Outlook: 2015.Q3 Download: www.realtor.org/reports/commercial-real-estate-outlook 2015 NATIONAL ASSOCIATION OF REALTORS All Rights Reserved.
Housing Price Forecasts. Illinois and Chicago PMSA, August 2017
 Housing Price Forecasts Illinois and Chicago PMSA, August 2017 Presented To Illinois Realtors From R E A L Regional Economics Applications Laboratory, Institute of Government and Public Affairs University
2017 Mid-Year Residential Real Estate Update Boise Regional REALTORS July 20, 2017 Mid-Year Residential Real Estate Update
 2017 Mid-Year Residential Real Estate Update 2017 Boise Regional REALTORS y 20, 2017 In 2015, Ada County surpassed $2 billion in total dollar volume sold. The first year since 2006. 2017 Boise Regional
Housing Price Forecasts. Illinois and Chicago PMSA, March 2016
 Housing Price Forecasts Illinois and Chicago PMSA, March 2016 Presented To Illinois Association of Realtors From R E A L Regional Economics Applications Laboratory, Institute of Government and Public Affairs
Multifamily Outlook 2016
 Executive Summary Demand for multifamily rental housing was higher than expected in 2015, absorbing much of the newly completed supply. Therefore, vacancy rates remained low and rents continued to rise
GROWING DIVERSITY OF RENTER HOUSEHOLDS THE STATE OF THE NATION S HOUSING 2012
 5 Housing Renter household growth surged in 11, spurred by the decline in homeownership rates across most age groups. With vacancy rates falling and rents on the rise, returns on rental property investments
Economic and Housing Update
 Economic and Housing Update Mark Palim Vice President, Applied Economic and Housing Research Fannie Mae January 14, 2015 2012 Fannie Mae. Trademarks of Fannie Mae. Economic Activity Rebounding Solidly
The state of the nation s Housing 2011
 The state of the nation s Housing 2011 Fact Sheet PURPOSE The State of the Nation s Housing report has been released annually by Harvard University s Joint Center for Housing Studies since 1988. Now in
Housing Price Forecasts. Illinois and Chicago PMSA, January 2019
 Housing Price Forecasts Illinois and Chicago PMSA, January 2019 Presented To Illinois Realtors From R E A L Regional Economics Applications Laboratory, Institute of Government and Public Affairs University