Market Study. Sevier County Housing Needs Sevierville Pigeon Forge Gatlinburg Sevier County
|
|
|
- Quentin Ross
- 6 years ago
- Views:
Transcription
1 Market Study Sevier County Housing Needs Sevierville Pigeon Forge Gatlinburg Sevier County Prepared For: Mr. Allen Newton Executive Director Sevier County Economic Development 321 Court Ave Sevierville, TN Prepared By: Hodges & Pratt Company, P.C Coleman Road Knoxville, TN Effective Date of Conclusions: March 1, 2017 Date of Report: May 25, 2017


2 Hodges and Pratt Company, PC 1528 Coleman Road Knoxville, Tennessee P: F: May 25, 2017 Mr. Allen Newton Executive Director Sevier County Economic Development 321 Court Ave Sevierville, TN RE: Market Study Sevier County Housing Needs Assessment - Sevierville - Pigeon Forge - Gatlinburg - Sevier County Dear Mr. Newton, In accordance with your request, I have compiled the necessary data to complete the attached market analysis relative to the above referenced areas. In preparing this study, I have assembled data relative to the local economic trends, analyzed pertinent demographics, and surveyed the competitive multifamily market to include information on the identified scope of work discussed. The effective date of this analysis is March 1, The following report has been prepared as a market study that takes into account the standards of the National Council of Housing Market Analysts (NCHMA) along with the standards and ethics of the Appraisal Institute. It is my understanding that the intended use of this market study is to aid the client in understanding the local market in efforts to help relieve some pressure on housing demands. The objective of this report is to gather, analyze, and present as many market components as reasonably possible. The data and suggestions contained in this report are based upon the best judgments of the analyst; I make no guarantees or assurances that the projections or conclusions will be realized as stated. It is my intent to provide my best effort in data collection and to express opinions relative to conclusions based on analysis of the data herein. There appears to be significant demand for new units in this market; both market-rate and affordable product. The lack of new multifamily housing supply added to the market coupled with the recent wildfire event has caused a need for additional housing units. As documented in the report, there are barriers to entry for new projects to include the high price of land, availability of services, and the current rent/income levels of those residing in the market. The attached document can be broken down into three sections: an Executive Summary (pages 1-6), body of the report/analysis (pages 7-102) and the Addenda with supporting documents. I appreciate this opportunity to be of service. If additional information or explanation is necessary, please contact me. I look forward to the opportunity of continuing to serve your consulting needs in the future. Respectfully submitted, Nelson C. Pratt, MAI (Tennessee Certified General Real Estate Appraiser #CG-2754)
3 TABLE OF CONTENTS EXECUTIVE SUMMARY... 1 INTRODUCTION... 7 PURPOSE OF ANALYSIS... 7 SCOPE OF ANALYSIS... 7 ASSUMPTIONS AND LIMITING CONDITIONS... 8 DATE OF REPORT AND ANALYSIS... 8 DEFINITIONS & PROGRAMS... 9 Market-rate (Conventional) Apartments... 9 Low Income Housing Tax Credit (LIHTC) Section 8 Housing Workforce Housing FUNDAMENTAL MARKET ANALYSIS Step 1 - Property Productivity Analysis Step 2 - Market Delineation Step 3 - Forecast Demand Factors Step 4 - Supply Analysis (Survey and Forecast Competitive Supply) Rent Required for New Construction Substandard Households Rent Overburdened Affordability Utility Usage Step 5 - Analyze the Interaction of Supply and Demand Step 6 - Forecast Subject Capture Rate SUPPLY ANALYSIS OF THE SINGLE FAMILY MARKET CURRENT MULTI-FAMILY LAND INVENTORY TRAILERS AND MOBILE HOME COMMUNITIES STUDENT HOUSING PROJECTS Foreign Student Visa Population (J-1) AREA DATA ZONING CURRENT RENTAL SUPPLY Market Rent Analysis Conventional Units Market Rent Analysis LIHTC Units OCCUPANCY Turnover Rates Waiting Lists DEMAND BY UNIT TYPE AVERAGE SQUARE FOOTAGE CONCESSIONS SAMPLE OF NEWSPAPER ARTICLES TYPICAL EQUITY REQUIREMENTS SUMMARY AND CONCLUSIONS CERTIFICATION ADDENDA List of Items Shown in Following Page
4 Checklist of Items for Report ESRI / STDB Online Demographic Data AMI Rent Levels Utility Allowances for Sevier County Demand Calculations Conventional Affordable THDA Checklist for Market Studies THDA 2017 QAP Amendments for Sevier County (draft format) Incentive Programs/Sources Housing Trust Fund (HTF) Federal Home Loan Bank FEMA Community Investment Tax Credits (CITC) Community Development Block Grant (CDBG) Entitlement Program Home Funding Program Urban Land Institute (ULI) Terwilliger Center for Housing THDA Newsletter Qualifications of Analyst
5 EXECUTIVE SUMMARY Client Location Sevier County Economic Development Council Sevier County, Tennessee to include the Cities of Sevierville, Pigeon Forge and Gatlinburg Summary of Conclusions Market Areas: Rent Growth: Demand: Supply: Current Occupancy: Total Net Demand Sevier County for Workforce/Conventional Units: Summary Sevier County Demand 60% AMI Affordable Units Sevierville, Pigeon Forge, Gatlinburg, Sevier County Slow Increasing; pent-up demand believed to be in place for years Needs include conventional market-rate, affordable, workforce and seasonal employment housing There is also believed to be pent-up employment demand as there are reported to be unfilled jobs, due in part, to the lack of housing. The exact number of unfilled jobs is unknown, but reported to be an issue in the market. Insufficient new supply; see body of report 99.6% (conventional excluding Seymour) 97.8% (LIHTC) 100% (Section 8) 1,500 to 2,000 units total in Sevier County; spread amongst the cities and County 1,000 to 1,500 of those units in Sevierville/Pigeon Forge/remaining areas of County 350 to 500 of those units in Gatlinburg The local market has experienced a shortage of new rental housing stock for a number of years. The primary reasons for the lack of new supply to the market are a combination of below average income levels, low price points in rent, high land values associated with the tourism market, lack of available services and transportation, and the topography of the sites that are reasonably affordable. The recent wildfire event that occurred has exposed and intensified the housing issues as many of the structures served as rental housing units. There is believed to be demand present for a variety of housing price points. 800 to 1,000 units. While there is a clear need for units at this AMI level, it is unlikely this many units would be funded through THDA and the LIHTC program. As noted later in this report, there were six (6) projects that submitted an application for the 2017 round. Estimates of the housing needs have been included herein with some ranges. There is clearly a margin of error when dealing with a market that has experienced limited new supply on how the market will react to new product. As discussed within this report, price points are believed to be a driving force as the rents in the area have historically been below other areas in the region. The analysis is based on five years of growth, while a typical site specific study would analyze a threeyear period. However, based on the lack of new supply and vacancy rates, a five-year analysis is considered appropriate for this market. Given the distances and corporate limits of the various Cities, the estimates have been allocated to Gatlinburg and the balance of the market in aggregate. This is due to the belief that a project in the County (close to the city limits of Pigeon Forge or Sevierville) would draw residents from various geographies. PAGE 1
6 Summary Points Market research demonstrates both pent-up and future demand for a variety of housing needs ranging from supportive housing to conventional housing. New supply has been limited in this market for years due, in part, to the high costs of land coupled the lack of available services in secondary locations. Rent levels have been lower than what would typically be required to make new development feasible. Occupancy in the market is very strong. As noted in the report, the occupancy rates surveyed were over 99%; which is a very strong sign of demand. The only vacant units discovered were those in the process of being turned over. There are 43.9% workers employed in the county that live outside the county. Having additional housing options in the county could potentially capture some of those currently living outside the County. We are aware that there are many in the workforce that are working double shifts or working two jobs. Specific numbers are unknown, but this is understood to be an issue in this market. During our research, it became evident that employers are expressing concerns about their ability to attract a quality workforce, due in part, to the lack of available housing. The lack of housing options has led to overcrowding of the available rental units. It has been discovered through the research of this assignment that many of renters, particularly the seasonal workforce, are living in substandard conditions. Many renters that would likely consider traditional rental housing units are currently living in substandard or overcrowded situations. Excess/net demand calculations were performed based on the anticipated household growth outlined in this report. Based on the data collected, there is believed to be demand present for low-income, workforce, and conventional housing units. Specific demand numbers are very difficult to estimate. In a normal calculation, new demand is mainly predicated on new household growth. In this market, however, much of the demand is pent-up and difficult to quantify given the conditions of the existing housing market. Another difficult component is to estimate how a market that has not experienced increases in supply would react. There is believed to be both a short-term and long-term housing need in the market. I believe that there should be caution against building a high number of low quality units to solve the short-term problem exasperated by the fires; which could lead to further issues in the future. An example would include a cluster of low quality, small sized units that would be obsolete or not desirable for potential residents. Many of the residents are living in substandard conditions, so building units without adequate plumbing and appliances would be less than desirable. Potential Local Incentives The following items outline potential financial incentives that could assist with new development. Some of these items could be directed towards mid- to large-scale projects along with some smaller duplex and four-plex style projects. While there is believed to be a need for complexes with scale, amenities, etc., incentivizing smaller scale development could also assist in providing some units at a lower price point. This would allow for developers to spread units amongst the various markets. PAGE 2
7 Revenue Side Supplement with project based vouchers administrators or subsidies from local government Since there is no housing authority that administers vouchers for the County, then it would be up to THDA to administer. Local officials could lobby for additional housing choice vouchers and project based vouchers. Any potential for local government to supplement rent gap with monies that could be invested and the returns could be used to supplement operations of a specific development. Operating Expense Side Payment in Lieu of Taxes (PILOT) Program Typically 10 years, freezes taxes at their current amount Would need to be conducted in conjunction with local government Low tax rate in Sevier County makes less of an impact than an area with a higher tax rate that would equate to a higher percentage of operating expenses Utilities Ongoing expenses given lower usage rates Tap fees, extensions either waived or at reduced rates Lowering or eliminating initial deposits for residents, which can be a barrier to entry Equity Component Land contributions Long-term ground leases on City or County-owned land Summary of Demand Components Hodges & Pratt has a professional membership to the National Council of Housing Market Analysts (NCHMA). The NCHMA has two definitions of demand; one in terms of overall market demand and one in terms of project specific demand. Because there is no specific project addressed with this market analysis, the report will focus on the overall market demand. NCHMA defines overall market demand as: Market demand is not project specific and covers all renter households and income levels. Components of demand vary and can include household growth; turnover, those living in substandard conditions, rent over-burdened households, and demolished housing units. Below are NCHMA s list of Factors to Consider in Analyzing Demand. Factors to Consider in Analyzing Demand Household Growth: A market area must be able to provide sufficient units to accommodate both its existing households, newly forming households and in-migrating households. If the existing housing stock does not contain an adequate supply of units, the construction of new units is necessary to accommodate household increase. In this market, there has been positive household growth to justify new construction of units. However, it is believed that the largest demand driver is present in the pent-up demand noticed in the substandard housing issues identified herein. PAGE 3
8 Units in Pipeline: Projects that are planned or under construction will increase the existing supply and may affect market equilibrium. The units in the pipeline include the off-line units that will be renovated and returned to the market, as well as unstabilized project that are in lease-up. New supply has been limited in the market based on the factors noted herein. There has been an increase in both interest and applications to the various planning departments in recent months as the market appears to be reacting to the wide-spread publicity of the housing needs. Vacancy Rates: Rental markets with high vacancy rates may reflect an oversupply of available housing. The overall health of the rental market may impact the ability of a proposed development to reach stabilization, despite strong demand estimates and properly positioned rents. Older developments may offer significant incentives to compete with a new rental property. Income qualified renters may be unwilling to pay more for higher quality housing. The overall vacancy rate surveyed in this market is approximately 1%. This amount is well below what is being experienced in other markets. General market equilibrium is typically estimated around 5%. So, this is evidence of the pent-up demand in the market. Refer to page 91 of the report for vacancy statistics. Substandard Housing Conditions: The characteristics of a primary market area s rental inventory can be a source of demand. Below average unit conditions or obsolete unit designs can produce a pent-up demand for new units to replace the older housing stock. This is one of the primary keys for the local market. There is a significant portion of the market that is living in substandard housing conditions that are either not up to code or overcrowded. Trends for this type of conditions are primarily centered around motels. A variety of rental housing units in the market are overcrowded due to the lack of supply. Unit Replacement: Units can be removed from the rental inventory for a number of reasons, including natural disaster, eminent domain, condemnation, abandonment, or demolition, unit consolidation, and conversion to non-residential use. Replacement of existing units can be a major cause for residential construction, especially in established communities with limited vacant land available for development. Given the wildfire event of 2016, there is a significant need for unit replacement. As noted herein, there were approximately 2,500 structures lost; which accounted for approximately 232 rental units that included weekly rental motels. The actual number of renters is unknown given the overcrowding of some of these units. Absorption Levels: A market area s performance in adding and filling additional units is often a better gauge of its ability to accommodate additional units than household growth, especially in an area with a stable or declining population or an aging housing stock that does not satisfy needs or expectations of current residents. There has been a limited amount of new product to absorb. The most recent development in the market reportedly leased up at a rate of approximately 12 units per month. This is a reasonable rate, but below average for the region. This may suggest that the need for the upper end of the market is present, but not as overwhelming as the vacancy would indicate. Market Balance: Demand for new units comes from household growth as well as from pent-up demand due to a lack of available and affordable housing and/or substandard housing. Pent-up demand is often illustrated by very low vacancy rates. If the number of new units that are planned or under construction exceeds the Primary Market Area s (PMA s) historic rental housing absorption levels or its projected levels of renter household growth, the completion of all the units in the PAGE 4
9 development pipeline could temporarily oversaturate the market and lead to rising vacancy levels and declining rents. A PMA is generally defined as the area in which a complex will draw a majority of its residents. Given the demand that is apparent, there does not appear to be oversaturation based on the number of units in the pipeline. The lack of available affordable housing was present before the wildfire. Now, the issues has been exasperated. Market Segmentation: Household growth, job growth, and residential constriction do not necessarily occur evenly throughout all income ranges. The need for additional units can be limited to specific price ranges or market niches. In this market, it is believed that demand exists for conventional, affordable, and workforce housing. Based on the income levels in the market, there appears to be more need for affordable and workforce housing. Number of Potential Income Qualified Households: The primary area, in nearly all cases, must contain a sufficient number of households who meet the occupancy restrictions of a proposed project. If it does not, the planned project will not succeed unless it can attract households from supplemental sources, such as homeowners or persons living outside the market area who would not otherwise move. There are adequate households in place to support additional affordable/workforce housing. One underlying issue is that employers are having a difficult time attracting new workers from outside the area due to the availability of housing options. Unit Distribution: Demand, as measured by both the number of potential qualified renters as well as reported occupancy rates within the primary market area, can vary significantly by unit type. As documented, there is a very high percentage of two-bedroom units in the market. However, vacancy rates are low for all types and income levels. AMI Distribution: A planned project may have a few units targeted to a very high or very low income groups. In such cases, measuring the number of income-qualified households within the entire target income band can severely overstate the number of potential income-qualified renters. Given the low income levels in the area, there is a higher percentage of income-qualified households below 60% AMI that would qualify for affordable housing. Turnover: Not all income qualified tenants will necessarily move into a project. An estimate of what percentage of tenants would actually move can give a more realistic estimate of how existing tenants will be moving to a different unit during a planned project s lease-up period. Turnover has been limited in the market. Many residents have been in place for a number of years. The lack of turnover is attributable to both low price points and lack of new supply. Affordability: LIHTC projects are targeted to low- to moderate-income households, but charge fixed rents. Unless a planned project has project-based rental assistance or a tenant has a Housing Choice Voucher, each tenant must have sufficient income to pay the proposed rents. In many cases, tenants who pay an excessive amount of their income for rent do not have enough income to occupy the planned project. The use of HCV s in this market could enhance the marketability of these types of units. Housing Choice Vouchers: Can provide supplemental demand for units. Vouchers can allow otherwise non-income qualified tenants to occupy planned units, especially in communities where PAGE 5
10 rents exceed Housing Payment Standards, units do not meet Housing Quality Standards, landlords do not participate in the voucher program, and/or housing authorities have unused vouchers. These vouchers could help to bridge the gap for landlords as well given the low rent levels present in the market associated with the 60% Area Median Income (AMI) rents. The AMI levels for Sevier County are outlined within the Addenda. Market Saturation: If the primary market area already has units that serve a large percentage of the planned project s target income group, there may enough unserved households to fill another planned tax credit project without adverse impact on the occupancy levels of existing LIHTC projects. This is not applicable to this market. Location: A site s adjacent land uses, neighborhood characteristics and/or surrounding land uses may attract or prevent renters from moving to the site. Proximity to highways, services, and transportation are key components in this market. Proposed Rents: Demand estimates indicate the number of households able to pay the proposed rents, not their willingness to do so. If the proposed rents are not properly positioned based on site location, project design, unit size, and amenities, income qualified households may not lease the proposed units. Price point is a key factor in this area. While there is a significant need for housing, there is a percentage of the market that could not either afford or be willing to pay the market rent necessary to justify new construction. PAGE 6
11 INTRODUCTION The Sevier County Economic Development Council was tasked to address the housing needs of Sevier County and the three cities outlined in this report. The board has engaged Hodges & Pratt Co. to conduct a market study that addresses the scope of work items noted within this report. The purpose of this assignment is to assess the market characteristics of Sevier County, Tennessee and also to outline the housing needs. An analysis was conducted of the subject s overall market conditions, neighborhood and regional characteristics, and supply and demand factors. The scope of work herein includes an analysis of the area s economy, a demographic analysis as it pertains to the area, an analysis of area housing, and a field survey of apartments discussed in the market. In an effort to familiarize ourselves with the local market conditions, surveys were conducted with numerous property managers and real estate professionals that have experience in this market. The U.S. Census, local municipalities, American Community Survey (ACS), and STDB/ESRI provided historical and projected population and household data as well as income and renter-occupied percentages. PURPOSE OF ANALYSIS The purpose of this study is to analyze market demand and characteristics for the local market. In addition to discussion of the housing needs, information on current housing stock has been addressed. It is my understanding that this report will be utilized in conjunction with planning by the local municipalities as they look to incentivize development to the market. This analysis represents the best available attempt to identify the current market status and future market trends with respect to the client s development objectives and consequently has been developed to determine the current market s needs. Therefore, the conclusions in this study are applicable only to the market identified herein, and only for the potential uses for that site described to me by the client. The intended user of this report is The Sevier County Economic Development Council. Publication of this document to a media outlet or use of the report for any other use or user is prohibited. SCOPE OF ANALYSIS This report communicates the pertinent data and conclusions developed during my analysis. Data was compiled from numerous sources in addition to materials retained in my files from prior projects. Below outlines the scope of work noted in the employment agreement. The body of the report addresses these items along with other pertinent demographics and statistics. - Supply analysis of the multifamily market - Demand analysis for rental housing based on historical and projected household growth - Supply analysis of the single family market - Discussion of how trailers and mobile home communities are meeting existing needs - Discussion of the substandard housing issues in the market, such as hotels and cabins that are not winterized, etc. - Discussion of the various Cities, locations, and commuting patterns - Discussion of the unfilled jobs and their potential impact on new housing for recruitment - Definitions of various types of multifamily housing to include conventional/market-rate, affordable (Low Income Housing Tax Credit - LIHTC), subsidized (Section 8), and public housing - Illustrate the items utilized in determining a LIHTC market study for Tennessee Housing Development Agency (THDA) - Affordability discussion and how that impacts the rent levels - Occupancy rate analysis of the existing local inventory along with some of the surrounding markets in which current employees may reside and commute - Absorption rates of the newest product in the local and surrounding markets PAGE 7
12 - Rental rate analysis - Individual write-ups of the existing multifamily properties (retained in the workfile) - Survey of student housing projects and discussion how the rents are typically leased by the bedroom - Historical and current development patterns - Descriptions of the area characteristics to include demographic analysis of population growth, household growth, and industry. Consideration would be given to several geographies to include City, County, Zip Codes, Drive Times and Census Tracts - Discussion of various cities, locations and commuting patterns. This could include transportation issues for workers. - Survey of student housing projects and discussion how the rents are typically leased by bedroom. Include an evaluation of J1 students needs with the J1 student providers. - Add a discussion about how many in the workforce are working double shifts or working two jobs. - Sample the needs of small business as it relates to workforce housing by conducting surveys. ASSUMPTIONS AND LIMITING CONDITIONS 1. Possession of this report, or a copy thereof, does not carry with it the right of publication. It may not be used for any purpose by any person other than the party to whom it is addressed without the written consent of the appraisers, and in any event, only with proper written qualification and only in its entirety. 2. Information furnished by others is assumed to be true, correct and reliable. A reasonable effort has been made to verify such information; however, the analyst assumes no responsibility for its accuracy. 3. Neither all nor any part of the contents of this study, or copy thereof, shall be conveyed to the public through advertising, public relations, news, sales or any other media without written consent and approval of the appraisers. Nor shall the analyst, firm or professional organizations of which the analyst is a member be identified without written consent of the analyst. 4. Unless arrangements have been previously made, the analyst will not be required to give testimony or appear in court, with reference to the report in question, because of having performed this study. 5. Current and historical market conditions have been analyzed in anticipating trends pertinent to the date of this study. It should be noted however that unforeseeable changes in economic and market factors could dramatically affect the value estimate and conclusions herein. This includes shifts in the number of units that are delivered to the market. The analyst has estimated the number of units to be delivered, but this number is fluid and could change after the report is completed. 6. Acceptance and/or use of this report constitutes acceptance of the foregoing general assumptions and general limiting conditions. DATE OF REPORT AND ANALYSIS The effective date of the report is the date at which the estimate applies and establishes the market conditions that provide the context for the opinions. The date of the report reflects the issuance date of the report and indicates the perspective of the analyst on the market or property use conditions as of the effective date. The date of the report is May 25, 2017, which represents the final composition date of this document. The effective date of the report is March 1, 2017, corresponding with the updated date of demographics, surveyed comparables and discussion with the planning department. PAGE 8
13 DEFINITIONS & PROGRAMS Market-rate (Conventional) Apartments Market rent 1, as used in this report, is defined as follows: The most probable rent that a property should bring in a competitive and open market reflecting all conditions and restrictions of the lease agreement, including permitted uses, use restrictions, expense obligations, term, concessions, renewal and purchase options, and tenant improvements (TIs). Market-rate apartments, also referred to as conventional housing, refers to housing units that are not subject to any income restrictions or limitations. The landlord s attempt is to achieve that highest rent that can be achieved based on the quality, location, and amenities of the property. Income Levels Extremely Low Income (ELI) Households, as used in this report, is defined as follows: Households whose income is less than 30% of their area's HUD Adjusted Median Family Income (HAMFI). Very Low Income (VLI) Households, as used in this report, is defined as follows: Households whose income is less than 50% of their area's HUD Adjusted Median Family Income (HAMFI). Low Income (LI) Households, as used in this report, is defined as follows: Households whose income is less than 80% of their area's HUD Adjusted Median Family Income (HAMFI). Affordability & Availability Affordable Units, as used in this report, is defined as follows: An affordable unit is one in which a household at the defined income threshold can rent without paying more than 30% of its income on housing and utility costs. The most common affordable product that is available is known as a Low Income Housing Tax Credit (LIHTC) complex. Affordability of these units is set by individual properties with most being set a maximum of 60% AMI. The tax credit award that is issued by the state serves as an equity contribution and generally makes a deal financially feasible. Without the tax credits, development of an affordable project would like not be feasible. Affordable and Available Units, as used in this report, is defined as follows: A unit is both affordable and available if that unit is both affordable and vacant, or if it is currently occupied by a household at the defined income threshold or below. Fair Market Rent, as used in this report, is defined as follows: Fair Market Rent is the estimated amount of money a property with a certain number of bedrooms, in a certain area of the country, will rent for. Fair market rent is a gross rent estimate that includes the base rent, as well as any essential utilities that the tenant would be responsible for paying, such as gas or electric. It does not include non-essential utilities such as telephone, television, or internet. 1 The Dictionary of Real Estate Appraisal, 6 th Edition, Appraisal Institute, PAGE 9
14 Low Income Housing Tax Credit (LIHTC) The Low-Income Housing Tax Credit is a credit against federal income tax liability each year for 10 years for owners and investors in low-income rental housing. The amount of tax credits is based on reasonable costs of development, as determined by THDA, and the number of qualified low-income units. The tax credit rate is approximately four percent (4%) for acquisition costs, nine percent (9%) for rehabilitation and new construction costs, but only four percent (4%) if the development has federal subsidies or tax-exempt financing. The annual credit amount is the lesser of (i) the tax credit rate multiplied by average eligible costs for the number of low-income units or (ii) the amount determined by THDA to be needed to fill the gap between appropriate financing achievable and reasonable development costs. To be eligible, a development must have a minimum of either 20 percent of its units occupied by households with incomes no greater than 50 percent of area median income or 40 percent of its units occupied by households with incomes no greater than 60 percent of area median income. Developments must remain in low-income use for as long as 30 years with an initial 15- year term. States can allocate tax credits equal to a total of $2.20, plus the cost of living adjustment specified in Section 42(h)(3)(H) x Tennessee's population. For Tennessee, this provides approximately $14 million in tax credits each year. Volatility in pricing due to the pending corporate income tax rate. President Trump is proposing a rate of 15%, but most investors are planning for a rate of 20%. The uncertainty caused THDA to extend their deadline for applications from February 1, 2017 to May 1, Most participants indicate a reduction in pricing ranging from $0.08 to $0.12 with pricing quoted in the low to mid $0.90 range. Section 8 Housing Housing Choice Vouchers (HCV) o The Housing Choice Voucher (HCV) or Voucher program is a federal rental assistance program funded through the Department of Housing and Urban Development (HUD) where very low-income individuals, families, the elderly and the disabled receive assistance to afford decent, safe and sanitary housing in the private market. As the leading state housing agency, THDA administers the Housing Choice Voucher program in 72 Tennessee counties, between 4 regional offices. An additional 50 HCV were made available to Sevier County; refer to the recent Newsletter in the Addenda. PAGE 10
15 Project-Based Voucher (PBV) o The ability to get a project based voucher (PBV) would increase the revenue gap between feasible rent required to make a deal financially feasible and the maximum allowable LIHTC rent. The Section 8 housing choice voucher (HCV) program helps people with low income afford housing. The program is funded by the federal government and administered by local public housing authorities (PHAs). The project-based voucher (PBV) program is one part of the HCV program. It helps pay for rent in privately owned rental housing, but only in specific privately owned buildings or units. That means that if you get a project-based voucher, you don t get to choose the specific unit you live in. If a tenant qualifies for the PBV program, they will end up spending 30% of your income on housing and the public housing authority will pay the balance. Workforce Housing The U.S. Department of Housing and Urban Development (HUD) defines workforce housing as housing that is affordable to households earning between 80 and 120 percent of Area Median Income (AMI). For example, the Nashville Downtown Partnership s Workforce Housing Task Force defines workforce housing as affordable housing designated to households earning between 80 and 150 percent of AMI. For the purpose of this report, workforce housing is generally referred to as being between 80 and 100 percent of AMI. PAGE 11


16 Urban Land Institute (ULI) Terwilliger Center for Housing The ULI Terwilliger Center for Housing was established in 2007 with the mission to facilitate a full spectrum of housing, with a focus on workforce housing and affordable housing. The Center achieves this mission through research and publications. The Center has found, as told in the publication Bending the Cost Curve, that while there is a large and growing demand for affordable rental housing, the supply is too low. According to this publication, the reason for this low supply is the extra cost related to regulations and providing amenities and services, along with funding issues. The key solution to reducing costs is collaboration, which would require multiple stakeholders and developers to build and provide affordable rental housing. The ULI also published The Macro View on Micro Units to evaluate the market performance and acceptance of micro units. A micro unit is typically defined as a small studio apartment less than 350 square feet, that has a fully functioning kitchen and bathroom. Research done by ULI found that micro units tend to outperform conventional units in terms of occupancy and rent per square foot. This performance could be due to low supply of micro units. The market for these smaller units is mostly young professional singles. Below are plans showing a typical micro unit: PAGE 12
17 FUNDAMENTAL MARKET ANALYSIS This section outlines the typical basis considered for a site specific market study. Since this report does not address a specific site, there are parts of this six-step process that are not applicable. However, the information is shown as an illustration of the items that would be taken into consideration for a site specific market study. Additionally, the items that do pertain to this study have been included within their respective section. The fundamental market analysis for a specific property is typically analyzed in a six-step process as outlined herein. Reference is made to the Market Analysis for Real Estate, Second Addition, by Stephen F. Fanning, MAI. This book, published by the Appraisal Institute, is the source of the six-step process utilized. Step 1 - Property Productivity Analysis 1.1. Legal Attributes of the Property Zoning of a specific site would be taken into consideration for an individual development. Factors such as density, setbacks, etc. would be based on the specific zoning. Bonus densities and inclusionary zoning (IL) could be implemented as an incentive for development Physical Attributes of the Property Physical attributes of a specific site play a role in its viability. The size, shape, and frontage of the parcel would be taken into account. Proximity to major arteries is very important in the local market due to traffic and lack of public transportation. Topography has been an issue in the local market as many of the sites that would be at a reasonable price are too steep to be economically feasible. Many of the properties in the local market that have reasonable topography and access are priced above what a developer could reasonably pay for a multifamily site in this market. Within the productivity analysis of the actual improvements, consideration is given to the physical attributes of the property and how it compares to the competitive dataset. The following rating chart provides a summary of features of the complex as it relates to the market. The following table is a sample of how a specific project may compare to the market and rated. Sample Apartment Building Rating Inferior Typical Superior Impact on Productivity High Moderate Slight Average Slight Moderate High Design and appearance of property X Quality of construction (materials and finish) x Condition of improvements X Room sizes, layout, and mix X Closets and storage X Plumbing (adequacy and condition) X Electrical, technology, and appliances X Unit amenities X Project amenities (pools, fitness center, etc.) X Parking X Rating Conclusions Number of items Times category score Subtotal score Total subject score 55 Percentage above or (below) average 10% PAGE 13

18 1.3. Locational Attributes of the Property Consideration is given to the location attributes of the property to include the linkages to the neighborhood, supportive services, proximity to employment centers, and land use trends in the area. In this market, strong consideration is given to the proximity to major arteries as many of the renters do not have private transportation. PAGE 14
19 Overall Market Trends As noted, there is no published third party service that tracks historical trends in the local market. Consideration herein is given to the overall demographics of the market, occupancy rates, and rental data available. Refer to the household and population growth shown later in this section. Given the lack of new supply in the market, rent growth has been somewhat limited in the market, while occupancy rates have been very strong. Given the lack of housing options coupled with seasonal employment, the fundamentals for household growth lag behind other markets in this region. Vacancy As noted later in this report, there is virtually no vacancy in the market. Turnover rates are low and new supply is limited. The combined vacancy rate in the local market is less than one percent. Location Rating A location rating has been provided for the four areas noted herein. The competitive ranking is based on ten categories that rank each City versus the County. The higher the rating for an area reflects a higher score and stronger likelihood for development. The scoring system illustrates the highest score for rental housing for Sevierville; which is not surprising given that it reflects the highest concentration of supply in the areas. Please note this is a sample analysis that could vary from project to project based on location and targeted tenant base. Factor Rating Criteria Apartment Competitive Location Analysis Segment of Market Area County Sevierville Pigeon Forge Gatlinburg Rank by Importance 1 Proximity to existing development Public planning and development support for apartments Location in path of new residential growth Proximity to major roads ease of access and visibility (existing or approved) Reputation and prestige of area (social reputation, other crime in area, etc.) Proximity and ease of access to shopping centers (convenience and shopper goods) Proximity and ease of access to employment centers Aesthetics and natural features in area Proximity to entertainment and cultural areas (theaters, parks, golf, restaurants) Proximity and reputation of schools in area Total (Individual score times w eighting) Percentage of Total Scores 18% 30% 28% 24% PAGE 15

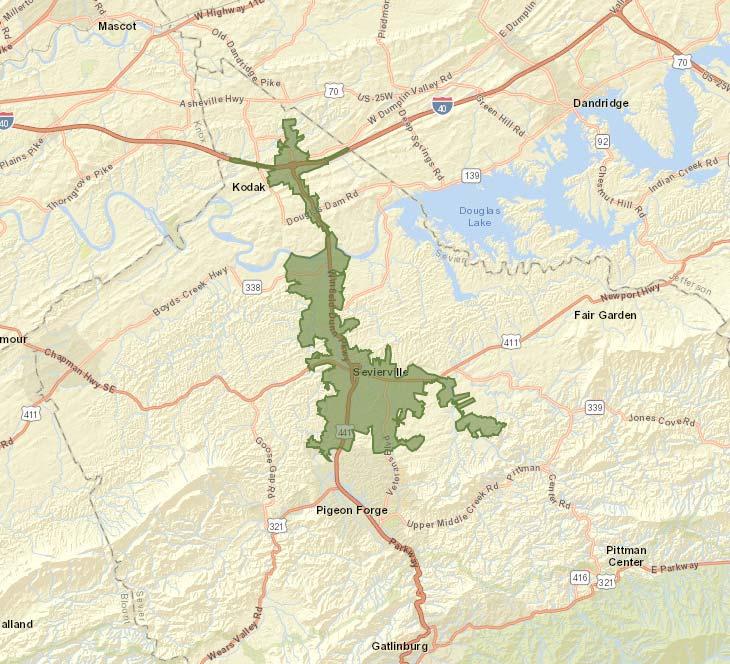
20 Step 2 - Market Delineation In order to analyze the demand and competitive ranking for the market area, it is necessary to delineate the area in which the subject will draw a majority of its tenants Boundaries of the Market Area In consideration of the natural and geographic boundaries of the market, as well as published sources, I have utilized Sever County, Sevierville, Pigeon Forge and Gatlinburg as the general boundaries for the primary market area. Approximate Boundaries of Primary Market Area as Drawn on SiteToDoBusiness Website Sevier County PAGE 16
21 Sevierville PAGE 17

22 Pigeon Forge PAGE 18

23 Gatlinburg PAGE 19

.")
24 Commuting Pattern Sevier County s population receives a slightly lower number of commuters from surrounding municipalities and counties than employees living in the county. In 2014, the amount of commuters working in the County while living in an outside area was 17,782, which is 43.9% of the employed population. A majority of those living in the County are also employed there (55.4%). The following chart illustrates the inflow and outflow of jobs in Sevier County. PAGE 20
25 2.2 Tenant Profile for the Subject Property and Neighborhood Since we are not focusing on a specific neighborhood, the data is reflect of the various cities. The charts below reflects an age, income, and housing breakdown of the population in Sevierville, Gatlinburg and Pigeon Forge. Age Distribution in Sevierville Age Distribution in Gatlinburg PAGE 21
26 Age Distribution in the Pigeon Forge As of the 2010 Census, the highest percentage of the population for Sevierville was in the age cohort, Gatlinburg was in the age cohort and Pigeon Forge was in the age cohort. Over the next five years, the average age of the population is increasing due to the aging of the Baby Boomers generation. In many markets, the largest segment of demand for high quality rental housing is coming from the Millennial generation. Those persons aged generally make up the largest segment of the rental market. A higher percentage of these persons are renting for a variety of reasons including, but not limited to, the ones outlined below. Rising student loan debt Lifestyle of convenience and mobility Increase in supply for high quality renting options High levels of amenities No maintenance Another source of demand is coming from the Baby Boomers. Many of these renters have chosen to downsize and enjoy the high quality finishes and mobile lifestyle offered by renting. Communities will continue to market to this segment as well given the percentage of the population they represent. This is being experienced in this market with the emergence of floor premiums as many tenants would pay a higher rent to avoid climbing stairs. Seasonal workforce provides a significant percentage of the need in the local market due to the nature of the economy. Income-Qualified Households Conventional Housing Income-qualified refers to confirming that a prospective tenant earns enough income to quality and therefore afford the rent. Typically, qualifying income levels for housing are established at approximately 30% to 35% of gross household income. This is based on the gross rent including any utility costs paid by the tenant. For purposes of this analysis, various income levels have been analyzed in order to consider various sectors of the market. The following segregations have been taken into consideration. PAGE 22
27 60% AMI Limits o AMI rents are based on the HUD-published income limits for Sevier County and are calculated based on 30% of the household income (adjusted for the size of the family). An allocation of 1½ persons per bedroom is utilized for the calculation. o Based on the 2016 HUD income limits and the subject s unit sizes (number of bedrooms), maximum monthly 60% rents under LIHTC guidelines (excluding tenant-paid utilities based on the typical utility allowances) are $440 per month for efficiency units, $474 per month for one-bedroom units, $572 per month for twobedroom units, $661 per month for three-bedroom units, $737 per month for fourbedroom units and $810 per month for five-bedroom units % AMI to reflect typical workforce housing o o o Based on the 2016 HUD income limits and the subject s unit sizes (number of bedrooms), maximum monthly 80% rents under LIHTC guidelines (excluding tenant-paid utilities based on the subject s utility allowances) are $621 per month for efficiency units, $668 per month for one-bedroom units, $804 per month for two-bedroom units, $930 per month for three-bedroom units, $1,037 per month for four-bedroom units and $1,141 per month for five-bedroom units. Based on the 2016 HUD income limits and the subject s unit sizes (number of bedrooms), maximum monthly 100% rents under LIHTC guidelines (excluding tenant-paid utilities based on the subject s utility allowances) are $801 per month for efficiency units, $861 per month for one-bedroom units, $1,036 per month for two-bedroom units, $1,198 per month for three-bedroom units, $1,336 per month for four-bedroom units and $1,471 per month for five-bedroom units. Given the rental rates in the market, the % AMI rents are generally reflect of the conventional rental market. As such, there is no distinction between the demand calculation for these units in the market. Conventional demand >$35,000 income Households with annual incomes below $35,000 are not included in the total demand numbers for Conventional housing as renter households within this demographic are not likely to qualify for residency in a conventional development based on the estimated monthly housing costs (market rents estimated later in this report + monthly utility costs). The rent levels for the units in this scenario would generally start at $875 per month to include utilities. This would equate to a minimum qualifying income of approximately $35,000 per year ($875/mo. X 12 months = $10,500/year 0.30 = $35,000). The following table outlines the projected income-qualified percentage over the study period. Based on this information, approximately 50.20% of the households in Sevierville would be income-qualified as of This number is expected to increase over the next five years to 56.70%. Approximately 48% of the households in Pigeon Forge would be income-qualified as of This number is expected to increase over the next five years to 55.70%. Approximately 55.90% of the households in Gatlinburg would be income-qualified as of This number is expected to increase over the next five years to 61%. Approximately 59.90% of the households in Sevier County would be income-qualified as of This number is expected to increase over the next five years to 65.40%. The increases over the next five years are due to the use of $35,000 as the base income level in 2021 with a maximum income of $100,000. The growths are considered appropriate given the historical rent growth in the market. PAGE 23
28 Trending of PMA Income Qualified Percentage Sevierville 50.20% 51.42% 52.67% 53.96% 55.27% 56.70% Pigeon Forge 48.00% 49.43% 50.90% 52.41% 53.97% 55.70% Gatlinburg 55.90% 56.88% 57.87% 58.88% 59.91% 61.00% Sevier County 59.90% 60.95% 62.02% 63.11% 64.22% 65.40% Step 3 - Forecast Demand Factors 3.1. Future Demand Conclusions Based on Growth Trends Total 2010 Census population for Sevierville was estimated at 14,807 and increased to a projected 15,968 by 2016 (1.26% annually). Over the previous decade, growth in population was at a rate of 2.05% annually for Sevierville. Sevierville s five-year projections from ESRI through 2021 reflect slower growth rates as compared to the previous time frames; this rate (1.10%) is projected by ESRI to be lower than the annual rate of the previous decade (2.05% annually) and previous five years (1.26%). As shown by the table below, Sevierville has the lowest population growth rate than Pigeon Forge, Gatlinburg and Sevier County. Total 2010 Census population for Pigeon Forge was estimated at 5,875 and increased to a projected 6,398 by 2016 (1.42% annually). Over the previous decade, growth in population was at a rate of 0.95% annually for Pigeon Forge. Pigeon Forge s five-year projections from ESRI through 2021 reflect higher growth rates as compared to the previous time frames; this rate (1.44%) is projected by ESRI to be higher than the annual rate of the previous decade (0.95% annually) and previous five years (1.42%). As shown by the table below, Pigeon Forge has the second highest population growth rate within Sevierville, Gatlinburg and Sevier County. Total 2010 Census population for Gatlinburg was estimated at 3,944 and increased to a projected 4,547 by 2016 (2.37% annually). Over the previous decade, growth in population was at a rate of 1.71% annually for Gatlinburg. Gatlinburg s five-year projections (2.03%) from ESRI through 2021 reflect higher growth rates as compared to the previous decade (1.71% annually) and lower growth rates than the previous five years (2.37% annually). As shown by the table below, Gatlinburg has the highest population growth rate within Pigeon Forge, Sevierville and Sevier County. Total 2010 Census population for Sevier County was estimated at 89,889 and increased to a projected 96,735 by 2016 (1.22% annually). Over the previous decade, growth in population was at a rate of 2.34% annually for Sevier County. Sevier County s five-year projections (1.28%) from ESRI through 2021 reflect lower growth rates as compared to the previous decade (2.34% annually) and higher growth rates than the previous five years (1.22% annually). As shown by the table below, Sevier County has the second lowest population growth rate within Sevierville, Gatlinburg and Pigeon Forge. Area Annual % Change Annual % Change Annual % Change Gross % Change Sevierville 12,063 14,807 15,968 16, % 1.26% 1.10% 5.67% Pigeon Forge 5,342 5,875 6,398 6, % 1.42% 1.44% 7.49% Gatlinburg 3,323 3,944 4,547 5, % 2.37% 2.03% 10.69% Sevier County 71,170 89,889 96, , % 1.22% 1.28% 6.61% Tennessee 5,689,283 6,346,105 6,698,359 7,010, % 0.90% 0.91% 4.66% Source: U.S. Census Bureau/STDB Projections Population Growth In 2010, there were 5,979 households in Sevierville. As of 2016, Sevierville had an estimated amount of 6,432 households and is forecasted by ESRI to increase to 6,792 by 2021 for an annual growth rate of 1.09% and a gross gain of 5.60%. PAGE 24
29 In 2010, there were 2,238 households in Pigeon Forge. As of 2016, Pigeon Forge had an estimated amount of 2,423 households and is forecasted by ESRI to increase to 2,597 by 2021 for an annual growth rate of 1.39% and a gross gain of 7.18%. In 2010, there were 1,681 households in Gatlinburg. As of 2016, Gatlinburg had an estimated amount of 1,917 households and is forecasted by ESRI to increase to 2,113 by 2021 for an annual growth rate of 1.95% and a gross gain of 10.22%. The Census data nor the ESRI projections took into account the wildfires. In 2010, there were 35,343 households in Sevier County. As of 2016, Sevier County had an estimated amount of 37,874 households and is forecasted by ESRI to increase to 40,297 by 2021 for an annual growth rate of 1.24% and a gross gain of 6.40%. The following chart summarizes historical and projected household growth based on U.S. Census information and projections for 2021 from ESRI. Household Growth Annual % Change Annual % Change Annual % Change Gross % Change Area Sevierville 5,112 5,979 6,432 6, % 1.22% 1.09% 5.60% Pigeon Forge 2,104 2,238 2,423 2, % 1.32% 1.39% 7.18% Gatlinburg 1,507 1,681 1,917 2, % 2.19% 1.95% 10.22% Sevier County 28,467 35,343 37,874 40, % 1.15% 1.24% 6.40% Tennessee 2,232,905 2,493,552 2,615,273 2,728, % 0.79% 0.85% 4.32% Source: U.S. Census Bureau/STDB Projections The above data indicates that the subject market area reflects growing population bases and that adequate demographic demand can be anticipated for developments of good quality housing units in the subject community. Given the shifts in tenure over the past several years, I also analyzed the renter-occupied household growth in these areas between 2010 and In many markets, a high percentage of the growth in recent years has been in the renter-occupied sector. However, this is not necessary the case in this market due to the lack of new supply. Renter-Occupied Household Growth Annual % Change Annual % Change Annual % Change Gross % Change Area Sevierville 2,267 3,045 3,224 3, % 0.95% 1.17% 6.05% Pigeon Forge 795 1,143 1,207 1, % 0.91% 1.73% 9.03% Gatlinburg % 2.54% 1.30% 6.70% Sevier County 7,599 11,060 12,898 13, % 2.56% 1.28% 6.59% Tennessee 670, , , , % 2.46% 0.89% 4.54% Source: U.S. Census Bureau/STDB Projections Demand Based on Apartment Construction Trends Building Permits Building permit activity for Sevier County is shown in the following graphs. The first graph displays all building permits in Sevier County. There was a spike in permitting activity from 2014 to 2015, all from single-family units. PAGE 25


30 The next chart displays the multifamily building permits for Sevier County. multifamily units permitted in 2013, 2014, and There were no Source: US Census The next table displays all single/two/three/four family permits in Sevier County. Permitting increased significantly in 2015 after less than 100 units were delivered annually from PAGE 26


31 Source: US Census For the single family permits and commercial permits, an additional source is cited. The Market Edge tracks building permit activity in various markets to include Sevier County. The chart below outlines Sevier County and the surrounding MSA. The numbers are generally consistent with those from the US Census website, but also include year-over-year percentage growth and 2016 numbers. The year-to-date permit activity reflects a 35% increase over the same time frame from PAGE 27

32 The year-to-date permit activity reflects a -28% decrease over the same time frame from PAGE 28
33 Conclusions Based on New Construction According to the information pulled from the US Census website; over the past ten (10) years, the County has averaged 133 units permitted per year. The peak number of units permitted was during 2006 when approximately 534 were issued. As can be seen by the lack of new product in the past three years, there is nominal multifamily building permit activity. Based on this information, coupled with the units in the due diligence stages of planning, there appears to be a barrier to entry in this market. According to our research, the barriers include high land costs and low rent levels. The pattern for single family permitting is generally consistent with other areas as the market reacted to the single family housing crisis. The data suggests there is increased confidence in the single housing market as permits appear to be stable with increases in the year-to-date permitting Demand Inferred by Rental Rate Trends There is little that can be gleaned by the rental rate trends since there is no historical tracking of the data. Information retained in our database indicates low to moderate rent growth, due in part to a lack of new, high quality product Demand Based on Historical Absorption The following charts depict area absorption rates in the immediate Sevier and Blount County markets. Summary of Absorption Rates Year No. of Units Complex Name Location Built Units Per Month The Overlook at Allensville Square Ph. I * Sevierville Camellia Trace at Mountain View Maryville The Reserve at Maryville Maryville Bridgeway Maryville Maryville The Ridge at Hamilton Crossing Alcoa The Cove at Creekwood Lenoir City Mean Median *See comments in narrative Note: During a previous survey with the management of The Overlook at Allensville Square Phase I, the absorption period was estimated at 7.5 units per month. However, since that survey, we have been informed by ownership that the absorption period for Phase I was closer to 12 units per month. The mean and median indicates for most markets in East Tennessee (excluding the chart above) is typically between 12 and 15 units per month. The below average absorption of Allensville Square may have been due to the high rent level as compared to the existing product in the competing market Conclusion Based on Absorption Trends The projects that have been built in Sevier and Blount County since 2003 reflect a mean absorption rate of 11.6 units per month and a median of 11.5 units per month. However, the actual absorption of Allensville Square is believed to be closer to 12 units per month. This amount is slightly lower than other areas in the region due to income levels of the residents and rent level experienced in this market. PAGE 29
34 3.2. Fundamental Analysis by Segmentation / Affordability Method Current and Projected Households The household growth as previously discussed is shown again below. As noted, Gatlinburg is outpacing the balance of the three cities in terms of historical and projected household growth percentage. Household Growth Annual % Change Annual % Change Annual % Change Gross % Change Area Sevierville 5,112 5,979 6,432 6, % 1.22% 1.09% 5.60% Pigeon Forge 2,104 2,238 2,423 2, % 1.32% 1.39% 7.18% Gatlinburg 1,507 1,681 1,917 2, % 2.19% 1.95% 10.22% Sevier County 28,467 35,343 37,874 40, % 1.15% 1.24% 6.40% Tennessee 2,232,905 2,493,552 2,615,273 2,728, % 0.79% 0.85% 4.32% Source: U.S. Census Bureau/STDB Projections Current and Projected Average Household Size The average household size in this market is increasing; which contradicts patterns in more urban markets. The following table was taken from the demographic information as published by ESRI. Household Size Growth Annual % Change Annual % Change Annual % Change Gross % Change Area Sevierville % 0.21% 0.08% 0.42% Pigeon Forge % 0.06% 0.08% 0.39% Gatlinburg % 0.14% 0.17% 0.85% Sevier County % 0.07% 0.00% 0.00% Source: U.S. Census Bureau/STDB Projections Housing by Unit Type In 2010, there were 3,045 renter-occupied households in Sevierville. As of 2016, Sevierville had an estimated amount of 3,224 renter-occupied households and is forecasted by ESRI to increase to 3,419 by 2021 for an annual growth rate of 1.17% and a gross gain of 6.05%. In 2010, there were 1,143 renter-occupied households in Pigeon Forge. As of 2016, Pigeon Forge had an estimated amount of 1,207 renter-occupied households and is forecasted by ESRI to increase to 1,316 by 2021 for an annual growth rate of 1.73% and a gross gain of 9.03%. In 2010, there were 718 renter-occupied households in Gatlinburg. As of 2016, Gatlinburg had an estimated amount of 836 renter-occupied households and is forecasted by ESRI to increase to 892 by 2021 for an annual growth rate of 1.30% and a gross gain of 6.70%. In 2010, there were 11,060 renter-occupied households in Sevier County. As of 2016, Sevier County had an estimated amount of 12,898 renter-occupied households and is forecasted by ESRI to increase to 13,748 by 2021 for an annual growth rate of 1.28% and a gross gain of 6.59%. Renter-Occupied Household Growth Annual % Change Annual % Change Annual % Change Gross % Change Area Sevierville 2,267 3,045 3,224 3, % 0.95% 1.17% 6.05% Pigeon Forge 795 1,143 1,207 1, % 0.91% 1.73% 9.03% Gatlinburg % 2.54% 1.30% 6.70% Sevier County 7,599 11,060 12,898 13, % 2.56% 1.28% 6.59% Tennessee 670, , , , % 2.46% 0.89% 4.54% Source: U.S. Census Bureau/STDB Projections Below is the renter-occupied housing distribution in this market. The percentages are calculated by dividing the number of renter-occupied household growth by the number of housing units. Households listed by the Census do not include vacant units while housing units include vacant units; which is why there is a difference in the renter occupied percentage. PAGE 30
35 Renter Occupied Housing by Year Area Gatlinburg 12.30% 12.10% 11.50% Pigeon Forge 22.00% 20.80% 20.80% Sevierville 39.20% 37.70% 37.40% Sevier County 19.80% 20.70% 20.30% Knoxville-Sevierville CSA 24.90% 27.30% 27.20% Tennessee 28.20% 31.00% 31.00% Source: STDB Data Households by Income Levels As previously discussed, approximately 50.20% of the households in Sevierville would be income-qualified as of This number is expected to increase over the next five years to 56.70%. Approximately 48% of the households in Pigeon Forge would be income-qualified as of This number is expected to increase over the next five years to 55.70%. Approximately 55.90% of the households in Gatlinburg would be income-qualified as of This number is expected to increase over the next five years to 61.00%. Approximately 59.90% of the households in Sevier County would be income-qualified as of This number is expected to increase over the next five years to 65.40%. The increases over the next five years are due to the use of $35,000 as the base income level in Trending of PMA Income Qualified Percentage Sevierville 50.20% 51.42% 52.67% 53.96% 55.27% 56.70% Pigeon Forge 48.00% 49.43% 50.90% 52.41% 53.97% 55.70% Gatlinburg 55.90% 56.88% 57.87% 58.88% 59.91% 61.00% Sevier County 59.90% 60.95% 62.02% 63.11% 64.22% 65.40% Frictional Vacancy in the Market There are several sources of frictional vacancy and demand that can impact a market. The three types of additional demand generally come from move-up demand, latent demand, or nonresident demand. Move-up demand is generated by the upward mobility of lower-income households. This could be present in the market as there has been a lack of quality product added to the market over the past several years. Latent demand, also known as pent-up demand, typically results from underbuilding in an area or not building a type of unit that is in demand. One sign of current pent-up demand would be the absorption rates of the most recent product coupled with the very low vacancy rate. Nonresident demand is demand from tourist and residents of second homes. Seasonal housing demand is believed to be present in this market. It is our understanding that demand exists from employers that would like to offer their seasonal housing additional options. PAGE 31
36 3.3. Reconciled Forecast of Demand The estimate of the forecasted apartment demand by the segmentation method is believed to be the most applicable method for the subject market. This information has been carried forward to the residual demand calculation shown later in this section. Step 4 - Supply Analysis (Survey and Forecast Competitive Supply) 4.1. Existing and Anticipated Competitive Supply For this part of the analysis, I have identified the current inventory of existing apartment units in Sevier County, Sevierville, Pigeon Forge and Gatlinburg. I have also quantified the number of units that are under construction and planned for development. It is noted that this number is fluid and will likely evolve. Reference is made to the preceding charts along with the average rental rates shown in the report. All Conventional Pipeline in the County In Lease-up (not stabilized) General Location Units Remaining Under Construction 0 Total Units Under Constr. Ober Gatlingburg Housing Project Gatlinburg 27 Allensville Phase II Sevierville 144 Total 171 Due Diligence Planning Stages Total Units Planned Duplex Development Pigeon Forge 22 Apartment Complex Pigeon Forge 128 Ski Mountain Road Project Gatlinburg 22 Multi-story workforce housing Sevierville N/A Mixed rate including some micro units and market rate Sevierville N/A Less expensive apartments Sevierville 20 Workforce housing (approved and zoned) construction cost prohibitive Sevierville N/A Mixed rate development annexed into city with workforce housing Sevierville N/A Total 192 TOTAL ALL UNITS 363 There is one project that is currently under construction in Gatlinburg along with one in the planning stages. These projects combine for a total of 49 units. In addition to these projects, I am aware of two additional projects that are in the planning stages located in Pigeon Forge. These projects combine for a total of 150 units. There is one project under construction that I am aware of in Sevierville; Allensville Square Phase II. Under construction: Ober Gatlinburg housing project consisting of 27 units which is currently under construction. However, it is my understanding that Ober Gatlinburg will primarily use these units to house their seasonal employees through the J-1 Program. Therefore, we have not included these units in our demand calculation. Allensville Phase II is a planned addition to the Overlook at Allensville Square. The second phase will contain 144 units. Planning stages: Duplex development located in Pigeon Forge with 22 units. Apartment complex located in Pigeon Forge with 128 units. PAGE 32

37 Ski Mountain Road apartment complex was scheduled to begin construction within the month of March. However, the final plans have not been submitted and the timeline is currently unknown. Per the initial plans, it will consist of 22 apartment units. Sevierville Planning stages / initial discussions: To my knowledge, there are several projects that are in the due diligence stages of planning. A map and outline of those projects as provided by the planning department are noted below. o o o o o o Multi-story workforce housing; number of units unknown units of mixed rate, including some micro units and market rate units. 20 units, noted as less expensive apartments. Workforce housing, approved and zoned but cost of construction seems to be prohibitive; final number of units unknown. A mixed rate development currently being annexed into the city with workforce housing being a primary focus; final number of units unknown. Workforce or elderly housing. They tried to get THDA credits last year and now they are pursuing them again. PAGE 33
38 Low Income Housing Tax Credit (LIHTC) Applications As was expected, there was significant interest from the private sector on the 2017 round of competitive tax credits. There are currently six projects that have applied for low income housing tax credits in Sevier County. These projects combine for a total of 441 units and were posted to THDA s website on the May 17, At this point, details are limited, but have been outlined below. Applications: Douglas Greene development located on Snyder Road in the Twelfth Civil District in Sevierville with 80 units. Watson Glade development located at 849 Glades Road and Watson Drive in Gatlinburg with 76 units. Smokey Pointe Apartments development located along Lenz Drive in Sevierville with 96 units. Gateview Ridge development located along Avery Lane in Sevierville with 96 units. Riverside Village development located along East Hardin Lane in Sevierville with 20 units. Low Income Housing Tax Credit Sevier County Initial Applications Name City No of Units Douglas Greene Sevierville 80 Watson Glades Gatlinburg 76 Smokey Pointe Apartments Sevierville 96 Gateview Ridge Sevierville 96 Riverside Village Sevierville 20 Forest Cove Sevierville 73 Total 441 Forest Cove development located at 1119 Glennhill Lane in Sevierville with 73 units. The allocation process is ongoing as of the date of this report, however, it is our projection that some units will get funded in Sevier County. It is unknown how many of the projects will be funded, but any of those that do would help take some pressure off the low income housing market. PAGE 34
39 Rent Required for New Construction The following information has been collected in an effort to determine the rent level that would be required to make new construction feasible. The projections below are based on data retained in the workfile for costs and sizes of new construction projects. Please note that this is a project-specific calculation and is subject to change based on number of units, quality of construction, amount of infrastructure needed, and level of site work needed for an individual deal. One of the barriers to entry for multifamily development is the rising costs of construction to include both labor and materials. In this sample scenario, it is estimated that it would take approximately $1.06 per square foot in this market to make the rents feasible for new construction that includes a moderate level of finish and amenities. This is based on the average indications shown herein. Data Inputs New Construction Rents Analysis: Rent Required for New Construction Average unit size 950 sq. ft. Number of units 100 Total leasable area 95,000 sq. ft. % building rentable 100% Construction cost $90, per unit Land size 6.67 acres Reflects Density of 15 units/acre Land cost $125, per acre Operating expense 40.0% Overall rate (sustainable rate) 7.00% Estimated Vacancy & Collection Losses 5% Calculation of Required Rent Units Cost per Unit Building and site improvement cost 100 X $90, = $9,000,000 Land cost X $125, = $833,333 Total cost $9,833,333 Calculation of Feasibility Rent Required NOI $9,833,333 X 7.0% = $688,333 Add operating expense [NOI/(1-Exp.Ratio)] - NOI = $458,889 Effective gross income (EGI) $1,147,222 Vacancy and collection loss 5% $57,361 Potential gross income $1,204,583 Calculation of Minimum Required Rent for New Construction PGI divided by NRA Required Rent/Year $1,204,583 95,000 = $12.68 Required rent per square foot per month ---> $1.06 Resulting Monthly Rent $1,004 PAGE 35
40 As shown later in the report, this rent is above most of the product in the market area. The typical rent level in the market coupled with high land prices have been significant barriers to entry. One item that could help to bridge the gap would be if a land owner or municipality were able to contribute the land for an equity position in the deal. If there is no site acquisition cost, the feasible rent required for new construction would be lowered as shown in the following table. Note this is an example based on estimated terms of a 100-unit project. The feasible rent would vary depending on the items noted herein and the gap between the two estimates would also be tied to the associated land acquisition price. As the land price increases, so would the gap in feasible rent if the land were not included in the total costs. Data Inputs New Construction Rents Analysis: Rent Required for New Construction Average unit size 950 sq. ft. Number of units 100 Total leasable area 95,000 sq. ft. % building rentable 100% Construction cost $90, per unit Land size 6.67 acres Reflects Density of 15 units/acre Land cost $0.00 per acre Operating expense 40.0% Overall rate (sustainable rate) 7.00% Estimated Vacancy & Collection Losses 5% Calculation of Required Rent Units Cost per Unit Building and site improvement cost 100 X $90, = $9,000,000 Land cost X $0.00 = $0 Total cost $9,000,000 Calculation of Feasibility Rent Required NOI $9,000,000 X 7.0% = $630,000 Add operating expense [NOI/(1-Exp.Ratio)] - NOI = $420,000 Effective gross income (EGI) $1,050,000 Vacancy and collection loss 5% $52,500 Potential gross income $1,102,500 Calculation of Minimum Required Rent for New Construction PGI divided by NRA Required Rent/Year $1,102,500 95,000 = $11.61 Required rent per square foot per month ---> $0.97 Resulting Monthly Rent $919 PAGE 36
41 Substandard Households As stated, demand from this category is quantified by the numbers of renter households living in units that either lack complete plumbing or are overcrowded (1+ person per room). The number of households living in substandard units represented by those units lacking complete plumbing facilities have not been included in the ratio used in this analysis as it is my opinion that renter households within this segment most likely would not be income-eligible for occupancy in the proposed subject development based on minimum the qualifying income bands previously discussed. The tables below show these totals as compiled by the Census Bureau. This number represents 5.16% of the total renter-occupied housing units within Sevier County, 4.81% within Gatlinburg, 7.24% within Pigeon Forge, and 5.50% within Sevierville. The numbers herein are based on data that was collected by the Census Bureau before the wildfire, so these numbers are likely conservative. Also, hotels are not included in the Census Bureau data for substandard households. We believe these numbers to be higher than stated since hotels are not captured within these statistics; particularly for Gatlinburg. The percentages of surrounding Counties are shown on the following page. SEVIER COUNTY RENTER HOUSEHOLDS LIVING IN SUBSTANDARD UNITS GATLINBURG RENTER HOUSEHOLDS LIVING IN SUBSTANDARD UNITS Total Renter occupied: 12,297 Total Renter occupied: 707 Complete plumbing facilities: 12,281 Complete plumbing facilities: or less occupants per room 11, or less occupants per room to 1.50 occupants per room to 1.50 occupants per room or more occupants per room or more occupants per room 0 Lacking complete plumbing facilities: 16 Lacking complete plumbing facilities: or less occupants per room or less occupants per room to 1.50 occupants per room to 1.50 occupants per room or more occupants per room or more occupants per room 0 Total No. of Overcrowded Units 634 Total No. of Overcrowded Units 34 Percent of HH in Substandard Units 5.16% Percent of HH in Substandard Units 4.81% Source: U.S. Census Bureau, 2015 ACS; Table B25016 Source: U.S. Census Bureau, 2015 ACS; Table B25016 PIGEON FORGE RENTER HOUSEHOLDS LIVING IN SUBSTANDARD UNITS SEVIERVILLE RENTER HOUSEHOLDS LIVING IN SUBSTANDARD UNITS Total Renter occupied: 1,229 Total Renter occupied: 3,163 Complete plumbing facilities: 1,229 Complete plumbing facilities: 3, or less occupants per room 1, or less occupants per room 2, to 1.50 occupants per room to 1.50 occupants per room or more occupants per room or more occupants per room 64 Lacking complete plumbing facilities: 0 Lacking complete plumbing facilities: or less occupants per room or less occupants per room to 1.50 occupants per room to 1.50 occupants per room or more occupants per room or more occupants per room 0 Total No. of Overcrowded Units 89 Total No. of Overcrowded Units 174 Percent of HH in Substandard Units 7.24% Percent of HH in Substandard Units 5.50% Source: U.S. Census Bureau, 2015 ACS; Table B25016 Source: U.S. Census Bureau, 2015 ACS; Table B25016 PAGE 37
42 County Rent Overburdened RENTER HOUSEHOLDS LIVING IN SUBSTANDARD UNITS Total Renter Occupied Total No. of Overcrowded Units Percent of HH in Substandard Units Jefferson County, TN 5, % Cocke County, TN 4, % Blount County, TN 12, % Knox County, TN 65,145 1, % Haywood County, NC 7, % Swain County, NC 1, % Rent-overburdened households are renter-occupied households paying greater than 35% (for family households) of their household income towards gross rent. The U.S. Census Bureau tracks and reports this data (Gross Rent as a Percentage of Household Income Table B25070). The table on the previous page shows the breakdown of renter households by the percentage of rent burden to household income for all renter households in the subject s PMA as reported by the 2015 American Community Survey. Given the consistency in renter-occupied percentages within the PMA, it is believed that the ratio indicated by this data would be relatively consistent. This number represents 34.65% of the total renter-occupied housing units within Sevier County, 41.58% within Gatlinburg, 34.42% within Pigeon Forge, and 41.23% within Sevierville. SEVIER COUNTY GROSS RENT AS A PERCENTAGE OF HOUSEHOLD INCOME GATLINBURG GROSS RENT AS A PERCENTAGE OF HOUSEHOLD INCOME Percentage TOTAL TOTAL Percentage PMA PMA Total: 12,297 Total: 707 Less than 10 percent 291 Less than 10 percent to 14 percent to 14 percent to 19 percent 1, to 19 percent to 24 percent 1, to 24 percent to 29 percent 1, to 29 percent to 34 percent 1, to 34 percent 7 35 to 39 percent to 39 percent 0 40 to 49 percent 1, to 49 percent percent or more 2, percent or more 194 Not computed 1,445 Not computed 165 Total No. of Overburdened Renter HH 4,261 Total No. of Overburdened Renter HH 294 Percentage of Renter HH Overburdened with Gross Rent > 35% of HH Income 34.65% Percentage of Renter HH Overburdened with Gross Rent > 35% of HH Income 41.58% Source: U.S. Census Bureau, 2015 ACS; Table B25070 Source: U.S. Census Bureau, 2015 ACS; Table B25070 PAGE 38
43 PIGEON FORGE GROSS RENT AS A PERCENTAGE OF HOUSEHOLD INCOME SEVIERVILLE GROSS RENT AS A PERCENTAGE OF HOUSEHOLD INCOME Percentage TOTAL TOTAL Percentage PMA PMA Total: 1,229 Total: 3,163 Less than 10 percent 0 Less than 10 percent to 14 percent to 14 percent to 19 percent to 19 percent to 24 percent to 24 percent to 29 percent to 29 percent to 34 percent to 34 percent to 39 percent to 39 percent to 49 percent to 49 percent percent or more percent or more 732 Not computed 65 Not computed 250 Total No. of Overburdened Renter HH 423 Total No. of Overburdened Renter HH 1,304 Percentage of Renter HH Overburdened with Gross Rent > 35% of HH Income 34.42% Percentage of Renter HH Overburdened with Gross Rent > 35% of HH Income 41.23% Source: U.S. Census Bureau, 2015 ACS; Table B25070 Source: U.S. Census Bureau, 2015 ACS; Table B25070 The percentages of surrounding Counties are shown below. County GROSS RENT AS A PERCENTAGE OF HOUSEHOLD INCOME IN SUBSTANDARD UNITS Total Renter Occupied Total No. of Overburdened Renter HH Percent of HH Overburdened Jefferson County, TN 5,240 1, % Cocke County, TN 4,595 1, % Blount County, TN 12,836 4, % Knox County, TN 65,145 23, % Haywood County, NC 7,081 2, % Swain County, NC 1, % PAGE 39
44 Affordability The table below reflects the number of households, area median income and affordable fair market value rents according to the U.S. Census ACS from 2010 to Number of Households ( ) Total 36,253 Renter 12,270 % Renter 34% 2016 Area Median Income(AMI) 1 Annual $51,600 Monthly $4,300 30% of AMI 2 $15,480 Maximum Affordable 3 Monthly Housing Cost by Income Income at 30% of AMI $387 Income at 50% of AMI $645 Income at 80% of AMI $1,032 Income at 100% of AMI $1, Fair Market Rent (FMR) 4 Zero-Bedroom $556 One-Bedroom $563 Two-Bedroom $696 Three-Bedroom $934 Four-Bedroom $954 Annual Income Needed to Afford FMR Zero-Bedroom $22,240 One-Bedroom $22,520 Two-Bedroom $27,840 Three-Bedroom $37,360 Four-Bedroom $38,160 Percent of Family AMI Needed to Afford FMR Zero-Bedroom 43% One-Bedroom 44% Two-Bedroom 54% Three-Bedroom 72% Four-Bedroom 74% 2016 Renter Median Household Income Estimated Median 5 $28,780 Percent Needed for Two-Bedroom FMR 97% Rent Affordable at Median $719 According to the U.S. Census ACS ( ), there were 36,253 total households in Sevier County. According to the U.S. Census ACS ( ), there were 12,270 renter households in Sevier County. According to the U.S. Census ACS ( ), renter households represented 34% of all households in Sevier County. The estimated annual median family income in Sevier County is $51,600. The monthly median family income in Sevier County is $4,300. In Sevier County an Extremely Low Income family (30% of AMI) earns $15,480 annually. For an Extremely Low Income family (30% of AMI) in Sevier County, monthly rent of $387 or less is affordable. PAGE 40
45 The Fair Market Rent for a two-bedroom rental unit in Sevier County is $696. A renter household needs an annual income of $27,840 in order for a two-bedroom rental unit at the Fair Market Rent to be affordable. The income needed to afford a two-bedroom unit at the Fair Market Rent represents 54% of the AMI. The renter median household income in Sevier County is $28,780. The income needed to afford a two-bedroom unit at the Fair Market Rent represents 97% of the renter median household income. Utility Usage The utility allowance is based on both the consumption and rates of utilities. Utility allowance adjustments are made if the cost of a utility increased or decreased by 10% or more from the previous year s rates. The utility allowance remains the same as the previous year s utility rate if the increase or decrease in rates is below 10%. The cost of utilities is calculated for electricity, natural gas, liquefied petroleum gas (propane), water, wastewater and trash. This year, THDA collected information on the primary utility providers serving the county seats of each county. May 2016 rates (and seasonal rates, if available) from each provider were used to determine the average monthly consumption cost for each utility. Monthly consumption costs were calculated using HUD s Utility Schedule Model. Updates to the 2016 utility allowances were made when the average cost of the current rates increased or decreased 10% or more from the 2015 rates. Please see addenda for Sevier County Utility Allowances Analyze the Competitive Supply A description of the competitive supply as it relates to the subject is outlined below. Location A vast majority of the existing rental stock is located in Sevierville. This is believed to be due in part to the municipal offices and services concentrated in the City. Age Given the lack of new supply, much of the current rental stock is over 25 years old. Amenities Other than a few project, project amenities are limited. The unit amenities common in the market are consistent with Class B and C assets. Step 5 - Analyze the Interaction of Supply and Demand Since there is no exact development referenced in this report, analysis of a site specific project does not have application. PAGE 41
46 Step 6 - Forecast Subject Capture Rate The final step in analyzing the marketability of the asset is to estimate how much of the market the subject can capture. This analysis involves two methods, inferred data and a quantifiable rating system. Inferred Capture Rate Analysis This level of analysis compares historical data of the comparable occupancies to determine an appropriate capture rate. The selected comparables reflect a current physical occupancy of approximately 99%; to exclude the one in Seymour. Historical absorption rates for the submarket have been in the 12 units per month range for the newest product that has been absorbed. Quantifiable Competitive Capture Rating There two ways to produce a capture rate through quantifiable analysis as outlined below. First, the pro rata share and actual current capture rate are calculated from the existing supply in the market. Secondly, a quantifiable rating method would been utilized which takes into consideration a rating system of the competitive market supply. Since this is not a project specific report, then no individual capture rate projection is warranted. However, an example is included for the purpose of discussion. Pro Rata Share Capture Rate Assuming the identified number of units in the competitive supply was 1,500 and a proposed development had 100 units, the property would need to capture 6.7% of the existing market. Pro Rata Share Method Competive Number of Units (Example) 1,500 Subject Units (Example) 100 Subject Capture Rate (Example) 6.7% Actual Current Capture Rate This rate takes into consideration the actual occupancy rate of the market. The total number of units is adjusted by the current occupancy rate to estimate the actual number of occupied units. Calculation of this capture rate is shown below. Given that the occupancy is near 100%, the hypothetical capture rates would be virtually the same as the previous calculation. Actual Current Capture Rate Method - Sample Only Competive Number of Units 1,500 Current Occupancy Rate 99.0% Occupied Units 1,485 Subject Units 100 Subject Capture Rate 6.7% PAGE 42
47 Quantifiable Rating Method In conducting this analysis, three major components would be been taken into consideration: location, age, and unit/project amenities. The rating system typically includes scores from 1 to 5 with 5 being the best. Location: Consideration for this item includes proximity to shopping centers, employment centers, access and exposure. Age: The newest properties in the market would be rated as 5; while the other properties would be lower. Consideration is given to the chronological age along with the condition. Amenities: Both the unit and project amenities would be taken into consideration for this item. Since there is no specific subject to compare, this data is only presented as a general rule of thumb. Final Reconciliation and Conclusions of Capture Rate Within the capture rate analysis, information was taken from both inferred data and quantifiable measures. A summary of the conclusions from the inferred analysis is noted below. Conclusions of Inferred Analysis General growth trends New construction Historical absorption Rent increase Analysis of the specific growth rates in the applicable market would be taken into account. There has been a low level of new construction in the market. New product may force properties in the market to either upgrade their finishes or potentially suffer from functional obsolescence. The historical absorption rates noted herein are considered to be fair to average given the new supply added to the market. Rent increases over the past five years in the market have been low to moderate. The following table outlines the conclusions from the fundamental analysis. Conclusions of Fundamental Analysis Pro rata capture rate Would be project and location specific. Current capture rate Would be project and location specific. Competitive rating method Would be project and location specific. Final Conclusions on Marketability If a specific project were to be analyzed, the analysis would utilize both inferred and fundamental methods to determine which one(s) were the most applicable to that deal. PAGE 43
 as well as trailing 12 months data (March 1, 2016 to March 1, 2017).")
48 SUPPLY ANALYSIS OF THE SINGLE FAMILY MARKET The following tables and graphs illustrate the historical level of single-family sales activity in Sevier County. The analyst has included home sales data from the past ten years (2007 to 2016) as well as trailing 12 months data (March 1, 2016 to March 1, 2017). Transactions ranging from $50,000 to $150,000 were included, all others were excluded. As can be seen in the chart below, home sales bottomed out in 2008, consistent with the recession and national credit crisis. Beginning in 2009 home sales began to rise, reaching a ten year high of 744 transactions in Sales have remained relatively stable; however, 2016 data indicates total transactions are down approximately 10% from the ten year high. Year Trailing 12 Total Sales An analysis of sales data collected has been conducted in order to extract historical trends in exposure time, also known as Days-On-Market (DOM). In 2007, the Sevier County market indicated a ten-year low in both median and average days-on-market. Since then, both indicators have been trending upwards. Average and median days-on-market both topped out in 2014 at 211 days and 146 days, respectively. A slight decline in both indicators has been observed over the last two years as well as within trailing 12 data Trailing 12 Avg. DOM Med. DOM PAGE 44

49 For comparison purposes average days-on-market has been analyzed for both Sevier and Knox County. Historically, Knox County has had a lower average DOM. With the exception of 2008 and 2009, this is the indication of the data collected. In 2009, Sevier County was approximately 50% lower than Knox County in average DOM. Since then, exposure times in Knox County have steadily declined whereas Sevier County has remained stable to gradually increasing. From 2010 to 2011, both counties remained generally consistent. In 2012, DOM began decreasing in Knox County but continued to rise in Sevier County. Over the last three years, 2014 to 2016, DOM has been significantly higher in Sevier County, ranging from 59% to 67%. Furthermore, trailing 12 months data indicates that this trend has continued into Trailing 12 Sevier Co Knox Co % 9.4% 92.5% 13.0% 12.5% 27.1% 35.0% 58.8% 60.9% 66.7% 67.2% PAGE 45


50 Although the single-family market is being outperformed by Knox County, Sevier County s average days-on-market have remained relatively stable as of recent. Average DOM is increasing slightly; however, there have been no dramatic shifts up or down. Furthermore, over the period analyzed, total sales volume in the $50,000 to $150,000 price range has been on the rise. Total sales were at their lowest in 2008, corresponding to the economic downturn and national credit crisis. They have been steadily increasing ever since. From 2008 to 2009, total sales volume increased by 77%. The following two exhibits clearly show the increase in sales volume as well as the reasonably stable exposure time. Year Trailing 12 Total Sales Avg. DOM PAGE 46


51 In addition to the number of single-family home sales increasing, average and median sales prices have been increasing for the past four years. Both average and median sales prices on product in the $50,000 to $150,000 range hit a ten year low in From that point both have been increasing. Median sale price was $104,750 in 2012 but has risen to $121,950 as of last year (2016). Trailing 12 months data indicates a median sale price of $120, Trailing 12 Avg. Sale $ $115,373 $115,689 $108,915 $111,280 $107,768 $103,101 $108,514 $113,302 $114,863 $114,783 $114,345 Med. Sale $ $119,000 $120,000 $111,200 $116,000 $112,000 $104,750 $114,600 $119,500 $120,000 $121,950 $120,000 PAGE 47
52 CURRENT MULTI-FAMILY LAND INVENTORY A survey was conducted in order to ascertain the market for available multi-family land. Several marketing websites were researched in order to obtain the current vacant land listing in the Sevier County market that are being marketed for potential multi-family development. Several listings were discovered; eight (8) of which were considered relevant for inclusion herein. These properties were listed on public listing services and likely do not reflect all the available land, but rather the inventory being marketed at the time of the study. Summary of Available Listings Listing No. Identification/Location List Price Size (Ac.) Price Per Acre Price Per SF Valley Heights Drive Pigeon Forge 168 Bass Pro Drive Kodak Winnfield Dunn Parkway Sevierville Veterans Boulevard Sevierville 449 Lonesome Valley Road Sevierville Chapman Highway Seymour 2230 Alpine Village Way Pigeon Forge Cold Springs Road Sevierville Mean Median $650, $205,696 $4.72 $1,450, $106,072 $2.44 $550, $24,017 $0.55 $459, $41,995 $0.96 $11,300, $134,524 $3.09 $1,400, $75,676 $1.74 $650, $100,000 $2.30 $1,900, $29,978 $0.69 $2,294, $89,745 $2.06 $1,025, $87,838 $2.02 Inventory discovered indicates a range in asking prices from $24,017 to $205,696 per acre and $0.55 to $4.72 per square foot. There are several factors responsible for the wide range in unit values presented to include: size, location, and topography. Of those attributes, location and topography have the most impact on unit price. The properties with the highest unit prices are typically characterized by good proximity to main commercial/tourist entertainment development and reasonably good topography. A map has been included below outlining the locations of each property being offered followed by a general outline and picture of each. PAGE 48

53 Location Map Current Multi-Family Land Listings PAGE 49


54 Location: Size: List Price: Comments: Valley Heights Drive Pigeon Forge 3.16 Acres $650,000 or $205,696 / Acre Just off Wears Valley Road in close proximity to the Parkway. Sloping wooded topography. Location: 168 Bass Pro Drive Kodak Size: Acres List Price: $1,450,000 or $106,071 / Acre Comments: Northwest quadrant of I- 40 and Snyder Road, adjacent to Bass Pro Shops. Rolling to sloping topography and wooded. PAGE 50


55 Location: Size: List Price: Comments: Winfield Dunn Parkway Kodak Acres $550,000 or $24,017 / Acre Northwest quadrant of Highway 66 and E. Mount Road. Below grade and gently rolling. Location: Size: List Price: Comments: Veterans Boulevard Sevierville Acres $459,000 or $41,994 / Acre West side of Veteran s Boulevard, just south of Dolly Parton Parkway. PAGE 51


56 Location: Size: List Price: Comments: 449 Lonesome Valley Sevierville 84 Acres $11,300,000 or $134,524 / Acre Apple Valley Farm located along Little Pigeon River. Generally level topography and good proximity to the parkway. Location: Size: List Price: Comments: Chapman Highway Seymour Acres $1,400,000 or $75,676 / Acre Generally level to gently rolling. Located off of Chapman Highway in Seymour. PAGE 52


57 Location: Size: List Price: Comments: 2230 Alpine Village Pigeon Forge 6.50 Acres $650,000 or $100,000 / Acre Rolling to steep topography that s wooded. Located within an established cabin/condo rental community. Location: Size: List Price: Comments: Cold Springs Rd. Sevierville Acres $1,900,000 or $29,978 / Acre Rolling and wooded. Approximately three miles from the parkway. PAGE 53

58 TRAILERS AND MOBILE HOME COMMUNITIES Within the due diligence process, we discovered that mobile home communities reflect a significant portion of the rental market. While the supply is difficult to quantify, we have included some rental rates for properties discovered. One of the difficulties in quantifying the supply is that many of the units are owned by individuals that lease the sites from an operator of a mobile home park. As such, the specific number of units is hard to survey. The typical rents per square foot are generally aligned with the balance of the rental product noted in the report. Those parks surveyed indicated 100% occupancy of the pad sites, consistent with the balance of the rental market. Inventory Summary Modular Homes No. City Park Year Built No.of Units Unit Type SF Per Unit Rent Per SF W/D Notes 1 Sevierville The Stables N/A 1 3 BR / 2 BA 1568 $985 $0.63 HU Modular unit in The Stables 2 Sevierville The Stables N/A 1 3 BR / 1 BA 1056 $775 $0.73 HU Modular unit in The Stables 3 Sevierville The Stables N/A 1 3 BR / 2 BA 1216 $865 $0.71 HU Modular unit in The Stables 4 Sevierville The Stables N/A 1 3 BR / 2 BA 1152 $860 $0.75 HU Modular unit in The Stables 5 Sevierville The Stables N/A 1 3 BR / 2 BA 1216 $865 $0.71 HU Modular unit in The Stables 6 Sevierville The Stables N/A 1 3 BR / 2 BA 1280 $920 $0.72 HU Modular unit in The Stables 7 Sevierville The Stables N/A 1 3 BR / 2 BA 1920 $990 $0.52 HU Modular unit in The Stables 8 Sevierville None N/A 1 3 BR / 2 BA 1990 $1,061 $0.53 HU Modular Unit with additonal detached garage. 9 Kodak Smoky Ridge BR / 2 BA 1056 $825 $0.78 HU Modular Home in Smoky Ridge 10 Kodak Smoky Ridge BR / 2 BA 1024 $740 $0.72 HU Modular Home in Smoky Ridge 11 Kodak Smoky Ridge BR / 2 BA 924 $635 $0.69 HU Modular Home in Smoky Ridge Mean $866 $0.68 Median $865 $0.71 The following data was taken from the ACS Housing Summary report; which outlines the number of mobile homes in each geography. Sevier County The information above shows how the housing inventory for Sevier County is made up according to type of structure and unit type. At the time of the survey, Sevier County contained a total of 53,136 units according to 2010 Census data. Mobile homes make up 12.8% of Sevier County s total housing inventory. The number of mobile homes in Sevier County is 7,206 units. PAGE 54

59 Sevierville Sevierville contains a higher percentage of mobile homes than the other nearby cities. At the time of the survey, the total number of homes in Sevierville was 7,758 units while 583 units or 7.5% of the units are mobile homes. Pigeon Forge At the time of the survey, Pigeon Forge contained a total of 332 mobile homes which is 6.0% of the total housing inventory, which is stated at 5,574 units. PAGE 55
60 Gatlinburg At the time of the survey, the City of Gatlinburg contained the lowest percentage of mobile homes according to the 2010 Census data provided. Gatlinburg contains a total of 6,308 housing units, and 63 of those are mobile homes, which represents 1.0% of the total housing inventory. STUDENT HOUSING PROJECTS Several tourist destination communities are exploring options for housing seasonal workforce housing in developments that are designed similar to a student housing project. These floor plans include communal living space and kitchens with separate, key-lock bedroom and bathrooms. Typically, an employer would master lease a certain number of units for their employees; providing security to the developer and lender. While this type of housing is not believed to be the primary solution to the housing problem, it could alleviate some pressure on the market. Foreign Student Visa Population (J-1) J-1 is an exchange visitor program, and the Sevier International Students Outreach Program (SISOP) works with Sevier County to help J-1 Summer Work Travel Program participants. Currently, the SISOP website recommends hotels/motels or the employer arranging housing. As is the case in the local and other tourist destinations, there appears to be a shortage of housing for this segment of the workforce. Wisconsin Dells, a tourist destination similar to Sevier County, has a program that caters to temporary seasonal housing for employees. In 2016, a student housing-style dorm was built to house 266 seasonal employees. According to Abigail Palmer, the Branson ISOP Committee Chair, Branson, MO is also attempting to develop housing for seasonal employees as they are also facing a shortage of housing for these employees. This information provides further evidence that the temporary seasonal housing Disney World in Orlando also has dorm-style housing for seasonal student employees. PAGE 56

61 AREA DATA The subject of this assignment is focused on Sevier County, Tennessee, which lies at the foothills of the Great Smoky Mountains National Park. Sevier County is bound by Blount County to the west, Knox and Jefferson Counties to the north, Cocke County to the east, and the North Carolina state line to the south. Sevier County, encompassing 603 square miles, is located approximately 26 miles southeast of Knoxville, the regional trade center for East Tennessee. Sevier County is part of the 15-county trade area centered around Knoxville that is represented by the East Tennessee Economic Development Agency (ETEDA). ETEDA 15-County Region Prior to 2004, Sevier County was part of the Knoxville Metropolitan Statistical Area (MSA) along with five surrounding counties to include Anderson, Blount, Loudon, Knox, and Union. In 2004 the Sevierville-Sevier County Micropolitan Area (MCSA) was created. This MCSA combined with the Harriman and LaFollette MCSA s and the Knoxville MSA formed the Knoxville Combined Statistical Area (CSA). Sevier County is not part of the Knoxville MSA like the other outlying counties due to not meeting the required level of social and economic integration. To be part of the MSA, Sevier County would need 25% of workers to commute to Knox County or have 25% of Knox County workers commute to Sevier County for work. At the time of the change, 19% of Sevier County s workforce commuted to Knox County, while only 5% of Knox County s did the same. Bordering counties that are included in the Knoxville MSA exhibited strong dependence on jobs in Knox County, with over 25% of employed persons commuting to Knox County for work. Location While Knoxville is the closest metropolitan area, Sevier County is only 81 miles southwest of Johnson City, Tennessee, 127 miles northeast of Chattanooga, and 210 miles east of Nashville. Interstate 40 extends through the northern portion of the county and is connected to the city of Pigeon Forge by State Route 66 then U.S. Highway 441 (referred to locally as the Parkway ). Additional highways serving the county include State Highways 35, 321, and 416, along with U.S. Highway 411. Total area of the county contains 603 square miles of which 32 percent is PAGE 57

62 situated within the national park. The Great Smoky Mountains is recognized as one of the most popular national parks in the United States, attracting over 11 million visitors each year. Population Because of the MSA s reconfiguration, historical demographic comparisons are inconsistent; however, it is noteworthy that Sevier County s rapid growth was the reason that this area was separated out from the original Knoxville MSA. Sevierville (the county seat) is located in the northern portion of the county, north of the cities of Pigeon Forge and Gatlinburg. The current estimated population within the city limits of Sevierville is 15,968, a 1.26% annual increase from the 2010 census. Estimated 2016 population for Sevier County is 96,735; an approximate annual increase of 1.22% from 2010 figures. The area s growth in population has been fueled by abundant vacant land, low housing costs and tax structure, and a strong, expanding economic base. The table below illustrates the population growth from 2000 to 2021 for Sevierville and surrounding areas. PAGE 58
63 Population Growth Annual % Change Annual % Change Annual % Change Gross % Change Area (Est) Gatlinburg 3,323 3,944 4,547 5, % 2.37% 2.03% 9.7% Pigeon Forge 5,342 5,875 6,398 6, % 1.42% 1.44% 7.0% Sevierville 12,063 14,807 15,968 16, % 1.26% 1.10% 5.4% Sevier County 71,170 89,889 96, , % 1.22% 1.28% 6.2% Knoxville-Sevierville CSA 1,195,921 1,333,139 1,389,087 1,436, % 0.69% 0.67% 3.3% Tennessee 5,689,283 6,346,105 6,698,359 7,010, % 0.90% 0.91% 4.5% Source: U.S. Census Bureau/STDB Projections As may be seen in the table, in surrounding cities, Gatlinburg has had the highest annual growth in the last five years at 2.37%. Sevier County has seen higher growth than the Knoxville CSA and state. In the 2000 s alone, Sevier County s population grew 2.34%, which also outpaced the Knoxville CSA and the state at 1.09%. Growth is anticipated to continue with annual increases of 1.28% over the next five years. Homeless Data The following information is a summary of data provided by Tennessee Valley Coalition for the Homeless (TVCH). This organization assists homeless citizens find housing. The table below summarizes the current options for housing in Sevier County on February 7, Source: Tennessee Valley Coalition for the Homeless The table shows that only two units are available for rent at or below fair market rate while nine units are available above fair market rent. A total of 14 units are waitlisted including those at or below FMR and the units above FMR. TVCH tracks the current housing inventory and their findings from their surveys conducted on January 23, 2017 through January 29, 2017 are summarized below. They are surveying a larger area then they were prior to the wildfires due to the enhanced demand the disaster created. Sevier County newly listed units from Monday 1/23/17 through Sunday 1/29/17; 2 available houses, and 1 listing comprised of 20 apartments on a waitlist. Sevier County Housing Units Summary At or Below Fair Market Rate Available Units 2 Waitlisted 11 Unavailable 3 Above Fair Market Rate Available units 9 Waitlisted 3 2,619 total units in the system as of 1/29/17. (Note one property may have more than one listing) 1,671 listings were on a waitlist as of 1/29/17 (Note one property may have more than one listing) There were 157 available units and 62 listings on waitlists were added, modified, from Monday 1/23/17 through Sunday 1/29/17 were in target areas: 19 available units added or modified and verified in Sevier County. 13 listings on waitlists were added or modified and verified. PAGE 59
64 30 available units added or modified and verified in Blount County. 20 listings on waitlists were added or modified and verified. 7 available units added or modified and verified in Cocke County. 9 listings on waitlists were added or modified and verified. 10 available units added or modified and verified in Jefferson County. 1 listings on waitlists were added or modified and verified. 0 available units added or modified and verified in Knox County zip code listings on waitlists were added or modified and verified. 0 available units added or modified and verified in Knox County zip code listings on waitlists were added or modified and verified. 14 available units added or modified and verified in Knox County zip code listings on waitlists were added or modified and verified. 24 available units added or modified and verified in Knox County zip code listings on waitlists were added or modified and verified. 0 available units added or modified and verified in Knox County zip code listings on waitlists were added or modified and verified. 53 available units added or modified and verified in Knox County zip code listings on waitlists were added or modified and verified. On Monday 1/23/17 through Friday 1/27/17 there were 150 calls made to landlords. These calls lead to 168 listings updated and 32 units added via phone. Voic s were left for 58 landlords, while one landlord could not receive voic s. The 58 landlords contacted indicated they would be willing to offer short term leases. Statewide, the seven day period leading up to 1/29/17 resulted in 14,197 searches on TNHousingSearch.org. This number is an increase from 12,868 searches reported the previous week, an increase of 1,329 searches. In Sevier County, the seven day period leading up to 1/29/17 resulted in 172 searches on TNHousingSearch.org. This is an increase over the 98 searches reported the previous week, an increase of 74 searches. Statewide in the three business days leading up to 1/29/17, 461 listings were updated to include 15,576 units. The same time period resulted in a total of five complexes being deleted to include 58 units. The data herein outlines the increasing need and searches for affordable housing units in the market. PAGE 60


65 Employment The CSA and Sevier County have experienced relatively strong growth in population and a declining unemployment rate from 2006 to However, the unemployment rose with the economic conditions in 2008 peaking in 2009 at 10.9% for Sevier County and 9.8% or the CSA in conjunction with the national housing crisis. The unemployment rates at the local level and in the surrounding counties have fallen more in line with the state and national rates. As of December 2016, Sevier County has an estimated unemployment rate of 5.7%, up from 4.1% in November. This variance in unemployment is indicative of the Sevier County market which is subject to the seasonality of the tourism industry. Most markets, excluding Sevier County, have experienced historically high levels of multifamily permits over the past five years. However, based on the factors discussed herein, this market has not experienced the increase in supply, which has further led to the housing crisis. The following tables depict the annual unemployment rates since 2006 as well as monthly rates for the past twelve months. PAGE 61

, local water parks, go-cart tracks, golf courses, and horse")

66 The monthly unemployment chart above illustrates an annual fluctuation of the Sevier County unemployment rate. The early spring, fall, and summer months have a lower unemployment rate due to the impact of tourism. During the down-season from January until March, local unemployment rises as tourism-related businesses need fewer workers. Mainly outdoor attractions like Dollywood (shorter schedule), local water parks, go-cart tracks, golf courses, and horse stables are shut down for the winter months. January and February are also the weakest months in terms of cabin rental and hotel bookings in Sevier County. The chart below reflects the 2016 renter wage information provided by according to the U.S. Census ACS from 2010 to PAGE 62
67 2016 Renter Wage Estimated Mean Renter Wage $8.48 Rent Affordable at Mean Wage $ Minimum Wage Minimum Wage $7.25 Rent Affordable at Minimum Wage $ Supplemental Security Income Monthly SSI Payment $733 Rent Affordable at SSI $ Housing Wage Zero-Bedroom $10.69 One-Bedroom $10.83 Two-Bedroom $13.38 Three-Bedroom $17.96 Four-Bedroom $18.35 Housing Wage as % of Minimum Wage Zero-Bedroom 147% One-Bedroom 149% Two-Bedroom 185% Three-Bedroom 248% Four-Bedroom 253% Housing Wage as % of Mean Renter Wage Zero-Bedroom 126% One-Bedroom 128% Two-Bedroom 158% Three-Bedroom 212% Four-Bedroom 216% Work Hours/Week at Minimum Wage Needed to Afford FMR Zero-Bedroom 59 One-Bedroom 60 Two-Bedroom 74 Three-Bedroom 99 Four-Bedroom 101 Work Hours/Week at Mean Renter Wage Needed to Afford FMR Zero-Bedroom 50 One-Bedroom 51 Two-Bedroom 63 Three-Bedroom 85 Four-Bedroom 87 Full-time Jobs at Minimum Wage Needed to Afford FMR Zero-Bedroom 1.5 One-Bedroom 1.5 Two-Bedroom 1.8 Three-Bedroom 2.5 Four-Bedroom 2.5 Full-time Jobs at Mean Renter Wage Needed to Afford FMR Zero-Bedroom 1.3 One-Bedroom 1.3 Two-Bedroom 1.6 Three-Bedroom 2.1 Four-Bedroom 2.2 The federal minimum wage is $7.25 in If one wage-earner holds a job paying the minimum wage, a household can afford to spend as much as $377 in monthly rent. The Supplemental Security Income for qualifying individuals was $733 in monthly federal benefits in An individual whose sole source of income is Supplemental Security Income can afford to spend as much as $220 in monthly rent. A renter household needs one full-time job paying $13.38 per hour in order for a twobedroom rental unit at the Fair Market Rent to be affordable. PAGE 63
68 Sevier County, the Housing Wage for a two-bedroom rental unit represents 185% of the minimum wage. Sevier County, the Housing Wage for a two-bedroom rental unit represents 158% of the mean renter wage. A renter earning the minimum wage must work 74 hours to afford a two-bedroom rental unit at the Fair Market Rent. A renter earning the mean renter wage must work 63 hours per week to afford a twobedroom rental unit at the Fair Market Rent. A renter household needs 1.8 full-time jobs paying the minimum wage in order to afford a two-bedroom rental unit at the Fair Market Rent. A renter household needs 1.6 full-time jobs paying the mean renter wage in order to afford a two-bedroom rental unit at the Fair Market Rent. The data suggests that the average wages in the market are too low to afford the FMR. This is potentially increasing the substandard housing issue. Economy The economy of Sevier County and its gateway cities (Sevierville, Pigeon Forge and Gatlinburg) to the Great Smoky Mountains National Park (GSMNP) are primarily dependent upon tourism dollars associated with the 500,000+ acre park that attracts over nine million visitors annually, which is the most of any of the nation s 391 national parks. The chart below depicts the travel impact of tourism by county. Sevier County tourists spent more than $2.0 billion in 2015 and created 20,300 jobs with a payroll of $440.7 million. As noted below, tax receipts of $115 million on the state level and $60 million on the county level were generated from Sevier County tourists. All of these numbers were increases from The 2016 data was not found online. PAGE 64
69 Source: Research Department of the U.S. Travel Association, August 2016 PAGE 65
70 Over 27% of Sevier County residents are employed in the accommodation and food services industry as outlined in the chart below: Sevier County Employment by Major Industry 2014 Industry Employment Percentage Total nonfarm employment 53, % Private nonfarm employment 48, % Forestry, fishing, and related activities * * Mining * * Utilities * * Construction * * Manufacturing 1, % Wholesale trade % Retail trade 9, % Transportation and warehousing * * Information % Finance and insurance 1, % Real estate and rental and leasing 3, % Professional, scientific and technical services 1, % Management of companies and enterprises % Administrative and waste management services 2, % Educational services % Health care and social assistance 2, % Arts, entertainment, and recreation 5, % Accommodation and food services 14, % Other services 2, % Government and government enterprises 5, % Federal, civilian % Military % State and local 4, % Source: U.S. Bureau of Economic Analysis *not given In addition to the national park, the county has numerous entertainment attractions including Dollywood Amusement Park and Dolly s Splash County, which draw in excess of two million visitors a year. Another main attraction to the area is Ripley s Aquarium in the Smokies, which is located in Gatlinburg. Additionally, numerous shopping outlets include Belz Factory Outlet World, Pigeon Forge Factory Outlet Mall, Tanger Five Oaks Center, and Tanger Center Pigeon Forge. Total combined square footage for said outlets is over 1.1 million square feet of retail space. Additional attractions include arcade and game centers, musical theaters, and local and nationally franchised restaurants. The abundance of tourism has also led to the development of numerous hotels and motels in the area. According to the most recent figures available, Sevierville/Pigeon Forge/Gatlinburg contain over 28,000 rooms to include hotel/motel, condo/cottage, time shares, camping/rv, and bed and breakfast facilities. The following table lists the major employers in Sevier County. The amusement park, Dollywood, tops the list with 3,100 employees, followed by Sevier County School System, and then Collier Foods in the restaurant business. The sixth largest employer, LeConte Medical Center, which opened February 15, 2010, next to the old hospital - Fort Sanders Regional Medical Center - features a main medical center, professional office buildings, the Dolly Parton Center for Women s Services, and the Thompson Cancer Survival Center. The hospital campus is comprised of 70 acres and was built at a cost of $115 million by Covenant Health. PAGE 66
71 Top Employers by Industry - Sevier Co, TN Rank Name of Firm Product/Services Employees 1 Dollywood Attraction Sevier County School System Education Collier Food Group Restaurant Tanger Five Oaks Retail County of Sevier Government Wilderness in the Smokies Attraction / Lodging LeConte Medical Center Healthcare Wal-Mart Retail Fee Hedrick Family Ent. Attraction City of Pigeon Forge Government Ripley's in the Smokies Attraction Diverse Concepts Restaurant City of Gatlinburg Government Bass Pro Shop Retail City of Sevierville Government A&W Ready Mix Concrete & Ready Mix Lisega INC Pipe hangers TRW Fuji Valve Engine Valves & Components Sevier County Electric System Utility KaTom Restaurant Supply, Inc Commercial Kitchen Equip Distribution Mountain Mold and Die Mold and Die Sevier County Utility District Utility Parker Tru-Tec Heat Treating Johnson Matthey Catalysts Process Catalysts and Technology Southern Casting Aluminum & Brass Casting Vulcan Corp. Crushed Stone Mannon Specialty Foods Cookie Dough Quality Solutions Quality Control A1 Block & Brick Block and Brick Products Tennessee Hardwood Flooring Wood Flooring Products Ten Tec, INC Ham Radios, Tool and Die Emco Williams Precast Stone 12 Sevierville has four industrial parks John L. Marshall Industrial Park, Smith-Thomas Business Park, Ray L. Regan Industrial Park, and the Hodsden Hicks Industrial Park. In total, industries within these parks employ 995. Lisega, Inc., a German-based company specializing in the manufacture of pipe supports, recently completed the construction of a ±100,000-square foot manufacturing facility in the Smith-Thomas Business Park near Interstate 40 in Sevier County, approximately 10 miles from the subject site. The company is relocating 124 workers that were at the Newport, Tennessee plant (now closed) and will add 100 new jobs as well. PAGE 67
72 Space at the industrial parks is limited and of concern to Sevier County Economic Council (SCEDC). Leaders have expressed the need for industrial park land near the interstate and are reportedly looking at several tracts to purchase. In order to further strengthen the local economy, the SCEDC and the local Sevierville, Pigeon Forge and Gatlinburg chambers of commerce have expanded the area s tourism season. While still peaking during the summer months, Fall and Winter (primarily December) promotions have resulted in lower rates of curtailment. January through March-April remains the slower months for sales tax collections; however, tourism officials believe that the new convention center - the Sevierville Events Center at Bridgemont - will enable the area to host larger events throughout the year. The Sevierville Events Center has a 108,000-square foot Exhibit Hall and a 19,000- square foot ballroom. The city owned Sevierville Events Center, which opened in September 2007, was constructed on a 1,000-acre parcel that is being developed by The Bridgemont Group. The Wilderness at the Smokies Event Center Hotel (featuring 234 rooms, an indoor water park, and 3-acre outdoor water park) opened next to the events center in July Also constructed was a 400-unit condominium development. The adjacent Eagle s Landing Golf Course was expanded from 18 to 36 holes. PAGE 68
73 Tourism Sevier County is one of the top 5 counties in Tennessee in terms of tourist revenue. In 2016, the Great Smoky Mountains National Park saw a 5% increase in visitors over 2015, totaling 11,312,785 visitors, the highest seen in the park s history. The Dollywood theme park has doubled in size since opening, now covering 150 acres. Dollywood is the largest tourist attraction in Tennessee and sees more than two million visitors annually. Gatlinburg had a tourism income of $647.6 million in 2016, which is a 4.33% increase over 2015 income ($620.7 million). Rental cabins are a major draw for the Smoky Mountains, and there are reportedly more than 7,000 in Sevier County. Pigeon Forge saw a 2015 revenue of $213.1 million, a 14% increase over After Las Vegas and New York City, Gatlinburg/Pigeon Forge/Sevierville attract the most couples for marriage. The Chicago Cubs affiliate baseball team is located in Sevier County at exit 407 in Kodak. There is a possibility that the team could be relocated to Knoxville once the current lease expires. Other attractions in Sevier County include: Ripley s Aquarium of the Smokies, Wonderworx, Dixie Stampede, NASCAR SpeedPark, Zorb, etc. According to a March 3, 2017 Knoxville News Sentinel article, the following attractions will be opening this season: Sevier Air Trampoline & Ninja Warrior Park in Sevierville, the DropLine and Whistle Punk Chaser at Dollywood, Dollywood Splash Country s new TailSpin Racer, and the Alcatraz East Crime Museum in Pigeon Forge. Income The most recent report from the Bureau of Economic Analysis states that the Sevier County per capita income is currently $32,350. As can be seen in the chart below, said income is relatively competitive with those indicated by the CSA. Per Capita Income Year % Change Area Gross Annual Sevier County $28,173 $29,365 $29,745 $29,344 $28,616 $28,858 $30,061 $31,236 $31,532 $32, % 1.38% CSA $29,582 $30,910 $31,938 $33,064 $32,340 $33,312 $35,215 $36,675 $36,614 $37, % 2.43% Tennessee $31,695 $33,072 $34,227 $35,307 $34,468 $35,601 $37,323 $39,137 $39,312 $40, % 2.44% United States $35,904 $38,144 $39,821 $41,082 $39,376 $40,277 $42,453 $44,266 $44,438 $46, % 2.49% Source: Bureau of Economic Analysis, U.S. Department of Commerce PAGE 69


74 Transportation Highway 66 was recently widened from four lanes to six lanes, a project that was completed in phases. Phase I stretched from just north of Nichols Street to Boyds Creek Highway, spanning 4.2 miles, and was completed in The second phase was from Douglas Dam Road to south of the I-40 interchange, and was completed in Phase III included work from Boyds Creek Highway to Douglas Dam Road. A retail development was planned for Highway 66 near Dumplin Creek, but the project fell through and the 198-acre site is currently vacant. The city of Sevierville and Pigeon Forge jointly operate a Trolley System. Fare to ride the Trolley is $0.50 to $0.75. Routes lead to the Sevier County Courthouse and various shopping destinations within the city such Tanger Five Oaks Mall, Wal-Mart, Kmart, and the River Place shops. From Sevierville, a passenger can travel to several stops in Pigeon Forge such as Dollywood and travel as far as the Gatlinburg Welcome Center. Trolleys are in operations year around, specifically 8:30 am to midnight from March through October and 10:10 am to 10:10 pm in November and December. The trolleys have approximately 700,000 passenger trips annually. The Gatlinburg-Pigeon Forge Airport is located near to the hospital and has approximately 70,000 aircraft operations with approximately 92% being general aviation. McGhee Tyson airport in the city of Alcoa in Blount County is approximately 35 miles away. This airport is the main commercial hub for the Great Smoky Mountains National Park and Sevier County and features seven commercial passenger airlines. PAGE 70


75 Wildfire In late November of 2016 wildfires began in Sevier County and damaged or destroyed approximately 2,500 structures, burned almost 18,000 acres and left 134 injured while claiming 14 lives. Total damage is estimated to be nearing $1 Billion dollars. Governor Bill Haslam is on record as saying that that is the largest fire in the last 100 years in the state of Tennessee. In response to the fires two telethons were held to help raise money and awareness for the area. Dolly Parton founded the My People Fund which helps those displaced by the fire in providing $1,000 per month for six months. As of February 7, 2017 nearly 10 million dollars in federal aid has been applied for. A news article dated March 6, 2017 states that a $5.8 million dollar federal grant has been issued to employ people that have lost their job due to the fire. This grant will employ those that lost their jobs due to the fire by aiding in the cleanup effort. There have been other forms of charity and assistance provided to help victims of the fire but these mentioned are just examples. Two unnamed juveniles have been arrested and charged with aggravated arson in conjunction with the fires. The City of Gatlinburg reopened to the public on December 9, 2016 at 7:00 A.M. Since the reopening, cleanup and restoration has continued in areas directly affected. Of the total structures lost, it is estimated that approximately 225 units that were being used for rental housing were destroyed. PAGE 71


76 Vacation Rental Housing The vacation housing market is a vital portion of the local economy in Sevier County. The high amount of tourism based revenue flowing into Sevier County and the included cities is not only providing goods sold, but also in lodging. Recent data in regards to the vacation housing in Sevier County is limited. The primary data for this portion of the report is based on the 2010 Census data as outlined below. Sevier County The table above outlines the housing inventory in Sevier County it by different types of occupancy. The county contains 55,918 total housing units as of the 2010 Census with 15,624 of those units identified as Seasonal/Recreational/Occasional Use. This equates to approximately 27.9% of the total housing inventory. Sevierville Sevierville contains a total of 7,764 housing units within the city limits. The number of housing units that fall under Seasonal/Recreational/Occasional Use is 1,057 or 13.6% of the total housing unit inventory. This rate is lower than that of the aggregate date of the County. Given the municipal offices of Sevierville, it is expected that this geography has the lowest percentage of seasonal housing. PAGE 72

77 Pigeon Forge The City of Pigeon Forge contains 5,187 total housing units according the 2010 Census data. This data states that 45.7% of the total housing market or 2,372 total units are classified as Seasonal/Recreational/Occasional Use. The total vacancy rate for the data during this time period was 56.9% due to the high percentage of the Seasonal/Recreational/Occasional units. Gatlinburg The total vacancy rate for the City of Gatlinburg according to the 2010 Census is 71.1% due to the high percentage of the Seasonal/Recreational/Occasional units. The high vacancy rate can be attributed to the high amount of housing units classified as Seasonal/ Recreational/Occasional use at 3,657 unit or 62.8% of the total housing unit inventory, which is stated at 5,825 units. This percentage is the highest of the geographies; which would suggest that a dormitory style housing project, to include J1 students and other seasonal workers, could sense in this area. Summary The County and all of the included cities all contain a high concentration of recreational housing which serves a vital purpose to help support the tourism industry. The lack of conventional housing has created high demand for local residents. PAGE 73
78 Conclusion Based on the foregoing information, the analyst concludes that the Sevierville/Sevier County has grown at a reasonable pace the past twenty years. With the GSMNP as the anchor for tourism in Sevier County, it is believed that Sevier County will continue to see growth in the future. Tourism dollars should continue to flow into the County. The area has low property tax rates consistent with an economy that brings sales tax revenue from visitors and developable land yet to be tapped. City and county leadership continue to demonstrate a business friendly environment that is conducive to future economic growth. ZONING Specific details relative to zoning have not been included with this report. Links to various zoning municipalities is outlined below for reference. g_ordinance_updated_june_2013.pdf PAGE 74
79 CURRENT RENTAL SUPPLY The existing rental market has been inventoried to the best of our ability. The properties have been separated by conventional and LIHTC properties. Summaries of the pertinent data can be found in the following pages. Per the request of the client, specific details regarding each project has been retained in the workfile. 1. The Overlook at Allensville Square Ph. I 2. Riverwalk Apartments 3. Ogle Place 4. Windy Creek 5. Glen Meadows/Glen Vista/Ruth Villas 6. Summer Meadows 7. River Country 8. RAECO 9. Chapman Heights 10. River Valley 11. The Meadows 12. River Trace 13. Sophia Gardens 14. Oak Vista 15. Shadowood Apartments 16. Cross Creek Village 17. Willa View 18. Meadowbrooke 19. Walnut Vista 20. Smoky Crossing In addition to the professionally managed assets discovered, we have included data found on the local MLS, signs on properties, Craigslist, and other searches. Details of this secondary data has been outlined as well in the form of spreadsheets of each bedroom type. PAGE 75
80 Local Rental Supply (Conventional & LIHTC) - Proximity to Nearest Major Traffic Artery Comparable Name Nearest Artery Distance (mi) The Overlook at Allensville Square Ph. I Winfield Dunn Parkway 0.7 Riverwalk Apartments Highway Ogle Place Parkway 1.9 Windy Creek Highway Glen Meadows/Glen Vista/Ruth Villas Highway Summer Meadows Highway River Country Highway RAECO Highway Chapman Heights Highway 441 <0.1 River Valley Circle Highway The Meadows Highway River Trace Duplexes Highway Sophia Gardens Townhomes Highway Oak Vista Townhomes Highway Shadowwood Apartments Highway Cross Creek Village Parkway <0.1 Willa View Parkway 0.7 Meadowbrooke Parkway 2 Walnut Vista Highway Smoky Crossing Chapman Highway <0.1 Highland Ridge Parkway 0.8 Dogwood Ridge Parkway 0.8 Gist Creek Winfield Dunn Parkway 1.5 Riverpark II Winfield Dunn Parkway 0.8 Meadow Creek Parkway 1.2 Riverpark Winfield Dunn Parkway 0.8 PAGE 76

81 COMPARABLE RENTALS MAP Conventional Units PAGE 77
82 Market Rent Analysis Conventional Units The following summaries sort the complexes in ascending order by amount of monthly rent for each of the unit types outlined. Additional pricing adjustments applied to the comparables downward adjustments to comparables that include washer/dryer appliances or cable/internet. However, no other adjustments have been applied, such as those for age/condition, location, square footage, other unit/project amenities, etc. No water/sewer is included within the base rents; which would be most typical for a new conventional asset. Please note that the identity of each property was omitted (whited out) for confidentiality. Details of each complex has been retained in the workfile. One-Bedroom Units: The comparables shown in this chart generally reflect rental rates ranging from $453 to $805 with a mean of $623 and a median of $620 per unit. The mean and median rent per square foot of this dataset is $0.96 and $0.90 per square foot, respectively. One-Bedroom Rental Summary (By Adjusted Monthly Rent) Rental Complex Year Unit Size Monthly Water/ Rent Per WD/HU Adj. Rent No. Name Built / Ren Type (Sq. Ft.) Rent Sewer Sq. Ft. 5 Glen Meadows/Glen Vista/Ruth Villas BR/1BA 575 $500 -$47 $453 $ Walnut Vista BR/1BA 600 $475 $475 $ Meadowbrooke BR/1BA 450 $625 -$30 $595 $ Riverwalk BR/1BA 750 $645 $645 $ The Overlook at Allensville Square Ph. I BR/1BA 725 $765 $765 $ Smoky Crossing BR/1.5BA - TH 860 $805 $805 $0.94 Minimum $475 $453 $0.79 Mean $636 $623 $0.96 Median $635 $620 $0.90 Maximum $805 $805 $1.32 Note: Please note that the rental rates from the market have not been adjusted for various physical and locational attributes, but are shown to illustrate the range of rents quoted in the market. Supplemental Rental Data 1BR Units In addition to the properties above, the following supplemental information has been taken from various sources to include online searches and phone calls. The properties did not have enough detail for a full write-up, but do account for a portion of the local supply. Of the additional data collected, the mean and median rent indications are $672 and $665 per month, respectively. It is noted that several of the supplemental comparables are rented by the week; causing them to reflect higher monthly rents. PAGE 78
83 No. City Year Built No.of Units Unit Type Inventory Summary 1 BR Units SF Per Unit Rent Per SF W/D Util. Included Notes 1 Gatlinburg BR / 1 BA N/A $720 N/A Laundry E/W/S/T/C 6 units in Gatlinbug near the Parkway. 2 Gatlinburg BR / 1 BA 1000 $1,060 $1.06 Laundry N/A 5 plex with large common area. 3 Kodak N/A 1 1 BR / 1 BA N/A $435 N/A None W/A 1 BR apartment in Kodak with limited information being provided via Craigslist. 4 Pigeon Forge BR / 1 BA N/A $830 N/A Laundry N/A Older triplex with shared laundry. 5 Pigeon Forge Room Stove N/A $667 N/A None All Small complex that utilizes weekly, bi weekly and monthly rentals. Rates are based on weekly rentals of $155/week x 4.3 weeks. 6 Pigeon Forge Room No Stove N/A $645 N/A None All Small complex that utilizes weekly, bi weekly and monthly rentals. Rates are based on weekly rentals of $150/week x 4.3 weeks. 7 Pigeon Forge Room N/A $839 N/A None All Small complex that utilizes weekly, bi weekly and monthly rentals. Rates are based on weekly rentals of $195/week x 4.3 weeks. 8 Sevierville BR / 1 BA 720 $700 $0.97 HU W/S/T Locally known as Castle Garden Apartments and is in remote location. 9 Sevierville BR / 1 BA N/A $600 N/A N/A S Four units in Sevierville. W/D hookups are not available but the property has a coin operated laundy facility. 10 Sevierville BR / 1 BA 445 $650 $1.46 HU S Duplex with one upstairs and one downstairs unit. The upper level is the unit with the higher rent. 11 Sevierville BR / 1 BA 445 $475 $1.07 HU S 12 Sevierville BR / 1.5 BA N/A $665 N/A N/A S Triplex with rents ranging from $500 to $ Sevierville BR / 1.5 BA N/A $665 N/A N/A S Triplex with rents ranging from $500 to $ Sevierville 1975 N/A 1 BR N/A $450 N/A N/A N/A S8 property with unknown floor plans. Rents were taken from online information. Property bears the name Gateway Village Mean $672 $1.14 Median $665 $1.06 Unable to Attain Rental Rates 15 Kodak BR / 1 BA N/A N/A W/D S Duplex that is reportedly in good condition. 16 Sevierville BR / 1 BA N/A N/A HU S Four units with frontage on French Broad River and dock. No central HVAC. 17 Sevierville BR / 1 BA 600 N/A HU S Duplex containing two one bedroom units. PAGE 79
84 Two-Bedroom Units: The comparables shown in this chart generally reflect rental rates ranging from $515 to $925 with a mean of $677 and a median of $635 per unit. The mean and median rent per square foot of this dataset is $0.76 and $0.74 per square foot, respectively. Two-Bedroom Rental Summary (By Adjusted Monthly Rent) Rental Complex Year Unit Size Monthly Water/ Rent Per WD/HU Adj. Rent No. Name Built/Ren Type (Sq. Ft.) Rent Sewer Sq. Ft. 19 Walnut Vista BR/1BA 650 $515 $515 $ RAECO BR/1BA 600 $525 $525 $ Chapman Heights BR/1BA 700 $525 $525 $ Cross Creek Village BR/1BA - TH 900 $535 $535 $ River Country BR/1BA 825 $630 -$91 $539 $ Willa View BR/1BA 700 $575 $575 $ The Meadows BR/1BA 850 $600 -$16 $584 $ River Valley BR/1BA 900 $600 $600 $ Meadowbrooke BR/1BA 675 $650 -$30 $620 $ Glen Meadows/Glen Vista/Ruth Villas BR/1BA 800 $700 -$75 $625 $ Cross Creek Village BR/1.5BA 984 $625 $625 $ Cross Creek Village BR/2BA 984 $645 $645 $ RAECO BR/1BA 1,000 $675 $675 $ Windy Creek BR/1.5BA 1,000 $700 -$16 $684 $ Ogle Place BR/1.5BA 1,050 $725 -$16 $709 $ Riverwalk BR/2BA 1,114 $745 $745 $ River Trace Duplexes BR/1BA 924 $795 $795 $ Oak Vista Townhomes BR/1.5BA - TH 800 $800 $800 $ Smoky Crossing BR/1.5BA - TH 960 $850 $850 $ Smoky Crossing BR/1.5BA - TH 1,000 $872 $872 $ The Overlook at Allensville Square Ph. I BR/2BA 1,000 $915 $915 $ Smoky Crossing BR/2.5BA - TH 1,280 $925 $925 $0.72 Minimum $515 $515 $0.59 Mean $688 $677 $0.76 Median $663 $635 $0.74 Maximum ,280 $925 $925 $1.00 Note: Please note that the rental rates from the market have not been adjusted for various physical and locational attributes, but are shown to illustrate the range of rents quoted in the market. Supplemental Rental Data 2BR Units Of the additional data collected, the mean and median rent indications are $744 and $713 per month, respectively. The rents per square foot reflected a mean of $0.76 and a median of $0.73 per square foot. PAGE 80
85 No. City Year Built No.of Units Unit Type SF Per Unit Rent Per SF W/D Inventory Summary 2 BR Units Util. Included Notes 1 Gatlinburg BR / 1 BA N/A $770 N/A Laundry E/W/S/T/C 6 units in Gatlinbug near the Parkway. 2 Gatlinburg BR / 1 BA 1768 $900 $0.51 HU W/S Two level duplex off of Ski Mountain Road. 3 Gatlinburg BR / 2 BA 2100 $1,200 $0.57 HU W/S 4 Gatlinburg BR / 1 BA 588 $615 $1.05 N/A N/A 13 Unit complex along Ski Mountain Road. Limited turnover, most tenants work downtown with no plans of moving. 5 Kodak BR / 1 BA 812 $500 $0.62 HU S All brick four unit complex. 6 Kodak BR / 1 BA 970 $692 $0.71 HU W/S/T Rents range from $675 to $700 per month. 7 Pigeon Forge BR / 2 BA 1050 $750 $0.71 HU N/A Duplex with attached oversize garages. 8 Pigeon Forge BR / 2.5 BA 1472 $850 $0.58 HU N/A 7 Condo units for sale. All are currently rented and reportedly in good condition. 9 Pigeon Forge BR / 2 BA N/A $865 N/A HU N/A Triplex containing 4,264 square feet. The distribution of the SF is not known. 10 Pigeon Forge BR / 2 BA N/A $850 N/A HU N/A 11 Pigeon Forge BR / 1 BA N/A $875 N/A Laundry N/A Older triplex with shared laundry. 12 Pigeon Forge BR / 2 BA 1264 $850 $0.67 HU N/A Triplex with rents averaging $850 per month. 13 Pigeon Forge BR / 1 BA 816 $650 $0.80 W/D N/A Newer duplex built in 2012 with two, two bedroom units. 14 Pigeon Forge BR / 2 BA 1108 $750 $0.68 HU N/A Duplex near the Parkway in Pigeon Forge. 15 Sevierville BR / 1 BA N/A $500 N/A HU S Four units, all units are reportedly rented for $500 monthly. 16 Sevierville BR / 2 BA 1021 $875 $0.86 N/A N/A Five units located on Hopson Street in Sevierville. A detached two car garage is also available. 17 Sevierville BR / 1.5 BA 902 $675 $0.75 HU W Four two bedroom, one and one half bath units that rent for $675 according to information online. 18 Sevierville BR / 1 BA N/A $600 N/A None S Four units in Sevierville. W/D hookups are not available but the property has a coin operated laundy facility. 19 Sevierville BR / 2 BA 960 $650 $0.68 HU N/A All brick with attached carports. 20 Sevierville BR / 1 BA 812 $750 $0.92 HU S Duplex near Middle Creek Road. 21 Sevierville BR / 1 BA 858 $650 $0.76 HU S Two units near Pittman Center Road. 22 Sevierville N/A 2 2 BR / 2 BA N/A $775 N/A HU S Two modular units with unknown year built. 23 Sevierville BR / 1 BA N/A $650 N/A HU N/A Rent quoted is for year lease. 24 Sevierville BR / 1 BA 768 $450 $0.59 W/D S Duplex on a large lot. 25 Sevierville BR / 1 BA 540 $450 $0.83 HU S Duplex with one upstairs and one downstairs unit. The upper level is the unit with the higher rent. 26 Sevierville BR / 1 BA 600 $600 $1.00 HU S Modular duplex in an area of rental properties. 27 Sevierville BR / 2 BA 912 $550 $0.60 HU N/A Two separate homes located at this address. Parcel has river frontage. 28 Sevierville BR / 1 BA N/A $550 N/A HU W Nine apartments with rents ranging from $500 to $600 per month. 29 Sevierville BR / 2 BA N/A $700 N/A HU S Triplex on Dollys Drive near other rental properties. 30 Sevierville BR / 1.5 BA 832 $550 $0.66 HU N/A This property contains seven townhouse units. 31 Sevierville BR $602 N/A N/A N/A S8 property with unknown floor plans. Rents were taken from online information. Property bears the name Gateway Village 32 Sevierville N/A 1 2 BR / 2 BA 1308 $1,450 $1.11 HU N/A Condo unit in Sevierville. 33 Sevierville N/A 4 2 BR / 1.5 BA N/A $1,000 N/A W/D Pest Fourplex that has been recently updated with new appliances and granite countertops 34 Sevierville N/A 1 2 BR / 1 BA 800 $725 $0.91 W/D N/A Apartmetn in Kirkland Manor 35 Sevierville N/A 1 2 BR / 2 BA 1100 $1,000 $0.91 HU W Rent to own unit that was recently remodeled. $1,000 includes $100 per month for HOA. 36 Sevierville N/A 1 2 BR / 2 BA 1200 $900 $0.75 HU N/A House for rent in Sevierville. Information taken from Craigslist. Mean $744 $0.76 Median $713 $0.73 Unable to Attain Rental Rates 37 Kodak BR / 2 BA N/A N/A N/A W/D S Duplex that is reportedly in good condition. 38 Kodak BR / 1 BA 859 N/A N/A HU S Triplex with unknown rents. 39 Sevierville BR / 1.5 BA N/A N/A N/A HU S 40 Sevierville BR / 2 BA N/A N/A N/A HU S 41 Sevierville BR / 2 BA 940 N/A N/A HU S Duplex with attached carports. 42 Sevierville BR / 1 BA 924 N/A N/A HU N/A Duplex near Sevier County High School. 43 Sevierville BR / 1 BA N/A N/A N/A HU S Four units with frontage on French Broad River and dock. No central HVAC. 44 Sevierville BR / 1 BA N/A N/A N/A W/D N/A Duplex with storage garage. 45 Sevierville BR / 1.5 BA N/A N/A N/A HU N/A 46 Sevierville BR / 2 BA 1044 N/A N/A W/D S Two story duplex with unknown rents. 47 Sevierville BR / 1 BA 832 N/A N/A None N/A 10 of 12 units are occupied while remaining two units are being used for personal storage. 48 Sevierville BR / 1 BA 850 N/A N/A N/A N/A 18 unit complex that would not participate in survey. 49 Sevierville BR / 1.5 BA 1100 N/A N/A N/A N/A PAGE 81
86 Three-Bedroom Units: The comparables shown in this chart generally reflect rental rates ranging from $1,115 to $1,125 with a mean of $1,118 and a median of $1,115 per unit. The mean and median rent per square foot of this dataset is $0.78 and $0.72 square foot, respectively. Three-Bedroom Rental Summary (By Adjusted Monthly Rent) Rental Complex Year Unit Size Monthly Water/ Rent Per WD/HU Adj. Rent No. Name Built / Ren Type (Sq. Ft.) Rent Sewer Sq. Ft. 20 Smoky Crossing BR/2.5BA - TH 1,547 $1,115 $1,115 $ Smoky Crossing BR/2.5BA - TH 1,667 $1,115 $1,115 $ The Overlook at Allensville Square Ph. I BR/2BA 1,175 $1,125 $1,125 $0.96 Minimum ,175 $1,115 $1,115 $0.67 Mean ,463 $1,118 $1,118 $0.78 Median ,547 $1,115 $1,115 $0.72 Maximum ,667 $1,125 $1,125 $0.96 Note: Please note that the rental rates from the market have not been adjusted for various physical and locational attributes, but are shown to illustrate the range of rents quoted in the market. The two above projects reflect higher quality assets that contain amenities and are professionally managed. Supplemental Rental Data 3BR Units Of the additional data collected, the mean and median rent indications are $768 and $838 per month, respectively. The rents per square foot reflected a mean of $0.56 and a median of $0.52 per square foot. PAGE 82
87 No. City Year Built No.of Units Unit Type Inventory Summary 3 BR Units SF Per Unit Rent Per SF W/D Util. Included Notes 1 Pigeon Forge BR / 2 BA N/A $1,010 N/A HU N/A Triplex containing 4,264 square feet. The distribution of the SF is not known. 2 Pigeon Forge BR / 1 BA N/A $900 N/A Laundry N/A Older triplex with shared laundry. 3 Pigeon Forge BR / 2 BA 1635 $850 $0.52 HU N/A Triplex with rents averaging $850 per month. 4 Pigeon Forge BR / 3 BA N/A $825 N/A HU N/A Six condominium units with rents ranging from $750 to $900 monthly. 5 Sevierville BR / 1 BA N/A $500 N/A HU S Four units, all units are reportedly rented for $500 monthly. 6 Sevierville BR / 1 BA N/A $500 N/A HU S Four units, all units are reportedly rented for $500 monthly. 7 Sevierville BR / 2 BA 1734 $700 $0.40 HU N/A Two separate homes located at this address. Parcel has river frontage. 8 Sevierville N/A 1 3 BR / 2 BA 1152 $860 $0.75 None N/A Modular home listed on Craigslist for $860 per month. Mean $768 $0.56 Median $838 $0.52 Unable to Attain Rental Rates 9 Sevierville BR / 1 BA N/A N/A N/A N/A Duplex near downtown with good traffic counts. PAGE 83
88 A summary of the weighted average rent and rent per square foot are outlined in the following table and charts. Summary of Rent Comp Averages (not adjusted) Co m Identification Avg. Unit NRA Avg. Rent Per Mo. Avg. Rent Per NRA 1 A 946 $935 $ B 968 $711 $ C 1,050 $725 $ D 1,000 $700 $ E 695 $600 $ F 825 $630 $ G 800 $600 $ H 700 $525 $ I 900 $600 $ J 850 $600 $ K 924 $795 $ L 800 $800 $ M 956 $602 $ N 700 $575 $ O 532 $634 $ P 625 $495 $ Q 1,257 $947 $0.75 Mean 855 $675 $0.80 Median 850 $630 $0.75 *Due to the lack of breakdown for the number of units per floor plan, the average rent, unit size, and rent per SF are unweighted. PAGE 84
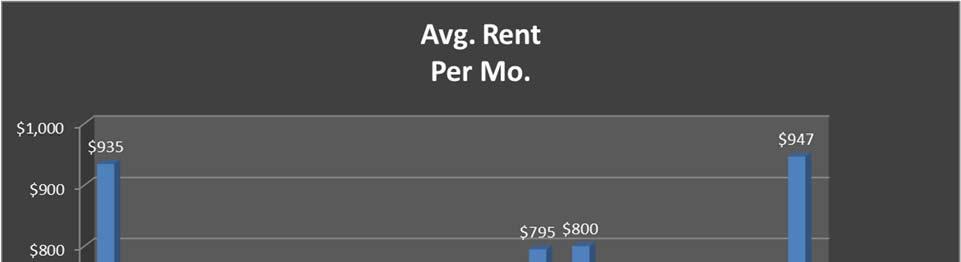
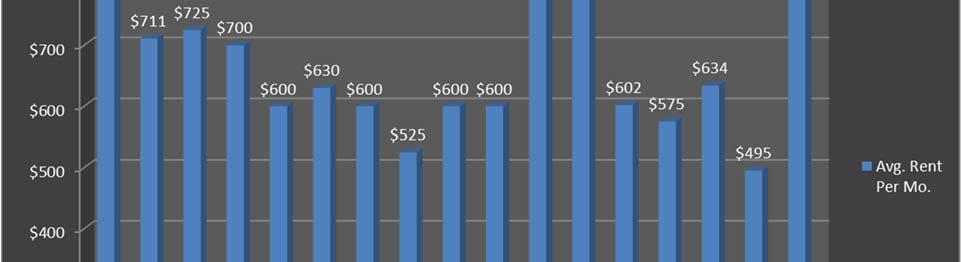

89 PAGE 85
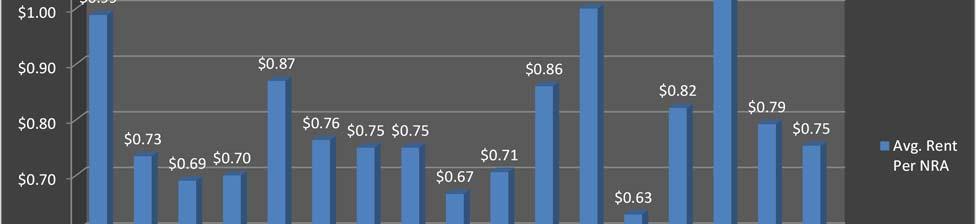

90 PAGE 86


91 1. Highland Ridge COMPARABLE RENTALS MAP LIHTC Units 2. Dogwood Ridge 3. Gist Creek 4. Riverpark II 5. Meadow Creek 6. Riverpark PAGE 87
92 Market Rent Analysis LIHTC Units The following summaries sort the complexes in ascending order by amount of monthly rent for each of the unit types proposed. Additional pricing adjustments applied to the comparables downward adjustments to comparables that include washer/dryer appliances or cable/internet. However, no other adjustments have been applied, such as those for age/condition, location, square footage, other unit/project amenities, etc. Within the LIHTC properties, the base rent includes water/sewer, which is consistent with the maximum rents and utility allowances surveyed. One-Bedroom Units: The comparables shown in this chart generally reflect rental rates ranging from $412 to $509 with a mean of $454 and a median of $448 per unit. The mean and median rent per square foot of this dataset is $0.68 and $0.71 per square foot, respectively. One-Bedroom LIHTC Rental Summary (By Adjusted Monthly Rent) - Assuming W/S/T is Included Rental Complex Year Unit AMI Size Monthly Water/ Rent Per WD/HU Adj. Rent No. Name Built / Ren Type Restriction (Sq. Ft.) Rent Sewer Sq. Ft. 23 Gist Creek BR/1BA 50% 822 $395 -$30 $47 $412 $ Riverpark BR/1BA 50% 588 $415 $30 $445 $ Riverpark BR/1BA 60% 588 $415 $30 $445 $ Riverpark II BR/1BA 60% 600 $450 $450 $ Meadow Creek BR/1BA 60% 690 $430 $30 $460 $ Gist Creek BR/1BA 60% 822 $492 -$30 $47 $509 $0.62 Minimum $395 $412 $0.50 Mean $433 $454 $0.68 Median $423 $448 $0.71 Maximum $492 $509 $0.76 Note: Please note that the rental rates from the market have not been adjusted for various physical and locational attributes, but are shown to illustrate the range of rents quoted in the market. Two-Bedroom Units: The comparables shown in this chart generally reflect rental rates ranging from $465 to $617 with a mean of $515 and a median of $503 per unit. The mean and median rent per square foot of this dataset is $0.50 and $0.49 per square foot, respectively. Two-Bedroom LIHTC Rental Summary (By Adjusted Monthly Rent) - Assuming W/S/T is Included Rental Complex Year Unit AMI Size Monthly Water/ Rent Per WD/HU Adj. Rent No. Name Built/Ren Type Restriction (Sq. Ft.) Rent Sewer Sq. Ft. 22 Dogwood Ridge BR/1BA 50% 997 $495 -$30 $465 $ Highland Ridge BR/2BA 50% 1,110 $500 -$30 $470 $ Dogwood Ridge BR/1BA 60% 997 $510 -$30 $480 $ Gist Creek BR/2BA 50% 1,106 $448 -$30 $75 $493 $ Riverpark BR/1.5BA - TH 60% 912 $500 $500 $ Dogwood Ridge BR/2BA 60% 1,050 $535 -$30 $505 $ Riverpark II BR/2BA 60% 950 $535 $535 $ Meadow Creek BR/1BA 60% 950 $535 $535 $ Highland Ridge BR/2BA 60% 1,110 $580 -$30 $550 $ Gist Creek BR/2BA 60% 1,106 $572 -$30 $75 $617 $0.56 Minimum $448 $465 $0.42 Mean ,029 $521 $515 $0.50 Median ,024 $523 $503 $0.49 Maximum ,110 $580 $617 $0.56 Note: Please note that the rental rates from the market have not been adjusted for various physical and locational attributes, but are shown to illustrate the range of rents quoted in the market. PAGE 88
93 Three-Bedroom Units: The comparables shown in this chart generally reflect rental rates ranging from $551 to $732 with a mean of $623 and a median of $615 per unit. The mean and median rent per square foot of this dataset is $0.52 and $0.53 per square foot, respectively. Three-Bedroom LIHTC Rental Summary (By Adjusted Monthly Rent) - Assuming W/S/T is Included Rental Complex Year Unit AMI Size Monthly Water/ Rent Per WD/HU Adj. Rent No. Name Built / Ren Type Restriction (Sq. Ft.) Rent Sewer Sq. Ft. 21 Highland Ridge BR/2BA 50% 1,283 $581 -$30 $551 $ Gist Creek BR/2BA 50% 1,231 $512 -$30 $116 $598 $ Riverpark BR/1.5BA - TH 60% 1,125 $600 $600 $ Riverpark II BR/2BA 60% 1,140 $615 $615 $ Meadow Creek BR/2BA 60% 1,140 $615 $615 $ Highland Ridge BR/2BA 60% 1,283 $680 -$30 $650 $ Gist Creek BR/2BA 60% 1,231 $646 -$30 $116 $732 $0.59 Minimum ,125 $512 $551 $0.43 Mean ,205 $607 $623 $0.52 Median ,231 $615 $615 $0.53 Maximum ,283 $680 $732 $0.59 Note: Please note that the rental rates from the market have not been adjusted for various physical and locational attributes, but are shown to illustrate the range of rents quoted in the market. A summary of the weighted average rent and rent per square foot are outlined in the following table and charts. Summary of LIHTC Rent Comp Averages (not adjusted) Comp. No. of Avg. Unit Avg. Rent Avg. Rent tific No. Units NRA Per Mo. Per NRA A Hig 88 1,167 $584 $0.50 B Do 54 1,015 $517 $0.51 C Gis 48 1,080 $510 $0.47 D Riv $544 $0.57 E Me $544 $0.56 F Riv $516 $0.56 Mean 56 1,019 $536 $0.53 Median $531 $0.54 PAGE 89


94 Avg. Rent Per Mo. $600 $584 $517 $510 $544 $544 $516 $500 $400 $300 $200 Avg. Rent Per Mo. $100 $0 A B C D E F Avg. Rent Per NRA $0.60 $0.50 $0.50 $0.51 $0.47 $0.57 $0.56 $0.56 $0.40 $0.30 Avg. Rent Per NRA $0.20 $0.10 $0.00 A B C D E F PAGE 90
95 OCCUPANCY My analysis of the local multifamily market is based upon surveys of property owners and managers of local comparable complexes. There is no third party reporting service for this data. Of the stabilized conventional properties surveyed by Hodges & Pratt, the physical occupancies range from 93.0% to 100% with an aggregate of 97.7%. Excluding the 402-unit deal in Seymour, the aggregate occupancy is 99.6%. Per the client s request, specifics regarding each property have been retained in the workfile. Conventional Occupancy Complex Name Units City State Date Surveyed Original Occupancy Year Built Rate Total / Averages 1, % Excluding Smoky Crossing (Seymour) % Of the stabilized LIHTC properties surveyed by Hodges & Pratt, the physical occupancies range from 95.0% to 100% with an aggregate of 97.8%. It is pertinent to note that three of the LIHTC managers surveyed indicated that additional demand was needed and they believed additional affordable supply would be absorbed at a rapid rate. LIHTC Occupancy Complex Name Units City State Date Surveyed Original Occupancy Year Built Rate Highland Ridge 88 Sevierville TN February 15, % Dogwood Ridge 54 Sevierville TN March 3, % Gist Creek 48 Sevierville TN March 2, % Riverpark II 50 Sevierville TN March 3, % Meadow Creek 50 Sevierville TN March 2, % Riverpark 46 Sevierville TN March 3, % Total / Averages % Of the Section 8 properties that responded to our survey, each was 100% with a waiting list. Section 8 Occupancy Complex Name Project Type Units City State Date Surveyed Original Occupancy Year Built Rate Gateway Village Family 36 Sevierville TN March 13, % Park Village Family 32 Sevierville TN March 3, % Woodland Park Elderly 55 Sevierville TN March 13, % Renaissance Square Elderly 81 Seymour TN March 13, % The Commons Elderly 20 Seymour TN March 13, % Riverview Apartments* Disabled* 20 Sevierville TN N/A 1992 N/A Total / Averages % *Excluded, did not respond PAGE 91
96 Turnover Rates Most of those surveyed were unaware of their turnover rates. However, it is evident from the conversations that units do not turn over very often. The following data was extracted from the American Community Survey (ACS) report. The average move-in date from this survey was Renter Occupied Housing Units by Year Householder Moved into Unit Sevierville Pigeon Forge Gatlinburg Sevier County Moved in 2010 or later 1, % % % 6, % Moved in 2000 to , % % % 4, % Moved in 1990 to % % % % Moved in 1980 to % 0 0.0% % % Moved in 1970 to % 0 0.0% 0 0.0% % Moved in 1969 or earlier % 0 0.0% 0 0.0% % Source: U.S. Census Bureau/STDB Projections Waiting Lists The following data outlines the waiting lists noted by the conventional comparables. Given the overwhelming percentage of two-bedroom units in the market, there are likely more people on waiting lists for this unit type. However, it is believed that all unit types are experiencing waiting lists. As noted in the report, both the LIHTC and Section 8 managers also noted waiting lists. The chart to the right outlines the responses received when asked if there was a waiting list. Waiting List? n/a people n/a Yes- number unknown n/a n/a Yes- number unknown Yes- number unknown Yes- number unknown Yes- number unknown Yes- number unknown people n/a Yes- number unknown n/a people Yes- number unknown Yes- number unknown Yes- number unknown n/a PAGE 92
97 DEMAND BY UNIT TYPE The chart and graph below shows that the ratio of one-bedroom units, two-bedroom units, and three-bedroom units in the market. As can be seen by the data, the overwhelming majority of the conventional dataset reflects two-bedroom units. There is believed to be demand for a wide variety of units in the market. There has been a clear focus on developing two-bedroom units in the market. This is believed to be associated with the incremental costs of building a twobedroom unit versus a one-bedroom unit. A high percentage of one-bedroom units is generally concentrated in larger market with higher levels of income that are catering to a young professional audience. Following the conventional tables, the LIHTC unit mixes are shown. There is more of a balanced unit mix in the LIHTC complexes. Unit Mix Ratio Complex Year Built One BR Two BR Three BR A % 67% 8% B % - C % - D % 53% - E % - F % - G % - H % - I % - J % - K % - L % - M % - N % - O % - P % - Q % 36% - R % 65% 25% Low 10% 36% 8% High 64% 100% 25% Mean 37% 90% 17% Median 36% 100% 17% PAGE 93


98 100% 90% 80% 70% 60% 50% 40% One BR Two BR Three BR 30% 20% 10% 0% A B C D E F G H I J K L M N O P Q R PAGE 94

99 LIHTC Complexes Unit Mix Ratio Complex Year Built One BR Two BR Three BR A % 33% B % - C % 66% 17% D % 72% 20% E % 52% 32% F % 52% 30% Low 8% 52% 17% High 18% 100% 33% Mean 15% 68% 26% Median 17% 67% 30% 100% 90% 80% 70% 60% 50% 40% One BR Two BR Three BR 30% 20% 10% 0% A B C D E F PAGE 95
100 AVERAGE SQUARE FOOTAGE The square footages in the local market are outlined on the following chart. There data is provided to illustrate typical unit sizes currently available in the market. Average Unit Size Complex Year Built One BR Two BR Three BR A ,000 1,175 B ,050 - C ,000 - D E F G H I J K L M N O P Q ,184 1,607 Low ,175 High 860 1,184 1,607 Mean ,391 Median ,391 PAGE 96

101 1,600 1,400 1,200 1, One BR Two BR Three BR A B C D E F G H I J K L M N O P Q PAGE 97


102 LIHTC Units Average Unit Size Complex Year Built One BR Two BR Three BR A ,110 1,283 B ,015 - C ,106 1,231 D ,140 E ,140 F ,125 Low ,125 High 822 1,110 1,283 Mean 675 1,007 1,184 Median ,140 1,400 1,200 1, One BR Two BR Three BR A B C D E F CONCESSIONS None of the properties surveyed are offering concessions. This is a good sign for the market and is often tied to a tight market or one that reflects a lack of new supply. PAGE 98
103 SAMPLE OF NEWSPAPER ARTICLES The following data summarizes some recent newspaper articles as it relates to the local housing market and wildfires. The title of the article, author, news source, and date have been italicized. Bullet points outlining some of the pertinent data is shown below each article. Gatlinburg Affordable Housing Market Struggles After Fire. Written by Rachel Ohm, Knoxville News Sentinel, January 4, One property owner for a local motel indicated that the most common question asked is whether or not the rooms contain a kitchen. This indicates that several potential renters are seeking long term residency. 2. The same property owner stated that he has seen a housing shortage since 2004 and has only worsened since the fires. 3. The article states that nearly 43% of Sevier County residents that rent are living in costburdened housing. This means they spend over 30% of their income on housing. 4. THDA has waived income restrictions for low-income tax credits and provided additional Section-8 housing vouchers to affected income-eligible families. 5. THDA also provided $164,000 in grant money to three local agencies helping to deal with Sevier County s housing shortage. (The Tennessee Valley Coalition of Homelessness, Helen Ross McNabb Center and Family Promise of Blount County). 6. Most residents that are from Gatlinburg have been hesitant to leave Gatlinburg, and the lack of public transportation makes this more difficult. 7. Long-term or weekly rentals are common within the market for low-income residents of Sevier County. 8. Many structures that were lost to the fires will not be rebuilt due to the additional cost associated with bringing these buildings up to current code. After the Flames, Mountain Tough Gatlinburg Looks to the Future. Written by Darryl Fears, The Washington Post, December 8, The goal for reopening Gatlinburg was two weeks after the fires were extinguished. 2. Sevier County, Gatlinburg and Tennessee Emergency Management Agency are looking for answers as to why so many residents weren t warned in time. 3. The biggest reason the fires spread so quickly was the wind. 4. The large amount of wooden structures is another factor that contributed to the spread of the fires. 5. Many residents were not able to be warned because the fires had damaged the local infrastructure, which made communication more difficult. Tennessee Hiring Sevier County Wildfire Victims with $5.8 Million Federal Grant. Written by uncredited, The Associated Press, March 6, A total of $5.8 million dollars is being used to employ local residents that lost their jobs due to the fire. 2. The residents will be employed by aiding the cleanup effort currently going on in relation to the wildfires. PAGE 99
104 3. $2 million is immediately available while the remaining $3.8 million will be distributed throughout the year. Family Promise Providing Housing for Sevier County Fire Victim. Written by Rachel Totten, The Daily Times, December 30, Family Promise of Blount County is one of the organizations that is attempting to help rehome residents that have been displaced by the fires. 2. The organization is able to do this due to an Emergency Solutions Grant (ESG) provided by Tennessee Housing and Development Agency (THDA). 3. The grant allows them to do this without dipping into their typical budget. 4. Additional emphasis is put on low-income families. 5. Some residents have been placed in the local Mainstay Suites and transitional housing, in Blount County, operated by Family Promise. Gatlinburg Hotels Getting Back to Busy. Written by Jim Gaines, Knoxvillebiz.com, December 23, Chalet Village lost 40 of 100 total cabins to the fire. 2. Many hotels experience an uptick in business since Gatlinburg reopened. Some of this is attributed to residents using the hotels for housing. A Month After Historic Fire, Gatlinburg Rebuilds. Written by Steve Ahillen, Knoxville New Sentinel, December 28, total residents lost their lives due to fire related causes ,140 acres were burned in what s being called the Chimney Tops Two Fire. 3. A December 13, 2016 news report estimated damage at $500 million. 4. Total firefighting cost is estimated at approximately $9 million. 5. Approximately 780 firefighters from 40 states, 61 fire engines, 7 helicopter and 5 bulldozers were utilized to fight the fires. 6. Two teenagers age 17 and 15 were charged with aggravated arson on December 7, Wildfire Highlighted Need for Affordable Housing in Gatlinburg. Written by Gerald Witt, USA Today, February 27, Some efficiency apartments in Downtown Gatlinburg rent for $700 monthly. 2. Residents have complained that many housing needs are not being met. 3. Some second homes are rented out to local residents in the off season. 4. The fire consumed roughly 15.9% of Gatlinburg s housing stock. 5. The fire consumed roughly 4% of Sevier County s housing stock. 6. HUD is waiving the 45-day waiting period for some families affected by the fire that allows them to receive federal housing assistance. PAGE 100
105 7. HUD is also bringing a 1.5 million dollar program online for new development addressing low-income housing. 8. A quote by a local resident in the article states People who have jobs cleaning hotels or flipping flapjacks in a restaurant make too much money to qualify for housing vouchers, but not enough to afford resort-area prices. 9. Weekly hotel rentals are a common occurrence for these types of workers. TYPICAL EQUITY REQUIREMENTS Based on interviews that we have conducted with both developers and lenders, typical equity requirements for a new construction, conventional loan would be in the 25% to 35% range assuming a for-profit entity. The requirements for a non-profit sponsor and/or an affordable development would vary based on the details of the deal. SUMMARY AND CONCLUSIONS There appears to be significant demand for new units in this market; both market-rate and affordable product. The local market has experienced a shortage of new rental housing stock for a number of years. The primary reasons for the lack of new supply to the market is a combination of below average income levels, low price points in rent, high land values associated with the tourism market, lack of available services and transportation, and the topography of the sites that are reasonably affordable. The recent wildfire event that occurred has exposed and intensified the housing issues as many of the structures served as rental housing units. There is believed to be demand present for a variety of housing price points. For a market-rate, new construction project there are several benefits for a developer financing the deal through the HUD Section 221(d)(4) program. The most recent development (Allensville Square) was developed through this program. While it generally takes longer to close the loan, the 40-year, fixed-rate amortization with a non-recourse loan is very attractive. The long-term amortization period allows for better debt coverage ratios that a shorter amortization period would allow. Suggestions for developers would include the following items. Maximize the local incentives, to the degree in which the local municipalities will participate. It would be helpful to find land owner that want to contribute land to the deal for some equity component. Having the land put in as part of the deal will help with the feasible rent needed to justify new construction. Partner with local employers to master lease a number of units that could help them attract a qualified workforce while potentially assisting with securing a loan. Having a non-profit sponsor for an affordable housing development significantly increases the opportunities for various grants and financing incentive. Specific conclusions as it relates to individual items can be found in the Executive Summary. PAGE 101

106 CERTIFICATION NCHMA MEMBER CERTIFICATION This market study has been prepared by Hodges & Pratt, a member in good standing of the National Council of Housing Market Analysts (NCHMA). This study has been prepared in conformance with the standards adopted by NCHMA for the market analysts industry. These standards include the Standard Definitions of Key Terms Used in Market Studies, and Model Content Standards for the Content of Market Studies. These Standards are designed to enhance the quality of market studies and to make them easier to prepare, understand, and use by market analysts and by the end users. These Standards are voluntary only, and no legal responsibility regarding their use is assumed by the National Council of Housing Market Analysts. Hodges & Pratt is duly qualified and experienced in providing market analysis for Affordable Housing. The company s principals participate in the National Council of Housing Market Analysts (NCHMA) educational and information sharing programs to maintain the highest professional standards and state-of-the-art knowledge. Hodges & Pratt is an independent market analyst. No principal or employee Hodges & Pratt has any financial interest whatsoever in the development for which this analysis has been undertaken. While the document specifies Hodges & Pratt the certification is always signed by the individual completing the study and attesting to the certification. (NOTE: Information on the National Council of Housing Market Analysts may be obtained by calling , or by visiting Nelson C. Pratt, MAI Tennessee Certified General Real Estate Appraiser, CG-2754 PAGE 102
107 ADDENDA PAGE 103
108 CHECKLIST OF ITEMS
109 Checklist Item Page # Supply analysis for the multifamily market 32 Demand analysis for rental housing based on historical and projected household growth 24 Supply analysis of the single family market 44 Discussion of how trailers and mobile home communities are meeting existing needs 54 Discussion of the substandard housing issues in the market, such as hotels and cabins that are not winterized, etc. 37 Discussion of the various Cities, locations, and commuting patterns 20 1 (in Discussion of the unfilled jobs and their potential impact on new housing for recruitment summary) Definitions of various types of multifamily housing to include conventional/market-rate, affordable (Low Income Housing Tax Credit - LIHTC), subsidized (Section 8), and public housing 9 Illustrate the items utilized in determining a LIHTC market study for Tennessee Housing Development Agency (THDA) Addenda Affordability discussion and how that impacts the rent levels 40 Occupancy rate analysis of the existing local inventory along with some of the surrounding markets in which current employees may reside and commute 91 Absorption rates of the newest product in the local and surrounding markets 29 Individual write-ups of the existing multifamily properties Addenda Survey of student housing projects and discussion how the rents are typically leased by the bedroom 56 Historical and current development patterns 27 Descriptions of the area characteristics to include demographic analysis of population growth, household growth, and industry. Consideration would be given to several geographies to include City, County, Zip Codes, Drive Times and Census Tracts 58 Discussion of various cities, locations and commuting patterns. This could include transportation issues for workers 20 Survey of student housing projects and discussion how the rents are typically leased by bedroom. Include an evaluation of J1 students needs with the J1 student providers 56 Add a discussion about how many in the workforce are working double shifts or working two jobs 2 Sample the needs of small business as it relates to workforce housing by conducting surveys with local employers 2 What are the market rents and occupancies for unrestricted conventional rental properties in Gatlinburg? In Sevierville? In Pigeon Forge? Are there wide variances based on seasons of the year? 78 What are the occupancies, rental rates and locations of existing LIHTC properties in Sevier County? Are there wide variances in occupancy or collections based on the season of the year? 88 Top ten list of major employers (by employee total) in Sevier County? Gatlinburg? Sevierville? Pigeon Forge? (for operators that own multiple hotels, amusement parks or other businesses- some attempt to roll up those numbers to common owner principals) 67 Some idea of the proportion of foreign student visa population as a percentage of the total deemed income-eligible households in Sevier County at any given point 56 Look at the Utility Usage for seasonal housing and comment on the barrier to entry from high deposits/rates 41 Elaborate on the single family housing market <$150, Analyze Turnover Rates from complexes 92 Discuss Waiting Lists 92 Be sure to note proximity to major arteries to all comparables 76 Impact of the Wildfire on housing needs to include loss of housing stock (apartments, hotels, etc.) and the additional need caused by the event 71 Incentive programs available and used in other markets to entice workforce housing development to include community funds, grant programs, etc. Addenda GIS mapping of the available services in the market N/A Typical equity requirements for a new construction project 101
110 ESRI/STDB ONLINE DEMOGRAPHIC DATA
111
112
113
114
115
116
117
118
119
120
121
122
123
124
125
126

127
128
129

130
131
132
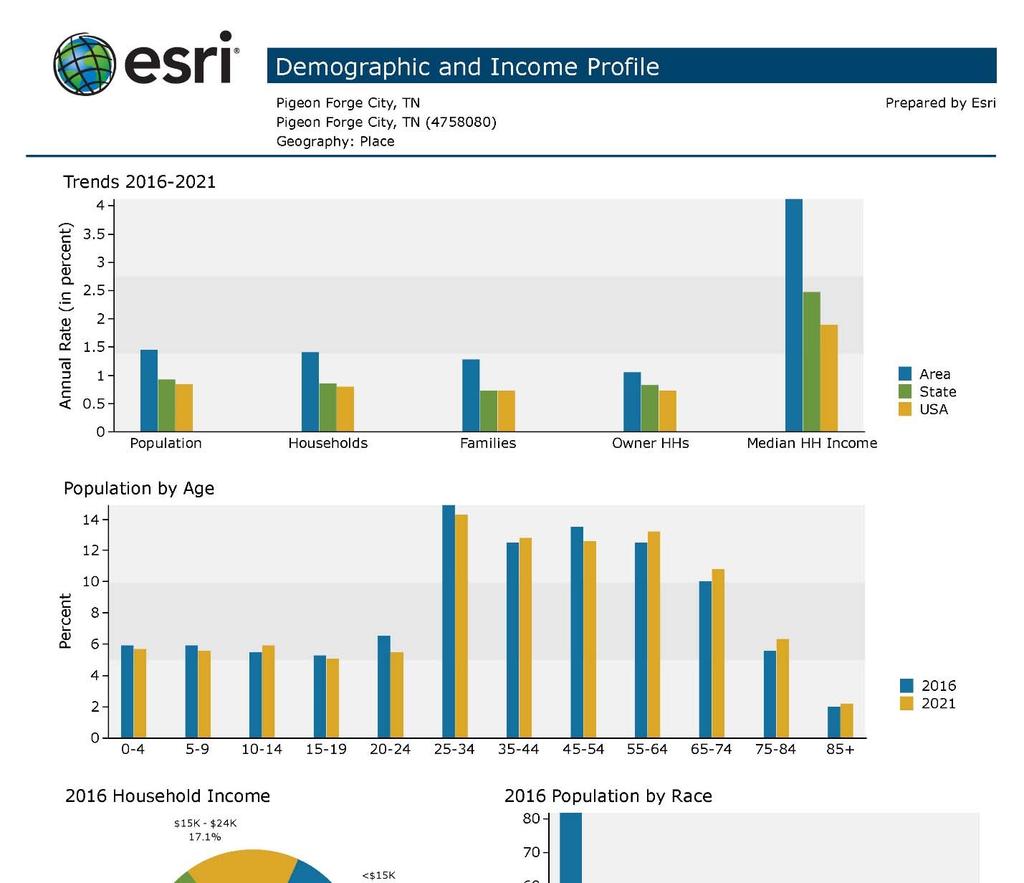
133
134
135
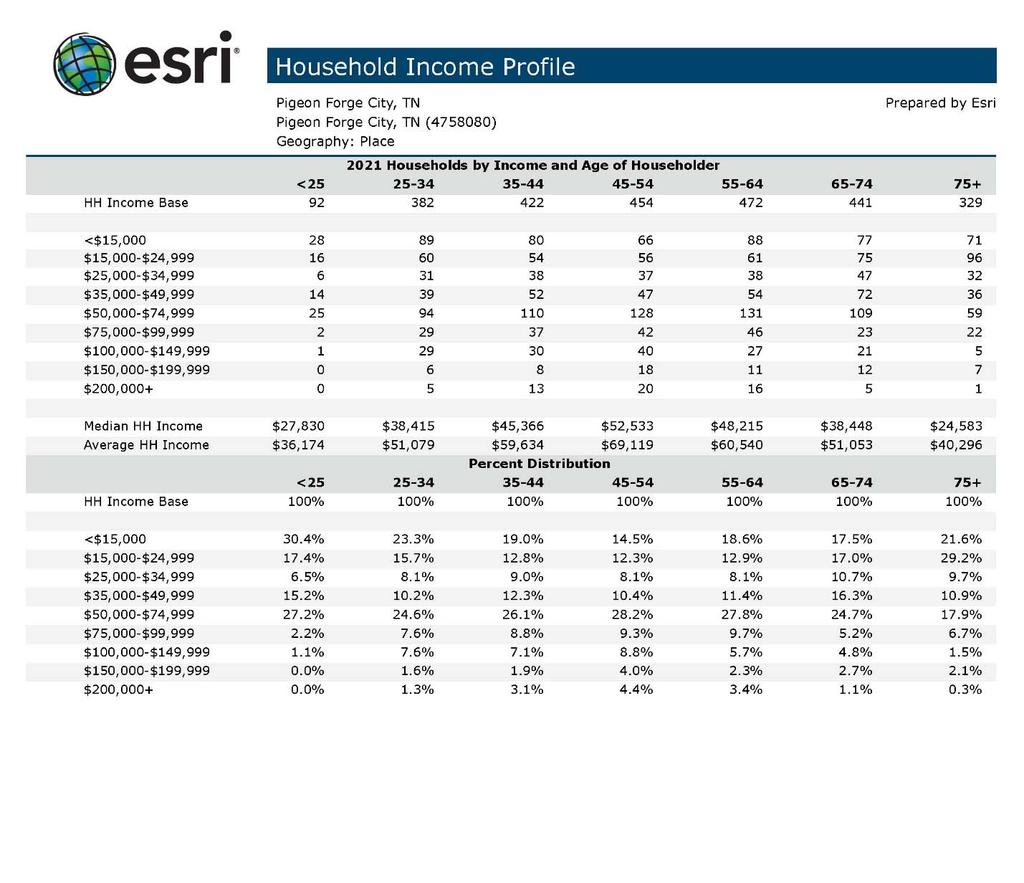
136
137
138
139
140
141

142
143
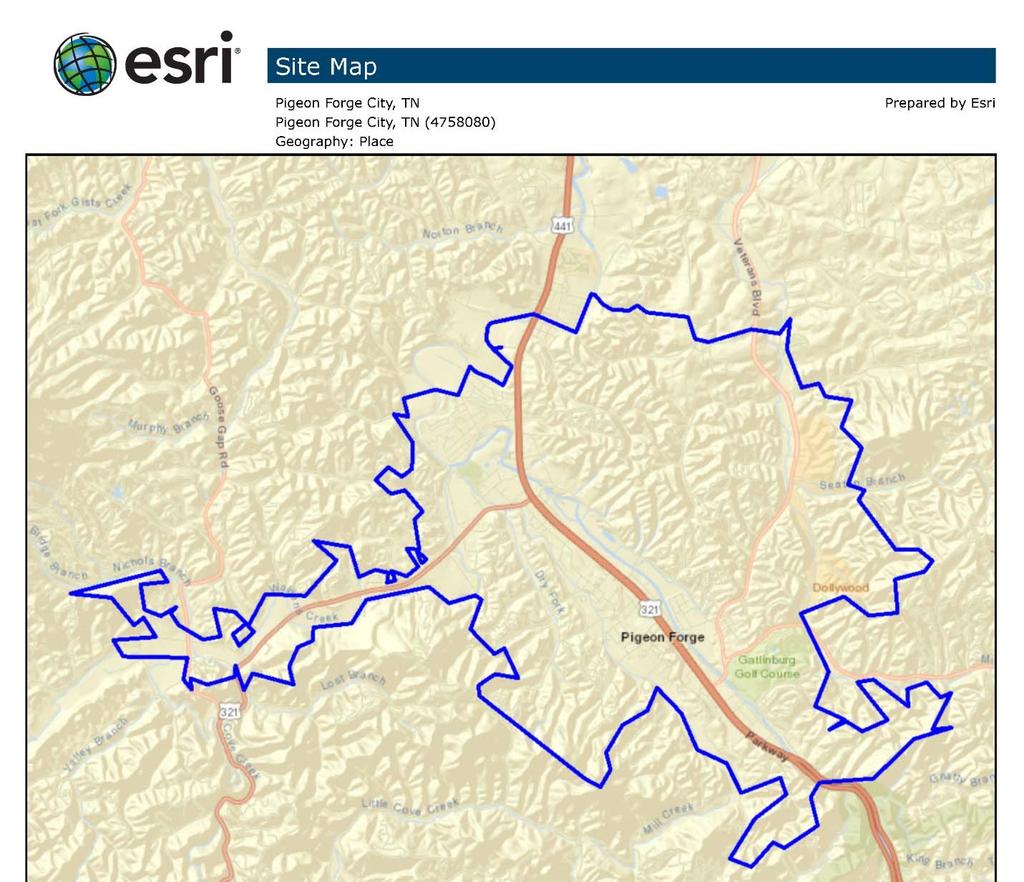

144

145
146
147
148


149

150
151
152
153
154
155
156
157

158
159

160

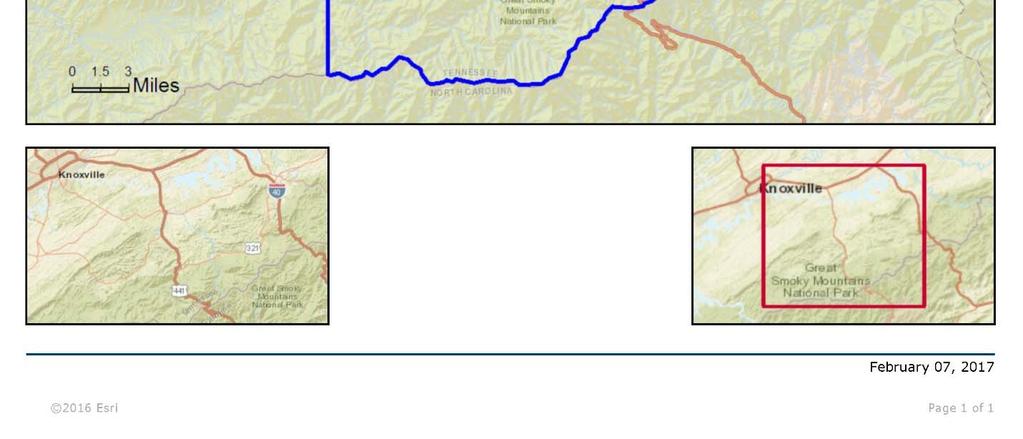
161
162

163
164

165
166
167

168
169
170

171
172
173
174
175
176
177


178
179 AMI RENT LEVELS
180
181 UTILITY ALLOWANCES
182
183
184
185
186
187 DEMAND CALCULATIONS
188 Net Demand Analysis - Sevier County CONVENTIONAL Projected Change in Household Base Households Total Growth Estimated 2015 Household 37,428 Estimated 2016 Household 37, Projected 2017 Household 38, Projected 2018 Household 38, Projected 2019 Household 39, Projected 2020 Household 39, Net Change in Household from ,361 Add: Units Removed from Housng Stock Housing Stock Removal Rate Units Removed Estimated 2015 Housing Stock 61, % 202 Estimated 2016 Housing Stock 62, % 206 Projected 2017 Housing Stock 63, % 209 Projected 2018 Housing Stock 64, % 212 Projected 2019 Housing Stock 65, % 216 Total Units Removed from Housing Stock 1,045 New Housing Demand 3,405 Estimated Percent Renter Households over Analysis Period - New Households 50.00% New Rental Housing Demand 1,703 Household Income Over $35, % New Income-Qualified Rental Housing Demand 1,093 Add: Units Removed from Wildfire Lost Structures Units Lost Structures Affected 1, Total Units Removed from Housing Stock 232 Add: Multifamily Competitive Vacancy Inventory Vacant Income-Qualified Renter-Occupied Housing Units 8,283 0 Market Vacancy 5% 414 Less: Current Vacant Units 0 Vacant Units Required to Reach 5% Market Vacancy 414 Total Demand for New Rental Units over 5-year Period 1,740 The inputs for the demand chart are based on the preceding data outlined in the report. The data suggests there are between 1,500 and 2,000 units of demand for multifamily units in the County.
189 Net Demand Analysis - Gatlinburg Projected Change in Household Base Households Total Growth Estimated 2015 Household 1,873 Estimated 2016 Household 1, Projected 2017 Household 1, Projected 2018 Household 1, Projected 2019 Household 2, Projected 2020 Household 2, Net Change in Household from Housing Removal Units Add: Units Removed from Housng Stock Stock Rate Removed Estimated 2015 Housing Stock 6, % 22 Estimated 2016 Housing Stock 6, % 23 Projected 2017 Housing Stock 7, % 23 Projected 2018 Housing Stock 7, % 24 Projected 2019 Housing Stock 7, % 24 Total Units Removed from Housing Stock 116 New Housing Demand 314 Estimated Percent Renter Households over Analysis Period - New Households 50.00% New Rental Housing Demand 157 Household Income Over $35, % New Income-Qualified Rental Housing Demand 94 Add: Units Removed from Wildfire Lost Structure Units Lost Structures Affected 1, Total Units Removed from Housing Stock 232 Add: Multifamily Competitive Vacancy Inventory Vacant Income-Qualified Renter-Occupied Housing Units Market Vacancy 5% 25 Less: Current Vacant Units 0 Vacant Units Required to Reach 5% Market Vacancy 25 Total Demand for New Rental Units 351 The inputs for the demand chart are based on the preceding data outlined in the report. The data suggests there are between 350 and 500 units of demand within the Gatlinburg market.
190 AFFORDABLE Net Demand Analysis - Sevier County - 60% AMI Projected Change in Household Base Households Total Growth Estimated 2015 Household 37,428 Estimated 2016 Household 37, Projected 2017 Household 38, Projected 2018 Household 38, Projected 2019 Household 39, Projected 2020 Household 39, Net Change in Household from ,361 Housing Removal Units Add: Units Removed from Housng Stock Stock Rate Removed Estimated 2015 Housing Stock 61, % 202 Estimated 2016 Housing Stock 62, % 206 Projected 2017 Housing Stock 63, % 209 Projected 2018 Housing Stock 64, % 212 Projected 2019 Housing Stock 65, % 216 Total Units Removed from Housing Stock 1,045 New Housing Demand 3,405 Estimated Percent Renter Households over Analysis Period - New Households 50.00% New Rental Housing Demand 1,703 Household Income Between $21,000 and $33, % New Income-Qualified Rental Housing Demand 210 Demand from Rent-Overburdened HH 34.65% Rent-Overburdened HH 590 Demand from Substandard Housing 5.16% Substandard Housing 88 Add: Multifamily Competitive Vacancy Inventory Vacant LIHTC Units Market Vacancy 5% 17 Less: Current Vacant Units 8 Vacant Units Required to Reach 5% Market Vacancy 9 Total Demand for New Rental Units 897 The inputs for the demand chart are based on the preceding data outlined in the report. The data suggests there are between 800 and 1,000 units of demand for 60% LIHTC units in the overall County.
191 THDA CHECKLIST
192


193


194


195


196

197
198 THDA 2017 QAP AMENDMENTS FOR SEVIER COUNTY (DRAFT FORMAT)


199

200
201 INCENTIVE PROGRAMS / SOURCES
202 Housing Trust Fund (HTF) The Housing Trust Fund (HTF) is an affordable housing production program that complements existing Federal, state and local efforts to increase and preserve the supply of decent, safe, and sanitary affordable housing for extremely low- and very lowincome households, including homeless families. States and state-designated entities are eligible grantees for the Housing Trust Fund (HTF). HUD will allocate HTF funds by formula annually. A State must use at least 80 percent of each annual grant for rental housing; up to 10 percent for homeownership; and up to 10 percent for the grantee's reasonable administrative and planning costs. HTF funds may be used for the production or preservation of affordable housing through the acquisition, new construction, reconstruction, and/or rehabilitation of non-luxury housing with suitable amenities. All HTF-assisted units will be required to have a minimum affordability period of 30 years. Eligible activities and expenses include: Real property acquisition Site improvements and development hard costs Related soft costs Demolition Financing costs Relocation assistance Operating cost assistance for rental housing Reasonable administrative and planning costs Eligible forms of assistance include: Equity investments Interest-bearing loans or advances Non-interest bearing loans or advances Interest subsidies Deferred payment loans Grants Other forms of assistance approved by HUD Source:
203 Federal Home Loan Bank Affordable Housing Program (AHP), Cincinnati Office The Affordable Housing Program (AHP) is our largest and most impactful initiative more than $560 million awarded since 1990, more than 71,000 affordable housing units funded. AHP can be used to fund both ownership and rental projects. Grants are awarded on a competitive basis in one offering each year. Applications are typically accepted between May and August, with awards in November. The following is only a brief summary of the AHP. Complete program details, including guidelines, limits, definitions, and requirements are provided in the current AHP Implementation Plan and related documents which are available in the Program Documents and Forms section of the Community Investment section of this website. Source of AHP Funds Each of the Federal Home Loan Banks sets aside 10 percent of net earnings annually to be used as subsidies to finance development of affordable housing. The funds are made available only through financial institutions that are Members of the Federal Home Loan Banks. Non-profits, local governments, community development corporations, for-profits, and other organizations (known as Sponsors), seeking AHP funding must submit an application through a financial institution that is a Member of a Federal Home Loan Bank. Use of Funds AHP funds can be used to assist with the funding of new construction, acquisition, rehabilitation or any combination thereof for ownership and rental housing serving very low-, low- and moderate-income households. Very lowincome households are those with annual incomes at or below 50 percent of area median income. Low- and moderate-income households are those with annual incomes at or below 80 percent of area median income. The area median income guidelines are defined annually by the U.S. Department of Housing and Urban Development (HUD). Availability of Funds AHP funds are made available through a single competitive offering conducted annually. Interested Members and Sponsors have until the closing date for each offering to submit an application. Applications must be completed and submitted online to the FHLB by 5:00 P.M., Eastern Standard Time, August 1, 2016, for the FHLB s 2016 offering. Source:
204 FEMA Survivors of the Sevier County wildfires have been approved for nearly $10 million in FEMA disaster assistance and loans from the U.S. Small Business Administration. With the looming Feb. 13 deadline to register for FEMA disaster assistance, here is a snapshot of the wildfire recovery in Tennessee since the Dec. 15 major disaster declaration. Except as noted, the figures below are from close of business Feb. 5: Registrations approved for disaster assistance: 401 Individuals and Households Program amount approved: nearly $3 million Housing Assistance approved: more than $1.5 million Other Needs Assistance approved: nearly $1.5 million Percentage of housing inspections completed: 99 percent SBA loans to homeowners, renters and businesses of all sizes totaled: more than $6.8 million, including: more than $4.1 million in loans to homeowners and renters more than $2.7 million in loans to businesses for physical disaster damage and working capital. 1,271 survivor visits to the two disaster recovery centers and the Multi Agency Resource Center established during the recovery. Federal disaster assistance is available to eligible individuals and households, and to those who were working in or visiting Sevier County between Nov. 28 and Dec. 9 and had disaster-related damage. Source:
205 Community Investment Tax Credits (CITC) Incentive program administered in cooperation with the Tennessee Department of Revenue. Low construction loan interest rates. Available for non-profit sponsors. One incentive would be to lobby for a special term, limited basis, to entice a for-profit developer to be able to qualify. Financial institutions may obtain a credit against the sum total of taxes imposed by the Franchise and Excise Tax Laws when qualified loans, qualified investments, grants or contributions are extended to eligible housing entities for engaging in eligible low income housing activities. The amount of the credit shall be applied one time and will be based on the total amount of the loan, investment, grant, or contribution; or the credit may be applied annually for qualified loans and qualified low rate loans and will be based on the unpaid principal balance of the loan. The amount of the credit shall be as follows: Five percent (5%) of a qualified loan or qualified long term-term investment; OR three percent (3%) annually of the unpaid principal balance of a qualified loan as of December 31 of each year for the life of the loan, OR fifteen (15) years, whichever is earlier. Ten percent (10%) of a qualified low rate loan, grant, or contribution; OR five percent (5%) annually of the unpaid principal balance of a qualified low rate loan as of December 31 of each year for the life of the loan, OR fifteen (15) years, whichever is earlier. The program is administered in cooperation with The Tennessee Department of Revenue. THDA will certify the housing entity and activity as eligible to receive the tax credits. TDoR will award the tax credits to the financial institutions. The eligible housing entity will be required to maintain records as requested by THDA to ensure that affordable housing opportunities are being provided. Source:
206 Community Development Block Grant (CDBG) Entitlement Program The Community Development Block Grant (CDBG) Entitlement Program provides annual grants on a formula basis to entitled cities and counties to develop viable urban communities by providing decent housing and a suitable living environment, and by expanding economic opportunities, principally for low- and moderate-income persons. Focus on rebuilding the existing footprint and density. Eligible grantees are as follows: Principal cities of Metropolitan Statistical Areas (MSAs) Other metropolitan cities with populations of at least 50,000 Qualified urban counties with populations of at least 200,000 (excluding the population of entitled cities) CDBG funds may be used for activities which include, but are not limited to: Acquisition of real property Relocation and demolition Rehabilitation of residential and non-residential structures Construction of public facilities and improvements, such as water and sewer facilities, streets, neighborhood centers, and the conversion of school buildings for eligible purposes Public services, within certain limits Activities relating to energy conservation and renewable energy resources Provision of assistance to profit-motivated businesses to carry out economic development and job creation/retention activities
207 Home Funding Program The HOME Investment Partnerships Program (HOME) provides formula grants to States and localities that communities use - often in partnership with local nonprofit groups - to fund a wide range of activities including building, buying, and/or rehabilitating affordable housing for rent or homeownership or providing direct rental assistance to low-income people. HOME's flexibility empowers people and communities to design and implement strategies tailored to their own needs and priorities. HOME's emphasis on consolidated planning expands and strengthens partnerships among all levels of government and the private sector in the development of affordable housing. HOME's technical assistance activities and set-aside for qualified community-based nonprofit housing groups builds the capacity of these partners. HOME's requirement that participating jurisdictions match 25 cents of every dollar in program funds mobilizes community resources in support of affordable housing. States are automatically eligible for HOME funds and receive either their formula allocation or $3 million, whichever is greater. Local jurisdictions eligible for at least $500,000 under the formula ($335,000 in years when Congress appropriates less than $1.5 billion for HOME) also can receive an allocation. For rental housing and rental assistance, at least 90 percent of benefiting families must have incomes that are no more than 60 percent of the HUD-adjusted median family income for the area. Participating jurisdictions may choose among a broad range of eligible activities, using HOME funds to provide home purchase or rehabilitation financing assistance to eligible homeowners and new homebuyers; build or rehabilitate housing for rent or ownership; or for "other reasonable and necessary expenses related to the development of non-luxury housing," including site acquisition or improvement, demolition of dilapidated housing to make way for HOME-assisted development, and payment of relocation expenses.
208 Urban Land Institute (ULI) Terwilliger Center for Housing The ULI Terwilliger Center for Housing conducts research, performs analysis, provides expert advice, and develops best practice recommendations that reflect the residential land use and development priorities of ULI members in all residential product types, with special attention to workforce and affordable housing. The Center integrates ULI s wideranging housing activities into a program of work that furthers the development of mixedincome communities with a range of housing options. The Center was established in 2007 with a gift from longtime member and former ULI chairman, J. Ronald Terwilliger. The Center s activities are also made possible by contributions from the ULI Foundation, individual ULI members, charitable foundations, and earned revenue. The mission of the ULI Terwilliger Center for Housing is to expand housing opportunity by leveraging the private sector and other partners to create and sustain mixed-income, mixed-use urban and suburban neighborhoods that incorporate a full spectrum of housing choices, including workforce housing, compact design, and connections to jobs, transit, services, and education. The Center achieves its mission through a multifaceted program of work that includes conducting research, publishing, convening thought leaders on housing issues, and recognizing best practices that support the mission of the Center. Source:
209 THDA NEWSLETTER


210


211

212


213

214


215

216
217 QUALIFICATIONS OF ANALYST
218

219
APPENDIX A. Market Study Standards and Requirements
 APPENDIX A Market Study Standards and Requirements Section 42(m)(1)(A)(iii) of the IRS Code and Section IV(A)(2) of the 2018 Qualified Allocation Plan (QAP) require market studies for all low-income housing
MHC 2012 Housing Tax Credit Cycle MARKET STUDY GUIDE
 MHC 2012 Housing Tax Credit Cycle MARKET STUDY GUIDE I. DATA SOURCES 1. Acceptable data sources include: a. The 2000 Census b. Data from state or local planning bodies c. Data purchased commercially from
2017 Market Study Guidelines
 2017 Market Study Guidelines The Internal Revenue Code and the Qualified Allocation Plan ( QAP ) of Virginia require the submission of a market study in connection with an application for Low Income Housing
2019 Market Study Guidelines
 2019 Market Study Guidelines The Internal Revenue Code and the Qualified Allocation Plan ( QAP ) of Virginia require the submission of a market study in connection with an application for Low Income Housing
EXHIBIT E LOW INCOME HOUSING TAX CREDIT APPLICATION REQUIREMENTS
 EXHIBIT E LOW INCOME HOUSING TAX CREDIT APPLICATION REQUIREMENTS A. Application for Tax Credit Reservation or Tax-Exempt Bond Conditional Commitment shall Include: 1. Complete application form (current
White Oak Science Gateway Master Plan Staff Draft AFFORDABLE HOUSING ANALYSIS. March 8, 2013
 White Oak Science Gateway Master Plan Staff Draft AFFORDABLE HOUSING ANALYSIS March 8, 2013 Executive Summary The Draft White Oak Science Gateway (WOSG) Master Plan encourages development of higher density,
Ontario Rental Market Study:
 Ontario Rental Market Study: Renovation Investment and the Role of Vacancy Decontrol October 2017 Prepared for the Federation of Rental-housing Providers of Ontario by URBANATION Inc. Page 1 of 11 TABLE
Myth Busting: The Truth About Multifamily Renters
 Myth Busting: The Truth About Multifamily Renters Multifamily Economics and Market Research With more and more Millennials entering the workforce and forming households, as well as foreclosed homeowners
City of Mitchell RENTAL HOUSING UPDATE
 City of Mitchell RENTAL HOUSING UPDATE March 2015 An updated examination of rental housing market conditions in the Mitchell area Community Partners Research, Inc. 10865 32 nd Street North Lake Elmo, MN
Prepared For: Tyler Arens Good Samaritan Society 4800 W. 57th St. Sioux Falls, SD Project Number CH184PSMH June 14, 2017
 Prepared For: Tyler Arens Good Samaritan Society 4800 W. 57th St. Sioux Falls, SD 57105 Project Number CH184PSMH June 14, 2017 Danter Company, LLC National Leaders in Real Estate Research 2760 Airport
Carver County AFFORDABLE HOUSING UPDATE
 Carver County AFFORDABLE HOUSING UPDATE July 2017 City of Cologne Community Partners Research, Inc. Lake Elmo, MN Executive Summary - Cologne Key Findings - 2017 Affordable Housing Study Update Cologne
Needs Analysis Requirements Revised May 2017
 INTRODUCTION Needs Analysis Requirements Revised May 2017 Kentucky Housing Corporation (KHC) requires a Needs Analysis for funding applications for rental housing projects consisting of four units or less.
Neighborhood Market Study/Housing Needs Assessment
 Updated 7/16/14 Per HUD requirements imposed by the Consolidated and Further Continuing Appropriations Act of 2012 (P.L. 112-55) and the Home Final Rule as revised effective August 23, 2013, the City of
2016 MAP Guidelines: Presentation Title Chapter 7 Issues
 2016 MAP Guidelines: Presentation Title Chapter 7 Issues Your companyinformation National Council of Housing Market Analysts Baltimore, MD April 19, 2016 Agenda MAP Market Study Guidelines Robert Lefenfeld
Housing Program Application (HOME & HTF) County of Bucks, Pennsylvania Housing Services
 County of Bucks, Pennsylvania Housing Services") Housing Program Application (HOME & HTF) County of Bucks, Pennsylvania Housing Services Since 1989, Housing Services has been the comprehensive provider of funding for community development, housing and
Housing Program Application (HOME & HTF) County of Bucks, Pennsylvania Housing Services Since 1989, Housing Services has been the comprehensive provider of funding for community development, housing and
Housing Authority of the City of Tacoma. Request for Proposals: Project-Based Voucher Program AND. Property-Based Subsidies
 Housing Authority of the City of Tacoma Request for Proposals: Project-Based Voucher Program AND Property-Based Subsidies Request for Proposals: PBV and LPBS August 6, 2018 Page 1 Request for Proposals:
The supply of single-family homes for sale remains
 Oh Give Me a (Single-Family Rental) Home Harold D. Hunt and Clare Losey December, 18 Publication 2218 The supply of single-family homes for sale remains tight in many markets across the United States.
SJC Comprehensive Plan Update Housing Needs Assessment Briefing. County Council: October 16, 2017 Planning Commission: October 20, 2017
 SJC Comprehensive Plan Update 2036 Housing Needs Assessment Briefing County Council: October 16, 2017 Planning Commission: October 20, 2017 Overview GMA Housing Element Background Demographics Employment
Town of Limon Comprehensive Plan CHAPTER 4 HOUSING. Limon Housing Authority Affordable Housing
 CHAPTER 4 HOUSING Limon Housing Authority Affordable Housing 40 VISION Throughout the process to create this comprehensive plan, the community consistently voiced the need for more options in for-sale
HOUSING OVERVIEW. Housing & Economic Development Strategic Plan for Takoma Park Presented by Mullin & Lonergan Associates February 26,2018
 HOUSING OVERVIEW Housing & Economic Development Strategic Plan for Takoma Park Presented by Mullin & Lonergan Associates February 26,2018 Overarching Themes & Underlying Bases Takoma Park strives to be
Housing Characteristics
 CHAPTER 7 HOUSING The housing component of the comprehensive plan is intended to provide an analysis of housing conditions and need. This component contains a discussion of McCall s 1990 housing inventory
CHAPTER 4: MODERATE INCOME HOUSING ELEMENT
 The Utah Municipal Code, -9a-()(a)(iii) requires that all cities adopt a Plan for Moderate Income Housing as part of their General Plan. Section -9a-() of the Utah Municipal Code, outlines that this Plan
HOUSINGSPOTLIGHT. The Shrinking Supply of Affordable Housing
 HOUSINGSPOTLIGHT National Low Income Housing Coalition Volume 2, Issue 1 February 2012 The Shrinking Supply of Affordable Housing One way to measure the affordable housing problem in the U.S. is to compare
Carver County AFFORDABLE HOUSING UPDATE
 Carver County AFFORDABLE HOUSING UPDATE July 2017 City of Chaska Community Partners Research, Inc. Lake Elmo, MN Executive Summary - Chaska Key Findings - 2017 Affordable Housing Study Update Chaska is
INCLUSIONARY HOUSING PROGRAM IMPLEMENTATION GUIDELINES
 INCLUSIONARY HOUSING PROGRAM IMPLEMENTATION GUIDELINES JULY 2005 Department of Grants & Community Investment 1110 West Capitol Avenue West Sacramento, CA 95691 Phone: (916) 617-4555 Fax: (916) 372-1584
CHAPTER 2: HOUSING. 2.1 Introduction. 2.2 Existing Housing Characteristics
 CHAPTER 2: HOUSING 2.1 Introduction Housing Characteristics are related to the social and economic conditions of a community s residents and are an important element of a comprehensive plan. Information
TRI-CITIES ANNUAL HOUSING AFFORDABILITY REPORT
 TRI-CITIES ANNUAL HOUSING AFFORDABILITY REPORT April 2013 Section 1: Housing Affordability Indicators Subject Page 1. Household Income 2 2. Housing Price Index 3 3. Affordable Incomes Ownership 4 4. Purpose-Built
Glenmont Sector Plan Staff Draft AFFORDABLE HOUSING ANALYSIS
 Glenmont Sector Plan Staff Draft AFFORDABLE HOUSING ANALYSIS November 1, 2012 Center for Research and Information Systems Montgomery County Planning Department M NCPPC Executive Summary The Glenmont Sector
Glenmont Sector Plan Staff Draft AFFORDABLE HOUSING ANALYSIS
 Glenmont Sector Plan Staff Draft AFFORDABLE HOUSING ANALYSIS UPDATED December 4, 2012 Center for Research and Information Systems Montgomery County Planning Department M-NCPPC Executive Summary The Glenmont
APARTMENT MARKET SUPPLY AND DEMAND DATA. Prepared March 2012 PAGE 1
 APARTMENT MARKET SUPPLY AND DEMAND DATA Prepared March 2012 PAGE 1 SUMMARY OF MARKET CONDITIONS Inventory According to the 4 th quarter 2011 MFP report on the San Jose metro apartment market, the inventory
Multifamily Market Commentary February 2017
 Multifamily Market Commentary February 2017 Affordable Multifamily Outlook Incremental Improvement Expected in 2017 We expect momentum in the overall multifamily sector to slow in 2017 due to elevated
FUNDING SOURCES FOR AFFORDABLE HOUSING IN HANCOCK COUNTY, MAINE
 FUNDING SOURCES FOR AFFORDABLE HOUSING IN HANCOCK COUNTY, MAINE March 2013 Prepared by: Hancock County Planning Commission, 395 State Street Ellsworth, ME 04605 www.hcpcme.org voice: 207-667-7131 Fax:
Document under Separate Cover Refer to LPS State of Housing
 Document under Separate Cover Refer to LPS5-17 216 State of Housing Contents Housing in Halton 1 Overview The Housing Continuum Halton s Housing Model 3 216 Income & Housing Costs 216 Indicator of Housing
Detroit Inclusionary Housing Plan & Market Study Preliminary Inclusionary Housing Feasibility Study Executive Summary August, 2016
 Detroit Inclusionary Housing Plan & Market Study Preliminary Inclusionary Housing Feasibility Study Executive Summary August, 2016 Inclusionary Housing Plan & Market Study Objectives 1 Evaluate the citywide
City of Exeter Housing Element
 E. Identification and Analysis of Developments At-Risk of Conversion Pursuant to Government Code Section 65583, subdivision (a), paragraph (8), this sub-section should include an analysis of existing assisted
Housing Assistance in Minnesota
 Minnesota Housing Finance Agency Housing in Minnesota Program Assessment October 1, 2002 - September 30, 2003 Minnesota Housing Finance Agency Housing In Minnesota l\1innesotl Housing Finaru:e Agency Contentsoontents...
National Housing Trust Fund Allocation Plan
 National Housing Trust Fund Allocation Plan FINAL PENDING APPROVAL OF THE U.S. DEPARTMENT OF HOUSING AND URBAN DEVELOPMENT Fostering the Development of Strong, Equitable Neighborhoods Brian Kenner Deputy
CULPEPER AFFORDABLE HOUSING NEEDS ASSESSMENT SUBMITTED TO VIRGINIA DEPARTMENT OF HOUSING AND COMMUNITY DEVELOPMENT JUNE 2013
 CULPEPER AFFORDABLE HOUSING NEEDS ASSESSMENT SUBMITTED TO VIRGINIA DEPARTMENT OF HOUSING AND COMMUNITY DEVELOPMENT JUNE 2013 Prepared by the Culpeper Affordable Housing Committee and Rappahannock-Rapidan
Carver County AFFORDABLE HOUSING UPDATE
 Carver County AFFORDABLE HOUSING UPDATE July 2017 City of Watertown Community Partners Research, Inc. Lake Elmo, MN Executive Summary - Watertown Key Findings - 2017 Affordable Housing Study Update Watertown
November An updated analysis of the overall housing needs of the City of Aberdeen. Prepared by: Community Partners Research, Inc.
 City of Aberdeen HOUSING STUDY UPDATE November 2010 An updated analysis of the overall housing needs of the City of Aberdeen Prepared by: Community Partners Research, Inc. nd 10865 32 Street North Lake
MONTGOMERY COUNTY RENTAL HOUSING STUDY. NEIGHBORHOOD ASSESSMENT June 2016
 MONTGOMERY COUNTY RENTAL HOUSING STUDY NEIGHBORHOOD ASSESSMENT June 2016 AGENDA Model Neighborhood Presentation Neighborhood Discussion Timeline Discussion Next Steps 2 WORK COMPLETED Socioeconomic Analysis
The Impact of Market Rate Vacancy Increases Eleven-Year Report
 The Impact of Market Rate Vacancy Increases Eleven-Year Report January 1, 1999 - December 31, 2009 Santa Monica Rent Control Board April 2010 TABLE OF CONTENTS Summary 1 Vacancy Decontrol s Effects on
Carver County AFFORDABLE HOUSING UPDATE
 Carver County AFFORDABLE HOUSING UPDATE July 2017 City of Carver Community Partners Research, Inc. Lake Elmo, MN Executive Summary - Carver Key Findings - 2017 Affordable Housing Study Update Carver has
HOUSING ELEMENT I. GOALS, OBJECTIVES AND POLICIES
 HOUSING ELEMENT I. GOALS, OBJECTIVES AND POLICIES GOAL 1: IN ORDER TO ACHIEVE A BALANCED HOUSING SUPPLY (AND A BALANCED POPULATION AND ECONOMIC BASE), EVERY EFFORT SHOULD BE MADE TO PROVIDE A BROAD RANGE
2014 Plan of Conservation and Development. Development Plan & Policies
 The Town of Hebron Section 3 2014 Plan of Conservation and Development Development Plan & Policies C. Residential Districts I. Residential Land Analysis This section of the plan uses the land use and vacant
MISSISSIPPI GULF COAST APARTMENT SURVEY
 MISSISSIPPI GULF COAST APARTMENT SURVEY PREPARED FOR AND COORDINATED BY GULF REGIONAL PLANNING COMMISSION 1232 PASS ROAD TELEPHONE (228) 864-1167 GULFPORT MISSISSIPPI 39507 PREPARED BY W. S. LOPER AND
Market Study Requirements
 Market Study Requirements KENTUCKY HOUSING CORPORATION (KHC) MAINTAINS AN APPROVED LIST OF MARKET ANALYSTS WHO MEET THE QUALIFICATIONS TO PREPARE MARKET STUDIES FOR SUBMISSION WITH APPLICATIONS FOR FUNDING
Date: January 9, Strategic Housing Committee. IZ Work Group. Legacy Homes Program
 City of Whitefish 418 E 2 nd Street PO Box 158 Whitefish, MT 59937 Date: January 9, 2019 To: From: Subject: Strategic Housing Committee IZ Work Group Legacy Homes Program At our meeting, we are going to
HCV Administrative Plan
 6.0 HCV Project-Based Program Project-based vouchers (PBV) are an optional component of the HCV program that PHAs may choose to implement. Under this component, PHAs have been able to attach up to 20 percent
Companion Document Statement of Need
 Start with Home Tri-Cities Homelessness & Housing Task Group Companion Document Statement of Need Renewing Riverview Part A: Rental Housing Affordability & Need Analysis The charts, tables and text in
City of Golden Council Memorandum
 City of Golden Council Memorandum 911 10 th St. Golden CO 80401 TEL: 303-384-8000 FAX: 303-384-8001 WWW.CITYOFGOLDEN.NET To: The Honorable Mayor and City Council From: Rick Muriby, Planning Manager Thru:
Low Income Housing Tax Credits 101 (and a little beyond 101) James Lehnhoff, Municipal Advisor
 James Lehnhoff, Municipal Advisor") Low Income Housing Tax Credits 101 (and a little beyond 101) James Lehnhoff, Municipal Advisor 9/29/2017 1 Affordable Housing Need What is Affordable? Overview Why do affordable housing projects need financial
Low Income Housing Tax Credits 101 (and a little beyond 101) James Lehnhoff, Municipal Advisor 9/29/2017 1 Affordable Housing Need What is Affordable? Overview Why do affordable housing projects need financial
NSP Rental Basics: A Primer on Using Rental Projects to Meet NSP Obligation and 25% Set-Aside Requirement. About this Tool
 NSP Rental Basics: A Primer on Using Rental Projects to Meet NSP Obligation and 25% Set-Aside Requirement About this Tool Description: This tool is intended for NSP grantees and their partners seeking
City of Lonsdale Section Table of Contents
 City of Lonsdale City of Lonsdale Section Table of Contents Page Introduction Demographic Data Overview Population Estimates and Trends Population Projections Population by Age Household Estimates and
Project-Based Voucher Program CHAPTER 16 PROJECT-BASED VOUCHER PROGRAM
 CHAPTER 16 PROJECT-BASED VOUCHER PROGRAM 16.0 INTRODUCTION The Project Based Voucher (PBV) program attaches rental assistance to a particular unit rather than to a family. This chapter outlines the HA
Cycle Monitor Real Estate Market Cycles Third Quarter 2017 Analysis
 Cycle Monitor Real Estate Market Cycles Third Quarter 2017 Analysis Real Estate Physical Market Cycle Analysis of Five Property Types in 54 Metropolitan Statistical Areas (MSAs). Income-producing real
Briefing Book. State of the Housing Market Update San Francisco Mayor s Office of Housing and Community Development
 Briefing Book State of the Housing Market Update 2014 San Francisco Mayor s Office of Housing and Community Development August 2014 Table of Contents Project Background 2 Household Income Background and
City of Exeter Housing Element
 D. Housing Stock Characteristics Government Code Section 65583(a) requires an analysis and documentation of household characteristics, including level of payment compared to ability to pay, housing characteristics,
ARLINGTON COUNTY, VIRGINIA. County Board Agenda Item Meeting of September 24, 2016
 ARLINGTON COUNTY, VIRGINIA County Board Agenda Item Meeting of September 24, 2016 DATE: September 20, 2016 SUBJECT: Allocation of Fiscal Year 2017 Affordable Housing Investment Fund (AHIF) loan funds for
Mueller. Real Estate Market Cycle Monitor Second Quarter 2018 Analysis
 Mueller Real Estate Market Cycle Monitor Second Quarter 2018 Analysis Real Estate Market Cycle analysis of 5 property types in 54 Metropolitan Statistical Areas (MSAs). Graphic Clarification! Point 11
Rural Housing Challenges in Tennessee: Socio-economic Drivers, Problems and Opportunities
 Rural Housing Challenges in Tennessee: Socio-economic Drivers, Problems and Opportunities Presented at: 19 th Annual Rural Development Conference April 28, 2014 Hulya Arik, PhD Economist Tennessee Housing
7224 Nall Ave Prairie Village, KS 66208
 Real Results - Income Package 10/20/2014 TABLE OF CONTENTS SUMMARY RISK Summary 3 RISC Index 4 Location 4 Population and Density 5 RISC Influences 5 House Value 6 Housing Profile 7 Crime 8 Public Schools
RFP REQUEST FOR PROPOSAL. for TAX CREDIT ADVISOR SERVICES. for BOULDER HOUSING PARTNERS. March 6, 2012 Requested Return: March 15, 2010
 RFP 06-2012 REQUEST FOR PROPOSAL for TAX CREDIT ADVISOR SERVICES for BOULDER HOUSING PARTNERS March 6, 2012 Requested Return: March 15, 2010 Boulder Housing Partners 4800 Broadway Boulder, CO 80304 (720)
2016 Vermont National Housing Trust Fund Allocation Plan
 2016 Vermont National Housing Trust Fund Allocation Plan Overview The National Housing Trust Fund (HTF) is a new federal affordable housing production program that will complement existing Federal, State,
HOUSING NEEDS ANALYSIS & ASSESSMENT REQUEST FOR PROPOSALS
 HOUSING NEEDS ANALYSIS & ASSESSMENT REQUEST FOR PROPOSALS I. Introduction Sibley County is located southwest of the seven-county metro. It directly borders Scott, Carver, McLeod, Le Sueur, Renville, and
CHAPTER 7 HOUSING. Housing May
 CHAPTER 7 HOUSING Housing has been identified as an important or very important topic to be discussed within the master plan by 74% of the survey respondents in Shelburne and 65% of the respondents in
How to Read a Real Estate Appraisal Report
 How to Read a Real Estate Appraisal Report Much of the private, corporate and public wealth of the world consists of real estate. The magnitude of this fundamental resource creates a need for informed
Carver County AFFORDABLE HOUSING UPDATE
 Carver County AFFORDABLE HOUSING UPDATE July 2017 City of Waconia Community Partners Research, Inc. Lake Elmo, MN Executive Summary - Waconia Key Findings - 2017 Affordable Housing Study Update Waconia
Multifamily Market Commentary February 2018
 Multifamily Market Commentary February 2018 2018 Multifamily Affordable Market Outlook A Long Way to Go Momentum in the overall multifamily sector will likely slow in 2018 due to elevated levels of new
MISSISSIPPI GULF COAST APARTMENT SURVEY
 MISSISSIPPI GULF COAST APARTMENT SURVEY PREPARED FOR GULF REGIONAL PLANNING COMMISSION 1635 POPPS FERRY ROAD, SUITE G TELEPHONE (228) 864-1167 BILOXI, MISSISSIPPI 39532 PREPARED BY W. S. LOPER AND ASSOCIATES
Research. A Capital Value production. An analysis of the Dutch residential (investment) market 2017
 market 2017") Research A Capital Value production An analysis of the Dutch residential (investment) market 2017 Summary In 2016, the development of the housing market was turbulent. Key events included a historic residential
Research A Capital Value production An analysis of the Dutch residential (investment) market 2017 Summary In 2016, the development of the housing market was turbulent. Key events included a historic residential
National Housing Trust Fund Implementation. Virginia Housing Alliance
 National Housing Trust Fund Implementation Virginia Housing Alliance June 16, 2016 Ed Gramlich National Low Income Housing Coalition 1 What Is the National Housing Trust Fund? National Housing Trust Fund
Ashland Transit Triangle:
 Ashland Transit Triangle: Strategic Approach to Implementation Fregonese Associates Inc. 12/19/16 Phase I of the Transit Triangle Study Conducted in the Fall of 2015 Tasks Completed: Market analysis Initial
Assessment of Fair Housing Tool for Local Governments. Table of Contents
 Assessment of Fair Housing Tool for Local Governments (LG0) OMB Control Number: -00 I. Cover Sheet Assessment of Fair Housing Tool for Local Governments Table of Contents II. III. IV. Executive Summary
CHICAGO LOW-INCOME HOUSING TRUST FUND MAUI Program Guide and Application (Capital Investment)
") 2019 MAUI Capital Investment Application CHICAGO LOW-INCOME HOUSING TRUST FUND MAUI Program Guide and Application (Capital Investment) (Rev. 12-31-18) Chicago Low-Income Housing Trust Fund Since 1989,
2019 MAUI Capital Investment Application CHICAGO LOW-INCOME HOUSING TRUST FUND MAUI Program Guide and Application (Capital Investment) (Rev. 12-31-18) Chicago Low-Income Housing Trust Fund Since 1989,
IV. Public Housing Authority
 IV. Public Housing Authority The Wagner-Steagall Act of 1937, sometimes referred to as the Housing Act of 1937, was a part of New Deal legislation that allowed for local Public Housing agencies to use
2018 HOUSING NEEDS ASSESSMENT
 REQUEST FOR PROPOSALS 2018 HOUSING NEEDS ASSESSMENT Upper Arkansas Area Council of Governments 3224-A Independence Road Cañon City, Colorado 81212 The Upper Arkansas Area Council of Governments (UAACOG),
Housing Indicators in Tennessee
 Housing Indicators in l l l By Joe Speer, Megan Morgeson, Bettie Teasley and Ceagus Clark Introduction Looking at general housing-related indicators across the state of, substantial variation emerges but
Residential Neighborhoods and Housing
 Residential Neighborhoods and Housing 3 GOAL - To protect Greenwich as a predominantly residential community and provide for a variety of housing options The migration of businesses and jobs from New York
REQUEST FOR QUALIFICATIONS
 A partnership among the Apartment Association of Metro Denver, Denver Housing Authority, Downtown Denver Partnership, and the City and County of Denver Table of Contents REQUEST FOR QUALIFICATIONS Introduction...
Request for Proposals Wake County Affordable Housing Development Program for Tax Credit Developments
 2015 Request for Proposals Wake County Affordable Housing Development Program for Tax Credit Developments 1) STATEMENT OF PURPOSE AND PROGRAM SUMMARY Wake County s Department of Housing and Community Revitalization
AFFORDABLE ATLANTA. Presented By: Presented For: ULI Atlanta: LCC Working Group on Affordable Housing 1/16/18
 AFFORDABLE ATLANTA DEFINING THE NEED, STRATEGY, AND COLLECTIVE ACTION FOR AFFORDABLE HOUSING IN THE ATLANTA REGION Presented By: Presented For: 1/16/18 ULI Atlanta: LCC Working Group on Affordable Housing
/'J (Peter Noonan, Rent Stabilization and Housing, Manager)VW
VW") CITY COUNCIL CONSENT CALENDAR OCTOBER 17, 2016 SUBJECT: INITIATED BY: INFORMATION ON PROPERTIES REMOVED FROM THE RENTAL MARKET USING THE ELLIS ACT, SUBSEQUENT NEW CONSTRUCTION, AND AFFORDABLE HOUSING HUMAN
CITY COUNCIL CONSENT CALENDAR OCTOBER 17, 2016 SUBJECT: INITIATED BY: INFORMATION ON PROPERTIES REMOVED FROM THE RENTAL MARKET USING THE ELLIS ACT, SUBSEQUENT NEW CONSTRUCTION, AND AFFORDABLE HOUSING HUMAN
QAP Schedules
 List of Schedules A. Rental Housing Tax Credit Compliance Manual available online B. Policies and Procedures Regarding Transferability of Rental Housing Tax Credits C. Market Study Requirements D. Private
CHICAGO LOW-INCOME HOUSING TRUST FUND MAUI Program Guide and Application (Capital Investment)
") CHICAGO LOW-INCOME HOUSING TRUST FUND MAUI Program Guide and Application (Capital Investment) Chicago Low-Income Housing Trust Fund Since 1989, it has been the mission of the Chicago Low-Income Housing
CHICAGO LOW-INCOME HOUSING TRUST FUND MAUI Program Guide and Application (Capital Investment) Chicago Low-Income Housing Trust Fund Since 1989, it has been the mission of the Chicago Low-Income Housing
Table of Contents. Appendix...22
 Table Contents 1. Background 3 1.1 Purpose.3 1.2 Data Sources 3 1.3 Data Aggregation...4 1.4 Principles Methodology.. 5 2. Existing Population, Dwelling Units and Employment 6 2.1 Population.6 2.1.1 Distribution
CITY OF PORT HURON, MICHIGAN EXECUTIVE SUMMARY OF THE TARGET MARKET ANALYSIS STUDY CONDUCTED BY ZIMMERMAN/VOLK ASSOCIATES, INC.
 CITY OF PORT HURON, MICHIGAN EXECUTIVE SUMMARY OF THE TARGET MARKET ANALYSIS STUDY CONDUCTED BY ZIMMERMAN/VOLK ASSOCIATES, INC. 2007 EXECUTIVE SUMMARY TARGET MARKET ANALYSIS PURPOSE: The purpose of this
Housing Element Amendment. Borough of High Bridge
 Housing Element Amendment Borough of High Bridge Hunterdon County New Jersey September, 2004 Prepared for: The Borough of High Bridge 71 Main Street High Bridge, N.J. 08829 Prepared by: Art Bernard, P.P.
Mueller. Real Estate Market Cycle Monitor Third Quarter 2018 Analysis
 Mueller Real Estate Market Cycle Monitor Third Quarter 2018 Analysis Real Estate Physical Market Cycle Analysis - 5 Property Types - 54 Metropolitan Statistical Areas (MSAs). It appears mid-term elections
A REPORT FROM THE OFFICE OF INTERNAL AUDIT
 A REPORT FROM THE OFFICE OF INTERNAL AUDIT PRESENTED TO THE CITY COUNCIL CITY OF BOISE, IDAHO AUDIT / TASK: AUDIT CLIENT: REPORT DATE: October 14, 2013 AUDIT GRADE: #13-04, Property Rehabilitation / Loan
H o u s i n g N e e d i n E a s t K i n g C o u n t y
 1999 2000 2001 2002 2003 2004 2005 2006 2007 2008 2009 2010 Number of Affordable Units H o u s i n g N e e d i n E a s t K i n g C o u n t y HOUSING AFFORDABILITY Cities planning under the state s Growth
housing plan May 18, 2009
 housing plan May 18, 2009 Cherry Hill Township and Planning Board reserve the right to make further changes to this Housing Element & Fair Share Plan. The need or desirability of a change may arise from
PINELLAS COUNTY, FLORIDA STATE HOUSING INIITATIVES PARTNERSHIP (SHIP) PROGRAM LOCAL HOUSING ASSISTANCE PLAN (LHAP) FISCAL YEARS ,
 PROGRAM LOCAL HOUSING ASSISTANCE PLAN (LHAP) FISCAL YEARS ,") PINELLAS COUNTY, FLORIDA STATE HOUSING INIITATIVES PARTNERSHIP (SHIP) PROGRAM LOCAL HOUSING ASSISTANCE PLAN (LHAP) FISCAL YEARS 2006-2007, 2007-2008 and 2008-2009 TABLE OF CONTENTS I. PROGRAM DESCRIPTION...
PINELLAS COUNTY, FLORIDA STATE HOUSING INIITATIVES PARTNERSHIP (SHIP) PROGRAM LOCAL HOUSING ASSISTANCE PLAN (LHAP) FISCAL YEARS 2006-2007, 2007-2008 and 2008-2009 TABLE OF CONTENTS I. PROGRAM DESCRIPTION...
Tax Credits 101. Wednesday, November 7 10:45am 12:00pm
 Tax Credits 101 Wednesday, November 7 10:45am 12:00pm Today s Panel Kevin Clark Ohio Housing Finance Agency (OHFA) Brian Graney Ohio Capital Corporation for Housing Meg Manley PIRHL, LLC Tim Swiney Wallick
PROPOSED $100 MILLION FOR FAMILY AFFORDABLE HOUSING
 PROPOSED $100 MILLION FOR FAMILY AFFORDABLE HOUSING We urgently need to invest in housing production An investment in housing production is urgently needed to address the lack of affordable housing. The
7/14/2016. Needed Housing. Workforce Housing. Planning for Needed Housing June 30, 2016 GOAL 10: HOUSING OAR (10)
") Needed Housing Planning for Needed Housing June 30, 2016 Damon Runberg, Oregon Employment Dept. Jim Long, City of Bend Affordable Housing Mgr. Tom Kemper, Housing Works Executive Director GOAL 10: HOUSING
Needed Housing Planning for Needed Housing June 30, 2016 Damon Runberg, Oregon Employment Dept. Jim Long, City of Bend Affordable Housing Mgr. Tom Kemper, Housing Works Executive Director GOAL 10: HOUSING
Analysis of Infill Development Potential Under the Green Line TOD Ordinance
 Analysis of Infill Development Potential Under the Green Line TOD Ordinance Prepared for the Los Angeles County Second Supervisorial District Office and the Department of Regional Planning Solimar Research
Background and Purpose
 DRAFT MEMORANDUM To: From: Perkins+Will James Musbach and Rebecca Benassini Subject: Affordable Housing Need and Supply, Downtown Concord Specific Plan, addendum to Existing Conditions Report; EPS #121118
WELLSVILLE AFFORDABLE HOUSING PLAN
 WELLSVILLE AFFORDABLE HOUSING PLAN 2014 DRAFT 2.2 Wellsville: Affordable Housing Plan 2014 Page 2 DRAFT 2.2 Wellsville: Affordable Housing Plan 2014 Table of Contents Summary of Affordable Housing Conditions...
2012 Profile of Home Buyers and Sellers New Jersey Report
 Prepared for: New Jersey Association of REALTORS Prepared by: Research Division December 2012 Table of Contents Introduction... 2 Highlights... 4 Conclusion... 7 Report Prepared by: Jessica Lautz 202-383-1155