AN EMPIRICAL ANALYSIS OF THE NORWEGIAN HOUSING MARKET
|
|
|
- Denis Woods
- 6 years ago
- Views:
Transcription


1 AN EMPIRICAL ANALYSIS OF THE NORWEGIAN HOUSING MARKET Are there indications pointing towards a housing bubble in the Norwegian market? Written by Karen Høvring Maiken Ludt Parmo Master s thesis, May 2016 Copenhagen Business School MSc in Finance and Strategic Management Supervisor Jørgen Bo Andersen Characters: (113 pages)
2 Abstract In this thesis, we aim to provide whether there are bubble tendencies in the Norwegian housing market, or if the price growth can be explained by fundamental factors. Moreover, we will investigate if our provided models underline the formation of the housing bubble in Denmark that occurred during the years before the financial crisis in After approximately 40 years with a relatively synchronized development in house prices in Norway and Denmark, Danish house prices evolved differently after Norwegian house prices picked up relatively fast, whereas Danish house prices continued to fall which subsequently has proven to be a result of a bubble burst in Denmark. Accordingly, we argue that our findings for Norway from the provided models will be more reliable if the similar models show vital signs of the bubble formation in Denmark before the burst. Additionally, Norway and Denmark are two quite similar countries in terms of demographics, governance and traditions, which we believe make the analyses more comparable and valid. To get an understanding of how bubbles are formed and cracks we have adopted Hyman Minsky's model. When considering factors that drive house prices, we have been looking at macroeconomic variables in light of Jacobsen and Naug s article what drives housing prices?. Case & Shiller s seven criteria for a housing bubble are discussed in relation to the Norwegian housing market today, and to the Danish market prior to the financial crisis, while the empirical analysis is conducted on the basis of a Hodrick-Prescott filter and the Price-to-Rent method. Throughout the thesis we have been aware of the fact that we will be unable to find definite and concrete answers to our research question, but we will emphasize if house prices are overvalued based on our fundamental and empirical analyses. It is both challenging and problematic to reveal a housing bubble with certainty before a potential bubble burst, since what will happen ahead of time is unknown. The results which emerge in this thesis gives us reason to argue for overpriced house prices in the Norwegian housing market, which provides indications of the existence of a housing bubble. ii
3 Table of contest 1 INTRODUCTION Introduction and problem statement Structure of the paper Delimitations METHODOLOGY HOUSING PRICES AND HOUSING BUBBLES Definition of a housing bubble Why housing prices are rising, housing bubbles occur and burst Hyman Minsky s model Case and Shiller Demand and supply for the housing market Demand Supply Price determination and equilibrium in the short- and long-term The short-term The long-term Fundamental factors (J&N) Interest rate Unemployment Real income New constructions HISTORICAL DEVELOPMENT The Norwegian housing market The Danish housing market COMPARATIVE FUNDAMENTAL ANALYSIS Development in real house prices Development in Gross Domestic Product (GDP) Development in key interest rate Development in interest rate (lending rate) Development in disposable income
4 5.6 Development in the unemployment rate Development in new constructions Conclusion comparative fundamental analysis ANALYSIS OF CASE AND SHILLER S HOUSING BUBBLE CRITERIA Norway Conclusion of Case and Shiller s criteria in Norway Denmark Conclusion of Case and Shiller s criteria in Denmark Other factors Developments in the debt level Number of unsold homes Financing EMPIRICAL ANALYSES Hodrick-Prescott filter Theoretical framework Data Material Empirical testing Price/Rent Theoretical framework Data Material Empirical testing Conclusion Empirical Analysis FINAL CONCLUSION Bibliography APPENDIX
5 Table of figures Figure 1.1: Real house price index for Norway and Denmark (1992=100)... 6 Figure 3.1 Minsky s model for bubble formation Figure 3.2: Price determination in the short-term Figure 3.3: Housing supply in the short- and long-term Figure 5.1: Development in real house prices Denmark and Norway (Index 1992=100) Figure 5.2: Development in GDP in Norway and Denmark (Index 1980=100) Figure 5.3: Development in key interest rate Norway and Denmark Figure 5.4: Developments in interest rate Norway and Denmark Figure 5.5: Development in real disposable income in Norway and Denmark (1992=100) Figure 5.6: Development in unemployment rate in Norway and Denmark Figure 5.7: Development in unemployment rate and real house prices in Norway (1980=100) Figure 5.8: Development in unemployment rate and real house prices in Denmark (1992=100) 58 Figure 5.9: Development in new constructions Norway Figure 5.10: Development in new constructions Denmark Figure 6.1: Amount of commenced dwellings in Norway Figure 6.2: Construction costs and house price index Norway (2000=100) Figure 6.3: Media that concerns house prices in Norway ( ) Figure 6.4: Media that concerns housing bubbles in Norway ( ) Figure 6.5: House price- and disposable income index Norway (1980=100) Figure 6.6: Forced sales in Norway Figure 6.7: Started dwellings in Denmark (Index, 2000=100) Figure 6.8: Construction costs- and house price index Denmark (2003=100) Figure 6.9: Media attention that concerns house market in Denmark (1990,2001,2003,2006) Figure 6.10: Media attention that concerns house prices in Denmark (1990,2001,2003,2006) Figure 6.11: House price- and disposable income index Denmark (2000=100) Figure 6.12: Forced sales in Denmark Figure 6.13: Development in household s foreign and domestic debt in Norway Figure 6.14: Development in total credit growth and house prices in Norway (1985=100) Figure 6.15: Development in debt/disposable income ratio in Norway Figure 6.16: Unsold homes in Norway Figure 7.1: Time series from for real house price with HP-filter, Norway (1980=100). Shows lambda value of 100 and Figure 7.2: Time series from for real house price index with HP-filter, Norway (1980=100). Shows lambda value of 100 and Figure 7.3: Time series from for real house price index with HP-filter, Norway (1980=100). Shows lambda value of Figure 7.4: Gap from trend in Norway. Shows lambda value of
6 Figure 7.5: Gap from trend in Norway. Shows lambda value of Figure 7.6: Time series from for real house price index with HP-filter, Denmark (1992=100). Shows lambda value of Figure 7.7: Time series from for real house price index with HP-filter, Denmark (1992=100). Shows lambda value of 100 and Figure 7.8: Gap from trend in Denmark. Shows lambda value equal to Figure 7.9: P/R rates in Norway Figure 7.10: P/R with and exponential trend line in Norway Figure 7.11: Real- and fundamental P/R rations in Norway List of tables Table 5.1: Conclusion comparative fundamental analysis Table 6.1: Conclusion Case and Shiller Norway Table 6.2: Conclusion Case and Shiller Denmark Table 7.1: Real P/R ratios in selected years in Norway Table 7.2: Calculations of fundamental P/R ratios in Norway
7 1 INTRODUCTION 1.1 Introduction and problem statement The last 24 years have appeared to be a continuous expansion period in the Norwegian housing market, with exception from fluctuations during the financial crisis. Norwegian house prices dropped in the wake of the financial crisis in 2008, but in 2009, Norway experienced a period of recovery. This brought prices far above the peak level, which have had a significant impact for most households, since housing is one of the largest consumer components, as well as the largest investment over a lifetime for a majority of us. Housing investments, in addition to expected value appreciation, is often regarded as the most important saving method. Hence, developments in house prices are of a big concern for a majority of households, and have major impact on personal finances. We therefore find it interesting to investigate the underlying factors of the excessive growth in Norwegian house prices. Norway has had a significant growth in house prices since the 1990s. The last recession in house prices occurred in 2008, as a result of the extensive financial crisis that affected the world economy. Today, house prices in Norway are higher than ever. In sharp contrast to developments in Norway, there has been a significant decline in Danish house prices from 2007 until late The house price development in Denmark was similar to the Norwegian market until During the financial crisis, house prices dropped in real terms by 22 % in Denmark, and by 7.73 % in Norway. Moreover, Norwegian house prices have increased by 27 % in real terms since 2008, while the Danish housing market has not fully recovered. Figure 1.1 below illustrates the development in Norwegian and Danish real house price index from 1992 to 2015: 5
8 Figure 1.1: Real house price index for Norway and Denmark (1992=100) As figure 1.1 illustrates, developments in real house prices in Denmark and Norway had a similar trend until the financial crisis. At this point, Norwegian and Danish house prices started to move in different directions. Danish house prices had a significant increase during the beginning of the 2000s, and later it has been proven that Denmark experienced a housing bubble that burst in 2005/2006 (Dam et.al., 2011). When the bubble burst, there were subsequent dramatic price drops, as the prices were far above their fundamental level. As the housing bubble in Denmark by now is a fact, we know the underlying explanation of the different direction in the development of house prices in Denmark and Norway after the financial crisis. It is interesting to investigate whether the Norwegian economy has indications of a housing bubble today or if house prices can be supported by underlying fundamental economic conditions. To emphasize the importance of potential deviations from fundamental factors when investigating housing bubbles, we will additionally examine the Danish housing market prior to the financial crisis. Moreover, we will compare the Norwegian economy today, with factors that were present (or absent) in the Danish economy prior to the bubble burst in order to get a deeper understanding of the mechanisms of a housing bubble. Denmark has about the same population as Norway, and has 6
9 many similarities regarding demographics, governance and traditions. This makes Denmark an interesting basis for comparison. Problem statement Based on this, we have chosen the following problem statement: Are there indications pointing towards a housing bubble in the Norwegian market? To answer this question, we will investigate two sub-questions; Can the high growth in house prices in Norway be seen as abnormal, or can it be explained by underlying fundamental factors? Can we prove the Danish housing bubble prior to the financial crisis? If this is the case, we can argue that our applied models and theories may be valid for the Norwegian market as well. There is now an ongoing heated debate about whether the rise in house prices can be justified by distinctive fundamentals, or whether the growth is due to other factor s. Simplified, there exist two main opinions regarding the Norwegian housing market. These opinions are no theories themselves, but they are based on the perspectives and theories regarding how housing bubbles occur. Opinion 1: People deny the existence of a housing bubble and explain the high house prices as a result of real fundamental factors. This is the dominant opinion among Norwegian economists. Opinion 2: People argue that the growth in house prices cannot be explained by fundamental factors. This group support that a housing bubble is the explanation behind the high growth in house prices. 7
10 The housing market is complex and driven by economic conditions, as well as expectations and speculations in several variables. It is therefore difficult to say for sure whether there is a housing bubble, before the potential bubble burst. For that reason, we will look into indications pointing towards whether or not a housing bubble exists in the Norwegian market today. We will not look into whether there are housing bubble tendencies in the Danish market today, but analyze characteristics of the market when they were experiencing a housing bubble in 2005/2006. Furthermore, we will compare our findings in order to get a deeper understanding of a possible bubble formation in the Norwegian housing market. It is often difficult to determine whether or not there exists a housing bubble until it eventually burst. When we are looking at fundamental factors in the housing market, we consider macroeconomic variables such as the GDP, key interest rates, interest rates (lending rates), unemployment levels, income level and the level of new constructions. A bubble in a national context will inflict serious economic repercussions in the real economy, as for example the financial crisis did in In the stock market, professional investors and stockbrokers are overrepresented. They have a strong understanding of the concept of risk and what risk entails. In contradiction, the housing market is overrepresented by players who do not have a good understanding of risk. There is a weak understanding of the concept, and the danger associated with a decline in house price is not known among many actors in the housing market. It is therefore important to reveal indications of a housing bubble before it eventually burst, to curb the economic consequences of a potential crack. In order to answer our problem statement, we will use well-known housing bubble theories and frameworks. We consider the housing bubble theories as more reliable if they confirm the fact that Denmark was in a housing bubble prior to the financial crisis. We will in the next section present how the thesis is structured, and present the applied models. 1.2 Structure of the paper Our problem statement will be answered using empirical data and analytical assessments of fluctuations in both the Norwegian and the Danish housing market. The paper is structured as 8
11 follows: We will start our thesis by introducing the methodological approach to inform the reader of the background behind our applied methods and frameworks, in order to obtain reliability and validity throughout the thesis. In the beginning of chapter 3 we will provide a definition of a housing bubble, by using different definitions given by known economists. Further on, we will discuss two theories and hypothesis regarding why house prices are rising, house bubbles occur and burst. These theories comprise: Hyman Minsky s model Case and Shiller Moreover, the chapter addresses housing market theory, namely the supply and demand side of the housing market. We will explain how prices are determined in the short- and long-term. Finally, we will explain fundamental factors 1 in the housing market, where particularly Jacobsen and Naug (2004) is an essential platform for our work. The Norwegian housing market development is addressed in chapter 4 with a detailed explanation of previous housing bubbles, in light of Minsky s model and the current situation today. Similarly, we will provide a general explanation for Denmark. The comparative fundamental analysis in chapter 5 is made with the purpose to investigate whether the developments in house prices can be explained by fundamental factors or if the growth seems to be abnormal. More specific, we will focus on today s situation for Norway compared to the period in the mid-2000s for Denmark, when they were experienced a housing bubble. We will look at developments in real house prices, the GDP and the key interest rate in Norway and Denmark. In addition, we will analyze the fundamental factors in light of Jacobsen and Naug s article What drives housing prices?. 1 By fundamental factors we will look at economic variables as interest rates, unemployment, real income and new constructions 9
12 Chapter 6 addresses Case and Shiller s seven criteria for a housing bubble based on the article Is there a bubble in the Housing Market. We will discuss whether these criteria are met in both the Norwegian housing market today and the Danish housing market prior to the financial crisis. Additionally, we analyze three other factors we find highly relevant for developments in house prices in Norway. The empirical analysis in chapter 7 examines the HP-filter and the Price-to-Rent method. We will first introduce the theoretical aspects of the HP-filter. Further on, the HP-filter is applied on the Norwegian and the Danish housing market to determine whether house prices deviate from trend. As a supplement regarding the Norwegian house market, we will do a P/R analysis in order to investigate the growth in house prices relative to the growth in rental prices. The theoretical aspect of the P/R model will be introduced prior to the analysis. To provide a comprehensive understanding regarding the Norwegian housing market, we believe the analyses and theories provided will enable us to derive a conclusion. All together this will lead to our final conclusion, which we will present in chapter 8. Here we will gather all threads together. To make it easier to distinguish between Norwegian and Danish figures, graphs and tables, Norway will consistently be illustrated in blue, whereas Denmark will be illustrated in red. This is done in order to provide the reader with a clear and systematic overview throughout the paper. 1.3 Delimitations We will in this section go deeper into the thesis delimitations, i.e. what we will limit ourselves to, in addition to what we will restricts ourselves from, in order to provide the reader with a clear understanding of the scope of the paper. Overall delimitations We will restrict us from developing any new models or frameworks. The aim of this paper is not to develop a new model for predicting house prices, but rather to provide a descriptive explanation of the housing market based on available frameworks. Hence, the study will accordingly not develop 10
13 or estimate new methods to detect possible housing bubbles. We will limit the paper by using familiar theories to analyze house price developments. We will limit ourselves to mainly focus on the Norwegian market. As our problem statement indicates, our main focus will be the Norwegian housing market. Analyses regarding the Danish market are made in order to confirm whether our provided models and frameworks can be used to prove the previous housing bubble. If this is the case, the models will be more reliable when it comes to findings regarding the Norwegian market. We will limit ourselves to look at both countries as a whole, even though a housing bubble most likely will occur in primarily big cities. However, due to difficulties finding satisfactory data material for separate cities, the analysis of the housing market in both Norway and Denmark will be made for the countries as a whole. Therefore, we are looking at figures for fundamental macroeconomic variables for both countries as a whole, and have not focused on geographical variations in the housing market, although this will have a huge impact on the price level. We will restrict ourselves from distinguishing between different types of housing. The study is limited to examining housing as a whole. Hence, no distinction is made between different housing types, such as detached villas, apartments or townhouses. The terms dwelling, housing and house is thus referring to all kinds of housing throughout the paper. Delimitations in section 6: Case and Shiller We will limit ourselves to only analyze other factors for the Norwegian housing market. We will analyze the following factors for Norway: developments in debt level, number of unsold homes, and financing. We find these factors as highly relevant for the current situation in Norway characterized by high growth in house prices. Delimitations in section 7: Empirical analyses We will restrict ourselves from conducting a P/R analysis for Denmark. We will not conduct a P/R analysis for Denmark due to limited data access, as we do not have any yearly data of the average 11
14 rental price per square meter. We did our best to find usable figures, without any luck. We have searched the statistical ten-year overviews provided by Statistics Denmark from 1964 to 2015, but they have only collected average annual rent for 1981, 1985, 1992, 1995 and As the latter was the latest figure we could collect, we were not able to draw any conclusions regarding developments in rental market prices during the years prior to the bubble burst. One possible solution could have been to plot in the five figures and to draw a trend line from , and further look at the continued trend - but we did not find this as reasonable to do. Furthermore, the Danish rental market has been, and still is, highly regulated. It would therefore not be reliable to calculate average annual rents forward in time based on these statistics. Additionally, we contacted Statistics Denmark 2 and Denmark's National Bank, but they could not assist us. Hence, we will not develop a P/R analysis for Denmark for two reasons: i. It will not make sense to calculate the P/R ratios for five separate years, as fluctuations will not appear. Moreover, we do not have the annual average rental prices for the period prior- and during the housing bubble in 2005/2006. ii. It will not make sense to calculate the P/R ratios due to the highly regulated rental market Hence, we believe that it is sensible to disregard the Danish P/R development in this thesis. We will limit ourselves to only consider the years from 1992 to 2015 in the HP analysis for Denmark. The aim of the HP-analysis for Denmark is to investigate whether the model can prove the formation and burst of the housing bubble prior to the financial crisis. As we have data ex-ante and ex-post this period, we regard it as reasonable to not go further back in time. Again, we want to further underline that Denmark is not our main focus. The data collection for this thesis was completed on March 1 st Published material after this date will not be considered. 2 See appendix 1 for mail correspondence from Karen Larsen, Statistics Denmark 12
15 2 METHODOLOGY In the previous chapter we presented the theoretical basis to provide the reader of an overview of which theoretical frameworks and models that is included in the thesis, in order to answer the problem statement in the best possible way. In this chapter, we will present the methodological approach. Moreover, we will emphasize and discuss the thesis applied methods, in addition to the implementation of data material, in order to obtain reliable information and discuss the thesis reliability and validity. The thesis uses an ontological framework, and the approach is post-positivistic. According to Guba (1990), this ontology assumes the reality to be objective, but grants that the reality can be apprehended only imperfectly and probabilistically. Hence, our findings are most likely true, but always subjected to falsification (Guba and Lincoln, 1994). Additionally, the approach is postpositivistic as we strive to ensure that the knowledge produced in this study can be used by others to undertake similar studies. Moreover, we are using a deductive approach in the thesis. According to Johannessen et. al. (2011), the researcher tests general statements by using empirical data in a deductive approach. We are using house price models derived from well-known theories, with basis in the statement are there tendencies of being a housing bubble in Norway. Hence, we are testing our hypothesis by using specific theory, models and obtained empirical data. We do not attempt to verify or disprove theories empirically, but our paper is based on existing theories, frameworks and methods that further are combined in order to answer the thesis problem statement. The method we are using is descriptive, as the purpose of this thesis not is to develop or create a new model for assessing house prices, but rather investigate the problem statement by using existing models. The problem statement will be approached by using empirical data and an analytical assessment of movements and fluctuations in the Norwegian housing market, seen in context to movements in the Danish housing market. Our findings will be discussed by using familiar analysis tools. Both qualitative and quantitative analyses will be applied to assess developments in the Norwegian and Danish housing markets. Our fundamental analysis is based on quantitative and qualitative 13
16 assessments, while the empirical analysis is primarily based on quantitative data. Hence, we apply theoretical frameworks that again are based on secondary data (Riis, 2005). The data are mainly based on journals, reports, articles from newspapers, publications from statistics banks and online resources. The academic areas of interest provided are quite wide and offers numerous of academic articles online. The time series and data sets for Norway are mainly obtained from The Norwegian Central Bank and Statistics Norway. Statistics Denmark is the main source for Denmark. To achieve the best possible quality of the data provided in the assessment, it is crucial to achieve valid and reliable data material. When the report is largely quantitative, it is important to focus on validity and reliability when working in conjunction with preparations for data collection. Reliability is related to how trustworthy the data is. The thesis will mainly use time series and data sets obtained from The Central Bank of Norway and Statistics Norway, in addition to Statistics Denmark. These are considered to be very reliable sources. The data are mainly processed using Excel. Excel can to a certain extent uncover errors in the data, for example by pointing to values which differ significantly from remaining data, so one can verify that the values are correct. It could however be debated how reliable the figures published by The Norwegian Central Bank are, as they go back to Many factors have changed significantly over the past 200 years. It has for example been sold homes with different standards in different periods, which makes it difficult to get the same basis for comparison in house prices. In addition, there are difficulties related to calculating the consumer price index. For example, a kilo of meat from a cow today, is difficult to compare with a kilo of meat from a cow in 1819, as the primary task of a cow before was to produce milk, while today's meat production is the primary task (Eitrheim et. al., 2003). Despite this, it is assumed that the data is reliable. The validity of the thesis refers to the validity of the data relative to the problem to be answered. To achieve a high degree of validity, it is essential that the obtained data actually is relevant to the problem. All data used in the thesis have all been necessary to answer the research question regarding whether Norway have tendencies of a housing bubble (Grønmo, 2007). 14
17 3 HOUSING PRICES AND HOUSING BUBBLES The purpose of this chapter is to present the theoretical background of the characteristics in the housing market. We will first provide the reader with knowledge of the term housing bubble. Further, we will address theories of why housing bubbles occur and crack, namely Hyman Minsky s model and Case and Shiller s seven criteria. Moreover, we will provide an overview of supply and demand in the housing market. Next, we will present price determination and equilibrium in the short- and long-term. Lastly, fundamental factors are presented in the light of Jacobsen and Naug s model. 3.1 Definition of a housing bubble Housing bubble has become a more discussed subject over the last years. In the 1960s economists discussed whether market forces could prevent housing bubbles to occur, and that a bubble eventually have to burst (Stiglitz, 1990). There exist several definitions of a housing bubble, and we will in this section list some theoretical definitions. We will further derive our own suitable definition. If the reason that the price is high today is only because investors believe that the selling price will be high tomorrow when fundamental factors do not seem to justify such a price then a bubble exist Stiglitz (1990). Case and Shiller (2003) said A tendency to view housing as an investment is a defining characteristic of a housing bubble. A characteristic is that homebuyers do not believe the prices to fall so it is better to buy now than later. Furthermore, a housing bubble exists when homebuyers buy houses that would normally be considered too expensive and is now an acceptable purchase because they believe they will be compensated by a further increase in price (Case and Shiller, 2003). In other words, a housing bubble can be explained as a situation where an increase in house prices is affected by households expectations that house prices will increase. Hence, a bubble exists when house prices cannot be explained by fundamental factors. 15
18 Moreover, Kidleberger (1987) said: A bubble may be defined loosely as a sharp rise in the price of an asset or a range of assets in a continuous process, with the initial rise generating expectations of further rises and attracting new buyers generally speculators interested in profits from trading rather than in its use or earning capacity. The rise is then followed by a reversal of expectations and a sharp decline in price, often resulting in severe financial crises, which is when then bubble bursts. An interpretation of the definitions above implies that a bubble does exist when more people are viewing housing as an investment, and they are buying houses since they believe in a further price increase. This will increase the housing demand, which consequently will push the prices up. Hence, a suitable and adapted definition of a housing bubble on the basis of the above definitions is: A housing bubble emerges when there is a positive change in house prices, which cannot be supported by changes in fundamental factors of the housing market. When we see a positive and greater discrepancy between fundamental- and actual value a housing bubble exists. Calculations of fundamental values of housing can be made by basing the calculation on specific macroeconomics- and other explanatory factors. The market value of housing usually includes an element that takes expected price increase into account. Several factors may create expectations regarding house price growth. Households may expect that future ability to pay will be improved as a result of shift in macroeconomic conditions, such as remaining low unemployment, growth in income, and decreased interest rate. This will affect households future expectations of house prices. The deviation from the fundamental value has a self-reinforcing effect, where homebuyers demand will expand due to positive expectations of future house prices. Homebuyers, who previously did not considered housing as a potential purchase, will consider it as acceptable if they have expectations of future rise in house prices. Buyers will now expect that future gains are possible with the assumption that the house will be sold to an even higher price in the future. Hence, the aspect of expectations has a central role when we identify a housing bubble, or indications for a housing bubble. However, housing bubbles are very difficult to predict, as there is no accurate and objective way to measure the fundamental factors. 16
19 3.2 Why housing prices are rising, housing bubbles occur and burst Hyman Minsky s model and theory presented in this part explains the different phases ex-ante and ex-post of a housing bubble burst. According to Levitin and Watcher (2012), there are several competing theories for factors causing housing bubbles: Some theories are demand-side theories, meaning that the housing bubble was caused by a growth in consumer demand for housing, which pushed up housing prices. Others are supply-side theories, meaning that the housing bubble was caused by a growth in the supply of housing finance, thereby enabling consumers to make more heavily leveraged bids for housing and bid up home prices. As Levitin and Watcher conclude, a strong demand will contribute to form a bubble in the market, but the increase in price may also stem from large supply, and easy access of credit. However, it is not enough to only explain why prices increase; it is just as important to. Even though bubbles are hard to determine, it is possible to recognize them by identifying distinctive characteristics for the presence of a housing bubble. We will particularly support us to the following theories: Hyman Minsky s model Case & Shiller Hyman Minsky s model Hyman Minsky published an article named The Financial Instability Hypothesis in 1978 where he introduced a model that describes various phases of an economy, and these phases distinctive traits. In the context of the model, the economy exceeds its natural growth path and moves towards a bubble. Although the model is made up for financial crises, it can easily be transferred to- and used for the housing market. The model assumes that instability in the supply of credit is the main driver of a crisis. According to Minsky, access to credit creates crises. During the expansion phase in the economy, there is great optimism among investors, and they are risk averse. Similarly, the lenders also possess the same growth expectations. This means that lenders have a greater willingness to lend money during expansion phases. The opposite will occur in economic recessions. Interest expenses will rise, the lending policy becomes stricter and borrowing becomes more difficult. These 17
20 have a tendency to form the basis to reinvigorate bubbles and amplify crises. An illustration of Minsky s phases is presented in the figure below. Figure 3.1 Minsky s model for bubble formation Displacement Displacement is represented by an exogenous macroeconomic shock. This is characterized by a process being initiated, which further causes a trend where the economy moves away from the normal growth path. This creates expectations around the possibility of making profits in the longer term. Hence, higher investment levels will occur. A result of this could be higher interest rates to reduce further overheating in the housing market. By fear of a possible appreciation of the currency, money supply will increase to avoid a further increase in interest rates. Increased money supply will justify lower interest rates and greater willingness to invest. i. Overtrading As a result of increased expectations in the previous phase, the economic activity increase. Hence, the overtrading phase is characterized by a high level of activity and growth, and the market has positive expectations regarding future profitability. As a consequence of increased activity, prices will rise, which in turn will lead to increased demand and further increased activity. This phase is a spiral that builds up in line with the market activity. The operators in the market will begin to overestimate values resulting from the increased expectations, and prices will exceed their initial 18
21 level. This is largely driven by psychology among the market operators. Speculations, psychology and irrational behavior are therefore the main characteristics of this phase, as people are worried to miss out on gains. ii. Monetary expansion This phase do often occur simultaneously with the overtrading phase, and is characterized by high optimism and irrational expectations for future profits. An increase in demand for money and credit is consistently in the monetary expansion phase. Banks and financial institutions see substantial opportunities to earn money and the supply of credit increases. The banks are conducting a freer lending policy, and optimism is further reinforced. Additionally, high demand for loans will increase competition among banks to capture and retain customers. As a consequence, the activity level increases. iii. Revulsion As illustrated in figure 3.1 this phase is the turning point in the economic recovery. The market operators discovered that prices are overvalued and that they cannot be supported by fundamental factors in the economy. The recession that occurs in the revulsion phase will spread uncertainty in the market. When people realize that the price growth will discontinue, they want to exit the market. Demand for housing will decrease, the banks lending policies will be stricter, and the fall in money supply will push the interest rates up. Consequently, house prices will fall. The phase will therefore lead to liquidity problems, increased bankruptcies and low economic recovery. iv. Discredit The model s final phase is characterized by lower values in turn of lower prices, while the moneyand credit amount are reduced. Consequently, the demand for housing decreases. There is considerable pessimism in the market, and expectations of future profits are reduced significantly. This results in prices becoming lower than their initial values. 19
22 3.2.2 Case and Shiller Case and Shiller started their empirical analysis of the housing market in the 1980s and are considered pioneers in analyzing and determining housing bubbles. They argue that one should look at the stability of the relationship between income and other fundamental factors and home prices over time (Case and Shiller, 2003). In 2003 they conducted a study for the period from 1995 to 2002 in which they examined whether different fundamental factors could explain a high increase in house prices. They claim that there are a number of indicative criteria that should be met to be able to say something about the existence of a housing bubble. According to Case and Shiller (2003), the following criteria must be present: Pressure of being a home-owner If the majority of people own their own home, some people might consider owner-occupied housing as a requirement, and thus enter the house market. Widespread comprehension that it is profitable to own housing Whether or not we are in a housing bubble can be seen in relation with people considering housing as an investment. If the buyer seeks to own the home only for the purpose of generating returns, it will be considered to be an investment. Widespread expectations of increase in house prices An important factor for how house prices will further develop is expectations about the housing market. Households might expect further increase in prices. Consequently, households will buy houses that would normally be too expensive. The purchase will now be considered as acceptable, because households now believe they will be compensated by a further price increase in the future. If expectations of house price increase are the main motive for a housing purchase, the house market will not be stable in the long-term. 20
23 House prices receive much attention in media and private conversations The media affects developments in house prices, and articles published in the media usually affect what people are talking about in private contexts. House prices increase more than private income House prices are not driven by costs if the increase in income is higher than the increase in house prices. Limited understanding of risk attached to the investment Weak understanding of risk indicates that there might be a housing bubble. Among other, this contains weak understandings about changes in the interest rate. Simplified opinion regarding mechanics of the housing market dominates This is highly related to the factor above. These seven market characteristics, among other factors, will be investigated throughout the thesis to examine whether or not there are indications of being a bubble in the Norwegian housing market. Similarly, we will investigate if these characteristics underline the identified housing bubble in the Danish housing market prior to the financial crisis. 3.3 Demand and supply for the housing market Housing investments are for a majority of households the largest investment they make in their lifetime. Housing procurement differs from procurement other assets because it is both a purchase of the consumer good to live somewhere and an investment in the home as a capital object. In this thesis we are focusing on the private housing market. A home is defined as an essential good, which we consider as both a consumer durable and an asset. The majority of households have a larger part of their wealth tied in their home (NOU, 2002). Several factors influence the determination of prices in the housing market. Houses that are transacted in the market differ along a number of dimensions, such as space, location, standard and 21
24 type of ownership. Additionally, homebuyers motives vary from purely residential consumption to pure financial investments. In the latter case, housing is a capital object considered in relation to other investments based on the risk-adjusted returns from rental income and potential appreciation of value. Regardless of the motive behind the procurement, significant risk is associated with such a purchase, due to uncertain future disposable income streams and consumer preferences. The greatest uncertainty is still associated with the expected growth in house prices (Nordvik, 1993). However, considering a purchase with a long-term horizon will increase the ability to carry short-term price risk. Another factor that separates the housing market from many other markets is that the housing supply is given in the short-term, as explained in section Regulatory and housing construction takes time, and adaption of capacity within the construction industry requires sustained high profitability. Jacobsen and Naug (2004) argue that the most important explanatory factors for house prices are interest rates, housing construction, unemployment and household income. What actually determines house prices are housing supply and housing demand. In the short-term, housing supply is moderately stable since new constructions take time and house prices are thus determined by housing demand (Jacobsen and Naug, 2004). However, housing supply will affect housing prices over a long-term perspective. Construction costs will be important, but the price of land will also be significant for the amount of resources that should be used for new housing constructions. Demographics, migration and centralization are also factors that will affect house prices in the longterm. The housing market consists of partially integrated markets, such as the ownership- and rental market. We will use the ownership market as a starting point to explain the market's overall behavior. This is because the integration between the markets in the long-term affects the development and price level in the submarkets to directly influence each other. Simultaneously, the ownership market constitutes approximately 84 % of the total market in Norway (Statistics Norway, 2015), and 61 % in Denmark (Statistics Denmark, 2015). Neither the Norwegian, nor the Danish housing market is homogeneous, as housing is not identical. Nevertheless, as we mentioned in the delimitation section, we assume that all homes are equal, with the purpose to make the explanation 22
25 most intuitive. The basic scenario can be expanded to include more submarkets with different types of dwellings. The rest of this section will explain the rationale behind demand and supply closer. In we will look at housing demand, while investigates the supply Demand The demand side consists of all potential homebuyers, and we assume all homebuyers to have different willingness to pay. Each point on the demand curve 3 represents an individual homeowner s maximum willingness to pay, namely the marginal willingness to pay for housing. Total demand at any point on the curve is determined by the number of homebuyers who have a marginal willingness to pay equal to, or higher than, the buyer in that current point. Their ability to pay is in turn determined by factors, such as disposable income and assets, wealth, future expectations of income and expenses, interest rates and other factors affecting the housing cost. However, the willingness to pay is also affected by the value a buyer is putting into housing as a consumption and investment good, relative to other goods. Households with equal ability to pay may therefore have varying willingness to pay, and households with equal willingness to pay may have different ability to pay. Households expectations can however change in the short-term and can thus contribute to significant fluctuations in their willingness to pay in a short-term perspective (Kongsrud, 2000). In a long-term perspective, demographic change will be an essential driver of housing demand. Housing demand consists of household s demand for owner-occupied housing and for housing as an investment object. Numerous of buyers invest in housing if they believe they will get a positive outcome by renting or selling the object. Furthermore, housing demand is a function of the willingness to pay for different prices, and depends on different variables. We will now look at disposable income, the housing cost, credit limits, unemployment and demographics. 3 See figure
26 Income Income affects housing prices in several ways. A real income target has to be used to explain the development in real house prices. Income may be measured as a gross- or net value where total income refers to a gross value, and disposable income is a net value. Disposable income measures the development in households budget, and is intuitively the vital factor for house prices. For a given tax level, income growth may contribute to increased house prices. However, this would not be the case if the growth is offset by higher taxes. To capture both of these effects we have decided to use disposable income. The housing cost More or less explicit, most models are using the housing cost as an explanatory factor for housing demand (Jacobsen and Naug (2004), NOU (2002), The National Bank of Denmark (2003) and Wagner (2005)). In line with Wagner (2005), the housing cost can be defined as: Real interest expense after tax + Operating and maintenance costs - Housing tax - Increase of housing value = The cost of housing The housing cost of owner-occupied housing equals the value of goods the owner misses out by owning the house in a given period (NOU, 2002). In other words, it may be understood as an opportunity cost. The housing cost is a more intuitive term than a figure we can estimate precisely. The main component of the housing cost is interest expenses, as most homes are fully or partially leveraged. Hence, a higher real interest rate results in a higher housing cost, as the housing cost will increase when interest expenses on the loan increases. This effect will decrease or disappear if the loan has fixed interest rate for parts of the maturity. Additionally, higher interest rates will result in an increase in the opportunity cost of the equity tied up in the home. The consideration of housing as an investment will to a large extent depend directly on expected returns relative to assets as fixed 24
27 income securities. Low borrowing costs and alternative returns will tempt investors to invest in the housing market when interest rate cuts are not fully reflected in reduced housing rental costs. Needs for the consumer good to live somewhere will not change significantly by a rise in interest rates. Tax deductions for interest expenses will decrease the interest- and housing cost, and thus stimulate housing demand. A higher deduction rate increases the stimulus in the same way as higher inflation for a given interest rate level. Operating and maintenance costs are associated with maintenance and administration of housing on a daily basis, and include insurance and municipal taxes (NOU, 2002). Intuitively, housing demand is stimulated if operating and maintenance costs decrease, and conversely if they rise. These costs are difficult to estimate. However, they may be approximated by a fixed percentage of the housing stock. We assume this to be reasonable as development in operating and maintenance costs hardly explain a significant part of the development in house prices. The tax benefit of owner-occupied housing differs from the tax benefit of debt financing of house purchasing 4. The tax benefit of owner-occupied housing (tax on housing capital) is based on the assessed value (which usually is lower than the market value) of the house and relates to the fact that housing is taxed less than other assets in the calculation of income and wealth (NOU2002: 2, Lunde 1999). Housing is favorable taxed in Norway, which has a positive effect on housing demand and is a strong incentive for housing making it an even more attractive investment. As a result, it is more beneficial to invest in housing than in other financial assets. Increase in housing value is the most problematic component of the housing cost since it is difficult to estimate (Jacobsen and Naug (2004), Wagner (2005) and NOU (2002)). A potential increase in the housing value is unknown at the time of the purchase. Consequently, the assessment of this component is only based on expectations. Obviously, changes in interest rates, increase in income, and similar factors regarding the increase in housing value is difficult to estimate. Hence, historical 4 The Norwegian Tax Administration Act (1999) 6-40 states that paid interest on debt may be deducted by a rate equal to 27 %. Hence, the tax is reduced by 27 % of interest expenses reinforcing the benefit of owner-occupied housing. This interest deduction applies to all kinds of debt, but the largest part of a majority of household s debt is related to housing. 25
28 price inflation can be perceived as the best estimate of future housing price inflation, meaning that expectations are adaptive (Nordvik, 1993). Nordvik (1993) finds adaptive expectations to be the best approach for the formation of expectations for Norwegian households. Accordingly, the expected value of the housing costs can contribute to a housing bubble, where prices are significantly higher than what can be explained by fundamental factors (Case and Shiller, 2003). Credit limits The relationship between the housing cost and housing prices is less apparent in cases where there are effective credit constraints (Jacobsen and Naug, 2004). Credit limits set a ceiling on households purchasing power, and are limiting the housing price development. However, banks always consider the solvency for each and every borrower, and credit to households is limited in all situations of banks assessments. House price growth is affected in cases where banks lending policy change practices, as new types of loans and the possibility of interest-only periods may have increased households ability to distribute their consumption over a lifetime. This especially applies to firsttime buyers. Unemployment Unemployment is an indicator of future prospects, and affects the amount of potential homebuyers. Low unemployment improves wage settlements for everyone in the workforce. Simultaneously, larger workforce means more people being creditworthy. However, it may be problematic to include unemployment in a model where the income also is an explanatory variable, since developments in income and unemployment probably is closely correlated. Demographics Demographics impacts housing prices in several ways. The size of the total population relative to the housing stock is essential in the long-term. Increased percentage of people in the establishment phase is pushing prices up, especially for smaller dwellings. Reduced size of the average household has a similar effect. Moving patterns and centralizing tendencies may provide regional differences and thus affect average prices. For instance, increase in housing prices in cities are often greater 26
29 than the corresponding price growth in less densely populated areas, because housing supply in cities is less elastic than supply throughout the country. Some demographic factors may act simultaneously, and mutually reinforce each other; Settlement patterns of immigrants show a clear centralization trend The trend of smaller (and consequently a higher number) household is strongest in the cities Young people in the establishment phase are to a greater extent drawn to cities for conducting education and to work All of these factors contribute to push prices up in urban areas. Summary In this section, we have discussed the relationship between explanatory variables for housing demand and -prices. Fluctuations in elements of the housing cost and other variables create cycles around the rising trend. The housing cost consists of interest expenses after tax, operational and maintenance costs, property taxes, and the expected appreciation of the residence. Changes in credit restrictions, unemployment and demographic factors may also affect housing prices. We will now introduce the supply side of the housing market Supply Figure 3.2 illustrates determination of prices in the short-term. It shows the equilibrium where a group of homebuyers equal to the line segment of AB are left without a house. 27
30 Figure 3.2: Price determination in the short-term Hendry (1984) stated that housing supply is perfectly inelastic in the short-term 5, which means that it is relatively fixed. Consequently, the short-term housing supply is not largely affected by a rise in demand or in housing prices. The most obvious reason is that new constructions are time consuming. Even though housing supply is changing somewhat as a result of reconstruction of commercial buildings and natural attrition of housing, a good approximation is to assume the offer to be constant in the short-term. Thus, the supply curve becomes vertical, as illustrated in figure 3.2. In this section we will discuss factors affecting housing supply in a theoretical and empirical perspective. The housing stock in a given period depends on the stock of existing homes from former periods, in addition to new constructions subtracted the housing falling out of the market. However, new constructions will in turn depend on prices of existing homes, as new and existing homes are close substitutes. Housing investments will also depend on other factors, which in turn may be influenced by the willingness to pay. One such factor is the construction cost of new homes. We will now look at explanatory variables on the supply side, namely construction- and property costs. 5 Jacobsen and Naug define the short-term housing supply to be 2-3 years 28
31 Construction cost The factor price of labor and materials, housing requirements and productivity in the construction industry are fundamental factors affecting construction costs. Property cost The cost of land and property reprocessing determine the property cost. There is ample supply of land and potential property areas in most places in both Denmark and Norway, at least outside of urban areas. However, public infrastructure, in addition to necessary regulations, is just as vital as the property area itself. Cost of land outside urban areas are mainly determined by the alternative value of the land, as farmland or similarly. Scarcity of land provides different prices in urban areas than in less densely populated areas. Access of land determines housing prices more than the construction cost itself in metropolitan areas. Extensions of the housing stock must take place on vacant lots, in the periphery, via densification, or by reversal of commercial property. Other key factors are building processing, infrastructure in terms of public transportation and communication technology. Housing supply is stimulated by higher prices on existing homes and lower construction costs. Housing investments and the capacity in the construction industry are adjusting slowly. The construction cost may deviate from normal levels over longer periods, controlled by factor prices and the productivity in the industry. Slow adjustments make housing supply inelastic. Property access is the most important limiting factor for housing supply in urban areas, while it is a small problem in less densely populated areas where the alternative value of the area is less. 3.4 Price determination and equilibrium in the short- and long-term Figure 3.2 illustrates a positive market price, as there is a shortage of housing. In equilibrium, all homes for sale will be bought 6. The line segment of AB shows potential homebuyers with a lower marginal willingness to pay than the market price. These homebuyers will thus not able to buy a 6 The equilibrium price will equal the point of intersection where the supply and demand meet in a perfect market without frictions 29
32 home in this market. They will have to seek other markets to find homes priced below their reservation price. The demand curve illustrates, for any price level, how many homebuyers that have a willingness to pay equal to, or above, the actual price level. In practice there are not only one, but several homebuyers with a willingness to pay equal to each and every price level. Hence, the slope of the demand curve does not necessarily have to be minus one. The crucial factor of the slope is determined by the number of homebuyers with a willingness to pay equal to every single price level, and the slope may be exponential. Similarly, the slope of the supply curve is determined by the housing stocks price sensitivity. Higher price levels will result in more new constructions over time, which in turn will increase the total housing stock, and in the long-term we expect the slope of the supply curve to be positive. We will now address price determination in the short- and longterm The short-term As mentioned above, the short-term housing supply is inelastic, and it is reasonable to assume the housing supply to be unchanged. This implies that prices in the short-term are determined by factors on the demand side. Hence, drivers of a price increase in the short-term may be explained by increased disposable income or expectations of increased disposable income, a potential tax advantage of home ownership, a lower interest rate level, an expected increase in housing prices, or lower operating- and maintenance costs. This requires everyone to have access to credit. In practice, these effects will turn out differently, depending on whether people have debts, wealth or if they are existing homeowners (Kommunal og Regionaldepartementet, 2002). The market price will be equal to the short-term demand, and if prices are lower than the market price, the number of demanded homes will exceed the number of supplied homes. In that case we will experience a housing shortage. People with the highest willingness to pay are expected to make the highest bids in order to ensure the house. Accordingly, prices will be pushed up, until there is market clearance. Hence, the market price will equal the marginal demanders willingness to pay. In 30
33 other words, only people with a capacity to pay a minimum price, equivalent to the market price, will be able to buy The long-term It would not be reasonable to assume housing supply to be given in the longer term, as the commencement will pick up when housing prices exceed construction costs. Further, this will in the longer-term result in a higher housing supply, which in turn will curb the price increase. New constructions will continue until the marginal cost of constructing one more unit equals the market price - at this time it will no longer be profitable. In the long-term, housing supply will adapt to the demand. If the number of new constructions exceeds the resignation, the housing stock will increase. Hence, the short-term level of supply will shift to the right, as shown in figure 3.3. This will result in a long-term rising supply curve. Additionally, it is conceivable that other factors than the demand components may result in shifts in the demand. Among others, demographic factors and long-lasting production changes between sectors may play substantial roles. In addition, the supply side will in the long-term be limited by the quantity of building plots available (Skak, 2011). We have in figure 3.3 illustrated a positive shift in the demand curve. The new demand curve is named D. As shown, this will cause a new price of P in the long-term. The long-term price is lower than the short-term price P. A more elastic supply can more rapidly adjust to the demand, and in turn, the long-term price increase will be lower. Firstly, we get a new price in the intersection between supply in the short-term and the new demand curve (b). As illustrated, the short-term price increase is independent of the supply elasticity, as it is believed that the supply is given in the short-term. However, the housing stock will in the long-term be adjusted up to meet the increase in demand. This is illustrated by a rightward shift in the shortterm supply curve, S. If the housing stock increases more than the demand, the reservation price will be lower, and thus prices will fall. On the other hand, we will get the opposite effect if the demand side changes more rapidly than the increase in the housing stock. The price will increase to 31
34 P, given by the new equilibrium in b. Ultimately, figure 3.3 illustrates how the market price has increased as a consequence in a shift in the demand- and supply side, which is shown in c. The longterm price is named P. Figure 3.3: Housing supply in the short- and long-term Income is the most central driver for housing demand, and an increase in income provides a higher disposable income if everything else is held constant. Households will afford more expensive housing, and the willingness to pay for housing will increase. This means that the housing demand increases, which is illustrated in the figure above as a rightward shift in the demand curve from D to D. This will drive prices up, and existing homeowners will come fortunate out of the situation. They will obtain increased wealth, as their home will become more valuable. People selling their homes will obtain an economic gain on the sale. Conversely, people who are trying to enter the house market will have to pay a higher price for the exact same standard than what they would have done before the increase in average real income occurred. Additionally, a reduction in the interest rate will increase the willingness- and the ability to pay, as the housing cost will be reduced. People with existing debts may be granted a new mortgage loan, provided that they are granted credit. Housing prices will be pushed up, and the price increase will 32
35 continue until the level where housing costs are equal to the previous level for the marginal home buyer. If housing prices are pushed up, the decrease in interest rates will only have a small effect for first-time buyers, and the willingness to pay will only be higher for those already having debts (Kommunal og Regionaldepartementet, 2002). Actual- or expected increase in construction costs may affect expectations regarding an increase in the property value, since increase construction costs are expected to result in lower supply. This will in turn lead to increased house prices. On the other hand, if several people are expecting higher house prices not supported by developments in fundamental conditions, it may lead to an unbalanced market. Such a self-reinforcing mechanism creates a momentary and potential significant growth in prices 7. It may also result in a negative spiral with market pessimism, which we have discussed in section 3.1 about housing bubbles. Furthermore, it is important to take risk into account when buying a home. People with low wealth will normally have lower willingness to pay than people with high wealth. They will have to issue a higher loan to finance the house purchase, which involves a greater risk and uncertainty regarding both future interest rates and future income development. This could in turn affect the demand, and particularly young adults and immigrants, as they often have uncertain future income and normally less savings (Kommunal og Regionaldepartementet, 2002). Unemployment also affects prices through the expectation channel. When unemployment decreases more certainty regarding future income is creates, which may further result in increased housing demand. Accordingly, house prices will increase. 3.5 Fundamental factors (J&N) Jacobsen and Naug built an empirical model attempting to explain fluctuations in house prices. In addition to explaining the historical development of housing prices, they wanted to predict prices in the near future. An important issue is raised in their article - namely whether house prices are overvalued in relation to a fundamental value. This value is determined by the explanatory variables they conclude are relevant for the price development. They did this analysis because house prices 7 Housing bubbles are often explained by irrational expectations (Case and Shiller, 2003). 33
36 had experienced significant growth during the period between 1992 and when the prices more than tripled. Jacobsen and Naug s model presents four central and crucial key factors that are decisive for a property s value in the longer run. Hence, we will look at the changes and movements in each of these factors for both Denmark and Norway. These factors are: interest rates, unemployment, level of income, and housing construction. Jacobsen and Naug states that the fundamental factors cited in the analysis as the key drivers of housing prices are good arguments to provide an explanation of the intense rise in housing prices we have seen the recent years. The authors tested a number of variables to determine which factors that are influencing house prices. More concrete, they tested 12 different variables, before taking lagged values into account. They used short time series for housing prices with the price index for pre-owned housing as a whole. This index has quarterly data going back to Q The authors solved the problem by estimating a number of models, which only contained a subset of variables. Further, they simplified the models by imposing restrictions that were not rejected by the data and that simplified the interpretation of the dynamics. The variables that Jacobsen and Naug tested in their model were income, indices of paid rent and total house rent in the consumer price index (CPI), other parts of the CPI adjusted for tax changes and excluding energy products (CPI-ATE), various measures of the real after-tax interest rate, the housing stock, the unemployment rate, backdated rise in house prices, household debt, total population, the percentage of the population being in the establishment phase (i.e. aged and 25-39), various measures of relocation/centralization and TNS Gallup s indicator of household expectations concerning their own and the country s economy. We will not go further in to the mechanisms behind their model, but only focus on the four most important fundamental factors. The next section will explain the four different fundamental factors included in Jacobsen and Naug s final model. 34
37 3.5.1 Interest rate Jacobsen and Naug (2004) point out that the interest rate largely affects house prices. The factor that probably has the greatest impact on demand for credit is developments in the interest rate. Hence, interest rate indirectly affects the demand for housing. A reduction in the interest rate will result in expectations about a further increase in house prices, and a rise in the interest rate results in expectations about a decrease in house prices Unemployment Unemployment is another important factor that is being brought up. The unemployment is a variable that will impact house prices directly. If the level of unemployment rises, several people will have difficulty serving their loans, which further may lead to forced housing sales. Increased unemployment will have a clear negative impact on house prices. The rationale for including unemployment as an explanatory factor is that increased unemployment leads to expectations of lower wage growth and higher uncertainty about future income and ability to pay for themselves and others. This will in turn result in reduced willingness to pay for housing Real income As mentioned earlier, income is one of the most central drivers for housing demand. Jacobsen and Naug (2004) argue that housing prices must rise in line with income in the long run, because variables such as interest rates, unemployment and expectations are stationary. Hence, they fluctuate around an average that is constant over time. Real income directly affects the ability to pay, and an increase in income may therefore result in increased willingness to pay. If housing demand is high, several people would sacrifice more to win the bidding round and thus push the willingness to pay towards the payment capacity. This may further result in strong growth in housing prices. Growth in income is in isolation a factor that forms the basis for fundamental price growth in the housing market. Even though an increase in income level provides a fundamental argument and vindication of the rise in housing prices, it will not be possible, or sustainable, if housing prices increase more than the income level. 35
38 3.5.4 New constructions Jacobsen and Naug (2004) argue that house prices affect the activity in the construction industry. New constructions will be profitable if house prices increase relative to the construction cost. In the short-term it is difficult to determine whether new constructions are affecting house prices, as the housing supply is fairly stable. It takes time to build new homes, and new construction each year is relatively low compared to the total housing stock. In the long-term, new constructions should be adapted to the demand for housing. An increase in new constructions will result in reduced house prices, and a reduction in new construction will result in increased house prices. In other words, long-term fundamental increase in house prices might be explained by low construction activity. 36
39 4 HISTORICAL DEVELOPMENT 4.1 The Norwegian housing market In this section we will describe three housing booms followed by cracks that have affected the Norwegian market: Kristianiakrakket ( ) Parikrisen ( ) The banking crisis ( ) In addition we will discuss the period after 1993, including the financial crisis in Further, we will reflect these periods to Minsky s model. Kristianiakrakket The first economic crisis that really affected the Norwegian housing market was Kristianiakrakket in The end of the 1800s was characterized by strong economic growth, especially in large cities. The population, income, and constructions increased, in addition to the supply of financial services. International economic conditions continued to fluctuate in the late 1890s, and affected the Norwegian economy. Continuous increase in the stock market, migration to large cities and high demand for housing resulted in a liberal borrowing policy (Statistics Norway). Additionally, the number of banks grew rapidly. In 1890, there were 30 commercial banks in Norway, compared to 10 in An economic expansion in the end of the 1800s led to increased export, industrial growth and housing speculations (SNL, 2016). A significant increase in new constructions between 1893 and 1899 led to a housing crack. As a result, when the crisis occurred, as much as 10 % of the building stock was empty, and to prevent depopulation housing rental prices in some areas were set to zero. The crisis happened when Christian Christophersen & Co went bankrupt. The banks total debt was NOK 14 million, which equaled 20 % of the governments yearly expenses (Gram, 2015). Easy credit access and a strong construction pace had led to the supply exceeding the demand when the bubble burst. Loan financing from banks that were secured by shares, where offered to builders and buyers (Grytten, 2008). 37
40 We will now discuss the crisis using Hyman Minsky s model. Displacement The strong optimism towards the end of the 1800s, the increase in export, and the industrialization led to a displacement in the market. Migration to the capital was extremely high and grew by 23.8 % from 1895 to 1898 (Søbye, 2000). The new law of full halt in the construction industry accelerated this process. Additionally, the monetary policy changed from a quotient to a differential system. i. Overtrading When the housing law was enacted in 1893, the nominal housing prices rose by 12 %, and the prices was far above the trend line. The Norwegian economy was rising, and the globalization made sure of an increase in housing demand. House prices increased significantly in the coming years even though the construction was high. This would indicate a lower supply than demand. ii. Monetary expansion A sharp fall in the interest rates between 1892 and 1898, in addition to increased wages, ensured a higher demand for money and credit (Knutsen, 2008). This led to establishment of new banks, and from 1895 to 1900, 40 new commercial banks were established in Norway (Eitrheim et. al., 2003). Competition among banks pushed the interest rates to a lower level, which contributed to a strong growth in house prices. A fall in the interest rate, optimism, and growing credit- and money supply led to a tremendous boom. iii. Revulsion Christophersen & Co went bankrupt in the end of 1899, and the business cycle changed. Unemployment increased, and housing supply was significantly higher than housing demand. The construction boom from 1883 resulted in unoccupied houses in the main capital (Søbye, 2000). This indicated that house prices were driven by speculations and not a lack of housing. 38
41 iv. Discredit Optimism quickly changed to pessimism. As a result of the recession and economic losses, banks started to lower their credit level, and implemented a more restrictive lending policy. To compensate for the increased risk, the interest rate was set to a higher level. The growth in credit levels dropped significantly at the end of the 1800s, and had virtually no development in the following years. The money supply followed a similar trend. The result was a comprehensive housing- and banking crisis. Parikrisen in the 1920s The second big crisis happened in the 1920s. The nominal aggregate housing price index rose by 72 % from 1914 to 1920, while the consumer price index rose by 197 % during the same period (The Central Bank of Norway, 2015). As a consequence of a higher proportion of money supply in circulation relative to goods, Norway experienced large price increases. An expansionary monetary policy and the shortage of goods led to an increase in inflation. As a result, the government increased the interest rate and led a contractionary monetary policy in the period between 1920 and The development changed and Norway experienced deflation and appreciation, in addition to bankruptcies in banks and a significantly fall in housing prices (SNL, 2015a). Displacement In 1914 the Central Bank of Norway had to redeem the fixed relationship between money supply and the amount of gold reserves (Hodne and Grytten, 2002). This led to a macroeconomic shock that caused a displacement. i. Overtrading People had more optimistic expectations for looser monetary- and credit policies. The willingness to pay increased and housing prices grew. ii. Monetary expansion 39
42 Banks received a considerable proportion of the money supply due to a repeal of the gold standard and increased money supply. Production was low compared to the money supply, which led to inflation and speculations. The inflation increased, and peaked at 40 % in This resulted in a real interest rate of -30 %, and triggered the desire to invest. A consequence was widespread speculations of equity, bonds, and the housing market (Hodne and Grytten, 2002). Norway experienced excess demand after the war, due to a shortage of goods. Optimism and easy access to money led to high consumption. iii. Revulsion In 1920 the trend changed, and Norway was now facing a period of recession. Simultaneously, in order to get the currency in par value relative to gold, the Central Bank of Norway introduced a more defensive monetary policy. Inflation turned in to deflation and the real interest rate turned from negative to positive. Lower supply of money made it more expensive to invest, and homebuyers had lower willingness to pay. Consequently, the housing demand fell in 1921, and the housing crack was now a reality (SNL, 2015a). iv. Discredit Fall in demand led to a reduction in the income level, which led to massive strikes. Unemployment rose and the banks had to carry heavy losses due to the expansive monetary policy. The banking crisis in the 1980s The political objective after World War II was to give residential construction a wide space in the reconstruction work, as it had been disastrously neglected during the war. The embattled areas were to be prioritized first, to ensure appropriate settlement with the aim of obtaining good and sufficient spacious homes for all residents (SNL, 2015b). Some of the political guidelines that were implemented to achieve this goal were direct government support for householders, indirect support through the deductibility of mortgage interests, VAT compensation and low property taxes. These political objectives left its mark on the Norwegian housing market in many years after the war, and have most likely in some way continued to affect the Norwegian housing market until today, with a 40
43 higher proportion of homeowners than in many other European countries (Sørvoll, 2011). The proportion of homeowners in Norway was 51 % in 1945, compared to 80 % in House prices increased relatively steadily, except from slight fluctuations, in the period after World War II until the late 1970s. However, this has to be seen in context with the new regulations. The housing- and credit market was deregulated in the beginning of the 1980s, as well as pre-emptive and price-fixing regulations slowly, but surely, was removed (Lundesgård, 2012). The housing market could operate as a free market, without government interference. The deregulation during the Willoch-government ( ), in combination with a substantial growth in the Norwegian economy, low unemployment, increased access to credit, as well as high inflation (which resulted in a negative real interest rate in some parts of the period), made it very lucrative to invest in the housing market (Lundesgård, 2012). The nominal house prices in Norway increased with as much as 60 % in the period between 1984 and 1988, when they experienced a period of expansion (The Central Bank of Norway, 2016). Low interest rate in combination with the credit liberalization 8 explains a lot of the development in house prices in the period between 1970 to mid The oil adventure and subsequent investment willingness among financial players, led to credit-financed consumptions and demand for houses. Both the real and nominal house prices increased significantly. In 1986, Norway entered a period of recession with low oil prices and a weaker export industry. This was met with a devaluation of the Norwegian Krone with the purpose to improve competitiveness. A high interest rate was necessary to counteract expectations of a new devaluation (The Ministry of Finance, 2013), and the consequences were a crisis in the financial industry in the late 1980s. Households struggled to repay loans they had incurred during Jappetiden 9, combined with a historical high real interest rate of 7-8 %. Additionally, new lending regulations were 8 Norway s Prime Minister Kåre Willoch disengaged the credit market, and the Norwegians went crazy, as they could borrow almost as much money as they wanted to. 9 It was a great emergence of ambitious, dynamic and individualistic people, with attitudes that more than ever acted for personal gain. These people were known as yuppies ( japper ) 41
44 implemented by the banks. This contributed to increased interest expenditures for households by more than 30 % from 1985 to In 1985 and 1986, house prices grew by an average of 30 % each year, but when the bubble burst in 1987, the prices fell with over 40 % in four years. Norway entered a new recession that lasted until Displacement In the late 1970s, Norway followed international liberalization trends and got a more international economy. Financial- and credit markets were the most liberal. The housing market was subjected to deregulations, and thus the housing prices did not follow their natural growth path. i. Overtrading Changes in macroeconomic factors resulted in optimism and future profits, also called Jappetiden. ii. Monetary expansion During the 1980s the inflation in Norway was approximately 10 %, which is extremely high. Due to the high inflation, real interest rates were low and occasionally negative at the beginning of the 1980s. Although the real interest rate increased, the desire to invest was relatively high. In context to the deregulation of the credit market, the increase in real interest rate was undermined and the house prices continued to increase. The expansionary monetary policy led the Central Bank of Norway to increase the money supply considerably. This resulted in a doubling of the money supply in the period 1980 to 1986 (Hodne and Grytten, 2002). iii. Revulsion Norway was highly affected by the decline in oil prices in Norwegian Krone was devalued by 12 % and the exchange rate was unchanged (Hodne and Grytten, 2002). The currency was weakened as an investment object, and the interest rates increased until the beginning of the 1990s. This led to a turn in the investment growth, and the unemployment rose. 42
45 People were defaulting on their loans, the banks guarantee fund was not large enough, and the authorities had to be proactive in order to save them. From 1987 to 1992, house prices fell by 40 %, a reduction that certainly can be characterized as a bubble bursting. iv. Discredit Prices fell below its natural growth path after the bubble burst in The period from 1993 and a new banking crisis in 2007/2008 The recession lasted until 1993 and Norway had a continuous economic upturn until 2008, except from 2002 and The rapid growth in house prices from Q1 of 1993 to Q3 in 2007 was in total equal to 198 % (in real prices). This period is characterized by expansionary monetary policy, a low interest rate as a result of the low inflation, strong wage growth, low unemployment and a high rate of migration to the cities. Banks and creditors led an expansionary monetary policy to get more customers. The introduction of interest-only loans and low-deposits made it possible to reach as many borrowers as possible. Both Norwegian and Danish banks converted to Basel II regulations in 2007, which implied that the requirements for the risk weights of the banks decreased (The Ministry of Finance, 2011). The Norwegian Ministry of Finance does not exclude that this has a correlation with the growing debt burden in the beginning of the 2000s. Before the introduction of Basel II, several banks took higher chances and approved more, in addition to a greater degree of risky loans, as they already in 2004 knew that they would have a greater lending capacity in a few years. In other words, the banks secured their market shares in advance. The transition period kept going until The vulnerability of the Norwegian financial system increased towards the financial crisis, but the Central Bank of Norway and the Financial Supervisory Authority did not consider the situation as critical (The Ministry of Finance, 2011). The demand for Norwegian goods declined as a result of the financial crisis, and the growth in the Norwegian economy decreased towards 2008 (The Ministry of Finance, 2011). Housing prices in Norway dropped in the wake of the financial crisis, but they recovered relatively short after. In 2008 the prices reached a bottom. However, the real house prices were back to the same level as prior to 43
46 the crisis already in the second quarter of This may be due to an operating and ongoing expansionary monetary- and fiscal policy stimulus during the financial crisis, to keep the wheels turning in the Norwegian economy. It is argued that the experiences from the banking crisis in the 1990s were helpful in this period, especially given the banks customization and the government s design of rules (The Ministry of Finance, 2011). The budgetary rule may be avoided with a certain margin in order to prevent financial crises, and government spending increased sharply in relation with the recession. Displacement The inflation was 1.3 % in 2002, due to strong product growth and a number of supply shocks. In addition, the key interest rate reached a peak of 7 % by the end of the year. The Central Bank of Norway therefore began strong and frequent interest rate changes to strengthen the economy so that inflation would be at the desired level 10. Already at the end of Q1 of 2004, the key interest rate was 1.75 %, which was historically low. A sharp reduction in the key interest rate, in addition to several supply shocks, can be characterized as a macroeconomic shock. This led to growth in house prices. i. Overtrading The macroeconomic shock led to optimism, which in turn increased expectations of future earnings. ii. Monetary expansion The low interest rate led to higher demand for money. As a result, the willingness to issue loans increased, and the competition between lenders became harder. Homebuyers got increasingly favorable terms on their loans, and could thus afford to invest more in houses. iii. Revulsion The problems began during 2006 and 2007 when the international economy turned. Unemployment increased, and more borrowers were unable to pay their installments. As a consequence, the 10 In 2001 Norges Bank introduced an annual target to inflation to be 2.5 %. 44
47 investment banks in the US, and in turn investors throughout the world, began to experience large losses on their subprime portfolios. House prices decreased and banks were forced to sell homes below the original value. The Norwegian housing market started to react to these changes, and the pessimism led to a drop in demand for money and credit. House prices declined significantly, and in the latter half of 2007 we could see the first sign of what many thought would be a protracted decline in house price. In the end of 2008 the Norwegian economy seemed to be negative. The Central Bank of Norway was criticized for not following up the prospects by reducing the key interest rate and increase spending. However, on October 15 th 2008, the Central Bank of Norway reduced the key interest rate by 0.5 percentage points. They continued to reduce it even more, and in June 2009 it was historical low, 1.25 %. iv. Discredit Unlike the other periods, there has not been any discredit for the house prices in the period after What looked like a period of profit taking until 2009, changed when the house prices started to rise again. New optimism and sharp reduction in interest rates resulted in an increase in house prices after a short fall in This is not normal for the last periods in Minsky s model. A short summary of the Norwegian housing market history The Norwegian housing market has experienced three cracks, and in this section we have looked at the history and some repercussions of these. The level of inflation, interest rates, borrowing policy and credit growth largely affect a boom or a bubble. However, it is difficult to foresee a bubble, and even more difficult to predict when the bubble will burst. Although Norway has experienced strong growth in house prices since 2009, it gives us no basis to say whether or not we are in a housing bubble. However, the development in house prices gives us a basis of further analysis as to whether or not the prices can be explained by fundamental factors. We do not know if the housing market today should be similar as previous periods, markets are constantly changing and adapting to new equilibrium. 45
48 4.2 The Danish housing market The housing market in Denmark has experienced three cycles of rapid growth followed by a recession in house prices since We will include a short review of the first two cycles, and detailed review of the last one. Cycle 1 The first cycle took place from the beginning of the 1970s and lasted until the beginning of the 1980s. Real house prices experienced a moderate drop after the oil crisis in 1973, but they picked up rapidly and showed a steady increase of 32.1 % from Q1 of 1970 until the second oil crisis, which occurred in Q2 of 1979 (Girouard, 2006). The oil crisis resulted in higher unemployment- and interest rates, as well as lower household income. Obviously, this combination had a negative impact on house prices, and in 1979 Denmark witnessed the most excessive drop in house prices since the World War II (Det økonomiske råd, 1979). Real housing prices dropped as much as 36.8 % between Q1 of 1979 and Q4 of 1982 (Realkredit Denmark, 2012). Cycle 2 The second cycle happened from 1982 to House prices continuously increased by 56.5 % between Q4 of 1982 and Q1 of 1986 (Girouard, 2006). The exchange rate in the early 1980s was converted to a fixed exchange rate policy in the hope of fostering stability and more security around the Danish krone. The policy turned out to be effective, as a new optimism was created in the market. Export increased, which was a necessity as the Danish economy suffered a very indebted economy. The increase in exports and optimism in the market, together with declining interest rates, led to a new boom in Denmark (Abildgren and Thomsen, 2011). The boom led to a significant increase in GDP from 1982 to 1986, and an increase of 43 % at current prices occurred (Statistics Denmark). The surge in GDP may possibly have been due to the new initiatives by the government, but also because the credit availability was expanded during the given period, which made companies more applicable to borrow for new investments. The boom occurred in the wake of a time of falling house prices, and with expanded credit availability, there was an increase in the lending quota for housing investments (Abildgren and Thomsen, 2011). In 1986 several contractionary fiscal policies were introduced, which now is called Kartoffelkuren. These policies 46
49 occurred during the Schlüter government ( ). The purpose was to improve the foreign commerce bank by limiting resident s access to credit, by making it more expensive to issue loans for both consumption and house purchases. The aim was to encourage people to increase their private savings. Consequently, the demand for domestic goods and services decreased, in addition to a decline in new housing constructions. Furthermore, the unemployment rate decreased and the housing prices dropped even more as a result of the low level of economic activity. Minsky argues that there should be increasing credit opportunities in a market before an economic shock can trigger a crisis. The reform changes in the mortgage market in the early1980s opened for new credit opportunities for borrowers. The new loan opportunities resulted both in renewed energy to the banks lending quota, as well as growing demand for housing and new constructions. The latter meant that the unemployment rate fell, which further led to a rise in disposable income, and in turn resulted in an opportunity for more borrowers in the housing market. This led to a further demand for housing and mortgage loans, and consequently increased house prices. The introduction of Kartoffelkuren in 1986 intended to reduce consumption and raise savings among the Danes, which resulted in a falling housing demand. Rising unemployment and thereby decreasing disposable income led to further decline in demand for housing and thus also a decline in both mortgage loans and house prices. Cycle 3 Both the first and the second cycle lasted for about a decade, with an average duration of 5.5 years of boom and 4.5 years of recession (André et.al., 2006). The decline in house prices between 1987 and 1992 was corrected during the following years. The third cycle differs as it lasted longer than the two previous, with a boom of 14 years and a positive growth in real housing prices of % from 1993 to 2007 (Bødker and Skaarup, 2010). The price level was 72 % higher in 2007 than in 1986 (Shiller, 2005). Interest-only loans were introduced in October 2003 (IMF, 2007; Lunde, 2009a), which amounted for 25 % of all the outstanding debt of Danish households in 2006 (Erlandsen et.al., 2006). There were also introduced new types of fixed-rate loans in 2004 (IMF, 2007). 47
50 The downswing of the third cycle is described by OECD as follows: The Danish economy is currently experiencing its worst recession in over four decades. The downturn, which started with the unwinding of the property boom has now been compounded by the trade and financial effects of the global economic crisis. OECD (2009) Housing prices fell with 7.6 % in real terms in 2008, and between Q3 of 2007 and Q2 of 2009 they fell with as much as 24 %. Housing prices and the access to credit went hand in hand, and many borrowers experienced major credit loss. Denmark was also experiencing a huge financial and economic crisis after the drop in housing prices. IMF implies that it exists a significantly correlation between the economic cycles and the housing prices, as the housing prices are forward-looking, and consequently in head of the economic development. According to Minsky s theory, it is only possible for economic upheaval to have so much influence if the housing market is in a bubble with expanded credit opportunities and optimistic borrowers with low risk expectations. As mentioned earlier, Minsky argues that when the economy is experiencing a boom, the credit availability is in an upward curve as well. This was the case in the period between 2003 and 2006, when the credit availability was expanded even before the crisis in 1996 with floating rate loans, and in 2003 with the possibility of interest-only loans. Especially from 2003 and onwards, the economy was strong and in a period of expansion in Denmark, and many borrowers achieves additional return on their housing investments. This caused more borrowers to enter the market. A characteristic of the development in Denmark was, however, that the increase in the Danish house prices proved to be a consequence of a housing bubble (Hendricks, 2012). A short summary of the Danish housing market theory From 1929 to the Great Recession in 2007 the GDP had a growth rate of 2.05 % per year. The global boom in 1960 affected Denmark and they had long periods with high growth rates in the GDP. However, during the Kartoffelkurven in the 1980s the growth rate was relatively low. It was not until 1993 the Danish economy started to grow again. 48
51 A natural question to raise is whether or not the housing prices alone have been a contributing factor to the recession in the Danish economy, in line with what IMF implies, because of the fact that the Danish housing prices started to fall in advance of the occurrence of the subprime crisis in the American housing market, and thus also before the global financial crisis. The global financial crisis clearly did not make the situation any better for the Danish economy. However, it is important to mention that the crisis itself did not cause the housing crash in Denmark, since the housing prices were declining even the financial crisis. A consequence of the global financial crisis for Denmark was a significant drop in GDP measured in real terms. 49
52 5 COMPARATIVE FUNDAMENTAL ANALYSIS In this section we will provide a comparative analysis of different factors influencing the housing market in Norway and Denmark. The factors we will analyze are historical developments in house prices, gross domestic product (GDP), key interest rates and Jacobsen and Naug s (2004) most important fundamental factors; interest rates, disposable income, unemployment and new constructions. The purpose of the comparative analysis is to investigate whether developments in the Norwegian housing market today is similar to developments in the Danish housing market when they were experiencing a housing bubble. Moreover, if the high growth in house prices in Norway can be explained by fundamental factors. 5.1 Development in real house prices Figure 5.1 illustrates the development in Norwegian and Danish real house prices from 1992 to Figure 5.1: Development in real house prices Denmark and Norway (Index 1992=100) 11 Norway has experienced significant growth in house prices since the 1990s, and the development was relatively similar in Denmark until the financial crisis. However, the Norwegian and Danish 11 See appendix 2 and 3 for calculations 50
53 house market started to move in opposite directions after the financial crisis. As illustrated above, Norwegian house prices continued to grow despite a slight fall during the financial crisis, whereas Danish house prices did not recover. Developments in Norwegian house prices may be seen as abnormal compared to developments in Danish house prices. However, Denmark was experiencing a housing bubble prior to the financial crisis. This is of course a contributing factor for the dissimilar developments. It may as well be strengthened if Norwegian house prices are growing more rapidly than what fundamental factors explains. 5.2 Development in Gross Domestic Product (GDP) House prices are expected to be relatively consistent with the cyclical development in a country (Valadez, 2011). GDP is the primary indicator to measure the economic wealth of a country. It is therefore interesting to analyze GDP developments, as it can provide information about the trend in house price developments. If the growth in GDP does not correspond with the growth in house prices, it may point towards a housing bubble. Figure 5.2 illustrates the development in GDP in Norway and Denmark from 1980 to Figure 5.2: Development in GDP in Norway and Denmark (Index 1980=100) 51
54 As illustrated, Norway and Denmark has both had a relatively stable growth in the GDP, with exception of some slight falls. However, the GDP in Norway has had a significantly higher growth than in Denmark since This might be seen in context to Norway s high income from the petroleum sector. The GDP development in Denmark cannot explain the drop in house prices, which is consistent with the fact that they were experiencing a house bubble. Conclusively, the GDP development underlines indications of a housing bubble in Denmark, and the house price development cannot be supported by this fundamental factor. The GDP growth in Norway is higher than in Denmark. This can support the higher house prices in Norway. Hence, house prices might not be abnormal, and can be explained by this fundamental factor. However, this factor alone is not enough to conclude whether or not prices may be supported by fundamental factors. 5.3 Development in key interest rate The central bank in every country sets a key interest rate to ensure economic stability. The key interest rate affects the short-term market rent and expectations about future developments, and is an instrument to regulate a country s monetary policy (The Central Bank of Norway, 2004). A change from an expansionary monetary policy (a decrease of the rate) to a contractionary monetary policy (an increase of the rate) can highly influence developments in house prices (The Central Bank of Norway, 2004). Hence, it is interesting to see how developments in the key interest rate may have affected the different house price developments in Norway and Denmark. The central bank in both Norway and Denmark are changing the key interest rate in order to sustain economic stability. The Central Bank of Norway adjusts the key interest rate on the basis of the inflation target 12, whereas the key interest rate in Denmark is adjusted when the European Central Bank is changing their key interest rate. This is due to the fixed-exchange-rate policy Denmark has against the Euro (The National Bank of Denmark, 2015). 12 In 2001 the central bank of Norway introduced an annual target to inflation to be 2.5 % 52
55 Figure 5.3: Development in key interest rate Norway and Denmark The key interest rate has in general been developing in the same pace in both countries. However, the Norwegian key interest rate has overall been on a higher level than the Danish. The central bank in both countries lowered the key interest rate drastically in 2008 as a consequence of the financial crisis. This was done to stabilize the country s economy. In Denmark, the key interest rate was increasing from 2003 to Simultaneously, house prices increased during the same period. This may indicate that the house prices were not supported by this fundamental factor. Since 2008, the key interest rate has been historical low in Norway, and the trend shows an overall decrease. As the key interest rate indirectly affects housing prices, we can argue that the development in the key interest rate supports the high growth in house prices. Hence, Norwegian house prices may partly be explained by this fundamental factor. In conclusion, developments in the key interest rate in Norway support the high growth in house prices today, whereas they could not support the high house prices in Denmark from 2003 to Until the summer 2003, the d-lending rate was Norges Bank s key rate 53
56 5.4 Development in interest rate (lending rate) As mentioned in section 3.5.1, developments in the interest rate is the factor that probably has the greatest impact on demand for credit, and thus indirectly affects the demand for housing. Interest rates and installments determine how much of household s income that contributes to serve the loans. Hence, the interest rate is important to determine the size of households loans. If the interest rate is high, it is more expensive to finance housing investments. Less people will have the opportunity to issue loans and invest in housing. Conversely, a lower interest rate will result in more people having the opportunity to increase their borrowings. Figure 5.4: Developments in interest rate Norway and Denmark Figure 5.4 illustrates the lending rate in Norway, as well as the average 14 short- and long bond rates for mortgage loans in Denmark. The short- and long rates for Denmark provides an overview of the development of interest of mortgage loans. The interest rate has mostly been developing in the same pace in Norway and Denmark. In Denmark, the interest rate increased from 2003 to 2006 before it started to decline again. In the same period, the house prices rose. Consequently, the increase in house prices prior to the financial 14 The bond rate is calculated as a yearly average from the weekly figures from Association of Danish mortgage loans. 54
57 crisis cannot be explained by this fundamental factor. Furthermore, the interest rate fell in Norway after the financial crisis, and the interest rate has had an overall decline since then. A low lending rate supports high house prices. Hence, as this indirectly affects demand for housing it can support the high growth in house prices in Norway in recent years. In conclusion, developments in the interest rate in Norway support the high growth in house prices today, whereas they could not support the high house prices in Denmark from 2003 to Development in disposable income Housing procurements are financed by loans served by people s income. Problems may arise if interest rates and -costs, in addition to installments, are higher than income. Hence, house prices cannot outgrow people s income over time (Larsen, 2005). Figure 5.5 illustrates the development in real disposable household income from 1992 to 2015 in Norway and Denmark. Figure 5.5: Development in real disposable income in Norway and Denmark (1992=100) Developments in disposable income have been relatively similar in both countries. However, the growth in income in Norway has overall been higher than in Denmark since Disposable income in Denmark has followed the house price development (cf. figure 5.1). High growth in 55
58 disposable income can result in higher optimism associated with future income. Hence, the high growth in income prior to the burst of the housing bubble in Denmark may have been a contributing factor for the high house price increase. Despite a slight drop in 2006, disposable income has had a substantial growth in Norway. High increase in income can generate expectations of a further growth, and thus have affected the high growth in house prices. Conclusively, this fundamental factor can explain the house price development in both Norway today and in Denmark prior to the financial crisis. 5.6 Development in the unemployment rate As mentioned in section 3.5.2, unemployment is a factor with a directly impact on house prices. A lower unemployment rate will result in expectations of higher future income, and vice versa. The unemployment rate tends to be higher during recessions, and lower during expansions. Hence, this development can provide indications of growth in house prices. Figure 5.6 illustrates developments in the unemployment rate in Norway and Denmark from 1980 to Figure 5.6: Development in unemployment rate in Norway and Denmark
59 The unemployment has been relatively low in Norway, compared to Denmark. We will further analyze developments in unemployment compared to real house prices in both countries in order to investigate whether the level of unemployment can support the developments in house prices. Norway Figure 5.7: Development in unemployment rate and real house prices in Norway (1980=100) The unemployment rate in Norway has on a general basis been low in the period between 1980 and There was a small increase from 2008 to 2010 as a result of the financial crisis. After this, it somewhat stabilized, until it rose again from 3.5 % to 4.4 % in This increase might be due to the oil-driven recession Norway is now experiencing. Developments in unemployment and house prices are generally moving in opposite directions, and higher unemployment has a tendency to cause lower house prices. Nevertheless, we can see a growing trend in Norwegian house prices in addition to higher unemployment. 57
60 Denmark Figure 5.8: Development in unemployment rate and real house prices in Denmark (1992=100) The development in unemployment has been relatively low compared to house prices. When Denmark experienced a housing bubble, the unemployment fell and house prices rose. Hence, this fundamental factor can explain the house price development. Conclusively, unemployment cannot explain the high growth in house prices in Norway, which indicates bubble tendencies. On the other hand, it could explain the price growth in Denmark prior to the financial crisis. 5.7 Development in new constructions Jacobsen and Naug stated that increased constructions in principal would lead to lower house prices. The following figures show developments in new constructions in both Norway and Denmark. 58
61 Figure 5.9: Development in new constructions Norway Figure 5.10: Development in new constructions Denmark The movement in new constructions have been relatively similar in both countries. Intuitively, a larger amount of new constructions will result in a larger housing stock and supply side, which further should result in lower prices. As illustrated in figure 5.9 and 5.10, new constructions have increased during the past years. We see an overall increasing trend from the beginning of 2008 in 59
62 ongoing and completed dwellings. However, started dwellings the last two years have increased, whereas completed dwellings have leveled out. Nevertheless, started constructions today might not turn out in a larger housing supply before the constructions are completed. In the period between 2003 and 2006, new constructions and house prices increased significantly in Denmark. This fundamental factor could thus not explain the house price developments. Conclusively, new constructions cannot support house price developments in Norway today or in Denmark prior to the financial crisis. However, since this factor is difficult to incorporate, it has to be put in context with additional factors. 5.8 Conclusion comparative fundamental analysis The following table illustrates whether or not the analyzed fundamental factors may contribute to support the house price growth in Norway and Denmark. Fundamental factors Norway Denmark GDP Can support house price growth Bubble tendencies Key interest rate Can support house price growth Bubble tendencies Interest rate Can support house price growth Bubble tendencies Disposable income Can support house price growth Can support house price growth Unemployment rate Bubble tendencies Can support house price growth New constructions Bubble tendencies Bubble tendencies Table 5.1: Conclusion comparative fundamental analysis By generally looking at the economic growth in these two countries, Norway has experienced a strong growth since the financial crisis. The Danish economy has evolved differently, with a declining growth since An economic recession like Denmark experienced affects the housing market indirectly in terms of higher unemployment (as well as greater uncertainty about future earnings), lower income, and by negative expectations regarding own- and the country s economy. 60
63 Studies show that economic recessions incurring in connection with a fall in house prices in socalled strong economies are contributing to a deeper and more prolonged recession than otherwise. It is observed that the unemployment rate will drop significantly more, and that the fall in GDP is slightly larger than when the recession does not coincide with a fall in house prices (IMF, 2008). In this chapter we have analyzed various factors that are considered to be important when determining developments in the housing price market. Although we know for a fact that Denmark was in a housing bubble, some of the fundamental factors can still support the house price growth. Findings from the fundamental comparative analysis do not show vital signs of a housing bubble in the Norwegian market. However, some of the fundamental factors show indications of bubble tendencies, namely developments in the unemployment rate and new constructions. Further analysis has to be conducted to make a certain conclusion. 61
64 6 ANALYSIS OF CASE AND SHILLER S HOUSING BUBBLE CRITERIA We introduced Case and Shiller s seven criteria for a housing bubble in section In this chapter we will firstly attempt to investigate whether the conditions in the Norwegian housing market today fulfill these seven criteria. Subsequently, we will address the Danish housing market prior to the financial crisis. Lastly, we will discuss three additional factors that we consider as highly relevant for developments in house prices in Norway. Statistics for the Norwegian housing market is collected from Statistics Norway, retrieve media, the Central Bank of Norway and Norwegian Association of Real Estate Agents. Statistics for the Danish housing market is collected from Statistics Denmark, Infomedia and the report Den Finansiele Krise i Danmark årsager, konsekvenser og læring. 6.1 Norway The pressure of being a home-owner This is a discretionary assessment as it is difficult to measure. More people will enter the housing market if they feel that owner-occupied housing is a requirement. If the pressure is high, housing demand will increase and further push house prices up. In Norway, 84 % 15 own their own home (Statistics Norway, 2015), and Statistic Norway s report (2015) shows that this percentage has been relatively stable over the last decades. Due to a decreased interest rate and increased rental prices the last years, more people will choose owner-occupied housing rather than rental housing. Numerous people believe that rental housing for longer periods is a waste of money, as they will miss out on the possible and expected increase in housing value. Hence, we can argue that there exists a pressure of being a home-owner in Norway by looking at the house price development and the ratio of homeowners. Accordingly, we believe this criterion to be fulfilled. Widespread comprehension that it is profitable to own housing Case and Shiller argue that an increase in people considering housing as an investment may point towards a housing bubble. One indication may be the development in secondary housing. From the 15 Percentage of the population over 16 years old. 90 % over 45 years old own their own home. 62
65 Norwegian Tax Authority s report it is shown that 17 % of the housing market in 2015 represents secondary housing (Vegstein and Ekeberg, 2015). This is an increase of about 2 percentage points from (Sparre, 2013). Additionally, after the financial crisis, a lot of speculators had a tendency to turn from the financial market and enter the housing market instead, due to excessive volatility. Households may choose to buy a house instead of renting it because they expect a positive return on the purchase. It is difficult to measure whether people are buying a house for future price increases or for consumer needs. However, according to a research done by GARANTI Eiendomsmegling (2015), 60 % believes that housing is the best long-term investment. Additionally, 70 % expects house prices to increase or be unchanged in We therefore find it reasonable to assume that several households find it profitable to own housing. Hence, this criterion is fulfilled. Widespread expectations of increase in house prices It is difficult to measure actual expectations in the market regarding the house price development. However, we can see a tendency of houses being sold above the appraised value. To measure market expectations, we can look at the development in total construction costs compared to house prices and new constructions. The level of new constructions and associated costs can provide indications of whether house prices will rise further. Figure 6.1 illustrates a strong growth in new constructions from 2009 until today. The level of commenced dwellings was in 2009 on the lowest level since the 1990s. Nevertheless, the activity level started to pick up again, and there was an increase of 60 % from 2009 to Homes for holiday purposes are not included in these figures 63
66 Figure 6.1: Amount of commenced dwellings in Norway In the following figure we have compared construction costs to house prices. Figure 6.2: Construction costs and house price index Norway (2000=100) If the growth in house prices are greater than the growth in construction costs, the market will expect further growth in house prices. As illustrated in figure 6.2, the gap between construction 64
67 costs and house prices has increased since Construction costs grew by 72 % from 2000 to 2015, while house prices grew by 140 %. The activity level in the construction industry changed after the financial crisis, due to uncertain future prospects and uncertainty regarding the interest rate. Further on, expectations of decreased house prices affected the construction industry, which resulted in a reduction in The fact that the construction activity was remarkably low in 2009 could have resulted in even greater pressure of the housing market activity. However, both expectations of higher house prices, and the actual increase in house prices, have been an incentive to more constructions. Based on the elements presented above, we believe the criterion to be fulfilled. House prices receive much attention in media and private conversations The media coverage regarding the housing market has increased significantly in recent years. Retrieve media collects statistics regarding topics published in the media. In the following figures we present media coverage of house prices and housing bubbles. Figure 6.3: Media that concerns house prices in Norway ( ) 65
68 Figure 6.4: Media that concerns housing bubbles in Norway ( ) As illustrated in the figures, the media coverage of housing bubbles and house prices has increased in recent years. There are various factors explaining the increased focus of the housing market. Firstly, the large increase in house prices in recent years has affected the media s attention. Secondly, the financial crisis has led to a greater focus on the economy in general. In addition, topics covered in the media also affect what people discuss in private. Various crises in other countries have increased the focus on factors driving house prices. To reveal whether the media attention is higher than other important topics, we have also looked at the media coverage of the oil price. During the couple of last year s there has been a lot of focus on the oil industry due to the historical low oil price. In 2014, there were articles that covered the term oil price, while covered the term house prices and 696 covered the term housing bubble. However, it is important to emphasize that the strong development in technology also has made it easier to provide access to databases, which has made it possible for the media to continue producing information about the housing market. Nevertheless, a lot of attention is aimed towards the Norwegian house market, and we thus believe this criterion to be fulfilled. 66
69 House prices increase more than private income House prices have increased more than disposable income, which indicates that houses are becoming relatively more expensive. Figure 6.5 illustrates that house prices have increased by 153 % since 2000, while disposable income has increased by 114 %. A significant increase in house prices compared to disposable income suggests that this criterion is fulfilled. Figure 6.5: House price- and disposable income index Norway (1980=100) Limited understanding of risk attached to the investment An important factor when deciding to enter the housing market is consumer expectations. Norwegian citizens have_over_the_past_years experienced_that_housing_is_a_safe_investment associated with low risk (BoNord, 2013). However, this is not necessarily correct. The Norwegian economist Harald Magnus Andreassen wrote an article in 2007, stating that the real value of a house does not rise in the long-term. It is the rental income that provides long-term returns. Today, many consumers lack an understanding regarding the interest rate. Expectations of a low interest rate have resulted in consumers issuing larger mortgage loans than they would otherwise, and actual low interest rates have made consumers able to actually issue these loans. Growing household debt in combination with low interest rates indicate that they are issuing higher loans 67
70 when the interest rate is low instead of issuing lower loans with higher monthly installments. If households are issuing large loans with a low interest rate, they might have problems when the interest rate rises to its normal level. Households may believe that today s low level of interest rates, in addition to a favorable tax system, is sustainable in the future. Furthermore, larger parts of households in Norway have mortgage loans with a floating rate. Hence, an increase in the interest rate will rapidly lead to higher interest payments (The Financial Supervisory Authority, 2015). If the housing value decreases, people are having more debts than what the housing value justifies. The development in debt levels provides information regarding households willingness to issue loans. The debt level, relative to disposable income, has increased significantly over the last 30 years, and is now at a record high level (The Central Bank of Norway, 2016). There are several reasons for this development. Among other, low interest rates and expectations of a long-term low interest rate are important factors (The Financial Supervisory Authority of Norway, 2015). Another underlying factor for this exponential growth might be due to the high growth in house prices. The debt growth has increased significantly in Norway the recent years. This might indicate lower concerns regarding interest rate and borrowing costs. According to Morten Balterzens report Financial trends 2015, Norwegian households mortgage debts are growing more than their income, which we will explain further in section Another indication is the amount of interestonly loans, which may indicate limited understanding of risk for several reasons. Firstly, households should repay as much as possible when the interest rate is low, as they have more money to spend on repayments. Subsequently, when people choose to postpone their repayments even though the interest rate is relatively low, it may indicate that they have issued excessively high mortgage loans. A research company named United Minds has on behalf of Intrum Justitia provided a European Consumer Paying Report in 2015, which revealed that 46 % of all Norwegians aged between 18 and 34 years are not able to pay unforeseen expenses equivalent to half a month s salary without having to borrow money. Further on, the report states that 31 % of the population sometimes feels they have trouble getting money to suffice. Additionally: 20 % sometimes borrow money to pay their bills 68

71 42 % have paid one or more bills after the last day of payment Based on the growth of debt levels, in addition to struggles to meet claims, this criterion seems to be fulfilled. Simplified opinion regarding mechanics of the housing market dominates This factor is closely related to the previous. It is important to understand the link between housing procurement and risk. Increased risk due to high debt might in the worst-case lead to forced sales of homes. The number of forced sales can be an indicator of significantly high housing investments, which may imply that people does not have a comprehensive understanding of risk. The figure below shows petitions for forced sales 17 in Norway from 2008 to Figure 6.6: Forced sales in Norway Figure 6.6 illustrates that the number of forced homes increased after the financial crisis. The large increase was unusual, and most likely due to household s personal finances (Oslo City Court, 2016). In 2014, there was a decline in forced sales, and a further decline occurred in However, compared to the period before 2011, the number of petitions and cases of forced sales are considerably larger. Oslo City Court argues that Norway will experience an increase in the number 17 Includes forced sales from real property, housing associations and other. 69
72 of forced sales due to the uncertainty in Norwegian- and international economy (Oslo City Court, 2016). Based on this, we believe this criterion to be fulfilled Conclusion of Case and Shiller s criteria in Norway The following table illustrates whether or not Case and Shiller s criteria are fulfilled. Criteria The pressure of being a home-owner Widespread comprehension that it is profitable to own housing Widespread expectation of increase in house prices House prices receive much attention in media and private conversations House prices increase more than private income Limited understanding of risk attached to the investment Simplified opinion regarding mechanics of the housing market dominates Table 6.1: Conclusion Case and Shiller Norway Fulfilled All the seven criteria are fulfilled. Accordingly, we can argue that the Norwegian housing market has indications of being in a bubble, based on the analysis of Case and Shiller s seven criteria for a housing bubble. However, it is important to emphasize that this analysis is largely based on subjective and discretionary assessments, in addition to limited data access and general problems of quantitative measuring. Thus, it will be necessary to see this analysis in context with other analyzes in order to form a more certain and adequate conclusion. 70
73 6.2 Denmark The pressure of being a homeowner As mentioned in 6.1, this criterion is difficult to measure. The proportion of owner-occupied housing is relatively low in Denmark, and in 2004, 61.2 % owned their home (Statistics Denmark, 2014). Significant increase in house prices from 2003 to 2006 led to a perception among young buyers that they should buy before the prices grew even more, and thus not risk to not afford housing at a later period (Rangvid, 2013). Hence, this criterion was fulfilled. Widespread comprehension that it is profitable to own housing An analysis conducted by Økonomi- og Erhvervsstyrelsen in 2005 revealed that people had clear expectations of further increase in house prices. Approximately 60 % believed in a further increase in house prices, and about 50 % believed the growth to last for at least five years (Rangvid, 2013). On this ground, it is reasonable to believe that house purchases were made as an investment due to expectations of a further increase. Hence, this criterion was fulfilled. Widespread expectations of increase in house prices As mentioned above, 60 % believed in a further increase in house prices according to the analysis conducted by Økonomi- og Erhvervsstyrelsen. Additionally, as discussed in section 6.1.1, new constructions and construction costs are important factors when measuring market expectations. Figure 6.7 illustrates an increase in new constructions of 119 % between 2000 and This indicates that there were high expectations of further increase in house prices. Moreover, the construction activity fell significantly between 2006 and 2009, by as much as 252 %. 71
74 Figure 6.7: Started dwellings in Denmark (Index, 2000=100) Figure 6.8: Construction costs- and house price index Denmark (2003=100) Figure 6.8 illustrates developments in construction cost compared to house prices. The gap between construction costs and house prices was at its largest in House prices increased by 110 % between 2000 and 2006, while construction costs grew by 18 % in the same period. If the growth in house prices are greater than the growth in construction costs, the market will expect higher house prices. This indicates that the large price increase could not be explained by increasing construction 72
75 costs. Hence, we believe there were widespread expectations of increase in house prices, and that the criterion was fulfilled. House prices receive much attention in the media and private conversations The development in house prices was a popular topic between 2003 and In the following figures we present media coverage of the housing market and house prices. Figure 6.9: Media attention that concerns the housing market in Denmark (1990,2001,2003,2006) Figure 6.10: Media attention that concerns house prices in Denmark (1990,2001,2003,2006) 73
76 Infomedia shows that the term housing market was mentioned in articles and/or TVrelations in 2006, compared to 199 in 1990, and 125 in The term house price was mentioned in articles and/or TV-relations in 2006, and housing bubble was mentioned 179 times. In comparison, the term soccer team was mentioned half as many times in 2006, despite the fact that Denmark is a football nation and the world cup was held that year. Hence, there was a significant increase in media attention regarding the house market in 2006, and we believe that this criterion was fulfilled. House prices increase more than private income Between 2000 and 2007 house prices increased by 110 %, while disposable income increased by 50 %. House prices and disposable income have grown by the same rate from 2012 until today. This indicates that house prices were overvalued from 2000 and 2007, and we believe that this criterion was fulfilled. Figure 6.11: House price- and disposable income index Denmark (2000=100) Limited understanding of risk attached to the investment As mentioned above, the market expected further increase in house prices in As a result, homebuyers had a tendency to view housing as a low risk investment. New types of loans were 74

77 introduced during the mid-2000s; loans with floating rate 18, and interest-only loans (Rangvid, 2013). Denmark experienced a low interest rate in 2004 and 2005, but it increased during the next years. Consequently, households debt increased significantly from 2005 to 2009, which indicates a limited understanding of risk attached to the investment. Hence, when the prices fell in 2007, the majority of households had a mortgage debt that was higher than the house value. This indicates that the market had a weak understanding of risk, and we believe that the criterion was fulfilled. Simplified opinion regarding mechanics of the housing market dominates As mentioned, the number of forced sales can be an indicator of too expensive housing investments. This indicates that people have simplified opinions regarding mechanics of the housing market. The figure below shows petitions for forced sales 19 in Denmark from 2000 to Figure 6.12: Forced sales in Denmark Loans with floating rate are a generic term for both adjustable-rate mortgages and other loans, where the interest rate varies in the duration of the loan. 19 Shows forced sales of total real property. 75
78 Figure 6.12 illustrates an increase in forced sales from 2007 to The Danish house market was in a housing bubble prior to the financial crisis, and it seems as the petitions for forced sales continued to increase when the bubble did burst. An increase in forced sales can be a result of lower house prices and people not being able to serve their loans. We believe this criterion to be fulfilled Conclusion of Case and Shiller s criteria in Denmark The following table illustrates whether or not Case and Shiller s criteria is fulfilled. Criteria The pressure of being a home-owner Widespread comprehension that it is profitable to own housing Widespread expectation of increase in house prices House prices receive much attention in media and private conversations House prices increase more than private income Limited understanding of risk attached to the investment Simplified opinion regarding mechanics of the housing market dominates Table 6.2: Conclusion Case and Shiller Denmark Fulfilled All the seven criteria are fulfilled, and the analysis of Case and Shiller s seven criteria for a housing bubble accordingly supports the fact that Denmark experienced a housing bubble prior to the financial crisis. Hence, we believe this model to be valid for the Norwegian house market as well. However, it is again important to emphasize that this analysis is largely based on subjective and discretionary assessments, in addition to limited data access and general problems of quantitative measuring. 76
79 6.3 Other factors To investigate the high growth in house prices in Norway during the last years, we have selected three factors that we consider as highly relevant for developments in house prices. Developments in debt level, the number of unsold homes and house financing contain important information and are good indicators. We will now discuss these factors further Developments in the debt level Credit growth The credit level in Norway is an important indicator to get a broader understanding of developments in the house- and credit market. Borio et. al. (1994) argue for a positive relationship between the development in house prices and credit. Statistics Norway has credit indicator statistics (C2 and C3) from the mid-1980s. C2 is an approximate measure of the size of the gross domestic debt of the public 20, whereas C3 gives an indication of the total debt of households, non-financial enterprises and municipalities. Both C2 and C3 are important indicators of the economic activity level. Figure 6.13: Development in household s foreign and domestic debt in Norway Households, non-financial enterprises and municipalities 77
80 Figure 6.13 illustrates a small deviation between C2 and C3, which means that only a small amount of household s debt stems from foreign sources. There has been a significant increase in credit growth and house prices over the last years. This coincides with Case and Shiller s criterion Limited understanding of risk attached to the investment, as households have a higher willingness to incur risks by issuing more loans. Rising debt and house prices can mutually influence each other (ECB, 2003). The interaction between house price- and credit growth has several underlying explanations; firstly, households aiming to buy a house have to borrow more to finance the housing procurement if house prices increase. Subsequently, when a household seek to issue loans, the banks are mainly focusing on two factors: household income and the collateral value of the particular property. The collateral values increase when house prices rise, and households may therefore be able to issue higher mortgage loans. In addition to these two channels, higher house prices will reduce the risk of mortgages the banks already have exposed, and it may encourage banks to faster expansion in terms of new mortgages. When lending increase, it results in households being able to bid a higher price of housing (Anundsen and Jansen, 2013). Figure 6.14: Development in total credit growth and house prices in Norway (1985=100) 78

81 By comparing figures for house price- and credit growth for Norway from 1985 and onwards, it is evident that these series follow a similar trend. However, as illustrated in figure 6.14, the variables have surpassed each other several times throughout the period. Credit growth has been higher than growth in house prices since 2008, despite the years 2012 and This indicates that households are borrowing more than what house prices have grown, which means that the ability to invest in housing is higher. This further result in increased housing demand. Conclusively, we can argue that the high growth in house prices can be supported by a high credit growth. Debt ratio in percent of disposable income The debt/disposable income ratio represents the debt in percent of disposable income. Figure 6.15: Development in debt/disposable income ratio in Norway Figure 6.15 illustrates that developments in the debt/disposable income ratio have increased since However, the ratio has been on a relatively stable level since As the figure illustrates, households have twice as high debt as disposable income. The sustained rise in the debt/disposable income ratio reflects the fact that house prices are raising. In addition, the growth in the debt ratio is affected by a high growth in the GDP, a low unemployment, growth in disposable income, lower 79
82 lending rates, positive future expectations among households and higher house prices. According to Statistics Norway (2016), households debt growth has remained unchanged so far this year, and the growth has been relatively stable the last year and a half. Nevertheless, the debt still has a higher growth rate than income, which means that the debt load is still growing. The Ministry of Finance (2013) argues that a high debt ratio in percent of disposable income leads to an unbalanced economy and increased risk of debt- and housing bubbles Number of unsold homes Another factor we find important regarding the housing market development is the number of unsold homes. A reduction of unsold homes might be an explanatory factor of increased house prices, as it probably is signs of continuous rise in house prices, because the housing demand is higher. Conversely, an increase in the number of unsold homes will push the prices down. In both cases there will be an unbalanced market that drives prices in opposite directions. Figure 6.16: Unsold homes in Norway Real Estate Norway reports statistics of the number of unsold homes. We only have access to numbers from 2011 to 2016, and as the figure illustrates it has overall been relatively stable. According to Dagbladet (2008), there were a number of unsold homes in This 80
83 indicates a high market demand if we compare it with today s level of unsold homes. Hence, many houses are purchased as soon as they are put up for sale Financing House procurements are mainly financed by loans. Naturally, the bank s lending policy highly influence household s mortgage financing. The Financial Supervisory Authority is setting a capital requirement, and in 2011, they introduced a capital requirement of 15 %. This was an increase from the previous requirement of 10 %. It would be rationale to assume that this increase would entail lower demand for mortgage loans, as borrowers are restricted to issue limited loans relative to the previous requirement of 10 %. However, as discussed in 6.2.1, the debt level has continuously increased. Despite the capital requirement of 15 %, it is still possible to issue start-up loans through the Norwegian State Housing Bank (NSHB). A start-up loan is an opportunity to enter the house market for households that are not able to fulfil the capital requirement. The department director in NSHB, Are Sauren, stated that they saw a definite increase in the number of people seeking start-up loans after According to the discussion in section 6.1, an increase in debt will lead to higher risk, and this especially applies to households issuing start-up loans as their equity. As stated in the report Strategy for the housing market (2015), the Financial Supervisory Authority has implemented additional regulations in order to prevent an even higher debt level: 1 out of 10 loans that can be issued without 15 % equity Minimum requirement of 2.5 % installment payments on mortgage loans with less than 30 % equity 81
84 7 EMPIRICAL ANALYSES This chapter will further seek to answer the problem statement of the thesis, by providing an empirical analysis of both the Norwegian housing market today and the Danish housing market prior to the financial crisis. Two different house price models will be introduced and applied as tools to identify if the markets can (could) be characterized with bubble tendencies. The respective models are the Hodrick-Prescott filter and Price-to-Rent. As mentioned in section 1.3, Denmark will not be included in the P/R analysis due to limited data access and rental market regulations. As these models examine the housing market based on different underlying factors, we believe that they are contributing to a solid picture of the conditions in the housing markets. 7.1 Hodrick-Prescott filter Theoretical framework To analyze deviations from trend we have used the Hodrick-Prescott filter 21 (HP-filter), which was developed by Robert J. Hodrick and Edward C. Prescott in The aim of this tool is to reveal how developments in actual levels are, relative to developments in trend. Therefore, such an analysis can be helpful to answer whether the development is at a higher level than what the fundamental value implies. The model estimates the long-term trend for historical time series, and can thus be very useful to examine trends, fluctuations and deviations. The model is presented in the following equation: Y! = C! + τ! Y! = Time series C! = Cycle component τ! = Trend component The trend component can be identified by minimizing the following equation: 21 The filter is installed as an ad-inn to Microsoft Excel 82
85 !!!!!!! (y! τ! )!! + λ τ!!! τ! τ! τ!!!!!! t = 1,, T The first part of the equation is the squared sum of the actual value minus the trend. Since this part is squared, negative and positive deviations are equally emphasized. This is because both positive and negative bubbles might occur. The second part of the equation measures changes in trend from one period to another, and is weighted with the smoothing parameter lambda λ. If lambda equals 0, the trend component will equal the original time series. The closer lambda approaches, we will see that the trend is gradually linear. Although the HP-filter is considered a worthy tool when measuring deviations from trend, there are some weaknesses that are worth noticing: The choice of lambda The lambda value is discretionary. Hence, the credibility of the results can be discussed due to infinite possible values of lambda, which makes it possible to manipulate the analysis. Most applications for this model have been quarterly data. However, we are using yearly data in our analysis. Hodrick and Prescott suggest a lambda value of 1600 for quarterly data and 100 for yearly data. Backus and Kehoe (1992) are using a lambda value of 100 for yearly data, while Correia, Neves and Rebelo (1992) and Cooley and Ohanian (1991) suggest a lambda value of 400. Differences in the lambda value illustrate a weakness of this method, as the result will be largely affected by the lambda value. Endpoint problems The trend in the HP-filter is determined by the observed numbers in t!! and t!!. As the HPfilter is duplex, it implies that both the beginning and the end of the calculations are missing data to complete the filter, namely endpoint problems. The filter will change from being a duplex to become a unilateral filter (Benedictow and Johansen, 2005). Since we do not have data after 2016, the trend in the most recent years will highly depend on actual house price 83
86 growth instead of future house price growth. This is a highly critical factor when analyzing the Norwegian market. We are mainly interested in indications pointing towards a housing bubble today. Hence, recent observations are of a big relevance. Problems regarding long cycles Longer cycles might be captured as a trend. This is because the HP-filter will adjust potential prices up and down during the cyclical fluctuations, and thus draw a wrong conclusion (Grytten, 2011). This is particularly relevant in our study where house prices have grown significantly over a long period, from the early 1990s until today. Accordingly, the growth might be regarded as a trend change and not a long-term expansion. To counteract this problem, we will apply two different lambda values. A higher lambda value will provide a smoother trend line Data Material This analysis is done in Excel and is based on yearly real house prices indexes. See appendix 4 and 5 for all calculations. Lambda values We will use 100 as a basis lambda value. However, there has been a substantial growth in the Norwegian house market the latest years. Additionally, there was high growth in the Danish house market prior to the financial crisis. Endpoint problems might occur if we only use a low lambda value, as the trend will follow the extreme growth. Hence, the choice of lambda value is a matter of discussion. To get a greater emphasize on the past and to get a smoother trend, a higher lambda value is implemented as well. Statistics Norway is using a lambda value of when they apply a HP-filter for the GDP. This is 25 times higher than the value Hodrick and Prescott have used as a basis value. Therefore, we are using an additional lambda value of Hodrick and Prescott used lambda 100 for yearly data and 1600 for quarterly data (1 600*25 = ) 84
87 House prices in Norway We will use the period from 1980 to 2015 as a basis period, but we will also look at the historical house price data for Norway as far back as Nominal house prices are taken from the Central Bank of Norway and are measured by average price per square meter. To calculate real house prices, we have adjusted nominal house prices for inflation, based on CPI figures from the Central Bank of Norway. House prices in Denmark We will use the period from 1992 to 2015 when analyzing deviations from trend. As mentioned in section 3.1, we will not go further back in time due to limited data access. Nominal house prices between 1992 and 2015 are taken from Statistics Denmark and are measured by average price per square meter Empirical testing Norway Real house price index with HP-filter Figure 7.1 illustrates the trend line with a lambda value of 100 and Figure 7.1: Time series from for real house price with HP-filter, Norway (1980=100). Shows lambda value of 100 and
88 As illustrated, there are only short periods where the house prices are overpriced, with a lambda value equal to 100. Hence, the growth in house prices in recent years do subsequently not show signs of a housing bubble. In addition, house prices were underpriced right after the financial crisis. The real house price index is moving in line with the trend component from 2008, which do not provide any indications of a housing bubble today. As illustrated, there are greater deviations from the index and trend with a lambda value of than it was with a lambda value of 100. The figure illustrates that Norwegian house prices were underpriced in the period between 1990 and This may be due to the economic recession that happened after the banking crisis in the 1980s. This underlines the HP-filter to be suitable with data where long-term cycles are perceived as a trend, as it distinguishes the time series in trends and cycles. To further minimize the problems regarding the high growth from the early 1990s, we will now expand the horizon of the time series. This may provide a more correct and valid trend line due to a greater amount of data being included. Real house price index from with HP-filter By extending the analysis back to 1819, we are able to observe earlier crises that have influenced the house price development to a large extent. Additionally, we are reducing the problem regarding long cycles, as the growth since the 1990s becomes a smaller percentage of the total data material in a time series with a longer horizon. We will see whether earlier crises will be evident with apparent deviations between the house price index and the trend. 86
89 Figure 7.2: Time series from for real house price index with HP-filter, Norway (1980=100). Shows lambda value of 100 and As illustrated in figure 7.2, a lambda value of 100 results in small deviations between the index and trend line. There are only a few periods where house prices show signs of being overpriced. The HP-filter still considers the high price growth as a trend rather than an abnormal high growth, and struggles to capture historical bubbles. By using a longer time series, an increase in the lambda value will provide a smoother trend line. On the contrary, a lambda value of clearly illustrates historical bubbles, such as Kristianiakrakket, the postwar period and the banking crisis. 87
90 Figure 7.3: Time series from for real house price index with HP-filter, Norway (1980=100). Shows lambda value of According to the HP-filter with a lambda value equal to 2 500, the Norwegian housing market does not have indications of a housing bubble today. From 2009 to 2013, the trend line was below the house price index, which means that the housing market was overpriced. However, from 2014, the trend line seems to be fairly equal to the house price index. Nevertheless, endpoint problems occur. We will further illustrate the deviations graphically in order to get a closer look at deviations from trend, as well as differences in the short- and long-term series. Gaps from the trend line The figures below show gaps from the house price index and the trend line, with a lambda equal to
91 Figure 7.4: Gap from trend in Norway. Shows lambda value of Figure 7.5: Gap from trend in Norway. Shows lambda value of Both figures (7.4 and 7.5) illustrate the housing bubble in the late 1980s. This resulted in negative deviations, which lasted until Despite the financial crisis, the model shows positive deviations from 2004 until From 2014 until today, the deviation is approximately zero, and does not provide any indications of a housing bubble in the Norwegian house market. 89
92 Conclusion The HP-filter with a lambda value of 100 does not provide any indications of a housing bubble, nor with a lambda value of However, this result is not highly reliable due to endpoint problems, and since a discretionary aspect is highly involved. This method alone does not provide a conclusive and reliable answer. It will thus be necessary with further analyzes to answer our problem statement. In section 7.2 we will conduct a supplementary P/R analysis, but firstly we will investigate whether the HP-filter proves the housing bubble in Denmark prior to the financial crisis Denmark Real house price index with HP-filter Figure 7.6 illustrates that the house price index is far above the trend line with a lambda value equal to 100 between 2004 and Figure 7.6: Time series from for real house price index with HP-filter, Denmark (1992=100). Shows lambda value of 100. As illustrated, the figure illustrates that the housing market was overpriced, which corresponds with the fact that there was a bubble in the Danish housing market prior to the financial crisis. However, we have done calculations for a lambda value at as well. 90
93 Figure 7.7: Time series from for real house price index with HP-filter, Denmark (1992=100). Shows lambda value of 100 and Figure 7.7 illustrates the house price index with trends for lambda values of 100 and An implementation of a higher value of lambda results in a larger deviation between the price index and the trend line. Both lambda values prove the housing bubble prior to the financial crisis. It is nevertheless important to bear in mind that the HP-filter is more reliable for the Danish housing market as we also have data for the years after the relevant period we are analyzing. To get a clearer look at the deviations from trend, we will illustrate the gap graphically. Gap from trend line The figure below shows gaps from the house price index and the trend line, with a lambda equal to
94 Figure 7.8: Gap from trend in Denmark. Shows lambda value equal to Figure 7.8 illustrates a bubble, as well as the boom in This proves that the Danish housing market was experiencing a housing bubble in this period. Conclusion The HP-filter for the Danish housing market showed that they experienced a housing bubble prior to the financial crisis. Hence, we believe this model to be valid for the Norwegian house market as well. 7.2 Price/Rent Theoretical framework A housing procurement is regarded as an investment irrespective of the underlying reason for the purchase, i.e. whether it is to live in the home, or to rent it out. An option for a privately owned home is to use it as a rental object. The same applies the other way around, as an option to buy a home would be to rent one. Hence, developments in the relationship between prices for owneroccupied housing and rental housing will play an important role, namely the Price-to-Rent ratio (P/R ratio). This ratio is used to consider whether house prices are overvalued relative to a longterm value, and whether there are bubble tendencies. 92
95 The foundation of the P/R model is based on the Price-Earnings model (P/E-model), which was first introduced by Gordon and Shapiro (1956) and further developed by Miller and Modigliani (1961). The model determines the stock value of a given company, and is a well-known and commonly used tool by equity analysts to assess the current stock price in relation to the future expected cash flow. A possible bubble formation or indications of bubble tendencies in the stock market can be measured by looking for whether the real P/E ratio is greater than the fundamental P/E ratio. The real P/E ratio is calculated by dividing the share s market price (P) on earnings per share (E), and indicates the willingness to pay for future expected revenue. The fundamental P/E ratio differs from the real P/E ratio as it is based on a number of factors which affect a company s future earnings 23. Thus, the stock price should reflect the present value of future payments to the stock owner. It is difficult to provide an accurate indication of future earnings, and any over- or underestimation of the stock is consequently found by comparing fundamental value to real value. Some people would imply the P/E method to best fit financial investments, and that the approach is unsuitable for goods such as housing, which is defined as a consumer good. As there always is an option of using a house as a rental object, which entails rental income, it is still possible to use the P/E method to analyze housing prices. By using the P/E method in the housing market, the coefficients will accordingly be defined as P/R, as rental income in this case will represent earnings. Poterba (1984) has developed a model to estimate house prices by looking at the relationship of costs associated with owning and renting a home, the so-called Price/Rent model. The P/R model assumes the house price to be the sum of discounted future expected profit streams related to the house - i.e. the value of private housing consumption (user cost) or rental cost. Alternatively, rental costs of similar housing can be applied (The Central Bank of Norway, 2003). Leamer (2002) is also one of several that has adopted P/R method to analyze the housing market. The basis for the analysis is the assumption that the purchasing price should reflect potential future rental income the property can generate. Krainer (2003) considers the P/R method to make sense 23 Such as the company s growth, investment opportunities, percentage of retained earnings, capital expenditures and the general economic growth rate 93
96 when evaluating trends in housing prices, and argues the approach to be more accurate and easier to implement relative to other approaches. He defines housing bubbles as the existence of a situation where the market price and fundamental value differs to a significant degree. According to Jorgensen (1963), the user cost of home-ownership is the sum of the opportunity cost of owning the asset (after tax), property tax, depreciations and cost of repairs, minus expected capital gains from owning. Simplistically, the user cost is defined as the sum of interest costs 24 and wear and tear on the property, minus the expected appreciation of investment value (Norges Bank, 2006). The user cost is expressed as: (7.1) User cost of home-ownership= P(i! + τ + m π) Where; P = House price index i! = Nominal interest rate after tax τ = Property tax m = Depreciation and maintenance costs of housing π = Expected housing gain (or loss) Homeowners will make an assessment of the choice between owning and renting. Under the assumption that homeowners are rational, the final choice will always be the most profitable option. In the short-term, homeowners will therefore choose to rent if the rental cost is lower than costs associated by owning (user costs), and the opposite if house prices are low. A homeowner will make a cost-benefit analysis, where the marginal benefit of owning equals expected potential rental income one could achieve by renting out the house. The marginal cost equals the user cost of the house (Poterba, 1984). Thus, a long-term adaption in the housing market indicates the cost of owner-occupied housing to equal the rental cost for similar housing. Hence, market equilibrium occurs when the user cost of owning equals the rental cost. This relationship can be illustrated as the following equation: 24 Including both interest expenses and interest income that is relinquished by investing in the property 94
97 (7.2) R = P(i! + τ + m π) Where R represents the rental cost for similar housing. If the rental cost is lower than the user cost of owner-occupied housing, it will be more profitable to rent than to own. There will emerge a current disequilibrium in the housing market, as the demand will turn towards rental housing. In the longer term, equilibrium will again be achieved - either by rental prices being pushed upwards, housing prices being pushed downwards, or by a combination. By rearranging equation (7.2), it may be written as follows: (7.3)! =!!!!!!!!!! Equation (7.3) shows the long-term fundamental relationship between house- and rental prices. This is referred to as the P/R value for the housing market. The right side of the equation shows the longterm fundamental relationship between house- and rental prices, which emerges as a result of the nominal borrowing rate after tax, expected inflation, ongoing costs of owner-occupied housing and expected capital gains on the house. It is reasonable to assume that fluctuations in the variables occur over time, in line with the overall economic activity level and conjunctures. Hence, the fundamental value will be affected by underlying macroeconomic conditions prevailing in the market. For example, lower expected future house prices (providing less or no capital gain) will imply a lower P/R value, as more households will prefer to rent rather than to own. On the other hand, lower borrowing rates (providing affordable debt), lower tax or lower maintenance costs will imply a higher P/R value, as it will be relatively more advantageous to own. Accordingly, there is no reason to expect the P/R ratio to remain constant in a long-term perspective. If the P/R coefficients are rising, we can assume a greater increase in future house prices relative to rental prices. In contradiction, declining P/R coefficients may be indicative of expectations of lower future house prices. Rational agents would in this case choose rental housing rather than owner-occupied housing, which in turn will lead to more homeowners converting to the rental market. However, an 95
98 increased fundamental P/R value does not necessarily mean that housing prices grow unacceptably much, or indicate bubble tendencies in the housing market. In order to state the latter clearly, an assessment and opinion should be taken on the basis of a comparison of the fundamental value and the real rate applicable to the market. The real P/R ratio is calculated by dividing house prices on average rental prices an approach that has been common practice to display aggregated data (The Central Bank of Norway, 2003). The P/R ratio will then be seen in light of historical levels to assess whether the current value is relatively high or in line with the average development 25. If house prices have increased disproportionately in relation to rental prices in a shorter term, it could be signaling an overheated housing market. In other words; imminent risks of a house price bubble. Extremely high and rising P/R values can in many cases be an indication of disequilibrium between house- and rental prices. Given that the fundamental P/R ratio is unchanged, housing demand will solely increase due to irrational future price expectations, as people will believe future price levels to be considerably higher than what fundamentals would indicate. In many cases such an imbalance between the owning- and the rental market could trigger a fierce price spiral and thus attract people looking at the house as a purely speculative object. In the worst case, an imbalance may result in a bubble formation in the housing market. A potential burst of a bubble may be impacted by several different important factors. However, macroeconomic conditions will be a crucial factor 26 in most cases (Uventet oljeprisfall, 1986). Prior to the P/R analyze of the housing market, we would like to clarify some assumptions and simplifications that underlie this approach. These are largely based on the declaration in Bertelsen and Bremnes (2007), of which the most important assumptions are: 25 It should be added that actors (particularly media) often forget that developments in the P/R value may be due to changes in fundamental factors, and thus cry wolf-wolf without a particularly eligible basis. In many cases, the media may create fear and contribute to trigger substantial price fluctuations in the housing market 26 Liberalization of credit markets and regulations in the housing market are just some factors that have played crucial roles in the Norwegian through time 96
99 The rental equivalence principle; It is believed that all types of homes are homogeneous, and that there exists a corresponding rental price of these properties: This assumption implies that house- or rental prices are not impacted by geographical location. This is an unrealistic assumption because all homes are distinctive, and homogeneity is virtually absent in reality. In the real world, every house is unique regarding both location and property structure. However, a simplification of reality is necessary to implement a P/R analysis with aggregate figures. Owner occupied- and rental housing are perfect substitutes: This premise assumes that a price reduction in one will lead to reduced demand for the other, and vice versa. This obviously breaks with reality as well, when it is common knowledge that people have strong preferences to stay in their own home rather than rented homes, and therefore do not compete in the same market for housing. With today's price trends, macroeconomic conditions and fiscal policies, there are strong incentives to own a home instead of renting one. Zero transaction costs: The theoretical framework is based on the assumption of the absence of transaction costs on purchase- and sale of housing. Again, the assumption violates with reality. An undoubtedly violation of this assumption is among other the document fee in Norway (the government s share) of 2.5 % of the total sales price. Results from our P/R analyses will be presented in section 7.2.3, but first we will present sources of the data material applied in the calculations Data Material To look at the long-term development in the relationship between house- and rental prices, we have used rates in the period from 1871 until today. 97
100 House prices (P) House prices are based on data material from The Central Bank of Norway for the period from 1870 until The figures show nominal average price per square meter for existing homes. The figures apply to all types of existing homes, such as detached houses, semi-detached houses and flats. For the years 2015 and 2016 we have used numbers from The Norwegian Housing Price Statistics 27. Rental prices (R) There are no statistical databases providing a direct measure for historical rental prices. However, there exist some different available data materials for the recent year s rental prices. These figures vary in types of rental housing included, as well as costs and size of the geographical range taken into account. Statistics Norway has since the second half of the 1990s conducted a periodically survey of living conditions, namely the Survey on Living Conditions (SLC) 28, with the purpose to prepare official statistics on housing conditions, including paid rent for all types of homes. The Tenancy Act of 1999 regulates rental prices in Norway, where a number of provisions regulate rental contractual conditions. Among other, according to 4-2, the parties are under no circumstances able to raise the rents more than the increase in the overall price level given by the consumer price index. The average annual rent per square meter provided by the SLC in 2015 was estimated to be NOK To calculate the rental price per square meter back to 1871, we are using the consumer price index (CPI). Since the Tenancy Act stipulates that rental price changes cannot be adjusted more than the CPI, we are able to estimate rental prices back in time. However, we are aware that the CPI does not necessarily represent developments in the actual rental price level. A landlord can choose whatever rental price he or she wants, but is not eligible to simply 27 The Norwegian Housing Price Statistics is a collaboration between Real Estate Norway, Eiendomsverdi AS and Finn.no. The statistics do not comprise a total count of all house transactions in Norway, but are mediated realtors and listings through Finn.no, i.e. nearly 70 % of all sales of existing homes traded in Norway within a year. 28 The survey is an interview survey among a representative sample of 11,760 people aged 16 years and over of the Norwegian population. 98
101 increase the rent in the long-term. The CPI figures are obtained from The Central Bank of Norway and Statistics Norway. In addition, Statistics Norway has since 2005 provided a yearly rental market survey to provide statistics on rental prices for different types of housing in different parts of the country. This is to ensure a sound knowledge of the rental market. The Rental Market Survey (RMS) of 2015 presented the annual average rental price per square meter to equal NOK However, we have chosen not to interpret results from this survey, because the level of investigation of RMS is to say something about the rental level and composition of the rental market at a given time, and the rent levels are presented by certain market segments. According to Statistics Norway, the RMS is not designed to provide estimates of rent changes over time (Statistics Norway, 2015a). Nevertheless, as both surveys would have been based on the same CPI figures, P/R values from both the SLC and RMS would naturally have shown equal development and fluctuations over time. Fundamental P/R ratios Girouard (2006) has been very helpful in the presentation of the fundamental P/R analysis from 1990 to 2004, and provided guidance of how the ratios should be calculated in the best possible way. This is important so that the numbers we calculate in the period from 2005 to 2015 can be compared with the previous years calculated by OECD publishing (Girouard, 2006). These numbers are taken from the article Recent house price development: The role of fundamentals from The analysis will apply the following input variables from : Nominal borrowing rate: The nominal borrowing rate is taken from Statistics Norway 29 and is the bank's lending rates, measured as an annual average. Tax rate: It is assumed that the tax rate was fixed at 28 % until In 2014 it was reduced to 27 % (The Financial Supervisory Authority, 2016) After-tax nominal mortgage rate: nominal borrowing rate (nominal borrowing rate tax rate). This is adjusted to include the offsetting benefit given by the tax deduction, which applies in Norway, and 29 Table: Yearly Interest Rates on Loans and Deposits, Banks (Per Cent) 99
102 equals the cost of foregone interest that a homeowner may have earned on alternative investments. Property tax rate: Property tax is an optional tax form in Norway, which only some municipals apply, and the tax rate varies. However, OECD assumes the property tax rate of owner-occupied houses to be fixed at 0.7 % in their calculations (Girouard, 2006). Expected capital gains: Expected capital gains (or loss) on the house is calculated by the OECD methodology as a moving average of the CPI over the previous five years (Girouard, 2006). Depreciations: OECD assumes depreciations to be fixed at 4 % (Girouard, 2006) Empirical testing This section will first provide an analysis of developments in real P/R rates. Subsequently, we will calculate the fundamental P/R rates, and present a comparison between real and fundamental values. Real P/R ratios The empirical analysis is based on estimates of the real P/R ratio of the calculated figures. See appendix 6 for all calculations and the nominal developments in computed rental price per square meter for the period
103 Figure 7.9: P/R rates in Norway Figure 7.9 illustrates the development from 1871 to The analysis shows an overall rising trend. However, fluctuations are to be seen during the whole period, especially during the economic crises and previous housing bubbles. We will now go deeper into the development in the relationship between house- and rental prices in the period from 1871 to However, since the aim of this thesis is to investigate whether there are bubble tendencies in the Norwegian housing market today, we will focus on the latest decades. The formation of the Kristianiakrakket, which later burst in 1899, as well as disturbances associated with The Great War ( ), is clearly illustrated in figure 7.9. The period from 1930 to 1980 shows a relatively flat trend, despite some short-term fluctuations in the coefficients. In order to study the latest period more accurately, we have chosen to display the P/R development from 1980 to 2016 with a log linear trend line: 101
104 Figure 7.10: P/R with and exponential trend line in Norway Figure 7.10 illustrates a relatively steady increase in the P/R ratios since 1980, with exceptions from the crash in 1987 and the fall in house prices during the financial crisis in As illustrated, the formation of a new housing bubble from the mid-1980s is evident. The house prices reached a peak in the late 1980s, followed by a sharp decrease (burst) due to the housing market crash with significant fall in prices. By using the exponential trend line, we can see that the real P/R ratios were much higher than the trend ahead of the housing market crash, and lower than the trend during the crash. The 1980s were characterized by major economic upheavals. In addition, people had high optimistic expectations for the future as a result of the credit market liberalization, increased wages and low real interest rates. This triggered both consumption and demand in the country, and household s debt ratio as well as house prices grew, as shown in figure xx. This took an abrupt end in The increase in housing prices turned out not having root in fundamental factors, and a sudden drop in oil prices, economic setbacks and subsequent rising unemployment, caused a recession in the national economy. Economic disturbances spread quickly through to the housing market, and the bubble burst was fact. Both real and nominal house prices were facing a period with negative growth, which lasted nearly six years. 102
105 In 1992, nominal house prices bottomed out at a P/R ratio of Since rental housing had become relatively more expensive compared to owner-occupied housing as a result of the decline in house prices, the demand for owner-occupied housing gradually began to pick up again. As a result of a new economic upturn combined with optimistic future expectations among the general public, the demand for owner-occupied housing increased. Consequently, housing prices grew rapidly in the 1990s. As illustrated in the figure, the relationship between house- and rental prices increased steadily. The rise in house prices began to level out in the beginning of the new millennium. Calculations of the P/R ratios show a growth from 2002 to 2003 of only 0.55 %. This was probably a consequence of a technology bubble that burst around the millennium, combined with fear of terrorism following the September 11 attacks in 2001, and thus less optimistic expectations. However, from the second half of 2003, the house price growth really speeded up, with relatively high P/R values compared to the levels in the 1980s. We have chosen to illustrate some selected P/R values in the table below, with both individual values, and the average P/R rate for the period as a whole: Avg. price per m House price Rental price Real P/R ratio Table 7.1: Real P/R ratios in selected years in Norway As illustrated in table 7.1 and in figure 7.10, there has been a tremendous development in P/R rates since Despite of a slight fall around the 2000s and the financial crisis in 2008, the values have been rising sharply. Table 7.1 clearly shows that today s P/R value is at a relatively high level compared with the average level for the entire period between 1980 and In addition, figure 7.10 shows large positive deviations from the trend prior to the financial crisis, as well as rising deviations until the present. However, with an explanatory power of only 76 % of the data, the trend line must be used a bit careful. It is however clear that the P/R values are, and have 103
106 been, on a much higher level than previous periods. Additionally, we find it interesting that the P/R value today is at 31.61, which is a higher level than what it was during the top of the previous housing bubble in 1987, when it was at its highest. The figure also illustrates more than a threefold increase in P/R values in the period between 1993 and This indicates that it was more than three times as expensive to buy a house relative to rent a house today as in The strong growth in P/R coefficients in the past 20 years may indicate existence of a bubble in the housing market, which is amplified if one assumes that the current values are of a much higher rate than what they were in the late 1980s during the course of the banking crisis. High P/R values in the housing market can, as previously mentioned, partly be justified, as homeownership is heavily tax-favored. However, there have not been any major changes in the taxation rules the last 20 years. Thus, changes in taxation rules could not be said to be a strong argument when explaining the sharp rise in the P/R ratios. Nevertheless, as mentioned in section 6.1 of Case and Shiller s seven criteria regarding the existence of housing bubbles, expectations of a continuing rise in housing prices appears to be present. However, high expectations of a continuing increase in housing price will not in itself be enough to explain or defend the high P/R values. Nor is there any quantitative size of the P/R ratio that states whether house prices are overrated, but the ratios may provide indications of house prices future development. To provide a deeper analysis of developments in house prices by using P/R values, we have to calculate what the real P/R ratio should have been for the market to be in equilibrium. Hence, it is desirable to compare the real P/R ratios with the fundamental P/R ratios. As mentioned above, a high positive difference over time may provide an indication of a possible bubble formation. Fundamental P/R ratios To calculate the fundamental P/R ratios, we have used the right side of equation (7.3). This gives us the following table and calculations of fundamental P/R: 104
107 Year Nominal 3.92% 4.26% 5.66% 7.29% 4.91% 4.52% 4.75% 4.84% 4.75% 4.61% 3.93% borrowing rate Tax rate 28% 28% 28% 28% 28% 28% 28% 28% 28% 27% 27% = After-tax 3% 3% 4% 5% 4% 3% 3% 3% 3% 3% 3% nominal mortgage interest rate Property tax 0.70% 0.70% 0.70% 0.70% 0.70% 0.70% 0.70% 0.70% 0.70% 0.70% 0.70% Expected capital 1.61% 1.50% 1.77% 2.10% 2.26% 2.08% 2.06% 1.74% 1.72% 1.67% 1.77% gains (loss) Depreciations 4% 4% 4% 4% 4% 4% 4% 4% 4% 4% 4% Fundamental P/R ratios Real P/R ratios Table 7.2: Calculations of fundamental P/R ratios in Norway Actual versus fundamental P/R We can now study the development of real- versus fundamental P/R values. This is done for the period from 1990 to We do not go further back in time, as the last decades are most expedient. In addition, OECD did not go further back than 1990 in their report (Girouard, 2006). The trend can be seen in the figure below: Figure 7.11: Real- and fundamental P/R rations in Norway 105
108 Figure 7.11 illustrates higher real P/R ratios than fundamental ratios since A possible explanation for lower fundamental ratios may be lower nominal borrowing rates, while expected capital gains are higher, at least until These two factors may have equalized each other. Lower nominal interest rates will also result in increased house prices, due to higher housing demand, according to section The gap between real- and fundamental P/R ratios was at its largest in At this time, the real P/R ratio was equal to 25.89, compared to the fundamental P/R ratio of This may be due to the strong growth in house prices between 2003 and 2007, while the nominal borrowing rate increased within the same period. Higher interest rates reduced the fundamental P/R ratios, whereas higher house prices increased the real ratios. In the period between 2008 and 2009, these two elements moved towards each other. Lower house prices may have resulted in lower real P/R ratios, while reduced interest rates have increased the fundamental ratios. The fundamental ratios have remained relatively stable with a slight decrease after 2009, while the real P/R ratios have continued to increase. This indicates a bubble accumulation and is a consequence of low interest rates the past seven years in parallel with rising house prices. Conclusion P/R analysis We have investigated whether Norway has tendencies of being in a housing bubble or not, by looking at deviations between real and fundamental values. Our findings show a high growth in the real P/R ratios since the early 1990s. This growth, which has resulted in a higher real P/R ratio in 2015 than during the previous housing bubble, provides indications of a housing market being in disequilibrium. Additionally, we found the real P/R ratios to be higher than the fundamental ratios since Despite the financial crisis, the gap between the real- and the fundamental P/R ratios has increased. The noticeably higher real ratios compared to fundamental ratios indicates an overvaluation of Norwegian house prices. Conclusively, according the P/R model, it is reasonable to believe that Norway has indications of being in a housing bubble. An obvious weakness of the P/R model is that it does not fully differentiate between pure appreciation in house prices and price changes due to depreciation or improvement of housing 106
109 (renovation). This is a challenge in Norway, as no other nation in the world spends more money on house upgrading. Numbers from Prognoscentret shows that the Norwegian population refurbished for more than NOK 70 billion in 2015, which is the highest amount ever recorded in the country 30. It is important to keep in mind that rental prices in Norway are partly regulated by law. This has probably impacted the development of the relationship between house- and rental prices, and likely been contributing to the indicator being at a high level. Historically, the average P/R ratio has been , but is today as high as Moreover, incentives for owner-occupied housing are greater than rental housing, making the rental market very small 32. Nevertheless, we believe the analysis to provide valuable feedback of the current situation. Based on historical developments in the P/R ratio and house prices, the simplified analysis may in several cases be helpful to identify possible bubble tendencies. 7.3 Conclusion Empirical Analysis In this chapter we have investigated whether Norwegian house prices are overvalued. Firstly, we investigated deviations from trend. The answers from the HP-filter were evident, and did not show any tendencies of a housing bubble in the Norwegian house market today. However, an essential factor will be the choice of the lambda value in the implementation of the HP analysis. This approach opens for a debate of whether the adaption of the lambda value simplifies the analysis. Nevertheless, the HP analysis for Denmark showed an undoubtable sign of a housing bubble with every applied lambda value. Taking this into consideration, the model should be valid for the Norwegian house market as well. However, the analysis for Denmark does not entail endpoint problems as the period of interest is 10 years back in time. Hence, we have data past the housing bubble period, which minimizes the endpoint problem. We consequently get a more valid conclusion for Denmark For the period between 1871 and According to Jan Hoegh in Econ Pöyry, a comparison of house- and rental prices in Norway should be done with extreme caution due to the real size of the rental market 107
110 On the contrary, due to noticeably higher real P/R ratios compared to fundamental P/R ratios, the P/R analysis provided indications of a housing bubble in the Norwegian market. We find these divergent results interesting and will in the following final conclusion investigate the results in conjunction with the comparative fundamental analysis and the analysis of Case and Shiller s seven criteria for a housing bubble. 108
111 8 FINAL CONCLUSION This thesis started with the problem statement: Are there indications pointing towards a housing bubble in the Norwegian housing market?. A housing bubble exists if the current house price level cannot be defended by fundamental factors. It is difficult to prove a housing bubble before it eventually burst. However, using economic models, graphs and analyses in light of historical developments, we have managed to derive at a conclusion. We will first summarize all elements the thesis has undergone, and thereafter present our final conclusion. Our thesis started by introducing characteristics of a housing bubble, in addition to the theoretical aspects of price dynamics in the housing market. This was in order to provide the reader with a solid knowledge regarding the underlying mechanics in the housing market. Further, we provided an overview of the historical developments in the housing market in both Norway and Denmark. This was to get an overview of previous crises and developments in the respective housing markets. Hereafter, we went into detail on key fundamental variables with the purpose to investigate whether developments in house prices can be explained by fundamental factors or if the growth seems to be abnormal. The analysis was done in light of Jacobsen and Naug s article What drives house prices?. The comparative fundamental analysis was followed by an analysis of Case and Shiller s seven criteria for a housing bubble. Our last contribution to provide an adequate conclusion was an empirical analysis consisting of the HP-filter and the P/R method. Can the high growth in house prices in Norway be seen as abnormal, or can it be explained by underlying fundamental factors? The following factors suggest the high growth in house prices to be abnormal: Increase in the unemployment rate Increase in new constructions High pressure of being a home-owner Widespread comprehensions that it is profitable to own housing Widespread expectations of increase in house prices House prices receive much attention in the media and private conversations 109
112 House prices increase more than private income Limited understanding of risk attached to the investment Simplified opinions regarding mechanics of the housing market dominates Historical high debt ratio in percent of disposable income Noticeably higher real P/R ratios compared to fundamental P/R ratios The following fundamental factors support the high growth in house prices: Strong economic growth in terms of higher GDP Historical low key interest rate Low interest rate (lending rate) High growth in disposable income Historical high credit level Low levels of unsold homes Low deviations between real house price index and trend By conducting several analyses, we found divergent results. After an overall assessment of the fundamental factors derived from Jacobsen and Naug s article, we found that house prices cannot be supported solely by fundamental factors. Both unemployment and new constructions are increasing and do not support the high house price growth. Increased unemployment would in a perfect market lead to lower housing demand and simultaneously a smaller workforce, which in turn indicates less people being creditworthy. Hence, this would in principal cause lower house prices. An increase in new constructions would isolated lead to a larger housing supply, which in a perfect market would push prices down. Nevertheless, started constructions today might not turn out in lower house prices before the constructions are completed. However, we still see an overall increase in new constructions since the financial crisis, simultaneously with growth in house prices. From the analysis of Case and Shiller s seven criteria we found that every single criterion was fulfilled, and all criteria argue for a housing bubble in the Norwegian market. Furthermore, the analysis shows that Norwegian households have a historical high debt ratio in percent of disposable 110
113 income. This leads to an unbalanced economy, and provides indications of a housing bubble. This is additionally reinforced by the P/R analysis. Deviations between real- and fundamental values were significant, and suggest that house prices are overvalued. The analysis shows strong growth in house prices, whereas the rental prices do not follow an equal trend. Moreover, the real P/R ratio in 2015 was higher than during any previous housing bubble, which underlines the disequilibrium that was revealed in the analysis. On the contrary, there are several indications pointing towards a housing market that can be explained by fundamental factors. First of all, Norway is experiencing strong economic growth, measured by GDP. When developments in fundamental factors, such as a low key interest rate, a low interest rate (lending rate), and high growth in disposable income, is seen in relation to house price developments and the corresponding HP analysis, the house price growth can to a large extent be claimed to root in reality. The empirical presentation of the HP-filter showed a low deviation between the real house price index and the trend. From 2014 until today, the deviation was approximately zero, which evidently does not provide indications of a housing bubble in the Norwegian market. Moreover, other factors such as a high credit level and a low level of unsold homes support the high growth in house prices. People are able to serve a higher total debt level due to growth in disposable income, combined with lower interest rates the past years. Consequently, we get a higher housing demand. If housing demand is high, people would sacrifice more to win the bidding round and thus push the willingness to pay towards the payment capacity. This may further result in strong growth in housing prices. Can we prove the Danish housing bubble prior to the financial crisis? Our conducted analyses show that the following factors prove the housing bubble: Low economic growth in terms of GDP A high key interest rate Increase in new constructions High pressure of being a home-owner Widespread comprehensions that it is profitable to own housing Widespread expectations of increase in house prices 111
114 House prices receive much attention in the media and private conversations House prices increase more than private income Limited understanding of risk attached to the investment Simplified opinions regarding mechanics of the housing market dominates Significant deviations between the real house price index and trend Two of the four fundamental factors from Jacobsen and Naug s study showed bubble tendencies in the Danish housing market, namely increase in new constructions and rise in the interest rate. This shows that a housing bubble may exist although the growth in house prices can be supported by some fundamental factors. Consequently, we can argue that Jacobsen and Naug s study may not be an appropriate measure when analyzing abnormal markets. However, both the GDP and the key interest verified the housing bubble. From the analysis of Case and Shiller s seven criteria, we found that every single criterion was fulfilled during the house bubble, and all criteria argued for a housing bubble in the Danish market. This indicates that Case and Shiller s model may be suitable when analyzing the Danish house market. Hence, we can argue that this model is reliable for the Norwegian house market as well. Furthermore, the empirical presentation of the HP-filter undoubtedly proves the housing bubble, due to significant deviations between the real house price index and trend. For every implemented lambda value, the model shows clear signs of a housing bubble. The model shows vital signs even with the lowest lambda value. Accordingly, we can argue that this model is valid for the Norwegian market as well. Are there indications pointing towards a housing bubble in the Norwegian market today? By looking at the totality and an overall picture of the analyses in conjunction with each other, we can argue that there are indications pointing towards a housing bubble in the Norwegian market today. Case and Shiller s model and the P/R analysis show clear indications of a housing bubble. In addition, a historical high debt ratio in percent of disposable income, an increase in the unemployment rate, and a high level of new constructions do also provide indications of a housing bubble. Case and Shiller s model confirmed the housing bubble in Denmark, and we therefore consider this model as highly valid and reliable. Moreover, if we look at the current Norwegian economy in light of Minsky s model, it is apparent that we are in a phase where expansive monetary 112
115 policy prevails. This phase is characterized by low interest rates, an optimistic market outlook, increased unemployment and high levels of disposable income, which all indicate the presence of a housing bubble. The HP-analysis showed no indications pointing towards a housing bubble in the Norwegian market. Even though this analysis under no doubt underlined the housing bubble in Denmark, it is important to emphasize that this bubble happened in a period back in time, which minimizes the endpoint problems that exists in the Norwegian analysis. Hence, we choose to place less emphasis on the results from this analysis. It is also important to remember that the Case and Shiller s analysis were based on subjective and discretionary assessments, and may consequently lack some substance in the argumentation. Additionally, it is important to bear the P/R model assumptions in mind, as well as the fact that rental prices were calculated based on historical CPI figures, which may provide unrealistic development in rental prices. We will once again emphasize that our study is an interpretation of the current housing market, and our conclusion is to some extent based on our expectations as well as different surroundings under the thesis process. The housing market is also characterized by psychological behavior, which has a great impact on house prices. It is not easy to get an appropriate measure of the psychological aspect. Consequently, the price formation in the housing market is complex and affected by numerous factors, which are hard to measure. 113
116 Bibliography Abildgren, K., & Thomsen, J. (2011). En fortælling om to danske bankkriser. Danmarks Nationalbank Kvartalsoversigt, 1 (1), Anundsen, A. K., & Jansen, E. S. (2013). Boligpris- og kredittvekst forsterker hverandre. Statistics Norway, 5, Backus, D. K., & Kehoe, P. J. (1992). International evidence on the historical properties of business cycles. The American Economic Review, Benedictow, A., & Johansen, P. R. (2005). Prognoser for internasjol økonomi:står vi foran en amerikansk konjunkturavmatning? Bertelsen, C. H., & Bremnes, J. M. (2007). Dagens boligmarked: Euforiske tilstander eller strukturelle endringer? En studie av bobletendenser og etterspørselen i det norske boligmarkedet. Norwegian School of Economics. BoNord. (2013). Bolig er den beste investeringen. Retrieved 4 25, 2016, from Borio, C. E., Kennedy, N., & Prowse, S. D. (1994). Exploring Aggregate Asset Fluctuations Across Countries: Measurement, Determinants and Monetary Policy Implications. Bank of International Settlements (Basel), Monetary and Economic Dept. Case, K. E. (1994). Land Prices and House prices in the United States. National Bureau of Economic Research, Case, K. E., & Shiller, R. J. (2003). Is there a bubble in the Housing Market? Brookings papers and Economic Activity, 2, Cooley, T. F., & Ohanian, L. E. (1991). The cyclical behavior of prices. Journal of Monetary Economics, 28 (1), Correia, I. H., Neves, J. L., & Robelo, S. T. (1992). Business Cycles from : New facts about old data. European Economic Review, 36, ECB. (2003, 3). Structural Factors in the EU Housing Market. Retrieved 4 15, 2016, from Eitrheim, Ø., Klovland, J., & Qvigstad, F. (2003). Historical Monetary Statistics for Norway Tidsskrift for Norges Bank, occasional papers, 35. Ellenes, S. B., Viblermo, T. E., Saamiletho, A., Flodin, J., Tekniska, K., & Edlund, H. H. (2011). Sammenlignede analyser av nordiske husleielovgivninger. Oxford research with Wangsteen, Wigemyr & Co. 114
117 Dagbladet. (2008). Rekordmange usolgte boliger bekymrer. Retrieved 5 2, 2016, from Dam, N. A., Hvolbøl, T. S., Pedersen, E. H., Sørensen, P. B., & Thamsborg, S. H. (2011). Boligboblen der bristede: Kan boligpriserne forklares? Og kan deres udsving dæmpes? Retrieved 4 20, 2016, from %20 bristede.pdf#search=boligboble Denmark, T. N. (2015). Penge- og valutakurspolitik. Retrieved 22 4, 2016, from Guba, E. (1990). The Paradigm Dialog, P.20. (S. Publications, Producer) Retrieved from Guba, E., & Lincoln, Y. S. (1994). Competing Paradigms in Qualitative Research. Handbook of qualitative research, Girouard, N. (2006). Recent house price developments: The role of fundamentals. Economics Department Working Paper, 475. Gordon, M., & Shapiro, E. (1956). Capital Equipment Analysis: The Required Rate of Profit." Management Science. 3 (1), Gram, T. (2015). Bankkriser i Norge. Retrieved 3 10, 2016, from no/upload/tidslinje/artikler/1/bankkriser%20i%20norge.pdf Grytten, O. H. (2011). Forelesningsnotat FIE431 P/E- analyse og bobleteori. Norges Handelshøyskole, Grytten, O. (2008). Krakk og kriser i historisk perspektiv. Retrieved 3 26, 2016, from Grønmo, S. (2007). Samfunnsvitenskapelige metoder. Bergen: Fagbokforlaget. Infomedia. (2016). Medieovervåking. Retrieved 3 12, 2016, from IMF. (2008). Financial Stress, Downturns and Recoveries. World Economic Outlook, 2. Hendry, D. F. (1984). Econometric Modelling of House Prices in the United Kingdom. (Chapter 8 in Econometrics and Quantitative Economics, Eds.: Hendry David F & Wallis, Kenneth F, Basil Blackwell Publisher Ltd., Oxford. Hendricks. (2012, 5 31). Sådan oppstod den danske boligboble. Retrieved 4 26, 2016, from Videnskab.dk: Hodne, F., & Grytten, O. H. (2002). Norsk økonomi i det 20 århundre. Oslo: Fagbokforlaget. 115
118 Jacobsen, D. E., & Naug, B. E. (2004). Hva driver boligprisene? Norges Bank Penger og Kreditt, 76 (1), Justicia, I. (2015). 1 av 2 har ikke råd til uforutsette utgifter. Retrieved 4 7, 2016, from Johannessen, A., Tufte, P. A., & Chritoffersen, L. Introduksjon til samfunnsvitenskapelig metode (Vol. 4). Oslo: Abstrakt forlag AS. Jorgensen, D. W. (1963). Capital Theory and Investment Behavior. American Economic Review, 53 (2), Kindleberger, C. (1987). Bubbles, The New Palgrave: A Dictionary of Economics,. (M. M. John Eatwell, Ed.) Knutsen, S. (2008). Finansielle kriser i aktuelt of historisk perspektiv. Retrieved 4 4, 2016, from Handelshøyskolen BI: Kongsrud, P. M. (2002). Forstår vi prisdannelsen i boligmarkedet? Retrieved 2 26, 2016, from Kommunal og Regionaldepartementet. (2002). Boligmarkedene og boligpolitikken. Retrieved 3 22, 2016, from Krainer, J. (2003). House Price Bubbles. FRBSF Economic Letter, 6. Larsen, E. R. (2005). Statistics Norway, Økonomiske Analyser 5. Retrieved 4 8, 2016, from Learner, E. E. (2002). Bubble Trouble? Your House has a P/E ratio too. UCLA Anerson Forecast. Lujanen, M. (2004). Housing and Housing Policy in the Nordic Countries. København: Nordic Council Minister. Lunde, J. (1999). Dansk boligbeskatning set i ejendoms- og boligøkonomisk perpektiv. Insituttt for finansiering, 12 (99). Levitin, A. J., & Watcher, S. M. (2010). Explaining the Houing Bubble. Georgetown Law Journal, 100 (4). Nationalbank, D. (2003). MONA - en kvartalsmodel av dansk økonomi. København: Danmarks Nationalbank. NOU. (2002:2). Boligmarkedene og boligpolitikken. Retrieved from 116
119 NOU. (2004:2). Effekter og effektivitet - Effekter av statlig innsats for regional utvikling og distriktspolitiske mål. Retrieved 2 25, 2016, from NOU. (2014:13). Kapitalbeskatning i en internasjonal økonomi. Retrieved 3 23, 2016, from The Ministry of Finance: Nordvik, V. Boligpriser og forventningsdannelse: sammenhengen mellom forventet og faktisk boligpris. Prosjektrapports, Norges byggeforsikringsinstitutt. NSHB. (2016). Startlån. Retrieved 4 17, 2016, from Miller, M. H., & Modigliani, F. (1961). Dividend Policy, Browth, and the valuation of Shares. The Journal of Business, 34 (4), Minsky, H. P. (1978). The financial instability hypothesis. The Jerome Levy Economics Institute, 74. OECD. (2009). Economic Outlook, 1. Retrieved 4 5, 2016, from Oslo City Court. (2015). Statistikk. Retrieved 4 4, 2016, from Oslo City Court. (2016, 3 2). Tvangssalg av bolig. Retrieved 4 18, 2016, from domstol/oslo-%c2%ad byfogdembete/arsmelding- %C2%AD 2015/saksavviklingen-%C2%AD 2015/tvangssalg-%C2%AD av-%c2%ad bolig/ Poterba, J. M. (1984). Tax Subsidies to Owner Occupied Housing: An Asset-Market Approach. The Quarterly Journal of Economics, Sauren, A. (2011). Flere trenger startlån fra Husbanken. Retrieved 3 22, 2016, from Søbye, E. (2000). Statistikk og historie. Kristianiakrakket Retrieved 4 4, 2016, from Sentralbanksjefens årstale. (2007, 02 15). Økonomiske perspektiver : Foredrag av sentralbanksjefen Svein Gjerdrem på Norges Banks representantskapsmøtes torsdag 15. Februar Retrieved 03 26, 2016, from Shiller, R. J. (2005). Irrational Exuberance (Vol. 2nd edition). New Jersey: Princeton University Press. Skak, M. (2011). Is there an upward trend in Danish real house prices? Nationaløkonomisk tidsskrift, 149, SNL. (2015b). Bankkriser i Norge. Retrieved 4 4, 2016, from SNL. (2016). Bankkriser i Norge. Retrieved 3 23, 2016, from 117
120 SNL. (2015a). Norges historie fra 1905 til Retrieved 4 4, 2016, from Smarte Penger. (2016). Lingingsverdi - "gammelt system". Retrieved 4 4, 2016, from Sparre, M. R. (2013). Boligmarkedet kuppes av dem som eier bolig fra før. Retrieved 4 28, 2016, from Statistics Denmark. (2014). Statistisk tiårsoversikt Retrieved 4 2, 2016, from Statistics Norway. (n.d.). Kristianiakrakket Retrieved 3 4, 2016, from Statistics Norway. (2004). Leiemarkedet og kjennetegn på prisdannelse. Retrieved 3 4, 2016, from Statistics Norway. (2015b). Levekårsundersøkelsen. Retrieved 3 22, 2016, from Statistics Norway. (2015a). Leiemarkedsundersøkelsen. Retrieved 4 25, 2016, from Stiglitz, J. E. (1990). Symposium on bubbles. The Journal of Economic Perpectives, 4 (2), Rangvid, J. (2013). Den Finansiele Krise i Danmark årsager, konsekvenser og læring. Retrieve Media. (2016). Medieovervåkning. Retrieved 5 3, 2016, from Riis, O. (2005). Hvordan Kan Man Tilrettelægge Undersøkelsen? Samfundsvidenskab i Praksis; Introduktion i Anvendt Metode. 1st ed. Hans Reitzels Forlag. The Ministry of Finance. (2011). Bedre rustet mot finanskriser, NOU 2011:1. Retrieved 4 4, 2016, from /id631151/ The Central Bank of Norway. (2006). Finansiell stabilitet 2/2006. Norges Bank Rapportserie 5. The Central Bank of Norway. (2016). Historical Monetary Statistics for Norway. Retrieved 2 25, 2015, from The Central Bank of Norway. (2004). Norske finansmarkeder - pengepolitikk og finansiell stabilitet. Retrieved 4 3, 2016, from 118
121 The Financial Supervisory Authority. (2016). Direkte skatter. Retrieved 4 8, 2016, from The Financial Supervisory Authority. (2015). Finansielle utviklingstrekk Retrieved 4 4, 2016, from nguage=no The Ministry of Finance. (2013). Endringer i finansieringsvirksomhetsloven og verdipapirhandelloven (nye kapitalkrav mv.). Retrieved 3 15, 2016, from /id719257/ The Ministry of Finance. (2013). Meld. St. 12 ( ). Retrieved 3 15, 2016, from st /id714050/ Valadez, R. M. (2011). The housing bubble and the GDP: a correlation perspective. Journal of Case Research in Business and Economics, 3 (1). Vegstein, L. L., & Ekeberg, E. (2015). Bolighaiene sluker byene. Retrieved 4 27, 2016, from Økonomi- og Erhvervministeriet. (2005). Pristigninger på boligmarkedet. Økonomisk tema
122 APPENDIX Table of Content Appendix 1: Mail correspondence from Karen Larsen, Statistics Denmark... 2 Appendix 2: Nominal- and real house prices in Norway... 3 Appendix 3: Nominal- and real house prices in Denmark... 8 Appendix 4: House prices with HP-filter in Norway... 9 Appendix 5: House prices with HP-filter in Denmark Appendix 6: Real P/R calculations
123 Appendix 1: Mail correspondence from Karen Larsen, Statistics Denmark 2

124 Appendix 2: Nominal- and real house prices in Norway 3

125 4

126 5

127 6
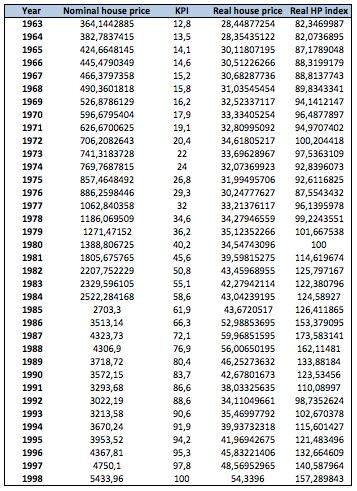
128 7


129 Appendix 3: Nominal- and real house prices in Denmark 8

130 Appendix 4: House prices with HP-filter in Norway 9
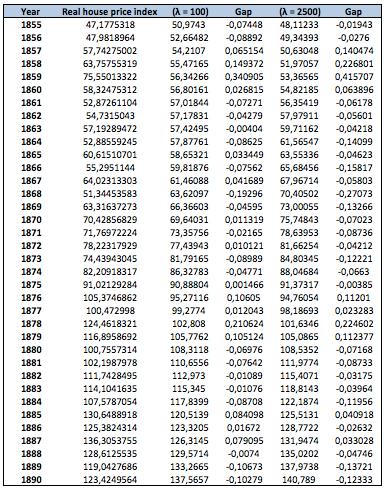
131 10
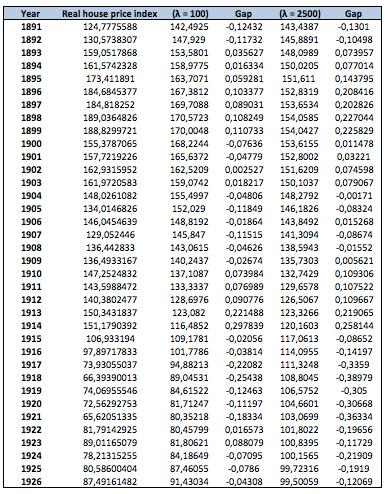
132 11

133 12
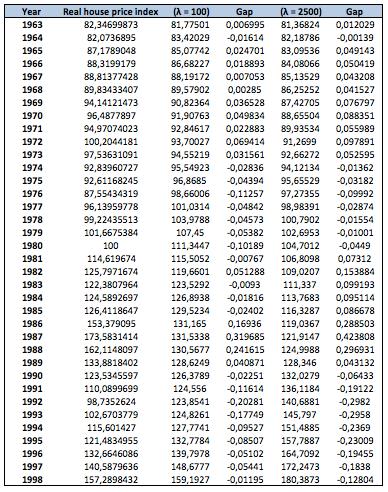
134 13


135 Appendix 5: House prices with HP-filter in Denmark 14
136 Appendix 6: Real P/R calculations 15
137 16
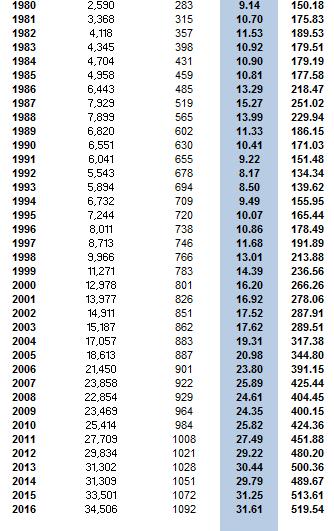
138 17
An Assessment of Recent Increases of House Prices in Austria through the Lens of Fundamentals
 An Assessment of Recent Increases of House Prices in Austria 1 Introduction Martin Schneider Oesterreichische Nationalbank The housing sector is one of the most important sectors of an economy. Since residential
Cycle Monitor Real Estate Market Cycles Third Quarter 2017 Analysis
 Cycle Monitor Real Estate Market Cycles Third Quarter 2017 Analysis Real Estate Physical Market Cycle Analysis of Five Property Types in 54 Metropolitan Statistical Areas (MSAs). Income-producing real
An Assessment of Current House Price Developments in Germany 1
 An Assessment of Current House Price Developments in Germany 1 Florian Kajuth 2 Thomas A. Knetsch² Nicolas Pinkwart² Deutsche Bundesbank 1 Introduction House prices in Germany did not experience a noticeable
Ontario Rental Market Study:
 Ontario Rental Market Study: Renovation Investment and the Role of Vacancy Decontrol October 2017 Prepared for the Federation of Rental-housing Providers of Ontario by URBANATION Inc. Page 1 of 11 TABLE
Housing as an Investment Greater Toronto Area
 Housing as an Investment Greater Toronto Area Completed by: Will Dunning Inc. For: Trinity Diversified North America Limited February 2009 Housing as an Investment Greater Toronto Area Overview We are
THE IMPACT OF RESIDENTIAL REAL ESTATE MARKET BY PROPERTY TAX Zhanshe Yang 1, a, Jing Shan 2,b
 THE IMPACT OF RESIDENTIAL REAL ESTATE MARKET BY PROPERTY TAX Zhanshe Yang 1, a, Jing Shan 2,b 1 School of Management, Xi'an University of Architecture and Technology, China710055 2 School of Management,
Comparative Study on Affordable Housing Policies of Six Major Chinese Cities. Xiang Cai
 Comparative Study on Affordable Housing Policies of Six Major Chinese Cities Xiang Cai 1 Affordable Housing Policies of China's Six Major Chinese Cities Abstract: Affordable housing aims at providing low
Housing Markets: Balancing Risks and Rewards
 Housing Markets: Balancing Risks and Rewards October 14, 2015 Hites Ahir and Prakash Loungani International Monetary Fund Presentation to the International Housing Association VIEWS EXPRESSED ARE THOSE
The Effect of Relative Size on Housing Values in Durham
 TheEffectofRelativeSizeonHousingValuesinDurham 1 The Effect of Relative Size on Housing Values in Durham Durham Research Paper Michael Ni TheEffectofRelativeSizeonHousingValuesinDurham 2 Introduction Real
CONSUMER CONFIDENCE AND REAL ESTATE MARKET PERFORMANCE GO HAND-IN-HAND
 CONSUMER CONFIDENCE AND REAL ESTATE MARKET PERFORMANCE GO HAND-IN-HAND The job market, mortgage interest rates and the migration balance are often considered to be the main determinants of real estate
Economic Forecast of the Construction Sector
 Economic Forecast of the Construction Sector March 2018 Economic Forecast of the Construction Sector Page 2/8 Introduction This economic forecast of the construction sector focuses on 2018 and 2019. The
An overview of the real estate market the Fisher-DiPasquale-Wheaton model
 An overview of the real estate market the Fisher-DiPasquale-Wheaton model 13 January 2011 1 Real Estate Market What is real estate? How big is the real estate sector? How does the market for the use of
How should we measure residential property prices to inform policy makers?
 How should we measure residential property prices to inform policy makers? Dr Jens Mehrhoff*, Head of Section Business Cycle, Price and Property Market Statistics * Jens This Mehrhoff, presentation Deutsche
Hamilton s Housing Market and Economy
 Hamilton s Housing Market and Economy Growth Indicator Report November 2016 hamilton.govt.nz Contents 3. 4. 5. 6. 7. 7. 8. 9. 10. 11. Introduction New Residential Building Consents New Residential Sections
Estimating National Levels of Home Improvement and Repair Spending by Rental Property Owners
 Joint Center for Housing Studies Harvard University Estimating National Levels of Home Improvement and Repair Spending by Rental Property Owners Abbe Will October 2010 N10-2 2010 by Abbe Will. All rights
Is there a conspicuous consumption effect in Bucharest housing market?
 Is there a conspicuous consumption effect in Bucharest housing market? Costin CIORA * Abstract: Real estate market could have significant difference between the behavior of buyers and sellers. The recent
Messung der Preise Schwerin, 16 June 2015 Page 1
 New weighting schemes in the house price indices of the Deutsche Bundesbank How should we measure residential property prices to inform policy makers? Elena Triebskorn*, Section Business Cycle, Price and
Mueller. Real Estate Market Cycle Monitor Second Quarter 2018 Analysis
 Mueller Real Estate Market Cycle Monitor Second Quarter 2018 Analysis Real Estate Market Cycle analysis of 5 property types in 54 Metropolitan Statistical Areas (MSAs). Graphic Clarification! Point 11
Comparing the Stock Market and Iowa Land Values: A Question of Timing Michael Duffy ISU Department of Economics
 Comparing the Stock Market and Iowa Land Values: A Question of Timing Michael Duffy ISU Department of Economics This paper is an update of earlier versions. The purpose of the paper is to examine the question;
COMPARATIVE STUDY ON THE DYNAMICS OF REAL ESTATE MARKET PRICE OF APARTMENTS IN TÂRGU MUREŞ
 COMPARATVE STUDY ON THE DYNAMCS OF REAL ESTATE MARKET PRCE OF APARTMENTS N TÂRGU MUREŞ Emil Nuţiu Petru Maior University of Targu Mures, Romania emil.nutiu@engineering.upm.ro ABSTRACT The study presents
Mueller. Real Estate Market Cycle Monitor Third Quarter 2018 Analysis
 Mueller Real Estate Market Cycle Monitor Third Quarter 2018 Analysis Real Estate Physical Market Cycle Analysis - 5 Property Types - 54 Metropolitan Statistical Areas (MSAs). It appears mid-term elections
Linkages Between Chinese and Indian Economies and American Real Estate Markets
 Linkages Between Chinese and Indian Economies and American Real Estate Markets Like everything else, the real estate market is affected by global forces. ANTHONY DOWNS IN THE 2004 presidential campaign,
Economy. Denmark Market Report Q Weak economic growth. Annual real GDP growth
 Denmark Market Report Q 1 Economy Weak economic growth In 13, the economic growth in Denmark ended with a modest growth of. % after a weak fourth quarter with a decrease in the activity. So Denmark is
Luxury Residences Report 2nd Half 2016
 Luxury Residences Report 2nd Half 2016 YEAR XIII No. 2 March 2017 1 Luxury Residences Report 2 nd Half 2016 Introduction Introduction and methodology 2 Luxury Residences Report 2 nd Half 2016 Introduction
Volume Title: Well Worth Saving: How the New Deal Safeguarded Home Ownership
 This PDF is a selection from a published volume from the National Bureau of Economic Research Volume Title: Well Worth Saving: How the New Deal Safeguarded Home Ownership Volume Author/Editor: Price V.
Viability and the Planning System: The Relationship between Economic Viability Testing, Land Values and Affordable Housing in London
 Viability and the Planning System: The Relationship between Economic Viability Testing, Land Values and Affordable Housing in London Executive Summary & Key Findings A changed planning environment in which
14 September 2015 MARKET ANALYTICS AND SCENARIO FORECASTING UNIT. JOHN LOOS: HOUSEHOLD AND PROPERTY SECTOR STRATEGIST
 14 September 2015 MARKET ANALYTICS AND SCENARIO FORECASTING UNIT JOHN LOOS: HOUSEHOLD AND PROPERTY SECTOR STRATEGIST 087-328 0151 john.loos@fnb.co.za THEO SWANEPOEL: PROPERTY MARKET ANALYST 087-328 0157
ON THE HAZARDS OF INFERRING HOUSING PRICE TRENDS USING MEAN/MEDIAN PRICES
 ON THE HAZARDS OF INFERRING HOUSING PRICE TRENDS USING MEAN/MEDIAN PRICES Chee W. Chow, Charles W. Lamden School of Accountancy, San Diego State University, 5500 Campanile Drive, San Diego, CA 92182, chow@mail.sdsu.edu
Return to Iowa farmland versus S&P 500
 Economics Working Papers (2002 2016) Economics 3-5-2012 Return to Iowa farmland versus S&P 500 Michael Duffy Iowa State University, mduffy@iastate.edu Follow this and additional works at: http://lib.dr.iastate.edu/econ_las_workingpapers
Oil & Gas Lease Auctions: An Economic Perspective
 Oil & Gas Lease Auctions: An Economic Perspective March 15, 2010 Presented by: The Florida Legislature Office of Economic and Demographic Research 850.487.1402 http://edr.state.fl.us Bidding for Oil &
IAS Revenue. By:
 IAS - 18 Revenue International Accounting Standard No 18 (IAS 18) Revenue In 1998, IAS 39, Financial Instruments: Recognition and Measurement, amended paragraph 11 of IAS 18, adding a cross-reference to
Non-Profit Co-operative Housing: Working to Safeguard Canada s Affordable Housing Stock for Present and Future Generations
 Co-operative Housing Federation of Canada s submission to the 2009 Pre-Budget Consultations Non-Profit Co-operative Housing: Working to Safeguard Canada s Affordable Housing Stock for Present and Future
Determinants of residential property valuation
 Determinants of residential property valuation Author: Ioana Cocos Coordinator: Prof. Univ. Dr. Ana-Maria Ciobanu Abstract: The aim of this thesis is to understand and know in depth the factors that cause
What s Next for Commercial Real Estate Leveraging Technology and Local Analytics to Grow Your Commercial Real Estate Business
 What s Next for Commercial Real Estate Leveraging Technology and Local Analytics to Grow Your Commercial Real Estate Business - A PUBLICATION OF GROWTH MAPS- TABLE OF CONTENTS Intro 1 2 What Does Local
Young-Adult Housing Demand Continues to Slide, But Young Homeowners Experience Vastly Improved Affordability
 Young-Adult Housing Demand Continues to Slide, But Young Homeowners Experience Vastly Improved Affordability September 3, 14 The bad news is that household formation and homeownership among young adults
ECONOMIC CURRENTS. Vol. 5 Issue 2 SOUTH FLORIDA ECONOMIC QUARTERLY. Key Findings, 2 nd Quarter, 2015
 ECONOMIC CURRENTS THE Introduction SOUTH FLORIDA ECONOMIC QUARTERLY Economic Currents provides an overview of the South Florida regional economy. The report presents current employment, economic and real
What Factors Determine the Volume of Home Sales in Texas?
 What Factors Determine the Volume of Home Sales in Texas? Ali Anari Research Economist and Mark G. Dotzour Chief Economist Texas A&M University June 2000 2000, Real Estate Center. All rights reserved.
RESEARCH BRIEF TURKISH HOUSING MARKET: PRICE BUBBLE SEPTEMBER 2014 SUMMARY. A Cushman & Wakefield Research Publication OVERVIEW
 RESEARCH BRIEF TURKISH HOUSING MARKET: PRICE BUBBLE SEPTEMBER 2014 SUMMARY OVERVIEW Debates on the existence of a price bubble in the Turkish housing market have continued after numerous news releases
MARKET STRATEGY VIEWPOINT U.S. Housing Decelerating
 Jan-01 Oct-01 Jul-02 Apr-03 Jan-0 Oct-0 Jul-05 Apr-0 Jan-07 Oct-07 Jul-08 Apr-09 Jan-10 Oct-10 Jul-11 Apr-12 Jan-13 Oct-13 Jul-1 Apr-15 Jan-1 Oct-1 Jul-17 Apr-18 U.S. Housing Decelerating August 27, 2018
[03.01] User Cost Method. International Comparison Program. Global Office. 2 nd Regional Coordinators Meeting. April 14-16, 2010.
![[03.01] User Cost Method. International Comparison Program. Global Office. 2 nd Regional Coordinators Meeting. April 14-16, 2010.](/thumbs/89/100772946.jpg "[03.01] User Cost Method. International Comparison Program. Global Office. 2 nd Regional Coordinators Meeting. April 14-16, 2010.") Public Disclosure Authorized Public Disclosure Authorized Public Disclosure Authorized Public Disclosure Authorized International Comparison Program [03.01] User Cost Method Global Office 2 nd Regional
Public Disclosure Authorized Public Disclosure Authorized Public Disclosure Authorized Public Disclosure Authorized International Comparison Program [03.01] User Cost Method Global Office 2 nd Regional
COMPARISON OF THE LONG-TERM COST OF SHELTER ALLOWANCES AND NON-PROFIT HOUSING
 COMPARISON OF THE LONG-TERM COST OF SHELTER ALLOWANCES AND NON-PROFIT HOUSING Prepared for The Fair Rental Policy Organization of Ontario By Clayton Research Associates Limited October, 1993 EXECUTIVE
How to Read a Real Estate Appraisal Report
 How to Read a Real Estate Appraisal Report Much of the private, corporate and public wealth of the world consists of real estate. The magnitude of this fundamental resource creates a need for informed
The OeNB property market monitor of April 2015: Residential property price growth in Austria slowed down markedly in the second half of 2014
 The OeNB property market monitor of April : Residential property price growth in slowed down markedly in the second half of Martin Schneider, Karin Wagner, Walter Waschiczek Residential property price
Housing market and finance
 Housing market and finance Q: What is a market? A: Let s play a game Motivation THE APPLE MARKET The class is divided at random into two groups: buyers and sellers Rules: Buyers: Each buyer receives a
HOUSING MARKET OUTLOOK: SAN LUIS OBISPO, CA AND SURROUNDING AREA
 HOUSING MARKET OUTLOOK: SAN LUIS OBISPO, CA AND SURROUNDING AREA GABE RANDALL SCOTT KELTING April15, 2009 National Market Overview April 15, 2009 2008: A Year in Review Starting between 1999 and 2000,
BUSI 330 Suggested Answers to Review and Discussion Questions: Lesson 10
 BUSI 330 Suggested Answers to Review and Discussion Questions: Lesson 10 1. The client should give you a copy of their income and expense statements for the last 3 years showing their rental income by
Examples of Quantitative Support Methods from Real World Appraisals
 Examples of Quantitative Support Methods from Real World Appraisals Jeffrey A. Johnson, MAI Integra Realty Resources Minneapolis / St. Paul Tony Lesicka, MAI Central Bank 1 Overview of Presentation EXAMPLES
Cycle Monitor Real Estate Market Cycles Second Quarter 2018 Analysis
 Black Creek Research Cycle Monitor Real Estate Market Cycles Second Quarter 0 Analysis Real Estate Market Cycle analysis of five property types in Metropolitan Statistical Areas (MSAs). Important note:
ECONOMIC AND MONETARY DEVELOPMENTS
 Box EURO AREA HOUSE PRICES AND THE RENT COMPONENT OF THE HICP In the euro area, as in many other economies, expenditures on buying a house or flat are not incorporated directly into consumer price indices,
White Paper of Manuel Jahn, Head of Real Estate Consulting GfK GeoMarketing. Hamburg, March page 1 of 6
 White Paper of Manuel Jahn, Head of Real Estate Consulting GfK GeoMarketing Hamburg, March 2012 page 1 of 6 The misunderstanding Despite a very robust 2011 in terms of investment transaction volume and
Goods and Services Tax and Mortgage Costs of Australian Credit Unions
 Goods and Services Tax and Mortgage Costs of Australian Credit Unions Author Liu, Benjamin, Huang, Allen Published 2012 Journal Title The Empirical Economics Letters Copyright Statement 2012 Rajshahi University.
3 November rd QUARTER FNB SEGMENT HOUSE PRICE REVIEW. Affordability of housing
 3 November 2011 3 rd QUARTER FNB SEGMENT HOUSE PRICE REVIEW JOHN LOOS: HOUSEHOLD AND PROPERTY SECTOR STRATEGIST 011-6490125 John.loos@fnb.co.za EWALD KELLERMAN: PROPERTY MARKET ANALYST 011-6320021 ekellerman@fnb.co.za
BUSI 398 Residential Property Guided Case Study
 BUSI 398 Residential Property Guided Case Study PURPOSE AND SCOPE The Residential Property Guided Case Study course BUSI 398 is intended to give the real estate appraisal student a working knowledge of
Securing Land Rights for Broadband Land Acquisition for Utilities in Sweden
 Securing Land Rights for Broadband Land Acquisition for Utilities in Sweden Marija JURIC and Kristin LAND, Sweden Key words: broadband, land acquisition, cadastral procedure, Sweden SUMMARY The European
Forecast of Tax Revenues for Reston Community Center Reston, Virginia. Prepared for Reston Community Center March 2013
 Forecast of Tax Revenues for Reston Community Center Reston, Virginia Prepared for Reston Community Center March 2013 TAX BASE AND REVENUES FORECASTS FOR RESTON COMMUNITY CENTER Purpose of the Analysis
PROPERTY BAROMETER Residential Property Affordability Review The recently improving Housing Affordability trend stalled in the 1 st quarter of 2017
 21 June 2017 MARKET ANALYTICS AND SCENARIO FORECASTING UNIT JOHN LOOS: HOUSEHOLD AND PROPERTY SECTOR STRATEGIST FNB HOME LOANS 087-328 0151 john.loos@fnb.co.za LIZE ERASMUS: STATISTICIAN 087-335 6664 lize.erasmus@@fnb.co.za
Document under Separate Cover Refer to LPS State of Housing
 Document under Separate Cover Refer to LPS5-17 216 State of Housing Contents Housing in Halton 1 Overview The Housing Continuum Halton s Housing Model 3 216 Income & Housing Costs 216 Indicator of Housing
1. INTRODUCTION .., Since, Sri Lanka's economy turn in to!tee market economy policy, there has been a. 1.1 Background
 1 Since, Sri Lanka's economy turn in to!tee market economy policy, there has been a significant growth in the residential real estate industry in Sri Lanka. During the last As this booming of apartments
MULTIPLE CHALLENGES REAL ESTATE APPRAISAL INDUSTRY FACES QUALITY CONTROL. Issues. Solution. By, James Molloy MAI, FRICS, CRE
 REAL ESTATE APPRAISAL INDUSTRY FACES MULTIPLE CHALLENGES By, James Molloy MAI, FRICS, CRE QUALITY CONTROL Third-party real estate appraisal firms are production-driven businesses designed to complete assignments
This PDF is a selection from a published volume from the National Bureau of Economic Research
 This PDF is a selection from a published volume from the National Bureau of Economic Research Volume Title: NBER Macroeconomics Annual 2015, Volume 30 Volume Author/Editor: Martin Eichenbaum and Jonathan
Nothing Draws a Crowd Like a Crowd: The Outlook for Home Sales
 APRIL 2018 Nothing Draws a Crowd Like a Crowd: The Outlook for Home Sales The U.S. economy posted strong growth with fourth quarter 2017 Real Gross Domestic Product (real GDP) growth revised upwards to
HM Treasury consultation: Investment in the UK private rented sector: CIH Consultation Response
 HM Treasury Investment in the UK private rented sector: CIH consultation response This consultation response is one of a series published by CIH. Further consultation responses to key housing developments
The Uneven Housing Recovery
 AP PHOTO/BETH J. HARPAZ The Uneven Housing Recovery Michela Zonta and Sarah Edelman November 2015 W W W.AMERICANPROGRESS.ORG Introduction and summary The Great Recession, which began with the collapse
Orange Water and Sewer Authority Water and Sewer System Development Fee Study
 Orange Water and Sewer Authority Water and Sewer System Development Fee Study March 6, 2018 March 6, 2018 Mr. Stephen Winters Director of Finance and Customer Service 400 Jones Ferry Road Carrboro, NC
Research report Tenancy sustainment in Scotland
 Research report Tenancy sustainment in Scotland From the Shelter policy library October 2009 www.shelter.org.uk 2009 Shelter. All rights reserved. This document is only for your personal, non-commercial
Solutions to Questions
 Uploaded By Qasim Mughal http://world-best-free.blogspot.com/ Chapter 7 Variable Costing: A Tool for Management Solutions to Questions 7-1 Absorption and variable costing differ in how they handle fixed
* Are the Public and Private Capital Markets Worlds Apart? M. Mark Walker, PhD, CFA, CBA
 WINTER 2007/2008 THE INSTITUTE OF BUSINESS APPRAISERS, INC. Business Appraisal Practice In this Issue Editor's Column - Does a Historical Average, Weighted or Otherwise, Constitute an Income Forecast?
Cube Land integration between land use and transportation
 Cube Land integration between land use and transportation T. Vorraa Director of International Operations, Citilabs Ltd., London, United Kingdom Abstract Cube Land is a member of the Cube transportation
Hands Off Our Homes. The Financialization of Housing in Europe
 Hands Off Our Homes The Financialization of Housing in Europe Content Introduction Introduction...3 What is the financialization of housing?... 4 The causes of the current situation...5 Hands Off Our Homes
NATIONAL ASSOCIATION OF REALTORS. National Center for Real Estate Research
 NATIONAL ASSOCIATION OF REALTORS National Center for Real Estate Research COMMUNITY ACCEPTANCE OF AFFORDABLE HOUSING C. Theodore Koebel Robert E. Lang Karen A. Danielsen Center for Housing Research and
Georgia Tech Financial Analysis Lab 800 West Peachtree Street NW Atlanta, GA
 800 West Peachtree Street NW Atlanta, GA 30308-0520 404-894 - 4395 http://www.scheller.gatech.edu/finlab Dr. Charles W. Mulford, Director Invesco Chair and Professor of Accounting charles.mulford@scheller.gatech.edu
MONETARY POLICY AND HOUSING MARKET: COINTEGRATION APPROACH
 MONETARY POLICY AND HOUSING MARKET: COINTEGRATION APPROACH Doh-Khul Kim, Mississippi State University - Meridian Kenneth A. Goodman, Mississippi State University - Meridian Lauren M. Kozar, Mississippi
Value Fluctuations in a Real Estate Investment Financed with Debt
 Working Draft of New Case Study 4A Value Fluctuations in a Real Estate Investment Financed with Debt (which will be added to AICPA Accounting and Valuation Guide Valuation of Portfolio Company Investments
Public private collaboration model in the cadastral workflow in Denmark
 Public private collaboration model in the cadastral workflow in Denmark Jakob HØJGAARD-GERAAE, Denmark Key words: Cadastre, digital cadastre, e-governance, history, land management SUMMARY The structure
Performance of the Private Rental Market in Northern Ireland
 Summary Research Report July - December Performance of the Private Rental Market in Northern Ireland Research Report July - December 1 Northern Ireland Rental Index: Issue No. 8 Disclaimer This report
THE CASE FOR EUROPEAN LONG LEASE REAL ESTATE: CONTRIBUTING TO MORE CERTAIN INVESTMENT OUTCOMES
 This document is for professional/qualified investors only. It is not to be distributed to or relied on by retail clients. THE CASE FOR EUROPEAN LONG LEASE REAL ESTATE: CONTRIBUTING TO MORE CERTAIN INVESTMENT
31 July 2014 Japan s Modified International Standards (JMIS): Accounting Standards Comprising IFRSs and the ASBJ Modifications
: Accounting Standards Comprising IFRSs and the ASBJ Modifications") 31 July 2014 Japan s Modified International Standards (JMIS): Accounting Standards Comprising IFRSs and the ASBJ Modifications ASBJ Modification Accounting Standard Exposure Draft No. 1 Accounting for
31 July 2014 Japan s Modified International Standards (JMIS): Accounting Standards Comprising IFRSs and the ASBJ Modifications ASBJ Modification Accounting Standard Exposure Draft No. 1 Accounting for
Findings: City of Johannesburg
 Findings: City of Johannesburg What s inside High-level Market Overview Housing Performance Index Affordability and the Housing Gap Leveraging Equity Understanding Housing Markets in Johannesburg, South
The impact of the global financial crisis on selected aspects of the local residential property market in Poland
 The impact of the global financial crisis on selected aspects of the local residential property market in Poland DARIUSZ PĘCHORZEWSKI Szczecińskie Centrum Renowacyjne ul. Księcia Bogusława X 52/2, 70-440
Analysing lessee financial statements and Non-GAAP performance measures
 February 2019 IFRS Foundation The Essentials Issue No. 5 Analysing lessee financial statements and Non-GAAP performance measures Introduction Investors and company managers generally view free cash flow
Appendix 1: Gisborne District Quarterly Market Indicators Report April National Policy Statement on Urban Development Capacity
 Appendix 1: Gisborne District Quarterly Market Indicators Report April 2018 National Policy Statement on Urban Development Capacity Quarterly Market Indicators Report April 2018 1 Executive Summary This
Helix Vol. 8(1):
:") DOI 10.29042/2018-2249-2253 Use of Mortgage-Investment Analysis to Study the Behavior of the Population in the Residential Real Estate Market in the City of Kazan Nail M. Gabdullin* 1, Igor A. Kirshin
DOI 10.29042/2018-2249-2253 Use of Mortgage-Investment Analysis to Study the Behavior of the Population in the Residential Real Estate Market in the City of Kazan Nail M. Gabdullin* 1, Igor A. Kirshin
LeaseCalcs: The Great Wall
 LeaseCalcs: The Great Wall Marc A. Maiona June 22, 2016 The Great Wall: Companies reporting under IFRS are about to hit the wall due to new lease accounting standards. Every company that reports under
Reforming the land market
 Reforming the land market How land reform can help deliver the government target of 300,000 new homes per year CPP Working Paper 01/2018 April 2018 Thomas Aubrey Centre for Progressive Policy About the
Each copy of any part of a JSTOR transmission must contain the same copyright notice that appears on the screen or printed page of such transmission.
 Durability and Monopoly Author(s): R. H. Coase Source: Journal of Law and Economics, Vol. 15, No. 1 (Apr., 1972), pp. 143-149 Published by: The University of Chicago Press Stable URL: http://www.jstor.org/stable/725018
Macro-prudential Policy in an Agent-Based Model of the UK Housing Market
 Macro-prudential Policy in an Agent-Based Model of the UK Housing Market Rafa Baptista, J Doyne Farmer, Marc Hinterschweiger, Katie Low, Daniel Tang, Arzu Uluc Heterogeneous Agents and Agent-Based Modeling:
Using Hedonics to Create Land and Structure Price Indexes for the Ottawa Condominium Market
 Using Hedonics to Create Land and Structure Price Indexes for the Ottawa Condominium Market Kate Burnett Isaacs Statistics Canada May 21, 2015 Abstract: Statistics Canada is developing a New Condominium
Housing and Property Market in Lithuania
 Housing and Property Market in Lithuania Kestutis SABALIAUSKAS, Lithuania Key words: real property, housing market, housing loans, credit market, Lithuania. SUMMARY The real property market in Lithuania
Market Segmentation: The Omaha Condominium Market
 Market Segmentation: The Omaha Condominium Market Roger P. Sindt Steven Shultz University of Nebraska at Omaha Introduction A highly visible and growing niche in the homeownership market is the condominium
Luxury Residences Report First Half 2017
 Luxury Residences Report First Half 2017 YEAR XIV n. 1 October 2017 1 Luxury Residences Report: First Half 2017 Introduction Introduction and methodology 2 Luxury Residences Report: First Half 2017 Introduction
Restoring the Past U.E.P.C. Building the Future
 Brussels, 14.12.2010 Dear Sirs, Madam, Re: Exposure Draft Leases On behalf of the European Union of Developers and House Builders (Union Europeénne des Promoteurs-Constructeurs - UEPC), I am writing to
Economic and monetary developments
 Box 4 House prices and the rent component of the HICP in the euro area According to the residential property price indicator, euro area house prices decreased by.% year on year in the first quarter of
W H O S D R E A M I N G? Homeownership A mong Low Income Families
 W H O S D R E A M I N G? Homeownership A mong Low Income Families CEPR Briefing Paper Dean Baker 1 E X E CUTIV E S UM M A RY T his paper examines the relative merits of renting and owning among low income
ECONOMIC CURRENTS. Vol. 4, Issue 3. THE Introduction SOUTH FLORIDA ECONOMIC QUARTERLY
 ECONOMIC CURRENTS THE Introduction SOUTH FLORIDA ECONOMIC QUARTERLY Vol. 4, Issue 3 Economic Currents provides an overview of the South Florida regional economy. The report presents current employment,
Special Report. Australia s Cheapest Suburbs with the Greatest Potential for Capital Growth. For more reports head to
 Demand Supply Ratio Market Report Special Report Australia s Cheapest Suburbs with the Greatest Potential for Capital Growth Market: Australia Created by: hotspotcentral.com.au Contact: t: 1300 200 340
2011 Farmland Value Survey The survey was initiated in 1941 and is sponsored
 File C2-70 January 2012 www.extension.iastate.edu/agdm 2011 Farmland Value Survey The survey was initiated in 1941 and is sponsored annually by the Iowa Agriculture and Home Economics Experiment Station,
16 April 2018 KEY POINTS
 16 April 2018 MARKET ANALYTICS AND SCENARIO FORECASTING UNIT JOHN LOOS: HOUSEHOLD AND PROPERTY SECTOR STRATEGIST FNB HOME LOANS 087-328 0151 john.loos@fnb.co.za THULANI LUVUNO: STATISTICIAN 087-730 2254
7829 Glenwood Avenue Canal Winchester, Ohio November 19,2013
 7829 Glenwood Avenue Canal Winchester, Ohio 43110 614-920-1425 November 19,2013 Technical Director File Reference Number 2013-270 Financial Standards Accounting Board 401 Merritt 7 Norwalk, Connecticut
things to consider if you are selling your house
 things to consider if you are selling your house KEEPINGCURRENTMATTERS.COM WINTER 2012 EDITION PAGE TABLE OF CONTENTS 1 3 5 7 9 House Prices: Where They Will Be in the Spring Understanding the Impact OF
Housing Price Forecasts. Illinois and Chicago PMSA, March 2018
 Housing Price Forecasts Illinois and Chicago PMSA, March 2018 Presented To Illinois Realtors From R E A L Regional Economics Applications Laboratory, Institute of Government and Public Affairs University