Understanding Development in Winnipeg
|
|
|
- Randolf Goodman
- 6 years ago
- Views:
Transcription


1 Understanding Development in Winnipeg An Informational Briefing for City Council and Winnipeg Citizens Presented by: September 20, 2016 Prepared by
2 Contents 1. Executive Summary... i State of Winnipeg s Infrastructure... i Current Development Agreement Parameters Process...ii The Overarching Vision for Winnipeg... iii The Value of New Development... iii Comparison to Neighbouring Municipalities... iv Growth Assumptions... v Capital Project Assumptions... vi Other Jurisdictional Practices... vii Determination of Costs... vii Stakeholder Engagement... vii Attribution to Growth... vii Accountability and Transparency... viii Authority... viii 2. Introduction and Background... 1 About UDI / MHBA... 1 Purpose of This Report... 2 Why It s Important Context... 4 State of Winnipeg Infrastructure... 4 City of Winnipeg Financial Situation... 5 Historic and Projected Growth Population Employment Housing Market Commercial and Industrial Market Current Planning Environment Municipal Authority... 17
3 Municipal Plans OurWinnipeg Complete Communities Urban Sprawl vs Smart Growth (CaRDI, 2016) Sustainable Transportation Other Infrastructure Plans City of Winnipeg Development Process Development Agreement Parameters Value of Development to Winnipeg Economic Impact of Home Construction How New Development Pays for Its Impacts Direct Investment Assessment Contribution of New Homes Cost Benefit Studies Other Jurisdictions Considerations when Comparing Winnipeg to Other Jurisdictions Recognized Practices for Attributing Costs of Growth Planning and Background Study Requirements Meaningful Stakeholder Engagement and Collaboration Benefit Limitations on Development Charges Accountability and Transparency Mechanisms Capital Region Municipalities Contributing Factors for Development Cost Charges in Small Municipalities Concerns with the 2016 Growth Study Growth Projections Identification of Costs Projects Not Approved or Listed Above Approved Costs Projects Previously Completed Lack of Planning and Technical Rigour to Fairly Attribute Costs Disregard of Winnipeg s Utility Model... 49
4 Process Impact Vision for Winnipeg Loss of Development to Surrounding Communities Concerns with the Proposed By-Law Fairness and Equitable Application of Fees Accountability and Transparency Authority The Path Forward Collaborative Process Sound Principles and Analysis Effective City Planning, Fair Allocation Clear, Consistent Policy; Accountability and Transparency Next Steps to Long Term Sound Solutions References Appendix A: Sources of City Revenues Other Revenue Sources Appendix B Winnipeg Development Agreement Parameters Appendix C Other Jurisdictions British Columbia Local Government Act Saskatchewan Planning Act Alberta Municipal Government Act Ontario Development Charges Act Example of Consultation Process (City of Calgary, 2015) Examples of Project Cost Detail Appendix D Other Capital Region Municipalities Appendix E - Comparative Prices for New Homes Winnipeg and CMA Communities... 77
5 Table of Figures Figure 1 Property Tax Changes in Cities (City of Winnipeg, 2016) Figure 2 City of Winnipeg Taxation, Service & Regulatory Revenue, Figure 3 Per Capita Revenue Comparison... 6 Figure 4 City of Winnipeg Revenue and Expenses... 7 Figure 5 City of Winnipeg Accumulated Surplus... 7 Figure 6 City of Winnipeg Capital Investment... 8 Figure 7 Capital Spending Per Capita Comparison... 8 Figure 8 City of Winnipeg Capital Reserve, Figure 9 Winnipeg Census Metropolitan Area (CMA) Figure 10 Annual Population Growth Rate Figure 11 Sources of Migration Figure 12 Winnipeg CMA Employment Figure 13 Employment Outlook Figure 14 Population Growth and Housing Starts Figure 15 Rental Vacancy Rate Figure 16 Complete and Unsold Housing Inventory Figure 17 Evidence of Problematic Conditions (CMHC, Q2 2016) Figure 18 Commercial Real Estate Inventory, Figure 19 Recent Communities Figure 20 New Communities (City of Winnipeg, 2011) Figure 21 Density of Areas of Winnipeg Figure 22 Sage Creek Master Plan Figure 23 Sage Creek Medium Density Homes Figure 24 City of Winnipeg Secondary Plans Figure 25 Waverley West Approval Process Figure 26 Infrastructure Built by Developers, Paid for by New Home and Commercial Property Buyers Figure 27 Municipal levies by neighbourhood Figure 28 New Housing and Consumer Price Indexes Figure 29 Cost Benefit Study Approach Figure 30 Capital Region Municipalities Development Charges Figure 31 Comparison of New Homes Figure 32: Winnipeg CMA Community Averages Figure 33 Growth in Non-Residential Space Figure 34 Comparison of Roads Project Costing Figure 35 Comparison of Transit Project Costing Figure 36 Development Cost Charge Detail BC Best Practice Guide [EXAMPLE]... 73

6 1. Executive Summary The City of Winnipeg is exploring new mechanisms for funding infrastructure deficits and impacts of growth. In the spring of 2016, the City commissioned a study to identify options, determine development-related costs and revenues, and define a growth financing model and implementation framework. The study, completed by Toronto-based Hemson Consulting (the Hemson Report), was released to the public on September 1, The Hemson Report recommended development charges for residential, office, commercial/retail, institutional and industrial development. On Friday September 16, 2016, the City of Winnipeg put forward a proposed by-law to introduce impact fees on the Executive Policy Committee agenda. If approved, the by-law would come into force January 1, The administrative report that accompanied this item included recommended fees for each type of development. The administrative report also recommends the Chief Financial Officer be provided the authority to determine how the fees collected through this scheme will be used. The development industry has a long history of working with the City of Winnipeg to build new communities. This has included extensive work in planning these communities, determining the measureable impacts of the development, and negotiating developer and City responsibilities for the costs. It is in the context of this relationship, and a sincere interest in a strong, sustainable Winnipeg, that this report is offered. Residential and commercial developers and Manitoba home builders are very concerned about the proposed development financing mechanism because: There was no true stakeholder engagement on principles, impacts or attribution of costs through what became a rushed process; The capital project costs that are the basis for calculating the proposed fees appear to be significantly inflated, are not supported by detailed infrastructure plans, include projects that have not been approved by Council, and include projects already completed and in use since in 2009; and There is no clear explanation of the basis on which costs have been attributed to growth, how benefit was determined, or how this relates to who pays. State of Winnipeg s Infrastructure The Hemson Report put forward an argument that development is not paying for new development, because Winnipeg does not have a development charge system. The report does not consider the net new revenues from property taxes from new development or other reasons for under-funded infrastructure. i
7 In the 1990 s, a lack of growth in the city and decisions to spend money on operations instead of capital led to a serious infrastructure deficit. In 2009, the City of Winnipeg estimated that the added investment required to maintain infrastructure assets at appropriate service levels and in a good state of repair was $3.8 billion for existing infrastructure and $3.6 billion for new strategic infrastructure. For both types of infrastructure, approximately half was to maintain at current (2008) condition and half was to raise the average condition to appropriate asset management condition. A significant amount of the investment identified as strategic new infrastructure is really catch up needed to service the City as it exists today. For example, bringing wastewater treatment plants up to modern standards is included in new infrastructure. The City has previously stated these treatment plants had existing, sufficient capacity to service not only growth in the city, but also in neighbouring municipalities, and were already included in rate plans. Current Development Agreement Parameters Process The City of Winnipeg Charter requires an owner seeking approval of a subdivision to enter into a development agreement. The City of Winnipeg and the development community negotiated Development Agreement Parameters that were adopted by City Council in July The existing development agreement parameters, that have been in existence for 15 years, address land acquisition and dedication, services and improvement, maintenance, compliance and general administration and finance. Developers are required to transfer land to the City for various purposes and to construct various types of municipal services that become part of the City s infrastructure. Currently, developers pay 100% of the costs within the development and the costs of identified impacts outside the development (e.g. adjacent roads, nearby intersections). The City has recorded over $630 million in this private sector investment over a 9 year period. Developers have built over $630 million in infrastructure since 2007 that are now City of Winnipeg assets. In December 2015, the City and the development community agreed to discuss improvements to the Development Agreement Parameters. A schedule of meetings was agreed to begin in the winter of Instead, the City deferred these discussions, electing instead to undertake a study into alternative financing mechanisms. The Urban Development Institute and the Manitoba Home Builders Association offered to contribute to the cost of a comprehensive study that would form the basis for new agreement parameters. The City declined, choosing to pursue the study independently through the Finance department, without industry engagement. UDI and MHBA want to return to discussions, with all relevant departments, of how costs of development should be funded through the Development Agreement Parameters process. They are seeking a process that incorporates detailed plans for infrastructure development; objective analysis based on reasonable costing at the level of detail that ensures fair attribution; clear, consistent policy; transparency and accountability of both the City of Winnipeg and the ii
8 development community; and dedicated reserves that ensure the funds collected to pay for the impacts of new development are spent to execute those projects. The Urban Development Institute and the Manitoba Home Builders Association want to return to discussions of how cost of development should be funded through the Development Agreement Parameters process The Overarching Vision for Winnipeg Modern, thriving cities provide their citizens and future citizens with choice of where they want to live -- reflective of their needs and wants at different stages of their lives. OurWinnipeg was developed after extensive consultation and establishes the City of Winnipeg s vision for the next 25 years. It focuses on three key directions -- a city that works, sustainability and quality of life. These directions are intended to address questions such as how growth and change will be accommodated while making sure the city stays liveable, affordable and desirable. The development community has fully embraced SMART Growth principles and the vision of Complete Communities Complete Communities is one of the four Direction Strategies supporting OurWinnipeg. It is intended to guide Winnipeg s physical growth and development by introducing a new urban structure. Complete Communities states that new development should only be approved when a full range of municipal services can be provided in an environmentally sound, economical and timely manner; there is a reasonable relationship between the supply of land and the projected demand; new development is adjacent to and compatible with existing development, and is designed to minimize the spatial use of land. Some have referred to recent growth in Winnipeg as urban sprawl. Urban sprawl generally includes low density, homogenous, single use developments disconnected from the existing development. This is not a true characterization of recent development in Winnipeg. Recognized principles for Smart Growth include mixed land use, a range of housing opportunities and choice, walkable neighborhoods, distinctive, attractive communities with a strong sense of place. Recent developments such as Waverley West and Sage Creek are clear examples of modern, complete communities designed with Smart Growth principles and the Complete Communities vision. The Value of New Development New development expands the number and value of properties, enabling the city to grow its assessment base. This revenue is crucial to support the services of a modern city. Without new development, the existing tax base must pay higher taxes as the costs of delivering municipal services rise, along with the backlog of needed investments in infrastructure renewal to meet iii


9 modern regulatory standards and citizens expectations. New development also provides modern infrastructure that costs less to maintain and provides the capacity and appeal necessary to support and attract population growth. Without new development the existing tax payer will pay higher taxes for: Rising costs of delivery of municipal services Infrastructure renewal to meet modern service requirements and regulatory standards Once lots are sold and new homes constructed, homeowners pay property taxes on the assessed value of the property. New homes are generally assessed at a much higher value than the average home in Winnipeg and thus contribute a larger share of municipal revenue than the average home. Winnipeg has the oldest housing stock in western New homes contribute a larger share of municipal revenue than the average home Canada and the 3 rd oldest housing stock of major cities in Canada which contributes to lower assessed values. This explains, in part, why average property taxes in Winnipeg appear low compared to other cities. Assessed values, and thus property taxes, vary significantly by neighborhood. The average municipal levy per dwelling in Winnipeg was $1,303 in In 2013, an average new single detached home paid over $2,900 in property taxes and frontage levies, 2.2 times the amount paid by the average home. New homes built from are estimated to have contributed about $200 million in new assessment revenue, and will continue to add over $33 million to city coffers per year. These new homes also pay frontage levies, waste diversion fees, and utility rates for water and sewer. New businesses in commercial developments also pay the business tax. Cost benefit studies required by the City of Winnipeg as part of the development approval process have repeatedly shown the net benefits of these new developments to Winnipeg. Waverley West is estimated to provide the city with $892 million (NPV of $250 million) net revenue, after paying all capital, operating and maintenance costs. Waverley West will provide the city with $892 million net revenue after paying all capital, operating and maintenance costs Comparison to Neighbouring Municipalities A new home is for most people the most significant investment a family will make. This is also true of facilities built for business owners. Cost is an important consideration to individuals, iv


10 businesses and families. Homebuyers and new businesses are price and value sensitive and can be highly mobile in these decisions. As the total cost of ownership increases in one area, new homebuyers will look to another. There are many attractive areas in the CMA surrounding the city that provide these alternatives within an easy commute. While there are development charges in Manitoba municipalities outside of Winnipeg, homeowners consider the total cost of buying and operating a new home. A sample of active listings of to-be or just built homes indicates that the cost per square foot of the homes in Winnipeg averaged over 10% higher than comparable homes (3 bedroom, two bath under $400,000) in surrounding municipalities. The average selling price for the Winnipeg homes averaged over $16,000 higher, for smaller homes, and smaller lots. Property taxes for CMA municipalities also average 1/3 less than in Winnipeg. The combination of these factors lead many new home purchasers to perceive greater value in neighboring municipalities, even with the current charges. Surrounding municipalities are growing at double the rate of Winnipeg. If new homebuyers choose to build a home outside the city, the related new assessment revenue is lost. These individuals and families then use Winnipeg roads, parks and other amenities without providing the taxes that support their maintenance. An additional tax on a new home in Winnipeg will drive more people to the surrounding municipalities. Growth Assumptions Underpinning the calculation of the development taxes proposed in the Hemson Report are population and employment forecasts. Winnipeg grew at an average annual rate of.086% from 2001 to The Census Metropolitan Area outside of Winnipeg grew at over two times the rate inside the city The Census Metropolitan Area outside of Winnipeg grew at 1.78% over the same period, over two times the rate inside the city. The forecast to 2040 Surrounding municipalities are growing at over two (2) times the rate of Winnipeg. This new assessment revenue is lost to Winnipeg If the assumptions are wrong, the numbers are wrong and the fees are wrong shows a similar trend where growth in the areas surrounding Winnipeg (77%) is expected to be more than two times the growth rate inside the city (28%). International immigration is the major contributor to population growth in Winnipeg. Although it is expected that Winnipeg will benefit from continued international migration, caution is warranted. While Winnipeg is the seventh largest city in Canada in 2006, it ranked 22 nd in attractiveness to migrants in the Conference Board of Canada s benchmarking report (2010). Employment growth is projected at 1.1% for 2015, down from a 20 year high of 3.4% in The Conference Board of Canada s employment outlook indicates growth will continue to be the highest in the service sectors in the next five years. v

11 The City of Winnipeg forecasts an average of 4,000 new housing starts per year, although this level of housing start has only been seen in two out of the last 20 years. The Hemson Report has forecast an average of 4,200 housing units per year for the next ten years. Rental vacancy rates have now increased to 3% from 1% and are expected to rise as new units under construction are introduced to the market. According to CMHC s Housing Market Assessment, complete and unsold multi-family units remain elevated and are at the threshold of overbuilding. The CMHC Spring Housing Market Outlook for Winnipeg CMA forecasts total housing starts below the levels of the last three years. For the entire CMA, the forecast for housing starts is 3,600 compared to 4,200 in The rate of building in the other municipalities has been two times the rate of growth in the city and will absorb some of this demand. Developers in Winnipeg confirm market conditions in Winnipeg have somewhat cooled. Many have not increased lot prices for two or more years and have needed to offer incentives to encourage lot sales. While everyone hopes that the population grows at the rate projected in the study and this translates into greater housing starts, actual growth may be more modest. Capital Project Assumptions A second key component in the calculation of the new charge is the identification of capital costs associated with projects considered related to development. This data is based on information provided to Hemson by the City of Winnipeg. Hemson refers to them in their report as development-related projects and their gross and net costs. It is not clear what criteria was used to determine what was development related. The projects and their costing were not independently validated by the consultant. Hemson has stated that the development related capital forecast ensures that regulatory fees are only imposed to help pay for projects that have been or are intended to be purchased or built in order to accommodate future anticipated development. An initial analysis finds that: Many of these projects are not included in sufficiently detailed plans and cannot be reliably and accurately costed Many projects are not included in sufficiently detailed plans to enable reliable and accurate costing Many projects are listed at amounts far above the amount in approved budgets or plans Many projects are not included in capital budgets or master plans and have not been approved by Council Several projects have already been completed, with any additions to capacity unclear. The methodology deducts grants and contributions from other levels of government and the portion of the project that may confer benefits to existing residents. It is unclear how the relative demand from growth and related benefit has been determined. vi
12 The City of Winnipeg has repeatedly said that those who benefit from growth should pay for the impacts of this growth. What the actual impacts are of growth and who benefits is at the crux of this issue. Although it could be argued that all Winnipeggers benefit from ongoing growth and development, the methodology employed by Hemson Consulting (citywide average), results in anyone purchasing new homes or opening new businesses regardless of where in the city will pay for all estimated costs attributed to growth regardless of where the development is in the city. For example, homeowners in the north east of the city will pay for investments in the south west. While the vice versa applies, the related investments are not necessarily equal. Other Jurisdictional Practices The City of Winnipeg has repeatedly referenced development charges in other major cities and surrounding Manitoba municipalities as justification for the imposition in Winnipeg. Every municipality has its own unique characteristics, including the provincial legislation and regulatory scheme, physical geography, social and economic environment, extent and condition of existing infrastructure, and growth characteristics. While the general mechanisms to generate revenue are similar, municipalities may employ them in different ways or with different emphasis. There may be different policy considerations or goals that the municipality is trying to achieve. In all cases, understanding what underlies another city s policy, budgets or costs, and how they are affected by timing, reporting and other considerations is important to make a fair comparison. The practices in British Columbia, Alberta, Saskatchewan and Ontario were reviewed to understand what may be learned from the experience in these other jurisdictions. While there are significant differences in the basket of services included in the costing and the amounts charged, there are common principles that may be found where systems have been established to recover capital costs from new developments. Determination of Costs In all cases, the fundamental premise of a development levy is that costs charged to new development must be related to the development. Determining the amount of the levy begins with a clear understanding of what these costs are, and how they are connected to the development, generally through detailed infrastructure planning. Stakeholder Engagement Methods for involving the public in the decision making process in other provinces included external advisory groups and general provisions for a meaningful public process to obtain input on the proposed changes. Methods implemented include opportunities for municipal departments, local developers and the public to review and contribute their opinions. Attribution to Growth The concept of those who benefit should pay is reflected in all reviewed jurisdictions. Other jurisdictions include some parameters for what may reasonably be attributed to new growth. vii

13 Accountability and Transparency Attributing cost and collecting levies is only one part of the necessary system of development levies. Establishing the administrative structures to ensure the funds collected are clearly spent for the purpose which they are collected, returned when warranted, and clear public accountability and reporting are also key elements that are required in Acts, Regulations and Bylaws of other jurisdictions. In every province examined, development charges must be used only for the projects outlined in the DCC program. In most cases this involves segregated special reserves for each purpose, with separate accounting and reporting on their use. Authority The City of Winnipeg does not have the legal authority to implement broad-based impact fees The City of Winnipeg only has the legal authority that it is granted by the Province of Manitoba through The City of Winnipeg Charter Act (The Charter). The Charter sets out a development approval process that places clear limits on what costs, fees and charges the City of Winnipeg may impose on new developments. The Hemson Report does not address the question of whether the City of Winnipeg has the authority to impose regulatory charges, levies or fees. In a similar study conducted by Hemson for the City of Saskatoon, Hemson commented that The Charter does not provide the City of Winnipeg the authority to implement development charges. The City itself has previously come to this conclusion. The proposed by-law states its authority is found in the general authority of the City under subsection 6(1) of The City of Winnipeg Charter Act. It does not acknowledge the more specific direction of The Charter under Part 6 - Planning and Development, or subsection 259(1) which is quite specific on the matter. Use of the General Authority when specific authority has been clearly contemplated and subsequently restricted is an unreasonable use of this general authority, and could be considered an attempt to subvert the authority of the Act. The City of Winnipeg has not completed planning at the level of detail necessary to accurately and reliably determine which projects are required because of new development or what costs should be attributed to new development. This lack of rigour and detail undermines the validity of any regulatory scheme. Winnipeg requires detailed and approved plans before it can properly state what infrastructure needs to be built and what should be attributed to new development viii
14 2. Introduction and Background The City of Winnipeg is exploring new mechanisms for funding infrastructure deficits and impacts of growth. In the spring of 2016, the City commissioned a study to identify options, determine development-related costs and revenues, and define a growth financing model and implementation framework. The study, completed by Toronto-based Hemson Consulting (the Hemson Report), was released to the public on September 1, The Hemson Report recommended development charges for residential, office, commercial/retail, institutional and industrial development. On Friday September 16, 2016, the City of Winnipeg put forward a proposed by-law to introduce impact fees on the Executive Policy Committee agenda. If approved, the by-law would come into force January 1, The administrative report that accompanied this item included recommended fees for each type of development. The administrative report also recommends the Chief Financial Officer be provided the authority to determine how the fees collected through this scheme will be used. Mayor Bowman has stated on numerous occasions that growth does not pay for growth and in his February 2016 State of the City address, indicated It s a choice of higher property taxes for all, or higher property prices for some (Keele, 2016). This implies that new development is the only aspect of growth and that new development does not already pay for impacts of these developments. The Winnipeg development community wants to ensure any decisions about growth financing mechanisms are fully informed about the actual revenue and costs of development, and the impact poorly constructed fees will have on future growth and City of Winnipeg revenue. The development community in Winnipeg recognizes their responsibility for the capital costs of the new communities they build, guided by the vision of OurWinnipeg and Complete Communities. This may also include off-site infrastructure where there are measurable impacts from this development. The development community is seeking enhancements to the development agreement parameters and willingly participated in the Ad Hoc Committee established by City Council in December Unfortunately, these meetings were stopped in favour of the above-mentioned study. The development community welcomes the opportunity to return to these discussions. This type of collaborative process is critical to future, sustainable growth in Winnipeg. About UDI / MHBA The Urban Development Institute (UDI) is a national non-profit association representing the development industry across Canada. The Urban Development Institute (Manitoba Division) is the voice of the land development industry in Manitoba. Established in 1962, it was formed to promote: 1
15 Well-planned communities by encouraging the reasonable and unselfish use of land for residential, public, commercial and industrial purposes; Efficiency and a high standard of ethics among persons, firms and corporations engaged in the business of land assembly and development; and Pleasant and efficient relationships between persons, firms, corporations and municipal planning and other governmental authorities and agencies. UDI Manitoba s membership consists of a broad cross section of commercial, industrial and residential developers and associated professionals. The members include development companies and professionals involved in the industry such as engineers, architects, surveyors and planners. UDI s membership nationwide stands at over 1,000 companies, with chapters in British Columbia, Alberta, Manitoba, Ontario, Quebec and the Maritimes. The Manitoba Home Builders Association (MHBA) is a non-profit trade association whose mandate is to provide members, the public and all levels of government with ongoing education and information about the housing industry in our province. As the voice of the residential construction industry in Manitoba since 1937, MHBA is committed to promoting affordability and choice of housing for all Manitobans. They ensure members are always up-to-date on the latest developments, building techniques and government regulations so homebuyers know they re getting the very best in craftsmanship and quality. MHBA is a member of the Canadian Home Builder s Association, the voice of Canada s residential construction industry since 1943, with a membership of over 8,500 companies. Purpose of This Report This report is intended to provide objective, balanced and wellsupported information about development funding and an understanding of the significant risks to our city of a poorly constructed growth financing scheme. This report is intended to provide the decision-makers at the City of Winnipeg and concerned citizens with objective, balanced and well-supported information about development funding and an understanding of the significant risks to our city of a poorly constructed growth financing scheme. It provides information on historical and current development in Winnipeg, including why it is important, how it is planned, and the respective responsibilities of developers and the City of Winnipeg. It includes a review of accepted principles and lessons from other jurisdictions that are critical to effective public policy. The report also includes a recommended path forward, with the development community and the City of Winnipeg working together to ensure sound solutions that truly support the long-term best interests of our city. 2
16 Why It s Important New development expands the number and value of properties, enabling the City to grow its assessment base. This revenue is critical in supporting the services of a modern city. Without new development, the existing tax base must pay higher taxes as the costs of delivering municipal services rise, along with the backlog of needed investments in infrastructure renewal, to meet modern regulatory standards and citizens expectations. New development also provides modern infrastructure and appeal, and is necessary to support and attract population growth. A new home is, for most people, the most significant investment a family will make. Cost is an important consideration to these families. The City itself has acknowledged that new home buyers consider this important financial decision carefully. One of the most important financial decisions a Winnipegger can make is whether to purchase and own a house. For younger individuals, homeownership may be a financial challenge, tying up a larger share of disposable income. For older Winnipeggers, ownership of a home is viewed as an implicit source of income; equity held in reserve that may be liquidated and used as income (City of Winnipeg, 2016) Homebuyers are thus price and value sensitive and can be highly mobile in these decisions. As costs increase in one area, new homebuyers will look to another. In the case of Winnipeg, there are many attractive areas in the Capital Region surrounding the city that provide these alternatives within an easy commute. If new home buyers choose a home outside the city, the new assessment revenue is lost to the city. The private sector makes significant long-term investments that ultimately result in new communities. This includes purchase of the land, engineering and design of new subdivisions, shepherding applications through the comprehensive processes of approval, and building the actual infrastructure to service the subdivision. These investments are often carried for many years before revenue is earned from the sale of serviced lots. The developer must consider the risks associated with how long the process will take, and whether the lots will sell quickly at the price needed to warrant the investment. If this does not appear to be the case, the investment will be deferred until market conditions improve, or will be moved to where conditions are more favourable. Given the length of time for a new development, these decisions could result in growth being delayed for many years. Municipal policies that unreasonably increase the regulatory cost burden will slow growth and reduce the amount of new assessment revenue available to the city. Housing starts are a key economic indicator and this may have a snowball effect in other investment decisions, further slowing growth. 3
17 Existing taxpayers will need to pay more as a result. The development community supports a fair, transparent, accountable development framework that will enable growth and new revenue. This requires careful consideration. A long term public policy solution that enables growth and new revenue requires careful consideration. 3. Context State of Winnipeg Infrastructure In the 1990 s, a lack of growth in the city and decisions to spend money on operations instead of capital led to a serious infrastructure deficit. Possible funding that could have been used for capital was used to balance the operating budget. With the debt being paid down, the freed up interest payments were used to fund operations instead of increasing capital spending. The increased GST exemption was [also] used to fund operations (City of Winnipeg, 2009). Past decisions to divert funds from infrastructure investment have led to current deficits. In 2009, the City estimated that the added investment required to maintain [infrastructure assets] at appropriate service levels and in a good state of repair was $3.8 billion for existing infrastructure, and $3.6 billion for new strategic infrastructure. For both types of infrastructure, approximately half was to maintain at current (2008) condition, and half was to raise the average condition to appropriate asset management condition (City of Winnipeg, 2009). By definition, using the criteria of who benefits, all Winnipeg property owners should be contributing. A significant amount of the investment identified as strategic new infrastructure is catch up needed to service the City as it exists today. For example, over 40% of new strategic infrastructure was identified as related to regional roads, a longstanding problem -- all of the traffic typically handled by [a] fourth level of streets in the road hierarchy in other cities is handled by the arterial street system in Winnipeg. Despite relatively modest population growth, this has resulted in ever 4


18 increasing pressure on the arterial street system by both commuters and commercial development over the past 30 years Sustainable Transportation (City of Winnipeg, 2011) Bringing wastewater treatment plants up to modern standards is also included in new infrastructure. The City has previously stated these treatment plants had existing, sufficient capacity to service not only growth in the city, but also in neighbouring municipalities. While there are investments that may be reasonably attributed to growth, the level of planning detail necessary to understand the purpose of an investment, the relative demand from existing and new growth, the associated commitment to proceed, and timing of the investment is not in place to fairly attribute infrastructure costs to new growth. City of Winnipeg Financial Situation The 2016 Budget Highlights compare property tax changes in Winnipeg with a number of other cities. The chart, as shown below, indicates that the City of Winnipeg increased property taxes at a much lower level than comparative cities, totalling only 6.7% from 1999 to Figure 1 Property Tax Changes in Cities (City of Winnipeg, 2016). According to the City s financial statements, combined revenue from taxation, service and regulatory fees have increased by 34.5% over the past 9 years. 5
19 Revenue from taxation, service and regulatory fees increased by 34.5% between 2007 and 2015 Figure 2 City of Winnipeg Taxation, Service & Regulatory Revenue, Taxation, Service & Regulatory Revenue 1,400,000 1,200,000 1,000, , , , , Taxation Services and Regulatory Revenue Source: City of Winnipeg Annual Financial Reports A comparison of revenue per capita indicates that Winnipeg collects significantly less tax revenue per capita than Edmonton and Hamilton. Fees and charges are higher in Winnipeg than Hamilton. Edmonton collects the highest per capita amount of both tax and fees. Mississauga is lower than all compared cities, and may be influenced by its position within the Greater Toronto Area. Figure 3 Per Capita Revenue Comparison Per Capita Revenues Comparison by Category $3,500 $3,000 $262 $137 $309 $2,500 $2,000 $1,500 $1,000 $500 $- $698 $245 $1,410 $519 $686 $760 $409 $1,539 $1,510 $39 $303 $919 $549 Winnipeg Edmonton Hamilton Mississauga 2015 Taxes Fees and Charges Government Grants and Transfers Interest and Other Revenue 6


20 Revenue from all sources has resulted in an annual operating surplus, and an increasing accumulated surplus as shown in the charts below. Figure 4 City of Winnipeg Revenue and Expenses Figure 5 City of Winnipeg Accumulated Surplus Source: City of Winnipeg 2015 Annual Financial Report The City s 2016 Community Trends and Performance Report illustrated capital spending at $393 per capita in Winnipeg based on the 2014 multi-year budget to show a low level of investment compared to other cities. This was the information used by Hemson as part of its argument about the lack of spending on infrastructure. Due to timing and financing methods, the illustration did not fully account for all capital investments. According to the city s financial statements, actual 7
21 annual capital additions during the year averaged $744 per capita from 2010 to 2015, as illustrated below. Figure 6 City of Winnipeg Capital Investment $700,000 $600,000 $500,000 $400,000 $300,000 $200,000 $100,000 $- City of Winnipeg Capital Investment $949 $778 $777 $717 $741 $579 $498 $501 $499 $405 $246 $256 $281 $213 $ $1,000 $900 $800 $700 $600 $500 $400 $300 $200 $100 $- Capital Additions during the year (000's) Capital $ per capita A comparison to other similar sized cities shows that Winnipeg s investment since 2012 is relatively similar to Hamilton and higher than Mississauga. Edmonton shows significantly higher than the other three. Figure 7 Capital Spending Per Capita Comparison $1,600 $1,400 Capital $ per capita Comparison $1,200 $1,000 $800 $600 $400 Winnipeg Edmonton Hamilton Mississauga $200 $
22 Capital reserves in Winnipeg have also steadily increased since Figure 8 City of Winnipeg Capital Reserve, City of Winnipeg Capital Reserve (000's) 160, , , ,000 80, ,359 89,887 74,930 98,329 97, , , , , ,829 60,000 40,000 20, Source: City of Winnipeg 2007, 2008, 2013, 2015 Annual Financial Reports In spite of balanced budgets and increasing reserves, the City is on an active search for alternative sources of revenue. There is a growing gap between revenues and spending to support the services that Winnipeggers need. We have a growing structural operating deficit and not enough revenue to cover current expenditure levels. We need a new funding model. We need new, stable sources of revenue -Mayor Bowman (City of Winnipeg, 2016) The City has historically taken funds collected for one purpose and used them for another. In the 90 s, this led, in part, to the infrastructure deficit situation. There is concern this practice will continue with funds collected for investments in new infrastructure. In April 2016, City Council approved increases to water and sewer rates, but re-directed $32 million of the revenue to a general reserve in spite of massive upgrades underway at the City s four water treatment plants. (CBCNews, 2016). The Minister of Conservation and Water Stewardship objected and wanted to see Winnipeg refer the planned rate hike to the Public Utilities Board to provide good professional analysis on whether taking a dividend payment from water revenue is appropriate. While the PUB regulates the rates charged by all water and sewer utilities outside Winnipeg, City Council has sole authority for utility rates in Winnipeg. According to the PUB, this is not in the public interest. After hearings in December 2011 to see how the City of Winnipeg handles its 9
23 water and sewer utilities, the PUB found the practice of cross subsidizing to be a hidden tax. The PUB further found that: Winnipeg's water and sewer utilities are in excellent financial health with combined surpluses of $1.6 billion as of December 31, 2010 The money could be used to significantly accelerate the removal of existing infrastructure deficits, including the separation of combined sewers (to reduce or eliminate raw sewage discharges into rivers) if such monies were kept and used in the two utilities The Board is of the view that it would be in the public interest for the Public Utilities Board to regulate the rates charged by these utilities." (Manitoba Public Utilities Board, 2012). A number of projects for the water and sewer utility are included in the costs to be charged to new development, even though another funding method exists, to which new homeowners and commercial properties also contribute. The Mayor campaigned on finding alternative revenues and has actively lobbied the province for a greater share of the PST (Kives, 2014). Other lucrative opportunities have been rejected, such as ending the generous tax break enjoyed by MTS for its landlines that has been the same flat rate for more than four decades, even when given the opportunity with a sale to Bell (Annable, 2016). The proposed target for alternative revenues in the 2017 budget is now families investing in new homes. We are either looking at higher property taxes for everyone, or higher property values for some that choose to build and grow Mayor Brian Bowman (Taylor, 2016). Creating an unfair burden on those that choose to build and grow the city will dampen growth. Without the new, annual assessment revenue that comes with new growth, there will need to be higher property taxes for everyone. 10

24 Historic and Projected Growth Population Determining realistic projections for population growth in Winnipeg is a key factor in identifying the volume and type of growth. The City of Winnipeg created the 2016 City of Winnipeg Population, Housing and Economic Forecast to support planning for the city. This report includes information based on the Census Metropolitan Area (CMA). The CMA includes the City of Winnipeg and neighboring municipalities where 50% or more of the labour force works in the core city. There are eleven (11) municipalities included in Winnipeg s CMA. By definition, at least half the population in the CMA outside of Winnipeg pay taxes in their home municipalities and use City of Winnipeg infrastructure and amenities. Figure 9 Winnipeg Census Metropolitan Area (CMA) Population growth in the surrounding municipalities is two times the rate inside the city. This forecast reports the city of Winnipeg grew at an average annual rate of 0.86% from 2001 to The CMA outside of Winnipeg grew at 1.78% over the same period. The forecast to 2040 shows a similar trend where growth in the areas surrounding Winnipeg (77%) is expected to be more than two times the rate of growth inside the City (28%). Following a short spike where growth was at or over 1.4% from , the annual population growth rate is expected to return to more normal historical rates of near or less than one per cent. Figure 10 Annual Population Growth Rate 11

25 Figure 11 Sources of Migration International immigration is the major contributor to population growth in Winnipeg. Government policy determines the level of immigration. Manitoba s Provincial Nominee Program supports and promotes the introduction of business owners and skilled workers to the province. Federal government policy has recently changed, allowing increases in the family and refugee categories. Although it is expected that Winnipeg will benefit from continued international migration, caution in this optimism is warranted. While Winnipeg was the seventh largest city in Canada in 2006, it ranked 22 nd in attractiveness to Migrants in the Conference Board of Canada s benchmarking report (Cappe, 2010). Winnipeg scored a C grade in all categories, with the exception of a B for environment, which considers air quality, average temperature, and driving distance for commuters, among other factors. Relative to housing, For all migrants the Economy category appeared to matter the most in the decision to locate Winnipeg ranked 21 st, behind many smaller cities such as Regina, Saskatoon, Sudbury and St. John s. The report indicates factors considered in housing decisions included the percentage of household income spent on mortgages or rent, and the percentage of homes in need of major repair. For all migrants, the Economy category appeared to matter the most in the decision to locate, followed by society and environment. Factors related to the economy category included GDP per capita, employment growth, unemployment, disposable income per capita, knowledge employment, and proportion of the workforce commuting outside the City for work. Winnipeg ranked 31 st on this factor (Cappe, 2010). Employment The service sector is the primary employer in the Winnipeg CMA. In 2015, 51% of employment was in commercial services; 30% in public administration and non-commercial services (Conference Board of Canada, 2016). Approximately 19% of employment was in the goods producing sectors of manufacturing, construction, primary and utilities. 12

26 Figure 12 Winnipeg CMA Employment Winnipeg CMA Employment, 2015 Public administration 6% Manufacturing 10% Non-commercial services 24% Construction 7% Primary & Utilities 2% Transportation and warehousing 6% Information & Cultural Industries 2% Personal services 14% Business services 8% Wholesale and retail trade 15% Finance, insurance, real estate 6% Employment growth is projected at 1.1 per cent for 2016, down from a 20 year high of 3.4% in The employment outlook indicates growth will continue to be highest in the service sectors over the next five years (Conference Board of Canada, 2016). Figure 13 Employment Outlook


27 Housing Market The City s forecast also indicates an average of 4,000 new housing starts per year (City of Winnipeg, 2016). This level of housing starts has only been seen in two out of last 20 years. Figure 14 Population Growth and Housing Starts For several years, Winnipeg s rental vacancy rate remained near or below 1%, creating a buildup of demand. In 2012 Conference Board forecasts suggested a much higher future demand for multi-unit housing than in the past. Builders responded, sparking a significant jump in multi-unit construction for the rental universe. Rental vacancy rates have now increased to 3% and are expected to continue to rise as new units under construction are introduced to the market. Increasing vacancy rates mean rents will not experience the same upward pressure as in the recent past (CMHC, Spring 2016). Figure 15 Rental Vacancy Rate 14
 made up the majority of unsold units. By contrast, single detached inventories are down.")

28 According to CMHC s Housing Market Assessment, complete and unsold multi-family units remain elevated and are at the threshold of overbuilding (CMHC, Q2 2016). Apartment units intended for the ownership market (condominiums) made up the majority of unsold units. By contrast, single detached inventories are down. Figure 16 Complete and Unsold Housing Inventory Figure 17 Evidence of Problematic Conditions (CMHC, Q2 2016) The CMHC Spring Housing Market Outlook for Winnipeg CMA forecasts total housing starts below the levels of the last three years, particularly in multi-units. For the entire CMA, the forecast for housing starts is 3,600 compared to 4,200 in At recent rates, about 20% of these starts would be in the other municipalities in the CMA. Developers in Winnipeg confirm market conditions have meant lot prices have stayed flat for two or more years, and some have needed to offer incentives to encourage lot sales. New home construction and development is expected to be vulnerable to further increases in cost. Commercial and Industrial Market Commercial real estate in Winnipeg is approximately 75% industrial, with the balance split approximately equally between retail and office (The Johnson Report, 2016). 15
29 Figure 18 Commercial Real Estate Inventory, 2015 Commercial Real Estate Inventory (ft 2 ) Retail, 20,244,415 Office, 18,351,672 Industrial, 78,665,476 Office vacancy has been increasing over the last 10 years from 5.7% to 7.5%, with average annual growth of 189,546 ft 2 (17,616 m 2), or about one per cent. Leasing activity has been historically weak, with no new head offices attracted to Winnipeg. The highest, and steadily increasing vacancy (8.4%) is seen downtown. Industrial vacancy is a good indicator of the health of the industrial market and the overall health of the city s commerce. The market has been relatively stable in the 1.5 to 3 million ft 2 vacancy range for more than a decade. Vacancy was at a 10 year low in 2009 at 1.5 million ft 2, and increased to about 2.5 million ft 2 in 2014, with a small reduction in Total industrial inventory is currently 78.7 million ft 2. Average annual growth from 2005 to 2015 was 277,555 ft 2 (25,795 m 2 ) or 0.3 per cent. Winnipeg s current retail inventory consists of enclosed malls, shopping centres, strip centres, storefronts and restaurants. Over 3 million ft 2 have been added to the inventory since the end of 2000, mostly power centre and strip mall development. The closing of Target Canada has left two locations remaining vacant, accounting for nearly 1/5 th of the total market vacancy. Average annual growth from has been 240,850 ft 2 (22,384 m 2) or 1.2 per cent (The Johnson Report, 2016). 16
 of the Charter provides City Council with the authority to pass bylaws respecting construction and occupancy of buildings.")

30 4. Current Planning Environment Municipal Authority The City of Winnipeg derives its authority from The City of Winnipeg Charter Act. Subsection 150(a) of the Charter provides City Council with the authority to pass bylaws respecting construction and occupancy of buildings. Subsection 174(d) (vii) enables council to establish a system for licencing, permits or approvals and procedures for dealing with applications, including the method of calculating charges. Fees and charges for development applications, permits, and related matters are imposed by the Planning, Development and Building Fees By-Law No. 77/2009 (the Planning Fees By-law ) and the Fees and Charges By-law No. 196/2008. Under Part 6 - Planning and Development, the City has the authority to require development agreements and may establish a subdivision standards by-law that includes criteria and requirements for layout of streets, transportation, public works, utilities, sites for schools, parks and recreation areas, dedication of land to the City, and environmental considerations. Under subsection 259(1)(i) these agreements may include requirements for the owner to pay to the city some or all of the cost of existing or future public works, including the cost of any related environmental, engineering or other studies or reports, which benefit or will benefit the proposed subdivision. This is the authority that is used by the city to require the owner to pay for, or more typically construct, all on-site infrastructure (streets, The City of Winnipeg Charter Act specifies costs that may be charged for a development. It does not include a broad-based charge. In other provinces where the authority is intended, it is clearly given. sidewalks, active transportation, streetlights, water and sewer, etc. within the bounds of the subdivision), bordering streets, and some traffic interchanges that are off site but nearby. The City of Winnipeg has previously stated that it does not have the legal authority to establish a standard charge on new development for an expansive set of future infrastructure investments, much of which may be quite distant and unrelated to the development, except in the broadest sense of an overall benefit to the entire city. In other provinces where such authority is intended, it is clearly given. 17
31 Conditions for plans of subdivision 259(1) Council may, by by-law, provide that approval of proposed plans of subdivision be made subject to one or more of the following conditions: (a) that at least 10% of the land be conveyed to the city for purposes of the city other than streets, without consideration or for nominal consideration; (b) that instead of setting the condition under clause (a), money be paid to the city for the purchase of land for purposes of the city other than streets; (c) that all outstanding taxes, including local improvement taxes, be paid; (d) that streets within the proposed subdivision be dedicated as council considers necessary; (e) that where land in the proposed subdivision abuts on an existing street, land in the proposed subdivision, other than land occupied by an existing building, be conveyed for the purposes of making the street conform with any provision respecting streets of a by-law passed under section 255 (subdivision standards by-law); (f) that the owner of land within a proposed subdivision enter into one or more agreements with the city respecting such matters as council considers advisable or necessary, which agreements may include, without limiting the generality of the foregoing, requirements that (i) the owner pay to the city some or all of the cost of existing or future public works, including the cost of any related environmental, engineering or other studies or reports, which benefit or will benefit the proposed subdivision, (ii) the owner construct or pay for all or part of the capacity of the public works in excess of the capacity required for the proposed subdivision, and (iii) the city reimburses the owner for the cost, including interest at such rate as is agreed on, of the excess capacity referred to in subclause (ii) when money is recovered by the city from owners of other lands benefited by the excess capacity or at some earlier time. The City of Winnipeg Charter Act, A.M. 2002, c.39 Other municipalities in Manitoba have different authority. Under The Planning Act 143(1), a council may, by by-law, set the levies to be paid by applicants to compensate the municipality for the capital costs specified in the by-law that may be incurred by the subdivision of land. The Planning Act does not apply to the City of Winnipeg, with the exception of provincial land use policies. 18
32 Municipal Plans OurWinnipeg OurWinnipeg establishes the City of Winnipeg s vision for the next 25 years. It focuses on three key directions -- a city that works, sustainability and quality of life. These directions are intended to address questions such as how growth and change will be accommodated while making sure the city stays livable, affordable and desirable, and how to maintain and enrich what is valued while finding room for a growing population. The City Building section of the plan speaks to creating complete communities, providing options to accommodate growth and connecting and expanding sustainable transportation and infrastructure networks. Complete Communities Complete Communities is one of the four Direction Strategies supporting OurWinnipeg. Its primary focus is to guide Winnipeg s physical growth and development by introducing a new urban structure. New communities should contribute to the City s balance of residential, commercial, industrial, natural and recreational land uses to ensure economic, social and environmental sustainability (City of Winnipeg, 2011). It states that new development should only be approved when: A full range of municipal services can be provided in an environmentally sound, economical and timely manner There is a reasonable relationship between the supply of land and the projected demand New development is adjacent to, and compatible with, existing development and is designed to minimize the spatial use of land It also states that new communities will increase opportunities to live, work, learn and play in the same neighborhood. This encourages higher residential density in areas adjacent to commercial and employment lands, especially where the area is served by transit, services and other community amenities. It encourages new communities to include a mixture of residential, commercial, employment and institutional uses that are supported by multiple transportation options for residents and greater choices in housing type, density, style and tenure. Parks at the neighborhood and community level must address both active and passive requirements for recreation, sport and leisure, and promote connectivity and walkability between park sites and neighborhood features. New communities will also be developed with complete streets enabling safe and convenient spaces for pedestrians, bicyclists, public transit ridership and motorists to promote physical activity, health and active transportation. As shown on the maps below, recent communities are adjacent to and connected with the established areas of the City. 19

33 Figure 19 Recent Communities Source: Planning Ed. Land Use Planning: The Big Picture. June 4, City of Winnipeg New communities, as shown below, represent a relatively small amount of land area, also contiguous to existing developed areas. Figure 20 New Communities (City of Winnipeg, 2011) 20
34 Urban sprawl is an uninformed characterization of recent development in Winnipeg. Waverley West and Sage Creek are clear examples of modern, complete communities designed with Smart Growth principles Urban sprawl has been used by some as a critical description of recent development in Winnipeg. This is not an informed characterization. Urban sprawl generally includes low density, homogenous, single use developments disconnected from the existing urban area. Smart Growth, in contrast includes mixed land uses, a range of housing opportunities and choice, walkable neighbourhoods, and distinctive, attractive communities with a strong sense of place. These Smart Growth principles are quickly evident in the Complete Communities strategy. These standards have been incorporated into the City s review of development proposals even before the adoption of this directional strategy. Waverley West and Sage Creek are clear examples of modern, complete communities designed with Smart Growth principles. The chart below illustrates area densities for the established areas of the city, with comparison to Sage Creek, which at completion would host a population of approximately 17,800 people in 7,533 housing units (both single and multi-family, at 2.36 persons per household). While the other community data is from 2006 (latest published by the City of Winnipeg) (City of Winnipeg, 2016) the overall pattern is expected to remain. Figure 21 Density of Areas of Winnipeg Area Density (People/km 2) Sage Creek Downtown Point Douglas River Heights River East Inkster Seven Oaks Transcona St. Boniface St. James-Assiniboia St. Vital Fort Garry Assiniboine South


35 The Sage Creek Masterplan below illustrates this higher density, with a housing mix that includes a range of apartments, townhomes and single family homes; neighbourhood commercial and mixed use, and modern standards for active transportation, storm water management, and overall design. Neighbourhood commercial services include grocery, restaurants, gas station, convenience stores, banks, insurance, pharmacy, personal services, retail, etc. Figure 22 Sage Creek Master Plan Figure 23 Sage Creek Medium Density Homes 22
36 Urban Sprawl vs Smart Growth (CaRDI, 2016) While no single definition has been universally accepted, there is some agreement on defining characteristics of sprawl. These include, but are not limited to (CaRDI, 2016): the low density of population settlement patterns the increasing spread, or de-concentration over time, of urbanized development into formerly rural areas the pattern of overall settlement which evolves from a compact gradient around a center to an irregular, discontinuous, and dispersed pattern with multiple centers the separation and distance between residential, commercial, and other land uses the form and design of buildings and their neighborhood contexts which tend to be single story, homogeneous, and support only single use (e.g., single family residential) These have been simplified into four major factors in measuring sprawl: development density, land use mix, activity centering (proportion of people and businesses in close proximity) and street network accessibility. Smart Growth has been advocated as an antidote to the undesirable impacts of sprawl. Ten common Smart Growth Principles have been identified by the national Smart Growth Network (Smart Growth Network, 2016) as: 1. Mix land uses 2. Take advantage of compact building design 3. Create a range of housing opportunities and choices 4. Create walkable neighborhoods 5. Foster distinctive, attractive communities with a strong sense of place 6. Preserve open space, farmland, natural beauty, and critical environmental areas 7. Strengthen and direct development towards existing communities 8. Provide a variety of transportation choices 9. Make development decisions predictable, fair, and cost effective 10. Encourage community and stakeholder collaboration in development decisions The spread of development of land to suburban and rural areas outside of an urban centre is an important characterization of sprawl that arguably is happening with the extent of development in the CMA outside of Winnipeg. This would be further encouraged by adding costs within the urban area. 23
37 Sustainable Transportation One of the four directional strategies of OurWinnipeg, Sustainable Transportation establishes, at a high level, how transportation will be provided in Winnipeg for the next 25 years. This strategy forms the policy framework for the Transportation Master Plan (TMP). The Sustainable Transportation strategy anticipated that the TMP will include a step-by-step action plan for implementing the public transit, active transportation, goods movement and other transportation initiatives for the near term (5 year), mid-term (10 year) and long-term (25 year) planning horizons. It was to outline the specific timing, responsibilities, operational/coordination issues between agencies, cost to implement, policy/bylaw requirements and interactions with other activities (City of Winnipeg, 2011). The schedule of road network improvements does not have the implementation detail contemplated in the Sustainable Transportation Strategy The Transportation Master Plan was published in October It describes its purposes as setting out a strategic vision for transportation in Winnipeg, and to provide an updated and expanded set of policies to guide future transportation and land development decisions. It clarifies that it is a long term, strategic planning document, not intended to address site-specific or corridor-specific issues (City of Winnipeg, 2011). A schedule of road network improvements is included in the TMP, intended to address existing network constraints and recurrent congestion at river and railway crossings and in the downtown during peak periods. It was noted that all figures are preliminary estimates only. This schedule does not have the implementation detail contemplated in the Sustainable Transportation Strategy. It does not reference transportation studies of the load created by new developments in any given area versus existing demand, or to what extent cost is driven by the simple need to modernize infrastructure designed under old standards as it is rehabilitated or replaced. It does not identify the street classification to enable understanding of the economic value (and therefore attribution of benefit and fair funding contributions) associated with goods movement, or need driven by ex-urban demand on regional routes. It does not have timelines beyond short, medium and long term, implementation plans or coordination with other infrastructure. 24

38 Other Infrastructure Plans There is a significant gap in planning for all types of infrastructure in Winnipeg. The City has not published strategic or detailed plans for new water and wastewater infrastructure. While there are some policies that identify principles for facility types and service levels, the City has not published a libraries, recreation or protective services plan that identifies the specific investments required, timing or costs beyond the 2016 capital plan. The level of detail to responsibly determine costs associated with future development to 2041 is not at the standard seen in other communities that have implemented development cost charges. There is a significant gap in planning for all types of infrastructure in Winnipeg City of Winnipeg Development Process New developments in Winnipeg are subject to extensive approval processes. The City of Winnipeg Charter Act provides specific requirements related to the Plan Winnipeg By-Law (OurWinnipeg), Secondary Plans (Local Area Plans), Development Applications, and Decision Making processes. A secondary or local area plan formally establishes and documents a vision for a specific geography, and policy related to the respective land use, urban form, transportation, parks, and open spaces. Subdivision and rezoning applications are reviewed against OurWinnipeg, Complete Communities, any applicable secondary plans, and any other relevant plan or policy. Subdivisions that require a zoning change or create new public streets require Council approval, with a public hearing at a Community Committee. Figure 24 City of Winnipeg Secondary Plans The professional planning staff of the Planning and Property Development department administer the City s plans, oversee development of new plans and policies, and administer development application processes. The department provides reports and recommendations to inform Council decision making. It does not have independent decision authority. An application initiates the development approval process. Applications for planning new communities must include, at a minimum (City of Winnipeg, 2011): 25
39 Definition of the study area Public engagement to identify the local character and community needs Assessment of parks, community facilities and service capacities Assessment of infrastructure condition and capacities Vision and sustainability principles Locations for intensification, transition and conservation Land use diversity and development densities Multi-modal transportation infrastructure, locations and connectivity Development phasing, staging and public investment Cultural Heritage, including buildings, sites, archaeological or other issues or features as applicable Implementation Other policies or context specific guidelines as deemed appropriate Cost / benefit analysis Applicants will often hold an open house prior to submitting the application for interested members of the public. The City works with the applicant to ensure it is aligned with the Complete Communities vision and other City policies. Public hearings are a statutory requirement of the decision-making process. These hearings are carried out by the City before a Committee of Council. Open houses, while not legally required, are often held by the applicant to inform and consult with the local community that may be affected by the proposed development. 26
40 Through the process there are a variety of fees that must be paid to the city, ranging from $550 for plan reviews by staff and the Council Committee to $35,000 for a new secondary plan. Figure 25 Waverley West Approval Process Waverley West Approval Process Amendments to Plan Winnipeg - Multiple studies on supply and demand, transportation review, engineering studies - Extensive consultations with City of Winnipeg Planning & Property Development, Public Works, Water and Waste - Cost-benefit study - Public consultation - Hearing before Executive Policy Committee - Ministerial approval Regional Secondary Plan covering multiple developments within a larger area - Public consultations, including a Design Charette, meetings with Neighbourhood Advisory Groups, Open Houses, Workshops - Hearing before Community Committee - By-Law passed by Council to approve the Plan. Secondary Plans - Seven neighbourhood plans - Extensive consultations with City of Winnipeg - Consultations with Neighbourhood Advisory Groups and Open Houses - Community Committee Hearing Subdivision and Rezoning processes, including public hearings Negotiations with City and Province on land transfers, environmental licenses Development Agreement Parameters Section 259(1) (f) of The Charter provides that the City may require an owner seeking approval of a subdivision to enter into a development agreement. The City of Winnipeg and the development community negotiated Development Agreement Parameters. These parameters, adopted by City Council on July 17, 2002, serve as guidelines for conditions of approval. They are intended to convey the general policy of the City toward new and infill developments. The adoption/ amendment of these Parameters is determined by a majority vote of the City Council. The primary purpose of these parameters are to ensure that: 27
41 All developers pay their equitable share of costs associated with development (equity and fairness) Development agreement obligations are consistent across all developments (consistency and predictability) Development complies with City of Winnipeg s construction specifications (quality and standards) The existing Development Agreement Parameters address land acquisition and dedication, services and improvements, maintenance, compliance and general administration and finance. Developers are required to transfer land to the City for various purposes and to construct various types of municipal services that subsequently become part of the City s infrastructure. With few exceptions these parameters are negotiated based on the principle of cost attributed to benefit With few exceptions, these parameters are negotiated based on the principle of cost attributed to benefit or impact. The question of whether the entire city, areas of the city or the individual homeowner primarily benefits from the development is at the crux of who should pay, and underpins the identification of the City of Winnipeg and development community responsibilities for growth and development. Under the current scheme, the developer builds and pays for the infrastructure costs within the boundaries of the development (internal costs) as well as the required infrastructure to connect the subdivision to City services. The developer pays directly for construction of all streets, sidewalks, active transportation routes, water and sewer connections, all land drainage, street lights, street signs, boulevards, and landscaping, and 50% of arterial roads. Under the Charter, the developer is required to dedicate 10% of the land to the city for purposes other than streets (typically used for parks / green space) or cash in lieu of this land. The developer is also required to dedicate (give over) to the city the streets, rights of way, walkways, frontage roads, lane rights of way, easements, rivers and creeks, and storm water retention basins. The City may also require the developer to pay for or construct off-site public works that are impacted by (benefit) the new development. Developers pay for access to major arterials and expressways by installing all the intersection improvements including extra lanes, traffic lights, landscaping and drainage. Trunk sewer rates are paid for land drainage. This is an area charge portioned on an acreage basis that every developer pays for their portion in a precinct. This is no different than a developer charge for land drainage in Springfield, East St. Paul, Toronto or Calgary. In many cases, developers pay for one lane of the roadway in each direction where it fronts their property. Developers also contribute a significant amount of land for the right-of-ways where these roadways are installed. In other jurisdictions, the developers are credited for the land used for City purposes at market value. This is significantly greater than the value used by the City of Winnipeg. Some examples of the significant contributions of developers to off-site infrastructure: 28
42 Twinning Highway 59 south from Bishop Grandin Pavement and right-of-way for Bishop Grandin from Highway 59 east to the city border Cost of one lane of existing Bishop Grandin along the full north frontage Cost of one lane of existing Waverley from Bishop Grandin to Bison Coast of intersection improvements along existing Waverley Front ending for the upgrading and twinning of Waverley from Bison south to the southern edge of South Pointe Contributions to lanes of Kenaston from Bishop to Waverley Full cost of all intersections on Kenaston from Bishop to but not including the Perimeter Contribution of land for the right-of-ways A summary of the existing Development Agreement Parameters is included in Appendix B. Once the services have been installed, the developer is responsible for the maintenance/ warranty of the works for a defined length of time to ensure they meet the City s specifications before they become the responsibility of the City. The existing development agreement parameters require that developers maintain and warranty, for a period of one year, water mains, land drainage systems, storm water impoundments, wastewater sewer systems, street and lane pavements, sidewalks and walkways, lot line connections, structures and sodding of public and private-owned lands. The Development Agreement Parameters also guide consideration of when the city will reimburse a developer that pays or installs services that have excess capacity or benefit adjacent private lands, an existing or future development. The City and the development community had agreed to review and update the Development Agreement Parameters regarding off-site infrastructure These parameters have not been updated in almost 15 years. In December 2015, the City and the development community agreed to discuss improvements to the Development Agreement Parameters. A schedule of meetings was anticipated beginning in the winter of The development community had identified a number of challenges, including a lack of consistency in developer obligations from one agreement to the other, particularly regarding off-site obligations. To enable more clarity, certainty and consistency, developers had identified for discussion: A more expansive road classification system beyond the existing regional and local system, and formulas for developers responsibilities for the various classes of roadways, associated intersections, and traffic impact. 29
43 Land dedication, landscaping, recreation and community facility contributions (libraries, police, fire) and formulas Sewer and water model Transit, including planning and responsibility of new growth, revenue models and contributions from other sources Storm water management Legacy challenges obsolete infrastructure, impact of lack of planning. Meetings between the Committee of Council, city planners and developers to discuss these issues were deferred by the City as it elected instead to undertake a study into alternative financing mechanisms. UDI and MHBA had offered to contribute to the cost and collaborate with the City on such a study. The City declined, choosing instead to pursue the study independently through the Finance Department, without industry engagement. UDI and MHBA would welcome the opportunity to return to discussions, with all relevant city departments, of how costs of development should be funded through the Development Agreement Parameters process. 5. Value of Development to Winnipeg Where you live, where you work and where you establish and run your business are critically important decisions in people s lives. In addition to individuals and families moving from other provinces or countries, most people make decisions about where they live at three significant points in their lives -- when they leave their parent s home, when they start a family, and when retiring. A thriving, sustainable city focuses on effectively managing the foundation elements of safety, water quality and transportation, developing community facilities and amenities desired by today s population, and promoting sports, cultural and recreational opportunities (Florida, 2008). Perhaps more importantly, progressive municipal governments plan for the type of growth and development that they both need and A thriving, modern city provides the infrastructure and amenities that individuals, families, businesses and visitors want. desire, decades in the future. They also recognize that this type of planning requires true collaboration with business and community leaders including the development community who invest significantly in the long-term growth of a city. 30

44 Economic Impact of Home Construction The home building industry is essential to Manitoba s economic strength and prosperity. In 2014, new home construction in Winnipeg provided 6,200 jobs, one of the largest employers in Winnipeg. These jobs provided $320 million in wages, which translate into purchases across the entire local economy. New home construction represented $940 billion in direct investment in our city, with new home purchases representing the largest single wealth builder for most families (Canadian Home Builders Association, 2014). The construction industry as a whole employs 28,000 people in the Winnipeg CMA (Conference Board of Canada, 2016). New home construction represented $940 billion in direct investment in Winnipeg How New Development Pays for Its Impacts Direct Investment From 2007 to 2015, developers built and turned over $630 million in infrastructure to the city. New communities are built and funded by developers and ultimately paid for by the people who purchase homes or commercial properties in the new communities. Developers purchase the land, initiate the application process, perform related requirements and pay all related fees, plan the subdivisions, perform the engineering, and build the infrastructure to service the communities. From 2007 to 2015, developer in-kind contributions to capital as reported by the City amounted to over $630 million dollars (City of Winnipeg, ). Developers may carry their investment in the land for many years before generating revenue through lot sales to homebuilders, and are responsible for property taxes during this period. The homebuilder then markets a proposed new home designed for the lot to a new homebuyer. Homes and commercial developments are typically built on-demand, with construction scheduled only after a buyer has signed a purchase agreement. 31


45 Figure 26 Infrastructure Built by Developers, Paid for by New Home and Commercial Property Buyers Assessment Contribution of New Homes Once lots are sold and new homes are constructed, homeowners pay property taxes based on the assessed value of the property. New homes are generally assessed at a higher value than the average home in Winnipeg, and thus contribute a larger share of municipal revenue than the average home. Winnipeg has the 3 rd oldest housing stock of major cities in Canada, which contributes to lower average assessed values. This explains, in part, why average properties taxes in Winnipeg appear low compared to other cities. Assessed values, and thus property taxes, vary significantly by neighbourhood. The average municipal levy per dwelling in Winnipeg was $1,303 in The map below shows neighbourhoods that pay below average taxes in red, about average in yellow, and above average in green (City of Winnipeg; Statistics Canada, 2015). The green areas include much of the recent development. 32
, or 2.2 times the amount paid by the average home.")
46 Figure 27 Municipal levies by neighbourhood Source: 2015 Municipal Assessment Data by Neighbourhood, 2011 Census by Neighbourhood, Building permits Based on the average value of a new single detached home sold in 2013, property taxes and frontage levies were calculated at over $2,900 (Deloitte LLP, 2014), or 2.2 times the amount paid by the average home. According to the City of Winnipeg s Building Permit Statistics, there were 14,631 single family homes built over the ten year period (CMHC, Dec 2014; Aug 2016). Using building permit values grossed up for land values (Winnipeg PPD, 2016) and applying the mill rates of the day, this would result in combined tax revenues of $199,518,000 to the City of Winnipeg to These homes would continue to contribute $33.6 million per year at 2016 mill rates, or about $14.5 million more per year than an equivalent number of average homes. It is important to New single family homes built from have contributed about $200 million in new property tax revenues to the City of Winnipeg note single detached dwellings represent less than half the value (46%) of residential construction. The total value of residential permits was $6.3 billion over this period of time. Non-residential construction permits totalled $12 billion. These homes are further estimated to have generated over $60 million in land transfer taxes to the Province of Manitoba. 33
47 Housing price growth in the new home market has historically been above inflation. New homes can be expected to continue to disproportionally support City revenues into the future. Figure 28 New Housing and Consumer Price Indexes Winnipeg New Housing Price Index (Statistics Canada, 2016) (2007=100) Consumer Price Index (Statistics Canada, 2016) (2002=100) Without surplus contribution from new development, all property owners would need to pay more. Cost Benefit Studies Cost benefit studies are required by the City of Winnipeg as part of the development approval process. These studies ensure that revenues generated from development of new communities will pay for up-front and ongoing costs to the City. The typical approach to these studies is shown below (Deloitte LLP, 2014): Figure 29 Cost Benefit Study Approach Cost benefit studies are required by the City of Winnipeg as part of the development approval process Estimate sources of municipal revenue Residential property taxes (recurring) Frontage levies (recurring) Development permit fees (one time) Building permit fees (one-time) Estimate municipal share of infrastructure costs City contribution towards major infrastructure Maintenance and renewal costs for infrastructure based on an 80 year lifespan and renewal starting in year 50 Impact on capital cost budget Estimate increase in municipal operating costs Departmental expenses to deliver services Police and fire services Impact on Operating Cost Budget Determine net impact Forecast timing of City revenues and expenses Calculate Net Present Value (NPV) of revenues less costs 34
48 Waverley West has been the subject of repeated cost benefit studies. ND Lea conducted an original analysis for MHRC and Ladco in The City administration completed their own Cost Benefit report in 2004 as well. An update was prepared by MMM Group Ltd. with current figures as of December 31, The 2013 update indicated a total of $892.2 million (NPV of about $250 million), meaning that the City would receive net revenues of over $892 million from this development over 80 years, after all capital and operating costs associated with the development have been paid, with infrastructure renewal beginning in year 35. Capital costs included extensions and Waverley West is estimated to provide the City with $892 million more revenue than it will cost, after all capital, operating and maintenance costs. improvements to Waverley, Bison Drive and Kenaston Boulevard, off-site transportation improvements, Fire and Paramedic services, Police, Community Services and a reserve for infrastructure renewal after 50 years. Of important note, Waverley West is built with twinned sewers and all the ratepayers pay the same rates as those with combined sewers. A properly constructed developer cost charge would have to offset for this inequity. That means significantly higher rates for homes in older neighbourhoods. While Waverley West is a larger development, other cost benefits studies have similarly reported net benefits to the City from development of new communities (Deloitte LLP, 2014): Precinct K - $40 million NPV Ridgewood - $54 million NPV Waterford Green - $49 million NPV Precinct T - $10 million NPV 6. Other Jurisdictions Considerations when Comparing Winnipeg to Other Jurisdictions Every municipality has its own unique characteristics, including the provincial legislation and regulatory scheme, physical geography, social and economic environment, extent and condition of existing infrastructure, and growth characteristics. While the general mechanisms to generate revenue are similar, municipalities may employ them in different ways or with different emphasis. There may be different policy considerations or goals that the municipality is trying to achieve. In all cases, understanding what underlies another city s policy, budgets or costs, and how they are affected by timing, reporting and other considerations is important to make a fair comparison. 35
49 Recognized Practices for Attributing Costs of Growth MNP reviewed the practices in British Columbia, Alberta, Saskatchewan and Ontario to understand what may be learned from the experience in these other jurisdictions. While there are some differences in the categories of costs included and the amounts charged, there are common principles that may be found where systems have been established to recover capital costs from new developments. Various labels are used -- development cost charge (BC), off-site levy (AB), development levy (SK) or development charge (ON). Other municipalities in Manitoba also refer to these costs in a variety of ways, including capital levy or dedication fee. Development levy will be the general term used for the purpose of this paper. Planning and Background Study Requirements In all cases, the fundamental premise of a development levy is that costs charged to new development must be related to the development. Determining the amount of the levy begins with a clear understanding of what these costs are, and how they are connected to the development, generally through detailed infrastructure planning. Examples of how this is reflected in other provinces are described below. Alberta Regulation 48/2004 requires that calculation of any levy is to include a description of the specific infrastructure, description of the benefitting areas, supporting technical data and analysis, estimated costs and mechanisms to address cost increases over time. In Calgary, plans that informed development of the off-site levy included (City of Calgary, 2015): Calgary Transportation Plan Route Ahead: A Strategic Plan for Transit in Calgary (30 year Strategic Plan) Investing in Mobility: 10 year Transportation Infrastructure Investment Plan Investing in Communities; 10 Year Community Services & Protective Services Infrastructure Investment Plan Water Infrastructure Investment Plan: 10 Year Water Resources Capital Plan Calgary Recreation Master Plan Year Strategic Plan for Sport Facility Development and Enhancement Calgary Fire Department 30 Year Infrastructure Master Plan Calgary Fire Department Infrastructure Requirement: Proposed Plan for Growth Related Stations Employment Areas Growth and Change Calgary Public Library 2010 Library Master Facility Plan In Saskatchewan a development levy by-law must be based on studies that determine capital costs of municipal servicing and recreational requirements, future land use patterns and development and phasing of public works (Saskatchewan Planning and Development Act, 2007). 36
50 In Ontario, the increase in the need attributable to the anticipated development must be estimated for each service, and costs should be included only to the extent the municipality has indicated it intends to ensure that such an increase in need will be met. There must be a clear understanding of the long-term capital and operating costs of the infrastructure required for the service, and there must be an asset management plan (Ontario Development Charge Act). The BC Development Cost Charge Best Practices Guide identifies sources of data and background documents to compile the program as including a Master Transportation Plan, Master Drainage Plan (or Storm Water Management Plan), Master Sewage Plan, Water Distribution Modeling Reports, and Parks Master Plan, in addition to the Official Community Plan and Financial Plan. Projects included in the DCC program must be included in the Financial Plan (five year budget). For each capital project, a detail sheet should be appended that itemizes all components of the cost estimate such as construction elements as well as planning, engineering, contingencies, etc. (BC Ministry of Community Services, 2005). A suggested format for capital costing is included in Appendix C. The approach to the program should consider the degree of available detail in plans. A long horizon build out program can be very difficult given the uncertainty of timing and future costs. A revolving program that aligns the DCC program with the revolving financial plan allows for greater certainty and clarity. Regardless, the DCC program should be aligned with the term of the financial plan. For example, the full standard and build out of a multiphase 20-year program should not be included within a five-year revolving DCC program only the development to be completed within the five-year period. Meaningful Stakeholder Engagement and Collaboration Methods for involving the public in the decision making process in other provinces included external advisory groups and general provisions for a meaningful public process to obtain input on the proposed changes. Methods implemented include opportunities for municipal departments, local developers and the public to review and contribute their opinions. Alberta Regulation 48/2004 states the calculation of the levy is to be determined in consultation with affected landowners and developers. In completing the review of the Off-Site Levy By-law, the City of Calgary developed a comprehensive stakeholder engagement process including the creation of an internal and external advisory group. The engagement process provided opportunities for stakeholders to contribute to the discussions in multiple platforms, such as workshops, information sessions and meetings. The process included: o External Advisory Group, 14 meetings o Technical Subcommittees, 20 meetings o Internal Working team 32 meetings o Council, bi-monthly o Quarterly Stakeholder Information Sessions o Established Area Initial & Stakeholder Group (Staff/Stakeholder) 6 meetings 37
51 o Established Area Working Group 5 meetings o One on one meetings (staff with developers) 21+ meetings More detail is included in Appendix C. Within the British Columbia Development Cost Charges Best Practices Guidelines, public/stakeholder consultation is one of the guiding principles recognized to establish Development Cost Charges. It is recognized that public and stakeholder input in a meaningful manner makes the DCC bylaw process more effective and accepted by stakeholders. Minimum recommendations for consultation included in the Guidelines include representation from residential and non-residential developers, the public, and local government staff from planning and engineering practices. Stakeholders typically included in the Background Study process within the jurisdictions may include: Local Chapters of the National Home Builders Association Local Urban Development Institute Regional Developers General Public Local Real Estate Association Private land developers Chambers of Commerce Members of the General Public Ontario s review of the development charges system and related legislation involved public and stakeholder consultation over several months, supported by a detailed discussion paper. A Development Charges Working Group of key stakeholders was established to provide advice on complex issues over a further period of approximately nine months. In Regina, consultation for the background study included creation of a Stakeholder Consultation Group in the Background Review Phase, stakeholder surveys and interviews, consultation sessions on issues, draft policies, strategies and incentives. Benefit The concept of those who benefit should pay is reflected in all reviewed jurisdictions. Alberta Regulation 48/2004 section 3(3) states there is a shared responsibility between the municipality and developers for addressing and defining existing and future infrastructure requirements, and all beneficiaries of development are to be given the opportunity to participate in the cost of providing and installing the infrastructure in the municipality on an equitable basis related to the degree of benefit. 38
52 The BC Best Practice Guide identifies the principle of benefitter pays Infrastructure costs should be paid by those who will use and benefit from the installation of such systems. In Ontario, the increase in the need for service must be reduced by the extent to which it would benefit existing development. Limitations on Development Charges Other jurisdictions include some parameters for what may reasonably be attributed to new growth. In Ontario, a capital cost must not include an increase that would result in the level of service exceeding the average level of service provided in the municipality in the 10 year period prior. The increase in the need for service attributable to the anticipated development must further be reduced by the part of that increase that can be met using the municipality s excess capacity, other than excess capacity that the council of the municipality has indicated an intention would be paid for by new development. The Local Government Act of BC specifies that a development cost charge is not payable if the development does not impose new capital cost burdens on the municipality. In BC, the local governments must take into account whether the proposed charges will be excessive in relation to the capital cost of prevailing standards of service, deter development, or discourage the development of reasonably priced housing and reasonably priced serviced land. The Act further stipulates that the charges cannot be excessive in relation to the capital cost of the prevailing standards of service. The Municipal Government Act of Alberta provides that an off-site levy may be used only to pay for new or expanded facilities for water, sanitary sewage, storm sewer, road, or related land requirements. The Planning and Development Act of Saskatchewan provides that development levies may only be imposed where the municipality will incur additional capital costs. The levies must be based on studies that determine the servicing requirements for the area in which the levy is to be applied. Accountability and Transparency Mechanisms Attributing cost and collecting levies is only one part of the necessary system of development levies. Establishing the administrative structures to ensure the funds collected are clearly spent for the purpose which they are collected, returned when warranted, and clear public accountability and reporting are also key elements that are required in Acts, Regulations and Bylaws of other jurisdictions. In every province examined, development charges must be used only for the projects outlined in the program. In most cases this involves segregated special reserves for each purpose, with separate accounting and reporting on their use. Some borrowing may be 39
53 allowed between funds, with interest paid by the municipality. Generally borrowing is not permitted for other uses. The Local Government Act, BC provides that a development cost charge paid to a local government must be deposited by the local government in a separate special development cost charge reserve fund established for each purpose for which the local government imposes the development cost charge. The local government must prepare, consider and make public a report that includes the amount of development cost charges received, the expenditures from reserve funds, the balance of reserves, and any waivers or reductions. The Best Practices Guide elaborates on this matter, clarifying that monies collected shall be used to pay for the capital projects within the DCC program. The guide further recommends that a DCC monitoring and accounting system should be set up such that tracking of projects and the financial status of DCC accounts can be easily be facilitated, including any revisions to forecast amounts for the projects, grants received, amounts designated as credits, etc. The Act provides for the ability to temporarily lend money between DCC reserve funds with interest (for no longer than when needed in the source fund), but should not be used as temporary financing of non-dcc reserves. The Ontario Development Charges Act requires the municipality to establish a separate reserve fund for each service to which the development charge relates. Monies in the reserve fund may only be spent for the capital costs specified in the development. In BC, development levy bylaws must be sent to the Ministry of Community Services to be approved by the Inspector of Municipalities before they may be legally adopted The Municipal Government Act in Alberta specifies that an offsite levy and any accumulated interest must be accounted for separately from other levies, and must be used for the specific purpose for which it is collected. A senior level of oversight on development levies is seen in other provinces as well. The Saskatchewan Planning and Development Act provide that development levy bylaws require ministerial approval. In BC, development levy bylaws must be sent to the Ministry of Community Services to be approved by the Inspector of Municipalities before they may be legally adopted. Capital Region Municipalities A review of the region surrounding Winnipeg was undertaken to further understand the process for implementing development cost charges under The Planning Act (Government of Manitoba, 2005). Under the Manitoba Capital Region Partnership Act, there are 16 municipalities identified within the Manitoba Capital Region, which include: RM of East St. Paul Town of Stonewall RM of Headingley RM of Rosser RM of Tache RM of St. Francis Xavier 40
54 RM of Springfield RM of Cartier RM of West St. Paul RM of Hanover RM of St. Clements RM of Rockwood City of Selkirk RM of Ritchot RM of St. Andrews RM of Macdonald Based on the 2011 Canadian Census, the Capital Region accounts for over two thirds of Manitoba s entire population. Currently, under The Planning Act, a Council may, by by-law, set the levies to be paid by applicants to compensate the municipality for capital costs that may be incurred by the subdivision of land. As well, a council must establish a reserve fund under The Municipal Act into which the levies are to be paid. As development increases surrounding Winnipeg, so does the demand on the region to meet the infrastructure requirement for supporting this population growth. To provide a better understanding of the Capital Region principles for development cost charges, a review of the practices in the 16 communities was undertaken. In some cases, an overall development levy is charged and fees are put into an overall reserve fund to pay for construction of off-site public services. Other municipalities have clearly defined the allocation of the development charges to specific areas such as roads, sewers, drainage, water mains and traffic signals. Contributing Factors for Development Cost Charges in Small Municipalities Manitoba s Capital Region includes large undeveloped areas, many of which are zoned for rural/agricultural development. As land use patterns change and development expands, demands for new infrastructure are placed on smaller municipalities. The municipal tax base is smaller in rural areas. By implementing development cost charges, the payments made by municipalities are applied directly to users or benefiters of the services. Many of these are due to the urgent need for water and sewage treatment facilities. In many cases not only new development pays these levies but existing properties pay them as well through hookup fees or local improvement charges. Fees range from approximately $2,000 to $19,200 per lot in the region, as shown in the table below. 41
55 Figure 30 Capital Region Municipalities Development Charges Capital Region Municipality Total Development Charges RM of Rosser CentrePort (Commercial Land) $ RM of East St. Paul $ Town of Stonewall $ RM of Springfield $ RM of Tache (SFD) $ RM of Tache (Multi) $8 700 RM of St. Clements $9 250 RM of Headingley $7 200 RM of West St. Paul $6 500 RM of St. Francis Xavier $6 300 RM of Rockwood $4 500 RM of St. Andrews $3 500 RM of Hanover $2 500 RM of Cartier $2 000 Table 1 in Appendix C provides more detail on the specific elements for which fees are charged and the respective amounts. The following are general findings from the review of these municipal practices. Development Charges are allocated to specified reserve funds, in addition to the general Capital Levy Reserve Fund in 9 of the 16 jurisdictions Excluding the RM of Rosser s commercial land development charges, development charges are calculated for each subdivided lot. Within the RM of Tache, unique development cost charges, higher than the overall RM of Tache are allocated for the LUD of Lorette and the LUD of Landmark, which are the highest population centers in the RM of Tache. There are provisions made for single family lots and multi-unit dwellings in some jurisdictions. Within the RM of Springfield, development cost charges are assessed at a higher rate in the communities of Oakbank, Dugald, and Anola. Excluding the Capital Reserve Levy, the highest amount of charges assessed are for sanitary sewers/lagoons and water supply/distribution. Excluding the Capital Reserve Levy, the most common charges are related to parks and recreation/active transportation/culture reserve funds. Three (3) of the municipal areas apply a general administration fund to their levy structure. 42
56 Two (2) of the municipal areas apply a planning amount to their fees, which is applied to a reserve for future land use planning and other related studies which may need to be completed. In considering comparisons to charges in these municipalities, it is important to understand the context and perspective of a prospective homeowner. A review of a selection of active listings of to-be or just-built homes indicates that the cost per square foot of homes in Winnipeg averages over 10% higher than comparable homes (3 bedroom/2 bath, under $400,000) in surrounding municipalities. The average selling price for the sample of Winnipeg homes averaged over $16,000 higher for the Winnipeg homes, for a smaller average home. These comparable homes also show that lot sizes in surrounding municipalities are, on average, over 50% larger than in Winnipeg. Detail on these listings is included in Appendix E. Figure 31 Comparison of New Homes Average List Price Average Size Cost per Square Foot Average Lot Size CMA, Outside Winnipeg $340,573 1,416 sf $ ,441 (23 properties) City of Winnipeg (9 properties) (20 properties) $356,896 1,327 sf $ ,818 (5 properties) The total cost of ownership includes taxes. Property taxes in surrounding municipalities average about one-third lower than Winnipeg ($1,266 average). Figure 32: Winnipeg CMA Community Averages Winnipeg CMA Property Tax Comparisons Population Mill Rate Property Taxes on $350,000 Home Change Winnipeg 663, , % $2, Springfield 14,069 12, % 9.38 $1, St. François Xavier 1,240 1, % 9.11 $1, West St. Paul 4,932 4, % 8.50 $1, East St. Paul 9,046 8, % 8.29 $1, St. Clements 10,505 9, % 8.09 $1, Macdonald 6,280 5, % 7.99 $1, Taché 10,284 9, % 7.78 $1, Ritchot 5,478 5, % 7.49 $1, Headingley 3,215 2, % 7.00 $1, Rosser 1,352 1, % 6.74 $1, TOTAL/Average 732, , % 8.47 $1,
57 7. Concerns with the 2016 Growth Study The Determination of Regulatory Fees to Finance Growth: Technical Report dated August 31, 2016 (the Hemson Report) recommends imposition of regulatory fees for development related costs. A key component of this work was the determination of the City s growth related costs and revenues. The services included in the growth financing model included Public Works (yards and active transportation and roads), Parks and Open Spaces, Community Services, Police, Fire and Paramedic Services, Planning, Property and Development, Transit, Water, Wastewater and Storm water and Solid Waste. Their methodology involved the identification of development related capital costs, the determination of those with 10 year, 15 year and 25 year benefitting periods, apportionments of costs to residential and non-residential development, and identification of per square metre rates. The development community has a number of concerns with the data used in this report. Growth Projections Growth projections are a primary assumption underlying both the need for infrastructure and the distribution of costs. While showing a somewhat different pattern, the population projections in the Hemson Report are reasonably consistent, over the long term, with those of the Conference Board of Canada. However, housing growth is projected at close to 4,200 units while the CMHC forecast for is 3,600 for the entire CMA. Projections for average annual growth of non-residential space appears to exceed recent history quite significantly. Figure 33 Growth in Non-Residential Space Average Annual Growth, Non-Residential Space Office Retail Industrial Actual Hemson Projection
58 The Technical Report assumes 34% of employment growth in the City will be industrial over each of the forecast horizons. In most jurisdictions across Canada, industrial employment has tended to fall, or at least decline in share, with growth concentrated in retail, office and institutional sectors. Employment growth does not necessarily translate into growth in space. For example, while the Technical Report indicates industrial employment increased 18% over the previous 10 years, local market reports indicate total industrial space inventory increased by only 4% over the same period (The Johnson Report, Sept 2016). Identification of Costs There are many instances where costs have been inflated significantly beyond budgeted or planned amounts without any explanation. There are also costs included that are questionable in their relationship to future development. These costs in question create an added burden of about $575 million to be charged to future development and represent about 40% of total costs. Projects Not Approved or Listed Above Approved Costs A core concept of a development levy system is that costs should only be charged for projects that the Municipality has committed to implement. The gross project cost of all projects totals $8.1 billion. The 2016 adopted capital budget identified a total capital program of $2.89 billion over six years. The Transportation Master Plan to 2031 anticipates expenditures just over $4.3 billion (some of which are included in the capital budget). The City s Capital Budget does not include any mention of the YMCA or Maples Community Centre projects, which total $121 million. $16.2 million is budgeted for the Waverley West Community Campus that may be related to the South Winnipeg Recreation Centre, which is listed in the Technical Report at $30 million. Many of the listed projects either don t identify the timeframe (marked as various ) or extend beyond the period anticipated in the Capital Budget. In some cases, there may be approval to conduct a feasibility study (e.g., Tyndall Park) or prepare a plan (Kilcona Park) but the actual project itself has not been approved. The Transportation Master Plan (TMP) includes a longer horizon (2031) than the capital budget, while noting that costs are preliminary. There was no commitment to timing for the projects reflected in the TMP beyond short, medium and long term. Further, there are a number of projects listed above the budgeted cost or amounts referenced in plans. For example: The Technical Report includes $330 million in Pedestrian/Bicycle Paths. The current capital budget totals $22.1 million over the period, or $3.68 million per year. The Transportation Master Plan anticipates spending of $4.49 million per year for the period of , or a total of $66.9 million. The amount in the Hemson Report exceeds this amount by close to 500%. 45
.")
59 In many cases costs for projects listed in the Technical Report have been increased by 21-30% from amounts included in the Transportation Master Plan in 2011 dollars. The nonresidential construction cost index has only increased by about 9% since 2011 (Statistics Canada, 2016). There are projects where costs have increased significantly higher than the base increase range from 59% to over 100% of the original estimated costs. Figure 34 Comparison of Roads Project Costing The costs for the Bus-Rapid Transit works in the Technical Report are significantly above what was included in the Transportation Master Plan, and appear to be more similar to the costs estimated for the Light-Rail option. The horizon for these projects in the Technical Report also extends to 2041, longer than the term of the Transportation Master Plan and the other listed Public Works. 46
60 Figure 35 Comparison of Transit Project Costing The Technical Report recommends that the City adopt the development related capital forecast included in the study, essentially dispensing with the approval process for the projects that have not been properly planned or presented for approval. Projects Previously Completed Over $1 billion of listed projects have been completed, some over eight years ago. Two hundred and seven ($207) million of these projects are to be collected from new development. Concerns regarding this set of projects are many. First, this is clearly existing infrastructure, built and financed before any regulatory fee scheme was in place. It is unreasonable to attempt to capture past projects commissioned and in use for several years, as a cost arising for new development. Second, it is not clear what new capacity has been added. For example the largest project, the Disraeli Bridge, did not expand traffic lanes on the bridge, and was clearly described as a rehabilitation project in the value for money review. Thirty-five (35%) of this project has been attributed to new growth. These past projects have also been included as 2017 costs, when costs are actually spread out over a long period. If included at all, the costs in the cash flow analysis should reflect the timing of scheduled payments. Further, costs in the Technical Report should include only future costs related to payback of any outstanding payments or payback. For example, the Winnipeg Police Service Headquarters building payments are spread over a year period (By-Law ; By-Law ). Growth related costs are all included in Further, the inflation that has been applied to the amount for recovery includes these amounts. As debt financing costs tend to be fixed annual payments that do not increase over time (like the 47
61 anticipated cost for a typical project might), these costs should be separated from non-debt costs in the cash flow tables. The Technical Report includes a $300 million Water Treatment Plant project that appears to have been completed and commissioned for use in According to the City s 2009 capital budget: The City issued $100 million in debt in 2008 to finance a portion of the construction costs of the City s new Water Treatment Plant. The Water Treatment Reserve was first depleted as planned to finance a significant portion of the cost for this project. The costs of the project do not appear to have been reduced to account for the share of costs already funded through the existing Reserve, or debt repayments made since the project was completed. The Technical Report includes the West End Water Pollution Control Centre which was completed in 2006, ten years before the proposed scheme to collect regulatory fees. If funds are being collected to pay for works already completed, what will the funds be used for? Lack of Planning and Technical Rigour to Fairly Attribute Costs The lack of detailed, approved plans and supporting studies undermines the city s ability to effectively support growth, and severely impedes the ability to attribute costs in a responsible way The lack of detailed, approved plans and supporting studies undermines the City s ability to effectively support growth, and severely impedes the ability to attribute costs in a responsible way. There is no supporting detail for the listed projects regarding the purpose of the project, or demand created by various populations or economic activity to support the attribution of costs. This lack of technical rigour and transparency does not enable informed consideration and creates concern that amounts may be unfairly apportioned. It also doesn t move the city ahead in its need for more effective and complete planning. The Hemson Report Review of Municipal Growth Financing Mechanisms states that: Service standards are of critical importance. The initial round of developmentrelated capital infrastructure and facilities should be of roughly equal quality and quantity to that provided across the municipality. It would be inequitable 48
62 for higher standards to be required in new areas than are generally available in the existing community. Nowhere in the Technical Report is this analysis shown. This analysis is important to provide the transparency to evaluate whether new developments are being treated equitably under the proposed Regulatory Fees. Appendix 1 to the City s 2015 Community Trends and Performance Report listed numbers projects to be included in the City s capital budget over the next 10 years. Some were shown as renewal projects. Those listed as renewal projects in the 2015 report appear in the Technical Report with a significant growth related element for projects that may be mostly or entirely replacement and renewal of existing roads. The Hemson Report recognizes no Benefits to Existing or Prior Growth for a list of transportation projects ( ) totalling almost $1.4 billion. Most of these projects include road extensions that would travel through and link existing built-up communities that would benefit to some degree from the new links being proposed (e.g., Chief Peguis Trail, Bishop Grandin, Clement Parkway, etc.). Relying on this information and data as the basis for the development of growth charges is flawed as developers and ultimately citizens who are purchasing new homes will be paying for inaccurate and possibly non-existent expenditures. Disregard of Winnipeg s Utility Model The City of Winnipeg delivers services and collects fees for water and wastewater through a utility model. The PUB has previously confirmed that the utility has been effectively funded and has the financial capacity to invest in the major renewal projects it requires. The City has been diverting funds collected by the utility for other uses. $1.5 billion of these projects have been included in the model and over $300 million listed for recovery through development charges. Process After suspending a planned, collaborative process with the development community to review Development Agreement Parameters, the City of Winnipeg retained Hemson Consulting to identify options for funding growth and development, determine development-related costs and revenues, and define the growth-financing model and implementation framework. The development community seeks true collaboration with the City of Winnipeg. Consultation means different things to different people. There are some common principles inherent in credible consultation processes: The involvement of those who may be affected by a decision is actively sought out Individuals have the information they need to meaningfully participate 49
63 Participants trust that their contributions will influence the decision and will know how their input affected the decision. The methods used for consultation must also take into consideration what the City of Winnipeg is trying to achieve through participation, and what degree of inherent commitment is being made in return. This is illustrated below on the IAP2 Spectrum for Public Participation (IAP2): Inform Consult Involve Collaborate Empower Participation Goal To provide the public with balanced and objective information to assist them in understanding the problem, alternatives, opportunities and/or solutions To obtain public feedback on analysis, alternatives and/or decisions To work directly with the public throughout the process to ensure that public concerns and aspirations are consistently understood and considered. To partner with the public in each aspect of the decision including the development of alternatives and the identification of the preferred solution. To place final decisionmaking in the hands of the public. Promise to the Public We will keep you informed We will keep you informed, listen to and acknowledge your concerns and aspirations, and provide feedback on how public input influenced the decision We will work with you to ensure that your concerns and aspirations are directly reflected in the alternatives developed and provide feedback on how public input influenced the decision We will look to you for advice and innovation in formulating solutions and incorporate your advice and recommendations into the decisions to the maximum extent possible. We will implement what you decide. Example Techniques Fact sheets Web sites Open houses Public comment Focus groups Surveys Public meetings Workshops Deliberative polling Citizen advisory committees Consensus building Participatory decision-making Citizen juries Ballots Delegated decision Hemson began its work in late June and issued a working report for discussion Review of Growth Financing Mechanisms on June 15, The development community and other stakeholders were invited to participate in a session with the representatives of Hemson Consulting and City of Winnipeg on July 19, The information within the above-mentioned report was presented at that meeting. 50

64 On August 18, 2016, the City of Winnipeg and Hemson Consulting hosted a second session with these stakeholders to present the results of the growth financing analysis as well as policy options. It was clearly stated the purpose of the session was primarily to explain the methodology. Neither session involved real engagement on the issues or details underlying the study, or how to best support growth in our city. In fact, the Hemson consultant stated that this is being done to you, not with you. The development community is concerned that the process undertaken to arrive at the proposed fees was driven and accelerated by a search for revenue, not an understanding or intention to support effective planning and development in Winnipeg. There has been a clear disregard for unintended consequences that may result in exactly the situation the city is trying to avoid higher taxes for existing citizens. There is insight and cooperation to be gained through meaningful stakeholder engagement that will lead toward better solutions. been conducted, based on incomplete information. Impact Vision for Winnipeg The development community is concerned that the process undertaken to arrive at the proposed fees was driven and accelerated by a search for revenue, not an understanding or intention to support effective planning and development in Winnipeg. Those that invest and build the infrastructure of new developments, and those that ultimately must pay for it (home and commercial property buyers) are directly and immediately impacted by any decision to add a regulatory cost burden on development. The citizens of Winnipeg have a clear vested interest in ensuring the city continues to grow to provide economic and social opportunities for our families. There is insight and cooperation to be gained through meaningful stakeholder engagement that will lead toward better solutions than can be achieved through the incomplete exercise that has The proposed scheme does not take into consideration the policy objectives of OurWinnipeg or Complete Communities. The imposition of a fee will drive behaviour. It may not be the desired behaviour. A per square metre fee will drive smaller properties, limiting the choice and character of the city. Neglecting adaptations to support affordable housing and infill developments to strengthen currently challenged areas of our city will further limit their potential. Burdening multi-family, commercial and industrial development with more costs is contrary to recent decisions to provide money to stimulate this activity. If Council determines it should exempt certain development from a fee, the entire basket of projects must be re-examined. Costs 51
65 included because of these developments must be removed as they will have been unfairly attributed to the remaining new development. Loss of Development to Surrounding Communities After a long period of stagnant growth, immigration has provided a new wave of population growth that is hoped to continue. This new population, however, has choices, and their decisions will be influenced by the value they may gain for their investment. Winnipeg is an attractive city, but does not have the driving, resilient demand of cities such as Calgary or Toronto. Decreases in new home starts are often seen as evidence of a slowing economy and may impact the attraction of Winnipeg. Creating a system that increases costs in Winnipeg further beyond the differences in costs of ownership that already exist can be expected to result in home and commercial property buyers selecting locations outside the city. This will result in a loss of important assessment revenue and an increase in what all citizens must pay. 8. Concerns with the Proposed By-Law The proposed By-Law to impose fees on new development is cause for great concern. There are none of the checks and balances in the proposed system as are evident in other jurisdictions. The broad authority under which the by-law is proposed would appear to contradict the intent of the more specific authority granted under The City of Winnipeg Charter Act. Fairness and Equitable Application of Fees Basis for the Fee. The proposed by-law establishes an impact fee of an amount to be determined by Council. It does not reference the basis upon which the fee is to be established. The Administration Report recommends impact fees at the amounts identified in the Hemson Report. It does not provide a rationale, basis or principles for the amount of the recommended charges. In addition to concerns that the amount in the Hemson Report is unreasonably inflated for the reasons identified in Section 7, it is important there be clear statements the amount is intended to represent the growth related share of a specific set of projects. The Hemson Report also recommends an annual review of the set of projects upon which the fee is based. If a project does not proceed or proceeds differently, the cost basis should be examined and re-calculated. Authority to Determine Growth Related. The Administration Report recommends the determination of what capital projects are growth related be at the Chief Financial Officer s discretion. As manager of the reserve fund, the Chief Financial Officer would determine which, and to what extent, capital works were eligible for funding. Infrastructure would be eligible only to the extent that the work is determined by the Chief Financial Officer to be growth related. To ensure such a finding is valid, it must be based on an engineering analysis of the project and the respective demand that drives it. To ensure such a finding is transparent and to enable responsible oversight and accountability, this analysis must be part of the capital project recommendation to Council. This is not currently part of the Administration s recommendation. 52
66 Exemptions. The proposed by-law identifies exemptions for affordable housing. The Mayor has indicated that further exemptions may be considered for in-fill or other classes of development. The set of projects used to calculate the proposed fee were identified on the assumption that the charge would be consistently applied. In many cases it may have been a simply a matter of population. Any exemptions that are being considered must cause a re-examination of costs and the entire underpinning of the proposed fee. Costs may have been included expressly because of assumptions for the development to be included. If the development is excluded, so must be related costs. If there were no costs considered associated with the development, the entire underpinning of the analysis is flawed. Accountability and Transparency Establishment of Reserves. The By-Law does not specify how funds shall be deposited or used. The Administration Report recommends Council establish a single Impact Fee Reserve Fund. The Hemson Report recommends separate reserves for each service to be funded through the development charges. This is also the common practice across other jurisdictions, including other municipalities in the Winnipeg CMA. It is also common to have restrictions on borrowing across reserve funds (for example, with clear accounting, interest paid, and return prior to projects demanding use of the funds in the original reserve). Use of Funds. The purpose of the Impact Reserve Fund is to fund capital projects to the extent that they are determined by the Chief Financial Officer to be growth-related. It is wellestablished in other jurisdictions and basic principles of public sector accountability that fees collected to pay for a set of projects should be used to pay for those capital projects. There is no assurance of such, nor any obligation upon the City to fund the balance to see the projects fulfilled. The Public Utilities Board has been clear that funds collected to fund a service should be used for that service. Public Accountability. Neither the proposed by-law nor the Administrative Report identifies any obligation for public reporting. Many jurisdictions include obligations for a clear reporting on the use of funds. This is especially important in Winnipeg to provide public confidence that funds are in fact being used for the purpose for which they were collected. Potential for Multiple Fees. The fee is proposed to be applied at either the development or permit stage. Under section 3(4) of the proposed by-law it appears that even if a fee has been paid once for a development, it may be charged again if it was collected more than five years before the permit application. In many cases, phases of development may be serviced and released for construction over a period of many years. Such potential for duplication violates the basic principle of a single fee, collected once. For sake of clarity, and to prevent such a circumstance, it should be clear that any fee be only collected once, without reference to a time limit. 53
67 Authority The proposed by-law states its authority is found in the general authority of the City under subsection 6(1) of the City of Winnipeg Charter Act. It does not acknowledge the more specific direction of the Act under Part 6 - Planning and Development, or subsection 259(1) which is quite specific on the matter. Use of the General Authority when specific authority has been clearly contemplated and subsequently restricted is an unreasonable use of this general authority, and could be considered an attempt to subvert the authority of the Act. 9. The Path Forward UDI Manitoba and the Manitoba Home Builders appreciate that the city needs to ensure that new growth is sustainable and that new development pays for its impacts. Collaborative Process The Urban Development Institute and the Manitoba Home Builders Association are seeking to develop a relationship with the City of Winnipeg based on a shared understanding of both the long-term plans for residential, commercial and industrial development and the guidelines, parameters, principles, processes and fee structure that supports successful development. UDI and MHBA believe that progressive residential and commercial development is critical to a healthy city and is an integral component of long-term planning for sustainable communities. It is for this very reason that collaboration between government and industry is paramount to the success of long term planning. Hemson Consulting Ltd. completed a study to assist in determining funding mechanisms to support growth. UDI and MHBA will continue to advocate that this report alone is not an accurate and fulsome representation of the current and future environment in Winnipeg. As well, they represent the view of the development community that decisions of this magnitude should not be made until a foundationally collaborative assessment has been completed. In order for the process to be truly collaborative, all stakeholders should be included and should work together to: Reach a common understanding of each other s roles in building complete communities and the city now and in the future Review and evaluate historic data and information to determine a mutually agreeable position on the best way for development to support growth Ensure that plans for the future balance the need of the City to support growth without putting a burden on tax payer dollars while at the same time not discouraging the private sector investment that has funded so much of what makes Winnipeg the vibrant city it is today. 54

68 Sound Principles and Analysis Effective City Planning, Fair Allocation UDI and MHBA want to see clear, detailed plans for infrastructure development. It is this objective clarity that will ensure all stakeholder groups are working to common goals, planning is more effective, and a sustainable Winnipeg can be a reality. This process should be based on: Agreed-upon principles Responsible and objective analysis Reasonable costing with sufficient detail to fairly attribute costs Diligent fiscal planning and management ensures existing communities can fund their required upgrades and maintenance. Fair attribution ensures there is no disincentive for new development. Clear, Consistent Policy; Accountability and Transparency Clear, consistent policy is a top priority. UDI and MHBA encourage this process to be transparent and accountable to ensure all stakeholders from developers, to government, to future homebuyers have a common understanding of how development works while ensuring Winnipeg continues to grow and thrive over the next 25 years, a time that we can only anticipate to be a great growth cycle for this province. The City has indicated its driving concern for seeking a growth fee is to ensure that new development pays for its impacts. Any monies collected for this purpose must clearly be set aside and used for this purpose. Transparency and accountability to ensure that any monies raised for a project are used for that project are crucial to the credibility of any proposed scheme. Next Steps to Long Term Sound Solutions As a next step, UDI and MHBA urge the City to engage in proper consultations and establish a working group of stakeholders and City staff to ensure that the financing structure that is eventually adopted truly supports OurWinnipeg. There are long term solutions to the drivers of the City s operating costs that housing and development can be part of. The development community is keenly interested in a partnership with the City to support smart, sustainable growth in Winnipeg, now and into the future. 55
69 10. References Alberta Regulation 48/2004. (n.d.). Sections Annable, K. (2016, May 26). Province, city not interested in changing generous MTS tax break. Winnipeg Free Press, pp. BC Ministry of Community Services. (2005). Development Cost Charge Best Practices Guide. Canadian Home Builders Association. (2014). Winnipeg 2014: Economic Impacts of New Home Construction. Canadian Home Builders Association. Cappe, M. (2010). City Magnets II: Benchmarking the Attractiveness of 50 Canadian Cities. Conference Board of Canada. CaRDI. (2016, August 31). Defining Sprawl and Smart Growth. Retrieved from Community Regional Development Institute, Cornell University: CBCNews. (2012, May 3). PUB calls Winnipeg's utility rates a hidden tax. Retrieved from CBCNews Manitoba: CBCNews. (2016, April 27). Winnipeg councillors vote to raise water, sewer rate increases. Retrieved from CBC News Manitoba: City of Calgary. (2015). Off-Site Levy & Community Services Charges Background Report. City of Calgary. (2016). City of Calgary By-law 2M2016. Retrieved from Off-siteLeviesBylaw.pdf City of Prince Albert, AECOM. (2010). City of Prince Albert Development Levy Study. Retrieved from City of Regina. (2016). Servicing Agreement Fees and Development Levy Policies - Administration and Calculation. Retrieved from City Planning: 56
70 City of Vancouver. (2010). Metro Vancouver. Retrieved from Greater Vancouver Sewerage and Drainage District Development Cost Charge Bylaw No. 254, 2010: City of Winnipeg. ( ). Assessment and Taxation Department. City of Winnipeg. ( ). Annual Financial Reports, City of Winnipeg. (2009). The City of Winnipeg's Infrastructure Deficit: Council Seminar. City of Winnipeg. (2011). Complete Communities: An OurWinnipeg Direction Strategy. City of Winnipeg. (2011). Sustainable Transportation: An OurWinnipeg Direction Strategy. City of Winnipeg. (2011). Sustainable Transportation: An OurWinnipeg Direction Strategy. City of Winnipeg. (2011). Transportation Master Plan. City of Winnipeg. (2016) Preliminary Budget Highlights. ts.pdf. City of Winnipeg. (2016). City of Winnipeg Population, Housing and Economic Forecast. City of Winnipeg. (2016). Land Area and Total Population Density by Census Year. Retrieved from City of Winnipeg. (2016). Let's Talk. Retrieved from City of Winnipeg; Statistics Canada. (2015). Sourced from 2015 Municipal Assessment Data by Neighbourhood, 2011 Census by Neighbourhood, Building permits City of Yorkton, Associated Engineering. (2014). City of Yorkton Development Levy Bylaw. Retrieved from City of Yorkton Administration: CMHC. ( ). Residential Construction Digest. CMHC. CMHC. (Dec 2014; Aug 2016). Housing Now Tables, Winnipeg CMA. CMHC. (Q2 2016). Housing Market Assessment Winnipeg CMA. CMHC. CMHC. (Spring 2016). Housing Market Outlook Winnipeg CMA. CMHC. Colliers International. (2010). Land Development Cost Study - Municipal Land Development Charges and Other Costs Assessed by Government and Residential Propoerty Development in Saskatchewan. Calgary, Regina, Winnipeg, Saskatoon: Colliers International. 57
71 Conference Board of Canada. (2016). Economic Insights Into 13 Canadian Metropolitan Economies, Spring Conference Board of Canada. Deloitte LLP. (2014). Understanding the Role that New Communities Play in Supporting Municipal Finances. Florida, R. (2008). Who's Your City. Basic Books, Random House. Glowacki, L. (2016, March 3). War of words breaks out between province, city, over where to spend funds from water rate hike. Retrieved from CBC News Manitoba: Government of Alberta. (2004). Priniciples and Criteria for Off-Site Levies Regulation. Retrieved from Government of British Columbia. (2005). Development Cost Charge Best Practices Guide. Retrieved from 05.pdf Government of British Columbia. (2015). Local Government Act. Retrieved from BC Laws: /Local%20Government%20Act%20[RSBC%202015]%20c.%201/00_Act/r15001_14.xml#d ivision_d0e53028 Government of Manitoba. (2005). Retrieved from Government of Manitoba - Laws - Consolidated Acts: Government of Manitoba. (2016). Land Use and Development. Retrieved from Indigenous and Municipal Relations - Land Use and Development - Planning FAQs: Government of Ontario. (1997). Development Charges Act. Retrieved from Government of Ontario. (2013). Development Charges in Ontario - Consultation Document. Government of Saskatchewan. (2007). Retrieved from Hemson Consulting Ltd. (2011, April). Development Charges Background Study. Retrieved from 20Study.pdf IAP2, I. A. (n.d.). 58
72 Keele, J. (2016, February 25). Buying Homes in Winnipeg Could Get More Costly. CTV News, pp Kives, B. (2014, August 7). Brian Bowman wants Winnipeg to get larger share of provincial sales tax revenue. Winnipeg Free Press, pp. Winnipeg-to-get-larger-share-of-provincial-sales-tax-revenue html. Manitoba Public Utilities Board. (2012). A Hearing in Regards to the City of Winnipeg's Water & Sewer Utilities. Public Utilities Board. Ontario Development Charge Act. (n.d.). Ploeg, C. G. (2010). Paying for Urban Growth: Putting Calgary's Experience in Context. Province of Manitoba. (2014). Implementation of the Gast Tax Funding Agreement in Manitoba - Annual Implementation Report. 2014: Province of Manitoba. RM of Cartier. (2015). RM of Cartier Fees and Schedule By-law Retrieved from RM of East St. Paul. (2007). East St. Paul Development Plan. Retrieved from Red River Planning District: RM of Hanover. (2016). Capital Lot Levy Guide. Retrieved from Hanover Municipality Website: 3DC690CF275F&pageCode=AACD05C A561-6E2F885CD28C&subPageCode=947298C4-59C2-49BB-AA97-60B718F75052 RM of Headingley. (2013). RM of Headingley. Retrieved from Development Permit Fees By-law 11-13: RM of Rockwood. (2011). 21/11 Capital Levy - Dedication Fee for Infrastructure Costs. Retrieved from RM of Rockwood Files and Downloads - By-laws: RM of Rosser. (2016, 05). Rosser CentrePort Lands Lot Levy (Acreage) By-law Retrieved from ( 59
73 RM of Springfield. (2013). RM of Springfield Fees and Charges. Retrieved from RM of St. Clements. (2009). RM of St Clements. Retrieved from By-law to Establish Fees for Subdivision Capital Levy Reserve Fund : toestablishfeesforsubdivisioncapitallevyreservefund-amendedschedulea.pdf RM of St. Francois Xavier. (2013). BLY Dedication Fees. Retrieved from RM of Tache. (2015). RM of Tache Dedication Fees By-law Retrieved from RM of West St. Paul. (2012). RM of West St Paul Capital Levy By-law Retrieved from Saskatchewan Planning and Development Act, (n.d.). Section 169. Smart Growth Network. (2016). Smart Growth Principles. Retrieved from Smart Growth Online: Statistics Canada. (2016). CANSIM, table Retrieved from Consumer Price Index, By City: Statistics Canada. (2016). CANSIM, table and Catalogue no X. Retrieved from New Housing Price Index: Statistics Canada. (2016). Construction Price Indexes (non-residential building). Retrieved from Taylor, S. (2016, May 11). Bowman considers growth fees for Winnipeg in Metronews.ca, pp. The Johnson Report. (2016). Review of Commercial Real Estate in the City of Winnipeg. The Johnson Report. (Sept 2016). Review of Commercial Real Estate in The City of Winnipeg. Town of Stonewall. (2015). Town of Stonewall BL5-15 Capital Lot Levy. Retrieved from Various. ( ). Landmark Planning and Design Inc., Stantec Consulting, Lombard North Group, MMM Group LTd, Terracon Development,. 60
74 Watson & Associates. (2013). City of Guelph Development Charge Background Study. Winnipeg PPD. (2016). Residential and Non-Residential Permit Values; Construction of Dwelling Units. Retrieved from Planning, Property and Development Statistics:
75 Appendix A: Sources of City Revenues The City of Winnipeg receives the bulk of the revenue it requires to provide its services through: Property taxation Frontage levies Grants and subsidies from other levels of government Business taxation Utility payments Mission of Assessment and Taxation To provide fair, open understandable and defensible property valuations and classifications for the equitable distribution of taxation Property taxation is by far the largest source of revenue. Information on the City web-site, states that the Assessment and Taxation department is responsible for the valuation and classification of all real property, personal property and business occupancies within the City of Winnipeg for the purpose of distributing taxes fairly to the City s citizens. The department FAQs state that property taxation helps pay for community services such as policing, firefighting, garbage collection and snow removal. The City determines the tax the homeowner will pay by assessing the value of their property. Property taxes are calculated by applying municipal and school mill rates against the portioned assessment of the property. By definition, a mill is one-thousandth part. For calculating taxes, one mill represents $1.00 of taxes for every $1000 of portioned assessment. The calculated amount will include all of the below (with the exception of local improvements): Local improvements are alternations homeowners pay the City to make in their area. They can be initiated either by an area s resident or the City. These could include paving local lanes, oiling or lighting a lane, building sidewalks or boulevards or installing ornamental streetlights. Frontage levies are charged separately from other taxes on real property. Information in frontage levy FAQs states that the revenue collected is used for the upgrading, repair, replacement and maintenance of City streets and sidewalks. Council establishes a uniform rate to be applied throughout the city for each frontage tax imposed. Currently frontage is based on a property fronting on a street that contains a sewer main or water main. Calculation of the frontage levy is based on the length of the boundaries (frontage) of the property that fronts or abuts any portion of the services. That measurement is then multiplied by the applicable rate to determine the total frontage levy for the property. 62
76 In Winnipeg, water and waste services are considered a utility. Homeowners are billed through a separate system. The billing is based on actual or estimated usage times established rates. Water and sewer charges are based on the amount of water you use as measured by the water meter. Waste diversion charges were introduced to fund new programs that provide residents with more ways to reduce, reuse and recycle. This charge is a daily charge for each dwelling unit. A rate is established for per cubic metre per quarter. Water, sewer and diversion rates have been set for 2016, 2017, and It is our understanding that these rates are based on the cost of providing water and waste services and forecast required capital expenditures. If capital waste and water estimates are included in the basket of services on which development charges are based, again, homeowners will pay when they purchase a home and again on a quarterly basis when they pay their bill. Other Revenue Sources If capital waste and water estimates are included in the basket of services on which development charges are based, again, homeowners will pay when they purchase a home and again on a quarterly basis when they pay their bill. Municipalities in Canada are able to access infrastructure funding through different sources, including the following methods: Federal Grants: Opportunities for Canadian municipalities to access federal funds for infrastructure investment are available through an assortment of federal grant programs. Current programs that can be utilized include the 2014 New Building Canada Plan, which includes the Community Improvement Fund, the National Infrastructure Component, and the Provincial- Territorial Infrastructure Component, which have funding available for nationally significant projects and for projects that may have an impact on smaller areas. Provincial Infrastructure Funding: Funds are allocated to municipalities through joint initiatives, including Gas Tax Funding Agreements, between provinces and the Federal government. Funds are allocated to support initiatives including local roads and bridges, wastewater improvements, public transit and water projects. As well, funds may also be allocated to Community Energy Systems, solid waste infrastructure and capacity building. (Province of Manitoba, 2014). Public-Private Partnerships: Long-term performance based approach to procure public infrastructure, in which the private sector will take on the majority of risk for financing and construction. The P3 model also puts the responsibility on the private sector to effectively design, plan and maintain the infrastructure. Other Levies and Agreements: Policies are implemented across Canada to support infrastructure construction, operation and maintenance. These levies and agreements often follow similar principles to those of Development Cost Charge policies. 63
77 Appendix B Winnipeg Development Agreement Parameters Right of Way Width for Walkways Street Right-of Ways Land Acquisition and Dedication Width of the right of way will be negotiated so it is it sufficient to remove snow The developer provides the City at no cost street right-of-ways required to serve the subdivision including right-of-way widths for streets that require ditch drainage or rural cross sections The developer may also be required to provide land to the City at no extra cost for the purposes of widening of streets and/or widening collector streets serving the sub division The developer may be required to pay a share of the cost to acquire street rights-of way outside the sub division that are designated by the City as being acquired and/or required to provide access from the sub division to the regional street system The developer may be required to provide or accommodate in the subdivision plan, for street rights-of way access designated by the City for future access or regional streets requirements (City would either purchase or acquire such lands from the developer) The developer may be required to create and/or dedicate a reserve adjacent to an arterial road or expressway for the purposes of sound attenuation. Frontage Roads The developer is required to provide to the City at no cost frontage road right-of-ways to the subdivision wherever required in accordance with the Transportation Standards Manual Lane Rights-of Way The developer is required to provide at no cost lane rights-of-way wherever required in the subdivision Easements The developer is required to provide easements where necessary for the installation and maintenance of utilities such as hydro, natural gas and telephone lines Rivers and Creeks Stormwater Retention Basins If a river or creek exists within a development area, additional lands may be required for land drainage flow The developer would be required to transfer these lands to the City at a price negotiated with the City For any development with stormwater retention basins, the developer must provide an appropriate amount of land for access to the retention pond for public maintenance purposes 64
78 Public Park Reserves Waste Water Sewers Lateral Local Land Drainage Services Regional Land Drainage Trunk Facilities Developers are required to dedicate an equivalent of 10% of the development area for use as active and/or passive parks This includes 8% of the net subdivision area in land for the purposes of public park and the remaining 2% in an equivalent cash amount If land is not dedicated for public purposes, the developer must pay a full cash payment equivalent to 10 per cent of the appraised value Services and Improvements The developer must construct all required wastewater sewers to service the subdivision and may be required to service adjacent lands in order to convey wastewater from the subdivision to the existing wastewater collection system In situations where the City requires oversize sewers, the additional costs will be calculated and paid by the City (where internal diameter is 300 millimeters or less, the City is not liable) The developer may be required to pay for existing services or services planned to be constructed in the future that directly benefit the proposed subdivision. These costs will be determined by the Director of Water and Waste and specified before or during the development agreement The developer may be required to construct all required lateral local land drainage sewers to service the subdivision If necessary, the developer may also be required to provide services and facilities in adjacent lands in order to convey wastewater from the subdivision to the existing land drainage The developer may be required to construct all required regional land drainage trunk facilities (stormwater retention basins, interconnection pipes, outfalls and linear waterways) to serve the subdivision This may require the developer to construct services and facilities in adjacent lands to convey land drainage runoff from the subdivision to the existing land drainage system If the City requires the developer to construct regional land drainage trunk facilities, these additional costs will be calculated to determine cost sharing based on Trunk Service Rate (TSR- uniform per acre charge calculated by adding together all the costs for the regional land drainage system and dividing by the total drainage area it serves) The developer may be required to pay the TSR for existing services or services planned in the future that would benefit the proposed subdivision 65
79 Services and Improvements Floodproofing The developer must specify an appropriate flood protection method, either floodproofing of individual units or construction of a primary dike system Water The developer must construct all required watermains, including services in adjacent lands for connection to the existing water distribution systems Lot Line Connections Street Pavements and Lanes Traffic Control Devices and Traffic Signs If the City requires oversize watermains, the additional costs will be calculated and be paid by the City; if the watermain diameter is 250 millimeters (10 inches) or less, the City is not liable The developer may be required to pay for existing services or services planned to be constructed in the future that directly benefit the subdivision The developer must construct all required wastewater sewer and domestic water services from the main lines to the individual (single family and two family) lots in accordance with the City s specifications The developer must construct in all street rights-of-way in the subdivision, pavements The developer may be required to construct designated access roads and/or modifications to existing streets outside the subdivision boundaries The developer may be required to construct pavements of greater width and depth to serve additional areas. The City will reimburse for the costs associated with additional width and depth If development borders on an arterial road, the developer must pay the cost of one land of concrete pavement an a share of the land drainage, sidewalks, landscaping, street lighting and intersection improvements and modifications as determined by the City Where regional street improvements constructed by an initial developer benefit other lands or the City, appropriate cost sharing formulas will be determined and agreed upon Area charges may be applied in lieu of frontage charges where more than one developer chares the improvement costs The developer may be required to pay a share of the cost of previously constructed access roads that serve the subdivision The developer must pay for modifications to existing and/or installation of required new traffic control devices within the development area Where constructed traffic control devices benefit other areas or the City, an appropriate cost sharing formula will be applied Walkways The developer may be required to construct sidewalks, appropriate fencing along the street frontage of the walkway and ornamental lighting and landscaping between the sidewalk and the property lines 66
80 Services and Improvements Sidewalks The developer may be required to construct sidewalks along street rightof-ways, including all collector roads and streets adjacent or leading to schools or parks Boulevards The developer must install pavements, unit paving stones or sod and plantation of trees in all nontraveled surfaces of boulevards, cul-de-sacs and medians Street Name Signs Underground Services Street and Lane Lighting Stormwater Retention Basins Public Park Reserves- Services Public Park Reserves- Improvements The developer must pay for the cost of installation of street name signs at each intersection in the development area bearing street names approved by City Council The developer is responsible for the installation of all underground electrical, telephone and cable television services The developer must install ornamental lights on all streets and lanes within the subdivision For every 4 acres of water surface within an impoundment area, the developer will provide one acre of land for public access purposes The developer must grade, level and sod the public land component, install all services in road allowances located adjacent to the public land component and install chain link fencing to demarcate the public land component The developer must install services in road allowances located adjacent to public park reserves based on a formula of 100 feet of serviced frontage for each acre of dedicated parkland The developer must grade, level and sod the public park reserve, install irrigation equipment and land drainage systems 67
81 Appendix C Other Jurisdictions An evaluation of various Canadian jurisdictions was undertaken to understand current practices of municipalities in relation to development cost recovery. The evaluation looked at the following authorities and key legislation: British Columbia Local Government Act Alberta Municipal Government Act (Alberta Regulation 48/2004) Saskatchewan Planning and Development Act Ontario Development Charges Act City of Calgary, By-Law 2M2016 Under the authorities and legislation developed in other jurisdictions, best practices for development cost charges were evaluated. British Columbia Local Government Act Within the province of British Columbia, the Local Government Act (Government of British Columbia, 2015) has outlined the process for defining the following criterion related to Development Cost Charges (DCC): Imposition and Collection of Development Cost Charges The role of an inspector prior to a DCC By-law being adopted Circumstances in which DCC are not payable General prohibitions against waiving or reducing charges Amount of DCC and eligible deductions Establishment and usage of DCC Annual reporting requirements Saskatchewan Planning Act The Saskatchewan Planning Act (Government of Saskatchewan, 2007) indicates that if a council adopts and official community plan that authorizes the use of development levies, council may establish development levies through by-law. The levies may be applied to recover all or part of a municipality s capital costs for development of land. The levy may be assessed for the following: Sewage, water or drainage works Roadways and related infrastructure Parks and recreational facilities Levies applied, must be on a background study which determines capital costs and recreational requirements of a service area, and considers future land use patterns and development. 68
82 Alberta Municipal Government Act Within the Province of Alberta s Municipal Government Act (Government of Alberta, 2004), Alberta Regulation 48/2004 was established to outline the principles and criteria for off-site levies ( Development Cost Charges ). The Regulation was developed to establish off-site levies. Generally, principles and criteria included in the regulation are related to the following concepts: Full and open disclosure of all levy costs and payments, including method for calculating the levy, information used to determine the levy Shared responsibility between the municipalities and developers for defining current and future infrastructure and servicing requirements Levy calculations are to be determined in consultation with affected landowners and developers. City of Calgary Off-Site Levy By-law Pursuant to the Alberta Municipal Government Act, the City of Calgary established The Off-Site Levy By-law (City of Calgary, 2016) to pay for all or part of capital costs for new or expanded facilities or land required in connection with new or expanded facilities. In developing the Off-Site Levy By-Law, the City of Calgary recognized the importance of maintaining existing infrastructure and ensuring re-development continues to occur in already established neighbourhoods. To account for existing infrastructure and new increased demand, a density incentive program was created to offset costs of new charges on re-developed lands, and to promote ongoing redevelopment in existing neighborhoods. Ontario Development Charges Act The Ontario Development Charges Act (Government of Ontario, 1997) was established for Ontario municipal councils to impose development charges against land to offset increased capital costs required as a result of development areas. The Act provides guidance for establishing Development Charges, including the following general parameters: Methods to determining development charge amounts Requirements for a Background Study to be completed for all proposed development charge by-laws, including calculations and estimations of proposed charges, and preparation of an Asset Management Plan Availability of materials for the public in advance of approval process, including a public meeting. Methods for development charge allocation, including establishing reserve funds. 69
83 Table 1 Overview of Development Charge Policies BC Local Government Act Greater Vancouver Sewerage and Drainage District Development Cost Charge Development Cost Charges may be applied to recover capital costs directly and indirectly associated with a development. Principles for exclusion of Development Cost Charges from certain types developments, including renovations to existing properties, defined land uses/zoning districts, affordable housing and permit values. Alberta Regulation 48/2004 City of Calgary, By-Law 2M2016 Saskatchewan Planning and Development Act Ontario Development Charges Act Development Cost Charges are calculated for new developments and areas of re-development. Development Cost Charge amounts must be specified in local by-laws and must be consistent across a municipality. Development Cost Charge must be established based on background studies to understand municipal servicing and recreational requirements. As well, the Development Cost Charge must be based on future land use patterns and phasing of public works. Stakeholder involvement in establishing Development Cost Charges, including full and open disclosure of the costs, payments and methods of determining the calculated amount. Information should be available to the public for a review period prior to implementing the by-law. Full and open disclosure of fees charged. Development Cost Charges will be placed in a Reserve Fund for each of the purposes that the Charges are established for, e.g. School Sites, Capital Infrastructure, Public Utilities, Parks and Recreation, etc. Balances and expenditures from the Development Cost Charge Reserves are reported on, and made public upon request. 70

84 Example of Consultation Process (City of Calgary, 2015) 71

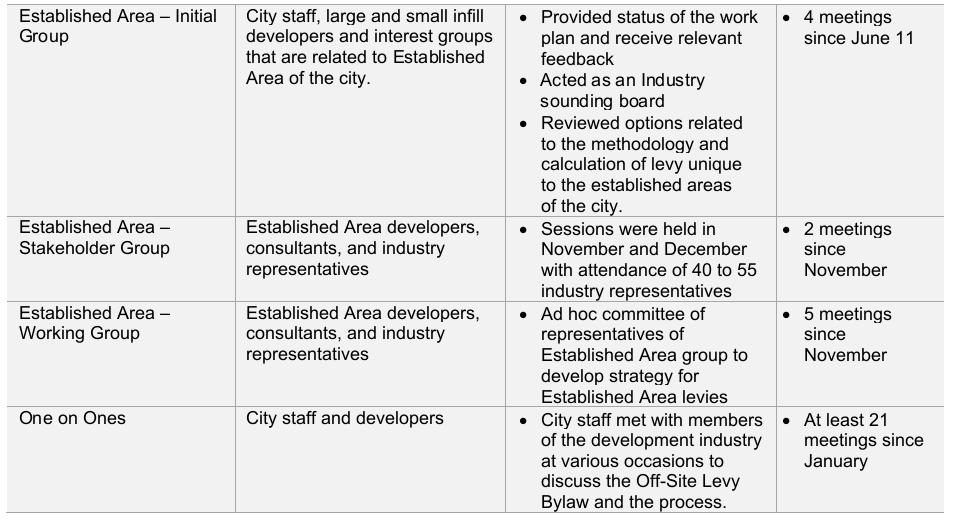
85 72


86 Examples of Project Cost Detail Figure 36 Development Cost Charge Detail BC Best Practice Guide [EXAMPLE] 73
City of Winnipeg Housing Policy Implementation Plan
 The City of Winnipeg s updated housing policy is aligned around four major priorities. These priorities are highlighted below: 1. Targeted Development - Encourage new housing development that: a. Creates
Subject. Date: 2016/10/25. Originator s file: CD.06.AFF. Chair and Members of Planning and Development Committee
 Date: 2016/10/25 Originator s file: To: Chair and Members of Planning and Development Committee CD.06.AFF From: Edward R. Sajecki, Commissioner of Planning and Building Meeting date: 2016/11/14 Subject
R esearch Highlights LEVIES, FEES, CHARGES AND TAXES ON NEW HOUSING (2002) Introduction. Municipal Levies, Fees and Charges
 Introduction. Municipal Levies, Fees and Charges") R esearch Highlights December 2002 Socio-economic Series 115 LEVIES, FEES, CHARGES AND TAXES ON NEW HOUSING (2002) Introduction Government-imposed costs on new housing can be substantial. They have a direct
R esearch Highlights December 2002 Socio-economic Series 115 LEVIES, FEES, CHARGES AND TAXES ON NEW HOUSING (2002) Introduction Government-imposed costs on new housing can be substantial. They have a direct
THAT Council receives for information the Report from the Planner II dated April 25, 2016 with respect to the annual Housing Report update.
 Report to Council Date: April 25, 2016 File: 1200-40 To: From: Subject: City Manager Laura Bentley, Planner II, Policy & Planning Annual Housing Report Update Recommendation: THAT Council receives for
A Guide to Establishing Additional Service Areas in Rural Municipalities
 A Guide to Establishing Additional Service Areas in Rural Municipalities February 2014 Contents Introduction... 3 Purpose of this Guide... 3 Background... 3 What are the benefits to Rural Municipalities
Impact of the Housing Market on the Economy and the Challenges Surrounding Access to Homeownership
 Impact of the Housing Market on the Economy and the Challenges Surrounding Access to Homeownership February 1, 2017 The impact of the housing market on the economy and the challenges surrounding access
INVENTORY POLICY For Real Property
 INVENTORY POLICY For Real Property (Broader Public Sector Entities) Page 1-12 CONTENTS 1. TITLE... 3 2. OVERVIEW... 3 3. PURPOSE... 3 4. POLICY STATEMENT... 3 5. APPLICATION... 7 6. EVALUATION AND REVIEW...
Suburban Sprawl: Exposing Hidden Costs, Identifying Innovations. Summary
 : Exposing Hidden Costs, Identifying Innovations Summary October 2013 Suburban sprawl is spreading across Canada as cities expand outwards to accommodate the growing demand for lower cost houses. But it
June 12, 2014 Housing Data: Statistics and Trends
 June 12, 214 Housing Data: Statistics and Trends This presentation was provided to the Mayor s Housing Commission on June 12, 214 and provided to Council on June 23, 214 along with a report summarizing
COMPARISON OF THE LONG-TERM COST OF SHELTER ALLOWANCES AND NON-PROFIT HOUSING
 COMPARISON OF THE LONG-TERM COST OF SHELTER ALLOWANCES AND NON-PROFIT HOUSING Prepared for The Fair Rental Policy Organization of Ontario By Clayton Research Associates Limited October, 1993 EXECUTIVE
Halifax Water Rate Pricing and Stormwater Management Programs. March 4 th, 2013
 Halifax Water Rate Pricing and Stormwater Management Programs March 4 th, 2013 Real Property Association of Canada One University Avenue, Suite 1410 Toronto, Ontario Canada M5J 2P1 www.realpac.ca T: (416)
Consultation on Increasing Housing Supply in Ontario: A guide for Ontario s co-op housing sector
 Consultation on Increasing Housing Supply in Ontario: A guide for Ontario s co-op housing sector The Government of Ontario is currently holding a consultation: Increasing Housing Supply in Ontario. CHF
Economic Impact of Commercial Multi-Unit Residential Property Transactions in Toronto, Calgary and Vancouver,
 Economic Impact of Commercial Multi-Unit Residential Property Transactions in Toronto, Calgary and Vancouver, 2006-2008 SEPTEMBER 2009 Economic Impact of Commercial Multi-Unit Residential Property Transactions
ental Market report Apartment vacancy rate almost unchanged in 2004 St.Catharines-Niagara Vacancy rate falls in larger centers IN THIS ISSUE
 r ental Market report St.Catharines-Niagara Canada Mortgage and Housing Corporation Apartment vacancy rate almost unchanged in 2004 The vacancy rate in the St. Catharines-Niagara Census Metropolitan (CMA)
Market Value Assessment and Administration
 Market Value and Administration This technical document is part of a series of draft discussion papers created by Municipal Affairs staff and stakeholders to prepare for the Municipal Government Act Review.
A New Beginning: A National Non-Reserve Aboriginal Housing Strategy
 14 A New Beginning: A National Non-Reserve Aboriginal Housing Strategy Steve Pomeroy, on behalf of The National Aboriginal Housing Association/ Association Nationale d Habitation Autochtone (NAHA/ANHA)
R esearch Highlights LIFE LEASE HOUSING IN CANADA: A PRELIMINARY EXPLORATION OF SOME CONSUMER PROTECTION ISSUES. Findings. Introduction.
 R esearch Highlights August 2003 Socio-economic Series 03-013 LIFE LEASE HOUSING IN CANADA: A PRELIMINARY EXPLORATION OF SOME CONSUMER PROTECTION ISSUES Introduction This study, completed under the CMHC
Housing. Imagine a Winnipeg...: Alternative Winnipeg Municipal Budget
 Housing Housing, and the need for affordable housing in cities and towns across Canada, has finally caught the attention of politicians. After a quarter century of urging from housing advocates, there
RENTAL MARKET REPORT. Manitoba Highlights* Highlight Box. Housing market intelligence you can count on
 H o u s i n g M a r k e t I n f o r m a t i o n RENTAL MARKET REPORT Manitoba Highlights* C a n a d a M o r t g a g e a n d H o u s i n g C o r p o r a t i o n Date Released: Spring 2011 Figure 1 Winnipeg
Housing as an Investment Greater Toronto Area
 Housing as an Investment Greater Toronto Area Completed by: Will Dunning Inc. For: Trinity Diversified North America Limited February 2009 Housing as an Investment Greater Toronto Area Overview We are
CITY OF VANCOUVER ADMINISTRATIVE REPORT
 CITY OF VANCOUVER ADMINISTRATIVE REPORT A6 Report Date: August 27, 2007 Author: Cameron Gray Phone No.: 604.873.7207 RTS No.: 06937 VanRIMS No.: Meeting Date: October 2, 2007 TO: FROM: SUBJECT: Vancouver
CITY OF HAMILTON. Community Services Housing & Homelessness Division
 CITY OF HAMILTON Community Services Housing & Homelessness Division TO: Chair and Members Emergency & Community Services Committee WARD(S) AFFECTED: CITY WIDE COMMITTEE DATE: April 20, 2011 SUBJECT/REPORT
Table of Contents. Title Page # Title Page # List of Tables ii 6.7 Rental Market - Townhome and Apart ment Rents
 RESIDENTIAL MONITORING REPORT 2013 Table of Contents Title Page # Title Page # List of Tables ii 6.7 Rental Market - Townhome and Apart ment Rents 21 List of Figures iii 7.0 Other Housing Demands and Trends
C Secondary Suite Process Reform
 2018 March 12 Page 1 of 9 EXECUTIVE SUMMARY On 2017 December 11, through Notice of Motion C2017-1249 (Secondary Suite Process Reform) Council directed Administration to implement several items: 1. Land
Rents for Social Housing from
 19 December 2013 Response: Rents for Social Housing from 2015-16 Consultation Summary of key points: The consultation, published by The Department for Communities and Local Government, invites views on
Georgia Street W, PO Box 10123, Pacific Centre, Vancouver, BC V7Y 1C6
 Select Standing Committee on Finance and Government Services c/o Parliamentary Committee Office Room 224, Parliament Buildings Victoria, BC V8V 1X4 Submitted via online consultation portal: https://consultations.leg.bc.ca/submission/create?cons=budget2018.
METHODOLOGY GUIDE VALUING LANDS IN TRANSITION IN ONTARIO. Valuation Date: January 1, 2016
 METHODOLOGY GUIDE VALUING LANDS IN TRANSITION IN ONTARIO Valuation Date: January 1, 2016 August 2017 August 22, 2017 The Municipal Property Assessment Corporation (MPAC) is responsible for accurately assessing
HOUSING MARKET INSIGHT Canada
 Housing Market Information HOUSING MARKET INSIGHT Canada Canada Mortgage and Housing Corpor ation Date Released: September 2016 Purpose-built rental apartment units in the lowest-rent quintile are older
INVENTORY POLICY For Real Property
 INVENTORY POLICY For Real Property (Consolidated Revenue Fund Entities) Page 1-10 CONTENTS 1. TITLE... 3 2. OVERVIEW... 3 3. PURPOSE... 3 4. POLICY STATEMENT... 3 5. APPLICATION... 7 6. EVALUATION AND
Spring Market trends
 2016 Spring Market trends Report NATIONAL SUMMARY Vancouver and Toronto continued to see significant price appreciation in the first quarter of the year. Greater Vancouver s average residential sale price
RENTAL MARKET REPORT. Manitoba Highlights* Highlights. Housing market intelligence you can count on
 H o u s i n g M a r k e t I n f o r m a t i o n RENTAL MARKET REPORT Highlights* C a n a d a M o r t g a g e a n d H o u s i n g C o r p o r a t i o n Date Released: Spring 2012 Figure 1 Winnipeg CMA Brandon
research highlight Impact of the 2010 Winter Olympic Games on the Vancouver and Sea-to-Sky Housing Markets introduction Methodology
 research highlight November 2006 Socio-economic Series 06-022 Impact of the 2010 Winter Olympic Games on the Vancouver and Sea-to-Sky Housing Markets introduction Cities are increasingly using mega events
City of Brandon Development Charges FAQs
 City of Brandon Development Charges FAQs Residential, commercial and industrial growth requires municipal infrastructure. Development Charges are one way to pay for this new infrastructure. Development
ental Market report Vacancy Rate Up Slightly Vacancy Rate Edges Higher in 2004 Charlottetown CA CHARLOTTETOWN Canada Mortgage and Housing Corporation
 4.8% r ental Market report Vacancy Rate Up Slightly CHARLOTTETOWN Canada Mortgage and Housing Corporation Volume 6 Edition 1 October 2004 www.cmhc.ca Vacancy Rate Edges Higher in 2004 The vacancy rate
Subject. Date: January 12, Chair and Members of Planning and Development Committee 2016/02/01
 Originator s files: Date: January 12, 2016 CD 06 AFF To: From: Chair and Members of Planning and Development Committee Edward R. Sajecki, Commissioner of Planning and Building Meeting date: 2016/02/01
Attachment 3. Guelph s Housing Statistical Profile
 Attachment 3 Guelph s Housing Statistical Profile Table of Contents 1. Population...1 1.1 Current Population (26)...1 1.2 Comparative Growth, Guelph and Ontario (21-26)...1 1.3 Total Household Growth (21
Chapter 24 Saskatchewan Housing Corporation Housing Maintenance 1.0 MAIN POINTS
 Chapter 24 Chapter 24 Saskatchewan Housing Corporation Housing Maintenance 1.0 MAIN POINTS The Saskatchewan Housing Corporation s maintenance of the 18,300 housing units it owns is essential to preserve
Ontario Rental Market Study:
 Ontario Rental Market Study: Renovation Investment and the Role of Vacancy Decontrol October 2017 Prepared for the Federation of Rental-housing Providers of Ontario by URBANATION Inc. Page 1 of 11 TABLE
The South Australian Housing Trust Triennial Review to
 The South Australian Housing Trust Triennial Review 2013-14 to 2016-17 Purpose of the review The review of the South Australian Housing Trust (SAHT) reflects on the activities and performance of the SAHT
City of Puyallup. Parks Impact Fee Study
 City of Puyallup Parks Impact Fee Study August 23, 2005 Prepared by Financial Consulting Solutions Group, Inc. 8201 164 th Avenue NE, Suite 300 Redmond, WA 98052 tel: (425) 867-1802 fax: (425) 867-1937
CITY CLERK. Consolidated Clause in Policy and Finance Committee Report 7, which was considered by City Council on July 19, 20, 21 and 26, 2005.
 CITY CLERK Consolidated Clause in Report 7, which was considered by City Council on July 19, 20, 21 and 26, 2005. 3 Regent Park Revitalization - Financial Strategy (Ward 28) City Council on July 19, 20,
Settlement Pattern & Form with service costs analysis Preliminary Report
 Settlement Pattern & Form with service costs analysis Preliminary Report Prepared for Regional Planning Halifax Regional Municipality by Financial Services, HRM May 15, 2004 TABLE OF CONTENTS INTRODUCTION...
2015 Spring Market trends report
 2015 Spring Market trends Report National Summary Low inventory in Vancouver and Toronto continue to drive prices as buyers find themselves in competition over the low supply of single-family homes. The
Economic Impacts of MLS Home Sales and Purchases in Canada and the Provinces
 Economic Impacts of MLS Home Sales and Purchases in Canada and the Provinces 2006 2008 FINAL REPORT April 24, 2009 Economic Impacts of MLS Home Sales and Purchases in Canada and the Provinces 2006-2008
Non-Profit Co-operative Housing: Working to Safeguard Canada s Affordable Housing Stock for Present and Future Generations
 Co-operative Housing Federation of Canada s submission to the 2009 Pre-Budget Consultations Non-Profit Co-operative Housing: Working to Safeguard Canada s Affordable Housing Stock for Present and Future
Economic Impacts of MLS Home Sales and Purchases In The province of Québec and The Greater Montréal Area
 Home Sales and Purchases In The province of Québec and The Greater Montréal Area Home Sales and Purchases In The Province of Québec and The Greater Montréal Area Prepared for: The Greater Montréal Real
HOUSING MARKET OUTLOOK St. John s CMA
 H o u s i n g M a r k e t I n f o r m a t i o n HOUSING MARKET OUTLOOK St. John s CMA C a n a d a M o r t g a g e a n d H o u s i n g C o r p o r a t i o n Date Released: Fall 2014 Highlights New home
PUBLIC OPEN HOUSE September 19, 2018
 PUBLIC OPEN HOUSE September 19, 2018 Board 1 BACKGROUND Council direction was given to develop a The is looking at new housing in mature and recent communities, as outlined in the City of Winnipeg s planning
News Release. Canadian home sales ease back in September Ottawa, ON, October 15, The Canadian Real Estate Association
 The Canadian Real Estate Association News Release Canadian home sales ease back in September Ottawa, ON, October 15, 2014 According to statistics 1 released today by The Canadian Real Estate Association
The Canadian Real Estate Association News Release
 The Canadian Real Estate Association News Release Canadian home sales fall further in February Ottawa, ON, March 15, 2018 Statistics 1 released today by The Canadian Real Estate Association (CREA) show
DRAFT. Development Impact Fee Model Ordinance. Mount Pleasant, SC. Draft Document. City Explained, Inc. J. R. Wilburn and Associates, Inc.
 City Explained, Inc. J. R. Wilburn and Associates, Inc. Development Impact Fee Model Ordinance Mount Pleasant, SC Draft Document January 11, 2017 ARTICLE I. TITLE This ordinance shall be referred to as
Subject: Affordable Housing Reserve Fund Policy Bylaw No. 3866, 2008
 For Council Our File: 10-5040-20/AFFHOU/2008-1 Doc #: 727285.v1 To: From: City Manager General Manager Planning and Development Subject: Affordable Housing Reserve Fund Policy Bylaw No. 3866, 2008 For:
CHARTER TOWNSHIP OF FENTON SEWER SYSTEM FINANCIAL OVERVIEW MARCH, 2018
 CHARTER TOWNSHIP OF FENTON SEWER SYSTEM FINANCIAL OVERVIEW MARCH, 2018 Fenton Township continues to receive inquiries regarding the relatively high sewer use fees that Township residents have been paying
The cost of increasing social and affordable housing supply in New South Wales
 The cost of increasing social and affordable housing supply in New South Wales Prepared for Shelter NSW Date December 2014 Prepared by Emilio Ferrer 0412 2512 701 eferrer@sphere.com.au 1 Contents 1 Background
1. An adequate provision of affordable housing is a fundamental and critical feature of any strong, livable and healthy community.
 Strengthen Ontario s Provincial Policy Statement as one tool to meet the province s housing needs Submission by Wellesley Institute to PPS five-year review The Wellesley Institute believes that a strengthened
The Canadian Real Estate Association News Release
 The Canadian Real Estate Association News Release Canadian home sales drop again in June Ottawa, ON, July 17, 2017 According to statistics 1 released today by The Canadian Real Estate Association (CREA),
HOUSING MARKET OUTLOOK REPORT
 2015 HOUSING MARKET OUTLOOK REPORT CANADIAN OVERVIEW Most regions posted modest gains in average residential sale price, despite increased inventory in many of Canada s housing markets. Residential property
The Canadian Real Estate Association News Release
 The Canadian Real Estate Association News Release Canadian home sales fall further in July Ottawa, ON, August 15, 2017 According to statistics 1 released today by The Canadian Real Estate Association (CREA),
Housing Bulletin Monthly Report
 January 21 1 Housing Bulletin Monthly Report Most new homes built in second half of 29 25, 2, 15, 1, 5, Dec 7 Jan 8 Feb 8 mar 8 apr 8 Alberta s 29 housing starts increased 72.8 per cent over 28, suggesting
Table of Contents. Appendix...22
 Table Contents 1. Background 3 1.1 Purpose.3 1.2 Data Sources 3 1.3 Data Aggregation...4 1.4 Principles Methodology.. 5 2. Existing Population, Dwelling Units and Employment 6 2.1 Population.6 2.1.1 Distribution
HOUSING NEEDS ASSSESSMENT
 HOUSING NEEDS ASSSESSMENT June 2018 TABLE OF CONTENTS EXECUTIVE SUMMARY... 2 INTRODUCTION... 3 VALUE IN PARTNERSHIPS... 4 DETERMINING AFFORDABILITY... 5 CURRENT HOUSING CONTEXT... 7 HOUSING PROVIDERS...
WHO PAYS FOR WHAT THE BIG PICTURE OF INFRASTRUCTURE INVESTMENT. A Smarter Growth Initiative Publication smartergrowth.ca
 WHO PAYS FOR WHAT THE BIG PICTURE OF INFRASTRUCTURE INVESTMENT A Smarter Growth Initiative Publication smartergrowth.ca 1 IT S YOUR CITY This publication was prepared by the Smarter Growth Initiative,
Impact Fees in Illinois
 f Impact Fees in Illinois 191 6 Advocacy Educat ion Ethics 201 6 The Purpose of this Report...is to provide information and guidance to aid in the discussion and consideration of impact fees at the local
Note on housing supply policies in draft London Plan Dec 2017 note by Duncan Bowie who agrees to it being published by Just Space
 Note on housing supply policies in draft London Plan Dec 2017 note by Duncan Bowie who agrees to it being published by Just Space 1 Housing density and sustainable residential quality. The draft has amended
Bill 7, Promoting Affordable Housing Act, 2016
 Bill 7, Promoting Affordable Housing Act, 2016 Submission to the Legislative Committee on Social Policy November 21, 2016 On behalf of the Association of Municipalities of Ontario and our members, I would
Trends in Affordable Home Ownership in Calgary
 Trends in Affordable Home Ownership in Calgary 2006 July www.calgary.ca Call 3-1-1 PUBLISHING INFORMATION TITLE: AUTHOR: STATUS: TRENDS IN AFFORDABLE HOME OWNERSHIP CORPORATE ECONOMICS FINAL PRINTING DATE:
HOUSING ISSUES IN NORTHERN ALBERTA. June 1, 2007
 HOUSING ISSUES IN NORTHERN ALBERTA June 1, 2007 INTRODUCTION Housing is fundamental to our social and economic well-being as individuals and communities. In northern Alberta, development is outpacing housing
HOUSING MARKET OUTLOOK Calgary CMA
 H o u s i n g M a r k e t I n f o r m a t i o n HOUSING MARKET OUTLOOK Calgary CMA C a n a d a M o r t g a g e a n d H o u s i n g C o r p o r a t i o n Date Released: Fall 2011 NEW HOME MARKET Total housing
The Canadian Real Estate Association News Release
 The Canadian Real Estate Association News Release Canadian home sales edge down from December to January Ottawa, ON, February 15, 2017 According to statistics 1 released today by The Canadian Real Estate
Provincial property transfer taxes and fees
 Select Standing Committee on Finance and Government Services Room 224, Parliament Buildings Victoria, BC V8V 1X4 Submitted to committee members by email Committee members: This year s budget consultation
A National Housing Action Plan: Effective, Straightforward Policy Prescriptions to Reduce Core Housing Need
 Co-operative Housing Federation of Canada s submission to the 2009 Consultations on Federal Housing and Homelessness Investments A National Housing Action Plan: Effective, Straightforward Policy Prescriptions
ental market report CMHC s Fall survey of rental hous Average vacancy rate in ³ N regina 2002 IN THIS Regina slips from 2001 level ISSUE
 r ental market report Canada Mortgage and Housing Corporation Average vacancy rate in IN THIS Regina slips from 2001 level ISSUE Average vacancy rate slips... 1 CMHC s Fall survey of rental hous ing found
TRI-CITIES ANNUAL HOUSING AFFORDABILITY REPORT
 TRI-CITIES ANNUAL HOUSING AFFORDABILITY REPORT April 2013 Section 1: Housing Affordability Indicators Subject Page 1. Household Income 2 2. Housing Price Index 3 3. Affordable Incomes Ownership 4 4. Purpose-Built
Land Dedication (Reserves)
") Land Dedication (Reserves) This technical document is part of a series of draft discussion papers created by Municipal Affairs staff and stakeholders to prepare for the Municipal Government Act Review.
Land Dedication (Reserves) This technical document is part of a series of draft discussion papers created by Municipal Affairs staff and stakeholders to prepare for the Municipal Government Act Review.
The Canadian Real Estate Association News Release
 The Canadian Real Estate Association News Release Canadian home sales activity softens further in November Ottawa, ON, December 17, 2018 Statistics 1 released today by the Canadian Real Estate Association
INDEXING THE GST NEW HOUSING REBATE: THE MOST URGENT ISSUE FOR THE FEDERAL BUDGET
 INDEXING THE GST NEW HOUSING REBATE: THE MOST URGENT ISSUE FOR THE FEDERAL BUDGET Canadian Home Builders Association Pre-Budget Submission August 2008 Summary The most urgent issue for the Canadian Home
Myth Busting: The Truth About Multifamily Renters
 Myth Busting: The Truth About Multifamily Renters Multifamily Economics and Market Research With more and more Millennials entering the workforce and forming households, as well as foreclosed homeowners
Housing Bulletin Monthly Report
 February 21 1 Housing Bulletin Monthly Report Housing Starts 25, 2, 15, 1, 5, Alberta Housing Starts up 5 per cent from 29 From February 29 to 21, preliminary housing starts increased 82.7 per cent across
Document under Separate Cover Refer to LPS State of Housing
 Document under Separate Cover Refer to LPS5-17 216 State of Housing Contents Housing in Halton 1 Overview The Housing Continuum Halton s Housing Model 3 216 Income & Housing Costs 216 Indicator of Housing
Rental Market report. British Columbia Highlights* Highlights. Housing market intelligence you can count on
 H o u s i n g M a r k e t I n f o r m a t i o n Rental Market report Highlights* C a n a d a M o r t g a g e a n d H o u s i n g C o r p o r a t i o n Date Released: Spring 2011 Figure 1 Figure 2 Vancouver
NORTHWEST TERRITORIES HOUSING CORPORATION
 NORTHWEST TERRITORIES HOUSING CORPORATION OVERVIEW MISSION The mission of the Northwest Territories Housing Corporation (NWTHC) is to ensure, where appropriate and necessary, that there is a sufficient
CITY OF SASKATOON COUNCIL POLICY
 ORIGIN/AUTHORITY Planning and Development Committee Report No. 26-1990; Legislation and Finance Committee Report No. 42-1990; City Commissioner s Report No. 29-1990, and further amendments up to and including
Member consultation: Rent freedom
 November 2016 Member consultation: Rent freedom The future of housing association rents Summary of key points: Housing associations are ambitious socially driven organisations currently exploring new ways
BYLAW 5781 ****************
 BYLAW 5781 **************** A BYLAW OF THE CITY OF LETHBRIDGE PROVIDING FOR THE IMPOSITION OF AN OFF-SITE LEVY IN RESPECT OF LAND TO BE DEVELOPED OR SUBDIVIDED FOR THE YEARS 2013, 2014, 2015 and 2016 ************************************************************
City of Brandon Brownfield Strategy
 City of Brandon Brownfield Strategy 2017 Executive Summary A brownfield is a property, the expansion, redevelopment, or reuse of which may be complicated by the presence or potential presence of a hazardous
The Canadian Real Estate Association News Release
 The Canadian Real Estate Association News Release Canadian home sales post solid gain in November Ottawa, ON, December 14, 2017 According to statistics 1 released today by The Canadian Real Estate Association
News Release. Canadian home sales edge up in February Ottawa, ON, March 13, The Canadian Real Estate Association
 The Canadian Real Estate Association News Release Canadian home sales edge up in February Ottawa, ON, March 13, 2015 According to statistics 1 released today by The Canadian Real Estate Association (CREA),
Federal Budget Pre-budget Submission: How best to use money for housing to stimulate the economy
 Federal Budget 2016-2017 Pre-budget Submission: How best to use money for housing to stimulate the economy February 2, 2016 John Dickie President Canadian Federation of Apartment Associations 640 1600
The Canadian Real Estate Association News Release
 The Canadian Real Estate Association News Release Canadian home sales rebound in January Ottawa, ON, February 16, 2016 According to statistics 1 released today by The Canadian Real Estate Association (CREA),
News Release. Canadian home sales fall back in October Ottawa, ON, November 15, The Canadian Real Estate Association
 The Canadian Real Estate Association News Release Canadian home sales fall back in October Ottawa, ON, November 15, 2013 According to statistics 1 released today by The Canadian Real Estate Association
Housing Bulletin Monthly Report
 December 21 1 Housing Bulletin Monthly Report Alberta Housing Starts Fall in November 21 Canada Housing Starts 25 2 15 1 5 8 NOV 8 DEC 8 Preliminary Housing Starts in Alberta* and Canada* November 28 to
Section VIII. History
 Section VIII History In This Section: An interesting look at the history of Co-operative Housing, spanning from its early roots in mid- 1800s England to Shamrock's founding in 1990. Table of Contents
Summary of Findings. Community Conversation held November 5, 2018
 Summary of Findings Housing and the Future of Lebanon: What types of homes do we need in Lebanon to have a thriving community for all who live or work here? Community Conversation held November 5, 2018
Two-year Incentive Program
 URBAN DEVELOPMENT INSTITUTE PACIFIC REGION #200 602 West Hastings Street Vancouver BC V6B 1P2 Canada T. 604.669.9585 F. 604.689.8691 www.udi.bc.ca Below is a list of approaches the Province can use to
The Canadian Real Estate Association News Release
 The Canadian Real Estate Association News Release Canadian home sales edge up in September Ottawa, ON, October 14, 2016 According to statistics 1 released today by The Canadian Real Estate Association
HOUSING MARKET OUTLOOK
 HOUSING MARKET INFORMATION HOUSING MARKET OUTLOOK Saskatchewan C A N A D A M O R T G A G E A N D H O U S I N G C O R P O R A T I O N Date Released: Fall 2018 1 Figure 1 Saskatchewan, Starts (000s) 12 Forecast
The Canadian Real Estate Association News Release
 The Canadian Real Estate Association News Release Canadian home sales activity eases in October Ottawa, ON, November 15, 2018 Statistics 1 released today by the Canadian Real Estate Association (CREA)
Administration and Calculation of Servicing Agreement Fees and Development Levies
 Administration and Calculation of Servicing Agreement Fees and Development Levies Policy Title: Applies to: Reference # Administration and Calculation of Servicing Agreement Fees and City of Regina ###-XXX-##
Hamilton CMA apartment vacancy rate edges down in 2001
 HamiltonCMA Canada Mortgage and Housing Corporation apartment vacancy rate edges down in 2001 In 2001, the private apartment vacancy rate in the Hamilton Census Metropolitan (CMA) edged down to 1.3 percent
NSW Affordable Housing Guidelines. August 2012
 August 2012 NSW AFFORDABLE HOUSING GUIDELINES TABLE OF CONTENTS 1.0 INTRODUCTION... 1 2.0 DEFINITION OF KEY TERMS... 1 3.0 APPLICATION OF GUIDELINES... 2 4.0 PRINCIPLES... 2 4.1 Relationships and partnerships...