CITY OF MEDFORD OREGON
|
|
|
- Dale Whitehead
- 5 years ago
- Views:
Transcription


1 CITY OF MEDFORD OREGON ANALYSIS OF IMPEDIMENTS TO FAIR HOUSING CHOICE Submitted: May 15, 2015 Contact: Parks and Recreation Department Grants Administrator 701 North Columbus Avenue Medford, Oregon Office: (541)

2 CITY OF MEDFORD, OREGON ANALYSIS OF IMPEDIMENTS TO FAIR HOUSING CHOICE Prepared for: City of Medford, Oregon City Manager s Office Grants Administrator 411 W. 8 th Street Medford, Oregon Prepared by: J-Quad Planning Group, LLC Midway Road, Suite 210 Addison, Texas July 1, 2014
3 Introduction and Acknowledgements Introduction This report provides an Analysis of Impediments to Fair Housing Choice (AI), commissioned by the City of Medford. This AI was conducted using a methodology consistent with the U.S. Department of Housing and Urban Development (HUD) guidelines published in the Fair Housing Planning Guide. HUD requires that each jurisdiction receiving federal funds certify that it is affirmatively furthering fair housing. The certification specifically requires jurisdictions to do the following: Conduct an analysis of impediments to fair housing choice within the state or local jurisdiction. Take appropriate actions to overcome the effects of any impediments identified through that analysis. Maintain records reflecting the analysis and actions in this regard. Lead and Participating Agencies The City of Medford City Manager s Office Grants Management served as lead agency for the development of the AI and was responsible for oversight and coordination of the process. The City of Medford retained J-Quad Planning Group, LLC, a Community Development, Urban Planning and Housing Consulting firm to assist in the preparation of the AI. Acknowledgements Data collected in preparing the AI relied in part on input from the public, including information gathered from three public engagement focus group sessions, key person interviews, and data provided by City Departments. We also acknowledge the participation of the City government officials, real estate and banking industries, non-profit, social services, business, home builders, apartment owners and managers, and the general public.
4 Table of Contents Executive Summary i Section 1 Community Profiles...1 Introduction Demographic Profile Income Profile Employment and Education Profile Public Transportation Profile Housing Profile Section 2 Fair Housing Law, Municipal Policies, Complaint Analysis Introduction Fair Housing Enforcement Production and Availability of Affordable Units Regulatory and Public Policy Review Analysis of Fair Housing Complaints Conclusions and Implications for Fair Housing Barriers Section 3 Focus Groups and Community Engagement Introduction Focus Group Concerns and Comments Solutions Section 4 - Home Mortgage Disclosure Act Data (HMDA) Analysis 62 Introduction Analysis Conclusions Section 5 - Fair Housing Index..82 Introduction Methodology Findings Section 6 Impediments and Remedial Activities..90 Introduction Real Estate Related Impediments Public Policy Impediments Banking, Finance, Insurance and related impediments Socio Economic Impediments Neighborhood Conditions Related Impediments Section 7 Oversight, Monitoring and Maintenance of Records...119
5 Executive Summary Introduction In 1995 the U.S. Department of Housing and Urban Development (HUD) announced that entitlement communities - communities receiving direct federal funding from Community Development Block Grant, HOME Investment Partnership and Emergency Solutions Grant programs must conduct a study of existing barriers to housing choice. This required study is referred to as the "Analysis of Impediments (AI) and is part of entitlement communities' consolidated planning process. In 2014 HUD published draft regulations of the Assessment of Fair Housing (AFH) with proposed changes to the 1995 AI requirements. These new regulations are expected to be finalized in The purpose of the AI is to examine whether state and local laws, private, public and non-profit sector regulations, administrative policies, procedures, and practices are impacting the location, availability, and accessibility of housing in a given area. The AI is not a Fair Housing Plan rather it is an analysis of the current state of fair housing choice including barriers and impediments in Medford. The AI identifies specific barriers that need to be addressed if future fair housing initiatives are to be successful. Each jurisdiction receiving federal funds must certify that it is affirmatively furthering fair housing. The certification specifically requires jurisdictions to do the following: Conduct an analysis of impediments to fair housing choice within the local jurisdiction. Take appropriate actions to overcome the effects of any impediments identified through that analysis. Maintain records reflecting the analysis and actions in this regard. i
6 The City of Medford s commitment to affirmatively furthering fair housing choice and affordable housing through planning and entitlement program design and implementation is noteworthy. A major impediment is that the limited amount of entitlement funding received makes it difficult for the City to have measurable impact on removing or lessening the impact of some fair housing impediments. City and other non-federal entitlement resources and private sector support will be necessary in order to address many of the impediments. Despite limited funds, the City s efforts will continue to improve and strengthen its older and lower income areas. Evaluating fair housing is a complex process involving diverse and wide-ranging considerations. The role of economics, housing markets, and personal choice are important to consider when examining fair housing. Any disproportionate impacts on persons of a particular race, ethnicity, or members of the protected classes under fair housing law have been comparatively analyzed to determine to what extent those disparities are limiting fair housing choice. The AI methodology included community engagement interviews and focus group sessions; the construction of a community profile, fair housing index, analysis of the Home Mortgage Disclosure Act (HMDA) data; and a fair housing law and public policy analysis including national landmark court litigation, local fair housing legislation, development policies and regulations, fair housing complaints and a review of entitlement grant programs operated by the City. Recommended Remedial Actions detailed in this report represent recommendations by the consultant to the City for addressing impediments based on their experience and best practices used in other jurisdictions. The City is not obligated to implement the consultant s recommendations and may choose other options to address the impediment based on their evaluation of this report. Some remedial actions recommended are conceptual frameworks for addressing the impediments and will require further research, feasibility and cost analysis, and final program design by the City if they choose to implement them. The following narrative provides a summary of each section of the report. ii
7 Community Profiles Demographics - The demographic analysis of Medford concentrates on the magnitude and composition of the population and changes that occurred between 2000 and 2010, and demographic data from the American Community Survey five year average for Please note that the maps present data by census tract with an overlay of county and city boundaries. According to the 2010 Census, the population of Jackson County was 203,206, a large portion of which resided in Medford (74,907). Table 1.1, on page 4 of the Community Profile shows that the County s population increased by 21,937 or 12.1 percent between 2000 and The population of Medford increased by 18.6 percent during the same period. In Jackson County, the largest racial group was White, with about 89 percent of the population. In Medford, the White population was about 86 percent of the total, with Hispanics making up the majority of the remainder at 13.8 percent. In the County, Hispanics were 10.7 percent of the total. African-Americans represented 0.9 percent of the population in Medford and 1.2 percent of Jackson County. The Census Bureau does not recognize Hispanic as a race, but rather as an ethnicity. The White population increased by 13.4 percent in Medford between 2000 and 2010, while the Hispanic population increased by 76.7 percent. The African- American population grew by percent. There was a 65.1 percent increase in the Asian and Pacific Islander population between 2000 and 2010, accounting for 1.9 percent of the total population of the city in Households - The percentage of female-headed households among White households in Medford was 12.8 percent, compared to 49.1 percent in African- American households, and 21.0 percent in Hispanic households. Only 10.3 percent of African-American households were husband/wife family households, compared to 46.0 percent of White households and 42.5 percent of Hispanic households. iii
8 Non-family households, defined by HUD as a single occupant household or nonrelated individuals living together as indicated in the census data, among Whites made up 37.3 percent of all White households in Medford. Non-family households among African-Americans accounted for 23.0 percent of all African- American households. Non-family households among Hispanics accounted for 26.5 percent of all Hispanic households. Most of the non-family households were householder living alone. Occupation - Employment opportunities in the area and educational levels of the employees make a significant impact on housing affordability and the location choice of residents. There have been some small shifts in the distribution of occupations between 2000 and Construction occupations saw a reduction of 2.0 percentage points, falling to 4.4 percent of the workforce. The largest occupation was Education, etc. with over 21 percent of the workforce. Small increases were seen in Arts and Entertainment, etc. (3.4 percentage point increase) and Professional, etc. (1.6 percentage point increase). Largest Employers - According to the major employer data as published by the Chamber of Medford - Jackson County, the largest employers in Jackson County include Asante with 4,080 employees, Lithia Motors, Inc. with 3,000 workers, and Harry & David with 2,000 workers. Rogue Valley Medical Center had 1,638 employees. Allegiant Air had 1,500 employees and Providence Health Systems of S. Oregon had 1,300 workers. The Medford School District 549C had 1,157 workers. Jackson County had 1,027 workers and Wal-Mart Stores had 930 employees. Unemployment - According to the US Department of Labor s Bureau of Labor Statistics, the unemployment rate for the Medford was 9.4 percent in August By comparison, the US unemployment rate was 7.2 in August 2013 and 8.1 percent for the State of Oregon. The American Community Survey data for the period as reported for Medford showed an unemployment rate of 9.3 for the US and 10.8 percent for Oregon. iv
9 Household Income - The census data provides the distribution of income across income classes for Whites, African American, and Hispanics. Overall, the income distribution data show disparities in Medford s income distribution across these populations and a higher proportion of low-income households within the African American and Hispanic communities. The modal income classes (the income classes with the highest number of households) for Whites was the $50,000 to $74,999 category with 19.0 percent earning in this income range. In comparison, 11.4 percent of Hispanic households and 10.9 of African-American households had incomes in this range. The most frequently reported income class for African-Americans and Hispanics was the $25,000 to $34,999 income range with 20.0 percent of Hispanic households and 48.5 percent of African-American households. Over 38 percent of Hispanic households earned less than $25,000 per year, compared to 28.2 percent of White households and 35.1 percent of African-American households. According to the American Community Survey (ACS) estimates (5- year average), the median household income for White households was $42,856, $29,414 for African-American households, and $30,775 for Hispanic households, compared to $42,244 for the overall city. Poverty - The poverty data reveals that poverty is disproportionately impacting African American and Hispanic populations in the City. The incidence of poverty among Hispanics in Medford was 31.0 percent of their total population between 2008 and 2012, and poverty among African-Americans was reported to be 21.6 percent. Among White persons, the data reported 18.9 percent lived in poverty. Educational Attainment The analysis of education attainment shows the percentage of the population age 25 or older with less than a high school degree in Medford; the percentage of the total population without a high school degree; and the educational attainment percentages by race and ethnicity. According to the ACS estimates (5-year average), a total percentage of the v
10 population over 25 years without a high school degree is 21.3 percent. When looking at the distribution by race/ethnicity, the data show a Hispanic rate of 45.1 percent. The White population had 10.5 percent with less than a high school degree. For African-Americans, the rate was 26.2 percent. Public Transportation and Mobility - According to the RVTD website, Rogue Valley Transportation District is the public transportation provider for Medford and surrounding areas of Jackson County. RVTD has provided public transportation since RVTD provides three primary types of service: Fixed Route Service, Valley Lift (paratransit system), and TransLink. The Fixed Route Service features seven routes providing service to East and West Medford, Jacksonville, Central Point, White City, Ashland, RVMC, and the airport. Most buses run from early morning weekdays to about 10:00 pm. Saturday service is more limited and buses do not run on Sundays. Valley Lift is a shared ride, curb-to-curb, wheelchair accessible transportation service for people whose disabilities prevent them from using the Rogue Valley Transportation District's (RVTD's) lift-equipped buses. Valley Lift drivers and dispatchers are currently provided by Paratransit Services, a regional, non-profit company. TransLink provides transportation services to eligible Oregon Health Plan and eligible Medicaid clients traveling to receive authorized medical services. Housing - According to the 2010 Census, the total number of housing units in Medford was 32,430 with 2,351 or 7.2 percent vacant units. There were 26,297 housing units in Medford in This represents a 23.3 percent increase in the number of housing units between 2000 and In 2010, 48.1 percent were owner-occupied and 44.6 percent were renter-occupied. The median housing value in the city was $222,400 and the median contract rent was $728 between 2008 and Approximately 51 percent of White households lived in owneroccupied housing, compared to 5.5 percent of African-American households and vi
11 33.1 percent of Hispanic households. African-American and Hispanic owner households were well below the city average of 48.1 percent in Fair Housing Law, Court Case, Policies, Regulatory, Entitlement Programs and Complaint Analysis Fair Housing Law - The City of Medford has not enacted substantially equivalent fair housing law to that of the Federal Fair Housing Act and does not provide local enforcement. The City s Grants Administrator is responsible for conducting public education, training and outreach of fair housing rights and remedies in Medford. Complaint Analysis - Fair housing complaint information was received from the U.S. Department of Housing and Urban Development and provides a breakdown of complaints filed for Medford from April 1, 2009 through March 31, The complaints filed with HUD are received from the Fair Housing and Equal Opportunity (FHEO) regional office in Seattle, Washington. Eight complaints were filed according to one or more of seven bases, including; National Origin, Color, Religion, Familial Status, Handicap, Sex, and Race. Development Regulations - The City zoning ordinance, development code and public policies were examined to reveal any current ordinances or policies that impede fair housing choice. There were no impediments reveal as of the results of this analysis. Entitlement Programs - An assessment of characteristics affecting housing production, availability, and affordability in Medford and utilization of Federal Entitlement Grant funding was conducted, including the adequacy and effectiveness of programs designed and implemented utilizing CDBG Entitlement funding by the City of Medford. The assessment evaluated the programs ability to reach their target markets and how effective they are in identifying and serving those who have the greatest need. We also assessed the extent to which the agencies prioritized funding and utilized programs to address impediments identified in the City s Fair Housing vii
12 Impediment Analysis conducted prior to FY The City of Medford s FY 2013 Annual Action Plan submitted to HUD indicated that the City of Medford received approximately $560,450 in Entitlement funding for FY 2013 and operated a total budget of $799,137 for that program year. Industry Practices - Real estate related publications advertising the sale or rental of housing and advertising home improvements and remodeling, directed toward persons in the Medford area were reviewed. Some publications made blanket statements at the front of the publication stating that the magazines as well as their advertisers are subject to the Federal Fair Housing Act. Advertisers included FHEO statements and/or logos. Including these logos can be a means of educating the home seeking public that the property is available to all persons. There were no concerns relative to industry practices in advertising. Community Engagement and Focus Groups, Fair Housing Index, Home Mortgage Disclosure Act Analysis Fair housing choice within Medford encounters a number of impediments, as identified through the community engagement process, and the construction of a Community Profile, Fair Housing Index and analysis of the Home Mortgage Disclosure Act data. All three analyses reveal disparate impacts on minority populations when comparing income, educational attainment, poverty, unemployment, mortgage and housing lending, homeownership and other characteristics to that of Whites. Some area characteristics and physical conditions where minority populations and lower income persons are most likely to find housing affordable, are indicative of the ways in which the economy and housing and neighborhood conditions have suffered as a result of housing market distortions and disinvestment. Conditions further demonstrate that public policy and programmatic investments have only minimally improved the situation. vii i
13 Areas of Concentrated Poverty and Racial / Ethnic Concentration and Segregation (RCAP/ECAP) - The U. S. Department of HUD has defined Areas of Poverty, Racial and Ethnic Concentration and Segregation (RCAP/ECAP) as census tracts comprised of 50% or greater minority population and 3 times or more the poverty level of the MSA and generally lacking the basic amenities and failing to provide a quality of life expected and desired for any. The HUD RCAP/ECAP Analysis was performed to determine areas of racial and ethnic population and poverty concentrated census tracts. Concentrations of assisted housing were also analyzed to determine areas where housing impediments and demographic characteristics are impacting choice. The City of Medford did not have any census tracts within its corporate boundaries meeting the HUD RCAP- ECAP definition. Focus Groups and Community Engagement Three Public Forums and Stakeholder Focus Group sessions were held on May 21, 2014 at the City of Medford City Hall Building, th Street, Medford, Oregon Supplemental interviews were conducted with and information and input received from representatives unable to attend the sessions. Participants in the sessions and supplemental interviews included Medford city staff and other government representatives; administrators from local colleges, universities, and school districts; non-profit organizations, home builders, housing and social service agencies representatives; real estate and financial industry representatives; and the general public and other community representatives. Participants in the focus groups and public forums and the general public were given an opportunity to complete a Priority Needs Survey as part of the Consolidated Planning and Analysis of Impediments process. The survey was presented at each of the aforementioned sessions and also made available on the City s web site for completion and submission on line. ix
14 Home Mortgage Disclosure Act Analysis (HMDA) - In Medford, the least success in borrowing was found in the refinance and home improvement loan sectors. The highest success rates were found in the home purchase loan sector, particularly in government backed loans. Home purchase loans were the most frequent loan type, edging out refinance loans. Origination rates among Whites were higher than minorities in home purchase, home Improvement and refinance loans. Although Hispanics and African Americans accounted for the second and third highest number of applications after Whites, respectively, the percentage of loan originations for both were significantly lower compared to their percentages of population in the city. Applicants poor credit history or higher debt-to-income ratios accounted for the highest percentage of loan denials among all races and ethnicities. The Section 04 HMDA Analysis is based on a review of Federal Financial Institutions Examination Council (FFIEC) data for home mortgage activity from the federal agencies that regulates the home mortgage industry. The data contain variables that facilitate analysis of mortgage lending activity, such as race, income, census tract, loan type, and loan purpose. Section Five of the report, the Fair Housing Index, highlights geographic areas indicating a concentration of attributes prevalent in fair housing issues. Map 5.1, in Section 05 of the Fair Housing Index, identifies census tracts designated as having high, moderate and low risk of fair housing related problems and impediments based on a correlation of ten characteristics most likely to impact housing choice. The census tracts designated as having Moderate to High Risk of fair housing related problems are concentrated in the central parts of Medford, spreading southeast from downtown Medford. Eastern and northern parts of Medford and most of the rest of Jackson County fall into the Low Risk categories. x
15 Impediments to Fair Housing Choice Impediments to fair housing choice are detailed in Section 6 of this report. Five major categories of impediments were analyzed: Real Estate Impediments; Public Policy Impediments; Neighborhood Conditions as Impediments; Banking, Finance, and Insurance Related Impediments; and Socioeconomic Impediments. For each impediment identified, issues and impacts are detailed. Remedial actions are recommended to address each impediment. Some of the remedial actions recommended in this section are conceptual frameworks for addressing impediments. These actions will require further research, analysis, and final program design by the City of Medford for implementation. The Analysis of Impediments identified impediments related to real estate market conditions as impediments: a lack of affordability, cost burden and insufficient Income; public policy related impediments: a lack of public awareness of fair housing rights; limitations of public transportation and mobility; banking, finance, insurance and other Industry related impediments: Lack of affordability and disparities among minorities in obtaining mortgage and home improvement financing; and predatory lending; socio-economic impediments: poverty and low-income; and neighborhood conditions related impediments: Limited resources to assist lower income, elderly and indigent homeowners maintain their homes; and the need to inprove housing conditions and stability in neighborhoods. Remedial Activities Designed To Address Impediments - The major focus of the recommended remedial actions is creating partnerships, identifying new federal, state, city and private resources and leveraging entitlement funds needed to enhance the jurisdiction s ability to increase its supply of affordable housing and better meet the needs of low-income and moderate-income households. The identified impediments and remedial actions are summarized below and details presented in Section Six of the report. xi
16 Section 1: Community Profile Introduction The Community Profile is a review of demographic, income, employment, and housing data of Medford. The data were gathered from American Community Survey (ACS) 5-Year estimates; 1990, 2000, and 2010 U.S. Census; and other sources. The following sections provide an analysis of the current status of Medford, Oregon: Demographics documents and analyzes the basic structure of the community in terms of racial diversity, population growth, and family structure. Income - analyzes income sources, the distribution of income across income class, and poverty. Employment - examines unemployment rates, occupation trends, and major employers. Public Transportation examines access and availability of public transit systems. Housing - examines data on the housing stock, with particular attention to the age of the housing stock, vacancy rates, tenure, and cost burdens. Detailed analyses will concentrate on three ethnic groups in Medford: White, Hispanic, and African-American. All other ethnic groups are smaller in number and percentage and, therefore, the results of their analysis will not be presented in detail. African-Americans are not the third largest sub-population, however they are the fastest growing over the past 10 years and are the racial group which, historically, witnesses the most discrimination. The analysis is supported with tables and maps provided for reference. While most of the data presented in the tables and maps are directly referenced in the text, there may be some cases where additional information was included for the reader s benefit, though not specifically noted in the text. 1
17 2
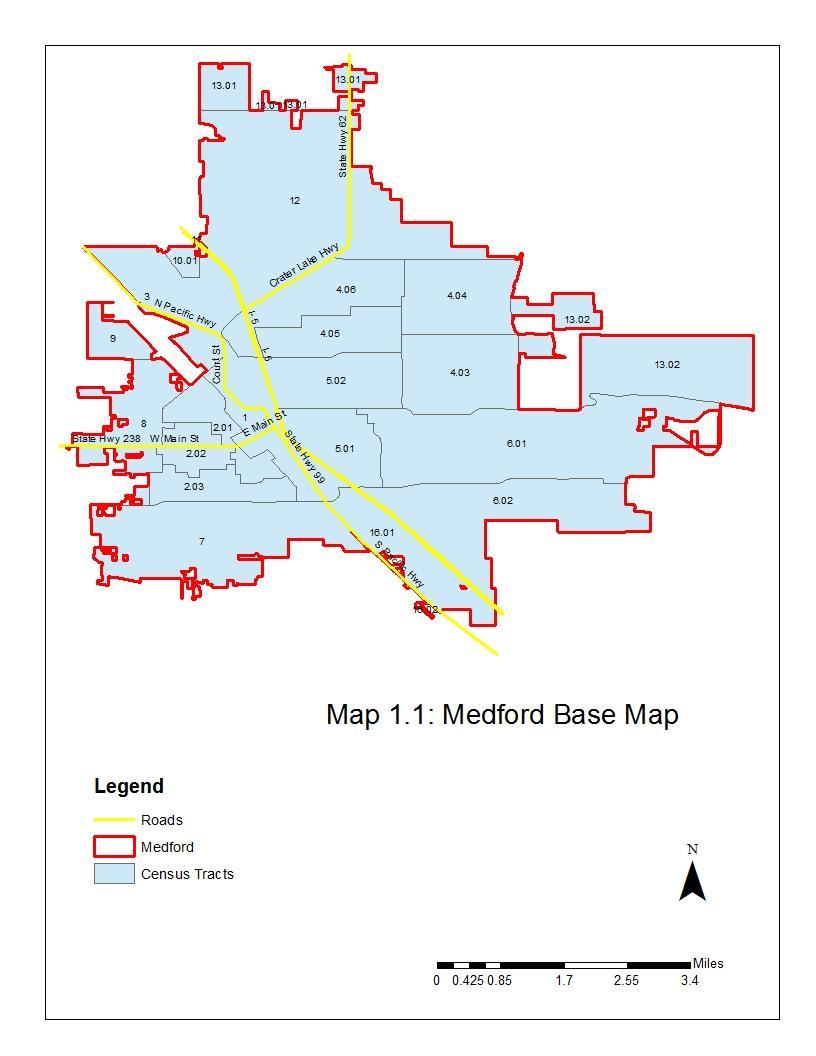
18 1.1. Demographics The demographic analysis of the Medford area concentrates on the magnitude and composition of the population and changes that occurred between 2000 and Please note that the attached maps present data by census tract with an overlay of the city limits for Medford. For reference, Map 1.1, on the previous page, provides a visual representation of Medford for comparison with thematic maps below. Race/Ethnicity According to the 2010 Census, the population of Jackson County was 203,206, a large portion of which resided in The population of Medford increased by 18.6 percent between 2000 and Medford (74,907). Table 1.1, on page 4, shows that the County s population increased by 21,937 or 12.1 percent between 2000 and The population of Medford increased by 18.6 percent during the same period. In Jackson County, the largest racial group was White, with about 89 percent of the population. In Medford, the White population was about 86 percent of the total, with Hispanics making up the majority The White population was about 89 percent of the total population in Jackson County and 86 percent in Medford in Fourteen percent of the population of Medford identified as Hispanic. of the remainder at 13.8 percent. In the County, Hispanics were 10.7 percent of the total. African-Americans represented 0.9 percent of the population in Medford and 1.2 percent of Jackson County. The Census Bureau does not recognize Hispanic as a race, but rather as an ethnicity. The White population increased by 13.4 percent in Medford between 2000 and 2010, while the Hispanic population increased by 76.7 percent. The African- American population grew by percent. There was a 65.1 percent increase in the Asian and Pacific Islander population between 2000 and 2010, accounting for 1.9 percent of the total population of the city in Maps 1.2 and 1.3, starting on page 5, indicate spatial concentrations of the Hispanic and African-American populations within Medford. 3
19 Table 1.1 Total population by race and ethnicity for Jackson County and Medford, 2000 and % Change Race # % # % Jackson County White 166, % 180, % 8.5% African-American % 2, % 229.6% American Indian and Eskimo 1, % 1, % -15.8% Asian and Pacific Islander 1, % 2, % 51.5% Other Race 5, % 9, % 76.3% Two or More Races 5, % 7, % 35.1% Total 181, % 203, % 12.1% Hispanic (ethnicity) 10, % 21, % 103.7% Medford White 56, % 64, % 13.4% African-American % % 112.8% American Indian and Eskimo % % 38.1% Asian and Pacific Islander % 1, % 65.1% Other Race 2, % 4, % 83.6% Two or More Races 2, % 2, % 45.3% Total 63, % 74, % 18.6% Hispanic (ethnicity) 5, % 10, % 76.7% Source: 2000 and 2010 US Census 4
20 5
21 6
22 Household Structure In many communities, female-headed households and female-headed households with children face a higher rate of housing discrimination than other Forty-nine of all African-American households in Medford were female-headed households, compared to less than 13 percent of White households. households. Higher percentages of female-headed households with children under the age of 18, sometimes correlates to increased complaints of reported rental property owners refusing to rent to tenants with children. This factor is evidenced when comparing this demographic factor to fair housing complaint data. As shown in Table 1.2, on the following page, the percentage of female-headed households among White households in Medford was 12.8 percent, compared to 49.1 percent in African-American households, and 21.0 percent in Hispanic households. Only 10.3 percent of African-American households were husband/wife family households, compared to 46.0 percent of White households and 42.5 percent of Hispanic households. Non-family households, defined by HUD as a single occupant household or nonrelated individuals living together as indicated in the census data, among Whites made up 37.3 percent of all White households in Medford. Non-family households among African-Americans accounted for 23.0 percent of all African-American households. Non-family households among Hispanics accounted for 26.5 percent of all Hispanic households. Most of the non-family households were householder living alone. The spatial distribution of female-headed households with children is shown in Map 1.4 on page 9. 7
23 Table 1.2 Household structure by race for Medford, White Hispanic African-American # of % of # of % of # of % of Household Type Households Households Households Households Households Households Family Households 17, % 1, % % Husband-wife family 13, % 1, % % Other family: 4, % % % Male householder, no wife present 1, % % % Female householder, no husband present 3, % % % Non-family households: 10, % % % Householder living alone 8, % % % Householder not living alone 1, % % 0 0.0% Total Households 28, % 2, % % Source: American Community Survey 8
24 9
25 1.2. Income Low-income households tend to be housed in less desirable housing stock and in less desirable areas in the city. Income limitations often prevent those households from moving to areas where local amenities raise the value of the housing. Income plays a very important part in securing and maintaining housing. Household Income The data in Table 1.4 and Chart 1.1 on page 17 show the distribution of income across income classes among Whites, Hispanics, and African-American. Overall, the income distribution data show some disparity in Medford s income distribution across these populations. Chart 1.1 shows that the modal income classes (the income classes with the highest number of households) for Whites was the $50,000 to $74,999 category with 19.0 percent earning in this income range. In comparison, 11.4 percent of Hispanic households and 10.9 of African-American households had incomes in this range. The most frequently reported income class for African-Americans and Hispanics was the $25,000 to $34,999 income range with 20.0 While the modal income category for African-American households was the $25,000 to $34,999 range (48.5%), over 35 percent earned less than $25,000 in 2012 (5-year average). Table 1.3 Median Income for Medford, Median Household Income Medford $42,244 Source: American Community Survey percent of Hispanic households and 48.5 percent of African-American households. Over 38 percent of Hispanic households earned less than $25,000 per year, compared to 28.2 percent of White households and 35.1 percent of African- American households. According to the American Community Survey (ACS) estimates (5-year average), the median household income for White households was $42,856, $29,414 for African-American households, and $30,775 for Hispanic households, compared to $42,244 for the overall city. Map 1.5, on page 12, shows the 5-year 10
26 average median household income by census tract for Medford between 2008 and Table 1.4 Households by race by income for Medford, White Hispanic African-American # of % of # of % of # of % of Income Class Households Households Households Households Households Households Less than $10,000 2, % % % $10,000 to $14,999 2, % % 6 3.6% $15,000 to $24,999 3, % % % $25,000 to $34,999 3, % % % $35,000 to $49,999 4, % % 0 0.0% $50,000 to $74,999 5, % % % $75,000 to $99,999 3, % % 0 0.0% $100,000 or more 3, % % 9 5.5% Total 28, % 2, % % Median Household Income $42,856 $30,775 $29,414 Source: Five-Year Estimates, American Community Survey Chart 1.1 Households by race by income for Medford, % Chart 1.1: Percent of Households by Income Class by Race for Medford 50.0% 40.0% White Hispanic 30.0% 20.0% African- American 10.0% 0.0% Less than $10,000 $10,000 to $14,999 $15,000 to $24,999 $25,000 to $34,999 $35,000 to $49,999 $50,000 to $74,999 $75,000 to $99,999 $100,000 or more 11
27 12
28 Poverty The poverty data reported in Table 1.5 reveals that poverty is disproportionately impacting the Hispanic and African-American communities in the city. The incidence of poverty among Hispanics in Medford was 31.0 percent of their total population between 2008 and 2012, and poverty among African-Americans was reported to be 21.6 percent. Among White persons, the data reported 18.9 percent lived in poverty. The incidence of poverty among Hispanics was 31.0 percent in Medford, compared to 18.9 percent for Whites and 21.6 percent for African-Americans. Poverty rates in Medford are shown on page 14 in Map 1.6. Concentrations are found in central Medford, where rates range from 27 to 54 percent by census tract. Table 1.5 Poverty Status by race for Medford, White Hispanic African-American Number in % in Number in % in Number in % in Age Group Poverty Poverty Poverty Poverty Poverty Poverty Under 5 Years 1, % % % 5 Years % % % 6 to 11 Years 1, % % 0 0.0% 12 to 17 Years 1, % % % 18 to 64 Years 7, % 1, % % 65 to 74 Years % % 0 0.0% 75 Years and Over % % 0 0.0% Total 12, % % % Source: Five-Year Estimates, American Community Survey 13
29 14
30 1.3. Employment Occupation Employment opportunities in the area and educational levels of the employees make a significant impact on housing affordability and the location choice of residents. Table 1.6, below, provides an analysis of occupation data, which indicate that there have been some small shifts in the distribution of occupations between 2000 and Construction occupations saw a reduction of 2.0 percentage points, falling to 4.4 percent of the workforce. The largest occupation was Education, etc. with over 21 percent of the workforce. Small increases were seen in Arts and Entertainment, etc. (3.4 percentage point increase) and Professional, etc. (1.6 percentage point increase). Construction occupations fell by 2.0 percentage points, while Arts and Entertainment, etc. occupations grew by 3.4 percentage points. Table 1.6 Occupation of employed persons for Medford, 2000 and (5-Year Average) Percentage Point Industry 2000 Average Change Agriculture, forestry, fishing and hunting, and mining 2.0% 2.9% 0.9% Construction 6.4% 4.4% -2.0% Manufacturing 9.9% 8.5% -1.4% Wholesale trade 3.6% 2.2% -1.4% Retail trade 18.1% 16.6% -1.5% Transportation and warehousing, and utilities 3.9% 3.1% -0.8% Information 2.4% 2.5% 0.1% Finance and insurance, and real estate and rental and leasing 5.8% 6.1% 0.3% Professional, scientific, and management, and administrative and waste management services 8.0% 9.6% 1.6% Educational services, and health care and social assistance 21.6% 21.5% -0.1% Arts, entertainment, and recreation, and accommodation and food services 8.9% 12.3% 3.4% Other services, except public administration 5.7% 6.6% 0.9% Public administration 3.6% 3.6% 0.0% Source: 2000 US Census and Five-Year Estimates, American Community Survey 15
31 Unemployment The data presented in Table 1.7, below, provide a portrait of the distribution of the unemployed. Looking at the table, The unemployment rate in Medford as of August 2013 was 9.4 percent. unemployment looks moderate, with rates ranging from 10.2 percent for Hispanics to 12.3 percent for African-Americans. According to the US Department of Labor s Bureau of Labor Statistics, the unemployment rate for the Medford was 9.4 percent in August By comparison, the US unemployment rate was 7.2 in August 2013 and 8.1 percent for the State of Oregon. The American Community Survey data for the period as reported for Medford in the table, showed an unemployment rate of 9.3 for the US and 10.8 percent for Oregon. Map 1.7, on page 18, shows the distribution of unemployed in Medford. Table 1.7 Employment Status by race for Medford, Employment White Hispanic African-American Total Status Number Percent Number Percent Number Percent Number Percent In Labor Force: 33, % 4, % % 36, % In Armed Forces % 0 0.0% 0 0.0% % Civilian: 33, % 4, % % 36, % Employed 29, % 4, % % 32, % Unemployed 4, % % % 4, % Not in Labor Force 20, % 1, % % 22, % Total 54, % 6, % % 59, % Source: Five-Year Estimates, American Community Survey Educational Attainment Looking at education, Table 1.8 on page 17 shows the percentage of the population aged 25 or older with less than a high school degree in Medford. Over 45.1 percent of Hispanics over the age of 25 had less than a high school degree. The second column shows the percentage of the total population without a high school degree and the remaining three columns show the percentage by race. The data show a total percentage of the population over 25 16
32 years without a high school degree at 14.2 percent. When looking at the distribution by race/ethnicity, the data show a Hispanic rate of 45.1 percent. population had 10.5 percent with less than a high school degree. Americans, the rate was 26.2 percent. Table 1.8 Less than High School Degree for Medford, % Less than White Hispanic Black High School Degree % Less HS % Less HS % Less HS Medford 14.2% 10.5% 45.1% 26.2% Source: Five-Year Estimates, American Community Survey The White For African- Map 1.8 on page 19 shows the percentage of less than high school degree by census tract in Medford. 17
33 18
34 19
35 Largest Employers According to the major employer data as published by The Chamber of Medford/Jackson County, the largest employers in Jackson County include Asante with 4,080 employees, Lithia The largest employer in Jackson County was Asante with 4,080 employees, with health care facilities and education making up four of the top 10 employers. Motors, Inc. with 3,000 workers, and Harry & David with 2,000 workers. Rogue Valley Medical Center had 1,638 employees. Allegiant Air had 1,500 employees and Providence Health Systems of S. Oregon had 1,300 workers. The Medford School District 549C had 1,157 workers. Jackson County had 1,027 workers and Wal-mart Stores had 930 employees. Table 1.9 Major Employers, Medford MOST RECENT PRODUCT/ EMPLOYMENT COMPANY SERVICE DATA Asante Health System 4,080 Lithia Motors, Inc. Auto-Truck Dealers 3,000 Harry & David Direct Mail Merchandisers 2,000 Rogue Valley Medical Center Hospitals 1,638 Allegiant Air Commercial Airline 1,500 Providence Health System in S. OR Health Systems 1,300 Medford School District 549C Schools 1,157 Jackson County County Government 1,027 Wall-Mart Stores Department Stores 930 Boise Plywood Mills 875 Amy's Kitchen Food Manufacturer 710 Southern Oregon University Colleges & Universities 600 Food Services of America Food Service Supplier 560 Rogue Valley Manor Retirement Communities 450 VA S. Oregon Rehab Center Government Agencies 418 TOTAL 20,245 Source: Largest Employers in Jackson County, The Chamber of Medford/Jackson County 20
36 1.4. Public Transportation According to the RVTD website, Rogue Valley Transportation District is the public transportation provider for Medford and surrounding areas of Jackson County. RVTD has provided public transportation since RVTD provides three primary types of service: Fixed Route Service, Valley Lift (paratransit system), and TransLink. The Fixed Route Service features seven routes providing service to East and West Medford, Jacksonville, Central Point, White City, Ashland, RVMC, and the airport. Most buses run from early morning weekdays to about 10:00 pm. Saturday service is more limited and buses do not run on Sundays. Valley Lift is a shared ride, curb-to-curb, wheelchair accessible transportation service for people whose disabilities prevent them from using the Rogue Valley Transportation District's (RVTD's) lift-equipped buses. Valley Lift drivers and dispatchers are currently provided by Paratransit Services, a regional, non-profit company. TransLink provides transportation services to eligible Oregon Health Plan and eligible Medicaid clients traveling to receive authorized medical services. Maps 1.9 shows fixed bus routes in the RVTD system and Map 1.10 provides a look at the geographic dispersion of public transit users in Medford. While no public transportation system is perfect and service delivery is contingent on budget restrictions, it appears that the RVTD system provides adequate coverage of the city and the surrounding county, and provides additional options for persons with special needs. 21

37 Map 1.9: Public Bus Routes Source: 22
38 23
39 1.5. Housing Tenure According to the 2010 Census, the total number of housing units in Medford was 32,430 with 2,351 or 7.2 percent vacant The number of housing units in Medford grew by 23.3 percent between 2000 and units. As shown in Table 1.10, below, there were 26,297 housing units in Medford in This represents a 23.3 percent increase in the number of housing units between 2000 and In 2010, 48.1 percent were owner-occupied and 44.6 percent were renter-occupied. The median housing value in the city was $222,400 and the median contract rent was $728 between 2008 and Table 1.10 Tenure for housing in Medford, 1990, 2000, and Tenure Number Percent Number Percent Number Percent Owner-occupied 10, % 14, % 15, % Renter-occupied 8, % 10, % 14, % Vacant % 1, % 2, % Total 19, % 26, % 32, % Source: 1990, 2000, and 2010 US Census Looking at tenure by race as shown in Table 1.11, over 51 percent of White households lived in owner-occupied housing, compared to 5.5 percent of African- American households and 33.1 percent of Hispanic households. African- American and Hispanic owner households were well below the city average of 48.1 percent in Table 1.11 Tenure by Race in Medford, Owner-Occupied Renter-occupied Tenure by Race Number Percent Number Percent White 14, % 13, % Hispanic % 1, % African-American 9 5.5% % Source: Five-Year Estimates, American Community Survey 24
40 Housing Type Table 1.12, below, shows that of all housing units in Medford, 62.1 percent were categorized as single-family detached, 5.9 percent as single-family attached, 12.4 percent contained two to four units, 15.7 percent as multifamily, and 4.0 percent as mobile home or other. Age of Housing As shown on Table 1.13, below, 12.9 percent of all housing units in the Medford were built prior to 1950, 9.1 Over 62 percent of housing units in Medford were single-family detached. Table 1.12 Housing type for Medford, Units in Structure Number Percent Single-family Detached 20, % Single-family Attached 1, % 2-4 Units 4, % Multifamily 5, % Mobile Home or Other 1, % Total 33, % Source: Five-Year Estimates, American Community Survey percent were built between 1950 and 1959, 10.6 percent were built between 1960 and 1969, 17.7 percent were built between 1970 and 1979, and 49.7 percent were built after About 50 percent of the housing stock is more than 30 years old, built prior to These units may contain lead-based paint or likely to be in need of repairs and maintenance. Over 50 percent of housing units in Medford are more than 30 years old. These housing units may contain lead-based paint or likely to be in need of repairs and maintenance. Maps 1.11, on page 26, and Map 1.12, on page 27, indicate the distribution of owner- and renter-occupied housing across Medford. Map 1.13, on page 28, shows the distribution of the oldest housing stock in Medford. Maps 1.14 and 1.15, on pages 29 and 30, provide a geographic depiction of the distribution of housing values and rents across Medford. Table 1.13 Age of Housing Stock in Medford, Year Built Number Percent Built 2010 or Later % Built 2000 to , % Built 1990 to , % Built 1980 to , % Built 1970 to , % Built 1960 to , % Built 1950 to , % Built 1940 to , % Built 1939 or Earlier 2, % Total 33, % Source: Five-Year Estimates, American Community Survey 25
41 26
42 27
43 28
44 29
45 30
46 Cost Burden Data contained in the Comprehensive Housing Affordability Strategy (CHAS) data compiled from American Communities Survey results from 2006 through 2010, duplicated in Table 1.14, on page 32, indicates that the impact of housing costs on household incomes is very severe on low- and very low-income households in Medford. The table indicates that 71 percent of all very low-income renters (those earning between 0 percent and 30 percent of the median family income) and over 76 percent of very low-income Seventy-one percent of very lowincome renter households in Medford are severely cost burdened, paying more than 50 percent of their incomes on housing expenses. homeowner households pay more than 50 percent of their income on housing expenses. Further, nearly seven percent of very low-income renters and 15 percent of very low-income homeowners pay between 30 and 50 percent of their incomes on housing expenses. Paying more than 30 percent on housing expenses is considered Cost Burdened and paying more than 50 percent on housing expenses is considered Severely Cost Burdened. Looking at households earning between 31 percent and 50 percent of the median family income, 51 percent of low-income renters and 42 percent of low-income homeowners pay more than 50 percent on housing expenses. Also, 37 percent of renters and over 21 percent of homeowners are paying between 30 and 50 percent on housing expenses in the Medford. Overall, 37 percent of homeowners in Medford are cost burdened, as are 52 percent of renters. Included in those numbers are those with severe cost burden, almost 14 percent of homeowners and 28 percent of renters. Almost 75 percent of households earning less than 30% of the area median family income in Medford are renters. Renters continue to dominate tenure by income 31 Seventy-five percent of households earning less than 30% of the area median family income are renters. group from all income groups except those earning above 100% of the area median family income, where almost 70 percent are homeowners.
47 Table 1.14: Cost Burden by Tenure and Household Income Income Distribution Overview Owner % Renter % Total Household Income <= 30% HAMFI , ,610 Household Income >30% to <=50% HAMFI , ,360 Household Income >50% to <=80% HAMFI 2, , ,335 Household Income >80% to <=100% HAMFI 1, , ,450 Household Income >100% HAMFI 10, , ,280 Total 16, , ,030 Cost burden Cost burden Income by Cost Burden (Owners and Renters) > 30% % > 50% % Total Household Income <= 30% HAMFI 2, , ,610 Household Income >30% to <=50% HAMFI 2, , ,365 Household Income >50% to <=80% HAMFI 3, , ,335 Household Income >80% to <=100% HAMFI 1, ,450 Household Income >100% HAMFI 3, ,275 Total 13, , ,030 Cost burden Cost burden Income by Cost Burden (Renters only) > 30% % > 50% % Total Household Income <= 30% HAMFI 2, , ,695 Household Income >30% to <=50% HAMFI 2, , ,370 Household Income >50% to <=80% HAMFI 2, ,015 Household Income >80% to <=100% HAMFI ,745 Household Income >100% HAMFI ,600 Total 7, , ,425 Cost burden Cost burden Income by Cost Burden (Owners only) > 30% % > 50% % Total Household Income <= 30% HAMFI Household Income >30% to <=50% HAMFI Household Income >50% to <=80% HAMFI 1, ,320 Household Income >80% to <=100% HAMFI ,705 Household Income >100% HAMFI 2, ,680 Total 6, , ,605 Source: HUD Comprehensive Housing Affordability Strategy (CHAS) Tables from ACS,
48 As shown in Table 1.16, to the right, 66 percent of owner households with a mortgage in Medford were cost burdened according to the five-year average from the American Community Survey. Cost burden among homeowners is highest for the lowest income, as would be expected. The table shows that 98 percent homeowners earning less than $20,000 per year are cost burdened. The percentage shrinks to 87.7 for those earning between $20,000 and $34,999. The percentage is still large at almost 71.9 percent for those earning between $35,000 and $49,999. Table 1.17 on the following page shows a similar situation for renters. Overall, 58 percent of renter households in Medford are cost burdened. For the lowest income households, those earning less than $10,000, 77.5 Table 1.15 Owner Housing Costs as a Percent of Household Income in Medford, Number of Cost Housing Costs as a Percentage Owner Burden of Household Income of Households 30% With a Mortgage Less than $20, Less than 30.0 Percent Percent or More % $20,000 to $34,999 1,157 Less than 30.0 Percent Percent or More 1, % $35,000 to $49,999 1,870 Less than 30.0 Percent Percent or More 1, % $50,000 or More 6,952 Less than 30.0 Percent 5, Percent or More 1, % Total Owner Households 10,589 Less than 30.0 Percent 5, Percent or More 4, % Not Mortgaged Less than $20, Less than 30.0 Percent Percent or More % $20,000 to $34,999 1,199 Less than 30.0 Percent 1, Percent or More % $35,000 to $49, Less than 30.0 Percent Percent or More 0 0.0% $50,000 or More 2,024 Less than 30.0 Percent 2, Percent or More % Total Owner Households 4,871 Less than 30.0 Percent 3, Percent or More % Source: Five-Year Estimates, American Community Survey percent are cost burdened. Eighty-nine percent of those earning between $10,000 and $19,999 were also cost burdened. 33 Eighty-nine percent of renter households earning between $10,000 and $19,999 pay more than 30 percent of their incomes on housing expenses.
49 Table 1.16 Gross Rent as a Percent of Household Income in Medford, Cost Gross Rent as a Percentage Number Burden of Household Income of Households 30% Less than $10,000 2,165 Less than 30.0 Percent Percent or More 1, % $10,000 to $19,999 2,942 Less than 30.0 Percent Percent or More 2, % $20,000 to $34,999 3,689 Less than 30.0 Percent Percent or More 2, % $35,000 to $49,999 2,216 Less than 30.0 Percent 1, Percent or More % $50,000 or More 3,909 Less than 30.0 Percent 3, Percent or More % Total Renter Households 14,921 Less than 30.0 Percent 5, Percent or More 8, % Source: Five-Year Estimates, American Community Survey 34
50 Section 2: Fair Housing Law, Court Case, Policies, Regulatory and Complaint Analysis Introduction It is important to examine how the City of Medford s laws, regulations, policies and procedures will ultimately affect fair housing choice. Fair housing choice is defined, generally, as the ability of people with similar incomes to have similar access to location, availability and quality of housing. Therefore, impediments to fair housing choice may be acts that violate a law or acts or conditions that do not violate a law, but preclude people with varying incomes from having equal access to decent, safe, and affordable housing. The first part of this section, Section 2.1, will address the existing statutory and case law that work to remove impediments and promote fair housing choice. The Federal Fair Housing Act can be effective in mitigating barriers to fair housing choice, depending upon enforcement efforts. Relevant judicial court case decisions pertaining to fair housing were reviewed and are incorporated in the analysis. Other related regulations and case law that provide further interpretation, understanding, and support to the Federal Fair Housing Act were considered and will also be discussed. The City of Medford has not enacted local fair housing legislation substantially equivalent to Federal Fair Housing Law. Therefore, our analysis of applicable fair housing laws focused on the State of Oregon Fair Housing Act. In the analysis the State of Oregon statues were compared to the Federal Fair Housing Act to determine whether they offered similar rights, remedies, and enforcement to the federal law and might be construed as substantially equivalent. Pertinent related laws, such as the Community Reinvestment Act and Home Mortgage Disclosure Act, were reviewed with respect to how they can facilitate fair lending. Section 2.2 summarizes the level of fair housing enforcement activity in the City of Medford. 35
51 A more difficult, but intertwined, aspect of evaluating barriers to fair housing choice involves an analysis of public policy, programs and regulations that impact the availability of affordable housing. Our analysis centered on how governmental actions impact fair housing choice and the availability of adequate, decent, safe, and affordable housing for people of all incomes. We examined government subsidies and public funding appropriations used to provide housing assistance for very low- and low-income households. This included an analysis of City operated Community Development Block Grant (CDBG), and any Home Investment Partnership Act (HOME), and Emergency Solutions Grant (ESG) programs operated utilizing State of Oregon or federal funding provided in Section 2.3. Numerous documents were collected and analyzed to complete this section. The key documents are Consolidated Plans, current and previous Annual Action Plans, and the Consolidated Annual Performance Evaluation Reports (CAPER); Medford Housing Authority Annual Plan, Five Year Plan, Administrative policies and Annual Contributions Contract. City staff also provided information on its current and future initiatives utilizing CDBG funds and other federal grants. Our analysis of development regulations, City advisory board actions and public policy documents are presented in Section 2.4. This section focuses on building codes, zoning ordinances, land use plans, local initiatives and governmental actions relative to development and incentives that stimulate development. The analysis of public policy includes decisions by Medford City Council and advisory boards and commissions and the Medford Housing Authority Board. Section 2.5 provides an analysis of fair housing complaints filed with HUD. Section 2.5 also contains conclusions about fair housing barriers based on the existing law, enforcement efforts, complaint analysis, and the availability of affordable housing. The HUD Seattle, Oregon Regional Fair Housing and Equal Opportunity (FHEO) Office has responsibility for fair housing enforcement in Medford. Official compliant date was received from the HUD Regional Office, Fair Housing Equal Opportunity Division. 36
52 2.1. Fair Housing Law The Federal Fair Housing Act (the Act) was enacted in 1968, and amended in 1974 and 1988 to add protected classes, provide additional remedies, and strengthen enforcement. The Act, as amended, makes it unlawful for a person to discriminate on the basis of race, color, sex, religion, national origin, handicap, or familial status. Generally, the Act prohibits discrimination based on one of the previously mentioned protected classes in all residential housing, residential sales, advertising, and residential lending and insurance. Prohibited activities under the Act, as well as examples, are listed below. It is illegal to do the following based on a person's membership in a protected class: Misrepresent that a house or apartment is unavailable by: Providing false or misleading information about a housing opportunity, Discouraging a protected class member from applying for a rental unit or making an offer of sale, or Discouraging or refusing to allow a protected class member to inspect available units; Refuse to rent or sell or to negotiate for the rental or sale of a house or apartment or otherwise make unavailable by: Failing to effectively communicate or process an offer for the sale or rental of a home, Utilizing all non-minority persons to represent a tenant association in reviewing applications from protected class members, or Advising prospective renters or buyers that they would not meld with the existing residents; Discriminate in the terms, conditions, or facilities for the rental or sale of housing by: Using different provisions in leases or contracts for sale, Imposing slower or inferior quality maintenance and repair services, Requiring a security deposit (or higher security deposit) of protected class members, but not for non-class members, 37
53 Assigning persons to a specific floor or section of a building, development, or neighborhood, or Evicting minorities, but not whites, for late payments or poor credit; Make, print, publish, or post (direct or implied) statements or advertisements that indicate that housing is not available to members of a protected class; Persuade or attempt to persuade people, for profit, to rent or sell their housing due to minority groups moving into the neighborhood by: Real estate agents mailing notices to homeowners in changing area with a listing of the homes recently sold along with a picture of a Black real estate agent as the successful seller, or Mailed or telephonic notices that the "neighborhood is changing" and now is a good time to sell, or noting the effect of the changing demographics on property values; Deny or make different loan terms for residential loans due to membership in a protected class by: Using different procedures or criteria to evaluate credit worthiness, Purchasing or pooling loans so that loans in minority areas are excluded, Implementing a policy that has the effect of excluding a minority area, or Applying different procedures (negative impact) for foreclosures on protected class members; Deny persons the use of real estate services; Intimidate, coerce or interfere; or Retaliation against a person for filing a fair housing complaint. The Fair Housing Act requires housing providers to make reasonable accommodations in rules, policies, practices, and paperwork for persons with disabilities. They must allow reasonable modifications in the property so people with disabilities can live successfully. Due to the volume of questions and complaints surrounding this aspect of the federal act, in March 2008, the Department of Justice (DOJ) and the Department of Housing and Urban Development (HUD) released a joint statement to technically define the rights and obligation of persons with disabilities and housing providers. 38
54 In addition to prohibiting certain discriminatory acts, the Act places no limit on the amount of recovery and imposes substantial fines. The fine for the first offense can be up to $11,000; the second offense within a five year period, up to $27,500; and for a third violation within seven years up to $55,000. The prohibition in the Fair Housing Act against advertising that indicates any preference, limitation or discrimination" has been interpreted to apply not just to the wording in an advertisement but to the images and human models shown. Ad campaigns may not limit images to include only or mostly models of a particular race, gender, or family type. As a test to determine if advertising relative to housing and real estate in the local housing market have impediments to fair housing, a review of local advertisements in real estate publications from April and May 2013 was conducted. These types of advertisements cover an area larger than just Medford, and the time-period is insufficient to conclusively establish a pattern of discrimination. The data does however provide an accurate snapshot of the advertising available, and a general overview of the state of compliance with fair housing law. The advertising, especially those with images of prospective or current residents was reviewed, with a sensitivity toward: Advertising with all or predominately models of a single race, gender, or ethnic group; Families or children in ad campaigns depicting images of prospective residents; Particular racial groups in service roles (maid, doorman, servant, etc.); Particular racial groups in the background or obscured locations; Any symbol or photo with strong racial, religious, or ethnic associations; Advertising campaigns depicting predominately one racial group; Campaigns run over a period of time, including a number of different ads, none or few of which include models of other races; Ads failing to contain Equal Housing Opportunity (EHO) statements or logos, or contains the statement or logo, but it is not readily visible; and 39
55 Ad campaigns involving group shots or drawings depicting many people, all or almost all of whom are from one racial group. Publications advertising the sale or rental of housing directed toward persons in the greater Medford area were reviewed including Apartment Finder, The Real Estate Book, and various local real estate sales publications. There were no major concerns revealed. Some publications made blanket statements at the front of the publication stating that the magazines as well as their advertisers are subject to the Federal Fair Housing Act. Most of the advertisers advertise with the equal housing opportunity logo or slogan. Including the logo helps educate the home seeking public that the property is available to all persons. A failure to display the symbol or slogan may become evidence of discrimination if a complaint is filed. Additionally, most of the images included in the selected materials either represented racial, ethnic or gender diversity among the models selected. Fair Housing Assistance Program (FHAP) Agencies The U. S. Department of Housing and Urban Development (HUD) provides funding to state and local governmental agencies to enforce local fair housing laws that are substantially equivalent to the Fair Housing Act. Once a state and a city or county in that state have a substantially equivalent fair housing law, they can apply to become certified as a Fair Housing Assistance Program (FHAP) Agency and receive funds for investigating and conciliating fair housing complaints or a Fair Housing Initiatives Program (FHIP) Agency and receive funds for education, promoting fair housing, and investigating allegations. It should be noted that a county or city must be located in a state with a fair housing law that has been determined by HUD to be substantially equivalent. Then, the local jurisdiction must also adopt a law that HUD concludes is substantially equivalent in order to participate in the FHAP Program. The local law must contain the seven protected classes - race, color, national origin, sex, religion, handicap, and familial status - and must have substantially equivalent violations, remedies, investigative processes, and enforcement powers. 40
56 In addition, the process for investigating and conciliating complaints must mirror HUD s. HUD s process begins when an aggrieved person files a complaint within one year of the date of the alleged discriminatory housing or lending practice. The complaint must be submitted to HUD in writing. However, this process can be initiated by a phone call. HUD will complete a complaint form, also known as a 903, and mail it to the complainant to sign. The complaint must contain the name and address of the complainant and respondent, address and description of the housing involved, and a concise statement of the facts, including the date of the occurrence, and the complainant s affirmed signature. Upon filing, HUD is obligated to investigate, attempt conciliation, and resolve the case within 100 days. Resolution can be a dismissal, withdrawal, settlement or conciliation, or a determination as to cause. The FHAP certification process includes a two-year interim period when HUD closely monitors the intake and investigative process of the governmental entity applying for substantial equivalency certification. Also, the local law must provide enforcement for aggrieved citizens where cause is found. It can be through an administrative hearing process or filing suit on behalf of the aggrieved complainant in court. The FHIP certification process is contingent on the type of funding for which the agency is applying. There are four programs to which an agency can apply; Fair Housing Organizations Initiative (FHOI), Private Enforcement Initiative (PEI), Education Outreach Initiative (EOI), and Administrative Enforcement Initiative (AEI). Currently, there is no funding under the AEI status. 41
57 Court Decisions Walker v. HUD represents a landmark case, settled by consent decree, and establishing precedent as to HUD, PHA and City responsibilities and culpability for insuring the elimination of segregation in public and assisted housing. - The Walker public housing/section 8 desegregation litigation began in 1985 when one plaintiff, Debra Walker, sued one Dallas, Texas area suburb, Mesquite. The lawsuit contended that Mesquite s refusal to give its consent for DHA to administer Section 8 certificates within Mesquite violated the 14th Amendment and the other civil rights law prohibiting racial discrimination in housing. The early stage of Walker resulted in the entry of the 1987 consent decree involving DHA and HUD without any liability findings. The suit was subsequently amended to bring in DHA, HUD, and the City of Dallas and to provide for a class of Black public housing and Section 8 participants who contended that the Dallas Housing Authority segregated person in public housing by race leading to racial concentrations of African Americans in minority concentrated areas. The suburbs, with the exception of Garland, gave their consent to the operation of DHA s Section 8 program within their jurisdiction and were dismissed from the case. The City of Dallas was subsequently found liable for its role in the segregation of DHA s programs in the Court s 1989 decision, Walker III, 734 F. Supp (N.D. Tex. 1989). HUD and DHA were subsequently found liable for knowingly and willingly perpetuating and maintaining racial segregation in DHA s low income housing programs. HUD was found liable not just for its failure to affirmatively further fair housing under the Fair Housing Act but also for purposeful violations of the Fifth Amendment to the U.S. Constitution, Title VI of the 1964 Civil Rights Act, 42 U.S.C. 1981, 1982, and The district court found that the defendants had the remedial obligation to not only cease any present discrimination but to also eliminate the lingering effects of past segregation to the extent practical. Court orders entered in this case have provided the following desegregation resources: (a) approximately 9,900 new assisted units have been made available to Walker class members. 42
58 (b) approximately $22 million was made available for the creation of housing opportunities in predominantly white areas of the Dallas metroplex. (c) $2 million was provided for the operation of a fair housing organization that focused on the problems of low income minority families. (d) Hope VI funding for 950 units in the West Dallas project. (e) $94 million was provided by the City of Dallas for neighborhood equalization and economic development in the public housing project neighborhoods. (f) $10 million was provided for mobility counseling to be used in connection with the Settlement Voucher program. Similar to the Walker case, Young v. HUD represents a landmark case, settled by consent decree, and establishing precedent as to HUD, PHA and City responsibilities and culpability for insuring the elimination of segregation in public and assisted housing. The Young case involved 70 plus housing authorities in 36 counties in East Texas, HUD, and the State of Texas. The litigation did not end until The remedy involved the equalization of conditions including the provision of air conditioning in the segregated black projects, desegregation of the tenant population in previously segregated black and white projects, use of the public housing and Section 8 programs and funding for a private fair housing organization to provide over 5,000 desegregated housing opportunities in predominantly white areas, equalization of neighborhood conditions around the predominantly black projects, injunctions against local cities blocking the development of public housing in white neighborhoods, sale of the Vidor public housing and the use of the proceeds for housing opportunities in white areas that were accessible by black public housing tenants, and $13 million in State funding for neighborhood equalization. Most of the relief was obtained only after the record of HUD s violations of previous remedial orders was compiled and presented to the Court. Some of the orders, agreements, and reports from this case that are attached are: A. The final judgment that was entered by the Court in 1995, 43
59 B. The order modifying final judgment entered in This order includes a HUD manual on creating desegregated housing opportunities as exhibit 3 to the order, C. The agreement between the plaintiffs and the State of Texas for the last $4.4 million of the total $13 million that the State contributed to the neighborhood equalization activities required by the Final Judgment. At the inception of the Fair Housing Act, insurance companies took the position that they were not covered by the Act. However, in 1992 a Wisconsin Appeals Court determined that the Act applies to discriminatory denials of insurance and discriminatory pricing that effectively preclude ownership of housing because of the race of an applicant. The case was a class action lawsuit brought by eight African-American property owners, the NAACP, and the American Civil Liberties Union against the American Family Insurance Company. The plaintiffs claimed they were either denied insurance, underinsured, or their claims were more closely scrutinized than Whites. American Family s contention was that the Act was never intended to prohibit insurance redlining. The appeals Court stated, Lenders require their borrowers to secure property insurance. No insurance, no loan; no loan, no house; lack of insurance thus makes housing unavailable. A 1998 court verdict against Nationwide Insurance further reinforced previous court action with a $100 million judgment due to illegally discriminating against black homeowners and predominantly black neighborhoods. Another case was settled for $250,000 in Maryland when Baltimore Neighbors, Inc., a non-profit organization, alleged that real estate agents were steering. Fine Homes real estate agents were accused of steering prospective African-American buyers away from predominantly White neighborhoods and Whites were almost never shown homes in predominantly African-American zip codes. In 2009 a landmark housing discrimination case was settled between the Connecticut Fair Housing Center and the New Horizons Village Apartments. In this case, the State 44
60 of Connecticut Office of Protection and Advocacy for Person with Disabilities sued New Horizons Village, an apartment complex which provides independent housing for people with severe physical disabilities. Under the consent decree, New Horizons will no longer be allowed to require tenants to open their private medical records for review and require them to prove they can live independently. CT Fair Housing Center stated The Fair Housing Act is clear that it is impermissible to limit the housing choices of people with disabilities based on stereotypes about their ability to care for themselves; people with disabilities are entitled to the same freedom to choose how and where they want to live as people without disabilities. In County of Edmonds v. Oxford House, the United States Supreme Court ruled that the Fair Housing Amendments Act of 1988 prevents communities from excluding group homes for the handicapped from single-family residential zones. The Oxford House is a nonprofit umbrella organization with hundreds of privately operated group homes throughout the country that house recovering alcoholics and drug addicts. Recovering alcoholics and drug addicts, in the absence of current drug use or alcohol consumption, are included under the protected class of handicapped in the Fair Housing Act as amended in In Oxford House v. Township of Cherry Hill, 799 F. Supp. 450 (D. N.J. 1991), the federal court rejected a state court ruling that recovering alcoholic and drug addicted residents in a group home do not constitute a single-family under the Township s zoning ordinance. In Oxford House-Evergreen v. County of Plainfield, 769 F. Supp (D. N.J. 1991) the court ruled that the county s conduct, first announcing that the Oxford House was a permitted use only to deny it as a permitted use after neighborhood opposition, was intentionally discriminatory. Unjustified institutionalization of persons with mental disabilities...qualifies as discrimination."- was stated as the majority opinion of the U.S. Supreme Court. In a landmark decision by a 6-3 vote, the U.S. Supreme Court ruled in June 1999, that a state may not discriminate against psychiatric patients by keeping them in hospitals instead of community homes. The court said that the Americans with Disabilities Act (ADA) may require that states provide treatment in community-based programs rather 45
61 than in a segregated setting. This case, know as the Olmstead case, ruled that community placement is a must when deemed appropriate by state professionals, agreed to by the individual with the disability, and resources available are sufficient. The courts agreed with the most integrated setting provision of the ADA. In a historic federal settlement order to resolve a lawsuit brought by the Anti- Discrimination Center (ADC) against Westchester County, NY. Westchester County conducted its own Analysis of Impediment to Fair Housing and did not examine race and its effects on housing choice. Only income was studied from a demographic perspective. Westchester did not believe that racial segregation and discrimination were the most challenging impediments in the County. ADC filed lawsuit against Westchester stating that the entitlement is not taking appropriate steps to identify and overcome impediments of fair housing. The Court stated that grant recipients must consider impediments erected by race discrimination, and if such impediments exist, it must take appropriate action to overcome the effects of the impediments. The settlement order issued in August 2009 found that Westchester had utterly failed to meet its affirmatively furthering fair housing obligations throughout a six-year period. All entitlements receiving federal funds must certify that they have and will affirmatively further fair housing. Because of the tie to federal funds, a false certification can be seen as fraudulent intent. Westchester was ordered to submit an implementation plan of how it planned to achieve the order s desegregation goals. One major outcome from the landmark agreement is the construction of 750 units of affordable housing in neighborhoods with small minority populations. In 2003, a settlement was ordered by the District Court in New Jersey for the owner of the internet website, who was found guilty of publishing discriminatory rental advertisements which is prohibited by the Fair Housing Act. It was the first of its kind to be brought by the Justice Department. It was thought to be imperative that the federal laws that prohibit discriminatory advertising should be enforced with the same vigor with regard to internet advertising as it would for print and broadcast media. The court ordered the site to establish a $10,000 victim fund to compensate individuals 46
62 injured by the discrimination. They were also ordered to pay a civil penalty of $5,000, adopt a non-discrimination policy to be published on the website, and require all employees to undergo training on the new practices. Under the Fair Housing Act, apartment complexes and condominiums with four or more units and no elevator, built for first occupancy after March 13, 1991, must include accessible common and public use areas in all ground-floor units. An apartment complex near Rochester, New York was ordered to pay $300,000 to persons with disabilities for not making its housing facility fully accessible, with $75,000 set aside for the plaintiffs. They were required to publish a public notice of the settlement fund for possible victims and pay a $3,000 civil penalty. In 2005, the Connecticut Commission on Human Rights and Opportunities (CHRO) issued a charge of discrimination on the basis of disability when an apartment manager refused to rent to a person with a disability on the first floor of the complex due to the absence of access ramp. The apartment manager was unwilling to make a modification to add a ramp. The court recognized that the renter has a disability and the defendant knew the fact and refused to make accommodations. The court concluded that the renter was entitled to compensatory and emotional distress damages of $10,000 and imposed a civil penalty of $1,000. In 2007, the 9th Circuit Court of Appeals gave a decision in support of Fair Housing Council of San Fernando Valley that Roommates.com has violated the fair housing laws by matching roommates by gender, sexual orientation, and parenthood. By asking prospective roommates to put in their status on these criteria and allowing prospective roommates to judge them on that basis is a violation of Fair Housing Act. In 2005, the National Association for the Advancement of Colored People (NAACP), The National Association of Home Builders (NAHB), and the Home Builders Association (HBA) of Greater Austin, filed a federal lawsuit against the County of Kyle, Texas. The plaintiffs contended that ordinances passed by the Kyle County Council, imposing requirements such as all-masonry construction, expanded home size, and expanded 47
63 garage size, drive up the cost of starter homes by over $38,000 per new unit. The allegation is that this increase has a disproportionate impact on minorities and this effect violates the Fair Housing Act. The County of Kyle filed a motion to dismiss, asserting that both NAACP and NAHB lack standing. The federal district court recognized the plaintiff s standing in Thereafter, the cities of Manor, Round Rock, Pflugerville, and Jonestown, all moved to join the litigation on the grounds that they each have ordinances similar to the one being challenged in Kyle and that any positive decision in this case would allow NAHB and NAACP to sue them at some later date. In May the court decided that the cities could participate as friends of the court but may not join in the litigation otherwise. This case is pending appeal. Homelessness and the Fair Housing Act Homelessness is defined as lacking a fixed, regular, and adequate night-time residence; or where the primary night-time residence is: o o o A supervised publicly or privately operated shelter designed to provide temporary living accommodations; An institution that provides temporary residence for individuals intended to be institutionalized; or, A public or private place not designed for, or ordinarily used as, a regular sleeping accommodation for human beings. 48
64 The Fair Housing Act s definition of dwelling does not include overnight or temporary residence, so mistreatment of the homeless is not generally covered by Fair Housing Law. The ability of persons to find affordable housing is a protected right of Fair Housing; therefore the inability of people to find affordable housing which may lead to homelessness, is in conflict with the Fair Housing Law. Unfair Lending Practices Unfair lending practices are more difficult to detect and to prove. However, there are laws, other than the fair housing law, to assist communities in aggressively scrutinizing fair lending activity. One such law is the Home Mortgage Disclosure Act (HMDA), which requires banks to publish a record of their lending activities annually. Frequently, fair housing enforcement agencies and nonprofits use this data to help substantiate a discrimination claim or to determine a bank's racial diversification in lending. Another law frequently utilized by community organizations is the Community Reinvestment Act (CRA). When a bank wants to merge with or buy another bank or establish a new branch, the community has an opportunity to comment. Usually, the CRA commitments made by the bank are analyzed, utilizing other data such as HMDA, to determine adherence. The community can challenge the action if the bank has a poor record. Sometimes agreements can be reached with the bank promising a certain level of commitment to the community. Additionally, the Equal Credit Opportunity Act (ECOA) prohibits discrimination in lending generally and can be quite significant when it comes to securing information about unfair lending practices and imposing remedies, which may include up to one percent of the gross assets of the lending institution. The U.S. Supreme Court ruled in June 2009 that states may investigate national banks to determine if they have discriminated against minorities seeking home loans. Furthermore states may charge accused violators if found guilty. The new legislation stemmed from a discrimination investigation of national banks by the New York attorney general. The federal Office of the Comptroller of the Currency (OCC) sought legal action through the courts to stop the attorney general s investigation because legal 49
65 principals suggested that only federal regulators can require national banks to conform to regulations and practices that discourages unfair lending. The Supreme Court overturned this ruling giving state government power to enforce consumer-protection and lending policies Enforcement It has long been settled that fair housing testing is legal and that non-profits have standing to sue so long as certain criteria are met. These decisions make it feasible for non-profits to engage in fair housing enforcement activities. The Department of Housing and Urban Development enforces federal fair housing laws which prohibit discrimination in the buying, selling, rental or enjoyment of housing because of race, color, national origin, religion, sex, disability or familial status. The Regional HUD Office in Seattle, Washington conducts investigations of fair housing complaints that are reported directly to their office. Oregon is part of the HUD Region that includes Alaska, Idaho, Oregon, and Washington. When the HUD Regional Office investigates complaints of discrimination, an investigator generally spends time in the jurisdiction, on-site, interviewing the complainant, respondents, and witnesses, reviewing records and documentation, while observing the environment. A detailed discussion of the complaints filled with HUD follows in Section 2.5. When a complaint is filed with any of the jurisdictions, HUD is notified of the complaint. HUD will notify the violator of the complaint and permit all parties involved an opportunity to submit an answer. HUD will conduct investigations of the complaint to determine whether there is reasonable cause to believe the Federal Fair Housing Act and or Oregon Fair Housing Ordinance has been violated. The complainant is then notified. A detailed discussion of the complaints filed with HUD follows in Section 2.5. A case is typically heard in an Administrative Hearing unless one party wants the case to be heard in Federal District Court. 50
66 Education and Outreach The City of Medford Grants Staff in the Parks and Recreation Department directs fair housing complaints to and makes referrals to HUD for enforcement. The City s Grants Staff is also responsible for conducting public education, training and outreach of fair housing rights and remedies in Medford. Education of the public regarding the rights and responsibilities afforded by fair housing law is an essential ingredient of fair housing enforcement. This includes outreach and education to the general public, landlords and tenants, housing and financial providers, as well as citizens, concerning fair housing and discrimination. It is important that potential victims and violators of housing and/or lending discrimination law be aware of fair housing issues generally, know what may constitute a violation, and what they can do in the event they believe they have been discriminated against. Likewise, it is important for lenders, housing providers, and their agents to know their responsibilities and when they may be violating fair housing law. Often, people may be unaware of their fair housing rights. Present day housing discrimination tends to be subtle. Instead of saying that no children are allowed, they may impose unreasonable occupancy standards that have the effect of excluding families with children. Rather than saying, We do not rent to Hispanics, they may say, Sorry we do not have any vacancies right now, try again in a few months, when, in fact, they do have one or more vacancies. Printed advertisements do not have to state, no families with children or minorities allowed to be discriminatory. A series of ads run over an extended period of time that always or consistently exclude children or minorities may very well be discriminatory. In addition, a person who believes he/she may have been discriminated against will probably do nothing if he/she does not realize that a simple telephone call can initiate intervention and a resolution on his/her behalf, without the expenditure of funds or excessive time. Thus, knowledge of available resources and assistance is a critical component. 51
67 2.3. Production and Availability of Affordable Units / CDBG Grant Administration An assessment of characteristics affecting housing production, availability, and affordability in Medford and utilization of Entitlement grant funding was conducted, including the adequacy and effectiveness of programs designed and implemented utilizing CDBG Entitlement funding by the City of Medford. The assessment evaluated the programs ability to reach their target markets and how effective they are in identifying and serving those who have the greatest need. We also assessed the extent to which the agencies prioritized funding and utilized programs to address impediments identified in the City s Fair Housing Impediment Analysis conducted prior to FY The City of Medford s Consolidated Plan, Annual Action Plan, Consolidated Annual Performance Evaluation Report, and other documentation were utilized. The FY 2013 Annual Action Plan submitted to HUD indicated that the City of Medford received approximately $560,450 in Entitlement funding for FY 2013 and operated a total budget of $799,137 for that program year. Community Development Block Grant (CDBG) $560,450 Entitlement $ 75,000 Program Income $167,217 Prior Year Carry Over $799,137 Total Entitlement Budget 2.4. Regulatory and Public Policy Review The City of Medford has not enacted substantially equivalent fair housing law. Having a local fair ordinance, especially one that is substantially equivalent to the federal Fair Housing Act, exemplifies a jurisdiction s local commitment to enforcing fair housing regulations and it provides public awareness of individuals rights under the Fair Housing Act. The city zoning ordinance, development code and public policies were 52
68 examined to reveal any current ordinances or policies that impede fair housing choice. Medford s land development codes and zoning regulations address affordable housing and the provision of making allowances through the code to allow the construction of a variety of types of housing including single family and multifamily housing. The regulations provide for the consideration of variances to development barriers that affect the feasibility of producing housing within the jurisdictions Analysis of Fair Housing Complaints Fair housing complaint information was received from the U.S. Department of Housing and Urban Development and provides a breakdown of complaints filed for Medford from April 1, 2009 through March 31, The complaints filed with HUD are received from the Fair Housing and Equal Opportunity (FHEO) regional office in Seattle, Washington. Eight complaints were filed according to one or more of seven bases, including; National Origin, Color, Religion, Familial Status, Handicap, Sex, and Race. Table 2.5.1, shows the breakdown. The totals in the chart below actually sum to more than 24 complaints because some cases cited multiple bases in their claim. Table: 2.5.1: Fair Housing Complaints by the Basis of Complaint April March 2014 Protected Race/ National Familial Handicap Class Color Origin Status Disability Sex Religion Totals Total Source: U.S. Department of Housing and Urban Development Seattle Washington Regional Office 53
69 Of the eight complaints, seven cases were closed with a no cause determination, meaning that justification for the complaint was not applicable to the Fair Housing Act. And one case was dismissed due to lack of jurisdiction and Administrative Closure. Table shows case closure types by year the case was opened. Table: 2.5.2: Type of Case Closure ( ) Type of Closure Total Cases remain open Case Conciliated / FHAP Judicial Consent Order No Probable Cause / FHAP Judicial Dismissal Withdrawn/No Action Taken Unable to Locate Complainant / Complainant failed to cooperate Lack of Jurisdiction/Administrative 1 1 Totals Source: U.S. Department of Housing and Urban Development Seattle Washington Regional Office 2.6. Conclusions and Implications for Fair Housing Barriers and Impediments The City of Medford has not enacted local fair housing law. The State of Oregon has enacted fair housing law that is substantially equivalent to the Federal Fair Housing Act. The State ordinance has added additional protected classes including Marital Status, Source of Income, Sexual Orientation, Gender Identity, Veterans / Military Status, and Domestic Violence Victims. The City of Medford Grants Staff provides referral of fair housing complaints to HUD for investigation and enforcement and is responsible for conducting public education, training and outreach of fair housing rights and remedies in Medford. 54
70 Real estate related publications advertising the sale or rental of housing and advertising home improvements and remodeling, directed toward persons in the greater Medford area were reviewed. Some publications made blanket statements at the front of the publication stating that the magazines as well as their advertisers are subject to the Federal Fair Housing Act. Some advertiser included EHO statements and/or logos. Including these logos can be a means of educating the home seeking public that the property is available to all persons. The FY 2013 Annual Action Plan submitted to HUD indicated that the City of Medford received approximately $560,450 in Entitlement funding for FY 2013 and operated a total budget of $799,137 for that program year. Community Development Block Grant (CDBG) $560,450 Entitlement $ 75,000 Program Income $167,217 Prior Year Carry Over $799,137 Total Entitlement Budget The city zoning ordinance building codes and public policies were examined to reveal any current ordinances or policies that impede fair housing. No concerns were noted as a result; however it is recommended that the City of Medford evaluate inclusinary or incentivized zoning as a means of increasing the number of affordable housing units and funding for affordable housing initiatives. 55
71 Section 3: Focus Group Sessions and Community Engagement Introduction This section will report on the results from three Fair Housing Focus Group sessions held on May 21, 2014 at the City of Medford City Hall Building, th Street, Medford, Oregon Supplemental interviews were conducted with various community, professional and industry representatives to obtain information from those unable to attend the sessions on May 21 st. Participants in the focus groups sessions and supplemental interviews included Medford City staff and other government representatives; administrators from local colleges, universities, and school districts; non-profit organizations, home builders, housing and social service agencies representatives; real estate and financial industry representatives; and the general public and other community representatives. Attendees were gathered through invitations sent to select resident and community leaders, organizations, industry professionals and public officials and a public meeting notice published in the local newspaper. At each focus group session, general issues related to the housing market, neighborhoods and concerns pertaining to fair housing choice in Medford were discussed. The Focus Group sessions were hosted by the City of Medford. It should be noted that the comments summarized in this section represent the comments and views of the focus group participants and those participating in supplemental interviews. JQUAD has made every effort to document all comments as a matter of record, and to ensure that the comments, as presented on the following pages, have not been altered to reflect our analysis, investigation or substantiation of information obtained during these sessions. Focus Group comments and information obtained during interviews were later analyzed and to the extent substantiated or collaborated by the data and analysis, included in Section Six: Impediments and Remedial Actions. Comments from Focus Group participants included the following. 56
72 3.1. Focus Group Concerns and Comments Social-Economic Conditions Social-economic issues were of major concern to participants in the focus group sessions as well as those persons participating in the supplemental interviews. Frequently mentioned in the focus group sessions and interviews was the perception that seniors were particularly impacted as the supply of affordable housing becomes scarce and the cost to purchase homes or to rent housing continues to soar beyond the range affordable to many local area residents. Others believed the number of persons lacking sufficient income for housing and housing related cost was on the rise, severely impacting housing choice for the lowest income households. Participants indicated that insufficient income and cost burden is not only a concern with regard to social equity and the plight of the elderly and lower income households, but limited incomes are also having an adverse impact on the condition and quality of single family owner occupied housing due to deferred maintenance and residents inability to afford maintenance and utility cost. The impact of local unemployment, insufficient incomes to afford housing maintenance and their mortgage payments for persons living in the Medford market were also cited as contributing factors to housing and neighborhood decline. Focus group participants wanted to have a greater emphasis placed on financial assistance to acquire housing suitable to meet the needs of the evolving demographics in the city and specific problems faced by residents and the working poor relative to foreclosure and elderly residents on fixed incomes. Participants also felt that increased housing counseling-both pre-purchase and post purchase support was needed to help applicants qualify for financing and to remain current with mortgage payments and home maintenance needs. Increased funding should be identified to provide rental assistance to those needing assistance with rent and utilities and security deposits necessary to initiate a lease. Homebuyers will need assistance with providing greater down payments and equity investments when buying a home, to replace the loss of 57
73 private mortgage insurance. Participants emphasized the need for increased funding for project based rental assistance due to limitations in the Section 8 Vouchers program. Housing Supply, Neighborhood Conditions, and Infrastructure and Regulatory Controls Participants desired greater emphasis is placed on building codes and regulatory controls being utilized to improve housing conditions, cost and accessibility. Participants recommended incorporating energy efficiency and green building standards in construction of affordable housing; the need for infrastructure to support new housing development and emergency repair funding for owner occupied housing. Decreased funding for Entitlement funded programs and public housing were also viewed as primary barriers to affordable housing. Local budgets for infrastructure and regulatory programs such as code enforcement and demolition were also cited as barriers. Public Policy and Public Awareness of Fair Housing Participants cited public awareness of fair housing rights as a concern. They felt that despite programs funded by the city, some residents appear to be unaware of their rights under fair housing law and that the number of violations reported and cases substantiated may be much lower than the number of violations actually occurring. Others felt that residents often fear retaliation by those who violate the laws. For example, attendees and persons interviewed felt that in some instances, people do not register fair housing complaints for fear of retaliation by their landlords, or if they report violations such as housing code, enforcement will result in higher rents or evictions actions by their landlords. Participants also felt that residents needed increased access to homebuyer education and counseling when considering purchase of a home and rental 58
74 housing and tenant s rights counseling and advocacy for renters. They were concerned that first-time home buyers often do not know where to go for help or how to start the process of purchasing a home. Others cited housing barriers faced by the untouchables, persons such as ex-offenders, convicted sex offenders and others recently discharged from the criminal justice system. Access to Banking and Financial Institutions Products, and Basic Goods and Services Predatory lending practices were identified as an issue. Perception were that predatory lenders are absorbing much of the market formerly controlled by FDIC insured banks and other reputable financial institutions and fast becoming lenders of choice in some low income and minority concentrated areas. In other instances, persons facing economic hardships are being preyed upon due to their inability to qualify for traditional lending and banking services. For example, predatory businesses provide individuals with loans backed by the title to their car or house at relatively high interest rates. Lenders are quick to foreclose in the event the borrower misses a payment. Attendees and persons interviewed were concerned that a growing number of people have fallen prey to sub prime loans because they have a poor credit rating or limited to no credit history. Lending, Foreclosures and the Mortgage Industry The inability to obtain home mortgages was seen as a barrier that limits housing choice. Criminal background histories and immigration status are relatively new factors contributing to the inability to qualify for home purchases and rental housing leases. Credit issues appeared to be the major barrier, based on focus group participants comments. Both a lack of qualified applicants and an adequate pool of applicants for mortgages, coupled with the inability of some housing units to qualify based on lending program guidelines were cited as barriers. Participants felt that greater emphasis should be placed on credit counseling and financial literacy being accessible to a broader population including youth and young adults age eighteen to thirty. Greater emphasis should 59
75 be given to preventing damage to one s credit history and providing a solid foundation that could prevent future financial problems. Persons with a criminal felony record and those convicted of sex crimes are having particular problems finding housing to rent as well as qualifying for mortgages. Special Needs Housing Participants were concerned that greater funding be provided for the elderly to age in place, and to provide housing for others in need of special needs housing. Participants cited statistics relative to the growth expected in the elderly population over the next decade which will elevate this problem. Without such funding elderly and disabled persons are sometimes placed in nursing homes prematurely, even though they could otherwise continue to live on their own with some limited assistance or ADA accessibility modifications where they currently reside. Participants were also concerned that limited options exist for persons in need of transitional housing whether they be recently paroled, victims of domestic violence, mentally ill, physically handicapped, and homeless or at risk of becoming homeless. Others cited a need for more permanent supportive housing. Other participants asked that CDBG funding be provided to support the operational cost of providing meals on wheels and operation of the food pantry. Public Transportation and Mobility Participants cited limited mobility and public transportation as impediments to housing choice. These limitations also included a concern for elderly and disabled persons in need of public transportation to access supportive services. Public transportation was deemed inadequate, for persons commuting to major employment centers. 60
76 3.2. Other Issues and Solutions Attendees indicated a need for increased emphasis on mitigating the impacts of increased incidents of discrimination or impediments to housing for persons with disabilities, renters with past criminal records or prior convictions for sexual abuse related crimes, those in need of special needs housing or facing evictions, foreclosures and homelessness. Participants voiced support for a greater emphasis on credit education and housing consumer counseling. Increased financial literacy courses taught in high schools was a best practice identified by the facilitator for the focus group session and well received by participants. Participants cited the need for additional funding for fair housing outreach, education and enforcement, fair housing training for landlords and homeowner associations and other at risk of violating fair housing law. 61
77 Section 4: Home Mortgage Disclosure Act (HMDA) Analysis Introduction The Federal Financial Institutions Examination Council (FFIEC) gathers data on home mortgage activity from the federal agencies that regulate the home mortgage industry. The data contain variables that facilitate analysis of mortgage lending activity, such as race, income, census tract, loan type, and loan purpose. The FFIEC provides the HMDA databases through their website for download and analysis. Data were input into a spreadsheet for analysis. For this analysis, the FFIEC databases were utilized for 2007 through The data reported in this report are summarized by a variety of methods. Tables 4.1 through 4.4 provide information for Jackson County. Charts 4.1 through 4.6 display the data graphically. The maps, provided at the end of this section, present data by census tracts for Jackson County with Medford city boundaries shown on the maps Analysis Table 4.1 provides a look at the number Over 15,800 conventional loan of loan applications and origination rates applications were reported in Jackson County between 2007 in Jackson County by loan type, and ethnicity, income, and loan purpose. Looking first at loan type, conventional loans were the most frequent home purchase loan applications with almost 64 percent of home purchase loan applications, while government-insured home purchase loans (FHA and VA) had lower origination rates, 46.8 percent compared to 48.0 percent for conventional loans. Over half of the conventional home purchase loan applications (50.9%) were submitted in the first two years of the study period, 2007 through 2008, as detailed in Table 4.3 and shown in Chart 4.6. In 2007, almost 5,600 applications were recorded, compared to less than 400 for government-insured loans. By 2009 conventional applications had dropped to about 1,900, below the number of 62
78 government-insured applications reported at 1,959. Conventional applications continued to fall through 2010 to just over 1,700 applications. Governmentinsured loan applications peaked again in 2012 at over 1,900 applications. The second section of Table 4.1 reports The White origination rate for all number of loan applications and loans during the period from 2007 through 2012 was over 49 origination rates by ethnicity. The percent. largest number of applications was from White applicants with almost 61,200, with the second highest origination rate at 49.6 percent. The second largest number of applications was from Hispanic applicants at over 3,500 applications. Hispanic origination rates were significantly lower than Whites at 39.3 percent. Black applications numbered 231 with origination rates at 42.9 percent. Comparing origination rates by ethnicity by applicant income in Chart 4.2 shows much higher origination rates for White applicants within all income groups when compared to all other ethnicities except Asians. Asians had the highest overall origination rate and highest in each category except the moderate-income category where they were exceeded by, Black, Hawaiian, and White applicants. Asians had a relatively low number of loan applications, however, at fewer than 640 applications. Hispanic applicants, the second highest number of applications reported, showed significantly lower origination rates, even when comparing low-income White applicants to upperincome Hispanic applicants. Upper-income Hispanic origination rates were about 42 percent, compared to the low-income White origination rate of about 48 percent. The third section of Table 4.1 shows High- and low-income applicants the distribution of loan applications by were the two largest number of applications by income group. applicant income. The largest number of applications reported was from high-income applicants with over 44,700 applications and an origination rate at 45.0 percent. The next largest number was from low-income applicants with over 10,600 applications and an origination 63
79 rate of 45.7 percent. Not surprisingly, the table shows that each successive higher income group had a higher origination rate then the previous income group, with the exception of the high-income group, which was somewhat lower than the middle-income group. The last section of Table 4.1 shows There were over 48,000 refinance loan applications and origination rates loan applications submitted during the study period. by loan purpose. The most loan applications were for refinance loans at 48,200, compared to over 24,600 for home purchase loans and just over 3,300 for home improvement loans. Home purchase loans had the highest origination rate at 47.6 percent, compared to 44.4 percent for refinance loans and less than 401 percent for home improvement loans. These data are reflected in Chart 4.1. Table 4.2 displays the HMDA data for the same data categories (Loan Type, Ethnicity, Income, and Loan Purpose) for the MSA with percentages taken within category rather than demonstrating the percentage of applications that result in loan originations. For instance, Table 4.2 indicates that 81.4 percent of originations for the MSA were for conventional loans whereas the origination rate is 48.0 percent from Table 4.1. For comparison, ethnic percentages were included under the Percent of Population column to compare the percentage of originations by ethnic group to their percentage in the population for that geography. For Loan Type, Conventional shows Over 81 percent of home loan the highest percentages, at about 81 originations were for conventional loans. percent. Government-insured loans, which are government insured and have more stringent lending criteria, were approximately 19 percent of the originations. Referring back to Table 4.1, government insured loans had a slightly lower origination rate than conventional, at about 47 percent for government insured versus 48 percent for conventional. 64
80 In Jackson County, for Ethnicity, Whites accounted for over 93 White shows the highest percentage percent of all loan originations during the study period. of originations at about 93 percent of the total. The percentage of originations is over five percentage points higher than the percentage of Whites in the population. Hispanics account for 11 percent of the population, compared to four percent of loan originations. African- American applicants accounted for 0.3 percent of all originations, with 1.2 percent of the total population. This is likely a reflection of the reality that Hispanics and African-Americans are more likely to fall within lower-income groups and, therefore, less likely to qualify for mortgage financing. For Income, the highest income group (>120% median) displays the highest percentage of originations, over 58 percent of all originations. It stands to reason that the highest income group would have the greatest success in being approved for loans. Loan Purpose data show that refinance loans accounted for about 62 percent of the originations. Home purchase loans were the second most frequent purpose with over 34 percent. Home improvement loans accounted for almost 4 percent of all originations. Table 4.3 examines origination rates, Conventional loan applications total number of applications, and submitted dropped from a high of over 5,500 in 2007 to just over denials, all by years and loan types. The 1,700 in changes in the housing market over the study period show up in some interesting patterns. The most noticeable change over the six years shown is the steep decline in conventional loan applications from a high of over 5,500 in 2007 down to a low of just over 1,700 in Refinance loan applications also show a steady decline from 2007, falling from a high in 2007 of over 11,000 applications to less than 5,600 applications in Government-insured loans were the only category to have an increase over the six-year period, starting at 360 applications in 2007 and peaking in 2009 at about 65
81 1,950 applications. Government loan applications fell back to less than 1,700 applications by 2011 but rose again in These data are shown in Chart 4.6 Origination rates for conventional loans Origination rates for governmentinsured applications peaked at rose during the six years of the study over 49 percent in period, starting at about 47 percent, falling to 44 percent in 2008, but peaking in 2012 at a high of almost 53 percent. Government-insured origination rates peaked at 49.4 percent in 2007, but dropped to 44 percent in Rates showed a steady decline between 2007 and 2012, with just a slight rebound between 2008 and Refinance origination rates rose from a low of 36 percent in 2008 to a high of 54 percent in Home improvement origination rates also rose from the six year period low of 32 percent in 2008 to over 50 percent in These data are shown in Chart 4.5. The total number of denials showed Collateral was the largest fairly consistent decline through the sixyear period for conventional, refinance, and home improvement loans. These category for loan denials. data reflect the decline in total number of loan applications during the study period. Government-insured loan application denials peaked in These data are shown in Charts 4.3 and 4.4. Chart 4.4 shows that the reasons for loan denials were primarily due to lack of collateral and debt-to-income ratio, with Other coming in a somewhat distant third. Credit history was a significant factor in 2007, but fell in significance during the following years. Table 4.4 compares applications The percentage of applications reported between minorities and White received from Whites was larger applicants for the various loan than those received from minorities for home purchase purposes and income groups. For all three loan purposes shown (Purchase, loans, refinance, and home improvement loans. Refinance and Home Improvement), the number of loan applications from White 66
82 applicants was higher than from Minorities. For home purchase loans, the percentage of applications from Whites was over 84 percent and eight percent for minorities. White applicants for home improvement loans represented about 81 percent of applications. Refinance loans reported 83 percent submitted by Whites. As shown earlier, Whites account for about 89 percent of the population of the county. Looking at the income group comparison, similar patterns hold up for all income categories. The percentage of applications from Whites is highest for the four highest income categories. The percentage peaks at about 10 percent minority for the very low-income group. Not surprisingly, denials were highest for the very low-income group, for minorities, Whites, and not provided, as well. The highincome group also had the most applications, with the low-income group second. Map 4.2 through 4.6 present loan The maps show applications and activities by census tract. The ratio of the ratio of denials to originations denials to originations was calculated with the darkest shaded areas showing where the least activity for each loan purpose and loan type. is located or where the least Tracts shown in the darkest shades success in originating loans occurs. indicate those areas where denials were highest in comparison to originations. Map 4.6 shows the ratio for all loan types combined. The ratios for the least successful areas, those in the darkest shades in each map, represent those areas where more loans were denied for each loan originated. Lighter shaded areas have more successful loan applicants. Map 4.1 shows the total number of loan originations by census tract. Less active areas are shown in the darker colors, with the most active areas in lighter colors. Like the other maps, the dark areas are meant to indicate areas of concern, either for a lack of loan activity or for their low rate of application originations in relation to denials. 67
83 4.2. Conclusions In Jackson County, the least success in borrowing was found in the home improvement loan sector, given the number of applications submitted, and the highest success was found in home purchase loan sector, particularly in conventional loans. Refinance loans were the most frequent loan type. Overall, the origination rates among Whites were higher than minorities in home purchase, home Improvement and refinance loans in the County. Though, Hispanics accounted for the second highest number of applications after Whites, the percentage of loan originations was significantly lower compared to their percentage in population in the county. Applicants inadequate collateral or higher debt-to-income ratios accounted for the highest percentage of loan denials among all races and ethnicities, with a significant showing for the Credit History category, particularly in the early years of the study period. Overall, the lending activity decreased in the middle years of the study due to the impacts of the economic slowdown and the sub-prime lending crises. Lending activity decreased over the six years of the study period, reflecting the impacts of the economic slowdown and the national housing crisis. 68
84 Table 4.1 Home Mortgage Disclosure Act (HMDA) Analysis Comparison of Number of Loan Application and Origination Rates Jackson County Number Orig. of Apps. Rate Loan Type: Conventional 15, % Government-insured 8, % Ethnicity: Native % Asian % Black % Hawaiian % White 61, % Hispanic 3, % Income: <50% median (very low) 1, % 50-79% median (low) 10, % 80-99% median (moderate) 10, % % median (middle) 7, % >120% median (high) 44, % Loan Purpose: Purchase 24, % Refinance 48, % Home Improvement 3, % Totals 76, % 69
85 Table 4.2 Home Mortgage Disclosure Act (HMDA) Analysis Comparison of Originations Within Categories Jackson County Number Percent of Percent of of Originations Originations Population Loan Type: Conventional 27, % Government-insured 6, % Ethnicity: Native % 0.8% Asian % 1.0% Black % 1.2% Hawaiian % 0.2% White 30, % 88.7% Hispanic 1, % 10.7% Income: <50% median (very low) 1, % 50-79% median (low) 4, % 80-99% median (moderate) 4, % % median (middle) 3, % >120% median (high) 20, % Loan Purpose: Purchase 11, % Refinance 21, % Home Improvement 1, % Totals 34,399 70
86 Table 4.3 Analysis of Home Mortgage Disclosure Act Data, Applications, Originations, and Denials by Year and Loan Type Jackson County Origination Rates Home Year Conventional Government Refinance Improvement % 49.4% 37.0% 40.0% % 48.0% 36.0% 32.1% % 48.1% 45.4% 41.2% % 47.8% 47.7% 43.3% % 46.1% 46.6% 40.1% % 44.0% 54.3% 50.2% Total Number of Applications Home Year Conventional Government Refinance Improvement , ,053 1, ,483 1,172 6, ,873 1,959 9, ,712 1,739 6, ,806 1,674 5, ,367 1,926 9, Denials by Year by Loan Type Home Year Conventional Government Refinance Improvement , , , , , ,
87 Table 4.4 Analysis of Home Mortgage Disclosure Act Data Activity for Jackson County, # Apps. % of Apps. % Denied Home Purchase Loans Minorities 2, % 15.7% White 20, % 10.8% Not Provided 1, % 16.9% Home Improvement Loans Minorities % 49.8% White 2, % 34.5% Not Provided % 39.9% Refinance Loans Minorities 1, % 31.3% White 38, % 20.8% Not Provided 5, % 36.8% Income Groups <50% MFI Minorities % 38.2% White 2, % 32.5% Not Provided % 40.1% 50 to 79% MFI Minorities 1, % 29.9% White 9, % 20.4% Not Provided % 40.1% 80 to 99% MFI Minorities % 26.2% White 8, % 19.0% Not Provided % 27.6% 100 to 120% MFI Minorities % 24.9% White 6, % 17.9% Not Provided % 23.5% >120% MFI Minorities 2, % 23.1% White 34, % 16.2% Not Provided 4, % 21.8% 72
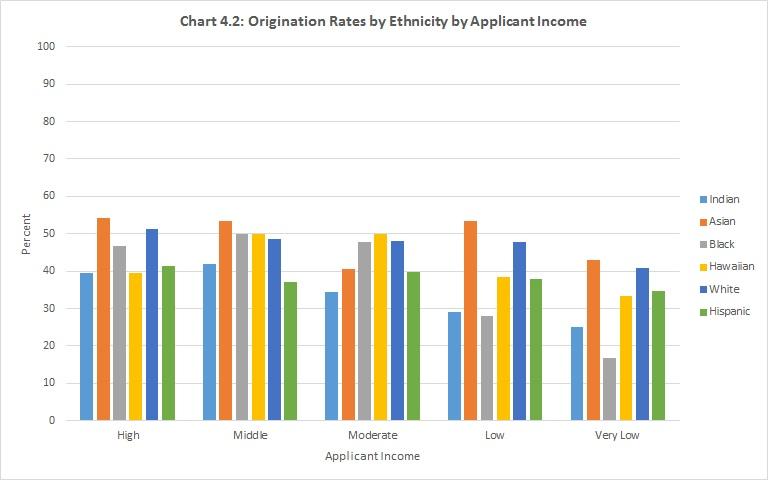
88 73
89 74
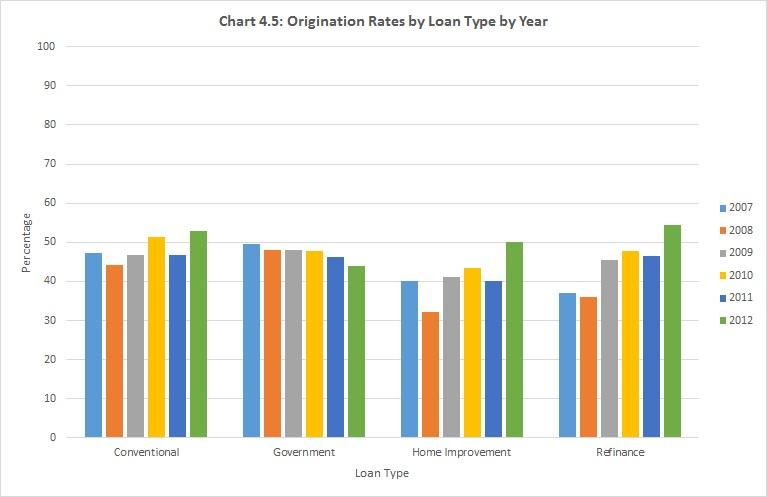
90 75
91 76
92 77
93 78
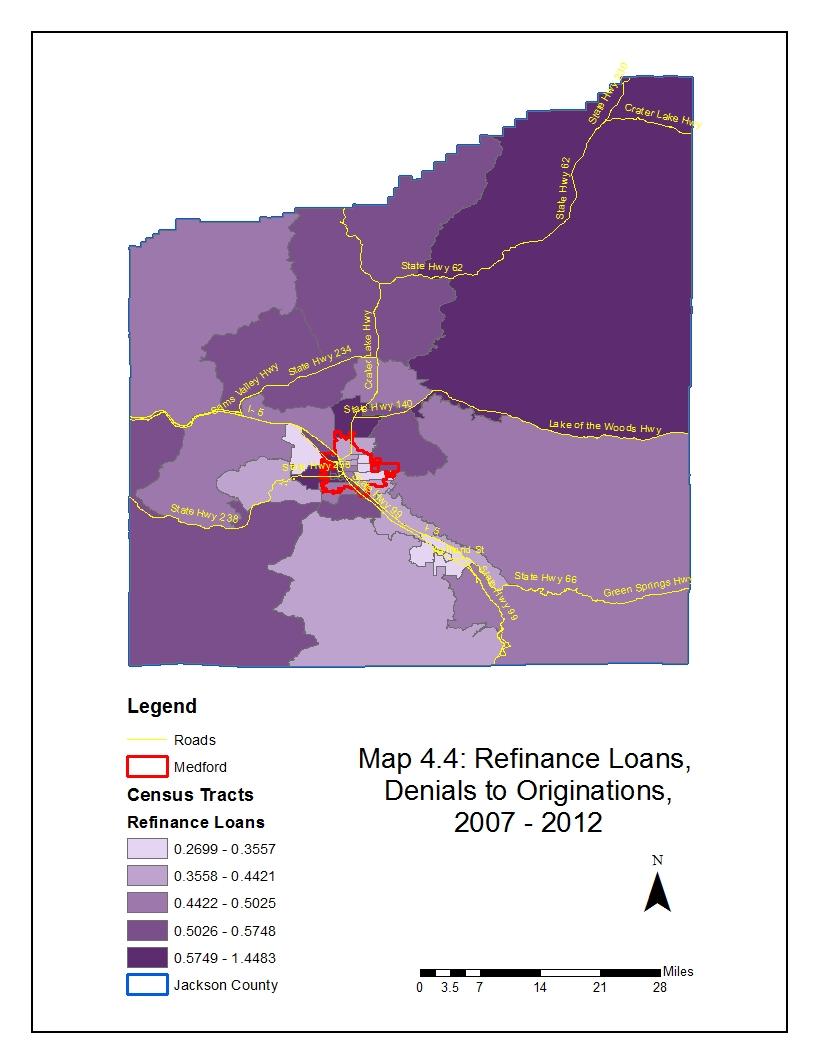
94 79
Analysis of Impediments to Fair Housing Choice
 STATE OF ARKANSAS Analysis of Impediments to Fair Housing Choice Final Report November 6, 2014 Submitted by: J-QUAD Planning Group, LLC 14683 Midway Rd. Suite # 210 Addison, TX 75001 Office: (972) 458-0600
CITY OF VALDOSTA, GEORGIA ANALYSIS OF IMPEDIMENTS TO FAIR HOUSING CHOICE
 CITY OF VALDOSTA, GEORGIA ANALYSIS OF IMPEDIMENTS TO FAIR HOUSING CHOICE Prepared for: City of Valdosta, Georgia Ms. Mara S. Register, Assistant to the City Manager Public Involvement Department 300 North
CITY OF CORPUS CHRISTI, TEXAS ANALYSIS OF IMPEDIMENTS TO FAIR HOUSING CHOICE
 CITY OF CORPUS CHRISTI, TEXAS ANALYSIS OF IMPEDIMENTS TO FAIR HOUSING CHOICE Prepared for: City of Corpus Christi, Texas City of Corpus Christi Community Development Division of Neighborhood Services Department
FAIR HOUSING: Serious Responsibility, Serious Liability
 FAIR HOUSING: Serious Responsibility, Serious Liability PRESENTED TO: American Planning Association Housing and Community Development Division PRESENTED BY: Heidi Aggeler, Managing Director 1999 Broadway
AFFIRMATIVELY FURTHERING FAIR HOUSING
 AFFIRMATIVELY FURTHERING FAIR HOUSING Proposed Rule 24 CFR Parts 5, 91, 92, et al. Presented by: Fair Housing Continuum, Inc. A private, not-for-profit, 501 ( c )( 3 ), fair housing enforcement agency.
Analysis of Impediments to Fair Housing Choice
 Final Report Analysis of Impediments to Fair Housing Choice Prepared for: Kane County, IL City of Elgin, IL City of Aurora, IL Prepared by: Economic & Planning Systems, Inc. 2012 EPS #20836 Table of Contents
Assessment of Fair Housing Tool for Local Governments. Table of Contents
 Assessment of Fair Housing Tool for Local Governments (LG0) OMB Control Number: -00 I. Cover Sheet Assessment of Fair Housing Tool for Local Governments Table of Contents II. III. IV. Executive Summary
CITY OF THOMASVILLE NORTH CAROLINA ANALYSIS OF IMPEDIMENTS
 CITY OF THOMASVILLE NORTH CAROLINA ANALYSIS OF IMPEDIMENTS May, 2010 TECHNICAL ASSISTANCE PROVIDED BY BENCHMARK CMR INC. City of Thomasville Analysis of Impediments INTRODUCTION... 3 Historical Overview
City of New Albany. Analysis of Impediments to Fair Housing Choice Draft. January 16, 2015
 January 16, 2015 City of New Albany Analysis of Impediments to Fair Housing Choice Draft Redevelopment Department 311 Hauss Square, Room 325 New Albany, Indiana 47150 Table of Contents I: Introduction,
Delaware State Housing Authority New Castle County Department of Community Services City of Wilmington City of Dover
 RFP # 2010-1 ANALYSIS OF IMPEDIMENTS TO FAIR HOUSING CHOICE REQUEST FOR PROPOSALS Delaware State Housing Authority New Castle County Department of Community Services City of Wilmington City of Dover RFP
AFFIRMATIVELY FURTHERING FAIR HOUSING
 FINAL REGULATIONS AFFIRMATIVELY FURTHERING FAIR HOUSING Ed Gramlich (ed@nlihc.org) National Low Income Housing Coalition Modified, October 2015 INTRODUCTION On July 8, 2015, HUD released the long-awaited
2011 ANALYSIS OF IMPEDIMENTS TO FAIR HOUSING CHOICE FOR THE CITY OF TULSA, OKLAHOMA
 2011 ANALYSIS OF IMPEDIMENTS TO FAIR HOUSING CHOICE FOR THE CITY OF TULSA, OKLAHOMA DRAFT REPORT FOR PUBLIC REVIEW MAY 18, 2011 2011 ANALYSIS OF IMPEDIMENTS TO FAIR HOUSING CHOICE FOR THE CITY OF TULSA,
Section 5: Fair Housing Index
 Section 5: Fair Housing Index Introduction The Fair Housing Index is a measure developed specifically for Analyses of Impediments to Fair Housing. The index combines the effects of several demographic
SCOPE OF WORK DEVELOPMENT OF A SOCIO-ECONOMIC IMPACT ANALYSIS FOR THE PRELIMINARY REGIONAL HOUSING PLAN FOR THE SOUTHEASTERN WISCONSIN REGION
 RHP SEI SCOPE OF WORK (00203617-4).DOC KRY/NMA/BRM 5/24/12; 5/4/12 SCOPE OF WORK DEVELOPMENT OF A SOCIO-ECONOMIC IMPACT ANALYSIS FOR THE PRELIMINARY REGIONAL HOUSING PLAN FOR THE SOUTHEASTERN WISCONSIN
Attachment 3. Guelph s Housing Statistical Profile
 Attachment 3 Guelph s Housing Statistical Profile Table of Contents 1. Population...1 1.1 Current Population (26)...1 1.2 Comparative Growth, Guelph and Ontario (21-26)...1 1.3 Total Household Growth (21
Little Haiti Community Needs Assessment: Housing Market Analysis December 2015
 Little Haiti Community Needs Assessment: Housing Market Analysis December 2015 Prepared by: EXECUTIVE SUMMARY Background The Little Haiti Housing Needs Assessment provides a current market perspective
SECTION X. IMPEDIMENTS AND SUGGESTED ACTIONS
 SECTION X. IMPEDIMENTS AND SUGGESTED ACTIONS Provisions to affirmatively furthering fair housing are long-standing components of HUD s housing and community development programs. In exchange for receiving
2018 SKAGIT COUNTY HOME CONSORTIUM ANALYSIS OF IMPEDIMENTS TO FAIR HOUSING CHOICE
 2018 SKAGIT COUNTY HOME CONSORTIUM ANALYSIS OF IMPEDIMENTS TO FAIR HOUSING CHOICE DRAFT FOR PUBLIC REVIEW APRIL 2, 2018 2018 SKAGIT COUNTY HOME CONSORTIUM ANALYSIS OF IMPEDIMENTS TO FAIR HOUSING CHOICE:
APPENDIX A. Market Study Standards and Requirements
 APPENDIX A Market Study Standards and Requirements Section 42(m)(1)(A)(iii) of the IRS Code and Section IV(A)(2) of the 2018 Qualified Allocation Plan (QAP) require market studies for all low-income housing
Fair Housing Equity Assessment Regional Analysis of Impediments to Fair Housing Choice Public Housing Authority De-Concentration Plan
 Fair Housing Equity Assessment Regional Analysis of Impediments to Fair Housing Choice Public Housing Authority De-Concentration Plan The Regional Analysis of Impediments (RAI) and Fair Housing Equity
2017 SOUTH DAKOTA ANALYSIS OF IMPEDIMENTS TO FAIR HOUSING CHOICE
 2017 SOUTH DAKOTA ANALYSIS OF IMPEDIMENTS TO FAIR HOUSING CHOICE Prepared by South Dakota Housing Development Authority and Governor s Office of Economic Development January 10, 2018 Analysis of Impediments
Analysis of Impediments to Fair Housing 2015 Carson, California
 Analysis of Impediments to Fair Housing 2015 Carson, California City of Carson Community Development Department 701 East Carson Street Carson, CA 90745 (310) 830-7600, extension 1319 E-mail: kbennett@carson.ca.us
The rapidly rising price of single-family homes in. Change and Challenges East Austin's Affordable Housing Problem
 Change and Challenges East 's Affordable Housing Problem Harold D. Hunt and Clare Losey March 2, 2017 Publication 2161 The rapidly rising price of single-family homes in East has left homeownership out
Analysis of Impediments to Fair Housing Choice. Contra Costa County Consortium
 Analysis of Impediments to Fair Housing Choice Contra Costa County Consortium 2017 Contents I. Executive Summary... 1 What Is Fair Housing?... 2 What Is an Impediment to Fair Housing Choice?... 2 Purpose
SJC Comprehensive Plan Update Housing Needs Assessment Briefing. County Council: October 16, 2017 Planning Commission: October 20, 2017
 SJC Comprehensive Plan Update 2036 Housing Needs Assessment Briefing County Council: October 16, 2017 Planning Commission: October 20, 2017 Overview GMA Housing Element Background Demographics Employment
ANALYSIS OF IMPEDIMENTS TO FAIR HOUSING CHOICE
 ANALYSIS OF IMPEDIMENTS TO FAIR HOUSING CHOICE PIERCE COUNTY CONSORTIUM FOR CDBG, HOME AND ESG FUNDS RECEIVED THROUGH THE U.S. DEPARTMENT OF HOUSING AND URBAN DEVELOPMENT AUGUST 2010 TABLE OF CONTENTS
Affirmative Fair Housing Marketing (AFHM) Plan Multifamily Housing
 Plan Multifamily Housing") Affirmative Fair Housing Marketing (AFHM) Plan Multifamily Housing U.S. Department of Housing and Urban Development Office of Fair Housing and Equal Opportunity 1a. Project Name & Address (including County,
Affirmative Fair Housing Marketing (AFHM) Plan Multifamily Housing U.S. Department of Housing and Urban Development Office of Fair Housing and Equal Opportunity 1a. Project Name & Address (including County,
City of Waco, Texas. Housing and Community Development Services Fair Housing Plan
 City of Waco, Texas Housing and Community Development Services 2014-2018 Fair Housing Plan Fair Housing Plan City of Waco Texas 1 Introduction to Fair Housing Federal Legislation and Regulations The Federal
ANALYSIS OF IMPEDIMENTS TO FAIR HOUSING CHOICE ATHENS-CLARKE COUNTY, GEORGIA
 ANALYSIS OF IMPEDIMENTS TO FAIR HOUSING CHOICE ATHENS-CLARKE COUNTY, GEORGIA January 2012 145 Church St. Suite 200 Marietta, GA 30060 (770) 420-5634 www.wfnconsulting.com Analysis of Impediments To Fair
REQUEST FOR PROPOSALS (A )
") CITY OF TUSCALOOSA ) STATE OF ALABAMA ) REQUEST FOR PROPOSALS (A18-1471) TO: FROM: RE: Qualified Firms The City of Tuscaloosa, Alabama Request for Proposals for Development of Analysis of Impediment to
CITY OF TUSCALOOSA ) STATE OF ALABAMA ) REQUEST FOR PROPOSALS (A18-1471) TO: FROM: RE: Qualified Firms The City of Tuscaloosa, Alabama Request for Proposals for Development of Analysis of Impediment to
Boise City Consolidated Plan, Annual Action Plan and Analysis of Impediments to Fair Housing. April, 2016
 Boise City Consolidated Plan, Annual Action Plan and Analysis of Impediments to Fair Housing April, 2016 Introduction Federal law requires Boise to develop a Consolidated Plan for Housing and Community
City of Lonsdale Section Table of Contents
 City of Lonsdale City of Lonsdale Section Table of Contents Page Introduction Demographic Data Overview Population Estimates and Trends Population Projections Population by Age Household Estimates and
Housing Study & Needs Assessment
 Housing Study & Needs Assessment Phase II Public Engagement Presentation #2 Winston-Salem, North Carolina January 25, 2018 MEETING OVERVIEW Welcome & Introductions Purpose & Goals Community Discussions
The'Analysis'of'Impediments'Study' to'fair'housing'choice'
 February( 2014 The'Analysis'of'Impediments'Study' to'fair'housing'choice' Justin'Harris' [Type'the'abstract'of'the'document'here.'The'abstract'is'typically'a'short'summary'of'the' contents'of'the'document.]'
DELAWARE STATEWIDE ANALYSIS OF IMPEDIMENTS TO FAIR HOUSING CHOICE
 DELAWARE STATEWIDE ANALYSIS OF IMPEDIMENTS TO FAIR HOUSING CHOICE 1. INTRODUCTION... 1 A. Introduction... 1 B. Obligation to Affirmatively Further Fair Housing... 1 C. Fair Housing Choice... 3 D. The Federal
HOME Investment Partnership Program Project Development Funds. Application
 City of Spartanburg Neighborhood Services 145 West Broad Street Spartanburg, South Carolina 29306 HOME Investment Partnership Program Project Development Funds Application Applicant Name: Project Name:
Housing Assistance in Minnesota
 Minnesota Housing Finance Agency Housing in Minnesota Program Assessment October 1, 2002 - September 30, 2003 Minnesota Housing Finance Agency Housing In Minnesota l\1innesotl Housing Finaru:e Agency Contentsoontents...
Opening Doors that Finance Fair Housing
 Opening Doors that Finance Fair Housing October 6, 2016 Alison George Melinda Pasquini, Esq. Denise Rome-Tamulis Polsinelli PC. In California, Polsinelli LLP Questions With a show of hands, how many in
The Metropolitan Transportation Plan/Sustainable Communities Strategy and the SACOG Region s Housing Market. July 2013
 The Metropolitan Transportation Plan/Sustainable Communities Strategy and the SACOG Region s Housing Market July 2013 Draft Housing Report Purpose Provide regional data on: MTP/SCS projected growth/housing
Affirmative Fair Marketing Procedures
 City of Oakland Department of Housing and Community Development Affirmative Fair Marketing Procedures I. Policy on Nondiscrimination and Accessibility 1. Owners and managing agents of housing assisted
Chapter 9: Housing. Introduction. Purpose and Intent. Legislative Authority. Organization of the Housing Element. Housing Element HE-1
 Chapter 9: Housing Introduction Purpose and Intent The is intended to provide residents of the community and local government officials with a greater understanding of housing needs in Rancho Cucamonga,
ECONOMIC CURRENTS. Vol. 5 Issue 2 SOUTH FLORIDA ECONOMIC QUARTERLY. Key Findings, 2 nd Quarter, 2015
 ECONOMIC CURRENTS THE Introduction SOUTH FLORIDA ECONOMIC QUARTERLY Economic Currents provides an overview of the South Florida regional economy. The report presents current employment, economic and real
DRAFT DOWNTOWN DANBURY TRANSIT-ORIENTED DEVELOPMENT STUDY CITY OF DANBURY, CT MAY 2018 APPENDIX A REAL ESTATE MARKET ANALYSIS
 DRAFT DOWNTOWN DANBURY TRANSIT-ORIENTED DEVELOPMENT STUDY CITY OF DANBURY, CT MAY 2018 APPENDIX A REAL ESTATE MARKET ANALYSIS M E M O R A N D U M TO: FROM: RE: Goody Clancy Associates W-ZHA Economic Framework
NORTH TEXAS REGIONAL HOUSING ASSESSMENT
 NORTH TEXAS REGIONAL HOUSING ASSESSMENT DALLAS CITY COUNCIL BRIEFING NOVEMBER 6, 2018 Dr. Myriam Igoufe Co-Principal Investigator and Project Manager Dr. Stephen Mattingly, Principal Investigator PRESENTATION
Housing Policy in the United States
 Housing Policy in the United States Second Edition Alex F. Schwartz THE NEW SCHOOL O Routledge g^^ Taylor & Francis Croup NEW YORK AND LONDON Brief Contents PREFACE ACKNOWLEDGMENT XIII XV 1 INTRODUCTION
Status of HUD-Insured (or Held) Multifamily Rental Housing in Final Report. Executive Summary. Contract: HC-5964 Task Order #7
 Multifamily Rental Housing in Final Report. Executive Summary. Contract: HC-5964 Task Order #7") Status of HUD-Insured (or Held) Multifamily Rental Housing in 1995 Final Report Executive Summary Cambridge, MA Lexington, MA Hadley, MA Bethesda, MD Washington, DC Chicago, IL Cairo, Egypt Johannesburg,
Status of HUD-Insured (or Held) Multifamily Rental Housing in 1995 Final Report Executive Summary Cambridge, MA Lexington, MA Hadley, MA Bethesda, MD Washington, DC Chicago, IL Cairo, Egypt Johannesburg,
Analysis of Impediments to Fair Housing Choice 2010 Update
 Analysis of Impediments to Fair Housing Choice 2010 Update To Satisfy the Requirements of 24 CFR 91.225(a)(1) August, 11 2010 City of Bryan Community Development Services Department 405 W 28 th St Bryan,
Columbus Urban League
 Columbus Urban League 2012 Fair Housing Plan Columbus and Franklin County Analysis of Impediments to Fair Housing Choice and Action Plan August 2012 Community Research Partners Yvonne Olivares, Director
Research Report #6-07 LEGISLATIVE REVENUE OFFICE.
 HOUSING AFFORDABILITY IN OREGON Research Report #6-07 LEGISLATIVE REVENUE OFFICE http://www.leg.state.or.us/comm/lro/home.htm STATE OF OREGON LEGISLATIVE REVENUE OFFICE H-197 State Capitol Building Salem,
The Urban County of Bucks County and Bensalem Township M a r c h
 Analysis of Impediments to Fair Housing Choice The Urban County of Bucks County and Bensalem Township M a r c h 2 0 1 4 Analysis of Impediments to Fair Housing Choice Table of Contents I. Introduction
Arch-Laclede s Landing Station
 Arch-Laclede s Landing Station This station profile describes existing conditions around the Arch-Laclede s Landing MetroLink Station. This is one of a set of profiles for each of the MetroLink System
PALM BEACH COUNTY ANALYSIS OF IMPEDIMENTS TO FAIR HOUSING CHOICE FISCAL YEARS
 PALM BEACH COUNTY ANALYSIS OF IMPEDIMENTS TO FAIR HOUSING CHOICE FISCAL YEARS 2010-2015 Prepared By: Palm Beach County Department of Housing and Community Development Edward W. Lowery, Director June, 2010
US Worker Cooperatives: A State of the Sector
 US Worker Cooperatives: A State of the Sector Worker cooperatives have increasingly drawn attention from the media, policy makers and academics in recent years. Individual cooperatives across the country
DRAFT Citizens Summary of Recommendations: 2017 Thurston County Assessment of Fair Housing Report Fair Housing is Affordable Housing
 DRAFT Citizens Summary of Recommendations: 2017 Thurston County Assessment of Fair Housing Report Fair Housing is Affordable Housing 2017 DRAFT Summary of Recommended Goals from the 2017 Thurston County
REQUEST FOR PROPOSALS ASSESSMENT OF FAIR HOUSING IN WAUSAU, WISCONSIN
 REQUEST FOR PROPOSALS ASSESSMENT OF FAIR HOUSING IN WAUSAU, WISCONSIN GENERAL INFORMATION STATEMENT OF INTENT This Request for Proposals (RFP) seeks a qualified firm or individual to conduct an Assessment
PINELLAS COUNTY, FLORIDA STATE HOUSING INIITATIVES PARTNERSHIP (SHIP) PROGRAM LOCAL HOUSING ASSISTANCE PLAN (LHAP) FISCAL YEARS ,
 PROGRAM LOCAL HOUSING ASSISTANCE PLAN (LHAP) FISCAL YEARS ,") PINELLAS COUNTY, FLORIDA STATE HOUSING INIITATIVES PARTNERSHIP (SHIP) PROGRAM LOCAL HOUSING ASSISTANCE PLAN (LHAP) FISCAL YEARS 2006-2007, 2007-2008 and 2008-2009 TABLE OF CONTENTS I. PROGRAM DESCRIPTION...
PINELLAS COUNTY, FLORIDA STATE HOUSING INIITATIVES PARTNERSHIP (SHIP) PROGRAM LOCAL HOUSING ASSISTANCE PLAN (LHAP) FISCAL YEARS 2006-2007, 2007-2008 and 2008-2009 TABLE OF CONTENTS I. PROGRAM DESCRIPTION...
Key Findings on the Affordability of Rental Housing from New York City s Housing and Vacancy Survey 2008
 Furman Center for real estate & urban policy New York University school of law n wagner school of public service 110 West 3rd Street, Suite 209, New York, NY 10012 n Tel: (212) 998-6713 n www.furmancenter.org
Section IV: HOME Narratives
 Section IV: HOME Narratives IV. HOME NARRATIVES (AP-90) A. INTRODUCTION Los Angeles County is an Urban County-participating jurisdiction for HUD s HOME Investment Partnerships (HOME) Program. It receives
Document under Separate Cover Refer to LPS State of Housing
 Document under Separate Cover Refer to LPS5-17 216 State of Housing Contents Housing in Halton 1 Overview The Housing Continuum Halton s Housing Model 3 216 Income & Housing Costs 216 Indicator of Housing
Chapter 12 Environmental Justice
 Chapter 1 Environmental Justice The roadway and transit projects identified and programmed in the Jackson MPO 045 Long Range Transportation Plan must address the principles of Executive Order 1898 relating
NJ CDBG-Disaster Recovery Program (HURRICANE IRENE) Handbook. Section V Civil Rights
 Handbook. Section V Civil Rights") NJ CDBG-Disaster Recovery Program (HURRICANE IRENE) Handbook Section V Civil Rights Revised 10/02 CDBG-Disaster Recovery Program Handbook Section V Civil Rights CONTENTS PAGE Civil Rights Requirements
NJ CDBG-Disaster Recovery Program (HURRICANE IRENE) Handbook Section V Civil Rights Revised 10/02 CDBG-Disaster Recovery Program Handbook Section V Civil Rights CONTENTS PAGE Civil Rights Requirements
CHAPTER 2: HOUSING. 2.1 Introduction. 2.2 Existing Housing Characteristics
 CHAPTER 2: HOUSING 2.1 Introduction Housing Characteristics are related to the social and economic conditions of a community s residents and are an important element of a comprehensive plan. Information
Affirmative Fair Housing Marketing Plans
 Affirmative Fair Housing Marketing Plans Asset Management Department, Housing Programs Analysts Christi Wheelock cwheelock@housingnm.org 505-767-2279 Amanda Aragon aaragon@housingnm.org 505-767-2267 Kathy
HOUSING ELEMENT OF THE CITY OF PEMBROKE PINES COMPREHENSIVE PLAN ADOPTION DOCUMENT
 HOUSING ELEMENT OF THE CITY OF PEMBROKE PINES COMPREHENSIVE PLAN RULES 9J-5.010, FAC City of Pembroke Pines, Florida ADOPTION DOCUMENT HOUSING ELEMENT HOUSING ELEMENT ADOPTION DOCUMENT VI. GOALS, OBJECTIVES
The Texas 2005 Profile of Home Buyers and Sellers. Prepared by: NATIONAL ASSOCIATION OF REALTORS Research Division
 The Texas 2005 Profile of Home Buyers and Sellers Prepared by: NATIONAL ASSOCIATION OF REALTORS Research Division February, 2006 The 2005 NATIONAL ASSOCIATION OF REALTORS Profile of Home Buyers and Sellers
TOD and Equity. TOD Working Group. James Carras Carras Community Investment, Inc. August 7, 2015
 TOD and Equity TOD Working Group James Carras Carras Community Investment, Inc. August 7, 2015 What is Equitable TOD? Equity is fair and just inclusion. Equitable TOD is the precept that investments in
2012 Profile of Home Buyers and Sellers Texas Report
 2012 Profile of Home and Sellers Report Prepared for: Association of REALTORS Prepared by: NATIONAL ASSOCIATION OF REALTORS Research Division December 2012 2012 Profile of Home and Sellers Report Table
REGIONAL. Rental Housing in San Joaquin County
 Lodi 12 EBERHARDT SCHOOL OF BUSINESS Business Forecasting Center in partnership with San Joaquin Council of Governments 99 26 5 205 Tracy 4 Lathrop Stockton 120 Manteca Ripon Escalon REGIONAL analyst april
2012 Profile of Home Buyers and Sellers New Jersey Report
 Prepared for: New Jersey Association of REALTORS Prepared by: Research Division December 2012 Table of Contents Introduction... 2 Highlights... 4 Conclusion... 7 Report Prepared by: Jessica Lautz 202-383-1155
Town of Prescott Valley 2013 Land Use Assumptions
 Town of Prescott Valley 2013 Land Use Assumptions Raftelis Financial Consultants, Inc. November 22, 2013 Table of Contents Purpose of this Report... 1 The Town of Prescott Valley... 2 Summary of Land Use
AFFIRMATIVE FAIR HOUSING MARKETING PLAN GUIDANCE
 NATIONAL HOUSING TRUST FUND AFFIRMATIVE FAIR HOUSING MARKETING PLAN GUIDANCE North Dakota Housing Finance Agency 2624 Vermont Avenue PO Box 1535 Bismarck, ND 58502-1535 800/292-8621 or 701/328-8072 800/366-6888
GOAL SUMMARY Assessment of Fair Housing 2017, City of Ithaca, NY
 GOAL SUMMARY Assessment of Fair Housing 2017, City of Ithaca, NY GOAL # 1 Prohibit 1.1. In Year 1: Gather best practices and Source of Income discrimination recommendations for implementation models Discrimination
2017 Assessment of Fair Housing, City of Ithaca, NY Factors Contributing to Fair Housing Problems
 2017 Assessment of Fair Housing, City of Ithaca, NY Factors Contributing to Fair Housing Problems City of Ithaca Request for Proposals (RFP) for 2019 Action Plan: Introduction & Information for Applicants
City of Santa Clarita
 City of Santa Clarita Fair Housing Choice (AI) City of Santa Clarita 23920 W. Valencia Blvd. Suite 302 Santa Clarita, CA 91355 May 2014 Table of Contents Page Section I: Introduction... 1 A. Community
PENNSYLVANIA AFFORDABLE HOUSING ACT Act of Dec. 18, 1992, P.L. 1376, No. 172 AN ACT Providing for the establishment and administration of an
 PENNSYLVANIA AFFORDABLE HOUSING ACT Act of Dec. 18, 1992, P.L. 1376, No. 172 AN ACT Cl. 48 Providing for the establishment and administration of an affordable housing program; and imposing additional powers
GUIDANCE ON HUD S REVIEW OF ASSESSMENTS OF FAIR HOUSING (AFH)
") GUIDANCE ON HUD S REVIEW OF ASSESSMENTS OF FAIR HOUSING (AFH) The AFH is a local planning document that includes analysis of fair housing issues and identification and prioritization of significant contributing
GUIDANCE ON HUD S REVIEW OF ASSESSMENTS OF FAIR HOUSING (AFH) The AFH is a local planning document that includes analysis of fair housing issues and identification and prioritization of significant contributing
Community Revitalization Efforts 2016 Thresholds and Scoring Criteria
 s 2016 Thresholds and Scoring Criteria Definitions: a deliberate, concerted, and locally approved plan or documented interconnected series of local approvals and events intended to improve and enhance
APPENDIX C CHARACTERISTICS OF THE ENERGIZE PHOENIX CORRIDOR
 APPENDIX C CHARACTERISTICS OF THE ENERGIZE PHOENIX CORRIDOR BACKGROUND ON RESIDENTIAL AND COMMERCIAL BUILDINGS IN THE EP CORRIDOR The 10-mile EP corridor (Figure G1) is a highly diverse, mixed-use L-shaped
McAllen,TX Development Land S. 35 th Street, McAllen, TX 78501
 McAllen,TX Development Land S. 35 th Street, McAllen, TX 78501 FOR SALE Rio Grande Valley PROPERTY OVERVIEW This great piece of property sits ideally in the path of McAllen s growth and has excellent proximity
DRAFT Racial/Ethnic Diversity by Block Group (2010 data/boundaries)
") DRAFT Racial/Ethnic Diversity by Block Group (2010 data/boundaries) Introduction to Fair Housing Federal Legislation and Regulations The Federal Fair Housing Act is Title VIII of the Civil Rights Act of
DRAFT Racial/Ethnic Diversity by Block Group (2010 data/boundaries) Introduction to Fair Housing Federal Legislation and Regulations The Federal Fair Housing Act is Title VIII of the Civil Rights Act of
Consolidated Planning Process
 Consolidated Planning Process By Ed Gramlich, Director of Regulatory Affairs, National Low Income Housing Coalition Administering agency: HUD s Office of Community Planning and Development Year Program
City of Dothan Affordable Housing Study. Community Presentation November 6 th, 2017
 City of Dothan Affordable Housing Study Community Presentation November 6 th, 2017 Welcome and Introduction Agenda Welcome and Introduction Background Study Goals Process Findings Q & A / Discussion Next
City of Del Mar. Community Plan Housing Element (April 30, 2013 April 30, 2021)
") 3( Community Plan Housing Element 2013 2021 (April 30, 2013 April 30, 2021) Adopted by City Council Resolution No. 2013-27 on May 20, 2013. Certified by the California Department of Housing and Community
3( Community Plan Housing Element 2013 2021 (April 30, 2013 April 30, 2021) Adopted by City Council Resolution No. 2013-27 on May 20, 2013. Certified by the California Department of Housing and Community
Town of Yucca Valley GENERAL PLAN 1
 Town of Yucca Valley GENERAL PLAN 1 This page intentionally left blank. 3 HOUSING ELEMENT The Housing Element is intended to guide residential development and preservation consistent with the overall values
New affordable housing production hits record low in 2014
 1 Falling Further Behind: Housing Production in the Twin Cities Region December 2015 Key findings Only a small percentage of added housing units were affordable to households with low and moderate incomes.
Memo to the Planning Commission JULY 12TH, 2018
 Memo to the Planning Commission JULY 12TH, 2018 Topic: California State Senate Bill 828 and State Assembly Bill 1771 Staff Contacts: Joshua Switzky, Land Use & Housing Program Manager, Citywide Division
and for preparation of a JOBS/HOUSING BALANCE STUDY FOR THE LEHIGH VALLEY
 Request for Proposals for an update to AN AFFORDABLE HOUSING ASSESSMENT OF THE LEHIGH VALLEY IN PENNSYLVANIA April 4, 2007 and for preparation of a JOBS/HOUSING BALANCE STUDY FOR THE LEHIGH VALLEY A. Introduction
FOR LEASE IN MEDFORD, OREGON CARDINAL AVE. Cardinal Ave & Crater Lake Hwy, Medford, Oregon
 CRATER LAKE HWY FORMER RETAIL PADS FOR LEASE IN MEDFORD, OREGON ANCHORS OPENING SUMMER 2018! CARDINAL AVE available 10,000 SF available 10,000 SF available 8,490 SF LEAR WAY available 7,000 SF Location
DRAFT Analysis of Impediments to Fair Housing Choice. City of Menifee Haun Road Menifee, CA
 DRAFT 2017-2021 Analysis of Impediments City of Menifee 29714 Haun Road Menifee, CA 92586 www.cityofmenifee.us This Page Left Intentionally Blank City Council Neil R. Winter Mayor Greg August District
Application Guidelines
 Application Guidelines The Harris County Home Repair Program provides grants to low-income elderly (62 years or older) or households with a disabled person. If qualified, we provide the following: Minor
Affirmatively Furthering Fair Housing & CDBG. November 9, 2017 Ankeny, Iowa
 Fair Housing & CDBG November 9, 2017 Ankeny, Iowa Today s discussion» HUD s Fair Housing rule (AFFH)» AFFH requirements & assessments» Where we are at now» Impacts on communities receiving CDBG funds»
2012 Profile of Home Buyers and Sellers Florida Report
 2012 Profile of Home and Sellers Report Prepared for: REALTORS Prepared by: NATIONAL ASSOCIATION OF REALTORS Research Division December 2012 2012 Profile of Home and Sellers Report Table of Contents Introduction...
Housing Indicators in Tennessee
 Housing Indicators in l l l By Joe Speer, Megan Morgeson, Bettie Teasley and Ceagus Clark Introduction Looking at general housing-related indicators across the state of, substantial variation emerges but
THE NSP SUBSTANTIAL AMENDMENT
 THE NSP SUBSTANTIAL AMENDMENT AMENDED DRAFT AUGUST 29, 2009 Jurisdiction(s): Town of Babylon (located in Suffolk County New York) Jurisdiction Web Address: www.townofbabylon.com NSP Contact Person: Theresa
ECONOMIC CURRENTS. Vol. 3, Issue 1. THE SOUTH FLORIDA ECONOMIC QUARTERLY Introduction
 ECONOMIC CURRENTS THE SOUTH FLORIDA ECONOMIC QUARTERLY Introduction Economic Currents provides an overview of the South Florida regional economy. The report contains current employment, economic and real
Briefing Book. State of the Housing Market Update San Francisco Mayor s Office of Housing and Community Development
 Briefing Book State of the Housing Market Update 2014 San Francisco Mayor s Office of Housing and Community Development August 2014 Table of Contents Project Background 2 Household Income Background and
PLANNING COMMUNITIES OF OPPORTUNITY: WHY TWO KEY 2015 FEDERAL HOUSING DECISIONS MATTER KAPA SPRING CONFERENCE 2016 BOWLING GREEN, KY MAY 19,
 PLANNING COMMUNITIES OF OPPORTUNITY: WHY TWO KEY 2015 FEDERAL HOUSING DECISIONS MATTER KAPA SPRING CONFERENCE 2016 BOWLING GREEN, KY MAY 19, 2016 2 PRESENTERS Steve Sizemore, AICP, PTP University of Louisville,
WELLSVILLE AFFORDABLE HOUSING PLAN
 WELLSVILLE AFFORDABLE HOUSING PLAN 2014 DRAFT 2.2 Wellsville: Affordable Housing Plan 2014 Page 2 DRAFT 2.2 Wellsville: Affordable Housing Plan 2014 Table of Contents Summary of Affordable Housing Conditions...
Attachment I is an updated memo from Pat Comarell, providing the updated balancing tests to reflect the Council s October 10 th briefing.
 COUNCIL STAFF REPORT CITY COUNCIL of SALT LAKE CITY TO: City Council Members FROM: Ben Luedtke & Nick Tarbet Policy Analysts DATE: October 17, 2017 RE: Housing Plan: Growing Salt Lake PLNPCM2017-00168
HOUSING ELEMENT I. GOALS, OBJECTIVES AND POLICIES
 HOUSING ELEMENT I. GOALS, OBJECTIVES AND POLICIES GOAL 1: IN ORDER TO ACHIEVE A BALANCED HOUSING SUPPLY (AND A BALANCED POPULATION AND ECONOMIC BASE), EVERY EFFORT SHOULD BE MADE TO PROVIDE A BROAD RANGE