CITY OF VALDOSTA, GEORGIA ANALYSIS OF IMPEDIMENTS TO FAIR HOUSING CHOICE
|
|
|
- Dina Grace Reeves
- 6 years ago
- Views:
Transcription
1

2 CITY OF VALDOSTA, GEORGIA ANALYSIS OF IMPEDIMENTS TO FAIR HOUSING CHOICE Prepared for: City of Valdosta, Georgia Ms. Mara S. Register, Assistant to the City Manager Public Involvement Department 300 North Lee Street Valdosta, Georgia Prepared by: J-Quad Planning Group, LLC Midway Road, Suite 210 Addison, TX August, 2011
3 Introduction and Acknowledgements Introduction This report provides an Analysis of Impediments to Fair Housing Choice (AI), commissioned by the City of Valdosta, Valdosta, Georgia. This AI was conducted using a methodology consistent with the U.S. Department of Housing and Urban Development (HUD) guidelines. HUD requires that each jurisdiction receiving federal funds certify that it is affirmatively furthering fair housing. The certification specifically requires jurisdictions to do the following: Conduct an analysis of impediments to fair housing choice within the state or local jurisdiction. Take appropriate actions to overcome the effects of any impediments identified through that analysis. Maintain records reflecting the analysis and actions in this regard. Lead and Participating Agencies City of Valdosta, Public Involvement Department was responsible for oversight and coordination of the AI process. The City of Valdosta retained J-Quad Planning Group, a Community Development, Urban Planning and Housing Consulting firm to assist in the preparation of the AI. Acknowledgements Data collected in preparing the AI relied in part on input from the public. The process included information gathered from three citizen focus groups, key person interviews, and data provided by Valdosta Housing Authority and the City of Valdosta. We also acknowledge the participation of the City and County government officials, development community, non-profit, social services, business and real estate industries. Special thanks to all focus group participants and their contributions toward making the AI process a success.
4 Table of Contents Executive Summary... i Section 1 Community Profiles..1 Introduction Demographic Profile Income Profile Employment and Education Profile Public Transportation Profile Housing Profile Section 2 Fair Housing Law, Municipal Policies and Complaint Analysis 30 Introduction Fair Housing Law Enforcement Production and Availability of Affordable Units Regulatory and Public Policy Review Analysis of Fair Housing Complaints Conclusions and Implications for Fair Housing Barriers Section 3 Focus Groups and Community Engagement Introduction Focus Group Concerns and Comments Solutions Section 4 - Home Mortgage Disclosure Act Data (HMDA) Analysis 59 Introduction Analysis Conclusions Section 5 - Fair Housing Index.. 76 Introduction Methodology Findings Section 6 Impediments and Remedial Activities Introduction Public Policy Impediments Neighborhood Conditions Related Impediments Banking, Finance, Insurance and other Industry Impediments Socio-Economic Impediments Section 7 Oversight, Monitoring and Maintenance of Records...114
5 Executive Summary Introduction In 1995 the U.S. Department of Housing and Urban Development (HUD) announced that entitlement communities - communities receiving direct federal funding from Community Development Block Grant, HOME Investment Partnership and Emergency Shelter Grant programs must conduct a study of existing barriers to housing choice. This required study is referred to as the "Analysis of Impediments (AI) and is part of entitlement communities' consolidated planning process. The purpose of the AI is to examine how state and local laws, private, public and non-profit sector regulations, administrative policies, procedures, and practices are impacting the location, availability, and accessibility of housing in a given area. The AI is not a Fair Housing Plan rather it is an analysis of the current state of fair housing choice in Valdosta. The AI identifies specific barriers that need to be addressed if future fair housing initiatives are to be successful. Each jurisdiction receiving federal funds must certify that it is affirmatively furthering fair housing. The certification specifically requires jurisdictions to do the following: Conduct an analysis of impediments to fair housing choice within the state or local jurisdiction. Take appropriate actions to overcome the effects of any impediments identified through that analysis. Maintain records reflecting the analysis and actions in this regard. i
6 The City of Valdosta s commitment to furthering fair housing and affordable housing through planning and CDBG program design and implementation is noteworthy. While the City of Valdosta receives a relatively small allocation of $564,554 in Community Development Block Grant funding, their programming of these funds continue to improve and help maintain stability, and strengthen its older and lower income areas. The City and its nonprofit partners are encouraged to expand these efforts into other neighborhoods as a primary means of expanding fair housing choice. The impediments identified in this section can be directly linked to and supported by data and analysis from previous sections. In some instances, footnotes provide links to the corresponding sections should the reader need to refer to those sections for more details. Evaluating fair housing is a complex process involving diverse and wide-ranging considerations. The role of economics, housing markets, and personal choice are important to consider when examining fair housing. Any disproportionate impacts on persons of a particular race, ethnicity, or members of the protected classes under fair housing law have been comparatively analyzed to determine to what extent those disparities are limiting fair housing choice. Valdosta has relatively few impediments to fair housing. However, some issues were identified. The analysis of fair housing choice in the City of Valdosta has resulted in the identification of impediments identified through a study methodology that included conducting focus group sessions, a socio-economic analysis resulting in the construction of a community profile and fair housing index, analysis of the Home Mortgage Disclosure Act (HMDA) data, and a fair housing law and public policy and program review. The following narratives provide a summary of those sections. ii
7 Community Profiles The Community Profile is a review of demographic, income, employment, housing, and transportation data of Valdosta, Georgia, gathered from the 2010 Census estimates, American Community Survey (ACS) 5-Year estimates, 2000 and 2010 U.S. Census, City of Valdosta, Valdosta Chamber of Commerce, Board of Realtors and other sources. The following provide a summary of the current status of the community in Valdosta. According to the 2010 Census estimates, the total population of Valdosta was 54,518, a 24.7 percent increase between 2000 and Table 1.1, in the Community Profile Section, shows the distribution of population by race and ethnicity in the city. The White population increased by 13.1 percent, but their percentage of the total population decreased from 47.7 percent to 43.2 percent between 2000 and African-Americans had the most significant numerical increase in population, 6,643 persons, and increasing to 51.3 percent of total population in This constituted a 31.3 percent increase in the African- American population from 2000 to Valdosta experienced a percent increase in the Hispanic population between 2000 and The percentage of Hispanic population of the total population increased from 2.2 percent in 2000 to 4.0 percent in 2010, a 2.8 percentage point increase. The Census Bureau does not recognize Hispanic as a race, but rather as an ethnicity, this may account for the high increase of percent in the Other category between 2000 and It is a common misidentification for ethnic Hispanics to choose the other category on the Census for race rather than White or African-American. Other populations had significant percentage increases in population between 2000 and 2010, an 83.3 percent increase in the American Indian and Eskimo population, 57.9 percent increase in Asian and Pacific Islander population, 103 percent Other Race, but numerically and as a percent of total population, these increases were actually much less significant. iii
8 Household compositions consisting of large families, families with children and female headed households with children appear most likely to encounter issues relative to fair housing choice. We noted disproportionate impacts for African Americans and Hispanics in most categories compared to Whites. The percentage of female-headed households with children among White households was 4.9 percent, compared to 26.4 percent in African-American households, and 10.3 percent in Hispanic households between 2005 and When considering all family types with children present, the data show that 22.1 percent of all White households, 43.4 percent of all African-American households, and 38.8 percent of all Hispanic households were in this category. Non-family households among Whites made up 48.6 percent of all White households in Valdosta. Non-family households among African-Americans accounted for 34.1 percent of all African-American households. Non-family households among Hispanics accounted for 30.0 percent of all Hispanic households. Employment opportunities in the area and educational levels of the employees make a significant impact on housing affordability and the location choice of residents. Table 1.5, in the Community Profile Section, presents our analysis of occupation data, which indicate that there has been some shift in the distribution of occupations between 1990 and Arts, entertainment, recreation, accommodation, and food services had the largest increase, up 11.8 percentage points to 13.5 percent. Educational and Health services had an increase, up 3.5 percentage points to 25.8 percent. Public Administration had an increase, up 3.3 percentage points to 8.0 percent. Professional, Business, repair, and personal services had an increase, up 3.0 percentage points to 9.9 percent. Manufacturing realized the largest reduction of 8.5 percentage points to 8.5 percent of the workforce. Retail Trade reduced by 6.4 percentage points to 17.0 percent of the total workforce. Wholesale Trade had a decrease of 2.7 percentage points leading to 1.9 percent of the total workforce. iv
9 According to the major employer data provided by SEEDS Business Resource Center and Valdosta-Lowndes County Industrial Authority, the top ten employers in the area include Moody Air Force Base, South Georgia Medical Center, Valdosta State University, Lowndes County School System, Valdosta City School System, Lowe's Distribution Center, Convergys Corp, Wal-Mart Supercenters, City of Valdosta, and Lowndes County Government. Unemployment can negatively impact both White and minority households and our analysis of the distribution of unemployment by Race and Ethnicity indicates significant disparities in unemployment rates among African-Americans compared to Whites and other minority populations. Between 2005 and 2009, 5.9 percent of White persons age 16 and over reported being unemployed. African- Americans persons in the same age group reported a 14.1 percent unemployment rate and Hispanic reported a 6.9 percent rate. As a comparison, the citywide unemployment rate was 9.7 percent during the period. Income is a major factor contributing to fair housing choice among minority households. Our analysis indicates significant disparities in income among African-Americans compared to Whites. According to the ACS estimates, the median household income was $37,490 for White households, $20,876 for African-American households, and $35,208 for Hispanic households, compared to $29,046 for the overall city. The modal income class, the income classes with the highest number of households, for Whites was the $50,000 to $74,999 range with 15.9 percent of Whites in this income range. The most frequently reported income for African-American households was less than $10,000 range with 19.1 percent of households in this range. The modal income class for Hispanic households was $35,000 to $49,999 range with 24.3 percent of households in this range. The poverty data shows major effects on the African American community. The poverty rate among African-Americans was 35.0 percent of the total population between 2005 and Among White persons, the data reported 20.9 percent v
10 lived in poverty between 2005 and In comparison, the poverty rate for the city was 28.2 percent during the period. The ACS data for Hispanics shows low estimates for households living in poverty but high margins of error. The 2000 Census estimates provide more accurate poverty estimates for Hispanics. In Valdosta employment and unemployment rates are being negatively impacted due to limitations relative to educational attainment. The data indicates disproportionately lower educational attainment among African-Americans and Hispanics compared to Whites population. According to the ACS estimates (5-year average), 30.2 percent of African-Americans age 25 and above reported less than a high school education compared to 7.6 percent of Whites and 39.1 percent of Hispanics for in the same age group. As a comparison, the percentage of population with less than a high school education in the city was 19.3 percent during the period. The availability of jobs, consistent with the skill levels and educational levels of low-income persons, is largely dependent on the geographic location of the jobs and the workforces ability to get to and from the employment centers where those job are located. If jobs are concentrated in largely upper income areas, far removed from the areas where lower income persons live, their ability to get to and from work may be difficult, without public transportation, sometimes causing hardships on employees or potential employees that cannot afford their own private automobile. To further examine the impact of employment proximity relative to housing choice for low- and moderate-income persons, we analyzed the use and availability of public transportation and the extent to which public transportation provides flexible routes, affordable rates, time efficient commutes with direct route and limited transfers, and routes and schedules that provide access to major employment centers for peak and off-peak work shifts. vi
11 Information on public transportation was provided by the Southern Georgia Regional Commission (SGRC) and based on the Valdosta-Lowndes 2035 Transportation Plan. Public transportation in the Valdosta Urbanized Area is currently provided by Berrien and Lowndes Counties. Each county has executed a contract with MIDS Inc. to operate their respective demand response systems. These two systems are funded through the Federal Transit Administration (FTA) 5311 program, and provide rural demand response public transit services to the residents of their respective counties. MIDS Inc. operates Monday through Friday 7:30 AM to 5:30 PM with a fare of $3.00 per one-way trip. MIDS Inc. also contracts with the SGRC to provide the FTA s 5310 or Department of Human Services Elderly and Disabled Program transportation services. The SGRC in partnership with the Georgia Department of Human Services (DHS) provides transportation services in an eighteen county service area including, Lowndes, Berrien, and Lanier Counties. These services are primarily funded through the Federal Transit Administration 5310 program and include transporting seniors age 60 and over. Greyhound operates a station in downtown Valdosta which provides direct service to Orlando, Florida and points south, as well as direct service to Atlanta, GA and points north. Pearl Executive Shuttle provides transportation to nearby airports like Atlanta s Hartsfield-Jackson International Airport, Jacksonville International Airport and Tallahassee Regional Airport. According to the 2010 Census, the total number of housing units in the city was 22,709 with 2,238 or 9.9 percent vacant units. There were 15,608 housing units in Valdosta in The total number of housing units in the city increased 45.5 percent between 2000 and According to the ACS estimates (5- year average), the total number of housing units in the city was 22,623 of which, 35.7 percent were owner-occupied, 54.0 percent were renter-occupied, and the remaining 10.4 percent were vacant. The median housing value in the city was $119,300 and the median contract rent was $534 between 2005 and vii
12 Hispanics and African Americans in particular, face a number of demographic concerns such as lower income levels that typically impact housing choice and affordability negatively. One of the most revealing indicators that African- Americans and Hispanics lag far behind Whites in obtaining housing of their choice is in the category of homeownership. According to the ACS data, homeownership rate among Whites was 49.4 percent, compared to 30.6 percent among African-Americans, and 26.2 percent among Hispanics. Fair Housing Law, Municipal Policies and Complaint Analysis The City of Valdosta has enacted local Fair Housing Ordinance No , to promote and enforce Fair Housing and Non-Discrimination within the City of Valdosta. Therefore, our analysis of applicable fair housing laws focused on the local city ordinance in addition to the State of Georgia statue. In the analysis both were reviewed and compared to the Federal Fair Housing Act to determine whether they offered similar rights, remedies, and enforcement to the federal law and might be construed as substantially equivalent. Pertinent related laws, such as the Community Reinvestment Act and Home Mortgage Disclosure Act, were reviewed with respect to how they can facilitate fair lending. The City of Valdosta Public Involvement Department receives fair housing complaints and makes referrals to HUD for enforcement. This agency is also responsible for conducting public education, training and outreach of fair housing rights and remedies in Valdosta. The HUD Regional Office in Atlanta, Georgia conducts investigations of fair housing complaints that are reported to them by the state and local jurisdictions. Georgia is part of HUD s Region IV that includes Alabama, Florida, Kentucky, Mississippi, North Carolina, South Carolina, Tennessee, Puerto Rico, and the U.S. Virgin Islands. When a complaint is filed with any of the jurisdictions, HUD is notified of the complaint. Fair housing complaint information was received from the Atlanta, Georgia FHEO Regional Office of the U.S. Department of Housing viii
13 and Urban Development. The data received from HUD provides a breakdown of complaints filed for Valdosta from January 1, 2008 through April 30, During this period, no complaints were filed according to one of the seven bases under the Federal Fair Housing Act: National Origin, Color, Religion, Familial Status, Handicap, Sex, and Race. The most recent cases according to HUD were filed in 1992 and An assessment of characteristics affecting housing production, availability, and affordability in Valdosta was conducted, including the adequacy and effectiveness of housing and housing related programs designed and implemented by the City of Valdosta Public Involvement Department. The 2011 Annual Action Plan indicated that the City of Valdosta anticipated receiving approximately $564,554 in Community Development Block Grant (CDBG) funding in FY Based on Valdosta City s planned utilization of these funds for housing and housing related programs, they should enhance their ability to address impediments relative to housing advocacy, availability, affordability, rehabilitation, homeownership, and financial literacy, as identified in the AI prior to FY Highlights of their proposed expenditure for FY 2011 include: $10,000 for home buyer education $447,554 for owner occupied rehabilitation $22,680 for completion of the 2011 Fair Housing Impediment Analysis Update Host an Annual Housing Summit geared toward providing continuing education and increased advocacy among area organizations relative to fair and affordable housing. Expansion of City Section 3 Initiatives. ix
14 Focus Groups, Fair Housing Index, and Home Mortgage Disclosure Act Analysis Fair housing choice encounters a number of impediments, as identified through the construction of a fair housing index and Home Mortgage Disclosure Act (HMDA) data analysis for Valdosta. Section Three of this report details public input received during the community participation process. The process included information gathered from three focus group sessions, key persons interviews, and data provided by the City. We also acknowledge the participation of the local chamber of commerce, and representatives from the banking and mortgage institutions, housing development, non-profit, social services, business and real estate industries. The focus groups voiced many concerns relating to fair housing choice that they perceive as impediments. The HMDA data analysis, detailed in Section Four, indicates that there are issues of concern in mortgage lending. Loan denials for minority populations were disproportionately higher than the denial rates for White applicants and there is some evidence to suggest that characteristics of redlining may exist and is found to be adversely impacting fair housing choice in Valdosta. Section Five of the report, the Fair Housing Index, highlights geographic areas indicating a concentration of attributes prevalent in fair housing issues. These attributes include high minority concentrations, older housing stock, reliance on public transportation, low income, low housing values and contract rents, a high percentage of female headed households with children, a high ratio of loans denied to loans originated, high unemployment rates, and high rates of high school dropouts. The collective concentration of these issues leads to neighborhood deterioration and market conditions that tend to impede fair housing choice. The census tracts designated as having high risk of fair housing related problems are concentrated in the central census tracts of Valdosta. The census tracts having moderate risk of fair housing problems are located in northeastern areas of the city. x
15 Impediments to Fair Housing Choice Impediments to fair housing choice are detailed in Section Six of this report. This section draws on the information collected and analyzed in previous sections to provide a detailed look at fair housing impediments in Valdosta. Five major categories of impediments were analyzed: Real Estate Impediments; Public Policy Impediments; Neighborhood Conditions as Impediments; Banking, Finance, and Insurance Related Impediments; and Socioeconomic Impediments. For each impediment identified, issues and impacts are detailed. Remedial actions are suggested to address each impediment. Some of the remedial actions recommended in this section are conceptual frameworks for addressing the impediments. These actions will require further research, analysis, and final program design by the City of Valdosta for implementation. Remedial Activities designed to address impediments The major focus of the recommended remedial actions is centered on creating partnerships, identifying new federal resources and leveraging private funding needed to enhance the jurisdiction s ability to increase its supply of affordable housing and better meet the needs of low-income and moderate-income households. Other remedial actions are recommended as a means of reversing the negative impacts of the market conditions and mortgage lending trends that adversely and disproportionately impact the members of the protected classes under the fair housing law. These include sub prime lending, foreclosures, credit and collateral deficiencies that impact loan origination rates, poverty, and income. The details of the identified impediments and remedial actions are presented in Section Six of the report. xi
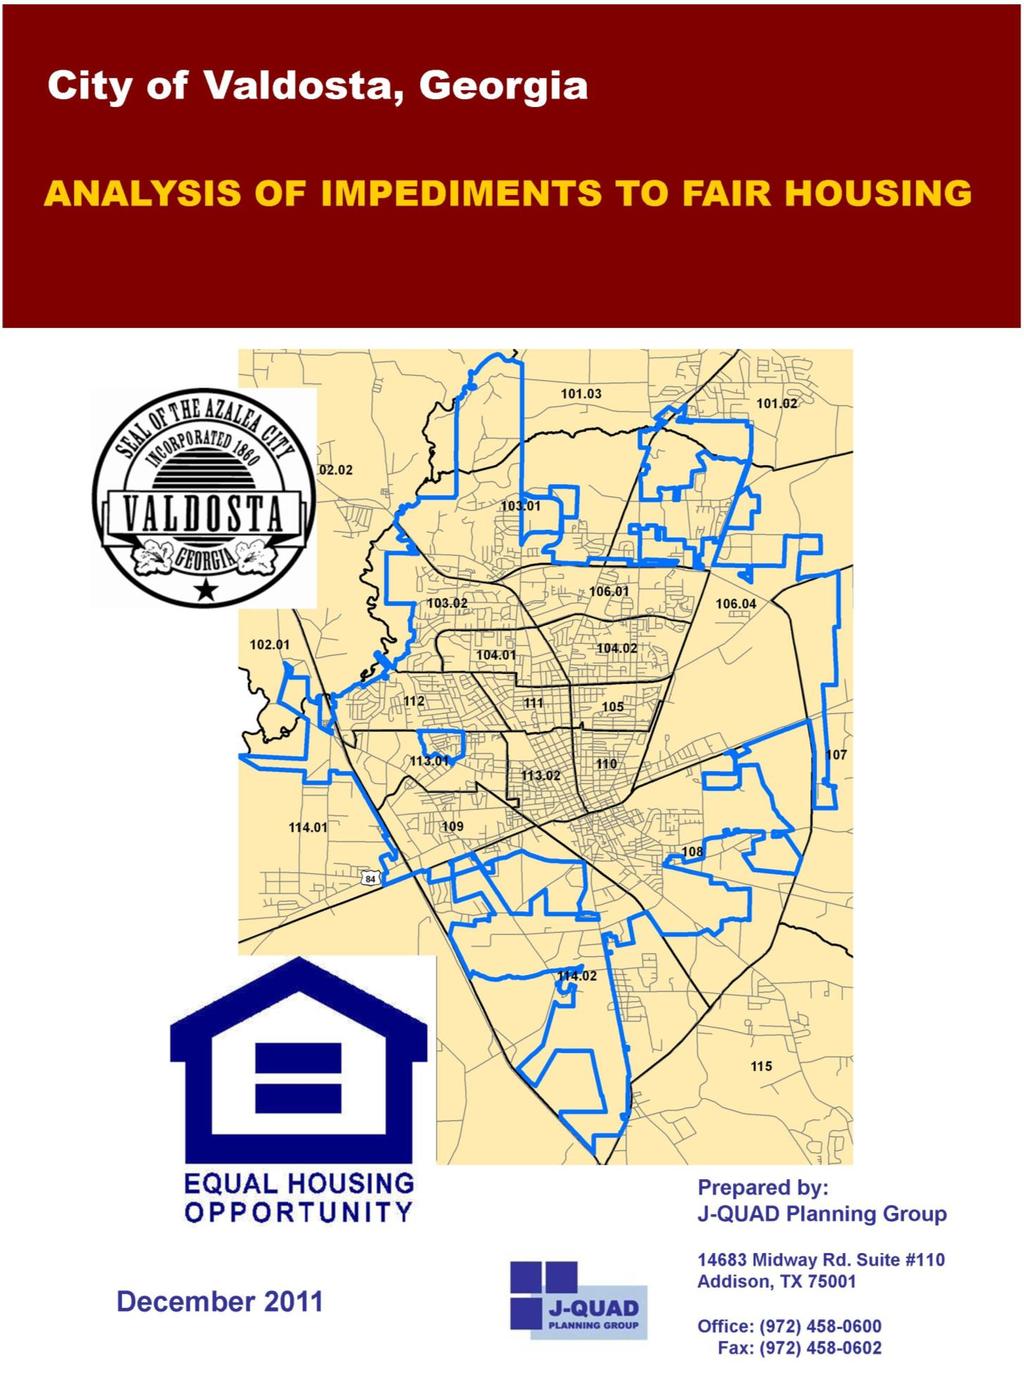
16 Section 1: Community Profile Introduction The Community Profile is a review of demographic, income, employment, and housing data of Valdosta, Georgia, gathered from the 2010 Census estimates, American Community Survey (ACS) 5-Year estimates, 2000 and 2010 U.S. Census, City of Valdosta, Valdosta-Lowndes County Chamber of Commerce, and other sources. The following sections provide a look at the current status of the community in Valdosta: Demographics - analyzes the basic structure of the community in terms of racial diversity, population growth, and family structure. Income - analyzes income sources, the distribution of income across income class, and poverty. Employment - examines unemployment rates, occupation trends, and major employers. Public Transportation analyzes access and availability of public transit system. Housing - examines data on the housing stock, with particular attention to the age of the housing stock, vacancy rates, tenure, and cost burdens. Detailed analyses will concentrate on the three major ethnic groups in Valdosta: White, African-American, and Hispanics. All other ethnic groups are smaller in number and percentage and, therefore, the results of their analysis will not be presented in detail. The analysis is supported with tables and maps provided as reference materials. Most of the data presented in the tables and maps are directly referenced in the text. There may be some cases where additional information was included for the reader s benefit, though not specifically noted in the text Demographics The demographic analysis of Valdosta concentrates on the magnitude and composition of the population and changes that occurred between 2000 and Please note that the attached maps present data by census tract with an overlay of the city limits. For reference, Map 1.1, on the following page, provides a visual representation of Valdosta. 1

17 Map 1.1: Valdosta, Georgia 2
18 According to the 2010 Census estimates, the total population of Valdosta was 54,518, a 24.7 percent increase between 2000 and Table 1.1, below, shows the distribution of population by race and ethnicity in the city. The White population increased by 13.1 percent, but their percentage of the total population decreased from 47.7 percent to 43.2 percent between 2000 and African-Americans had the most significant numerical increase in population, 6,643 persons, and increasing to 51.3 percent of total population in This constituted a 31.3 percent increase in the African-American population from 2000 to Valdosta experienced a percent increase in the Hispanic population between 2000 and The percentage of Hispanic population of the total population increased from 2.2 percent in 2000 to 4.0 percent in 2010, a 2.8 percentage point increase. The Census Bureau does not recognize Hispanic as a race, but rather as an ethnicity, this may account for the high increase of percent in the Other category between 2000 and It is a common misidentification for ethnic Hispanics to choose the other category on the Census for race rather than White or African-American. Other populations had significant percentage increases in population between 2000 and 2010, an 83.3 percent increase in the American Indian and Eskimo population, 57.9 percent increase in Asian and Pacific Islander population, 103 percent Other Race, but numerically and as a percent of total population, these increases were actually much less significant. Race Table 1.1 Total population by race and ethnicity for Valdosta, 2000 and %Change # % # % White 20, % 23, % 13.1% African-American 21, % 27, % 31.3% American Indian and Eskimo % % 83.3% Asian or Pacific Islander % % 57.9% Other race % 1, % 103.3% Total 43, % 54, % 24.7% Hispanic (ethnicity) % 2, % 131.0% Source: US Census 2000 and 2010 On the following pages are a series of Maps 1.2 through 1.5 indicate spatial concentrations of the various racial and ethnic groups within Valdosta. 3

19 Map 1.2: Percent African-American 2000 and

20 Map 1.3: Percent Hispanic 2000 and

21 Map 1.4: Percent American Indian and Eskimo 2000 and

22 Map 1.5: Percent Asian and Pacific Islander 2000 and
23 In many communities, female-headed households and female-headed households with children face a high rate of housing discrimination. Higher percentages of female-headed households with children under the age of 18, sometimes correlates to increases incidents of reported rental property owners refusal to rent to tenants with children. The percentage of female-headed households with children among White households was 4.9 percent, compared to 26.4 percent in African-American households, and 10.3 percent in Hispanic households between 2005 and When considering all family types with children present, the data show that 22.1 percent of all White households, 43.4 percent of all African-American households, and 38.8 percent of all Hispanic households were in this category. Non-family households among Whites made up 48.6 percent of all White households in Valdosta. Non-family households among African-Americans accounted for 34.1 percent of all African-American households. Non-family households among Hispanics accounted for 30.0 percent of all Hispanic households. Table 1.2, below, shows the family structure of White, African-American, and Hispanic households between 2005 and Household Type Table 1.2 Household structure by race for Valdosta, (5-Year Average) # of households White African-American Hispanic % of Households # of households % of Households # of households % of Households Family Households 5, % 6, % % Married-couple 4, % 2, % % Married-couple with children 1, % 1, % % Male householder, no wife present % % % Male Householder with children % % 8 3.0% Female householder, no husband present % 2, % % Female-Headed with children % 2, % % Non-Family Households 4, % 3, % % Total Households 10, % 9, % % Source: American Community Survey The spatial distribution of female-headed households with children is shown in Map 1.6, on the following page. 8

24 Map 1.6: Percent Female-Headed Households with Children,
25 1.2. Income Low-income households tend to be housed in less desirable housing stock and in less desirable areas in the city. Income limitations often prevent those households from moving to areas where local amenities raise the value of the housing. Income plays a very important part in securing and maintaining housing. The data in Table 1.3 and Chart 1.1, on the following page, show the distribution of income across income classes among Whites, African-American, and Hispanics. Overall, the income distribution data show a higher proportion of low-income households within the African-American and Hispanic communities. In general, limitations on fair housing choice are more commonly found to affect housing decisions among low-income persons. Chart 1.1 shows that the modal income class, the income classes with the highest number of households, for Whites was the $50,000 to $74,999 range with 15.9 percent of Whites in this income range. The most frequently reported income for African-American households was less than $10,000 range with 19.1 percent of households in this range. The modal income class for Hispanic households was $35,000 to $49,999 range with 24.3 percent of households in this range. The median household income was $37,490 for White households, $20,876 for African-American households, and $35,208 for Hispanic households, compared to $29,046 for the overall city in According to the ACS estimates, the median household income for the city was $31,940. Map 1.7, on page 12, shows the median household income by census tract between 2005 and
26 Table 1.3 Households by race by income for Valdosta, Income class # of households White African-American Hispanic % of Households # of household s % of Households # of households % of Households Less than $10,000 1, % 1, % % $10,000 to $14, % % % $15,000 to $24,999 1, % 1, % % $25,000 to $34,999 1, % 1, % % $35,000 to $49,999 1, % 1, % % $50,000 to $ $74,999 1, % 1, % % $75,000 to $99, % % % $100,000 or more 1, % % % Total: 10, % 9, % % Source: American Community Survey Chart 1.1: Percent of Households by income class by race for Valdosta, % 25.0% 20.0% 15.0% 10.0% White African-American Hispanic 5.0% 0.0% Less than $10,000 $10,000 to $14, 999 $15,000 to $24,999 $25,000 to $34,999 $35,000 to $49,999 $50,000 to $75,000 to $ $74,999 $99,999 $100,000 or more Source: American Community Survey 11

27 Map 1.7: Median Household Income,
28 The poverty data in Table 1.4, below, shows major effects on the African community. The incidence of poverty among African-Americans was 35.0 percent of the total population between 2005 and Among White persons, the data reported 20.9 percent lived in poverty between 2005 and In comparison, the poverty rate for the city was 28.2 percent during the period. The ACS data for Hispanics shows low estimates for households living in poverty but high margins of error. The 2000 Census estimates provide more accurate poverty estimates for Hispanics. Table 1.4 Poverty Status by race Valdosta, Age Group Number in Poverty White African-American Hispanic % in Poverty Number in Poverty % in Poverty Number in Poverty % in Poverty Under 5 years % 1, % 0 0.0% 5 years 0 0.0% % 0 0.0% 6 to 11 years % % 0 0.0% 12 to 17 years % 1, % % 18 to 64 years 3, % 4, % % 65 to 74 years % % 0 0.0% 75 years and over % % 0 0.0% Total 4, % 8, % % Source: American Community Survey In 2000, the poverty rate among Whites was 12.5 percent, compared to 36.1 percent in African-Americans, and 28.6 percent in Hispanics. The poverty rate for the overall city was 24.7 percent in
29 1.3. Employment Employment opportunities in the area and educational levels of the employees make a significant impact on housing affordability and the location choice of residents. Table 1.5, below, presents our analysis of occupation data, which indicate that there has been some shift in the distribution of occupations between 1990 and Arts, entertainment, recreation, accommodation, and food services had the largest increase, up 11.8 percentage points to 13.5 percent. Educational and Health services had an increase, up 3.5 percentage points to 25.8 percent. Public Administration had an increase, up 3.3 percentage points to 8.0 percent. Professional, Business, repair, and personal services had an increase, up 3.0 percentage points to 9.9 percent. Manufacturing realized the largest reduction of 8.5 percentage points to 8.5 percent of the workforce. Retail Trade reduced by 6.4 percentage points to 17.0 percent of the total workforce. Wholesale Trade had a decrease of 2.7 percentage points leading to 1.9 percent of the total workforce. Table 1.5 Occupation of employed persons for Valdosta, 1990 and (5-Year Average) Occupation Average Percent Point Change Agriculture, forestry, mining, and fisheries 1.7% 0.3% -1.4% Construction 3.7% 3.7% 0.0% Manufacturing 17.0% 8.5% -8.5% Transportation, Communications, and other public utilities 4.8% 3.7% -1.1% Wholesale trade 4.6% 1.9% -2.7% Retail trade 23.4% 17.0% -6.4% Finance, insurance, and real estate 3.9% 3.4% -0.5% Professional, Business, repair, and personal services 6.9% 9.9% 3.0% Arts, Entertainment and recreation services 1.7% 13.5% 11.8% Educational and Health services 22.3% 25.8% 3.5% Other professional and related services 5.4% 4.4% -1.0% Public administration 4.7% 8.0% 3.3% Source: US Census 1990 & American Community Survey 14
30 The data presented in Table 1.6, provide a portrait of the distribution of the unemployed. A closer look at the distribution of unemployment by Race and Ethnicity, however, indicates that unemployment is disproportionately higher among African-Americans compared to Whites and Hispanics. Between 2005 and 2009, 5.9 percent of White persons age 16 and over reported being unemployed. African- Americans persons in the same age group reported a 14.1 percent unemployment rate and Hispanic reported a 6.9 percent rate. As a comparison, the citywide unemployment rate was 9.7 percent during the period. Employment Status Table 1.6 Employment Status by race for Valdosta, White African-American Hispanic Total Number Percent Number Percent Number Percent Number Percent In Labor Force: 12,320 12, ,939 In Armed Forces % % % % Civilian: 11,530 12, ,965 Employed 10, % 10, % % 22, % Unemployed % 1, % % 2, % Not in labor force 6,576 6, ,494 Total 18,896 18, ,433 Source: American Community Survey According to the Bureau of Labor Statistics, the unemployment rate for the City of Valdosta has decreased slightly since 2009, reported at 8.9 percent in 2010 and 8.3 percent as of April Map 1.8, on the following page, shows the distribution of unemployed in Valdosta. 15

31 Map 1.8: Unemployment Rate,
32 According to the major employer data provided by SEEDS Business Resource Center and Valdosta-Lowndes County Industrial Authority, the top ten employers in the area include Moody Air Force Base, South Georgia Medical Center, Valdosta State University, Lowndes County School System, Valdosta City School System, Lowe's Distribution Center, Convergys Corp, Walmart Supercenters, City of Valdosta, and Lowndes County Government. In Valdosta, the difference in the unemployment rate between the three groups can, to some extent, be attributed to limitations due to educational attainment. According to the ACS estimates (5-year average), 30.2 percent of African- Americans age 25 and above reported less than a high school education compared to 7.6 percent of Whites and 39.1 percent of Hispanics for in the same age group. As a comparison, the percentage of population with less than a high school education in the city was 19.3 percent during the period. The availability of jobs, consistent with the skill levels and educational levels of lowincome persons, is largely dependent on the geographic location of the jobs and the workforces ability to get to and from the employment centers where those job are located. If jobs are concentrated in largely upper income areas, far removed from the areas where lower income persons live, their ability to get to and from work may be difficult, without public transportation, sometimes causing hardships on employees or potential employees that cannot afford their own private automobile. To further examine the impact of employment proximity relative to housing choice for low- and moderate-income persons, we analyzed the use and availability of public transportation and the extent to which public transportation provides flexible routes, affordable rates, time efficient commutes with direct route and limited transfers, and routes and schedules that provide access to major employment centers for peak and off-peak work shifts. 17
33 1.4. Public Transportation Information on public transportation was provided by the Southern Georgia Regional Commission (SGRC) and based on the Valdosta-Lowndes 2035 Transportation Plan. Public transportation in the Valdosta Urbanized Area is currently provided by Berrien and Lowndes Counties. Each county has executed a contract with MIDS Inc. to operate their respective demand response systems. These two systems are funded through the Federal Transit Administration (FTA) 5311 program, and provide rural demand response public transit services to the residents of their respective counties. MIDS Inc. operates Monday through Friday 7:30 AM to 5:30 PM with a fare of $3.00 per one-way trip. MIDS Inc. also contracts with the SGRC to provide the FTA s 5310 or Department of Human Services Elderly and Disabled Program transportation services. The SGRC in partnership with the Georgia Department of Human Services (DHS) provides transportation services in an eighteen county service area including, Lowndes, Berrien, and Lanier Counties. These services are primarily funded through the Federal Transit Administration 5310 program and include transporting seniors age 60 and over. Greyhound operates a station in downtown Valdosta which provides direct service to Orlando, Florida and points south, as well as direct service to Atlanta, GA and points north. Pearl Executive Shuttle provides transportation to nearby airports like Atlanta s Hartsfield-Jackson International Airport, Jacksonville International Airport and Tallahassee Regional Airport. 18
34 1.5. Housing According to the 2010 Census, the total number of housing units in the city was 22,709 with 2,238 or 9.9 percent vacant units. As shown in Table 1.7, to the right, there were 15,608 housing units in Valdosta in The total number of Tenure Table 1.7 Tenure for housing in Valdosta, 1990, 2000, and (5-Year Average) (Average) Number Percent Number Percent Number Percent Owner-occupied 7, % 7, % 8, % Renter-occupied 7, % 8, % 12, % Vacant 1, % 2, % 2, % Total: 15, % 18, % 22, % Source: US Census 1990 and 2000, and American Community Survey housing units in the city increased 45.5 percent between 2000 and According to the ACS estimates (5-year average), the total number of housing units in the city was 22,623 of which, 35.7 percent were owner-occupied, 54.0 percent were renter-occupied, and the remaining 10.4 percent were vacant. The median housing value in the city was $119,300 and the median contract rent was $534 between 2005 and Table 1.8, to the right, shows that of all housing units, 64.4 percent were categorized as single-family detached housing units, 2.3 percent as single-family attached units, 10.2 percent contained two to four units, 21.3 percent were multifamily, and 1.8 percent mobile home or other. Table 1.8 Housing type for Valdosta, (5-Year Average) Units in Structure Number* Percent Single-Family detached 14, % Single-Family attached % 2-4 units 2, % Multifamily 4, % Mobile home or Other % Total 22, % Source: American Community Survey As shown on Table 1.9, on the following page, 11.5 percent of all housing units were built prior to 1950, 13.8 percent were built between 1950 and 1959, 11.4 percent were built between 1960 and 1969, 18.7 percent were built between 1970 and 1979, and 44.7 percent were built after About 25 percent of the housing stock is more than 50 years old, built prior to About 37 percent of the housing stock 19
35 was built prior to 1970 and based on national standards, these units may contain lead-based paint or likely be in need of repairs and maintenance. Table 1.9 Age of Housing Stock in Valdosta, (5-Year Average) Year Built Number Percent Built 2005 or later 1, % Built 2000 to , % Built 1990 to , % Built 1980 to , % Built 1970 to , % Built 1960 to , % Built 1950 to , % Built 1940 to , % Built 1939 or earlier 1, % Total: 22, % Source: American Community Survey According to the ACS data shown in Table 1.10, the homeownership rate among Whites was significantly higher at 49.4 percent, compared to 30.6 percent among African-Americans, and 26.2 percent among Hispanics. Table 1.10 Tenure by Race in Valdosta, (5-Year Average) Tenure by Race Owner-occupied Renteroccupied # % # % White 5, % 5, % African-American 2, % 6, % Hispanic % % Source: American Community Survey Maps 1.9, on following page, and Map 1.10, on page 22, indicate the distribution of single-family and multifamily housing across the city. Map 1.11, on page 23, provides a geographic representation of the distribution of the oldest housing stock in the city. Maps 1.12 and 1.13, on pages 24 and 25, provide a geographic depiction of the distribution of housing values and rents across the city. 20

36 Map 1.9: Percent Single-Family Housing Units,

37 Map 1.10: Percent Multifamily Housing Units,

38 Map 1.11: Percent Pre-1960 Housing Stock 23

39 Map 1.12: Median Housing Value,

40 Map 1.13: Median Contract Rent,
41 Data contained in the Comprehensive Housing Affordability Strategy (CHAS) Table for the year 2000, duplicated in Table 1.11, on the following page, indicates that the impact of housing costs on household incomes is very severe on low- and very lowincome households. The table shows that 70.8 percent of all very low-income renters (those earning between 0 percent and 30 percent of the median family income) and 69.9 percent of very low-income homeowner households paid more than 30 percent of their income on housing expenses. Furthermore, 59.1 percent of very low-income renters and 50.9 percent of very low-income homeowners paid more than 50 percent of their incomes on housing expenses in Looking at the Other Low-Income households (those earning between 31 percent and 50 percent of the median family income), 67.7 percent of low-income renters and 60.9 percent of low-income homeowners paid more than 30 percent on housing expenses in Also, 25.3 percent of renters and 35.3 percent of homeowners paid more than 50 percent on housing expenses. In 2000, the moderate-income category (those earning between 51 percent and 80 percent of the median family income), shows 33.4 percent of renters and 38.6 percent of homeowners had rent burdens in excess of 30 percent, and 3.9 percent renters and 10.4 percent of homeowners paid more than 50 percent on housing expenses. These cost burdens impact fair housing choices and represent significant impediments in that they impact persons at every income category. 26
42 Table 1.11 Cost Burden by income and tenure, 2000 Very Low-Income (Household income <=30% MFI) Renters % Cost Burden > 30% % Cost Burden > 50% Elderly Small Related Large Related Other Total Renters Owners Elderly Small Related Large Related Other Total Owners Total Households Other Low-Income (Household income >30 to <=50% MFI) Renters % Cost Burden > 30% % Cost Burden > 50% Elderly Small Related Large Related Other Total Renters Owners Elderly Small Related Large Related Other Total Owners Total Households Moderate Income (Household income >50% to <=80% MFI) Renters % Cost Burden > 30% % Cost Burden > 50% Elderly Small Related Large Related 7 0 Other Total Renters Owners Elderly Small Related Large Related Other Total Owners Total Households Source: HUD Comprehensive Housing Affordability Strategy (CHAS) Tables,
43 According to the ACS estimates, as shown in Table 1.12 to the right, 49.8 percent of renter households paid more than 30 percent of their household income towards rent. About 76 percent of the renter households with household income of less than $10,000, 85.9 percent of the renter households that earned between $10,000 to $19,999, and 52.8 percent of the renter households that earned between $20,000 to $34,999 spent more than 30 percent of their households income towards rent during the five-year period. Overall, 49.8 percent of renter households paid more than 30 percent of their household income towards rent. Table 1.12 Gross Rent as a Percent of Household Income in Valdosta, (5-Year Average) Gross Rent as a Percent of Household Income Number of Households Less than $10,000 2,962 Less than 30.0 percent 207 Cost Burden 30% 30.0 percent or more 2, % Not computed 511 $10,000 to $19,999 2,290 Less than 30.0 percent percent or more 1, % Not computed 75 $20,000 to $34,999 3,005 Less than 30.0 percent percent or more 1, % Not computed 109 $35,000 to $49,999 1,810 Less than 30.0 percent percent or more % Not computed 38 $50,000 or more 2,139 Less than 30.0 percent percent or more 0 0.0% Not computed 138 Total Renter Households 12,206 Less than 30.0 percent 5, percent or more 6, % Not computed 871 Total: 12,206 Source: American Community Survey As shown in Table 1.13, to the right, 23.6 percent of owner households were under 30 percent cost burden and 8.6 percent of the owner households were under 50 percent cost burden during the same period. Table 1.13 Owner Housing Costs as a Percent of Household Income in Valdosta, (5-Year Average) Housing Cost as a Percent of Household Income Number of Owner Households Percent Less than 30.0 percent 6, % 30.0 percent or more 1, % 50.0 percent or more % Not computed % Total Owner-Occupied households 8, % Source: American Community Survey 28
44 African Americans and Hispanics in particular, face a number of demographic concerns that typically impact housing choice and affordability negatively. One of the most revealing indicators that minorities lag far behind Whites in obtaining housing of their choice is in the category of homeownership. The homeownership rate among Whites was 49.4 percent, 18.8 percentage points higher than African-Americans at 30.6 percent and 23.2 percentage points higher than that of Hispanics, reporting a homeownership rate of 26.2 percent between 2005 and Overall, there were significant disparities in the demographic characteristics for minorities compared to that of Whites in most all categories, including income, poverty, unemployment, educational attainment and household characteristics. These demographic characteristics likely influenced minorities choices in the geographical location and condition of housing and neighborhoods, housing type, cost of housing, decisions to become or remain a renter verses a homeowner, and unduly contributed the housing of their choice being a cost burden or creating overcrowded conditions for their household. According to the 2010 Census estimates, the total population of Valdosta was 54,518, a 24.7 percent increase between 2000 and The distribution of population, based on the race and ethnicity of the City s population, is becoming increasingly more diverse as well. The White population increased by 13.1 percent, but their percentage of the total population decreased from 47.7 percent to 43.2 percent between 2000 and African-Americans had the most significant numerical increase in population, 6,643 persons, and increasing to 51.3 percent of total population in Given the aforementioned disparities in the demographic characteristics of minorities, and African Americans in particular, as minority populations continue to increase, impediments to fair housing and their impacts relative to these disparities in demographics for minorities and their households, will likely increase as well. 29
45 Section 2: Fair Housing Law, Policies and Complaint Analysis Introduction It is important to examine how the City of Valdosta s laws, regulations, policies and procedures will ultimately affect fair housing choice. Fair housing choice is defined, generally, as the ability of people with similar incomes to have similar access to location, availability and quality of housing. Therefore, impediments to fair housing choice may be acts that violate a law or acts or conditions that do not violate a law, but preclude people with varying incomes from having equal access to decent, safe, and affordable housing. The first part of this section, Section 2.1, will address the existing statutory and case law that work to remove impediments and promote fair housing choice. The Federal Fair Housing Act can be effective in mitigating barriers to fair housing choice, depending upon enforcement efforts. Various judicial court case decisions pertaining to fair housing were reviewed and are incorporated in the analysis. Other related regulations and case law that provide further interpretation, understanding, and support to the Federal Fair Housing Act were considered and will also be discussed. The City of Valdosta has enacted local Fair Housing Ordinance No , to promote and enforce Fair Housing and Non-Discrimination within the City of Valdosta. Therefore, our analysis of applicable fair housing laws focused on the local city ordinance in addition to the State of Georgia statue. In the analysis both were reviewed and compared to the Federal Fair Housing Act to determine whether they offered similar rights, remedies, and enforcement to the federal law and might be construed as substantially equivalent. Pertinent related laws, such as the Community Reinvestment Act and Home Mortgage Disclosure Act, were reviewed with respect to how they can facilitate fair lending. Section 2.2 summarizes the level of fair housing enforcement activity in the City of Valdosta. 30
46 A more difficult, but intertwined, aspect of evaluating barriers to fair housing choice involves an analysis of public policy, programs and regulations that impact the availability of affordable housing. Our analysis centered on how governmental actions impact fair housing choice and the availability of adequate, decent, safe, and affordable housing for people of all incomes. We examined government subsidies and public funding appropriations used to provide housing assistance for very low- and low-income households. This included an analysis of city operated housing programs provided in Section 2.3. Numerous documents were collected and analyzed to complete this section. The key documents are Consolidated Plans, current and previous Annual Action Plans, the Consolidated Annual Performance Evaluation Reports (CAPER), Valdosta Housing Authority Five Year and Annual Plans and documentation on various housing programs and projects. City staff also provided information on its current and future initiatives to develop affordable housing and acquire additional funds. Our analysis of development regulations, City advisory board actions and public policy documents are presented in Section 2.4. This section focuses on building codes, zoning ordinances, land use plans, local initiatives and governmental actions relative to development and incentives that stimulate development. The analysis of public policy includes decisions by advisory boards and commissions such as the Valdosta Housing Authority Board, Zoning Board of Appeals, Greater Lowndes Planning Commissions, Construction Board of Appeals, Housing Board of Adjustment, Historic Preservation Commission, CDBG Advisory Committee, Metropolitan Planning Organization (MPO) and the Industrial Authority. Section 2.5 provides an analysis of fair housing complaints filed with HUD. Section 2.5 also contains conclusions about fair housing barriers based on the existing law, enforcement efforts, complaint analysis, and the availability of affordable housing. The HUD Atlanta Georgia Regional FHEO Office has responsibility for fair housing enforcement in Valdosta. Official compliant date was received from the HUD Atlanta, Georgia Regional Office, Fair Housing Equal Opportunity Division. 31
47 2.1. Fair Housing Law The Federal Fair Housing Act (the Act) was enacted in 1968, and amended in 1974 and 1988 to add protected classes, provide additional remedies, and strengthen enforcement. The Act, as amended, makes it unlawful for a person to discriminate on the basis of race, color, sex, religion, national origin, handicap, or familial status. Generally, the Act prohibits discrimination based on one of the previously mentioned protected classes in all residential housing, residential sales, advertising, and residential lending and insurance. Prohibited activities under the Act, as well as examples, are listed below. It is illegal to do the following based on a person's membership in a protected class: Misrepresent that a house or apartment is unavailable by: Providing false or misleading information about a housing opportunity, Discouraging a protected class member from applying for a rental unit or making an offer of sale, or Discouraging or refusing to allow a protected class member to inspect available units; Refuse to rent or sell or to negotiate for the rental or sale of a house or apartment or otherwise make unavailable by: Failing to effectively communicate or process an offer for the sale or rental of a home, Utilizing all non-minority persons to represent a tenant association in reviewing applications from protected class members, or Advising prospective renters or buyers that they would not meld with the existing residents; Discriminate in the terms, conditions, or facilities for the rental or sale of housing by: Using different provisions in leases or contracts for sale, Imposing slower or inferior quality maintenance and repair services, Requiring a security deposit (or higher security deposit) of protected class members, but not for non-class members, 32
48 Assigning persons to a specific floor or section of a building, development, or neighborhood, or Evicting minorities, but not whites, for late payments or poor credit; Make, print, publish, or post (direct or implied) statements or advertisements that indicate that housing is not available to members of a protected class; Persuade or attempt to persuade people, for profit, to rent or sell their housing due to minority groups moving into the neighborhood by: Real estate agents mailing notices to homeowners in changing area with a listing of the homes recently sold along with a picture of a Black real estate agent as the successful seller, or Mailed or telephonic notices that the "neighborhood is changing" and now is a good time to sell, or noting the effect of the changing demographics on property values; Deny or make different loan terms for residential loans due to membership in a protected class by: Using different procedures or criteria to evaluate credit worthiness, Purchasing or pooling loans so that loans in minority areas are excluded, Implementing a policy that has the effect of excluding a minority area, or Applying different procedures (negative impact) for foreclosures on protected class members; Deny persons the use of real estate services; Intimidate, coerce or interfere; or Retaliation against a person for filing a fair housing complaint. The Fair Housing Act requires housing providers to make reasonable accommodations in rules, policies, practices, and paperwork for persons with disabilities. They must allow reasonable modifications in the property so people with disabilities can live successfully. Due to the volume of questions and complaints surrounding this aspect of the federal act, in March 2008, the Department of Justice (DOJ) and the Department of 33
49 Housing and Urban Development (HUD) released a joint statement to technically define the rights and obligation of persons with disabilities and housing providers. In addition to prohibiting certain discriminatory acts, the Act places no limit on the amount of recovery and imposes substantial fines. The fine for the first offense can be up to $11,000; the second offense within a five year period, up to $27,500; and for a third violation within seven years up to $55,000. The prohibition in the Fair Housing Act against advertising that indicates any preference, limitation or discrimination" has been interpreted to apply not just to the wording in an advertisement but to the images and human models shown. Ad campaigns may not limit images to include only or mostly models of a particular race, gender, or family type. As a test to determine if advertising for the local housing market may be an impediment to fair housing, a review of local advertisements in real estate publications from May and June 2011 was conducted. These types of advertisements cover an area larger than just Valdosta, and the time-period is insufficient to conclusively establish a pattern of discrimination. The data does however provide an accurate snapshot of the advertising available, and a general overview of the state of compliance with fair housing law. The advertising, especially those with images of prospective or current residents was reviewed, with a sensitivity toward: Advertising with all or predominately models of a single race, gender, or ethnic group; Families or children in ad campaigns depicting images of prospective residents; Particular racial groups in service roles (maid, doorman, servant, etc.); Particular racial groups in the background or obscured locations; Any symbol or photo with strong racial, religious, or ethnic associations; Advertising campaigns depicting predominately one racial group; 34
50 Campaigns run over a period of time, including a number of different ads, none or few of which include models of other races; Ads failing to contain Equal Housing Opportunity (EHO) statements or logos, or contains the statement or logo, but it is not readily visible; and Ad campaigns involving group shots or drawings depicting many people, all or almost all of whom are from one racial group. Five publications advertising the sale or rental of housing directed toward persons in the greater Valdosta area were reviewed including Apartment Finder, Winter 2011 Edition; The Real Estate Book, Volume 14, # 6; The Valdosta Daily Times Homefront, June 12, 2011; Retirement Living South Georgia Style and Homes & Land of Valdosta and Surrounding Cities, Volume 2 Issue 1. Some publications made blanket statements at the front of the publication stating that the magazines as well as their advertisers are subject to the Federal Fair Housing Act. Some advertiser included EHO statements and/or logos. Including these logos can be a means of educating the home seeking public that the property is available to all persons. A failure to display symbols or slogans may become evidence of discrimination if a complaint is filed. Comparatively, other publications reviewed were advisements of for-sale properties listed by realtors and builders. Less than 25 percent of the advertisers in these publications included the EHO statement or logo. Additionally, most of the images included in the selected materials either represented racial, ethnic or gender diversity among the models selected. Fair Housing Assistance Program (FHAP) Agencies The U. S. Department of Housing and Urban Development (HUD) provides funding to state and local governmental agencies to enforce local fair housing laws that are substantially equivalent to the Fair Housing Act. Once a state and a city or county in that state have a substantially equivalent fair housing law, they can apply to become certified as a Fair Housing Assistance Program (FHAP) Agency and receive funds for investigating and conciliating fair housing complaints or a Fair Housing Initiatives 35
51 Program (FHIP) Agency and receive funds for education, promoting fair housing, and investigating allegations. It should be noted that a county or city must be located in a state with a fair housing law that has been determined by HUD to be substantially equivalent. Then, the local jurisdiction must also adopt a law that HUD concludes is substantially equivalent in order to participate in the FHAP Program. The local law must contain the seven protected classes - race, color, national origin, sex, religion, handicap, and familial status - and must have substantially equivalent violations, remedies, investigative processes, and enforcement powers. In addition, the process for investigating and conciliating complaints must mirror HUD s. HUD s process begins when an aggrieved person files a complaint within one year of the date of the alleged discriminatory housing or lending practice. The complaint must be submitted to HUD in writing. However, this process can be initiated by a phone call. HUD will complete a complaint form, also known as a 903, and mail it to the complainant to sign. The complaint must contain the name and address of the complainant and respondent, address and description of the housing involved, and a concise statement of the facts, including the date of the occurrence, and the complainant s affirmed signature. Upon filing, HUD is obligated to investigate, attempt conciliation, and resolve the case within 100 days. Resolution can be a dismissal, withdrawal, settlement or conciliation, or a determination as to cause. The FHAP certification process includes a two-year interim period when HUD closely monitors the intake and investigative process of the governmental entity applying for substantial equivalency certification. Also, the local law must provide enforcement for aggrieved citizens where cause is found. It can be through an administrative hearing process or filing suit on behalf of the aggrieved complainant in court. The FHIP certification process is contingent on the type of funding for which the agency is applying. There are four programs to which an agency can apply; Fair Housing Organizations Initiative (FHOI), Private Enforcement Initiative (PEI), Education 36
52 Outreach Initiative (EOI), and Administrative Enforcement Initiative (AEI). Currently, there is no funding under the AEI status. The State of Georgia enacted the Georgia Fair Housing Act in 1988, and amended it most recently in The law is presently called the Georgia Fair Housing Law. This Act declares it illegal to discriminate in the sale, rental, advertising, financing, or providing of brokerage services for housing. The Georgia Statue parallels the Federal Fair Housing Act, and appears to contain all of the requisite provisions to pass HUD s scrutiny as a substantially equivalent law. The State has a designated the Georgia Civil Rights Department - Georgia Commission on Equal Opportunity, a FHAP agency, to receive complaints and provides enforcement throughout the State of Georgia. The City of Valdosta has enacted Fair Housing Ordinance No , which is a part of the city s code ordinance. It also appears to be substantially equivalent to the Federal Act. Section1: Purpose, declares a safeguard of all individuals within the City of Valdosta from discriminations in housing opportunities, and provides protection to persons based on age, and sexual orientation in addition to race, disability, familial status, color, religion, national origin, or sex as afforded under the Federal Act. Section 4: Discrimination in the Sale or Rental of Housing extends protection for the federally protected classes. Enforcement is afforded only by the federal and state of Georgia governmental enforcement agencies. Court Decisions Walker v. HUD represents a landmark case, settled by consent decree, and establishing precedent as to HUD, PHA and City responsibilities and culpability for insuring the elimination of segregation in public and assisted housing. - The Walker public housing/section 8 desegregation litigation began in 1985 when one plaintiff, Debra Walker, sued one Dallas, Texas area suburb, Mesquite. The lawsuit contended that Mesquite s refusal to give its consent for DHA to administer Section 8 certificates 37
53 within Mesquite violated the 14th Amendment and the other civil rights law prohibiting racial discrimination in housing. The early stage of Walker resulted in the entry of the 1987 consent decree involving DHA and HUD without any liability findings. The suit was subsequently amended to bring in DHA, HUD, and the City of Dallas and to provide for a class of Black public housing and Section 8 participants who contended that the Dallas Housing Authority segregated person in public housing by race leading to racial concentrations of African Americans in minority concentrated areas. The suburbs, with the exception of Garland, gave their consent to the operation of DHA s Section 8 program within their jurisdiction and were dismissed from the case. The City of Dallas was subsequently found liable for its role in the segregation of DHA s programs in the Court s 1989 decision, Walker III, 734 F. Supp (N.D. Tex. 1989). HUD and DHA were subsequently found liable for knowingly and willingly perpetuating and maintaining racial segregation in DHA s low income housing programs. HUD was found liable not just for its failure to affirmatively further fair housing under the Fair Housing Act but also for purposeful violations of the Fifth Amendment to the U.S. Constitution, Title VI of the 1964 Civil Rights Act, 42 U.S.C. 1981, 1982, and The district court found that the defendants had the remedial obligation to not only cease any present discrimination but to also eliminate the lingering effects of past segregation to the extent practical. Court orders entered in this case have provided the following desegregation resources: (a) approximately 9,900 new assisted units have been made available to Walker class members. (b) approximately $22 million was made available for the creation of housing opportunities in predominantly white areas of the Dallas metroplex. (c) $2 million was provided for the operation of a fair housing organization that focused on the problems of low income minority families. 38
54 (d) Hope VI funding for 950 units in the West Dallas project. (e) $94 million was provided by the City of Dallas for neighborhood equalization and economic development in the public housing project neighborhoods. (f) $10 million was provided for mobility counseling to be used in connection with the Settlement Voucher program. Similar to the Walker case, Young v. HUD represents a landmark case, settled by consent decree, and establishing precedent as to HUD, PHA and City responsibilities and culpability for insuring the elimination of segregation in public and assisted housing. The Young case involved 70 plus housing authorities in 36 counties in East Texas, HUD, and the State of Texas. The litigation did not end until The remedy involved the equalization of conditions including the provision of air conditioning in the segregated black projects, desegregation of the tenant population in previously segregated black and white projects, use of the public housing and Section 8 programs and funding for a private fair housing organization to provide over 5,000 desegregated housing opportunities in predominantly white areas, equalization of neighborhood conditions around the predominantly black projects, injunctions against local cities blocking the development of public housing in white neighborhoods, sale of the Vidor public housing and the use of the proceeds for housing opportunities in white areas that were accessible by black public housing tenants, and $13 million in State funding for neighborhood equalization. Most of the relief was obtained only after the record of HUD s violations of previous remedial orders was compiled and presented to the Court. Some of the orders, agreements, and reports from this case that are attached are: A. The final judgment that was entered by the Court in 1995, B. The order modifying final judgment entered in This order includes a HUD manual on creating desegregated housing opportunities as exhibit 3 to the order, 39
55 C. The agreement between the plaintiffs and the State of Texas for the last $4.4 million of the total $13 million that the State contributed to the neighborhood equalization activities required by the Final Judgment. At the inception of the Fair Housing Act, insurance companies took the position that they were not covered by the Act. However, in 1992 a Wisconsin Appeals Court determined that the Act applies to discriminatory denials of insurance and discriminatory pricing that effectively preclude ownership of housing because of the race of an applicant. The case was a class action lawsuit brought by eight African- American property owners, the NAACP, and the American Civil Liberties Union against the American Family Insurance Company. The plaintiffs claimed they were either denied insurance, underinsured, or their claims were more closely scrutinized than Whites. American Family s contention was that the Act was never intended to prohibit insurance redlining. The appeals Court stated, Lenders require their borrowers to secure property insurance. No insurance, no loan; no loan, no house; lack of insurance thus makes housing unavailable. A 1998 court verdict against Nationwide Insurance further reinforced previous court action with a $100 million judgment due to illegally discriminating against black homeowners and predominantly black neighborhoods. Another case was settled for $250,000 in Maryland when Baltimore Neighbors, Inc., a non-profit organization, alleged that real estate agents were steering. Fine Homes real estate agents were accused of steering prospective African-American buyers away from predominantly White neighborhoods and Whites were almost never shown homes in predominantly African-American zip codes. In 2009 a landmark housing discrimination case was settled between the Connecticut Fair Housing Center and the New Horizons Village Apartments. In this case, the State of Connecticut Office of Protection and Advocacy for Person with Disabilities sued New Horizons Village, an apartment complex which provides independent housing for people 40
56 with severe physical disabilities. Under the consent decree, New Horizons will no longer be allowed to require tenants to open their private medical records for review and require them to prove they can live independently. CT Fair Housing Center stated The Fair Housing Act is clear that it is impermissible to limit the housing choices of people with disabilities based on stereotypes about their ability to care for themselves; people with disabilities are entitled to the same freedom to choose how and where they want to live as people without disabilities. In County of Edmonds v. Oxford House, the United States Supreme Court ruled that the Fair Housing Amendments Act of 1988 prevents communities from excluding group homes for the handicapped from single-family residential zones. The Oxford House is a nonprofit umbrella organization with hundreds of privately operated group homes throughout the country that house recovering alcoholics and drug addicts. Recovering alcoholics and drug addicts, in the absence of current drug use or alcohol consumption, are included under the protected class of handicapped in the Fair Housing Act as amended in In Oxford House v. Township of Cherry Hill, 799 F. Supp. 450 (D. N.J. 1991), the federal court rejected a state court ruling that recovering alcoholic and drug addicted residents in a group home do not constitute a single-family under the Township s zoning ordinance. In Oxford House-Evergreen v. County of Plainfield, 769 F. Supp (D. N.J. 1991) the court ruled that the county s conduct, first announcing that the Oxford House was a permitted use only to deny it as a permitted use after neighborhood opposition, was intentionally discriminatory. Unjustified institutionalization of persons with mental disabilities...qualifies as discrimination."- was stated as the majority opinion of the U.S. Supreme Court. In a landmark decision by a 6-3 vote, the U.S. Supreme Court ruled in June 1999, that a state may not discriminate against psychiatric patients by keeping them in hospitals instead of community homes. The court said that the Americans with Disabilities Act (ADA) may require that states provide treatment in community-based programs rather than in a segregated setting. This case, know as the Olmstead case, ruled that 41
57 community placement is a must when deemed appropriate by state professionals, agreed to by the individual with the disability, and resources available are sufficient. The courts agreed with the most integrated setting provision of the ADA. In a historic federal settlement order to resolve a lawsuit brought by the Anti- Discrimination Center (ADC) against Westchester County, NY. Westchester County conducted its own Analysis of Impediment to Fair Housing and did not examine race and its effects on housing choice. Only income was studied from a demographic perspective. Westchester did not believe that racial segregation and discrimination were the most challenging impediments in the County. ADC filed lawsuit against Westchester stating that the entitlement is not taking appropriate steps to identify and overcome impediments of fair housing. The Court stated that grant recipients must consider impediments erected by race discrimination, and if such impediments exist, it must take appropriate action to overcome the effects of the impediments. The settlement order issued in August 2009 found that Westchester had utterly failed to meet its affirmatively furthering fair housing obligations throughout a six-year period. All entitlements receiving federal funds must certify that they have and will affirmatively further fair housing. Because of the tie to federal funds, a false certification can be seen as fraudulent intent. Westchester was ordered to submit an implementation plan of how it planned to achieve the order s desegregation goals. One major outcome from the landmark agreement is the construction of 750 units of affordable housing in neighborhoods with small minority populations. In 2003, a settlement was ordered by the District Court in New Jersey for the owner of the internet website, who was found guilty of publishing discriminatory rental advertisements which is prohibited by the Fair Housing Act. It was the first of its kind to be brought by the Justice Department. It was thought to be imperative that the federal laws that prohibit discriminatory advertising should be enforced with the same vigor with regard to internet advertising as it would for print and broadcast media. The court ordered the site to establish a $10,000 victim fund to compensate individuals 42
58 injured by the discrimination. They were also ordered to pay a civil penalty of $5,000, adopt a non-discrimination policy to be published on the website, and require all employees to undergo training on the new practices. Under the Fair Housing Act, apartment complexes and condominiums with four or more units and no elevator, built for first occupancy after March 13, 1991, must include accessible common and public use areas in all ground-floor units. An apartment complex near Rochester, New York was ordered to pay $300,000 to persons with disabilities for not making its housing facility fully accessible, with $75,000 set aside for the plaintiffs. They were required to publish a public notice of the settlement fund for possible victims and pay a $3,000 civil penalty. In 2005, the Connecticut Commission on Human Rights and Opportunities (CHRO) issued a charge of discrimination on the basis of disability when an apartment manager refused to rent to a person with a disability on the first floor of the complex due to the absence of access ramp. The apartment manager was unwilling to make a modification to add a ramp. The court recognized that the renter has a disability and the defendant knew the fact and refused to make accommodations. The court concluded that the renter was entitled to compensatory and emotional distress damages of $10,000 and imposed a civil penalty of $1,000. In 2007, the 9th Circuit Court of Appeals gave a decision in support of Fair Housing Council of San Fernando Valley that Roommates.com has violated the fair housing laws by matching roommates by gender, sexual orientation, and parenthood. By asking prospective roommates to put in their status on these criteria and allowing prospective roommates to judge them on that basis is a violation of Fair Housing Act. In 2005, the National Association for the Advancement of Colored People (NAACP), The National Association of Home Builders (NAHB), and the Home Builders Association (HBA) of Greater Austin, filed a federal lawsuit against the County of Kyle, 43
59 Texas. The plaintiffs contended that ordinances passed by the Kyle County Council, imposing requirements such as all-masonry construction, expanded home size, and expanded garage size, drive up the cost of starter homes by over $38,000 per new unit. The allegation is that this increase has a disproportionate impact on minorities and this effect violates the Fair Housing Act. The County of Kyle filed a motion to dismiss, asserting that both NAACP and NAHB lack standing. The federal district court recognized the plaintiff s standing in Thereafter, the cities of Manor, Round Rock, Pflugerville, and Jonestown, all moved to join the litigation on the grounds that they each have ordinances similar to the one being challenged in Kyle and that any positive decision in this case would allow NAHB and NAACP to sue them at some later date. In May the court decided that the cities could participate as friends of the court but may not join in the litigation otherwise. This case is in progress and a judgment is expected in Homelessness and the Fair Housing Act Homelessness is defined as lacking a fixed, regular, and adequate night-time residence; or where the primary night-time residence is: o o o A supervised publicly or privately operated shelter designed to provide temporary living accommodations; An institution that provides temporary residence for individuals intended to be institutionalized; or, A public or private place not designed for, or ordinarily used as, a regular sleeping accommodation for human beings. The Fair Housing Act s definition of dwelling does not include overnight or temporary residence, so mistreatment of the homeless is not generally covered by Fair Housing Law. The ability of persons to find affordable housing is a protected right of Fair Housing; therefore the inability of people to find affordable housing which may lead to homelessness, is in conflict with the Fair Housing Law. 44
60 Unfair Lending Practices Unfair lending practices are more difficult to detect and to prove. However, there are laws, other than the fair housing law, to assist communities in aggressively scrutinizing fair lending activity. One such law is the Home Mortgage Disclosure Act (HMDA), which requires banks to publish a record of their lending activities annually. Frequently, fair housing enforcement agencies and nonprofits use this data to help substantiate a discrimination claim or to determine a bank's racial diversification in lending. Another law frequently utilized by community organizations is the Community Reinvestment Act (CRA). When a bank wants to merge with or buy another bank or establish a new branch, the community has an opportunity to comment. Usually, the CRA commitments made by the bank are analyzed, utilizing other data such as HMDA, to determine adherence. The community can challenge the action if the bank has a poor record. Sometimes agreements can be reached with the bank promising a certain level of commitment to the community. Additionally, the Equal Credit Opportunity Act (ECOA) prohibits discrimination in lending generally and can be quite significant when it comes to securing information about unfair lending practices and imposing remedies, which may include up to one percent of the gross assets of the lending institution. The U.S. Supreme Court ruled in June 2009 that states may investigate national banks to determine if they have discriminated against minorities seeking home loans. Furthermore states may charge accused violators if found guilty. The new legislation stemmed from a discrimination investigation of national banks by the New York attorney general. The federal Office of the Comptroller of the Currency (OCC) sought legal action through the courts to stop the attorney general s investigation because legal principals suggested that only federal regulators can require national banks to conform to regulations and practices that discourages unfair lending. The Supreme Court overturned this ruling giving state government power to enforce consumer-protection and lending policies. 45
61 2.2. Enforcement It has long been settled that fair housing testing is legal and that non-profits have standing to sue so long as certain criteria are met. These decisions make it feasible for non-profits to engage in fair housing enforcement activities. The Department of Housing and Urban Development (HUD) enforce local, state and federal fair housing laws which prohibit discrimination in the buying, selling, rental or enjoyment of housing because of race, color, national origin, religion, sex, disability or familial status. The HUD Regional Office in Atlanta, Georgia conducts investigations of fair housing complaints that are reported to them by the state and local jurisdictions. Georgia is part of HUD s Region IV that includes Alabama, Florida, Kentucky, Mississippi, North Carolina, South Carolina, Tennessee, Puerto Rico, and the U.S. Virgin Islands. When a complaint is filed with any of the jurisdictions, HUD is notified of the complaint. HUD will notify the violator of the complaint and permit all parties involved an opportunity to submit an answer. HUD will conduct investigations of the complaint to determine whether there is reasonable cause to believe the Federal Fair Housing Act and or Valdosta City Ordinance has been violated. The complainant is then notified. A detailed discussion of the complaints filed with HUD follows in Section 2.5. A case is typically heard in an Administrative Hearing unless one party wants the case to be heard in Federal District Court. Education and Outreach The City of Valdosta Public Involvement Department receives fair housing complaints and makes referrals to HUD for enforcement. This agency is also responsible for conducting public education, training and outreach of fair housing rights and remedies in Valdosta. Education of the public regarding the rights and responsibilities afforded by fair housing law is an essential ingredient of fair housing enforcement. This includes the education to landlords and tenants, housing and financial providers, as well as 46
62 citizens, about potential victims of discrimination. It is important that potential victims and violators of housing and/or lending discrimination law be aware of fair housing issues generally, know what may constitute a violation, and what they can do in the event they believe they have been discriminated against. Likewise, it is important for lenders, housing providers, and their agents to know their responsibilities and when they may be violating fair housing law. Often, people may be unaware of their fair housing rights. Present day housing discrimination tends to be subtle. Instead of saying that no children are allowed, they may impose unreasonable occupancy standards that have the effect of excluding families with children. Rather than saying, We do not rent to Hispanics, they may say, Sorry we do not have any vacancies right now, try again in a few months, when, in fact, they do have one or more vacancies. Printed advertisements do not have to state, no families with children or minorities allowed to be discriminatory. A series of ads run over an extended period of time that always or consistently exclude children or minorities may very well be discriminatory. In addition, a person who believes he/she may have been discriminated against will probably do nothing if he/she does not realize that a simple telephone call can initiate intervention and a resolution on his/her behalf, without the expenditure of funds or excessive time. Thus, knowledge of available resources and assistance is a critical component Production and Availability of Affordable Units An assessment of the key characteristics affecting housing production, availability, and affordability in Valdosta was conducted, including the adequacy and effectiveness of the housing and housing related programs designed and implemented by the city. The assessment evaluated the programs ability to reach the target market and how effective they are in identifying and serving those who have the greatest need. We also assessed the extent to which the jurisdictions prioritized funding and utilized programs to address impediments identified in their Fair Housing Impediment Analysis (AI) conducted prior to FY Much of the information is taken from the Consolidated 47
63 Plan, Annual Action Plan, and Consolidated Annual Performance Evaluation Report (CAPER), and other documentation provided by the cities and county. The 2011 Annual Action Plan indicated that the City of Valdosta anticipated receiving approximately $564,554 in Community Development Block Grant (CDBG) funding in FY Based on Valdosta City s planned utilization of these funds for housing and housing related programs, they should enhance their ability to address impediments relative to housing advocacy, availability, affordability, rehabilitation, homeownership, and financial literacy, as identified in the AI prior to FY Highlights of their proposed expenditure for FY 2011 include: $10,000 for home buyer education $447,554 for owner occupied rehabilitation $22,680 for completion of the 2011 Fair Housing Impediment Analysis Update Host an Annual Housing Summit geared toward providing continuing education and increased advocacy among area organizations relative to fair and affordable housing. Expansion of City Section 3 Initiatives Regulatory and Public Policy Review The City of Valdosta enacted Ordinance Number as a chapter in the municipal codes, covering Fair Housing and Discriminatory Housing Practices within its constitutional limits. The regulation specially covers discrimination and it details the rights, enforcement and remedies as it relates to fair housing. This fair housing ordinance would be considered substantially equivalent because it includes the federally protected classes in the Federal Act. Having a fair ordinance, especially one that is substantially equivalent to the federal Fair Housing Act, exemplifies a jurisdiction s local commitment to enforcing fair housing regulations and it provides public awareness of individuals rights under the Fair Housing Act. 48
64 The city zoning ordinance, development code and public policies were examined to reveal any current ordinances or policies that impede fair housing. Valdosta s land development codes and zoning regulations addresses affordable housing and the provision of making allowances through the code to incentivize the construction of affordable housing; and assist with development barriers that affect the feasibility of producing affordable housing within the jurisdictions Analysis of Fair Housing Complaints Fair housing complaint information was received from the Atlanta, Georgia FHEO Regional Office of the U.S. Department of Housing and Urban Development. The data received from HUD provides a breakdown of complaints filed for Valdosta from January 1, 2008 through April 30, During this period, no complaints were filed according to one of the seven bases under the Federal Fair Housing Act: National Origin, Color, Religion, Familial Status, Handicap, Sex, and Race. The most recent cases according to HUD were filed in 1992 and Therefore, Table 2.1, on the page below, shows zero cases having been filed for the five year period covered under this analysis. Table 2.1: Number of Complaints by Protected Class by Year ( ) Protected Class Race/ Color National Origin Familial Status Disability Sex Religion Totals Totals 0 Source: HUD Atlanta Regional Office, FHEO 49
65 Table 2.2, on the page below, also reflects no case closures for types by year the case was opened since no cases were filed during the investigation period for this AI. Table 2.2: Number of Complaints by Protected Class by Year ( ) Type of Closure Totals Case Conciliated No Probable Cause Withdrawn Lack of Jurisdiction Complainant failed to cooperate Unable to Locate the complainant FHAP judicial dismissal FHAP judicial consent order Totals 0 Source: HUD Atlanta, Georgia Regional Office, FHEO 2.6. Conclusions and Implications for Fair Housing Barriers and Impediments The State of Georgia and the City of Valdosta have enacted fair housing laws that are substantially equivalent to the federal Fair Housing Act. Both the State and the Valdosta City ordinances disallow the same activities prohibited under the federal act. Having a fair ordinance, especially one equivalent to the federal Fair Housing Act, shows a jurisdiction s commitment to enforcing fair housing regulations. Between 2008 and 2011, there were no complaints received and investigated through the HUD FHEO Regional Office in Atlanta, Georgia. The most recent cases according to HUD were filed in 1992 and The City of Valdosta Public Involvement Department provides referral of fair housing complaints to HUD for investigation and enforcement and is responsible for conducting public education, training and outreach of fair housing rights and remedies in Valdosta. Five publications advertising the sale or rental of housing and one advertising home improvements and remodeling, directed toward persons in the greater Valdosta area 50
66 were reviewed. Some publications made blanket statements at the front of the publication stating that the magazines as well as their advertisers are subject to the Federal Fair Housing Act. Some advertiser included EHO statements and/or logos. Including these logos can be a means of educating the home seeking public that the property is available to all persons. The 2011 Annual Action Plan indicated that the City of Valdosta anticipated receiving approximately $564,554 in Community Development Block Grant (CDBG) funding in FY Based on Valdosta City s planned utilization of these funds for housing and housing related programs, they should enhance their ability to address impediments relative to housing advocacy, availability, affordability, rehabilitation, homeownership, and financial literacy, as identified in the AI prior to FY Highlights of their proposed expenditure for FY 2011 include: $10,000 for home buyer education $447,554 for owner occupied rehabilitation $22,680 for completion of the 2011 Fair Housing Impediment Analysis Update Host a Housing Summit geared toward providing continuing education and increased advocacy among area organizations relative to fair and affordable housing. Expansion of City Section 3 Initiatives. The city zoning ordinance and public policies were examined to reveal any current ordinances or policies that impede fair housing. No concerns were noted as a result. 51
67 Section 3: Focus Group Sessions and Community Engagement Introduction This section will report on the results from three focus group sessions held on June 14, 2011 at the Valdosta City Hall, 216 East Central Avenue, Valdosta, Georgia, Participants in the focus groups sessions and supplemental interviews included City Staff, City Council Members, Valdosta Housing Authorities personnel and other government representatives; representatives from local colleges, universities, and school districts; non-profit organizations, home builders, housing and social service agencies representatives; real estate and financial industry representatives; and the general public and other community representatives. Attendees were gathered by invitations sent to select resident and community leaders, organizations, industry professionals and public officials. At each focus group session, general issues related to the housing market, neighborhoods and concerns pertaining to fair housing choice in Valdosta were discussed. Supplemental interviews were conducted with various community and industry representatives to obtain information from those unable to attend the sessions on June 14, The sessions were hosted by the City of Valdosta Public Involvement Department. It should be noted that the comments summarized in this section represent the comments and views of the focus group participants. J-Quad has made every effort to document all comments as a matter of record, and to ensure that the comments, as presented on the following pages, have not been altered to reflect our analysis, investigation or substantiation of information obtained during these sessions. Focus Group comments and information obtained during interviews were later analyzed and to the extent substantiated or collaborated by the data 52
68 and analysis, included in Section Six: Impediments and Remedial Actions. Comments from Focus Group participants included the following Focus Group Concerns and Comments Social-Economic Conditions Among the social-economic issues frequently mentioned in the focus group sessions was the perception that the supply of affordable housing is inadequate and the cost to purchase homes or to rent housing continues to soar beyond the range affordable to many local area residents. Others believed that poverty and the number of persons lacking sufficient income for housing was on the rise, severely impacting housing choice for the lowest income households. Participants indicated that poverty is not only a concern with regard to social equity and the plight of renters, but poverty and limited incomes are also having an adverse impact on the condition and quality of single family owner occupied housing in some areas. In areas where a majority of homeowners cannot afford routine maintenance and rising utility costs, poor housing conditions may quickly become the prevalent state of affairs. The impact of a lack of job opportunities and insufficient incomes to afford decent housing were cited as contributing factors to housing and neighborhood decline. Focus group participants wanted to have a greater emphasis placed on financial assistance to acquire housing suitable to meet the needs of the changing demographics in the city and specific problems faced by residents and the working poor relative to foreclosure. Participants also felt that increased housing counseling-both pre-purchase and post purchase support-was needed to help applicants qualify for financing and to remain current with mortgage payments and home maintenance needs. Increased funding should be identified to provide 53
69 rental assistance to those needing assistance with rent and utilities and security deposits necessary to initiate a lease. Participants emphasized the need for increased funding for project based rental assistance due to limitations in the Section 8 Vouchers program and increased demand for rental assistance, and development funding for new scattered site public and assisted housing units. Housing Supply, Neighborhood Conditions, and Infrastructure and Regulatory Controls Participants desired greater emphasis be placed on building codes and regulatory controls being utilized to improve housing conditions, cost and accessibility. They recommended incorporating energy efficiency and green building standards in construction of affordable housing; the need for infrastructure and emergency repair funding; and assurance that zoning regulations protect against spot zoning and provide variances, when necessary, to induce vacant lot infill housing in developed neighborhoods. Acquisition and utilization of vacant lots, homebuyer subsidies for repairs, drainage, sidewalks, and increased emphasis on code enforcement were also cited as needs. Public Policy and Public Awareness of Fair Housing Participants cited public awareness of fair housing rights as a concern. They felt that despite increased outreach by the City, some residents appear to be unaware of their rights under fair housing law and that the number of violations reported and cases substantiated may be much lower than the number of violations actually occurring. Others felt that residents often fear retaliation by those who violate the laws. For example, attendees and persons interviewed felt that in some instances, people do not register fair housing complaints for fear of retaliation by their landlords, or if they report violations such as housing code, enforcement will result in higher rents or evictions actions by their landlords. Participants also felt that residents needed increased access to homebuyer education and counseling when considering purchase of a home and rental 54
70 housing and tenant s rights counseling and advocacy for renters. They were concerned that first-time home buyers often do not know where to go for help or how to start the process of purchasing a home. Anecdotal accounts by attendees and those interviewed included obstacles faced by renters such as denial of rental applications based on having no prior address, and/or frequent gaps in their rental histories. Others cited housing barriers faced by the untouchables, persons such as ex-offenders, convicted sex offenders and others recently discharged from the criminal justice system. Access to Banking and Financial Institutions Products, and Basic Goods and Services Predatory lending practices were identified as a major issue. Perception were that predatory lenders are absorbing much of the market formerly controlled by FDIC insured banks and other reputable financial institutions and fast becoming lenders of choice in some low income and minority concentrated areas. In other instances, persons facing economic hardships are being preyed upon due to their inability to qualify for traditional lending and banking services. For example, predatory businesses provide individuals with loans backed by the title to their car or house at relatively high interest rates. Lenders are quick to foreclose in the event the borrower misses a payment. Attendees were concerned that a growing number of people have fallen prey to sub prime loans because they have a poor credit rating or limited to no credit history. Others expressed concerns that lower income residents are paying higher prices due to a lack access to basic goods and services. For example, healthy food choices were often limited resulting in resident in low income and minority concentrated neighborhoods having diets lacking in fresh vegetables and fruits and other commodities being priced outside their affordability. Neighborhood markets and grocery stores in the neighborhoods are sometime limited to convenience stores charging exorbitant prices, taking advantage of persons with limited mobility or access to public transportation. 55
71 Lending, Foreclosures and the Mortgage Industry The inability to obtain home mortgages was seen as a major barrier that limits housing choice. Criminal background histories and immigration status are relatively new factors contributing to the inability to qualify for home purchases and rental housing leases. Credit issues appeared to be the major barrier, based on focus group participants comments. Both a lack of qualified applicants and an adequate pool of applicants for mortgages, coupled with the inability of some housing units to qualify based on lending program guidelines were cited as barriers. Participants felt that greater emphasis should be placed on credit counseling and financial literacy being accessible to a broader population including youth and young adults age eighteen to thirty. Greater emphasis should be given to preventing damage to one s credit history and providing a solid foundation that could prevent future financial problems. Persons with a criminal felony record and those convicted of sex crimes are having particular problems finding housing to rent as well as qualifying for mortgages. Other participants cited instances in which elderly and other owners of affordable housing are no longer able to afford routine maintenance on their home. Any major systems failure such as roof replacement, foundation problems or even heating and air conditioning replacement can render their home a health and safety risk or place the homeowner in violation of local property standards codes. Special Needs Housing Participants were concerned that greater funding be provided for the elderly to age in place, and to provide housing for others in need of special needs housing. Participants cited statistics relative to the growth expected in the elderly population over the next decade which will elevate this problem. Without such funding elderly and disabled persons are sometimes placed in nursing homes prematurely, even though they could otherwise continue to live on their own with some limited assistance or ADA accessibility modifications where they currently reside. Participants were also concerned that limited options exist for persons in 56
72 need of transitional housing whether they be recently paroled, victims of domestic violence, mentally ill, physically handicapped, homeless or at risk of becoming homeless. Others cited a need for more permanent supportive housing. Participants felt that more public resources should also be identified and dedicated to homeless programs, shelters and supportive services to the homeless and elderly. Participants were also concerned with limitations in available rental housing for the disabled and a lack of emphasis on building code standards that require new home construction to meet visitable housing standards. Some were concerned that information as to availability of ADA compliant housing is not readily available to those in need. As for visitable housing, participants indicated that web sites such as concrete concepts.com and data from cities with building codes that include visitable housing standards, indicates that meeting such standards will add as little as $300 dollars in additional cost if implemented during initial construction. These standards include insuring that at least one main entry into the dwelling and at least one bathroom, downstairs bedroom and hallway are handicapped accessible. Public Transportation and Mobility Participants cited limited mobility and public transportation as impediments to housing choice. These limitations also included a concern for elderly and disabled persons in need of public transportation to access supportive services. Public transportation was deemed inadequate, for persons commuting to major employment centers Other Issues and Solutions Attendees indicated a need to continue the City s emphasis on mitigating the impacts of increased incidents of discrimination or impediments to housing for persons with disabilities, renters with past criminal records or prior convictions for 57
73 sexual abuse related crimes, those in need of special needs housing or facing evictions, foreclosures and homelessness. Participants voiced support for continued emphasis on credit education and housing consumer counseling. Increased financial literacy courses taught in high schools was seen as solutions as well. Participants cited the need for additional funding for fair housing outreach, education and enforcement, fair housing training for landlords and homeowner associations and other at risk of violating fair housing law. 58
74 Section 4: Home Mortgage Disclosure Act (HMDA) Data Analysis Introduction The Federal Financial Institutions Examination Council (FFIEC) gathers data on home mortgage activity from the federal agencies that regulate the home mortgage industry. The data contain variables that facilitate analysis of mortgage lending activity, such as race, income, census tract, loan type, and loan purpose. The FFIEC provides the Home Mortgage Disclosure Act (HMDA) databases and retrieval software on compact disk. Data can be summarized within the software package or downloaded in its raw form for analysis. For this analysis, the FFIEC databases were utilized for 2004 through The data reported here are summarized by a variety of methods. Tables 4.1 and Tables 4.2 provide information for the City of Valdosta and Lowndes County. Table 4.4 provides information for Lowndes County. Tables 4.3, 4.5, and 4.6, and the charts present the data by census tract income groups. The maps, provided at the end of this section, present data according to census tracts for Lowndes County Analysis Table 4.1 examines home loan activities in Lowndes County and the City of Valdosta. The data are presented by loan type, ethnicity, income, and loan purpose. In Lowndes County, White applicants represented the largest number of loan applicants at 9,566. Origination rates, defined as the percentage of applications that result in loans being made, were over 73 percent for Whites. African-Americans were the next largest applicant group with over 4,525 applications submitted and an origination rate of over 51 percent. Hispanics submitted 579 applications and had an origination rate of about 53 percent. Asian 59
75 origination rates were about 62 percent, but there were only 317 applications reported. High-income applicants showed both the highest number of applications, at 7,680, and the highest origination rate, about 89 percent. Both the number of applications and the origination rates drop significantly for all other income groups, with 4,053 applications from middle-income applicants and an origination rate of over 52 percent. Conventional loans account for the largest number of applications for loan type, at 16,057, and an origination rate of about 54 percent. Home Purchase loans reflected a 62 percent origination rate with 6,016 applications. Refinance loans show the highest number of applications for loan purpose, at 10,625, and the origination rate of about 55 percent. Home improvement loans had an origination rate of about 46 percent with 1,950 loan applications. Isolating the census tracts within the City of Valdosta, for Loan Type, Conventional shows the highest number of loan applications, 6,595, and an origination rate of over 56 percent. The origination rate for FHA loans was about 70 percent. An evaluation of loan purpose reveals that home purchase loan applications were at 2,635 with an origination rate of over 62 percent. The origination rate for home improvement loans was over 47 percent and about 58 percent for refinance loans. In Valdosta, White applicants had the highest origination rate, approximately 73 percent, and the highest number of loan applications, at 10,167. The origination rate for African-Americans was about 41 percent for 3,584 applications. Hispanics had 239 applications and an origination rate of just over 50 percent. The origination rate for Asians was 60 percent with 131 applications. The origination rate for the very low-income group was over 17 percent compared to about 90 percent among high-income applicants. Table 4.2 displays the HMDA data for the same data categories (Loan Type, Ethnicity, Income, and Loan Purpose). On this table, however, percentages are taken within category, rather than demonstrating the percentage of applications that result in loan originations. For example, the first percentage in the % of 60
76 Originations column indicates that 82.7 percent of originations in the county were for conventional loans compared to 53.7 percent origination rate from Table 4.1. For comparison, ethnic percentages were included under the % Pop. column to compare the percentage of originations by ethnic group to their percentage in the population. Within the Loan Type category, Conventional shows the highest percentage, about 83 percent of all originations in Lowndes County. FHA loans, which are government insured, were about 14 percent of all originations. Referring back to Table 4.1, the origination rates were about 70 percent for FHA versus approximately 54 percent for conventional. For Ethnicity, White shows the highest percentage of originations at 67.2 percent of the total originations in the county. The percentage of Whites in the population was 58.1 percent. African-American applicants accounted for 22.3 percent of all originations, with 35.8 percent of the total population in the county. Hispanic applicants represented about 2.9 percent of originations with 4.8 percent of the total population in the county. The highest income group (>120% median) displays the highest percentage of originations, at about 65 percent of all originations. In contrast, the very lowincome group accounts for over two percent of all originations. The loan purpose data for the county shows that refinance loans were the most frequent purpose at over 55 percent. Home purchase loans accounted for over 35 percent of the originations. Home improvement loans accounted for about nine percent of all originations. In Valdosta, 83 percent of all originations were from conventional loans. FHA loans were over 13 percent of all originations. In the City of Valdosta, Whites had the highest percentage of origination, 58.2 percent of the total. The percentage 61
77 of Whites in the population was 43.3 percent. African-American applicants accounted for 30.1 percent of all originations, with 51.1 percent of the total population. Hispanic applicants accounted for 2.7 percent of originations, while their presence in the population was 4.0 percent of all residents. Asian applicants represented 1.8 percent of originations with the same percent of the total population. Native American applicants represented 0.1 percent of originations with 0.3 percent of the total population. The highest income group (>120% median) displays the highest percentage of originations, over 64 percent of all originations in the city. In contrast, the very low-income group accounts for less than three percent of all originations. The loan purpose data show that refinance loans were the most frequent purpose, about 54 percent of all originations in the city. Home purchase loans accounted for over 40 percent of the originations. Home improvement loans accounted for over nine percent of all originations in the city. Table 4.3 examines the HMDA data more closely with respect to the possibility of redlining within the county. Redlining relates to the avoidance of certain locations by mortgage lenders, where loan originations appear to be significantly influenced by undesirable characteristics of the area. Assuming that these negative characteristics can be epitomized by the lowest income census tracts (<51% median in the tables), a comparison of origination rates within these tracts to higher income tracts should shed some light on the probability of redlining. Origination rates for Lowndes County indicate that Very Low-Income applicants (<51% median) were successful 17 percent of the time, Low-Income applicants (51-80% median) and Moderate Income applicants (81-95% median) were successful about 24 percent of the time, Middle Income applicants (96-120% median) over 52 percent of the time, and High Income applicants (>120% median) 89 percent of the time. When isolating the Very Low Income census tracts, the origination rates change significantly among the middle and highincome tracts. Middle Income applicants were successful 28.3 percent of the time, almost 24 percentage points lower than their overall success in county. 62
78 Higher income applicants in very low-income tracts experienced much lower rates, as well. High Income applicants in very low-income tracts had a 35.2 percent origination rate, more than 53 percentage points lower than in the overall rate for the county. Comparing Very Low-Income tracts to High Income tracts, large differences are noted between origination and denial rates. Within High Income tracts, Very Low Income applicants were successful 32.5 percent of the time, nine percentage points higher than High Income applicants in the Very Low-Income tracts. High Income applicants were successful 64.4 percent of the time in High Income tracts, over 29 percentage points higher than in Very Low Income tracts. Origination rates for Middle Income applicants in High Income tracts were about 25 percentage points higher than in the Very Low Income tracts. While this analysis does not provide conclusive proof that redlining exists, the expectation for higher income applicants would be for relatively equal origination rates across all census tracts. The large differences in origination rates among all income groups in Very Low and High-Income tracts, suggest that some characteristics of redlining may be occurring, with origination rates heavily influenced by location and value assigned the property, as opposed the credit worthiness of the buyer. Table 4.4 compares origination rates between minorities and White applicants for the various loan purposes and income groups. For all loan purposes shown, White origination rates are much higher than minorities. For home purchase loans, origination rates were about 60 percent for Whites and over 34 percent for minorities, a difference of over 25 percentage points. White applicants for home improvement loans are successful almost 16 percentage points more often than minorities. The rates for refinance loans show a 14 percentage point difference. Looking at the income group comparison, minorities actually have relatively close origination rates to Whites in the two lowest income groups. With Moderate Income applicants (81-95% MFI), White origination rates start to show an 63
79 advantage. In the High Income group (>120% MFI), White origination rates are almost 17 percentage points higher. Within each income group, Whites and minorities are entering the loan markets with relatively equal incomes. Chart 4.1 provides a look at origination rates by census tract income for the loan types: conventional, FHA, and VA. Conventional loans have lower origination rates in all income groups than government insured loans. Chart 4.2 shows origination rates by ethnicity and income of the census tract. Whites show the highest origination rates of all races in all income groups of tracts except Very Low-Income tracts. Though the origination rates in Asian and Hispanic categories in Very Low- Income tracts show higher origination rates than Whites, they represent low number of applications. Chart 4.3 looks at origination rates by the income of the applicant and the income of the census tract of the property for which the loan would be applied. Ideally, origination rates should be similar among same income groups regardless of the income for the census tract where the subject property is located. The origination rates of all the income groups increase as the tract income increases. This indicates that families with similar income are more likely to originate a loan for property in a higher income census tract. Therefore, some characteristics of redlining may be present in lower income tracts in the community. The relatively small number of applications in the lower income tracts, however, makes any conclusive determination of redlining impossible. Chart 4.4 looks at origination rates by loan purpose and income of the census tract. Applications for all loan types have a higher success rate as the tract income increases, including home purchase loans, peaking at 70 percent for the High-Income tracts. Home Improvement loans have the lowest origination rates and Home Purchase loans show the highest origination rates in all income tracts. 64
80 Maps 4.1 through 4.6 provide loan activity by census tract. The ratio of denials to originations was calculated for each loan purpose and loan type. Tracts shown in the darkest red indicate those areas where 75 or more applications are denied for every 100 applications that are originated. The red areas show 50 to 75 applications denied for every 100 applications originated. The mauve areas show 25 to 50 applications denied for every 100 applications originated. The pink areas show 0 to 25 applications denied for every 100 applications originated. Map 4.4 and 4.6 have only pink and mauve categories representing 0 to 50 applications denied for every 100 applications originated. Map 4.2 shows the total number of loan originations by census tract. Less active areas are shown in the lighter colors, with the most active areas in dark red. Unlike the other maps, the light areas are meant to indicate areas of concern, either for a lack of loan activity or for their low rate of application originations in relation to denials. Maps 4.3 and 4.4 compare the ratio of loan denials to originations for Conventional loans and Government Backed loans. Maps 4.5 and 4.6 compare the ratio for home purchase loans and home improvement loans. The analysis of HMDA data on the reasons for denial showed that the majority related to the applicants credit history or their debt-to-income ratio. In Valdosta, over 1,685 (53.0%) denials were attributed to the applicants credit history in the ten years of the study. About 1,100 (34.5%) denials were due to the applicant s debt-to-income ratio in that same year and more than 400 (12.6%) were attributed to inadequate collateral. Those three categories accounted for just over 85 percent of the denials for the study period Conclusions In Lowndes County and the City of Valdosta, the highest success in loan origination was found in the home purchase loan sector and the least success was in the home improvement loan sector. 65
81 Overall, the origination rates among Whites were higher than minorities in home purchase, home Improvement and refinance loans. Refinance loans were the most frequent loan type in the county and the city. The loan applications and originations were significantly lower compared to their percentage in population for African-Americans, Asians, and Hispanics in the county and the city. This is likely attributable to two issues, the lack of applications from minorities and a higher percentage of loan denials to loan applications. The reasons for lower loan originations among minorities were inconclusive based on the overall data. However, during the period between 2004 and 2009, the majority of loan denials for all applicants were related to the applicants credit history, poor credit history, or higher debt-to-income ratio. Additionally, while the analysis offered does not provide conclusive evidence of redlining, the data tend to suggest some characteristics of redlining may exist. Ideally, origination rates should be similar among same income groups regardless of the income for the census tract where the subject property is located. However, the origination rates for all the income groups increases as the tract income increases and decreased as the tract income decreased. This indicates that families with similar income are more likely to originate a loan for property in a higher income census tract in the county and the city. While it is expected that very low-income applicants tend to have lower origination rates, within the very low-income census tracts, even high-income applicants showed a poor success rate. However, due to very low number of applications in the lower income census tracts, any conclusive determination of redlining is impossible for the county or the city. The disparate impact of lower numbers of loan applications, higher denial rates, and disparities in loan origination rates for minorities compared to Whites; coupled with the possibility that characteristics of redlining may be adversely impacting originations in lower income concentrated census tracts where minorities are most likely living, are indicative of impediments to fair housing. 66
82 Table 4.1 Home Mortgage Disclosure Act (HMDA) Analysis Comparison of Number of Loan Applications and Origination Rates Valdosta and Lowndes County Valdosta Lowndes County Number Origin. Number Origin. of App.s Rate of App.s Rate Loan Type: Conventional 6, % 16, % FHA % 2, % VA & Other % % Ethnicity: Native % % Asian % % Black 2, % 4, % Hispanic % % White 3, % 9, % Other % % Not Provided % 2, % Unknown % 1, % Income: <51% median (very low) % 1, % 51-80% median (low) % 2, % 81-95% median (moderate) 1, % 2, % % median (middle) 1, % 4, % >120% median (high) 3, % 7, % Unknown % % Loan Purpose: Home Purchase 2, % 6, % Home Improvement % 1, % Refinance 4, % 10, % Multifamily % % Totals 7, % 18, % 67
83 Table 4.2 Home Mortgage Disclosure Act (HMDA) Analysis Comparison of Originations Within Categories Valdosta and Lowndes County Valdosta Lowndes County # of % of %Pop. # of % of %Pop. Originations Originations Originations Originations Loan Type: Conventional 3, % 8, % FHA % 1, % VA & Other % % Ethnicity: Native 5 0.1% 0.3% % 0.4% Asian % 1.8% % 1.6% Black 1, % 51.1% 2, % 35.8% Hispanic % 4.0% % 4.8% White 2, % 43.3% 7, % 58.1% Other % 3.5% % 4.1% Not Provided % % Unknown % % Income: <51% median % % 51-80% median % % 81-95% median % % % median % 2, % >120% median 2, % 6, % Unknown % % Loan Purpose: Home Purchase 1, % 3, % Home Improvement % % Refinance 2, % 5, % Multifamily 8 0.2% % Totals 4, % 10, % 68
84 Table 4.3 Analysis of Home Mortgage Disclosure Act Data, Lowndes County Analysis of Redlining in Very Low-Income Census Tracts # of Apps. % Orig. % Denied Very Low Income Tracts <51% median % 52.3% 51-80% median % 51.1% 81-95% median % 47.4% % median % 47.2% >120% median % 36.3% Unknown % 28.3% High Income Tracts <51% median % 43.6% 51-80% median % 34.9% 81-95% median 1, % 26.4% % median 1, % 21.1% >120% median 3, % 10.7% Unknown % 4.2% Difference Between High and Very Low Tracts (percentage point difference) <51% median % median % median % median >120% median Unknown Origination Rates for Lowndes County <51% median 16.9% 51-80% median 23.9% 81-95% median 24.3% % median 52.1% >120% median 88.6% Unknown 12.9% 69
85 Table 4.4 Analysis of Home Mortgage Disclosure Act Data HMDA Activity for Lowndes County, # Apps. % of Apps. % Denied % Orig. Home Purchase Loans Minorities 1, % 44.5% 34.3% White 3, % 29.4% 59.7% Not Provided % 17.5% 15.7% Home Improvement Loans Minorities 2, % 48.6% 36.7% White 6, % 23.1% 52.6% Not Provided 1, % 46.6% 20.2% Refinance Loans Minorities 1, % 28.4% 40.5% White 4, % 12.9% 54.8% Not Provided 1, % 31.7% 9.8% Income Groups <51% MFI Minorities % 49.0% 31.7% White 1, % 45.1% 36.9% Not Provided % 56.3% 9.5% 51 to 80% MFI Minorities % 40.6% 39.0% White 1, % 35.9% 43.3% Not Provided % 51.5% 14.1% 81 to 95% MFI Minorities % 38.2% 39.7% White 2, % 27.6% 50.7% Not Provided % 44.1% 17.0% 96 to 120% MFI Minorities % 32.7% 44.2% White 3, % 23.6% 54.7% Not Provided % 43.0% 19.8% >120% MFI Minorities 1, % 25.8% 50.1% White 6, % 11.8% 66.9% Not Provided % 32.7% 27.8% 70
86 Originatio Rate Origination Rate Chart 4.1 Chart 4.1: Origination Rates by Loan Types by Income of Census Tracts Origination Rates by Loan Type by Income of Census Tracts Conventional FHA VA Very Low Low Moderate Middle High Income Group of Tracts Chart 4.2: Origination Rates by Ethnicity by Income of Census Tracts 80.0% 70.0% Native 60.0% Asian 50.0% 40.0% 30.0% Black Hispanic White Other 20.0% Not Provided 10.0% Unknown 0.0% Very Low Low Moderate Middle High Income Group of Tracts 71
87 Origination Rate Origination Rate Origination Rates by Applicant Income by Income of Census Tract Chart 4.3: Origination Rates by Applicant Income by Income of Census Tracts Very Low Low Moderate Middle High Very Low Low Moderate Middle High Income Group of Tracts Origination Rates by Loan Purpose by Income of Census Tract Chart 4.4: Origination Rates by Loan Purpose by Income of Census Tracts Purchase Improvement Refinance Very Low Low Moderate Middle High Income Group of Tracts 72

88 Map 4.1: Ratio of All Loan Denials to Originations, Map 4.2: Total Number of Loan Applications,

89 Map 4.3: Ratio of Conventional Loan Denials to Originations, Map 4.4: Ratio of Government Backed Loan Denials to Originations,

90 Map 4.5: Ratio of Home Purchase Loan Denials to Originations, Map 4.6: Ratio of Home Improvement Loan Denials to Originations,
91 Section 5: Fair Housing Index Introduction The Fair Housing Index is a measure developed by JQUAD specifically for Analyses of Impediments to Fair Housing. The index combines the effects of several demographic variables from the U.S. Census and Home Mortgage Disclosure Act (HMDA) data, and maps the results for all census tracts in Lowndes County. Data for ten variables, shown in the Fair Housing Index table are standardized and added to classify the conditions in various census tracts into degree of problems that may cause impediments to fair housing choice. The map provides a general indication of geographic regions within Valdosta where residents may experience some level of housing discrimination or have problems finding affordable, appropriate housing. The discussion is highly technical and contains statistical techniques that may not be familiar or easily understood depending on the statistical experience of the readers. Therefore, the findings presented at the end of this section are intended to provide a summary of the significant factors identified in this analysis Methodology Data for ten variables were gathered, by census tract, for analysis. These ten variables were: percent minority, percent female-headed households with children, median housing value, median contract rent, percent of the housing stock constructed prior to 1960, median household income, percent of the population with less than a high school degree, percent of the workforce unemployed, percent using public transportation to go to and from work, and the ratio of loan denials to loan originations for 2004 through 2009 from the Home Mortgage Disclosure Act (HMDA) report published by the Federal Financial Institutions Examination Council. With the exception of the HMDA data, all data were found in the American Community Survey (ACS) 5-Year 76
92 estimates of Population and Housing. Each variable contained data for every census tract in the county as defined by the ACS estimates. When the database was complete, Pearson correlation coefficients (a statistical measure that indicates the degree to which one variable changes in relation to changes in another variable and range in value from 1 to 1) were calculated to assure that all variables displayed a high relationship to each other. It is important, in this type of analysis, that the variables selected are measuring similar aspects of the population. The results of the calculations showed that all variables displayed moderate to high degrees of correlation with other variables in the model, ranging up to Once the relationship of the variables was established, each variable was standardized. This involves calculating a Z-score for each record by variable. For instance, for the variable percent minority, a mean and standard deviation were calculated. The mean for the variable was subtracted from data for each census tract and divided by the standard deviation. The result was a value representing the distance that the data point lay from the mean of the variable, reported in number of standard deviations. This process allows all variables to be reported in the same units (standard deviations from the mean) and, thus, allows for mathematical manipulations using the variables. When all variables were standardized, the data for each census tract were summed with negative or positive values given to each variable to assure that effects were being combined. For instance, in a fair housing environment, high minority concentrations raise suspicions that there may be problems relative to housing conditions and housing choices in the area based on correlations between these variables found in the census data. Therefore, the percent minority variable would be given a negative value. Conversely, in areas of high housing values, the current residents are likely not having problems with fair housing choice. High housing value, therefore, would be assigned a positive 77
93 value. Each variable was considered in this light and assigned an appropriate sign, thus combining effects. This new variable, the total for each census tract, was then standardized as described for the original ten variables above. The standardized form of the total variable provides a means of identifying individual census tracts where fair housing choice is at high risk due to demographic factors most often associated with housing discrimination. With the data presented in standardized form, the results can be compared to the standard normal distribution, represented by a bell curve with a mean of 0 and a standard deviation of 1. The analysis shows High Risk areas as those census tracts with standard scores below Scores between and -1 are designated Moderate Risk areas. Scores between and 0 are reported as Low Risk and above 0 as Very Low Risk. The results are summarized in the following section. It should be emphasized that the data used to perform this analysis do not directly report fair housing violations. The data were utilized in order to measure potential problems based on concentrations of demographic groups who most often experience restrictions to fair housing choice. Areas identified as having extreme problems are those where there is a high concentration of minorities, female-headed households, unemployment, high school dropouts, low property values, and, most likely, are areas where a large proportion of loans (conventional home mortgages, FHA or VA home mortgages, refinance, or home improvement) have been denied. Included following the map is the correlation table (Table 5.1). MedValue is the median home value according to the ACS estimates. MedRent is the median contract rent. XMinority is the percent minority. XFemHH is the percent female-headed household. XPre60 is the percent of housing built prior to MedHHI is the median household income. XLessHS is the percent of the population 25 years of age and older that has less than a high school degree. 78
94 XUnemp is the unemployment rate for the population aged 16 and older considered being in the labor force. XPubTrans is the percent utilizing public transportation to get to and from work. AllRat is the ratio of denials to originations from the HMDA data from 2004 to Findings Looking first at the correlation table (Table 5.1), the ratio of home loan denials to originations had high negative correlation with median income ( ), and moderate to high positive correlations with the percentage of minority (0.6936) and the percentage of less than high school education (0.5881). These correlations indicate that lower income groups, minorities, and persons with no high school degree, have lower likelihood of receiving home loan originations. The percentage not graduating from high school has a strong negative correlation to median household income ( ) and median housing value ( ). This indicates that non-high school graduates earn lower incomes and live in lower valued housing. The median income has a high negative correlation with unemployment rate ( ). The median income has a moderate negative correlation with minorities ( ). These correlations indicate that minorities and unemployed persons tend to earn lower incomes, and lower income groups are more likely to live in lower valued housing. The correlation between percentage minority and percentage female-headed households with children is high and positive (0.6444); this correlation indicates that the minority community has a higher rate of female-headed households with children than the non-minority community. The median housing value has a moderate to high negative correlation with the percentage of female-headed households with children ( ) and minorities ( ), which indicates that female-headed households with children and minorities tend to live in lower valued housing. 79
95 As indicated on Map 5.1, the census tracts designated as having high risk of fair housing related problems are concentrated in the central census tracts of Valdosta. The census tracts having moderate risk of fair housing problems are located in northeastern areas of the city. These areas of greatest concern contain the oldest housing stock, most likely in poor condition, with lower housing values and rents, and are primarily occupied by minority households that have higher percentages of households headed by females with children than that of other census tracts or areas. There is a higher than average unemployment rate and lower than average level of educational attainment. 80

96 Map 5.1: Fair Housing Index 81
CITY OF MEDFORD OREGON
 CITY OF MEDFORD OREGON ANALYSIS OF IMPEDIMENTS TO FAIR HOUSING CHOICE Submitted: May 15, 2015 Contact: Parks and Recreation Department Grants Administrator 701 North Columbus Avenue Medford, Oregon 97504
Analysis of Impediments to Fair Housing Choice
 STATE OF ARKANSAS Analysis of Impediments to Fair Housing Choice Final Report November 6, 2014 Submitted by: J-QUAD Planning Group, LLC 14683 Midway Rd. Suite # 210 Addison, TX 75001 Office: (972) 458-0600
CITY OF CORPUS CHRISTI, TEXAS ANALYSIS OF IMPEDIMENTS TO FAIR HOUSING CHOICE
 CITY OF CORPUS CHRISTI, TEXAS ANALYSIS OF IMPEDIMENTS TO FAIR HOUSING CHOICE Prepared for: City of Corpus Christi, Texas City of Corpus Christi Community Development Division of Neighborhood Services Department
CITY OF THOMASVILLE NORTH CAROLINA ANALYSIS OF IMPEDIMENTS
 CITY OF THOMASVILLE NORTH CAROLINA ANALYSIS OF IMPEDIMENTS May, 2010 TECHNICAL ASSISTANCE PROVIDED BY BENCHMARK CMR INC. City of Thomasville Analysis of Impediments INTRODUCTION... 3 Historical Overview
Little Haiti Community Needs Assessment: Housing Market Analysis December 2015
 Little Haiti Community Needs Assessment: Housing Market Analysis December 2015 Prepared by: EXECUTIVE SUMMARY Background The Little Haiti Housing Needs Assessment provides a current market perspective
2011 ANALYSIS OF IMPEDIMENTS TO FAIR HOUSING CHOICE FOR THE CITY OF TULSA, OKLAHOMA
 2011 ANALYSIS OF IMPEDIMENTS TO FAIR HOUSING CHOICE FOR THE CITY OF TULSA, OKLAHOMA DRAFT REPORT FOR PUBLIC REVIEW MAY 18, 2011 2011 ANALYSIS OF IMPEDIMENTS TO FAIR HOUSING CHOICE FOR THE CITY OF TULSA,
Analysis of Impediments to Fair Housing Choice
 Final Report Analysis of Impediments to Fair Housing Choice Prepared for: Kane County, IL City of Elgin, IL City of Aurora, IL Prepared by: Economic & Planning Systems, Inc. 2012 EPS #20836 Table of Contents
SCOPE OF WORK DEVELOPMENT OF A SOCIO-ECONOMIC IMPACT ANALYSIS FOR THE PRELIMINARY REGIONAL HOUSING PLAN FOR THE SOUTHEASTERN WISCONSIN REGION
 RHP SEI SCOPE OF WORK (00203617-4).DOC KRY/NMA/BRM 5/24/12; 5/4/12 SCOPE OF WORK DEVELOPMENT OF A SOCIO-ECONOMIC IMPACT ANALYSIS FOR THE PRELIMINARY REGIONAL HOUSING PLAN FOR THE SOUTHEASTERN WISCONSIN
FAIR HOUSING: Serious Responsibility, Serious Liability
 FAIR HOUSING: Serious Responsibility, Serious Liability PRESENTED TO: American Planning Association Housing and Community Development Division PRESENTED BY: Heidi Aggeler, Managing Director 1999 Broadway
Section 5: Fair Housing Index
 Section 5: Fair Housing Index Introduction The Fair Housing Index is a measure developed specifically for Analyses of Impediments to Fair Housing. The index combines the effects of several demographic
City of Lonsdale Section Table of Contents
 City of Lonsdale City of Lonsdale Section Table of Contents Page Introduction Demographic Data Overview Population Estimates and Trends Population Projections Population by Age Household Estimates and
City of New Albany. Analysis of Impediments to Fair Housing Choice Draft. January 16, 2015
 January 16, 2015 City of New Albany Analysis of Impediments to Fair Housing Choice Draft Redevelopment Department 311 Hauss Square, Room 325 New Albany, Indiana 47150 Table of Contents I: Introduction,
SECTION X. IMPEDIMENTS AND SUGGESTED ACTIONS
 SECTION X. IMPEDIMENTS AND SUGGESTED ACTIONS Provisions to affirmatively furthering fair housing are long-standing components of HUD s housing and community development programs. In exchange for receiving
Assessment of Fair Housing Tool for Local Governments. Table of Contents
 Assessment of Fair Housing Tool for Local Governments (LG0) OMB Control Number: -00 I. Cover Sheet Assessment of Fair Housing Tool for Local Governments Table of Contents II. III. IV. Executive Summary
AFFIRMATIVELY FURTHERING FAIR HOUSING
 FINAL REGULATIONS AFFIRMATIVELY FURTHERING FAIR HOUSING Ed Gramlich (ed@nlihc.org) National Low Income Housing Coalition Modified, October 2015 INTRODUCTION On July 8, 2015, HUD released the long-awaited
2017 SOUTH DAKOTA ANALYSIS OF IMPEDIMENTS TO FAIR HOUSING CHOICE
 2017 SOUTH DAKOTA ANALYSIS OF IMPEDIMENTS TO FAIR HOUSING CHOICE Prepared by South Dakota Housing Development Authority and Governor s Office of Economic Development January 10, 2018 Analysis of Impediments
Delaware State Housing Authority New Castle County Department of Community Services City of Wilmington City of Dover
 RFP # 2010-1 ANALYSIS OF IMPEDIMENTS TO FAIR HOUSING CHOICE REQUEST FOR PROPOSALS Delaware State Housing Authority New Castle County Department of Community Services City of Wilmington City of Dover RFP
ANALYSIS OF IMPEDIMENTS TO FAIR HOUSING CHOICE ATHENS-CLARKE COUNTY, GEORGIA
 ANALYSIS OF IMPEDIMENTS TO FAIR HOUSING CHOICE ATHENS-CLARKE COUNTY, GEORGIA January 2012 145 Church St. Suite 200 Marietta, GA 30060 (770) 420-5634 www.wfnconsulting.com Analysis of Impediments To Fair
Attachment 3. Guelph s Housing Statistical Profile
 Attachment 3 Guelph s Housing Statistical Profile Table of Contents 1. Population...1 1.1 Current Population (26)...1 1.2 Comparative Growth, Guelph and Ontario (21-26)...1 1.3 Total Household Growth (21
2018 SKAGIT COUNTY HOME CONSORTIUM ANALYSIS OF IMPEDIMENTS TO FAIR HOUSING CHOICE
 2018 SKAGIT COUNTY HOME CONSORTIUM ANALYSIS OF IMPEDIMENTS TO FAIR HOUSING CHOICE DRAFT FOR PUBLIC REVIEW APRIL 2, 2018 2018 SKAGIT COUNTY HOME CONSORTIUM ANALYSIS OF IMPEDIMENTS TO FAIR HOUSING CHOICE:
APPENDIX A. Market Study Standards and Requirements
 APPENDIX A Market Study Standards and Requirements Section 42(m)(1)(A)(iii) of the IRS Code and Section IV(A)(2) of the 2018 Qualified Allocation Plan (QAP) require market studies for all low-income housing
HOUSING ELEMENT OF THE CITY OF PEMBROKE PINES COMPREHENSIVE PLAN ADOPTION DOCUMENT
 HOUSING ELEMENT OF THE CITY OF PEMBROKE PINES COMPREHENSIVE PLAN RULES 9J-5.010, FAC City of Pembroke Pines, Florida ADOPTION DOCUMENT HOUSING ELEMENT HOUSING ELEMENT ADOPTION DOCUMENT VI. GOALS, OBJECTIVES
HOUSING ELEMENT GOAL, OBJECTIVES & POLICIES
 HOUSING ELEMENT GOAL, OBJECTIVES & POLICIES GOAL HO. HOUSING FOR THE PUBLIC. GOAL, OBJECTIVES & POLICIES It is the goal of the City of Casselberry to ensure an adequate supply of a wide range of housing
CHAPTER 2: HOUSING. 2.1 Introduction. 2.2 Existing Housing Characteristics
 CHAPTER 2: HOUSING 2.1 Introduction Housing Characteristics are related to the social and economic conditions of a community s residents and are an important element of a comprehensive plan. Information
Analysis of Impediments to Fair Housing Choice. Contra Costa County Consortium
 Analysis of Impediments to Fair Housing Choice Contra Costa County Consortium 2017 Contents I. Executive Summary... 1 What Is Fair Housing?... 2 What Is an Impediment to Fair Housing Choice?... 2 Purpose
Affirmative Fair Housing Marketing (AFHM) Plan Multifamily Housing
 Plan Multifamily Housing") Affirmative Fair Housing Marketing (AFHM) Plan Multifamily Housing U.S. Department of Housing and Urban Development Office of Fair Housing and Equal Opportunity 1a. Project Name & Address (including County,
Affirmative Fair Housing Marketing (AFHM) Plan Multifamily Housing U.S. Department of Housing and Urban Development Office of Fair Housing and Equal Opportunity 1a. Project Name & Address (including County,
Housing Policy in the United States
 Housing Policy in the United States Second Edition Alex F. Schwartz THE NEW SCHOOL O Routledge g^^ Taylor & Francis Croup NEW YORK AND LONDON Brief Contents PREFACE ACKNOWLEDGMENT XIII XV 1 INTRODUCTION
AFFIRMATIVELY FURTHERING FAIR HOUSING
 AFFIRMATIVELY FURTHERING FAIR HOUSING Proposed Rule 24 CFR Parts 5, 91, 92, et al. Presented by: Fair Housing Continuum, Inc. A private, not-for-profit, 501 ( c )( 3 ), fair housing enforcement agency.
ANALYSIS OF IMPEDIMENTS TO FAIR HOUSING CHOICE
 ANALYSIS OF IMPEDIMENTS TO FAIR HOUSING CHOICE PIERCE COUNTY CONSORTIUM FOR CDBG, HOME AND ESG FUNDS RECEIVED THROUGH THE U.S. DEPARTMENT OF HOUSING AND URBAN DEVELOPMENT AUGUST 2010 TABLE OF CONTENTS
PALM BEACH COUNTY ANALYSIS OF IMPEDIMENTS TO FAIR HOUSING CHOICE FISCAL YEARS
 PALM BEACH COUNTY ANALYSIS OF IMPEDIMENTS TO FAIR HOUSING CHOICE FISCAL YEARS 2010-2015 Prepared By: Palm Beach County Department of Housing and Community Development Edward W. Lowery, Director June, 2010
Chapter 9: Housing. Introduction. Purpose and Intent. Legislative Authority. Organization of the Housing Element. Housing Element HE-1
 Chapter 9: Housing Introduction Purpose and Intent The is intended to provide residents of the community and local government officials with a greater understanding of housing needs in Rancho Cucamonga,
Chapter 4: Housing and Neighborhoods
 Chapter 4: Housing and Neighborhoods Introduction Medina is a growing community that provides a variety of housing types and neighborhood styles while protecting and enhancing the City s open spaces and
DELAWARE STATEWIDE ANALYSIS OF IMPEDIMENTS TO FAIR HOUSING CHOICE
 DELAWARE STATEWIDE ANALYSIS OF IMPEDIMENTS TO FAIR HOUSING CHOICE 1. INTRODUCTION... 1 A. Introduction... 1 B. Obligation to Affirmatively Further Fair Housing... 1 C. Fair Housing Choice... 3 D. The Federal
City of Waco, Texas. Housing and Community Development Services Fair Housing Plan
 City of Waco, Texas Housing and Community Development Services 2014-2018 Fair Housing Plan Fair Housing Plan City of Waco Texas 1 Introduction to Fair Housing Federal Legislation and Regulations The Federal
Status of HUD-Insured (or Held) Multifamily Rental Housing in Final Report. Executive Summary. Contract: HC-5964 Task Order #7
 Multifamily Rental Housing in Final Report. Executive Summary. Contract: HC-5964 Task Order #7") Status of HUD-Insured (or Held) Multifamily Rental Housing in 1995 Final Report Executive Summary Cambridge, MA Lexington, MA Hadley, MA Bethesda, MD Washington, DC Chicago, IL Cairo, Egypt Johannesburg,
Status of HUD-Insured (or Held) Multifamily Rental Housing in 1995 Final Report Executive Summary Cambridge, MA Lexington, MA Hadley, MA Bethesda, MD Washington, DC Chicago, IL Cairo, Egypt Johannesburg,
Columbus Urban League
 Columbus Urban League 2012 Fair Housing Plan Columbus and Franklin County Analysis of Impediments to Fair Housing Choice and Action Plan August 2012 Community Research Partners Yvonne Olivares, Director
ECONOMIC CURRENTS. Vol. 5 Issue 2 SOUTH FLORIDA ECONOMIC QUARTERLY. Key Findings, 2 nd Quarter, 2015
 ECONOMIC CURRENTS THE Introduction SOUTH FLORIDA ECONOMIC QUARTERLY Economic Currents provides an overview of the South Florida regional economy. The report presents current employment, economic and real
Analysis of Impediments to Fair Housing 2015 Carson, California
 Analysis of Impediments to Fair Housing 2015 Carson, California City of Carson Community Development Department 701 East Carson Street Carson, CA 90745 (310) 830-7600, extension 1319 E-mail: kbennett@carson.ca.us
The Urban County of Bucks County and Bensalem Township M a r c h
 Analysis of Impediments to Fair Housing Choice The Urban County of Bucks County and Bensalem Township M a r c h 2 0 1 4 Analysis of Impediments to Fair Housing Choice Table of Contents I. Introduction
GUIDANCE ON HUD S REVIEW OF ASSESSMENTS OF FAIR HOUSING (AFH)
") GUIDANCE ON HUD S REVIEW OF ASSESSMENTS OF FAIR HOUSING (AFH) The AFH is a local planning document that includes analysis of fair housing issues and identification and prioritization of significant contributing
GUIDANCE ON HUD S REVIEW OF ASSESSMENTS OF FAIR HOUSING (AFH) The AFH is a local planning document that includes analysis of fair housing issues and identification and prioritization of significant contributing
The Metropolitan Transportation Plan/Sustainable Communities Strategy and the SACOG Region s Housing Market. July 2013
 The Metropolitan Transportation Plan/Sustainable Communities Strategy and the SACOG Region s Housing Market July 2013 Draft Housing Report Purpose Provide regional data on: MTP/SCS projected growth/housing
Affirmative Fair Marketing Procedures
 City of Oakland Department of Housing and Community Development Affirmative Fair Marketing Procedures I. Policy on Nondiscrimination and Accessibility 1. Owners and managing agents of housing assisted
New affordable housing production hits record low in 2014
 1 Falling Further Behind: Housing Production in the Twin Cities Region December 2015 Key findings Only a small percentage of added housing units were affordable to households with low and moderate incomes.
The'Analysis'of'Impediments'Study' to'fair'housing'choice'
 February( 2014 The'Analysis'of'Impediments'Study' to'fair'housing'choice' Justin'Harris' [Type'the'abstract'of'the'document'here.'The'abstract'is'typically'a'short'summary'of'the' contents'of'the'document.]'
Housing Assistance in Minnesota
 Minnesota Housing Finance Agency Housing in Minnesota Program Assessment October 1, 2002 - September 30, 2003 Minnesota Housing Finance Agency Housing In Minnesota l\1innesotl Housing Finaru:e Agency Contentsoontents...
Consolidated Planning Process
 Consolidated Planning Process By Ed Gramlich, Director of Regulatory Affairs, National Low Income Housing Coalition Administering agency: HUD s Office of Community Planning and Development Year Program
DRAFT Citizens Summary of Recommendations: 2017 Thurston County Assessment of Fair Housing Report Fair Housing is Affordable Housing
 DRAFT Citizens Summary of Recommendations: 2017 Thurston County Assessment of Fair Housing Report Fair Housing is Affordable Housing 2017 DRAFT Summary of Recommended Goals from the 2017 Thurston County
Fair Housing Equity Assessment Regional Analysis of Impediments to Fair Housing Choice Public Housing Authority De-Concentration Plan
 Fair Housing Equity Assessment Regional Analysis of Impediments to Fair Housing Choice Public Housing Authority De-Concentration Plan The Regional Analysis of Impediments (RAI) and Fair Housing Equity
Guidelines For Creating a TBRA Administrative Plan
 NOTE: Do not submit this document as your administrative plan. Also, do not submit KHC s Housing Choice Voucher Administrative Plan. You must create your own by using the document below as your guide.
Introduction. Charlotte Fagan, Skyler Larrimore, and Niko Martell
 Charlotte Fagan, Skyler Larrimore, and Niko Martell Introduction Powderhorn Park Neighborhood, located in central-southern Minneapolis, is one of the most economically and racially diverse neighborhoods
PINELLAS COUNTY, FLORIDA STATE HOUSING INIITATIVES PARTNERSHIP (SHIP) PROGRAM LOCAL HOUSING ASSISTANCE PLAN (LHAP) FISCAL YEARS ,
 PROGRAM LOCAL HOUSING ASSISTANCE PLAN (LHAP) FISCAL YEARS ,") PINELLAS COUNTY, FLORIDA STATE HOUSING INIITATIVES PARTNERSHIP (SHIP) PROGRAM LOCAL HOUSING ASSISTANCE PLAN (LHAP) FISCAL YEARS 2006-2007, 2007-2008 and 2008-2009 TABLE OF CONTENTS I. PROGRAM DESCRIPTION...
PINELLAS COUNTY, FLORIDA STATE HOUSING INIITATIVES PARTNERSHIP (SHIP) PROGRAM LOCAL HOUSING ASSISTANCE PLAN (LHAP) FISCAL YEARS 2006-2007, 2007-2008 and 2008-2009 TABLE OF CONTENTS I. PROGRAM DESCRIPTION...
City of St. Petersburg, Florida Consolidated Plan. Priority Needs
 City of St. Petersburg, Florida 2000-2005 Consolidated Plan Priority Needs Permanent supportive housing and services for homeless and special needs populations. The Pinellas County Continuum of Care 2000
Housing Study & Needs Assessment
 Housing Study & Needs Assessment Phase II Public Engagement Presentation #2 Winston-Salem, North Carolina January 25, 2018 MEETING OVERVIEW Welcome & Introductions Purpose & Goals Community Discussions
NJ CDBG-Disaster Recovery Program (HURRICANE IRENE) Handbook. Section V Civil Rights
 Handbook. Section V Civil Rights") NJ CDBG-Disaster Recovery Program (HURRICANE IRENE) Handbook Section V Civil Rights Revised 10/02 CDBG-Disaster Recovery Program Handbook Section V Civil Rights CONTENTS PAGE Civil Rights Requirements
NJ CDBG-Disaster Recovery Program (HURRICANE IRENE) Handbook Section V Civil Rights Revised 10/02 CDBG-Disaster Recovery Program Handbook Section V Civil Rights CONTENTS PAGE Civil Rights Requirements
HOUSING ELEMENT Inventory Analysis
 HOUSING ELEMENT Inventory Analysis 2.100 INVENTORY Age of Housing Stock Table 2.25 shows when Plantation's housing stock was constructed. The latest available data with this kind of breakdown is 2010.
PENNSYLVANIA AFFORDABLE HOUSING ACT Act of Dec. 18, 1992, P.L. 1376, No. 172 AN ACT Providing for the establishment and administration of an
 PENNSYLVANIA AFFORDABLE HOUSING ACT Act of Dec. 18, 1992, P.L. 1376, No. 172 AN ACT Cl. 48 Providing for the establishment and administration of an affordable housing program; and imposing additional powers
ANALYSIS OF IMPEDIMENTS TO FAIR HOUSING CHOICE
 ANALYSIS OF IMPEDIMENTS TO FAIR HOUSING CHOICE 2011 Thomas Jefferson HOME Consortium & Adopted by the Thomas Jefferson Planning District Commission on May 5, 2011 City of Charlottesville Adopted by the
STOKES COUNTY NORTH CAROLINA ANALYSIS OF IMPEDIMENTS
 STOKES COUNTY NORTH CAROLINA ANALYSIS OF IMPEDIMENTS JULY2011 TECHNICAL ASSISTANCE PROVIDED BY BENCHMARK CMR INC. 2 Stokes County Analysis of Impediments INTRODUCTION AND EXECUTIVE SUMMARY OF ANALYSYS...
Fair Housing Impediments Analysis. Introduction
 City of Schenectady Fair Housing Impediments Analysis Introduction and executive summary identifying the sponsor, participants, methodology, funding and conclusions Introduction This study is designed
OUTLINE OF THE CDBG-DR FEDERAL REGISTER NOTICE (February 23, 2018)
") OUTLINE OF THE CDBG-DR FEDERAL REGISTER NOTICE (February 23, 2018) INTRODUCTION When Congress makes a special appropriation of Community Development Block Grant funds for disaster recovery (CDBG-DR), HUD
OUTLINE OF THE CDBG-DR FEDERAL REGISTER NOTICE (February 23, 2018) INTRODUCTION When Congress makes a special appropriation of Community Development Block Grant funds for disaster recovery (CDBG-DR), HUD
Housing Characteristics
 CHAPTER 7 HOUSING The housing component of the comprehensive plan is intended to provide an analysis of housing conditions and need. This component contains a discussion of McCall s 1990 housing inventory
Briefing Book. State of the Housing Market Update San Francisco Mayor s Office of Housing and Community Development
 Briefing Book State of the Housing Market Update 2014 San Francisco Mayor s Office of Housing and Community Development August 2014 Table of Contents Project Background 2 Household Income Background and
CLUB COURT APARTMENTS RESIDENT SELECTION CRITERIA
 CLUB COURT APARTMENTS RESIDENT SELECTION CRITERIA 1. Anyone requesting an application is given one. When completed and returned, the application is dated and the time is noted in the upper right corner
Research Report #6-07 LEGISLATIVE REVENUE OFFICE.
 HOUSING AFFORDABILITY IN OREGON Research Report #6-07 LEGISLATIVE REVENUE OFFICE http://www.leg.state.or.us/comm/lro/home.htm STATE OF OREGON LEGISLATIVE REVENUE OFFICE H-197 State Capitol Building Salem,
REQUEST FOR PROPOSALS (A )
") CITY OF TUSCALOOSA ) STATE OF ALABAMA ) REQUEST FOR PROPOSALS (A18-1471) TO: FROM: RE: Qualified Firms The City of Tuscaloosa, Alabama Request for Proposals for Development of Analysis of Impediment to
CITY OF TUSCALOOSA ) STATE OF ALABAMA ) REQUEST FOR PROPOSALS (A18-1471) TO: FROM: RE: Qualified Firms The City of Tuscaloosa, Alabama Request for Proposals for Development of Analysis of Impediment to
City of Dothan Affordable Housing Study. Community Presentation November 6 th, 2017
 City of Dothan Affordable Housing Study Community Presentation November 6 th, 2017 Welcome and Introduction Agenda Welcome and Introduction Background Study Goals Process Findings Q & A / Discussion Next
Analysis of Impediments to Fair Housing Choice 2010 Update
 Analysis of Impediments to Fair Housing Choice 2010 Update To Satisfy the Requirements of 24 CFR 91.225(a)(1) August, 11 2010 City of Bryan Community Development Services Department 405 W 28 th St Bryan,
HOME Investment Partnership Program Project Development Funds. Application
 City of Spartanburg Neighborhood Services 145 West Broad Street Spartanburg, South Carolina 29306 HOME Investment Partnership Program Project Development Funds Application Applicant Name: Project Name:
HOUSING ELEMENT GOALS, OBJECTIVES, & POLICIES
 HOUSING ELEMENT GOALS, OBJECTIVES, & POLICIES GOAL H-1: ENSURE THE PROVISION OF SAFE, AFFORDABLE, AND ADEQUATE HOUSING FOR ALL CURRENT AND FUTURE RESIDENTS OF WALTON COUNTY. Objective H-1.1: Develop a
DRAFT DOWNTOWN DANBURY TRANSIT-ORIENTED DEVELOPMENT STUDY CITY OF DANBURY, CT MAY 2018 APPENDIX A REAL ESTATE MARKET ANALYSIS
 DRAFT DOWNTOWN DANBURY TRANSIT-ORIENTED DEVELOPMENT STUDY CITY OF DANBURY, CT MAY 2018 APPENDIX A REAL ESTATE MARKET ANALYSIS M E M O R A N D U M TO: FROM: RE: Goody Clancy Associates W-ZHA Economic Framework
4. HOUSEHOLD INCOME AND AFFORDABILITY
 4. HOUSEHOLD INCOME AND AFFORDABILITY The analysis of the Household and Affordability section relied primarily on data from the State Department of Housing and Community Development (HCD), California Tax
November An updated analysis of the overall housing needs of the City of Aberdeen. Prepared by: Community Partners Research, Inc.
 City of Aberdeen HOUSING STUDY UPDATE November 2010 An updated analysis of the overall housing needs of the City of Aberdeen Prepared by: Community Partners Research, Inc. nd 10865 32 Street North Lake
WELLSVILLE AFFORDABLE HOUSING PLAN
 WELLSVILLE AFFORDABLE HOUSING PLAN 2014 DRAFT 2.2 Wellsville: Affordable Housing Plan 2014 Page 2 DRAFT 2.2 Wellsville: Affordable Housing Plan 2014 Table of Contents Summary of Affordable Housing Conditions...
TOD and Equity. TOD Working Group. James Carras Carras Community Investment, Inc. August 7, 2015
 TOD and Equity TOD Working Group James Carras Carras Community Investment, Inc. August 7, 2015 What is Equitable TOD? Equity is fair and just inclusion. Equitable TOD is the precept that investments in
2014 Plan of Conservation and Development. Development Plan & Policies
 The Town of Hebron Section 3 2014 Plan of Conservation and Development Development Plan & Policies C. Residential Districts I. Residential Land Analysis This section of the plan uses the land use and vacant
Affordable Housing Initiatives:
 Affordable Housing Initiatives: Building Your Own Local Toolbox Mara S. Register Assistant to the City Manager City of Valdosta, Georgia The Role of Local Government In Housing Historically, local government
Town of Yucca Valley GENERAL PLAN 1
 Town of Yucca Valley GENERAL PLAN 1 This page intentionally left blank. 3 HOUSING ELEMENT The Housing Element is intended to guide residential development and preservation consistent with the overall values
2012 Profile of Home Buyers and Sellers Florida Report
 2012 Profile of Home and Sellers Report Prepared for: REALTORS Prepared by: NATIONAL ASSOCIATION OF REALTORS Research Division December 2012 2012 Profile of Home and Sellers Report Table of Contents Introduction...
2012 Profile of Home Buyers and Sellers Texas Report
 2012 Profile of Home and Sellers Report Prepared for: Association of REALTORS Prepared by: NATIONAL ASSOCIATION OF REALTORS Research Division December 2012 2012 Profile of Home and Sellers Report Table
Housing Indicators in Tennessee
 Housing Indicators in l l l By Joe Speer, Megan Morgeson, Bettie Teasley and Ceagus Clark Introduction Looking at general housing-related indicators across the state of, substantial variation emerges but
The supply of single-family homes for sale remains
 Oh Give Me a (Single-Family Rental) Home Harold D. Hunt and Clare Losey December, 18 Publication 2218 The supply of single-family homes for sale remains tight in many markets across the United States.
U.S. DEPARTMENT OF HOUSING AND URBAN DEVELOPMENT 39 STEPS TOWARD FAIR HOUSING
 U.S. DEPARTMENT OF HOUSING AND URBAN DEVELOPMENT 39 STEPS TOWARD FAIR HOUSING Preamble The 39 Steps Toward Fair Housing depicts the issues, cases, developments and achievements that have been a part of
The rapidly rising price of single-family homes in. Change and Challenges East Austin's Affordable Housing Problem
 Change and Challenges East 's Affordable Housing Problem Harold D. Hunt and Clare Losey March 2, 2017 Publication 2161 The rapidly rising price of single-family homes in East has left homeownership out
H o u s i n g N e e d i n E a s t K i n g C o u n t y
 1999 2000 2001 2002 2003 2004 2005 2006 2007 2008 2009 2010 Number of Affordable Units H o u s i n g N e e d i n E a s t K i n g C o u n t y HOUSING AFFORDABILITY Cities planning under the state s Growth
City of Santa Clarita
 City of Santa Clarita Fair Housing Choice (AI) City of Santa Clarita 23920 W. Valencia Blvd. Suite 302 Santa Clarita, CA 91355 May 2014 Table of Contents Page Section I: Introduction... 1 A. Community
PURPOSE OF STUDY. physical and social environments, as well as our political and economic institutions. As a commodity,
 PURPOSE OF STUDY Housing is one of the most important elements in our lives and our communities. Providing shelter and links to neighborhoods and larger communities, housing plays an essential part in
2012 Profile of Home Buyers and Sellers New Jersey Report
 Prepared for: New Jersey Association of REALTORS Prepared by: Research Division December 2012 Table of Contents Introduction... 2 Highlights... 4 Conclusion... 7 Report Prepared by: Jessica Lautz 202-383-1155
2015 New York City. Housing Security Profile and Affordable Housing Gap Analysis
 2015 New York City Housing Security Profile and Affordable Housing Gap Analysis 1 Contents: Housing Insecurity in New York City 3 A City of Renters. 6 Where the Housing Insecure Population Lives 16 Housing
Terms of Reference for Town of Caledon Housing Study
 1.0 Introduction Terms of Reference for Town of Caledon Housing Study The Town of Caledon is soliciting proposals for a comprehensive Housing Study. Results of this Housing Study will serve as a guiding
EVALUATION AND APPRAISAL REPORT OF THE CITY OF FELLSMERE COMPREHENSIVE PLAN APPENDIX D HOUSING ELEMENT
 OBJECTIVE H-A-1: ALLOW AFFORDABLE HOUSING AND ADEQUATE SITES FOR VERY LOW, LOW, AND MODERATE INCOME HOUSING. The City projects the total need for very low, low, and moderate income-housing units for the
CITY OF CLAREMONT MASTER PLAN 2017 CHAPTER 6: HOUSING
 CITY OF CLAREMONT MASTER PLAN CHAPTER 6: HOUSING Prepared by the Claremont Planning Board and the Claremont Planning and Development Department Vision Claremont Master Plan Chapter 6: Housing Quality housing
DRAFT Analysis of Impediments to Fair Housing Choice. City of Menifee Haun Road Menifee, CA
 DRAFT 2017-2021 Analysis of Impediments City of Menifee 29714 Haun Road Menifee, CA 92586 www.cityofmenifee.us This Page Left Intentionally Blank City Council Neil R. Winter Mayor Greg August District
Chapter 9 Fair Housing and Equal Opportunity
 Chapter 9 Fair Housing and Equal Opportunity Introduction Localities receiving Community Development Block Grants (CDBG) through the Michigan Strategic Fund (the MSF) are required to comply with various
AFFIRMATIVELY FURTHERING FAIR HOUSING FOR MUNICIPAL LEADERS
 AFFIRMATIVELY FURTHERING FAIR HOUSING FOR MUNICIPAL LEADERS Presented by Erin Kemple Executive Director Connecticut Fair Housing Center 221 Main Street Hartford, CT 06106 (860)247-4400, ext. 723 erin@ctfairhousing.org;
B-11-MN April 1, 2014 thru June 30, 2014 Performance Report. Community Development Systems Disaster Recovery Grant Reporting System (DRGR)
") Grantee: Grant: Pomona, CA B-11-MN-06-0516 April 1, 2014 thru June 30, 2014 Performance Report 1 Grant Number: B-11-MN-06-0516 Grantee Name: Pomona, CA Grant Award Amount: $1,235,629.00 LOCCS Authorized
Grantee: Grant: Pomona, CA B-11-MN-06-0516 April 1, 2014 thru June 30, 2014 Performance Report 1 Grant Number: B-11-MN-06-0516 Grantee Name: Pomona, CA Grant Award Amount: $1,235,629.00 LOCCS Authorized
City of Del Mar. Community Plan Housing Element (April 30, 2013 April 30, 2021)
") 3( Community Plan Housing Element 2013 2021 (April 30, 2013 April 30, 2021) Adopted by City Council Resolution No. 2013-27 on May 20, 2013. Certified by the California Department of Housing and Community
3( Community Plan Housing Element 2013 2021 (April 30, 2013 April 30, 2021) Adopted by City Council Resolution No. 2013-27 on May 20, 2013. Certified by the California Department of Housing and Community
MPDU Ordinance Traditional Neighborhood Housing Program
 MPDU Ordinance Traditional Neighborhood Housing Program New Castle County Council December 2, 2014 New Castle County Federal Housing Programs $35.53 Million in 2014 $4.0 Million CDGB, Home Investment Partnership
Affirmative Fair Housing Marketing Plans
 Affirmative Fair Housing Marketing Plans Asset Management Department, Housing Programs Analysts Christi Wheelock cwheelock@housingnm.org 505-767-2279 Amanda Aragon aaragon@housingnm.org 505-767-2267 Kathy
Town of Limon Comprehensive Plan CHAPTER 4 HOUSING. Limon Housing Authority Affordable Housing
 CHAPTER 4 HOUSING Limon Housing Authority Affordable Housing 40 VISION Throughout the process to create this comprehensive plan, the community consistently voiced the need for more options in for-sale
Rhode Island Consolidated Plan, Public Focus Group #6: Fair Housing. The DaVinci Center, 470 Charles St., Providence July 22, 2009, 4-6pm
 Rhode Island Consolidated Plan, 2010-2015 Public Focus Group #6: Fair Housing The DaVinci Center, 470 Charles St., Providence July 22, 2009, 4-6pm On July 22nd, Rhode Island Housing convened the sixth