2 7 T H J U L Y HALF-YEAR RESULTS
|
|
|
- Andrea Harris
- 5 years ago
- Views:
Transcription


1 2 7 T H J U L Y HALF-YEAR RESULTS
 (=) Fair values of buildings unchanged (+) Average cost of debt decreases (+) Banimmo net result breaks even EPRA EARNINGS GROWS UP TO 6.")

2 AFFINE 1H18 KEY TAKEAWAYS NET PROFIT, GROUP SHARE, OF 5.0M (=) Net rental income almost unchanged (-0.7%) (+) Corporate expenses reduced (-5.4%) (=) Fair values of buildings unchanged (+) Average cost of debt decreases (+) Banimmo net result breaks even EPRA EARNINGS GROWS UP TO 6.4M OCCUPANCY RATE INCREASES AT 89% (+2.0 POINTS) PORTFOLIO VALUE OF ASSETS GROWS (+1.6%) 25.2m of acquisitions, developments and refurbishments 15.8m from disposals 53m pipeline of investments committed and controlled projects FRIENDLY TAKEOVER BID FOR BANIMMO LAUNCHED BY PATRONALE LIFE: AFFINE COMMITS TO TENDER IT S 49,5% SHARES EPRA NAV PER SHARE: 20.0 EPRA TRIPLE NAV PER SHARE:

3 INVESTMENTS AND DISPOSALS 2


4 INVESTMENTS AND DISPOSALS INVESTMENTS AND DISPOSALS 25m: Investments 16m: Disposals MER MEUDON TURNKEY PROJECT COMPLETED JAN 2018 LILLE HASHTAG # TURNKEY PROJECT COMPLETION 2018 & 2020 EURONANTES KIBORI TURNKEY PROJECT COMPLETION DEC 2018 LEERS SÈVRES LE MAJOLIQUE PARIS KREMLIN-BICÊTRE BEFORE PARIS KREMLIN-BICÊTRE AFTER THOUARS 53m: Commitments Turnkey and developement projects under construction and committed acquisitions BARBEREY ST SULPICE 3
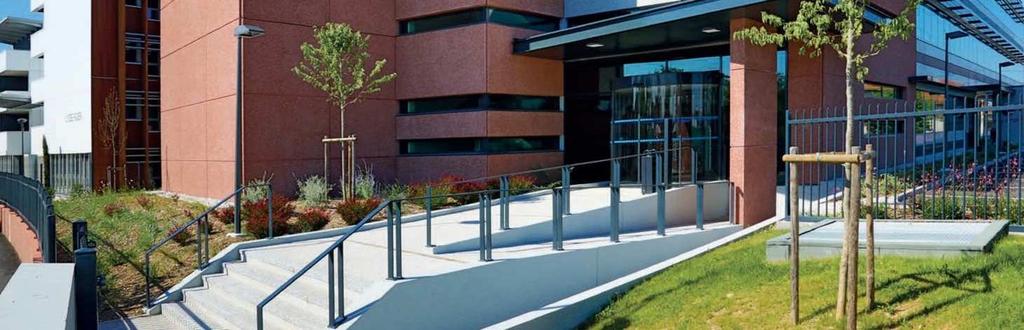
: 1.2m (i.e. 208/sqm) G+9 with 108 underground parking lots on 2 underground levels Multi-tenant building Occupation rate of 100% A CHANGING DISTRICT In")
 By public transportation > Underground line 9 and tramway T2 > Numerous bus lines BENEFITING LATER FROM THE GREATER PARIS In the horizon 2022,")
5 INVESTMENTS AND DISPOSALS SÈVRES LE MAJOLIQUE ACQUISITION OF 5,670 SQM OF OFFICES Market rental income (ERV): 1.2m (i.e. 208/sqm) G+9 with 108 underground parking lots on 2 underground levels Multi-tenant building Occupation rate of 100% A CHANGING DISTRICT In the heart of the Boucle Sud market (Boulogne-Billancourt, Issy-les- Moulineaux) Easy access By road > Ring road (Porte de Saint-Cloud) and Quais de la Seine > Main roads (A86, D910, D7, N118) By public transportation > Underground line 9 and tramway T2 > Numerous bus lines BENEFITING LATER FROM THE GREATER PARIS In the horizon 2022, station «Pont de Sèvres» will be served by the line 15 connecting Saint-Denis to Villejuif 4

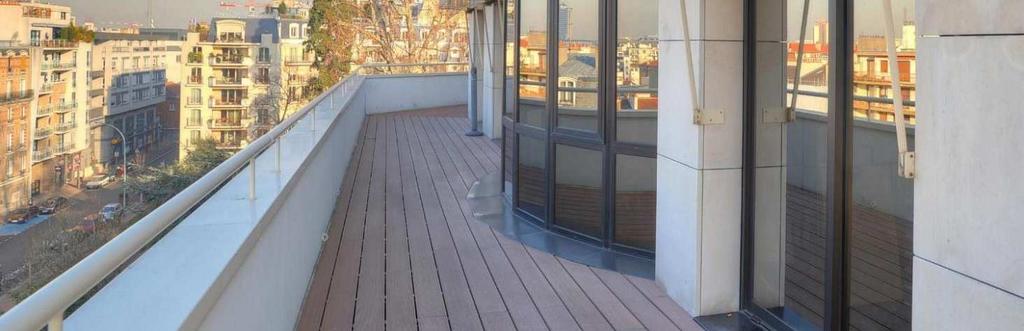
 1,610 sqm across 4 levels (G+3) Offices rented to the Automotive and")

6 INVESTMENTS AND DISPOSALS MEUDON GREEN OFFICE EN SEINE Green Office buildings COMPLETION EARLY 2018 OF 5,400 SQM OF OFFICES Market rental income (ERV): 1.9m (i.e. 350/sqm) BEPOS Effinergie and HQE 560 sqm of rooftop solar panels 2 buildings with 113 underground parking lots: 3,800 sqm across 4 levels (G+3) 1,610 sqm across 4 levels (G+3) Offices rented to the Automotive and Mobility Services Division 12-year-firm lease Occupancy rate: 97% LOCATED OPPOSITE ILE SEGUIN A dynamic economic environment 400 companies and nearby: Gemalto and Global Mail Excellent public transportation links Tram T2 and Bus 389 RER C and the train SNCF N In front of the Seine Musicale, music and performing arts center Video of the project on: 5
: 765,000 (i.e. 197/sqm) BREEAM Mixed Cross-Laminated Timber (CLT) / concrete / metal structure 1 building with 8 floors")
 IN PARTNERSHIP WITH SOGEPROM April 2014: Launching of the call for tenders by the municipality January 2017:")

7 INVESTMENTS AND DISPOSALS NANTES EURONANTES KIBORI ACQUISITION OF 3,880 SQM OF OFFICES Market rental income (ERV): 765,000 (i.e. 197/sqm) BREEAM Mixed Cross-Laminated Timber (CLT) / concrete / metal structure 1 building with 8 floors (Ground -1 to G+6) 33 underground parking lots 100% leased to the Regional Department of Public Finance for the Loire and Loire-Atlantique 9-year lease (o/w 5 firm) IN PARTNERSHIP WITH SOGEPROM April 2014: Launching of the call for tenders by the municipality January 2017: Acquisition signed Completion expected on H LOCATED IN THE EURONANTES RAILWAY STATION DISTRICT New major business district in 2020: 130,000 sqm of offices Close to the TGV station Excellent public transportation links Tramway Bus lines Kibori Euronantes TGV Station Video of the project on: 6
: 873,000 (i.e. 165/sqm) BREEAM 2 buildings with 90 parking lots: 2,230 sqm across 5 levels (G+4) 3,050 sqm across 4 levels (G+3) March 2017: Acquisition signed Completion")

8 INVESTMENTS AND DISPOSALS LILLE EURATECHNOLOGIES #HASHTAG ACQUISITION OF 5,280 SQM OF OFFICES Market rental income (ERV): 873,000 (i.e. 165/sqm) BREEAM 2 buildings with 90 parking lots: 2,230 sqm across 5 levels (G+4) 3,050 sqm across 4 levels (G+3) March 2017: Acquisition signed Completion planned in 2 phases: H and 2020 Marketing undergoing LOCATED IN THE EURATECHNOLOGIES AREA Lille s new area of excellence dedicated to Information and Communications Technology (ICT) 115,000 sqm business district around the Blan-Lafont building 2,800 jobs, 140 ICT companies: Capgemini, IBM Service Center, Microsoft and Tata Consultancy Services Excellent public transport links 2 métro stations 1 bus line 2 public bike stations Video of the project on: 7
: 330,000 (i.e. 206/sqm) Agreement signed with Louvre Hotels Group (12-fixed-terme lease)")


9 INVESTMENTS AND DISPOSALS KREMLIN BICÊTRE CONVERTION OF AN OFFICE BUILDING INTO A NEW LODGING CONCEPT Market rental income (ERV): 330,000 (i.e. 206/sqm) Agreement signed with Louvre Hotels Group (12-fixed-terme lease) Offers beds rather than rooms Surface area: 1,600 sqm 238 beds over 39 dormitory-type rooms Completion: Q A COMPLEMENTARY OFFER To the 3 stars hotel Campanile Which will boost its visibility and improve trafic for the multi-brand place AT THE EDGE OF PARIS Easy access Ring road: Porte d Italie Highway: A6b and A4 Excellent public transport links Métro: Line 7, Porte d Italie or Le Kremlin-Bicêtre station at 5 min walk Bus lines Tramway Public bike stations 8
10 INVESTMENTS AND DISPOSALS OVERVIEW OF THE INVESTMENTS INVESTMENTS IN H1 2018: More than 165m of realized or committed operations and controlled projects 102m of realized acquisitions over the last 12 months > Clichy, Courbevoie, Suresnes, Vaugirard, Sèvres, Meudon 11m of turnkey projects under construction accounted to date > Nantes et Lille #hashtag 53m of committed operations and controlled projects > 10m to come on turnkey projects: Nantes and Lille #hashtag > Developments: Kremlin-Bicêtre, Nîmes, Lyon, Sant Feliu 11.1m of gross rental income, 1.8m of which accounted in H (corresponding to 6.6m of potential annual rent) IMPACT ON THE RENTS Building Location ERV ( 000') ERV /sqm Meudon Paris Métropole 1, Nantes Kibori French region Lille Hashtag# French region Clichy Mozart Paris Métropole Courbevoie Abreuvoir Paris Métropole Suresnes Marcel Monge Paris Métropole 1, Paris Marché Vaugirard Paris Métropole Sèvres Majolique Paris Métropole 1, Kremlin / Nîmes / Lyon / Sant Feliu (rents compl.) 2,879 Total 11,135 9

11 PERFORMANCE OF THE PORTFOLIO 10
12 PERFORMANCE OF THE PORTFOLIO PROPERTIES FAIR VALUE UP 1.6% CHANGE IN FAIR VALUE EXCLUDING TRANSFER TAXES ( M) /12/2017 Disposals Net capital gain FV change (P&L) Capex Acquisitions 30/06/2018 CONTRIBUTION OF THE FAIR VALUE CHANGE TO THE P&L (-0.0%): Market rent effect (ERV): +0.8% Cap rate effect: -2.9% Miscellaneous: +2.0% (works, reversion, internal adjustements ) 11
13 PERFORMANCE OF THE PORTFOLIO OCCUPANCY RATE FINANCIAL OCCUPANCY RATES (EPRA) 90.2% 85.8% 87.5% 87.0% 89.0% Total 89.0% Offices 93.6% Retail Warehouses and industrials 78.5% 86.6% H18 Paris Métropole Targeted regional cities Others 72.7% 93.6% 94.5% Impact Logistics ptf disposal -2.1 pt Paris Métropole: Paris + Hauts-de-Seine + Seine-Saint-Denis + Val-de-Marne 12
14 PERFORMANCE OF THE PORTFOLIO HEADLINE RENTS CHANGE IN HEADLINE RENTS ANNUALIZED ( M) 34.1 (1.6) (0.2) /12/2017 Disposal Like-for-like Investment 30/06/2018 Scope effect: +4.3% Like-for-like: -0.6% 13
15 PERFORMANCE OF THE PORTFOLIO SCHEDULE IN RENTS ACCORDING TO LEASE DURATION ( M) Dec-18 Dec-19 Dec-20 Dec-21 Dec-22 Dec-23 Dec-24 Dec-25 Dec-26 End of lease Fixed term Average lease term to next break option: 3.0 years (vs 2.5 as at 31/12/2017) Average lease term to lease expiry: 5.1 years (vs 4.6) 13 new leases ( 0.6m) + 0.4m and + 0.2m in 2018 and departures ( 1.0m) - 0.8m and - 0.2m in 2018 and renegociated leases ( 0.4m vs 0.6m) - 0.2m and - 0.0m in 2018 and 2019 Portfolio change (+ 1.5m) + 1.1m and + 0.4m in 2018 and terminated leases ( 0.8m) - 0.3m and - 0.5m in 2018 and 2019 Impact 2018 : + 0.6m 2019 : + 0.3m 14

 Exchange of the stake in Dolce la Hulpe against full stake in Dolce Chantilly Reimbursement of")

16 DISCONTINUED OPERATION BANIMMO IN H Portfolio: 9 buildings; Gross rental income: 1.9m; value: 143m KEY EVENTS Disposal of the Banimmo France subsidiary Continuing of the Vilvoorde site change of use Revised building permit obtained for the vertical scission of North Plaza building Disposal of an office building in Rocquencourt (78) Exchange of the stake in Dolce la Hulpe against full stake in Dolce Chantilly Reimbursement of its 34m bond Renting ot a 3,050 sqm office surface area in the Diamond building Takeover bid by Patronale Life RESULTS Real estate operating result: 2.9m vs 2.3m Operating result: 0.9m vs - 2.7m Net result: - 0.1m vs - 4.4m More details on 15
17 INVESTMENTS AND DISPOSALS TAKEOVER BID ON BANIMMO AFFINE COMMITS TO TENDER ITS STAKE Buyer: Patronale Life, Belgian insurance group Disposal: all Affine s stake hold in Banimmo, i.e. 49.5% Price: 18.6m, i.e. 3.3/share (= average price of the last 6 months) BANIMMO OVERVIEW Performance ( ): - 2.9m Net investment (2006): 66.6m Dividend ( ): 45.1m Disposal (2018): 18.6m A NEUTRAL IMPACT ON 2018 AFFINE FINANCIAL STATEMENTS Disposal at a price close to the 2017 end-period net book value ( 3.28/share) Balance Sheet Impact Asset & Liabilities: Decrease of the discontinued operations amount Asset Cash: m Liabilities Banimmo NBV fixed at 18.6m P&L Impact Neutral impact of Banimmo net results for Affine POSITIVE IMPACT ON AFFINE VISIBILITY 18.6m in additional resources to implement its strategy, An additional stage in its refocusing on its French commercial property business (Paris Métropole and targeted regional cities) 16


18 CONSOLIDATED ACCOUNTS 17
19 CONSOLIDATED EARNINGS CONSOLIDATED EARNINGS ( m) H H Gross rental income Net rental income Other income Corporate expenses (4.2) (8.8) (4.0) Current EBITDA Current operating profit Other income and expenses Net financial cost (3.1) (6.9) (3.6) Taxes (0.3) 0.4 (0.0) Miscellaneous (0.0) 0.0 (0.2) Associates and Discontinued operations (2.7) (6.1) 0.7 Net current profit Value adjustments of properties & profit on disposals (0.0) Fair value adjustments of hedging instr Adjustements for associates & Discontinued operations (1.0) Others (o/w Banimmo shares depreciation) 0.0 (7.7) (0.4) Net non-current profit group share 2.7 (1.7) (1.4) Net profit group share Net profit group share(excl. Banimmo) EPRA Earnings(Net current profit group share) EPRA Earnings(excl. Banimmo)
20 CONSOLIDATED EARNINGS A 2.4% DECREASE OF THE NET ASSET VALUE ( m) 30/06/17 31/12/17 30/06/18 Shareholders equity(before allocation) PSL adjustment (73.1) (73.3) (73.3) Fair value adjustments to hedging instr Net deferred tax (1.1) EPRA NAV(excluding transfer tax) EPRA NNNAV(excluding transfer tax) EPRA NAV(excluding transfer tax) per share( ) EPRA NNNAV(excluding transfer tax) per share( ) ( m) (10.0) (0.1) (1.3) Excluding PSL (TSDI) Others*: interest on convertibles and PSL Convertibles, Banimmo non cash items, etc 31/12/2017 Dividends paid FV properties FV FI EPRA earnings Others* 30/06/ per share 20.0 per share Based on 3.3 share price for Banimmo NAV per share after dilution from convertibles 19


21 FINANCING 20


22 FINANCING LTV AND DECREASE OF THE FINANCING COST LTV EVOLUTION ( M) % % 80% % 50.8% 45.5% 46.8% 49.3% 46.6%46.4% 52.3% 48.6% 53.0% 40% 20% 0% H17 1H18 Value Loan LTV Net debt: 347m (excl. lease financing) LTV: 53.0% DECREASE OF THE FINANCING COST: 1.9% VS 2.0% 21
 350 300 250 200 150 100 50 0 2018 2019 2020 2021 Fixed rate Swap")

 Micro hedging (by loan): represents c.")
23 FINANCING AN INTEREST RATE RISK LARGELY HEDGED CHANGE IN HEDGING ( M) Fixed rate Swap Cap Unhedged Average Cap rate (RHS) 1,5% 1,0% 0,5% 0,0% Normative debt excluding financing lease deemed at 340m Macro hedging (global): 150m of cap at 1% for 6 years signed up in September 2016 (maturity Sept 2022) Micro hedging (by loan): represents c. 50% of the debt 22
24 FINANCING DEBT PROFILE UNDER CONTROL AMORTISATION OF DEBT ( M) S18 2S Contractual amortisation Repayment at maturity Early repayment A financing policy aiming at smoothing the amortization (around 19m p.a. on average) Average duration of the debt: 5.8 years Short term confirmed credit lines of 21m FINANCING IN H Financing / Refinancing: 34m Amortisation: 35m 23


25 STRATEGY & OUTLOOKS 24
26 STRATEGY & OUTLOOKS OUR STRATEGY [1/2] CONCENTRATION OF INVESTMENTS: Geographic: On Paris Métropole And regional cities (Bordeaux, Lille, Lyon, Marseille, Nantes, Toulouse) benefitting from good national and international transport network and a strong demographic and economic momentum Type: Focus on offices And retail premises in city center more opportunistically Open to mixed and innovative urban projects 29% 16% 48% 37% 35% 25% 27% 36% 47% S Others Targeted regional cities Paris Métropole BREAKDOWN OF THE PORTFOLIO IN ASSET VALUE 6.3% 21.4% 72.3% Offices Retail Warehouses and industrial 25
![STRATEGY & OUTLOOKS OUR STRATEGY [2/2] CONTINUATION OF THIS POLICY ACCORDING TO 3 CRITERIA: 1) Renew the portfolio by looking for buildings, New (turnkey) or recent, preferably with green](/docs-images/96/127090033/images/27-0.jpg "certification Of an unit size between 10m to 30m Containing a potential for value creation by their location or rental situation to streamline it By selling mature, small or isolated assets And")
 Integrate new technological developments")
27 STRATEGY & OUTLOOKS OUR STRATEGY [2/2] CONTINUATION OF THIS POLICY ACCORDING TO 3 CRITERIA: 1) Renew the portfolio by looking for buildings, New (turnkey) or recent, preferably with green certification Of an unit size between 10m to 30m Containing a potential for value creation by their location or rental situation to streamline it By selling mature, small or isolated assets And logistics assets and in making the most of our land reserve 2) Increase significantly the rents by: Investing in buildings with a good yield and good location Making the improvement of the OR a strong goal Optimizing daily management through an efficient information system Co-investing with partners in bigger projects that meet our strategy policy 3) Integrate new technological developments of the property sector Tenant services (virtual concierge services, pickup station ) Electronic document signing (lease, mandate ) New uses of workplace 26


28 CONTACTS CONTACTS AFFINE Maryse Aulagnon Chairperson Matthieu Evrard CEO Frank Lutz CFO frank.lutz@affine.fr LIQUIDITY CONTRACT: INVEST SECURITIES WEBSITE: 27


29 APPENDIX 28


30 APPENDIX AFFINE PORTFOLIO IN SOME KEY FIGURES 626m (transfer tax included) 41 buildings 248,400 sqm BORDEAUX JARDINS DES QUAIS RETAIL/OFFICE 25,530 SQM PARIS TRAVERSIÈRE TOWER OFFICE 7,780 SQM LILLE EURALILLE TOWER OFFICE 25,000 SQM PARIS AUBER OFFICE 2,280 SQM TOULOUSE LES AMARANTESI & II OFFICE 5,760 SQM LYON TANGRAM OFFICE 5,910 SQM GENNEVILLIERS PLUS INDUSTRIAL 15,220 SQM 29

31 APPENDIX EVOLUTION OF THE EMPLOYED POPULATION AGED 15 TO 64 BY URBAN AREA OF RESIDENCE FROM 2008 TO 2013 Source: Insee, census of the population, 2008 and 2013, France Stratégie calculation 30
32 APPENDIX CONSOLIDATED CASH-FLOW ( m) 30/06/17 31/12/17 30/06/18 Funds from operations Funds from operations (excluding cost of debt and tax) Change in WCR 0.4 (0.0) 1.4 Taxes paid (0.6) (0.7) 0.7 Discontinued operations Operating cash flow Acquisitions (11.1) (84.8) (23.2) Disposals Others Discontinued operations Investment cash flow 0.6 (38.5) 0.6 New loans Loan repayments (67.4) (120.0) (35.1) Interest (3.0) (6.4) (3.5) Others (of which dividends) (14.5) (15.6) (41.7) Discontinued operations - (3.3) (31.1) Financing cash flow (9.9) 27.1 (46.2) Change in cash position (12.4) Net cash position
33 APPENDIX CONSOLIDATED BALANCE SHEET ( m) 30/06/17 31/12/17 30/06/18 Properties of which investment properties of which property held for sale Equity holdings Equity affiliates Cash Discontinued operations Other assets Shareholders equity (before allocation) of which Non-controlling interest of which convertibles of which PSL Bank debt Discontinued operations Other liabilities Total Balance Sheet
34 APPENDIX PORTFOLIO GROSS YIELD RETURN BY ASSET TYPE Portfolio Headline Potential Split in value Yield Yield Offices 72.3% 5.4% 5.8% Retail 21.4% 5.6% 7.1% Warehouses & Industrials 6.3% 7.1% 8.2% Total 100.0% 5.6% 6.3% RETURN BY LOCATION Portfolio Headline Potential Split in value Yield yield Paris Métropole 47.3% 5.2% 5.5% Targeted regional cities 36.7% 5.1% 5.4% Others 16.0% 7.8% 10.1% Total 100.0% 5.6% 6.3% 33
35 APPENDIX SHARE PRICE ( ) AND AVG TRANSACTION VOL. (000) 19 Affine Eur onext IEIF SIIC France EPRA Eur ope janv.-18 mars-18 mai-18 juil janv.-18 mars-18 mai-18 juil
36 APPENDIX LTV (NET DEBT / PORTFOLIO VALUE) ( m) 30/06/17 31/12/17 30/06/18 LOAN Net financial debt Debt allocated to lease financing (6) (5) (3) Debt for investment properties VALUE Value of properties (incl. TT) Property companies on equity basis VEFA & Fixed assets adjustments Adjusted portfolio value incl. taxes LTV(net debt on portfolio value) 48.6% 52.3% 53.0% 35


37 APPENDIX A DIVERSIFIED RISK ON TENANTS A DIVERSIFIED PORTFOLIO OF CUSTOMER BREAKDOWN OF RENTS 11% SNCF 339 Leases 5% 4% 4% 3% TOP 5 S.A.M. Mairie de Corbeil-Essonnes Sogitec 73% Inseec Others < 3% 36
 30 25 20 Cash 20.6 Share 15 10 12.")


38 APPENDIX DIVIDEND AFFINE, HIGH YIELD PROPERTY COMPANY ( M) Cash 20.6 Share A 6.4% yield based on the share price of 30/06/2018 ( 15.60) 37
 for an amount of 54m (equity: 20m and mezzanine loan: 34m) for 3 commercial centre projects in Namur,")
 ; new mezzanine loan of 12m (of")
 December 2014 Depreciation of the remaining stake ( 4m) December 2015 Depreciation of 21m of the mezzanine loan (out of a total of 45m) April 2016 Judicial")
39 APPENDIX BANIMMO STAKE IN URBANOVE August 2010 Banimmo took a 42.5% stake in Citymall (former Foruminvest in Belgium) for an amount of 54m (equity: 20m and mezzanine loan: 34m) for 3 commercial centre projects in Namur, Charleroi and Verviers December2013 Partial depreciation of the stake for 15m May 2014 Banimmo purchased the company holding the ground lease in Charleroi for 5m November 2014 Takeover of the Namur and Verviers projects by Urbanove (44% Banimmo; 56% Walloon region + Besix + Degroof) ; new mezzanine loan of 12m (of which Banimmo: 9.9m) December 2014 Depreciation of the remaining stake ( 4m) December 2015 Depreciation of 21m of the mezzanine loan (out of a total of 45m) April 2016 Judicial Reorganization Procedure (PRJ) of Urbanove to reorganize the financial structure of the two projects extended until November 2016 December 2016 Disposal of the 2 projects: Amortisation of the remaining outstanding mezzanine loan representing 27.7m 38

 SIIC TROPHY Request for proposal won in")

40 APPENDIX BANIMMO 2 SUCCESSFUL DEVELOPMENTS DISPOSAL OF THE MARCHÉ SAINT GERMAIN (PARIS 6 ÈME ) Acquisition in 2009: 30m Eviction, work and financing costs: c. 40m Commercial centre increased from 3,200 sqm to 4,400 sqm Doubling rents to 4.3m Completion by Q Opening and disposal late 2016 at a price of 130m OR: 100% - Apple, Nespresso, Uniqlo, Marks & Spencer, Desnoyers, etc AGREEMENT OF SALE OF THE MARCHÉ DE LA HALLE SECRÉTAN (PARIS 19 ÈME ) SIIC TROPHY Request for proposal won in April 2011 Ground lease for 70 years Project cost: c. 15m Increase threefold the surface area to 3,800 sqm Rent: 1.25m Opening in October 2015 Agreement for sale signed in October 2016 Property sold in July 2017 for 27.8m OR: 100% - Les 5 fermes, Camaïeu, Neoness, Desnoyers, etc 39
41 APPENDIX SHAREHOLDING SHAREHOLDING Annualised float turnover rate of 44% Annualised capital turnover rate of 18% 30.2% 8.6% 41.0% 32.0% 46.0% 6.0% 21.0% 15.2% Holdaffine SMABTP La Tricogne Free float Capital Voting rights AFFINE IS LISTED ON EURONEXT PARIS 30 June 2018 Number of shares 10,056,071 Share price Market capitalisation 156.9m Change in H % EPRA earnings per share (excl. Banimmo) 0.45 Ticker (Bloomberg / Reuters) IML FP / BTPP.PA 40
HALF-YEAR RESULTS. Presentation of 31 July 2013
 HALF-YEAR RESULTS 2013 Presentation of 31 July 2013 AFFINE KEY TAKEAWAYS EPRA Earnings down due to disposals (-) Rental income down as a consequence of 2012 disposals (-) Negative global result from associates
Results H September 9, 2009
 Results H1 2009 September 9, 2009 1 Strategy for the crisis Fair value: analysis and impacts The group s companies Analysis of H1 2009 accounts Affine on the stock exchange 2 STRATEGY FOR THE CRISIS Simplifying
FULL-YEAR RESULTS PRESENTATION 26 FEBRUARY 2016
 FULL-YEAR RESULTS 2015 PRESENTATION 26 FEBRUARY 2016 AFFINE 2015 Key takeaways.net OPERATING PROFIT RISES SHARPLY TO 23.2M.NET PROFIT AT BREAK-EVEN (+) Significant increase in fair value, up 3.8m (+) Cost
2018 Half-Year Results Ongoing developments to prepare for the future
 Press Release 2018/07/20 2018 Half-Year Results Ongoing developments to prepare for the future The Board of Directors of Société de la Tour Eiffel, which met on 20 July 2018, approved the financial statements
2017 Annual Results Construction of solid and sustainable cash flow continues
 Press Release 2018/03/07 2017 Annual Results Construction of solid and sustainable cash flow continues The Board of Directors of the Société de la Tour Eiffel, meeting on 7 March 2018, approved the annual
2016 Annual Results Strong growth in earnings
 Press Release 08/03/2017 2016 Annual Results Strong growth in earnings The Board of Directors of the Société de la Tour Eiffel met on 8 March 2017, chaired by Hubert Rodarie, and approved the financial
Q RESULTS 15 MAY 2018 TLG IMMOBILIEN AG Q RESULTS
 TLG IMMOBILIEN AG Q 208 RESULTS DISCLAIMER This presentation includes statements, estimates, opinions and projections with respect to anticipated future performance of TLG IMMOBILIEN ("Forward-Looking
H RESULTS 10 AUGUST 2018 TLG IMMOBILIEN AG H RESULTS
 TLG IMMOBILIEN AG H1 2018 RESULTS DISCLAIMER This presentation includes statements, estimates, opinions and projections with respect to anticipated future performance of TLG IMMOBILIEN ("Forward-Looking
Analyst Presentation 12 February 2018
 Analyst Presentation 12 February 2018 Disclaimer This presentation is not an offer or an invitation to sell or exchange securities, or a recommendation to subscribe, buy or sell ANF Immobilier securities.
2013 annual results. 19 th March 2014
 19 th March 2014 Main achievements 2013 Stated 2013 objectives Achieved Securing rental income Pre-letting Montrouge - 6 years - 1.8m New leases / extensions Total amount: 9.2m Asset disposals ( 200m over
2017 FULL YEAR 16 FEBRUARY 2018
 FULL YEAR RESULTS 16 FEBRUARY 2018 : Delivering in line with strategy 1.1 billion invested Asset acquisitions 610m Development capex 414m Land acquisitions 92m 525 million disposals Asset sales 432m Land
ICADE REVENUE UP +8.4% IN Q1 2018
 PRESS RELEASE Issy-les-Moulineaux, April 27, 208 ICADE REVENUE UP +8.4% IN Q 208 Commercial Property Investment: o Rental income up by as much as +5,8% to 99.0 million o Financial occupancy rate at 92.4%
Interim statement from the Board of Directors for the first quarter of 2015
 Regulated information - under embargo until 05/05/2015, 8 a.m. Antwerp, 5 May 2015 Interim statement from the Board of Directors Acquisition of a modern logistics site of approximately 52.000 m² in a prime
ICADE 1 ST QUARTER 2015 ACTIVITY
 PRESS RELEASE Paris, 5 May 2015 ICADE 1 ST QUARTER 2015 ACTIVITY 1. PROPERTY INVESTMENT DIVISION 1.1. Rental business Asset classes Financial occupancy rate 31/03/2015 31/12/2014 Average lease terms (as
AUDIOCAST PRESENTATION Q1/2018
 19.4.2018 AUDIOCAST PRESENTATION Q1/2018 HIGHLIGHTS Q1/2018 EPRA EARNINGS PER SHARE EUR 0.041 -Divestments in 2017 and weaker currencies impacted EPRA EPS -Efficient cost management with administrative
2014 half-year results. 23 rd July 2014
 23 rd July 2014 Main achievements first half 2014 Stated 2014 objectives Achievements to date New acquisitions One agreement contracted for a 8,300 m² office building in the southern inner rim of Paris
Sponda Financial Results Q4 and FY February 2017
 Sponda Financial Results Q4 and FY 2016 3 February 2017 1. 2. 3. 4. Highlights for the Period Kari Inkinen Portfolio Development Pia Arrhenius Financials Niklas Nylander Business Environment and Business
Interim statement by the board of directors on the first quarter of 2018
 Regulated information - under embargo until 03/05/2018, 6 p.m. Antwerp, 3 May 2018 on the first quarter of 2018 Third logistics site in the Netherlands: agreement signed for the purchase of the site and
January - September 2011 results
 January - September 2011 results 14 November 2011 Highlights 9M 2011 RESULTS Commercial Property business continues showing a recurrent income giving the company stability and solidity, representing 95%
AUDIOCAST PRESENTATION H1/2018
 AUDIOCAST PRESENTATION H1/2018 IRREPLACEABLE AND MULTI-FUNCTIONAL ASSETS IN GROWING CATCHMENTS 2 WE CONTINUE OUR TRANSFORMATION JOURNEY 2011 H1/2018 GOAL 2022 41 # OF SHOPPING # OF SHOPPING 78 30 CENTRES
2015 ANNUAL RESULTS WEBCAST 16 FEBRUARY 2016
 ANNUAL RESULTS WEBCAST 16 FEBRUARY 2016 DISCLAIMER The information contained in this document has not been independently verified. No representation, warranty or undertaking, express or implied, is made
9M 2016 Results TLG IMMOBILIEN AG November M 2016 Results Presentation
 9M 2016 Results TLG IMMOBILIEN AG November 2016 DISCLAIMER This presentation includes statements, estimates, opinions and projections with respect to anticipated future performance of TLG IMMOBILIEN ("Forward-Looking
Rental income, SEK million 1,016 1,040 3,051 3,095 4,109 Growth in rental income comparable properties, percent
 Akelius Residential Property AB (publ) interim report January to September summary Jul Sep Jul Sep Jan Sep Jan Sep Jan Dec Rental income, SEK million 1,016 1,040 3,051 3,095 4,109 Growth in rental income
MTR Corporation Interim Results. 7 August 2007
 MTR Corporation 2007 Interim Results 7 August 2007 2007/8/7 Page 1 Results highlights and business overview Mr. CK Chow, CEO 2007/8/7 Page 2 First half 2007 achievements Merger Key legislative process
Presentation for REITs Symposium 2016
 Presentation for REITs Symposium 2016 4 June 2016 Important Notice This presentation shall be read in conjunction with OUE Commercial REIT s Financial Results announcement for 1Q 2016 dated 10 May 2016.
Rental income, EUR million Like-for-like growth in rental income, percent
 Akelius Residential Property AB (publ) interim report January to June summary Apr Jun Apr Jun Jan Jun Jan Jun Jan Dec Rental income, EUR million 115 113 233 229 469 Like-for-like growth in rental income,
2017 Half-year results LEADING DEVELOPER IN FRENCH GATEWAY CITIES
 2017 Half-year results LEADING DEVELOPER IN FRENCH GATEWAY CITIES DISCLAIMER This presentation has been prepared for information purposes only, and is intended to supplement other information published
This document does not constitute an offer to sell or an invitation or solicitation of an offer to subscribe for or purchase any securities, and
 This document has been prepared by Atrium (the Company ). This document is not to be reproduced nor distributed, in whole or in part, by any person other than the Company. The Company takes no responsibility
Interim presentation. 24 April, Anders Nissen, CEO Liia Nõu, CFO
 Interim presentation 24 April, 2018 Anders Nissen, CEO Liia Nõu, CFO A stable earnings development 21% Return on equity 2 1 2 3 Profitable acquisitions Positive effects from product development A seasonally
Rental income, EUR million** Like-for-like growth in rental income, percent Net operating income, EUR million
 Akelius Residential Property AB (publ) interim report January to March summary* Jan Mar Jan Mar Jan Dec Rental income, EUR million** 119 116 469 Like-for-like growth in rental income, percent 3.7 5.4 5.1
Rental income, SEK million 1,071 1,014 4,122 4,109 Growth in rental income comparable properties, percent
 Akelius Residential Property AB (publ) year-end report January to December summary Oct Dec Oct Dec Jan Dec Jan Dec Rental income, SEK million 1,071 1,014 4,122 4,109 Growth in rental income comparable
A PURE PLAYER IN PROPERTY DEVELOPMENT IN FRANCE 2017 ANNUAL RESULTS
 A PURE PLAYER IN PROPERTY DEVELOPMENT IN FRANCE 2017 ANNUAL RESULTS Disclaimer This presentation has been prepared for information purposes only, and is intended to supplement other information published
Rental income, EUR million Like-for-like growth in rental income, percent
 Akelius Residential Property AB (publ) year-end report January to December summary Oct Dec Oct Dec Jan Dec Jan Dec Rental income, EUR million 129 124 482 469 Like-for-like growth in rental income, percent
HIAG Immobilien Half-Year Results 2015 September 1 st, HIAG Immobilien 1
 Half-Year Results 2015 September 1 st, 2015 1 Disclaimer The financial data as well as the other information presented herein constitute selected information. The information in this presentation does
2018 HALF-YEAR RESULTS
 2018 HALF-YEAR RESULTS WEBCAST 25 JULY 2018 Disclaimer The information contained in this document has not been independently verified. No representation, warranty or undertaking, express or implied, is
Montea Space for Growth
 Montea Space for Growth 1 Table of content About Montea Real estate portfolio Space for Growth: Main objectives & Pipeline Outlook Financials 2 About Montea REIT listed on the NYSE Euronext Brussels &
FY 2015 Results TLG IMMOBILIEN AG March FY 2015 Results Presentation
 FY 2015 Results TLG IMMOBILIEN AG March 2016 DISCLAIMER This presentation includes statements, estimates, opinions and projections with respect to anticipated future performance of TLG IMMOBILIEN ("Forward-Looking
Opening of the first coworking centre in the Triomphe building
 Press release Regulated information 09 May 2018 5:40 PM Opening of the first Silversquare @Befimmo coworking centre in the Triomphe building EPRA earnings of 0.98 per share, in line with the outlook Net
Sirius Real Estate Ltd Half Year Presentation 2013
 Sirius Real Estate Ltd Half Year Presentation 2013 Who are we We are a leading provider of branded mixed-use flexible workspace in Germany 2 Financial Highlights Substantial increase in recurring profit
Net rental income increased by 25.36% to EUR million
 INTERIM STATEMENT OF THE BOARD OF DIRECTORS THIRD QUARTER 2018-2019 1 (closed on 31.12.2018) Net rental income increased by 25.36% to EUR 69.52 million EPRA Earnings 2 for the third quarter of financial
M A R C H 22,
 MARCH 22, 2017 1 01 2 ADO THE PURE-PLAY BERLIN RESIDENTIAL SPECIALIST Investment highlights 1 2 3 4 Berlin residential pure play with a 2.3bn quality portfolio Efficient, fully integrated and scalable
Rental income, EUR million Like-for-like growth in rental income, percent
 Akelius Residential Property AB (publ) interim report January to September summary Jul Sep Jul Sep Jan Sep Jan Sep Jan Dec Rental income, EUR million 120 116 353 345 469 Like-for-like growth in rental
INTERIM FINANCIAL STATEMENTS. for the period ended on March,
 INTERIM FINANCIAL STATEMENTS for the period ended on March, 31 2015 INDEX 1. Key aspects 5 2. Consolidated profit & loss account 9 3. Consolidated balance sheet 11 4. EPRA metrics 14 5. Significant events
ONE YEAR AFTER LAUNCHING ITS STRATEGIC PLAN, ICADE REPORTS SIGNIFICANTLY IMPROVED 2016 FULL-YEAR RESULTS
 PRESS RELEASE Paris, February 13, 2017, 7:30 a.m. ONE YEAR AFTER LAUNCHING ITS STRATEGIC PLAN, ICADE REPORTS SIGNIFICANTLY IMPROVED 2016 FULL-YEAR RESULTS NCCF per share: 4.41, i.e. +8.3% Portfolio value:
Interim presentation. 13 July, Anders Nissen, CEO Liia Nõu, CFO
 Interim presentation 13 July, 2018 Anders Nissen, CEO Liia Nõu, CFO Profitable growth 20% R12M Return on equity 2 1 2 3 Profitable acquisitions in new large markets Continued strong development in Brussels
CONSOLIDATED STATEMENT OF INCOME
 CONSOLIDATED STATEMENT OF INCOME (unaudited, data converted from the Euro to the US Dollar (for information concerning this restatement, see Note 11 to these Consolidated Financial Statements)) 1 st quarter
NBG PANGAEA REIC April 2017
 NBG PANGAEA REIC April 2017 Disclaimer This presentation has been prepared by NBG PANGAEA Real Estate Investment Company (former MIG Real Estate REIC or the Company) solely for information purposes and
DEMIRE Deutsche Mittelstand Real Estate AG Conference Call 1H 2018 Results
 DEMIRE Deutsche Mittelstand Real Estate AG Conference Call 1H 2018 Results 16 Disclaimer This document is for informational purposes only. This document is not intended to form the basis of any investment
CONSOLIDATED STATEMENT OF INCOME
 CONSOLIDATED STATEMENT OF INCOME 1 st quarter (a) 2017 4 th quarter Sales 41,183 42,275 32,841 Excise taxes (5,090) (5,408) (5,319) Revenues from sales 36,093 36,867 27,522 Purchases, net of inventory
LEADING PROPERTY DEVELOPER IN FRANCE 2018 HALF-YEAR RESULTS
 LEADING PROPERTY DEVELOPER IN FRANCE 2018 HALF-YEAR RESULTS Disclaimer This presentation has been prepared for information purposes only, and is intended to supplement other information published by Altarea
Substantial growth in turnover as at 30 September 2011
 Press Release Paris, 19 October 2011 Substantial growth in turnover as at 30 September 2011 Turnover of 1,065.8 million euros in the first 9 months of 2011, an increase of 11% compared with 2010; Turnover
Board of Directors' Report on the Corporation's State of Affairs
 Board of Directors' Report on the Corporation's State of Affairs Brack Capital Properties NV (hereinafter: "the Company") hereby submits the Board of Directors' report for a period of six months ending
2013 Half Year Results
 2013 Half Year Results 31 July 2013 Geopost, Enfield An active and successful period Strong operational performance Lettings up 30% Good momentum in development pipeline Further cost savings achieved Portfolio
Q BUSINESS ACTIVITY AND REVENUE WEBCAST 25 APRIL 2017
 BUSINESS ACTIVITY AND REVENUE WEBCAST 25 APRIL 2017 DISCLAIMER The information contained in this document has not been independently verified. No representation, warranty or undertaking, express or implied,
Institutional Presentation IIIQ FY 2018
 Institutional Presentation IIIQ FY 2018 www.irsa.com.ar IRSA: Leading Real Estate Company in Argentina Largest Real Estate Company in Argentina with opportunistic investments abroad 63.8% 86.34% HOTELS
Q3 UPDATE. 22 October 2015
 Q3 UPDATE 22 October 2015 MANAGEMENT AGENDA 2015 2016 CONTINUE STRONG OPERATIONAL PERFORMANCE LfL rental growth > 100bps above index 2015: on-track; 2016: under review Occupancy 1% up per year (base: 93.5%
Investor Presentation First Half Results
 Investor Presentation 2010 First Half Results 1 Disclaimer This document has been prepared by ANF Immobilier SA ( ANF Immobilier ) solely for the use of presentations made to investors or analysts. ANF
SITE CENTERS NOVEMBER 2018
 SITE CENTERS NOVEMBER 2018 JOINT VENTURE WITH CHINESE INSTITUTIONAL INVESTORS $607MM JOINT VENTURE ALLOWS SITE CENTERS TO ACCELERATE OPPORTUNISTIC INVESTING AND FURTHER IMPROVE THE BALANCE SHEET Dividend
FIRST HALF 2011 RESULTS
 Paris, August 31, 2011 FIRST HALF 2011 RESULTS Rents up 33%, +12% on a like-for-like basis, ahead of forecasts 15% increase in recurring cash flow EPRA NAV = 40.5 per share Debt ratio of 30% - cash flow
Interim statement by the board of directors for the third quarter of 2018
 Regulated information - embargo till 24/10/2018, 6 pm Antwerp, 24 October 2018 for the third quarter of 2018 Growth by 11% of the real estate portfolio: 735 million as at 30 September 2018 ( 663 million
Half-year financial report 2010
 ANF Immobilier Half-year financial report 2010 First half 2010 results: Follow-on strong growth in rents and cash flow Rents up 7.2% on a like-for-like basis EBITDA margin improves by 2.3 points to 80.6%
News Release. PS Business Parks, Inc. 701 Western Avenue P.O. Box Glendale, CA
 News Release PS Business Parks, Inc. 701 Western Avenue P.O. Box 25050 Glendale, CA 91221-5050 www.psbusinessparks.com For Release: Immediately Date: May 3, 2001 Contact: Mr. Jack Corrigan (818) 244-8080,
SECURITIES AND EXCHANGE COMMISSION. Washington, D.C FORM 8-K CURRENT REPORT
 SECURITIES AND EXCHANGE COMMISSION Washington, D.C. 20549 FORM 8-K CURRENT REPORT PURSUANT TO SECTION 13 OR 15(d) OF THE SECURITIES EXCHANGE ACT OF 1934 Date of Report (Date of earliest event reported):
Institutional Presentation 3Q FY2017
 Institutional Presentation 3Q FY2017 IRSA Commercial Properties (IRCP) at a Glance The leading commercial real estate player in Argentina Largest owner and operator of premium malls and office buildings
SUNTEC REIT FINANCIAL RESULTS. For the 2 nd Quarter and Half Year ended 30 June 2017
 SUNTEC REIT FINANCIAL RESULTS For the 2 nd Quarter and Half Year ended 30 June 2017 26 July 2017 Agenda 03 2Q 17 Highlights 05 Financial Highlights 18 Office Portfolio Performance 25 Retail Portfolio Performance
2013 ANNUAL RESULTS PRESENTATION
 2013 ANNUAL RESULTS PRESENTATION 2013 Annual Results Overview I. Introduction & Property Portfolio at 31 December 2013 II. Rental Activity III. Property Transactions IV. Financial Statements & Results
Our Objectives. Our Strategy
 2005 Third Quarter Report» Management s Discussion and Analysis Management s Discussion and Analysis This Management s Discussion and Analysis has been dated as at November 3, 2005. All dollar amounts
6M17 RESULTS. +5.7% FFO per share YoY % EPS YoY % EPRA NAV YoY +2.6% +3.4% +5.5% +16.3% All bps Occupancy vs 31/12/16
 6M17 RESULTS Trading Update CONSOLIDATED PERFORMANCE +5.7% FFO per share YoY +37.2% EPS YoY +12.2% EPRA NAV YoY Excellent set of results showing robust generation of cash flow FFO per share of 0.32 (+5.7%
2016 FULL-YEAR RESULTS WEBCAST 21 FEBRUARY 2017
 FULL-YEAR RESULTS WEBCAST 21 FEBRUARY 2017 DISCLAIMER The information contained in this document has not been independently verified. No representation, warranty or undertaking, express or implied, is
Glendale, California - PS Business Parks, Inc. (AMEX: PSB), reported operating results for the fourth quarter and the year ending December 31, 2001.
, reported operating results for the fourth quarter and the year ending December 31, 2001.") News Release PS Business Parks, Inc. 701 Western Avenue P.O. Box 25050 Glendale, CA 91221-5050 www.psbusinessparks.com For Release: Immediately Date: January 30, 2002 Contact: Mr. Jack Corrigan (818) 244-8080,
News Release PS Business Parks, Inc. 701 Western Avenue P.O. Box 25050 Glendale, CA 91221-5050 www.psbusinessparks.com For Release: Immediately Date: January 30, 2002 Contact: Mr. Jack Corrigan (818) 244-8080,
2018 Q3: TENANTS FIRST Putting the needs of our tenants at the centre of everything we do. 26 October 2018
 2018 Q3: TENANTS FIRST Putting the needs of our tenants at the centre of everything we do 26 October 2018 CONTENT 1 HIGHLIGHTS AND KEY FIGURES 2 NEW NAME 3 MARKET OVERVIEW 4 GENERAL COMPANY OVERVIEW 7
Macquarie Mexican REIT
 Macquarie Mexican REIT Fourth Quarter 2012 Results Presentation February 26, 2013 4Q12 Results Agenda 1. Overview Nick O Neil 2. Highlights & Portfolio Performance Jaime Lara 3. Financials Jaime Lara 2
2017 Interim Results Presentation
 2017 Interim Results Presentation Overview 1 Introduction & Property Portfolio at 30 June 2017 2 First-Half 2017 Rental Activity 3 Property Transactions 4 First-Half 2017 Financial Statements & Results
ANF Immobilier. Analyst Meeting 4/3/2015
 Image 1 ANF Immobilier Analyst Meeting 4/3/2015 2 10 years of ANF Immobilier 04 March 2015 3 Transformation 4 Total Shareholder Return 2005-2015 65 1,09 55 45 0,80 1,86 1,18 1,24 1,36 1,45 1,54 1,69 3,06
UNITED STATES SECURITIES AND EXCHANGE COMMISSION Washington, D.C FORM 10-Q
 UNITED STATES SECURITIES AND EXCHANGE COMMISSION Washington, D.C. 20549 FORM 10-Q ý QUARTERLY REPORT PURSUANT TO SECTION 13 OR 15(d) OF THE SECURITIES EXCHANGE ACT OF 1934 For the Quarterly Period Ended
Q EPRA KEY METRICS
 Q1 EPRA KEY METRICS EPRA KEY METRICS The European Public Real Estate Association (EPRA) is a not-for-profit association based in Brussels that represents the interests of both listed real estate companies
Combined Portfolio valuation movements A4 Landsec s London developments construction contracts A21
 Appendices Contents Page Page Performance A2 Central London office market A19 Top 10 assets by value A3 London office market take-up A20 Combined Portfolio valuation movements A4 Landsec s London developments
OPTIBASE LTD. ANNOUNCES THIRD QUARTER RESULTS
 Media Contacts: Amir Philips, CEO, Optibase Ltd. 011-972-73-7073-700 info@optibase-holdings.com Investor Relations Contact: Marybeth Csaby, for Optibase +1-917-664-3055 Marybeth.Csaby@gmail.com OPTIBASE
Corporate Presentation 4 th Quarter 2018 Financial Results
 Corporate Presentation 4 th Quarter 2018 Financial Results 17 January 2019 Important Notice This presentation is for information only and does not constitute an invitation or offer to acquire, purchase
 www.altareacogedim.com DISCLAIMER This presentation has been prepared for general information purposes only, as a complement to the informations already released by Altarea Cogedim, which the lectors are
NBG PANGAEA REIC September 2016
 NBG PANGAEA REIC September 2016 Disclaimer This presentation has been prepared by NBG PANGAEA Real Estate Investment Company (former MIG Real Estate REIC or the Company) solely for information purposes
Hansteen Interim Results. Heads of the Valley, Rhymney
 2018 Interim Results Heads of the Valley, Rhymney Investor and Analyst Presentation 22 August 2018 Introduction Urban industrial / logistics specialist Seven regional UK offices High yielding built portfolio
Telefonplan Stockholm Property AB (publ) REPORT FOR THE PERIOD January 1 December 31, 2015
 REPORT FOR THE PERIOD January 1 December 31, 2015") REPORT FOR THE PERIOD January 1 December 31, 2015 Image: View of Timotejen 19 Corp. Reg. No. 556708-3588 Telefonplan Stockholm Property AB (publ) REPORT FOR THE PERIOD January 1 December 31, 2015 JANUARY
REPORT FOR THE PERIOD January 1 December 31, 2015 Image: View of Timotejen 19 Corp. Reg. No. 556708-3588 Telefonplan Stockholm Property AB (publ) REPORT FOR THE PERIOD January 1 December 31, 2015 JANUARY
Institutional Presentation 2Q FY2017
 Institutional Presentation 2Q FY2017 IRSA Commercial Properties (IRCP) at a Glance The leading commercial real estate player in Argentina Largest owner and operator of premium malls and office buildings
2016 Annual Results Presentation
 2016 Annual Results Presentation 13 FEBRUARY 2017 Overview 1 Introduction & Property Portfolio at 31 December 2016 2 2016 Rental Activity 3 Property Transactions 4 Financial Statements & Results Appendices
IMPACT OF APPLICATION OF IFRS15 AND IFRS16 ACCOUNTING STANDARDS
 IMPACT OF APPLICATION OF IFRS15 AND IFRS16 ACCOUNTING STANDARDS July 6, 2018 Publicis Groupe SA [Euronext Paris: FR0000130577, CAC40] has applied IFRS15 Revenue accounting standard since January 1, 2018
FINANCIAL YEAR 2012 RESULTS
 FINANCIAL YEAR 2012 RESULTS 31 January 2013 Contents Financial Highlights FY 2012 Portfolio Update KLCA & Cyberjaya Office Market Outlook Klang Valley & Penang Retail Market Outlook Conclusion 2 Important
FOR IMMEDIATE RELEASE AUGUST 2, 2018 ARTIS REAL ESTATE INVESTMENT TRUST RELEASES SECOND QUARTER RESULTS
 FOR IMMEDIATE RELEASE AUGUST 2, 2018 ARTIS REAL ESTATE INVESTMENT TRUST RELEASES SECOND QUARTER RESULTS Today Artis Real Estate Investment Trust ( Artis or the "REIT") issued its financial results and
PRESENTATION RESULTS Q Aldar Q Results
 Q1 2018 RESULTS PRESENTATION DISCLAIMER This disclaimer governs the use of this presentation. You must not rely on the information in the presentations and alternatively we recommend you to seek advice
ATRIUM Q RESULTS ANALYST AND INVESTOR CALL. 18 May 2016
 ATRIUM Q1 2016 RESULTS ANALYST AND INVESTOR CALL 18 May 2016 KEY EVENTS IN 2016 YTD OPERATIONAL PERFORMANCE Core Markets¹: NRI increased 1.2% to 36.3m; LFL NRI remained stable at 31.4m Russia continues
RESI Update 4 th Quarter 2016
 RESI Update 4 th Quarter 2016 Supplemental Investor Information George Ellison, CEO Robin Lowe, CFO 2017 Altisource Residential Corporation. All rights reserved. Forward Looking Statements This presentation
Advanced M&A and Merger Models Quiz Questions
 Advanced M&A and Merger Models Quiz Questions Transaction Assumptions and Sources & Uses Purchase Price Allocation & Balance Sheet Combination Combining the Income Statement Revenue, Expense, and CapEx
Real Estate & REIT Modeling: Quiz Questions Module 1 Accounting, Overview & Key Metrics
 Real Estate & REIT Modeling: Quiz Questions Module 1 Accounting, Overview & Key Metrics 1. How are REITs different from normal companies? a. Unlike normal companies, REITs are not required to pay income
Sunway Berhad TP: RM3.27 (+10.6%) Acquires Industrial Land Parcels in Selangor
 Acquires Industrial Land Parcels in Selangor") A Member of the TA Group MENARA TA ONE, 22 JALAN P. RAMLEE, 50250 KUALA LUMPUR, MALAYSIA TEL: +603-20721277 / FAX: +603-20325048 C O M P A N Y U P D A T E Monday, 22 February 2016 FBMKLCI: 1,674.88 Sector:
A Member of the TA Group MENARA TA ONE, 22 JALAN P. RAMLEE, 50250 KUALA LUMPUR, MALAYSIA TEL: +603-20721277 / FAX: +603-20325048 C O M P A N Y U P D A T E Monday, 22 February 2016 FBMKLCI: 1,674.88 Sector:
H RESULTS INVESTORS PRESENTATION 23 AUGUST 2018
 H1 2018 RESULTS 1 INVESTORS PRESENTATION 23 AUGUST 2018 CONTENTS Key highlights H1 2018 Portfolio Development projects Operations and financials Additional materials 2 STRONG OPERATING PERFORMANCE WITH
Strong management team
 Strong management team Stable & transparent REIT framework Solid operational performance Top quality shareholder base High quality property portfolio 1 A strong management team Unprecedented learning curve
Strong progress for Property Management
 Strong progress for Property Management Interim report January-June 2016 Stockholm, 18 August 2016 Anders Nissen, CEO Liia Nõu, CFO Forward-looking statements PANDOX EXCELLENCE IN HOTEL OWNERSHIP & OPERATIONS
Best Practices Recommendations. Q&A November EPRA Best Practices Recommendations Q&A November
 Best Practices Recommendations Q&A November 2016 EPRA Best Practices Recommendations Q&A November 2016 1 Contents 1. Introduction 03 2. General Recommendations 04 3. EPRA Earnings 05 4. EPRA NAV 15 5.
Japan Real Estate Investment Corporation Performance Review for Fiscal Period Ended September 30, 2016 November 16, 2016
 Japan Real Estate Investment Corporation Performance Review for Fiscal Period Ended September 30, 2016 November 16, 2016 Message from President & CEO I would like to express our sincere appreciation that