BOARD OF COUNTY COMMISSIONERS INDIAN RIVER COUNTY, FLORIDA
|
|
|
- Robert Bradley
- 5 years ago
- Views:
Transcription

1 BOARD OF COUNTY COMMISSIONERS INDIAN RIVER COUNTY, FLORIDA IMPACT FEE UPDATE WORKSHOP AGENDA THURSDAY, MARCH 6, :30 P.M. County Commission Chamber Indian River County Administration Complex th Street, Building A Vero Beach, Florida, COUNTY COMMISSIONERS Sandra L. Bowden, Chairman District 5 Joseph A. Baird, County Administrator Wesley S. Davis, Vice Chairman District 1 William G. Collins II, County Attorney Joseph E. Flescher District 2 Jeffrey K. Barton, Clerk to the Board Peter D. O Bryan District 4 Gary C. Wheeler District 3 1. CALL TO ORDER 1:30 P.M. 2. PLEDGE OF ALLEGIENCE 3. PRESENTATIONS A. STAFF OVERVIEW OF IMPACT FEES B. IMPACT FEE TASK FORCE PRESENTATION OF IMPACT FEE TASK FORCE REPORT C. D. TREASURE COAST BUILDERS ASSOCIATION PRESENTATION OF IMPACT FEE ANALYSIS REPORT CONSULTANT PRESENTATION OF IMPACT FEE UPDATE REPORT 4. PUBLIC DISCUSSION February 5, 2008 Page 1 of 2
2 5. QUESTION & ANSWER SESSION 6. ADJOURNMENT Anyone who may wish to appeal any decision which may be made at this meeting will need to ensure that a verbatim record of the proceedings is made which includes the testimony and evidence upon which the appeal will be based. Anyone who needs a special accommodation for this meeting may contact the County s Americans with Disabilities Act (ADA) Coordinator at (772) (TDD # ) at least 48 hours in advance of meeting. The full agenda is available on line at the Indian River County Website at The full agenda is also available for review in the Board of County Commission Office, the Indian River County Main Library, the IRC Courthouse Law Library, and the North County Library. Commission Meeting may be broadcast live by Comcast Cable Channel 27 Rebroadcasts continuously with the following proposed schedule: Wednesday at 9:00 a.m. until 5:00 p.m., Thursday at 1:00 p.m. through Friday Morning, and Saturday at 12:00 Noon to 5:00 p.m. February 5, 2008 Page 2 of 2
 in association with Dr. James C. Nicholas Thomas G. Wright, Esq.")
3 Impact Fee Update Indian River County, Florida Technical Memorandum #3 (Revised) in association with Dr. James C. Nicholas Thomas G. Wright, Esq. July 2007
4 Table of Contents EXECUTIVE SUMMARY...1 INTRODUCTION...7 Legal Framework...7 Level of Service...10 Service Areas...12 TRAFFIC...13 Major Roadway System...14 Current Level of Service...14 Cost per Service Unit...16 Revenue Credits...21 Travel Demand...28 Updated Fee Schedule...32 Revenue Projections...36 SCHOOLS...37 Current Level of Service...37 Cost Component...42 Revenue Credits...45 Student Generation Rate...48 Updated Impact Fee Schedule...51 Revenue Projections...51 PARKS...53 Current Level of Service...54 Revenue Credits...58 Updated Impact Fee Schedule...61 Revenue Projections...62 LIBRARIES...63 Current Level of Service...63 Revenue Credits...65 Updated Impact Fee Schedule...69 Revenue Projections...69 FIRE RESCUE...70 Current Level of Service...71 Revenue Credits...73 Updated Impact Fee Schedule...76 Revenue Projections...79 LAW ENFORCEMENT...80 Current Level of Service...80 Revenue Credits...82 Updated Impact Fee Schedule...85 Revenue Projections...89 CORRECTIONS...90 Current Level of Service...90 Revenue Credits...92 Updated Impact Fee Schedule...95 Revenue Projections...98
5 PUBLIC BUILDINGS...99 Current Level of Service...99 Current Level of Service Revenue Credits Updated Impact Fee Schedule Revenue Projections SOLID WASTE Service Unit Current Level of Service Revenue Credits Updated Impact Fee Schedule Revenue Potential APPENDIX A: POPULATION AND DEMOGRAPHICS APPENDIX B: FUNCTIONAL POPULATION APPENDIX C: MAJOR ROADWAY INVENTORY APPENDIX D: PARK INVENTORY APPENDIX E: AVERAGE LAND COSTS List of Tables Table 1. Summary of Updated Impact Fees by Fee Type and Generalized Land Use...2 Table 2. Summary of Total Impact Fees by Detailed Land Use...3 Table 3. Existing Impact Fees by Detailed Land Use Type...5 Table 4. Updated Impact Fees by Detailed Land Use Types...6 Table 5. Existing Major Roadway System Level of Service...15 Table 6. Planned Improvement Costs...18 Table 7 Weighted Average Cost per Lane-Mile...19 Table 8. Capacity Added by Planned Road Improvements...20 Table 9. Road Cost per Vehicle-Mile...21 Table 10. Fuel Tax Distribution per Penny per Gallon, FY Table 11. Historic Local Option Gas Tax Funding, FY Table 12. Historic Optional Sales Tax Funding, FY Table 13. Future Local Option Gas Tax Funding, FY Table 14. Future Optional Sales Tax Funding, FY Table 15. Local Funding Credit per Gallon...24 Table 16. FDOT Work Program, FY Table 17. FDOT Work Program, FY Table 18. State Road Projects in 2030 LRTP, FY 2013 to Table 19. Federal/State Gas Tax Funding Credit per Gallon...27 Table 20. Road Credit per Vehicle-Mile...27 Table 21. Vehicle-Miles of Travel on Major Roadway System...29 Table 22. Expected Local Vehicle-Miles of Travel...30 Table 23. Trip Length Calibration Factor...30 Table 24. Travel Demand Schedule...31 Table 25. Updated Traffic Impact Fee Schedule...33 Table 26. Comparison of Current and Updated Traffic Impact Fees...34
6 Table 27. Traffic Impact Fee Revenue Estimates...36 Table 28. Inventory of Public Schools, Table 29. Public School Enrollment and Capacity, Table 30. Recent School Construction Costs...42 Table 31. Estimated Local School Building Costs per Square Foot...43 Table 32. School Bus Cost per Student...44 Table 33. School Capital Cost per Student...45 Table 34. Planned School Capital Expenditures and Revenues, Table 35. School State Revenue Credit...47 Table 36. School Capital Improvements Tax Revenue Credit...47 Table 37. School Past Property Tax Credit Percentage...48 Table 38. School Net Cost per Student...48 Table 39. Uncalibrated Student Generation Rates, Table 40. Calibrated Student Generation Rates, Table 41. Comparison of Student Generation Rates...50 Table 42. Updated School Impact Fee Schedule...51 Table 43. Comparative School Impact Fees...51 Table 44. School Demand and Cost Analysis, Table 45. School Impact Fee Revenue Estimates...52 Table 46. Current Parks and Recreation Level of Service...54 Table 47. Landscaping and Site Improvements Cost per Acre...55 Table 48. Utilities and Paving Cost per Acre...55 Table 49. Total Land Cost per Developed Acre...56 Table 50. Parks Facility Replacement Cost...57 Table 51. Total Park Cost per Person...58 Table 52. Historical Park Improvements, Table 53. Planned Park Improvements, Table 54. Park Annual Revenue Credit per Person...60 Table 55. Park Past Property Tax Percentage...61 Table 56. Park Net Cost per Person...61 Table 57. Updated Park Impact Fee Schedule...62 Table 58. Comparative Park Impact Fees...62 Table 59. Park Impact Fee Revenue Estimates...62 Table 60. Library Building and Land Replacement Cost...64 Table 61. Library Building Cost per Square Foot...64 Table 62. Library Land Cost per Acre...64 Table 63. Library Collections Replacement Cost...65 Table 64. Library Cost per Person...65 Table 65. Historical Library Improvements, Table 66. Library Annual Revenue Credit per Person...67 Table 67. Library Past Property Tax Percentage...68 Table 68. Library Net Cost per Person...68 Table 69. Updated Library Impact Fee Schedule...69 Table 70. Comparative Library Impact Fees...69 Table 71. Library Impact Fee Revenue Estimates...69 Table 72. Fire Rescue Building and Land Cost...71 Table 73. Fire Rescue Vehicle Cost...71 Table 74. Fire Rescue Capital Equipment Cost...72
7 Table 75. Fire Rescue Cost per Functional Population...72 Table 76. Historical Fire Rescue Improvements, Table 77. Planned Fire Rescue Improvements, Table 78. Fire Rescue Annual Credit per Functional Population...75 Table 79. Fire Rescue Net Cost per Functional Population...76 Table 80. Updated Fire Rescue Net Cost Schedule...76 Table 81. Comparative Fire Rescue Impact Fees...78 Table 82. Fire Rescue Impact Fee Revenue Estimates...79 Table 83. Law Enforcement Building and Land Cost...81 Table 84. Law Enforcement Cost per Building Square Foot...81 Table 85. Law Enforcement Vehicle and Equipment Cost...82 Table 86. Law Enforcement Cost per Functional Population...82 Table 87. Historical Law Enforcement Improvements, Table 88. Law Enforcement Annual Credit per Functional Population...84 Table 89. Law Enforcement Past Property Tax Percentage...84 Table 90. Law Enforcement Net Cost per Functional Population...85 Table 91. Updated Law Enforcement Impact Fee Schedule...86 Table 92. Comparative Law Enforcement Fees...88 Table 93. Law Enforcement Impact Fee Revenue Estimates...89 Table 94. Corrections Building and Land Cost...91 Table 95. Corrections Vehicle and Equipment Cost...91 Table 96. Corrections Cost per Functional Population...92 Table 97. Historical Corrections Improvements, Table 98. Corrections Annual Credit per Functional Population...94 Table 99. Corrections Past Property Tax Percentage...94 Table 100. Corrections Net Cost per Functional Population...95 Table 101. Updated Corrections Impact Fee Schedule...95 Table 102. Comparative Corrections Impact Fees...97 Table 103. Corrections Impact Fee Revenue Estimates...98 Table 104. Public Buildings Facility and Land Cost Table 105. Public Buildings Cost per Functional Population Table 106. Historical Public Buildings Improvements, Table 107. Public Buildings Annual Credit per Functional Population Table 108. Public Buildings Past Property Tax Percentage Table 109. Public Buildings Net Cost per Functional Population Table 110. Updated Public Buildings Impact Fee Schedule Table 111. Comparative Public Buildings Impact Fees Table 112. Public Buildings Impact Fee Revenue Estimates Table 113. Waste Generation Units by Land Use Type Table 114. Total Existing Waste Generation Units Table 115. Convenience Center Cost per Residential WGU Table 116. Recycling Cost per WGU Table 117. Landfill Acreage and Capacity Table 118. Landfill Land and Vehicle Cost Table 119. Landfill Class I Recoupment Cost per WGU Table 120. Solid Waste Cost Summary per WGU Table 121. Updated Solid Waste Impact Fee Schedule Table 122. Comparative Solid Waste Impact Fees...120
8 Table 123. Solid Waste Impact Fee Revenue Estimates Table 124. Persons per Unit, Table 125. Person per Single-Family Unit by Size, U.S Table 126. Persons per Unit, with Single-Family Tiering Table 127. Existing Housing Units and Population, Table 128. Permanent, Year-Round Population, Table 129. Functional Population per Unit for Residential Land Uses Table 130. Functional Population per Unit for Nonresidential Land Uses Table 131. Total Functional Population by Service Area, Table 132. Functional Population, Table 133. Existing Major Roadway Inventory Principal Arterial Roads Table 134. Existing Major Roadway Inventory Minor Arterial Roads Table 135. Existing Major Roadway Inventory Collector Roads Table 136. Existing Park Inventory Table 137. Average Land Cost, 40-to-160-Acre Parcels, Table 138. Average Land Cost, 4-to-6-Acre Parcels, List of Figures Figure 1. Population Growth, Figure 2. Indian River County 2030 Planned Roadway Improvements...17 Figure 3. Locations of Existing Public Schools...38 Figure 4. Location of Existing County Parks...53 Figure 5. Locations of Existing Library Facilities...63 Figure 6. Fire Station Locations...70 Figure 7. Public Building Locations Map...99 Figure 8. Solid Waste Locations Figure 9. Layout of the Existing Landfill Site Figure 10. Nonresidential Functional Population Formula...126
9 EXECUTIVE SUMMARY This report updates Indian River County s traffic, schools, parks, libraries, fire rescue, law enforcement, corrections, public buildings and solid waste impact fees. With the exception of the traffic impact fee, which the County has had for some time and which was updated a year earlier, the current fees were adopted in 2005 based on Tindale-Oliver & Associates, Indian River County Impact Fee Study, May 2005 (referred to here as the previous study ). The current traffic impact fee was adopted in 2004 based on Tindale-Oliver & Associates, Update of the Traffic Impact Fee Ordinance, February Several deviations from the methodology used in the previous study were made to simplify the impact fee system. The first major change was to base all of the updated fees at or below the existing level of service. The previous study had based several of the fees on the higher level of service anticipated to be provided in five years. In this study, the corrections and public buildings fees are based on a future level of service that is somewhat lower than the current level of service, in recognition of the fact that the current major jail and public building expansions to be completed this year will not be repeated in the near future. Another major deviation from the methodology employed in the previous study for four of the facilities addressed in this report (fire rescue, law enforcement, corrections and public buildings) is a significant simplification of the functional population calculations. For the most part, this change has little effect on the resulting impact fees. The one exception is the fee for public buildings. The previous study used an 11-hours-per-day, 5-days-per-week functional population for public buildings, rather than the 24-hours-per-day, 7-days-per-week functional population used for the other three facilities. This had the effect of putting most of the burden of public building costs on nonresidential development, since few people are home during the daylight weekday hours when public buildings are open. In this update, the 24-hours-per-day functional population approach has been used for all four facilities. This change results in higher public building impact fees for residential land uses and lower fees for nonresidential land uses, although overall revenues will increase significantly. Major changes are also proposed for the solid waste fee methodology. The previous study based the fees on the percent of the cost of incremental landfill improvements (such as creating new disposal cells) attributable to the disposal of waste from new development, and attributed convenience center costs to all development. This study recoups the cost of upfront landfill investments (land and heavy machinery) that will be consumed by new development, and allocates convenience center costs only to residential development. This latter change has the effect of significantly reducing solid waste fees for nonresidential land uses. In addition, overall fee revenues will decline somewhat, even if growth continues as in the recent past. In Table 1 below, the current and updated amounts for all of the County s impact fees are shown by fee type for five typical land uses (2,000-square-foot single-family unit, multi-family unit, 1,000 square feet of retail in a 100,000 square-foot shopping center, 1,000 square feet of office in a 100,000 square-foot office building, and 1,000 square feet of industrial). Residential fees increase more than nonresidential fees, due primarily to significant increases in school and park fees, which are paid only by residential development. Impact Fee Update, Technical Memo #3 (Revised) Duncan Associates Indian River County, Florida 1 July 19, 2007
10 Table 1. Summary of Updated Impact Fees by Fee Type and Generalized Land Use Impact Fee/Land Use Type Impact Unit Current Proposed Increase/ Decrease Percent Change Traffic Dwelling $5,202 $8,073 $2,871 55% Schools Dwelling $1,756 $4,459 $2, % Parks Dwelling $1,463 $2,488 $1,025 70% Libraries Dwelling $483 $552 $69 14% Fire Rescue Dwelling $278 $326 $48 17% Law Enforcement Dwelling $245 $348 $103 42% Corrections Dwelling $170 $215 $45 26% Public Buildings Dwelling $206 $408 $202 98% Solid Waste Dwelling $75 $82 $7 9% Total, Single-Family (2,000 sf)* Dwelling $9,878 $16,951 $7,073 72% Traffic Dwelling $2,842 $4,418 $1,576 55% Schools Dwelling $500 $1,091 $ % Parks Dwelling $884 $1,344 $460 52% Libraries Dwelling $285 $298 $13 4% Fire Rescue Dwelling $176 $176 $0 0% Law Enforcement Dwelling $148 $188 $40 27% Corrections Dwelling $100 $116 $16 16% Public Buildings Dwelling $121 $220 $99 81% Solid Waste Dwelling $57 $62 $5 10% Total, Multi-Family Dwelling $5,114 $7,913 $2,799 55% Traffic 1,000 sf $7,813 $12,247 $4,434 57% Fire Rescue 1,000 sf $502 $594 $92 18% Law Enforcement 1,000 sf $439 $635 $196 45% Corrections 1,000 sf $312 $391 $79 25% Public Buildings 1,000 sf $1,527 $743 -$784-51% Solid Waste 1,000 sf $236 $41 -$195-83% Total, Retail (100,000 sf) 1,000 sf $10,829 $14,651 $3,822 35% Traffic 1,000 sf $5,326 $8,282 $2,956 56% Fire Rescue 1,000 sf $130 $258 $128 98% Law Enforcement 1,000 sf $114 $276 $ % Corrections 1,000 sf $81 $170 $89 110% Public Buildings 1,000 sf $555 $323 -$232-42% Solid Waste 1,000 sf $94 $16 -$78-83% Total, Office (100,000 sf) 1,000 sf $6,300 $9,325 $3,025 48% Traffic 1,000 sf $2,797 $4,352 $1,555 56% Fire Rescue 1,000 sf $120 $149 $29 24% Law Enforcement 1,000 sf $105 $159 $54 51% Corrections 1,000 sf $75 $98 $23 31% Public Buildings 1,000 sf $512 $186 -$326-64% Solid Waste 1,000 sf $236 $41 -$195-83% Total, General Industrial 1,000 sf $3,845 $4,985 $1,140 * includes single-family detached and single-family attached 30% Source: Traffic, schools, parks, libraries, fire rescue, law enforcement, corrections, public buildings, and solid waste fees from Table 26, Table 43, Table 58, Table 70, Table 81, Table 92, Table 102, Table 111 and Table 122, respectively; fees do not include administrative charge. Impact Fee Update, Technical Memo #3 (Revised) Duncan Associates Indian River County, Florida 2 July 19, 2007
11 Table 2 compares current and updated total impact fees (sum of all nine fee types) for all land uses. For residential land uses, the total fees increase by more than 50 percent; for most nonresidential land uses, the total fees increase by more than 30 percent. Several minor changes were made to the detailed land use categories included in the fee schedules. For administrative ease, movie theaters, which are currently assessed based on the number of screens, and schools, which are currently assessed based on the number of students, are both proposed to be assessed on the basis of square footage. In addition, the very similar government office building and government office complex categories are proposed to be combined in a single government office category (the current fee shown in the table is the government office complex fee). Table 2. Summary of Total Impact Fees by Detailed Land Use Increase/ Decrease Percent Change Land Use Unit Current Updated Residential Single Family* Less than 1,500 sf Dwelling $7,815 $13,778 $5,963 76% 1,500 to 2,499 sf Dwelling $9,878 $16,951 $7,073 72% 2,500 sf or more Dwelling $10,754 $18,321 $7,567 70% Multi-Family/Accessory Dwelling $5,114 $7,913 $2,799 55% Mobile Home Dwelling $4,557 $8,733 $4,176 92% Hotel room $3,920 $5,867 $1,947 50% Motel room $2,413 $3,537 $1,124 47% Nursing Home bed $1,335 $1,731 $396 30% ACLF bed $1,253 $1,556 $303 24% Office Medical Office 1,000 sf $17,693 $25,684 $7,991 45% Bank 1,000 sf $18,713 $27,171 $8,458 45% Bank w/drive-in 1,000 sf $29,615 $44,674 $15,059 51% Office up to 50,000 sf 1,000 sf $9,107 $12,861 $3,754 41% Office over 50,000 sf 1,000 sf $6,300 $9,325 $3,025 48% Research & Dev't Center 1,000 sf NA $5,706 NA NA Industrial Manufacturing 1,000 sf $2,364 $2,857 $493 21% Warehouse 1,000 sf $2,462 $3,379 $917 37% Mini-Warehouse 1,000 sf $1,096 $1,631 $535 49% General Industrial 1,000 sf $3,845 $4,985 $1,140 30% Concrete Plant acre $8,266 $11,075 $2,809 34% Sand Mining acre $1,246 $1,448 $202 16% Retail Retail under 50,000 sf 1,000 sf $12,860 $18,537 $5,677 44% Retail 50, ,000 sf 1,000 sf $10,829 $14,651 $3,822 35% Retail 100, ,000 sf 1,000 sf $9,940 $13,186 $3,246 33% Retail over 200,000 sf 1,000 sf $9,156 $12,958 $3,802 42% Gas Station fuel position $8,411 $11,989 $3,578 43% New and Used Auto Sales 1,000 sf $14,992 $22,240 $7,248 48% Restaurant 1,000 sf $34,118 $48,121 $14,003 41% Fast Food Restaurant 1,000 sf $49,997 $73,071 $23,074 46% Supermarket 1,000 sf $15,690 $22,848 $7,158 46% Auto Repair 1,000 sf NA $9,882 NA NA Car Wash stall $19,146 $28,612 $9,466 49% Convenience Store 1,000 sf $31,015 $45,019 $14,004 45% Furniture Store 1,000 sf $2,137 $2,783 $646 30% Impact Fee Update, Technical Memo #3 (Revised) Duncan Associates Indian River County, Florida 3 July 19, 2007
12 Summary of Total Impact Fees by Detailed Land Use (continued) Increase/ Decrease Percent Change Land Use Unit Current Updated Recreational Golf Course hole $15,507 $22,504 $6,997 45% Racquet/Health/Dance 1,000 sf $8,986 $11,560 $2,574 29% County Park acres $1,002 $1,337 $335 33% Tennis Court court $13,646 $19,316 $5,670 42% Marina berth $1,326 $1,905 $579 44% Governmental Post Office 1,000 sf $18,497 $27,239 $8,742 47% Library 1,000 sf $21,791 $32,642 $10,851 50% Government Office 1,000 sf $11,895 $18,246 $6,352 53% Jail bed $1,218 $841 -$377-31% Miscellaneous Day Care Center 1,000 sf $11,989 $17,469 $5,480 46% Hospital 1,000 sf $7,875 $11,050 $3,175 40% Veterinary Clinic 1,000 sf $6,247 $7,999 $1,752 28% Church 1,000 sf $3,568 $5,168 $1,600 45% Movie Theater 1,000 sf $18,014 $26,758 $8,744 49% School (Elementary) 1,000 sf $3,750 $4,064 $314 8% School (High) 1,000 sf $6,151 $8,147 $1,996 32% School (College) 1,000 sf $19,655 $28,909 $9,254 47% Fire Station 1,000 sf $1,757 $2,237 $480 * includes single-family detached and single-family attached 27% Source: Current and updated total fees are sums of traffic, schools, parks, libraries, fire/rescue, law enforcement, corrections, public buildings and solid waste fees from Table 26, Table 43, Table 58, Table 70, Table 81, Table 92, Table 102, Table 111 and Table 122, respectively; fees do not include administrative charge; current fees for movie theaters and schools, which are based on screens and students, are estimated fees per 1,000 square feet; current fee for government office is actually the fee for government office complex (the old government office building and government office complex categories are combined in the updated schedule). The two following tables summarize existing and updated fees, respectively, for all types of fees and for detailed land use categories. Impact Fee Update, Technical Memo #3 (Revised) Duncan Associates Indian River County, Florida 4 July 19, 2007
13 Table 3. Existing Impact Fees by Detailed Land Use Type Impact Fire Law Public Solid Land Use Unit Traffic School Parks Library Rescue Enf. Jail Bldgs. Waste Total Residential Single Family Less than 1,500 sf Dwelling $3,452 $1,756 $1,302 $430 $247 $218 $151 $183 $75 $7,815 1,500 to 2,499 sf Dwelling $5,202 $1,756 $1,463 $483 $278 $245 $170 $206 $75 $9,878 2,500 sf or more Dwelling $5,838 $1,756 $1,587 $524 $301 $265 $184 $223 $75 $10,754 Multi-Family/Accessory Dwelling $2,842 $500 $884 $285 $176 $148 $100 $121 $57 $5,114 Mobile Home Dwelling $1,957 $623 $942 $349 $182 $158 $123 $149 $75 $4,557 Hotel room $3,271 $160 $140 $99 $229 $21 $3,920 Motel room $1,764 $160 $140 $99 $229 $21 $2,413 Nursing Home bed $560 $172 $151 $107 $312 $33 $1,335 ACLF bed $449 $172 $151 $107 $312 $62 $1,253 Office Medical Office 1,000 sf $15,553 $299 $262 $186 $1,275 $118 $17,693 Bank 1,000 sf $16,289 $341 $299 $212 $1,454 $118 $18,713 Bank w/drive-in 1,000 sf $27,607 $280 $245 $174 $1,191 $118 $29,615 Office up to 50,000 sf 1,000 sf $7,348 $246 $216 $153 $1,050 $94 $9,107 Office over 50,000 sf 1,000 sf $5,326 $130 $114 $81 $555 $94 $6,300 Research & Dev't Center 1,000 sf NA NA NA NA NA NA NA Industrial Manufacturing 1,000 sf $1,533 $88 $77 $55 $375 $236 $2,364 Warehouse 1,000 sf $1,958 $68 $59 $42 $288 $47 $2,462 Mini-Warehouse 1,000 sf $1,003 $13 $12 $8 $40 $19 $1,096 General Industrial 1,000 sf $2,797 $120 $105 $75 $512 $236 $3,845 Concrete Plant acre $6,261 $265 $232 $165 $1,130 $213 $8,266 Sand Mining acre $803 $34 $30 $21 $145 $213 $1,246 Retail Retail under 50,000 sf 1,000 sf $9,837 $503 $441 $312 $1,531 $236 $12,860 Retail 50, ,000 sf 1,000 sf $7,813 $502 $439 $312 $1,527 $236 $10,829 Retail 100, ,000 sf 1,000 sf $6,860 $513 $450 $319 $1,562 $236 $9,940 Retail over 200,000 sf 1,000 sf $6,977 $351 $307 $218 $1,067 $236 $9,156 Gas Station fuel position $6,694 $303 $265 $188 $921 $39 $8,411 New/Used Auto Sales 1,000 sf $13,212 $300 $263 $186 $913 $118 $14,992 Restaurant 1,000 sf $26,646 $1,289 $1,129 $801 $3,923 $330 $34,118 Fast Food Restaurant 1,000 sf $41,971 $1,389 $1,217 $863 $4,227 $330 $49,997 Supermarket 1,000 sf $13,288 $357 $313 $222 $1,087 $424 $15,690 Auto Repair 1,000 sf NA NA NA NA NA NA NA Car Wash stall $17,232 $332 $291 $206 $1,009 $77 $19,146 Convenience Store 1,000 sf $26,459 $746 $653 $463 $2,270 $424 $31,015 Furniture Store 1,000 sf $1,592 $56 $49 $35 $170 $236 $2,137 Recreational Golf Course hole $13,090 $429 $376 $267 $1,307 $38 $15,507 Racquet/Health/Dance 1,000 sf $6,556 $417 $366 $259 $1,270 $118 $8,986 County Park acres $769 $27 $23 $17 $81 $85 $1,002 Tennis Court court $11,368 $408 $357 $253 $1,241 $18 $13,646 Marina berth $1,132 $27 $24 $17 $82 $45 $1,326 Governmental Post Office 1,000 sf $16,518 $312 $273 $194 $1,107 $94 $18,497 Library 1,000 sf $20,023 $302 $265 $188 $919 $94 $21,791 Government Office 1,000 sf $11,205 $238 $209 $148 NA $94 $11,895 Jail bed $449 $153 $134 $0 $466 $16 $1,218 Miscellaneous Day Care Center 1,000 sf $10,555 $177 $155 $110 $755 $236 $11,989 Hospital 1,000 sf $6,267 $275 $241 $171 $838 $83 $7,875 Veterinary Clinic 1,000 sf $4,189 $287 $251 $178 $1,223 $118 $6,247 Church 1,000 sf $3,016 $94 $82 $58 $285 $33 $3,568 Movie Theater 1,000 sf $13,715 $759 $664 $471 $2,309 $96 $18,014 School (Elementary) 1,000 sf $2,003 $242 $199 $142 $994 $170 $3,750 School (High) 1,000 sf $4,723 $193 $166 $120 $829 $120 $6,151 School (College) 1,000 sf $17,319 $309 $275 $189 $1,340 $223 $19,655 Fire Station 1,000 sf $1,158 $0 $97 $69 $339 $94 Source: Table 26, Table 43, Table 58, Table 70, Table 81, Table 92, Table 102, Table 111 and Table 122. $1,757 Impact Fee Update, Technical Memo #3 (Revised) Duncan Associates Indian River County, Florida 5 July 19, 2007
14 Table 4. Updated Impact Fees by Detailed Land Use Types Impact Fire Law Public Solid Land Use Unit Traffic School Parks Library Rescue Enf. Jail Bldgs. Waste Total Residential Single Family Less than 1,500 sf Dwelling $5,356 $4,459 $2,226 $494 $292 $312 $192 $365 $82 $13,778 1,500 to 2,499 sf Dwelling $8,073 $4,459 $2,488 $552 $326 $348 $215 $408 $82 $16,951 2,500 sf or more Dwelling $9,063 $4,459 $2,705 $600 $355 $379 $234 $444 $82 $18,321 Multi-Family/Accessory Dwelling $4,418 $1,091 $1,344 $298 $176 $188 $116 $220 $62 $7,913 Mobile Home Dwelling $3,047 $2,841 $1,584 $352 $208 $222 $137 $260 $82 $8,733 Hotel room $5,078 $197 $211 $130 $247 $4 $5,867 Motel room $2,748 $197 $211 $130 $247 $4 $3,537 Nursing Home bed $878 $213 $227 $140 $266 $7 $1,731 ACLF bed $703 $213 $227 $140 $266 $7 $1,556 Office Medical Office 1,000 sf $24,194 $370 $395 $243 $462 $20 $25,684 Bank 1,000 sf $25,476 $421 $450 $277 $527 $20 $27,171 Bank w/drive-in 1,000 sf $43,175 $372 $397 $245 $465 $20 $44,674 Office up to 50,000 sf 1,000 sf $11,430 $356 $380 $234 $445 $16 $12,861 Office over 50,000 sf 1,000 sf $8,282 $258 $276 $170 $323 $16 $9,325 Research & Dev't Center 1,000 sf $5,063 $158 $168 $104 $197 $16 $5,706 Industrial Manufacturing 1,000 sf $2,383 $109 $116 $72 $136 $41 $2,857 Warehouse 1,000 sf $3,044 $82 $88 $54 $103 $8 $3,379 Mini-Warehouse 1,000 sf $1,562 $16 $18 $11 $21 $3 $1,631 General Industrial 1,000 sf $4,352 $149 $159 $98 $186 $41 $4,985 Concrete Plant acre $9,738 $328 $350 $216 $410 $33 $11,075 Sand Mining acre $1,247 $42 $45 $28 $53 $33 $1,448 Retail Retail under 50,000 sf 1,000 sf $15,522 $748 $799 $492 $935 $41 $18,537 Retail 50, ,000 sf 1,000 sf $12,247 $594 $635 $391 $743 $41 $14,651 Retail 100, ,000 sf 1,000 sf $10,759 $600 $641 $395 $750 $41 $13,186 Retail over 200,000 sf 1,000 sf $10,913 $504 $538 $332 $630 $41 $12,958 Gas Station fuel position $10,495 $374 $399 $246 $468 $7 $11,989 New/Used Auto Sales 1,000 sf $20,563 $417 $445 $274 $521 $20 $22,240 Restaurant 1,000 sf $41,645 $1,614 $1,724 $1,063 $2,018 $57 $48,121 Fast Food Restaurant 1,000 sf $66,142 $1,716 $1,832 $1,130 $2,145 $106 $73,071 Supermarket 1,000 sf $20,861 $481 $514 $317 $601 $74 $22,848 Auto Repair 1,000 sf $9,437 $107 $114 $70 $134 $20 $9,882 Car Wash stall $26,969 $410 $438 $270 $512 $13 $28,612 Convenience Store 1,000 sf $41,698 $816 $872 $538 $1,021 $74 $45,019 Furniture Store 1,000 sf $2,468 $69 $74 $45 $86 $41 $2,783 Recreational Golf Course hole $20,389 $530 $566 $349 $663 $7 $22,504 Racquet/Health/Dance 1,000 sf $10,214 $333 $356 $220 $417 $20 $11,560 County Park acres $1,199 $31 $33 $20 $39 $15 $1,337 Tennis Court court $17,706 $404 $432 $266 $505 $3 $19,316 Marina berth $1,765 $33 $35 $22 $42 $8 $1,905 Governmental Post Office 1,000 sf $25,692 $385 $411 $254 $481 $16 $27,239 Library 1,000 sf $31,142 $373 $398 $246 $467 $16 $32,642 Government Office 1,000 sf $17,428 $294 $314 $194 NA $16 $18,246 Jail bed $700 $42 $44 $0 $52 $3 $841 Miscellaneous Day Care Center 1,000 sf $16,557 $219 $234 $144 $274 $41 $17,469 Hospital 1,000 sf $9,744 $325 $347 $214 $406 $14 $11,050 Veterinary Clinic 1,000 sf $6,569 $355 $379 $233 $443 $20 $7,999 Church 1,000 sf $4,702 $116 $123 $76 $145 $6 $5,168 Movie Theater 1,000 sf $21,543 $1,306 $1,395 $860 $1,634 $20 $26,758 School (Elementary) 1,000 sf $3,137 $229 $245 $151 $286 $16 $4,064 School (High) 1,000 sf $7,352 $196 $209 $129 $245 $16 $8,147 School (College) 1,000 sf $26,832 $518 $554 $341 $648 $16 $28,909 Fire Station 1,000 sf $1,812 $0 $147 $90 $172 $16 Source: Table 26, Table 43, Table 58, Table 70, Table 81, Table 92, Table 102, Table 111 and Table 122. $2,237 Impact Fee Update, Technical Memo #3 (Revised) Duncan Associates Indian River County, Florida 6 July 19, 2007
 has been experiencing significant growth over the past two decades, and this growth is projected to continue.")
15 INTRODUCTION Impact fees are most appropriate for jurisdictions experiencing rapid growth. Indian River County (IRC) has been experiencing significant growth over the past two decades, and this growth is projected to continue. The population of the county increased by 51 percent in the 1980s and by 24 percent in the 1990s. The population is projected to increase by another 70 percent from 2000 to 2025 (see Figure 1). Figure 1. Population Growth, This section provides a legal background, general information about impact fee principles and a description of the role of level of service in impact fee analysis. Assumptions and resulting population estimates for 2007 and projections through the year 2025 (in five-year increments) are presented and summarized in Appendix A for use, as appropriate, within each of the impact fee program areas. Functional population estimates and projections (and a discussion of what functional population is) are provided in Appendix B. Legal Framework Impact fees are a way for local governments to require new developments to pay a proportionate share of the infrastructure costs they impose on the community. In contrast to traditional negotiated developer exactions, impact fees are charges that are assessed on new development using a standard formula based on objective characteristics, such as the number and type of dwelling units constructed. The fees are one-time, up-front charges, with the payment usually made at the time of building permit issuance. Essentially, impact fees require that each new development project pay its pro-rata share of the cost of new capital facilities required to serve that development. Since impact fees were pioneered in states like Florida that lacked specific enabling legislation, such fees have generally been legally defended as an exercise of local government s broad police power to regulate land development in order to protect the health, safety and welfare of the community. The courts have developed guidelines for constitutionally-valid impact fees, based on rational nexus standards. The standards essentially require that the fees must be proportional to the need for additional infrastructure created by the new development, and must be spent in such a way as to provide that same type of infrastructure to benefit new development. A Florida district court of appeals described the dual rational nexus test in 1983 as follows, and this language was quoted and followed by the Florida Supreme Court in its 1991 St. Johns County decision: In order to satisfy these requirements, the local government must demonstrate a reasonable connection, or rational nexus, between the need for additional capital facilities and the growth in population generated by the subdivision. In addition, the government must show a reasonable connection, or rational nexus, between the expenditures of the funds collected and the benefits Impact Fee Update, Technical Memo #3 (Revised) Duncan Associates Indian River County, Florida 7 July 19, 2007
16 accruing to the subdivision. In order to satisfy this latter requirement, the ordinance must specifically earmark the funds collected for use in acquiring capital facilities to benefit the new residents. Florida Statutes The 2006 Florida Legislature passed Senate Bill 1194, which establishes certain requirements for impact fees in Florida. The bill, which became effective on June 14, 2006, created a new Section , Florida Statutes, which reads as follows: Impact fees; short title; intent; definitions; ordinances levying impact fees.-- (1) This section may be cited as the "Florida Impact Fee Act." (2) The Legislature finds that impact fees are an important source of revenue for a local government to use in funding the infrastructure necessitated by new growth. The Legislature further finds that impact fees are an outgrowth of the home rule power of a local government to provide certain services within its jurisdiction. Due to the growth of impact fee collections and local governments' reliance on impact fees, it is the intent of the Legislature to ensure that, when a county or municipality adopts an impact fee by ordinance or a special district adopts an impact fee by resolution, the governing authority complies with this section. (3) An impact fee adopted by ordinance of a county or municipality or by resolution of a special district must, at minimum: (a) Require that the calculation of the impact fee be based on the most recent and localized data. (b) Provide for accounting and reporting of impact fee collections and expenditures. If a local governmental entity imposes an impact fee to address its infrastructure needs, the entity shall account for the revenues and expenditures of such impact fee in a separate accounting fund. (c) Limit administrative charges for the collection of impact fees to actual costs. (d) Require that notice be provided no less than 90 days before the effective date of an ordinance or resolution imposing a new or amended impact fee. (4) Audits of financial statements of local governmental entities and district school boards which are performed by a certified public accountant pursuant to s and submitted to the Auditor General must include an affidavit signed by the chief financial officer of the local governmental entity or district school board stating that the local governmental entity or district school board has complied with this section. Other provisions relating to impact fees are scattered about in the Florida Statutes. Section (3)(j) requires that urban infill and redevelopment area plans contain a package of financial incentives, one of which could be lower transportation impact fees for development which encourages more use of public transit, pedestrian and bicycle modes of transportation. School concurrency provisions in Section (13)(e)2 state that if developers make proportionate- Impact Fee Update, Technical Memo #3 (Revised) Duncan Associates Indian River County, Florida 8 July 19, 2007
17 share mitigation contributions, the local government shall credit such a contribution, construction, expansion, or payment toward any other impact fee or exaction imposed by local ordinance for the same need, on a dollar-for-dollar basis at fair market value. Transportation concurrency provisions relating to multi-modal transportation districts provide in Section (15)(d) that local governments may reduce impact fees or local access fees for development within multi-modal transportation districts based on the reduction of vehicle trips per household or vehicle miles of travel expected from the development pattern planned for the district. Transportation concurrency management provisions provide in Section (16)(b)2 that proportionate fair-share mitigation shall be applied as a credit against impact fees to the extent that all or a portion of the proportionate fair-share mitigation is used to address the same capital infrastructure improvements contemplated by the local government's impact fee ordinance. The boards of independent special fire control districts are authorized to establish fire impact fees in Section (4). Section (1)(e) authorizes impact fee abatement or reduction as part of a package of incentives that must be put in place for enterprise zones. Developments of regional impact must be given credit for any capital contributions required as a condition of development approval, pursuant to Section (16). Local governments are encouraged to establish affordable housing incentive strategies, which may include the modification of impact-fee requirements, including reduction or waiver of fees and alternative methods of fee payment for affordable housing, according to Section (4)(b). Public schools are exempted from the payment of impact fees in Section (1)(a). General Impact Fee Principles One of the most fundamental principles of impact fees, rooted in both case law and norms of equity, is that impact fees should not charge new development for a higher level of service than is provided to existing development. While impact fees can be based on a higher level of service than the one existing at the time of the adoption of the fees, two things are required if this is done. First, another source of funding other than impact fees must be identified and committed to fund the capacity deficiency created by the higher level of service. Second, the impact fees must generally be reduced to ensure that new development does not pay twice for the same level of service, once through impact fees and again through general taxes that are used to remedy the capacity deficiency for existing development. In order to avoid these complications, the general practice is to base the impact fees on the existing level of service. A corollary principle is that new development should not have to pay more than its proportionate share when multiple sources of payment are considered. As noted above, if impact fees are based on a higher-than-existing level of service, the fees should be reduced by a credit that accounts for the contribution of new development toward remedying the existing deficiencies. A similar situation arises when the existing level of service has not been fully paid for. Outstanding debt on existing facilities that are counted in the existing level of service will be retired, in part, by revenues generated from new development. Given that new development will pay impact fees to provide the existing level of service for itself, the fact that new development may also be paying for the facilities that provide that level of service for existing development could amount to paying for more than its proportionate share. Consequently, impact fees should be reduced to account for future payments that will retire outstanding debt on existing facilities. The issue is less clear-cut when it comes to other types of revenue that may be used to make capacity-expanding capital improvements of the same type being funded by impact fees. Arguably, Impact Fee Update, Technical Memo #3 (Revised) Duncan Associates Indian River County, Florida 9 July 19, 2007
18 no credit is warranted in most cases, since, while new development may contribute toward such funding, so does existing development, and both existing and new development benefit from the higher level of service that the additional funding makes possible. Impact fee studies in Florida, however, have traditionally given credit for the portion of dedicated revenues, such as gasoline taxes, that are used for capacity-expanding improvements. This study will provide revenue credits for these types of dedicated revenues. Credit has also sometimes been provided for outstanding grants for capacity improvements that can reasonably be anticipated in the future. In addition to the argument presented above (i.e., grants raise the level of service and benefit both new development and existing development), two additional arguments can be made against applying credit for grants. First, new development in a community does not directly pay for State and Federal grants in the same way they pay local gasoline and property taxes. Second, future grant funding is far more uncertain than dedicated revenue streams. On the other hand, local governments have less discretion about whether to spend grant funding on capacity-expanding capital improvements. In this study, credit will be provided for anticipated future Federal and State grant funding based on recent grant funding history. For the most part, impact fee studies in Florida do not give credit for past property tax payments from vacant land that is now being developed, or for future planned general fund expenditures for capacity-expanding improvements. However, the previous study did give credit for these types of expenditures, and this study will continue to provide such revenue credits. Level of Service The role of level of service (LOS) in impact fee analysis is central, but often misunderstood. The previous discussion makes clear the fundamental importance of the concept of level of service in impact fee analysis. However, it is possible to address these issues without specifying a LOS standard in terms of an explicit ratio, such as acres of parkland per 1,000 residents. In reality, the LOS is a set of capital facilities, including land, buildings and equipment, that provides service to a given amount of development. Explicit LOS standards inevitably over-simplify this complex relationship by emphasizing one element of the capital facilities, such as acres of land for parks or square feet of library buildings (or, in some cases a characteristic that is not directly related to capital facilities, such as officers for law enforcement). An alternative is to calculate the level of service in terms of the replacement cost of the capital facilities provided per unit of development served. In fact, this is what impact fee calculations generally do. The choice of an explicit LOS standard to represent this relationship is generally unnecessary, and can create undesirable policy outcomes. For example, a parks and recreation system represents a capital investment in land, buildings and other improvements that provides service to residents. Reducing this relationship to a simple ratio of acres of land to population does provide a concrete, measurable indicator. However, it may unintentionally put undue emphasis on the acquisition of park land, at the expense of the provision of recreational facilities and improvements. The expansion of a park system may involve periods of extensive land acquisition, followed by periods that focus on the development of land with park improvements. Adoption of a LOS standard expressed in acres implies that only additional land acquisition can enhance the level of service. In reality, the level of service provided by a park system can be enhanced by improvements to existing land as well as by acquisition of additional land. Impact Fee Update, Technical Memo #3 (Revised) Duncan Associates Indian River County, Florida 10 July 19, 2007
19 In this impact fee update, the fees are based, for the most part, on the existing levels of service. However, the levels of service do not need to be expressed in the form of simplistic ratios. Nor do explicit LOS standards need to be incorporated into the Comprehensive Plan in order for the impact fees to be consistent with the Plan. It is recommended that the specific LOS standards incorporated into the Comprehensive Plan after the previous impact fee study for non-concurrency facilities (fire rescue, law enforcement, corrections, public buildings and libraries) be replaced with a more general statement along the following lines: Impact fees shall be based on a level of service for new development that does not exceed the level of service provided to existing development. Of the facilities under consideration in this study, traffic, schools, parks and solid waste are subject to State concurrency requirements. The County s adopted level of service for transportation concurrency purposes is set forth in the Capital Improvements Element of the 2020 Comprehensive Plan: Level-of-Service D during peak hour, peak season, peak direction conditions, on all TRIP grant funded roads as well as all freeway, arterial, and collector roadways, with the exception of the following two, which will operate at level of service E plus 20%. 27 th Ave South County Line to SR rd Ave Oslo Road to 16 th Street For SIS/Florida Intrastate Highway System roadways, level of service B is adopted for rural areas, and level of service C is adopted for urban areas. According to County staff, the two exception roads have been improved and the E plus 20% standard is no longer necessary. Otherwise, the concurrency LOS standard for roads should remain as it is. The traffic impact fees are based on a standard that is different from, but not inconsistent with, the adopted standard. The adopted concurrency standard is focused on individual roadway facilities and utilizes peak hour traffic. The impact fees are based on average daily traffic and focus on the system-wide ratio of capacity to demand. The County s adopted level of service for schools is expressed in terms of building square feet per student station. These LOS standards were adopted to be consistent with the previous impact fee study, not for concurrency purposes (concurrency was not required for schools at the time). The draft interlocal agreement between the School District, the County and the municipalities for school concurrency, as approved by the School Board on February 13, 2007, establishes the following standard (the School Service Areas are defined as elementary, middle and high school attendance zones): The adopted level of service for each year of the five year planning period and through the long term planning period for each School Service Area will be 100% of the FISH permanent capacity. The proposed standard is consistent with the school impact fee analysis, which bases the fees on a district-wide ratio of one permanent FISH student capacity per enrolled regular (non-charter school) student. Impact Fee Update, Technical Memo #3 (Revised) Duncan Associates Indian River County, Florida 11 July 19, 2007
20 The adopted concurrency level of service for parks is based on the previous impact fee study. The adopted LOS in the 2020 Comprehensive Plan is 6.61 recreation acres/1,000 permanent plus weighted peak seasonal population county-wide. The County may wish to consider modifying its adopted LOS for concurrency purposes to base it on the ratio of developed park acres owned or operated by the County to the permanent population residing in unincorporated areas of the county. If the County wanted the concurrency standard to be consistent with the updated impact fees, the acreage would include State-owned land that is leased to the County on a long-term basis for a nominal rate, and would exclude enterprise facilities such as golf courses. On this basis, the current actual LOS for parks is 6.26 acres per 1,000 residents (see park impact fee analysis for detailed calculations). This LOS is based on regional, community and neighborhood parks that are currently available to residents in the unincorporated county. However, it might be prudent for the County to make the concurrency standard somewhat lower than the existing ratio. Regardless of what LOS is established for concurrency purposes, the updated park impact fees will be based on the current actual ratio of the replacement cost of existing park land and facilities to the unincorporated area residents served by these facilities. The adopted level of service for solid waste is also based on the previous impact fee study. The adopted LOS is 2.2 tons or 3.67 cubic yards per capita for permanent plus weighted peak seasonal population per year. This update uses a waste generation unit, or WGU, which is equivalent to one ton per year (a single-family dwelling is estimated to generate 1.6 tons per year), as the service unit, rather than permanent plus weighted peak seasonal population. An alternative concurrency LOS service standard that is consistent with the updated impact fee service unit would be 0.77 cubic yards of class I solid waste per year per waste generation unit. Service Areas The nine types of facilities covered in this report provide service to three different service areas: county-wide, unincorporated areas only and county-wide with an exception. Traffic, schools, libraries, corrections, public buildings and solid waste facilities provide services county-wide. Parks and law enforcement (Sherriff s Office patrol) facilities provide service to unincorporated areas only. County fire rescue service is provided to development county-wide, with the exception of Indian River Shores, which provides its own municipal fire rescue service. Impact Fee Update, Technical Memo #3 (Revised) Duncan Associates Indian River County, Florida 12 July 19, 2007
21 TRAFFIC The purpose of this section of the report is to assist Indian River County in updating its existing traffic impact fee program. This traffic impact fee update maintains the current traffic impact fee (TIF) formula and local trip characteristics. The calculations in this report are based on the methodology utilized by Tindale-Oliver & Associates in their 2004 update of the traffic impact fee. 1 However, one change from the methodology used in the previous study is that the trip lengths were calibrated to reflect actual travel on the major roadway system. The updated impact fee schedule is based on the most recent road cost data from the Metropolitan Planning Organization s (MPO s) Long Range Transportation Plan (LRTP) and the County s adopted Capital Improvement Program (CIP). The resulting revised cost per lane-mile is then used to update the impact fee formula cost component and resulting impact fee rate schedule. The credit component update is based on an analysis of revenues that local governments and the Florida Department of Transportation (FDOT) use to construct new and expanded roads in Indian River County. This is determined by updating the number of pennies per gallon of gas tax that return to the community for non-interstate capital improvements for State, County and municipal roads. The work activities accomplished as part of this effort are summarized below: Prepared an inventory of the major roadway system. The inventory is used to calibrate trip lengths by land use from the previous study to match existing vehicle-miles of travel (VMT) on the major roadway system. It is also used to demonstrate that there are no existing deficiencies on a system-wide basis. Reviewed the Cost Feasible Plan of the MPO s adopted 2030 Long Range Transportation Plan, the five-year Transportation Improvement Program and the FDOT Work Program to determine the status of which projects have been completed or are under construction. Updated the 2005 total cost estimates for the 2030 Cost Feasible Plan improvements based on the construction cost inflation index published by Engineering News-Record and updated cost estimates provided by the County Public Works Department. Calculated an updated average cost per lane-mile and per vehicle-mile of capacity (VMC) added to the transportation network based on the adjusted cost of capacity-adding road projects in the 2030 Cost Feasible Plan. Identified and reviewed revenue sources used for transportation purposes; determined the appropriate present value factor to use based on current Federal Reserve interest rate data for state and local bonds; assessed credit components of the current impact fee formula; and determined the credit amount to be applied in the impact fee formula. 1 Tindale-Oliver & Associates, Inc., Update of the Traffic Impact Fee Ordinance Cost Estimate Variable, Indian River County, February, Impact Fee Update, Technical Memo #3 (Revised) Duncan Associates Indian River County, Florida 13 July 19, 2007
22 Prepared an updated impact fee schedule for Indian River County, based on the updated cost and credit components. The remainder of this section reviews and summarizes the results of the work activities identified above. Major Roadway System A traffic impact fee program should include a clear definition of the major roadway system that is to be funded with impact fees. The County s current road impact fee system (i.e., the previous study and current ordinance) does not clearly define the major roadway system. In this update, a definition of the major roadway system is proposed that includes all collectors, minor arterials and major arterial roads in the county, except for I-95. The interstate is excluded because a significant portion of the traffic on that facility is likely to be attributable to through traffic that is unrelated to new development in Indian River County. An inventory of the existing major roadway system was compiled from Table of the Transportation Element of the 2020 Indian River County Comprehensive Plan. The inventory is presented in Table 133, Table 134 and Table 135 in Appendix C. The major purpose of the inventory is to ensure that the travel demand factors for individual land uses in the fee schedule are calibrated to the actual system-wide travel observed on the major roadway system. A secondary purpose is to ensure that the level of service (LOS) implicit in the standard consumption-based road impact fee methodology does not exceed the actual LOS on the major roadway system. The implicit LOS in the standard consumption-based methodology is a system-wide ratio of 1.0 between vehiclemiles of capacity (VMC) and vehicle-miles of travel (VMT) on the major roadway system. Current Level of Service The secondary purpose for compiling the existing major roadway inventory is to determine the current level of service for impact fee purposes. Oftentimes this is taken to be a segment-specific level of service, such as all roadway segments shall operate at LOS D or better. This is in fact the type of level-of-service standard that Indian River County has adopted for concurrency purposes. According to the Capital Improvements Element of the 2020 Comprehensive Plan, the adopted traffic circulation level-of-service standard is: Level-of-Service D during peak hour, peak season, peak direction conditions, on all TRIP grant funded roads as well as all freeway, arterial, and collector roadways, with the exception of the following two, which will operate at level of service E plus 20%. 27 th Ave South County Line to SR rd Ave Oslo Road to 16 th Street For SIS/Florida Intrastate Highway System roadways, level of service B is adopted for rural areas, and level of service C is adopted for urban areas. According to the County, the two road segments that are currently allowed to function at LOS E plus 20 percent have been upgraded to four lanes and no longer require a special standard. The level Impact Fee Update, Technical Memo #3 (Revised) Duncan Associates Indian River County, Florida 14 July 19, 2007
23 of service for concurrency purposes, however, is not necessarily appropriate as the level of service for impact fees. Most road impact fee systems in Florida are not really designed to provide sufficient funding to achieve or maintain such a segment-specific standard. Most road impact fees in Florida, including Indian River County s, use the standard consumption-based methodology. This methodology essentially charges new development, for every VMT generated, the cost to add a VMC. In other words, the cost per VMT equals the cost per VMC, which implies a one-to-one ratio of VMC to VMT (cost/vmt = cost/vmc times VMC/VMT, where VMC/VMT = 1). This is conservative, because most roadway systems have more than one VMC for every VMT on a systemwide basis. However, even if capacity were to be measured using LOS D, and even if the systemwide level of service were to be set at the existing VMC/VMT ratio, and the fees were based on this level of service, it would still not necessarily be sufficient to ensure that every roadway segment would function at LOS D. A segment-specific level of service standard is simply not appropriate for impact fees calculated using a consumption-based methodology. Why then use a consumption-based methodology? One advantage is that it avoids the problem of segment-specific existing deficiencies. An improvements-based methodology based on all segments functioning at LOS D or better would inevitably create a number of existing deficiencies that could not be remedied with impact fee funds. In addition, some of the non-impact fee funds that are used to remedy the deficiency would be generated by new development, which would need to have its impact fees reduced by a deficiency credit to avoid double payment issues. With the consumptionbased methodology, in contrast, there are no deficiencies as long as the system-wide ratio on which the fees are based is no higher than the actual existing VMC/VMT ratio. Another important advantage is the flexibility provided by a consumption-based system. An improvements-based methodology is tied to a specific list of planned improvements determined by a transportation plan to be needed to maintain segment-specific LOS in the face of anticipated growth. Revenues from a consumption-based fee, on the other hand, can be used on any capacity-expanding improvement. As in the prior impact fee study, capacities were based on average annual daily capacity at LOS D. There are no existing deficiencies on the existing major roadway system as a whole, as evidenced by a VMC/VMT ratio significantly greater than one, as shown in Table 5. Table 5. Existing Major Roadway System Level of Service Road Classification VMC Total VMT Ratio Principal Arterial 1,660,554 1,116, Minor Arterial 1,250, , Collector 1,809, , Total 4,721,233 2,985, Source: VMC from Table 133, Table 134 and Table 135 in Appendix C; VMT from Table 21. Impact Fee Update, Technical Memo #3 (Revised) Duncan Associates Indian River County, Florida 15 July 19, 2007
24 Cost per Service Unit Expanding the capacity of the County s major roadway system is primarily accomplished by widening existing roadway cross-sections to accommodate additional through lanes and by building new roads. The traffic impact fee is designed to cover the cost of adding capacity to the roadway system. All of the normal components of a roadway expansion project are eligible for impact fee funding, including engineering and design, right-of-way acquisition, construction of new lanes, reconstruction of existing lanes and relocation of utilities where necessary as part of a widening project, and installation of sidewalks, street lighting and landscaping as part of an improvement project. Cost per Lane-Mile The previous impact fee update developed detailed road cost estimates for the County s capacityadding road projects in the 2025 Cost Feasible Plan. The road cost estimates included separate analysis of right-of-way acquisition costs for planned roads, construction cost estimates and design costs. This update is based on the local average cost to add roadway capacity to the County s major roadway system based on the most recent cost data. The most recent and comprehensive road construction cost data were developed for Indian River County s 2030 Cost Feasible Plan in The locations of these projects are illustrated in Figure 2. The current Cost Feasible Plan includes improvements to I-95, SR 60 and US 1. Including State road improvements in the impact fee calculation is reasonable, because the County increasingly participates in the cost of State road improvements, and motor fuel tax credits are provided for the portion of gasoline taxes that are used to fund State road improvements. The improvements to I-95 are excluded from this update, since the County does not participate in construction of interstate highways, and much of the travel on such roads is through traffic unrelated to development in Indian River County. Given the array of projects in the 2030 Cost Feasible Plan and their locations throughout the county, these planned projects are representative of the current average cost to add capacity to the County s major roadway system. For this study, the 2005 cost estimates have been inflated to 2007 values to reflect the total cost increase since the original estimates were developed. In addition, updated cost estimates have been provided for some projects by the County Public Works Department. The project costs included in Table 6 represent the updated cost of implementing all of the as-yet unconstructed 2030 Cost Feasible Plan roadway capacity improvements. The project costs utilized in updating the impact fee schedule exclude the interstate highway widening on I-95 in order to be consistent with the existing impact fee schedule and trip length methodology. Impact Fee Update, Technical Memo #3 (Revised) Duncan Associates Indian River County, Florida 16 July 19, 2007

25 Figure 2. Indian River County 2030 Planned Roadway Improvements Impact Fee Update, Technical Memo #3 (Revised) Duncan Associates Indian River County, Florida 17 July 19, 2007
26 Project Limits Street From To Table 6. Planned Improvement Costs Total Cost (2005) Cost Factor Total Cost (2007) Added Lanes Lanemiles 82nd Ave 26th St CR 510 $28,174, $29,751, SR 60 98th Ave I-95 $2,543, $2,686, SR 60 I-95 82nd Ave $8,119,445 NA $21,289, SR 60 82nd Ave 66th Ave - NA $33,344, SR 60 6th Ave Indian River $1,864,758 NA $4,000, US 1 S Co. Line Oslo Rd $12,064,823 NA $54,009, US 1 Aviation Blvd Old Dixie Hwy $44,372, $46,856, US 1 Roseland Rd N Co. Line $5,255, $5,549, Subtotal, FDOT Projects $102,394,598 $197,486, th St 90th Ave 82nd Ave $3,781, $3,993, th St 43rd Ave 27th Ave $2,854, $3,014,477 1* th St SW 66th Ave 58th Ave $4,041, $4,267, th St SW 43rd Ave 34th Ave $1,560, $1,648, th St SW 34th Ave 27th Ave $3,359, $3,547, th St SW 27th Ave 20th Ave $1,922, $2,029, th St SW 66th Ave 58th Ave $4,019, $4,244, th St 66th Ave 43rd Ave $13,006,154 NA $16,006, th St 82nd Ave 74th Ave $3,850, $4,066, th Ave S Co. Line Oslo Rd $9,560, $10,096, th Ave Oslo Rd SR 60 $12,330,699 NA $24,000, rd Ave Oslo Rd 8th St $8,311,058 NA $13,000, rd Ave S Co. Line Oslo Rd $12,974, $13,701, th St 98th Ave 66th Ave $16,262, $17,172, rd St 82nd Ave 66th Ave $9,599, $10,137, th Ave S Co. Line Oslo Rd $8,562, $9,041, th Ave Oslo Rd 4th St $8,887, $9,385, th Ave 4th St SR 60 $8,853,565 NA $15,886, th Ave SR 60 CR 510 $36,173,489 NA $84,385, nd Ave S Co. Line Oslo Rd $7,302, $7,711, th St 82nd Ave 74th Ave $3,955, $4,176, CR 510 CR 512 US 1 $36,369,280 NA $73,400, CR 510 US 1 ICWW $3,718, $3,926, CR 512 Fellsmere City I-95 $19,192, $20,267, CR 512 I-95 CR 510 $13,317, $14,062, CR 512 CR 510 Roseland $6,674,370 NA $15,100, Indian Rvr Bvd Royal Palm 37th St $8,678,255 NA $11,000, Laconia St CR 510 Concha Dr $11,076, $11,696, Oslo Rd I-95 58th Ave $19,484, $20,575, Roseland Rd CR 512 US 1 $12,847, $13,567,379 1* Schumann Dr CR 510 Barber St $3,974, $4,196, Subtotal, County Projects $316,504,346 $449,308, Aviation Blvd 43rd Ave US 1 $8,537,828 NA $18,000, Aviation Blvd US 1 Indian River $14,387,771 NA $30,000, Barber St Schumann Dr US 1 $3,621, $3,824,396 1* Barber St CR 512 Schumann Dr $7,596, $8,021,699 1* Fleming St Easy St US 1 $4,838, $5,109, Subtotal, City Projects $38,982,353 $64,955, Total $457,881,297 $711,751, * No new traffic lanes (capacity enhanced by adding a median and turn lanes to an existing two-lane road) Source: Indian River County Metropolitan Planning Organization, 2006 Priority Projects Report, 2006, Table A-9; miles scaled by Duncan Associates; cost factor is Engineering News-Record Construction Cost Index, annual 2005 to April 2007 (NA indicates updated costs provided by IRC Public Works Department, February 28, March 9 and March 21, 2007). Miles Impact Fee Update, Technical Memo #3 (Revised) Duncan Associates Indian River County, Florida 18 July 19, 2007
27 One of the key inputs into the road impact fee formula is the cost per lane-mile to construct new roadway capacity. The current impact fee methodology is based on the consumption-based approach, in which roadway construction costs are entered into the formula as an average cost for providing new roadway capacity. This average unit cost reflects the relationship between the total project costs and the total number of lane-miles that is to be constructed. As shown in Table 7, the weighted average cost per lane-mile is approximately $4.0 million. Table 7 Weighted Average Cost per Lane-Mile Source Total Cost Lane-Mi. Added Cost per Lane-Mile Indian River County Projects $449,308, $3,691,933 FDOT Projects $197,486, $4,655,514 City Projects $64,955, $4,479,719 Total $711,751, Source: Total cost and lane-miles from Table 6. $3,984,722 Roadway Capacity Cost In order to determine the cost of new capacity added by planned road improvements, the consultant reviewed existing and planned roadway characteristics and determined the amount of capacity added by each road project. As in the prior impact fee study, the analysis of the capacity of Indian River County s road improvements is based on the generalized planning capacity estimates promulgated by the Florida Department of Transportation (FDOT). These capacity estimates are based on Highway Capacity Manual procedures and take into consideration roadway cross-sections, left turn lanes at intersections, the spacing of signalized intersections and the characteristics of the area (i.e., rural, rural developed, transitioning to urban and urbanized). As in the prior impact fee study, capacities were based on average daily capacity at LOS D. The average capacity per new lane-mile is determined based on the same set of improvements used to determine the average cost per lane-mile. Table 8 shows the total vehicle-miles of capacity added by planned improvements. As noted earlier, these improvements exclude interstate projects in Indian River County, such as the widening of I-95. Impact Fee Update, Technical Memo #3 (Revised) Duncan Associates Indian River County, Florida 19 July 19, 2007
28 Table 8. Capacity Added by Planned Road Improvements Project Limits New New Average Daily Capacity New Daily Street From To Miles Lns Ln-Mi Before After New VMC 82nd Ave 26th St CR ,600 14,600 7,000 49,350 SR 60 98th Ave I ,700 53,500 17,800 11,748 SR 60 I-95 82nd Ave ,700 53,500 17,800 23,852 SR 60 82nd Ave 66th Ave ,700 53,500 17,800 35,600 SR 60 6th Ave Indian River Blvd ,700 49,200 16,500 4,950 US 1 S. County Line Oslo Rd ,700 53,500 17,800 38,448 US 1 Aviation Blvd Old Dixie Hwy ,700 49,200 16, ,550 US 1 Roseland Rd N. County Line ,700 53,500 17,800 17,800 Subtotal, FDOT Projects ,298 12th St 90th Ave 82nd Ave ,600 14,600 14,600 12th St 43rd Ave 27th Ave * ,680 15,330 3,650 3,650 13th St SW 66th Ave 58th Ave ,600 14,600 14,600 13th St SW 43rd Ave 34th Ave ,600 14,600 8,176 13th St SW 34th Ave 27th Ave ,600 14,600 6,424 13th St SW 27th Ave 20th Ave ,600 14,600 6,570 17th St SW 66th Ave 58th Ave ,600 14,600 14,600 26th St 66th Ave 43rd Ave ,600 31,100 16,500 33,000 26th St 82nd Ave 74th Ave ,600 14,600 14,600 27th Ave S. County Line Oslo Rd ,680 31,100 19,420 38,840 27th Ave Oslo Rd SR ,600 31,100 16,500 57,750 43rd Ave Oslo Rd 8th St ,600 31,100 16,500 33,000 43rd Ave S County Line Oslo Rd ,680 31,100 19,420 38,840 4th St 98th Ave 66th Ave ,600 14,600 7,000 28,000 53rd St 82nd Ave 66th Ave ,600 14,600 29,200 66th Ave S County Line Oslo Rd ,600 14,600 29,200 66th Ave Oslo Rd 4th St ,680 31,100 19,420 29,130 66th Ave 4th St SR ,330 31,100 15,770 32,013 66th Ave SR 60 CR ,680 31,100 19, ,233 82nd Ave S County Line Oslo Rd ,600 14,600 29,200 8th St 82nd Ave 74th Ave ,600 14,600 7,000 7,000 Aviation Blvd 43rd Ave US ,600 31,100 16,500 31,845 Aviation Blvd US 1 Indian River Blvd ,100 31,100 32,966 CR 510 CR 512 US ,600 31,100 16,500 96,030 CR 510 US 1 ICWW ,600 31,100 16,500 11,550 CR 512 Fellsmere City I ,680 31,100 19,420 60,202 CR 512 I-95 CR ,100 46,800 15,700 38,465 CR 512 CR 510 Roseland ,100 46,800 15,700 20,410 Indian River Blvd Royal Palm 37th St ,100 46,800 15,700 15,700 Laconia St CR 510 Concha Dr ,600 14,600 8,030 Oslo Rd I-95 58th Ave ,680 31,100 19,420 63,115 Roseland Rd CR 512 US * ,680 15,330 3,650 17,155 Schumann Dr CR 510 Barber St ,680 31,100 19,420 15,924 Subtotal, County ,026,018 Barber St Schumann Dr US * ,680 15,330 3,650 4,745 Barber St CR 512 Schumann Dr * ,680 15,330 3,650 9,855 Fleming St Easy St US ,600 14,600 17,520 Subtotal, City ,120 Total ,350,436 * No new lanes added, capacity enhanced by creating a median and turn lanes on existing 2-lane road. Source: Project descriptions, segment lengths, added lanes from Table 6; average daily capacity based on LOS D, from Florida Department of Transportation, 2002 Quality/Level of Service Handbook, 2002, Table 4-1: Generalized Annual Average Daily Volumes for Florida s Urbanized Area and Table 4-2: Generalized Annual Average Daily Volumes for Florida s Areas Transitioning into Urbanized Areas. Impact Fee Update, Technical Memo #3 (Revised) Duncan Associates Indian River County, Florida 20 July 19, 2007
29 The average cost per service unit is determined by dividing the total cost of planned improvements by the VMC added by the improvement, as shown in Table 9. The table also shows the average capacity per lane, although this is not an integral part of the impact fee calculations. Source Table 9. Road Cost per Vehicle-Mile VMC Added Ln-Mi. Added Avg. Capacity per Lane Cost Cost per VMC FDOT Projects 292, ,891 $197,486,924 $676 Indian River County Projects 1,026, ,905 $449,308,217 $438 City Projects 32, ,019 $64,955,932 $2,022 Total 1,350, ,560 $711,751,073 $527 Source: Project costs from Table 6; lane-miles added and vehicle-miles of capacity added from Table 8. Revenue Credits This section of the report updates the credit calculation to account for revenue generated by new development that will be used to pay for capacity-related capital improvements through motor fuel taxes and sales taxes. To update this credit, the consultant reviewed Indian River County historical expenditures and future appropriations for roadway projects that expand the capacity of the road system. The County primarily utilizes the Local Optional Sales Tax and Local Option Gas Tax in funding road improvements. A credit for State and Federal funding recognizes the Florida Department of Transportation expenditures on State roads in Indian River County. FDOT funding sources include Federal and State gas tax and State general revenue in the form of legislative Transportation Regional Incentive Program (TRIP) appropriations. Penny per Gallon Gas Tax Equivalent Since the total cost per unit for each land use is developed using vehicle-miles of travel, the credit calculation is also developed using vehicle-miles of travel. To make this calculation, it is necessary to convert the average annual sales tax into an equivalent number of pennies of gas tax. This is accomplished by determining how much revenue is generated from the one penny of the County s sixcent 1 st Local Option Gas Tax based the total revenue distributed to the County. Since all municipalities participate in the traffic impact fee and assess their impact fees based on the County s impact fee schedule, this study bases the distribution per penny on the county-wide distribution of the 1 st Local Option Gas Tax rather than on the amount distributed to the unincorporated area of the County. As shown in Table 10, the value per penny (per gallon of fuel) that is used to calculate the equivalent pennies for all credits is $882,753 per penny. Table 10. Fuel Tax Distribution per Penny per Gallon, FY st Local Option Tax (1-6 Cents) Revenue, FY 2007 $5,296,518 Amount of Levy per Gallon $ Distribution per Penny $882,753 Source: Total gas tax revenue for FY 2007 from Florida Legislative Committee on Intergovernmental Relations, localoptfuel07.pdf. Impact Fee Update, Technical Memo #3 (Revised) Duncan Associates Indian River County, Florida 21 July 19, 2007
30 Local Funding Revenue Credit The local revenue credit is based on the weighted average historic and programmed funding by the County of the Optional Sales Tax and Local Option Gas Tax revenues for capacity-expanding roadway projects. The total credit is based on the average historical expenditures over the past six years, and future programmed funding from the five-year Capital Improvement Plan (CIP). Table 11 illustrates the historical expenditures for the Local Option Gas Tax that were used for capacityexpansion projects during the last six years. Table 11. Historic Local Option Gas Tax Funding, FY FY 2001/02 FY 2002/03 FY 2003/04 FY 2004/05 FY 2005/06 FY 2006/07* 6-Yr Total Project Description/Name Misc ROW $25,816 $25,816 Powerline Road $129,083 $9,500 $138,583 66th/12th to 4th ROW $0 $900,000 $900,000 13th St SW- West of 27th ROW $195,182 $195,182 Right of Way 8th Place 6th to 7 $143,100 $143,100 58th Avenue ROW $91,100 $91,100 CR 510/ 75th to 61st ROW $177,465 $1,000 $178, /512 to 75th ROW $750 $75,000 $75,750 66th-12th to SR 60 ROW $464,513 $1,900,000 $2,364,513 13th St SW ROW $60,817 $60,817 CR 512/Roseland to Seb Middle $488,122 $2,375,705 $2,863,827 Kings Highway/12th to Oslo $491,809 $2,015 $493,824 43rd Ave Widening/12th -19th $5,494 $700 $2,543,869 $2,550,063 4th St/US 1 to Old Dixie $232,971 $595,871 $45,111 $873,953 Powerline Road/Barber St $162,405 $162,405 Old Dixie-3 lanes 12-16th $550,000 $550,000 5th St SW/27th Ave $27,812 $29,757 $47,188 $104,757 SR60-58th Ave $1,192,597 $1,192,597 Oslo Road/TimberRidge to 27th $1,200,000 $1,200,000 CR 510/75th Ct-61st $142,209 $799,000 $941,209 CR 510/61st Drive to Shore Lane $3,100,000 $3,100,000 66th Ave/77th to Barber St $1,513 $800,000 $801,513 26th St/43rd Ave-66th Ave $1,914 $1,914 Oslo Rd/27th Ave-43rd Ave $1,500,000 $1,500,000 CR 510/512-75th Ct $399,824 $399,824 20th Ave Sw/17th St -25th St $23,236 $275,000 $298,236 43rd Ave/19th St-26th St $3,633 $398,836 $402,469 Kings Highway Widening $1,451,522 $150 $1,451,672 43rd Ave Bridge $10,657 $10,657 Oslo Bridge $6,240 $6,240 Total Capacity-Enhancing Projects $1,451,522 $25,966 $741,677 $631,192 $2,398,029 $17,830,100 * Expenditures for FY are budgeted amounts. $23,078,486 Source: Indian River County Office of Management & Budget. Table 12 illustrates the historic expenditures for the Optional Sales Tax that were used for capacity expansion from FY 2002 to FY Impact Fee Update, Technical Memo #3 (Revised) Duncan Associates Indian River County, Florida 22 July 19, 2007
31 Table 12. Historic Optional Sales Tax Funding, FY FY 2001/02 FY 2002/03 FY 2003/04 FY 2004/05 FY 2005/06 FY 2006/07* 6-Yr Total Project Description/Name Right of Way $630,477 $465,748 $504,725 $870,414 $13,818 $394,896 $2,880,078 King's Highway Widening $4,201,617 $150 $4,201,767 Oslo Road Widening $1,074 $1,074 ROW-Old Dixie/S.Relief Canal $1,500 $1,500 Roads & Bridges $5,462 $47,657 $53,119 43rd Ave Bridge over S.Relief Canal $10,657 $19,439 $36,475 $497,655 $564,226 Old Dixie Bridge over S.Relief Canal $10,378 $28,775 $25,931 $508,665 $573,749 Oslo Bridge Replace Lat J $6,240 $6,240 Oslo -27th -Timber Ridge $110,866 $300 $731 $1,493,865 $1,605,762 Oslo Road-43rd to 58th $900,000 $900,000 1st St SW/27th Ave Intersection $100,000 $100,000 17th Lane SW/27th Ave Intersection $150,000 $150,000 CR 512/Seb Riv Mid-I-95 $2,978,520 $2,978,520 66th Ave-SR60 to 59th St $100,000 $100,000 43rd Ave-8th to Oslo 4 lanes $567,094 $567,094 Total Road Projects $4,832,094 $466,972 $648,328 $918,928 $126,112 $7,690,695 * Expenditures for FY 2007 are budgeted amounts. $14,683,129 Source: Indian River County Office of Management & Budget. Table 13 illustrates the future appropriations for the Local Option Gas Tax that are projected to be used for capacity-expansion projects. Planned expenditures assume Board approval of an additional six-cent local option gas tax, and the issuance of bonds to be repaid by those revenues that would be spent in FY 2011 and Table 13. Future Local Option Gas Tax Funding, FY FY 2007/08 FY 2008/09 FY 2009/10 FY 2010/11 FY 2011/12 5-Yr Total Project Description CR 510, CR 512 to 75th Court 4 lanes $500,000 $1,200,000 $3,000,000 $3,000,000 $7,700,000 Powerline Rd, Barber to CR lane $300,000 $300,000 16th St, 66th Av to 74th Av - 2 lanes $1,500,000 $1,500,000 20th Ave SW, 17th St SW-25th St SW $400,000 $400,000 26th St, 74th Ave to 82 Ave - 2 lanes $750,000 $750,000 37th St, 58th to 66th Ave - 2 lanes $200,000 $200,000 43rd Ave, 49th to 53rd St - 3 lanes $1,000,000 $1,000,000 43rd Ave/SR 60, 19th Ave to 26th St $1,300,000 $2,200,000 $2,200,000 $5,700,000 81st St, 66th to 58th Ave - 2 lanes $400,000 $400,000 Misc ROW Acquisitions $500,000 $500,000 $1,000,000 Highland Drive/Old Dixie $150,000 $150,000 Total $3,800,000 $2,400,000 $2,500,000 $5,200,000 $5,200,000 Source: Indian River County Office of Management & Budget, March 16, $19,100,000 Table 14 illustrates the future Optional Sales Tax funding based on the programmed funding over the next five years. Impact Fee Update, Technical Memo #3 (Revised) Duncan Associates Indian River County, Florida 23 July 19, 2007
32 Table 14. Future Optional Sales Tax Funding, FY FY 2007/08 FY 2008/09 FY 2009/10 FY 2010/11 FY 2011/12 5-Yr Total Project Description CR 512 Phase 4, Seb to I95 $500,000 $500,000 Oslo Rd/43rd Ave to 58th $1,100,000 $1,100, St, 82nd Ave to 58th $287,829 $1,000,000 $1,287,829 16th St, 66th to 74th Ave - 2 lanes $1,000,000 $1,000,000 43rd Ave /8th to Oslo 4 lanes $1,000,000 $1,000,000 58th Ave/77th St-53rd 4 lanes $900,000 $900,000 58th Ave/CR 510 to 77th St 4 lanes $3,500,000 $3,500,000 66th Ave/59th St to SR 60 4 lanes $1,500,000 $1,300,000 $750,000 $3,550,000 66th Ave/77th St to Barber St 4 lanes $2,000,000 $2,000,000 $4,000,000 Misc Right of Way $1,000,000 $1,000,000 82nd Ave over Lateral D $1,209,307 $1,209,307 Misc Intersection Improvements $300,000 $1,050,000 $300,000 $1,650,000 Total $5,509,307 $4,637,829 $5,050,000 $5,500,000 $0 Source: Indian River County Office of Management & Budget, March 16, $20,697,136 The total local credit is based on the average historic and future funding for both the Local Option Gas Tax and Optional Sales Tax revenue sources that are used for capacity-expanding road projects in Indian River County. The summary of the total local funding credit is shown in Table 15. The total average equivalent in terms of County gas tax is $ per gallon. As in the current impact fee calculation, the County component of the transportation impact fee credit is based on the weighted average of the historic and future funding for the Optional Sales Tax and Local Option Gas Tax revenues. Table 15. Local Funding Credit per Gallon Historical Future Average Local Option Gas Tax (LOGT) Funding Total-Capacity Increasing Expenditures/Appropriations $23,078,486 $19,100,000 NA Average Annual Expenditures/Appropriations $3,846,414 $3,820,000 $3,833,207 Average Gas Tax per Penny $882,753 $882,753 $882,753 Local Option Gas Tax per Gallon $ $ $ Optional Sales Tax (OST) Funding Total-Capacity Increasing Expenditures/Appropriations $14,683,129 $20,697,136 NA Average Annual Expenditures/Appropriations $2,447,188 $4,139,427 $3,293,308 Average Gas Tax per Penny $882,753 $882,753 $882,753 Optional Sales Tax Equivalent per Gallon $ $ $ Total Local Funding Gas Tax Credit $ $ $ Source: Historical and future optional sales tax funding from Table 12 and Table 14; historical and future local option gas tax funding from Table 11 and Table 13; gas tax revenue per penny per gallon from Table 10. Federal/State Funding Revenue Credit The State roadway project revenue credit captures the amount of Federal and State motor fuel tax revenue applied toward funding capacity-expanding capital improvements. The equivalent number of pennies allocated to fund State projects was determined based on several different sources of information that covered past and future funding trends from 2001 to First, the amount of Federal and State taxes were determined based on capacity-adding construction and right-of-way projects in the Florida Department of Transportation (FDOT) Work Program Six Year History report Impact Fee Update, Technical Memo #3 (Revised) Duncan Associates Indian River County, Florida 24 July 19, 2007
33 that covers the period from 2001 to Second, the current FDOT FY 2008 through 2012 Draft Tentative Work Program for District 4 was utilized to determine short-term planned funding programmed for capacity-enhancing projects. Finally, this study includes the long-range State projects from the County s 2030 Long Range Transportation Plan in order to quantify the long-term commitment for capacity-enhancing State road projects in Indian River County. The use of all three sources helps smooth the effect of short-term spikes in funding related to large projects, such as the State Road 60 project. Federal and State gas tax funding, based on the historic FDOT expenditures for capacity-enhancing projects, is shown in Table 16. Table 16. FDOT Work Program, FY Project Description Improvement FY 2001 FY 2002 FY 2003 FY 2004 FY 2005 FY 2006 SR-5, County Line to Highland Add Lanes $414,662 $153,704 $2,192,212 $102,977 SR-5, Indian River Blvd Add Lanes $248,673 $446,911 $1,729,617 $7,104,722 $345,780 SR-5, US-1 to Oslo Rd Add Lanes $154,608 $72,275 $999,673 $2,124,594 SR-5, Oslo Rd to Indian River Add Lanes $35,945 $64,253 $195,811 SR-60, MP to MP 22.5 Add Lanes $239,264 $8,037,155 $561,963 $153,907 $646,238 $989,778 SR-60, MP to MP Add Lanes $54,478 $11,660,244 $524,463 $437,294 $1,811,652 $668,638 SR-60, MP to MP Add Lanes $62,674 $15,191,861 $2,224,542 $275,929 $139,146 $887,643 SR-60, MP 7.74 to MP Add Lanes $367,211 $213,069 $18,567,201 $2,722,260 $799,959 $1,437,303 SR-60, MP 3.38 to MP 7.44 Add Lanes $250,567 $1,072,166 $11,811,666 $269,472 $194,815 $165,706 SR-60, MP 3.00 to MP 6.00 Add Lanes $22,696 $259,976 $110,490 $196,126 SR-60, MP 0.75 to MP 3.38 Add Lanes $98,243 $32,554 $8,132,253 $90,937 $9,104 $9,353 SR-60, 27th Ave Vero Beach Intersection $536,079 $6,215 $120,935 SR-60, 82nd Ave to 66th Ave Add Lanes $4,747 $116,467 $26,777 $93,047 $38,377 $1,814,627 SR-60, I-95 to 82nd Ave Add Lanes $264 $991 $8,871 $174 $109 16th/17th St, 14th Ave to SR-5 Add Lanes $1,448 $706,364 $12,750 $282,611 $174,661 $169,587 82nd Ave, 26th St to CR-510 New Road $763,652 $42,059 $87,714 $1,568,702 $7,191 66th Ave, 16th St to SR-60 New Road $1,233,200 Total $1,637,671 $38,309,387 $43,160,151 $6,601,012 $15,743,514 $10,152,297 Source: Florida Department of Transportation, Work Program Six Year History, Adopted. The State road projects from the current FDOT District Four Work Program are shown in Table 17. Much of the funding programmed over the next six years reflects the ongoing Highway 60 improvements, which are scheduled to continue through Impact Fee Update, Technical Memo #3 (Revised) Duncan Associates Indian River County, Florida 25 July 19, 2007
34 Table 17. FDOT Work Program, FY Project Description Improvement FY 2007 FY 2008 FY 2009 FY 2010 FY 2011 FY 2012 SR-5, County Line to Highland Dr Add Lanes $3,591,712 SR-5, Indian River Blvd Add Lanes $1,613,041 SR-5/US-1, Highland Dr to Oslo Add Lanes $7,909,813 $3,600,000 SR-5/US-1, Oslo to Indian River Add Lanes $8,142 $20,568,936 $795,000 SR-60, MP to MP 22.5 Add Lanes $1,866,819 SR-60, MP to MP Add Lanes $1,622 SR-60, MP to MP Add Lanes $345,303 SR-60, MP 7.74 to MP Add Lanes $1,953,678 SR-60, MP 3.38 to MP 7.44 Add Lanes $677,126 SR-60, MP 0.75 to MP 3.38 Add Lanes $199,512 SR-60, 82nd Ave to 66th Ave* Add Lanes $1,311,850 $32,587,100 $1,282,000 SR-60, I-95 to 82nd Ave** Add Lanes $39,659 $5,000,000 SR-5/US-1 Add Lanes $2,945 16/17th St, 14th Av-SR-5/US-1 Add Lanes $1,391,153 $6,366,227 $250,000 82nd Ave, 26th St to CR-510 New Road $44,663 Aviation, 43rd Ave to US 1 Add Lanes $800,000 $800,000 CR-510/Wabasso Rd Study $62,147 Indian River County Signal Traffic Control $9,772 $4,095,115 Indian River County Signal Traffic Control $9,852 $5,067,073 58th Ave Turn Lanes $7,678,720 Total $21,838,809 $29,047,656 $16,323,415 $32,587,100 $1,532,000 $8,600,000 * FDOT Work Program shows $32,777,638 for FY 2008, but this is County advance, to be paid back with FY 2010 programmed funds ** FDOT Work Program shows $24,309,508 in FY 2009, but this is County advance; $5 million in FY 2012 is first installment of repayment Source: Florida Department of Transportation, FY Draft Tentative Work Program, District 4. As mentioned earlier, State road projects in the County s Long Range Transportation Plan are considered to reflect the long-term State funding forecast. The long-term funding averages out short-term funding spikes associated with one-time funding for major State road projects, such as the Highway 60 improvements in the current work program. The long-term credit calculation excludes State funding for improvements to Interstate 95 since the interstate is not included in either the cost or trip length variables used in the current County transportation impact fee schedule. As shown in Table 18, about $129 million in long-term gas tax funding related to non-interstate State road projects is planned over the remaining period. Table 18. State Road Projects in 2030 LRTP, FY 2013 to Work Prog Remaining Project LRTP Cost SR 60, I-95 to 82nd Ave $21,289,000 $5,050,068 $16,238,932 SR 60, 98th Ave to I-95 $2,686,297 $0 $2,686,297 SR 60, 6th Ave to Indian River Blvd $4,000,000 $0 $4,000,000 US 1, S. County Line to Oslo Rd $54,009,000 $0 $54,009,000 US 1, Aviation Blvd to Old Dixie Hwy $46,856,882 $0 $46,856,882 US 1, Roseland Rd to N. County Line $5,549,827 $0 $5,549,827 Total $129,340,938 Source: Indian River County Metropolitan Planning Organization, 2006 Priority Projects Report, 2006; 2001 to 2012 FDOT Work Program costs from Table 16 and Table 17. As in the current impact fee schedule, the Federal and State gas tax funding credit is based on the weighted average of historic, current and long-term funding for State road projects. The 29-year window of the combined FDOT Work Program and LRTP projects generates a long-term average funding in terms of equivalent gas tax funding per gallon, as shown in Table 19. Impact Fee Update, Technical Memo #3 (Revised) Duncan Associates Indian River County, Florida 26 July 19, 2007
35 Table 19. Federal/State Gas Tax Funding Credit per Gallon Total Project Cost Yrs Average Annual Funding Revenue from 1 Cent/Gal. Equivalent Funding per Gallon FDOT Work Program History (FY ) $115,604,032 6 $19,267,339 $882,753 $ FDOT Current Work Program (FY 2007-FY 2012) $109,928,980 6 $18,321,497 $882,753 $ Indian River LRTP (FY ) $129,340, $7,185,608 $882,753 $ Average State Road Funding, FY 2001 to 2030 $354,873, $11,829,132 $882,753 $ Source: FDOT Work Program History from Table 16; FDOT Current Work Program from Table 17; Indian River LRTP from Table 18; gas tax revenue from 1 cent/gallon from Table 10. Revenue Credit Summary Combining the total County and Federal/State revenues per equivalent gas tax per gallon provides the total gas tax revenue equivalency for funding that would be generated by new development through tax revenue for capacity-expanding road projects. As shown in Table 20, the total equivalent credit is $ per gallon, which is slightly higher than the total credit of $ per gallon used in the current impact fee equation. Dividing the credit per gallon by the average miles per gallon gives the daily credit per vehicle-mile; multiplying that by 365 days per year gives the annual credit per vehicle-mile; and multiplying that by the present value factor gives the equivalent current payment that represents the present value of the next 25 years of revenues generated per vehicle-mile of travel. Table 20. Road Credit per Vehicle-Mile County Revenue Credit per Gallon $ Federal/State Revenue Credit per Gallon $ Total Credit per Gallon $ Average Fuel Efficiency (Miles per Gallon) Daily Credit per Vehicle-Mile $ Days per Year 365 Annual Credit per Vehicle-Mile $4.56 Present Value Factor (25 Years at 4.2%) Credit per Vehicle-Mile $70 Source: County credit per gallon from Table 15; Federal/State credit per gallon from Table 19; average miles per gallon for the U.S. motor vehicle fleet from U.S. Department of Transportation, Highway Statistics 2005, Section V, Table VM-1, Average Miles traveled per gallon of motor fuel consumed all motor vehicles; discount rate of 4.2% is the average interest rate on tax-free state and local bonds for the last three months (March through May 2007) from the Federal Reserve. Impact Fee Update, Technical Memo #3 (Revised) Duncan Associates Indian River County, Florida 27 July 19, 2007
36 Travel Demand This section reviews the travel demand characteristics utilized in the current and updated impact fee formula. The travel demand generated by specific land use types is a product of three factors: 1) trip generation; 2) percent new trips; and 3) trip length. Trip Generation Trip generation rates represent trip ends, or driveway crossings at the site of a land use. Thus, a single one-way trip from home to work counts as one trip end for the residence and one trip end for the work place, for a total of two trip ends. The trip generation rates utilized in the current impact fee schedule are based on several sources of information. Approximately one-third of the rates match the most current trip generation rate information published in the current Institute of Transportation Engineers (ITE), Trip Generation manual. The national data from ITE provide the most recent, uniform and widely-utilized source for trip generation rates. In addition, the national trip generation rates compiled by ITE are likely to be applicable to the mix of land uses and trip characteristics found in Indian River County. Source data for the remaining two-thirds of the land use trip generation rates were developed by Tindale- Oliver; these rates vary slightly from the ITE rates and are based on independent trip generation studies. This phase of the study maintains the trip generation rates utilized in the current County road impact fee schedule. Percent New Trips The trip rates are also adjusted by a new trip factor to exclude pass-by and diverted-link trips. This adjustment reduces the possibility of over-counting trips by including only primary trips generated by the development. Pass-by trips are those trips that are already on a particular route for a different purpose and simply stop at a particular development on that route. For example, a stop at a convenience store on the way home from the office is a pass-by trip for the convenience store. A pass-by trip does not create an additional burden on the street system and therefore should not be counted in the assessment of impact fees. A diverted-link trip is similar to a pass-by trip, but a diversion is made from the regular route to make an interim stop. The new trip data utilized in the current schedule are based on a mix of ITE and Tindale-Oliver data from other Florida communities. The same new trip factors are used in this update. Trip Length Trip length represents the average length of a trip on the local major roadway system. The current impact fee schedule is based on total and local trip length factors developed for Indian River County by Tindale-Oliver & Associates. The major roadway trip length includes travel on major municipal, County and State roads, but excludes travel on interstates. In addition to the major road trip length, the current schedule utilizes a total trip length, which includes an additional one-half mile to take into account travel on local (non-major) streets, which is utilized to calculate the revenue credit. The updated fees continue to be based on the trip lengths used in the previous study, but the major roadway trip lengths from that study have been multiplied by the calibration factor from Table 23 below. This reduction of the major roadway trip lengths is necessary to ensure that the total major roadway system VMT calculated by multiplying existing land uses by the travel demand factors Impact Fee Update, Technical Memo #3 (Revised) Duncan Associates Indian River County, Florida 28 July 19, 2007
37 included in the fee schedule does not over-estimate the actual VMT observed on the major roadway system. The total trip length used in the credit calculations is the major roadway trip length plus one-half mile, as in the previous study. Calibration of Travel Demand Factors The travel demand factors used in the impact fee schedule can be calibrated to actual VMT on the major roadway system. This was not done in the previous study, but is best practice. The first step is to estimate the total VMT on the major roadway system that is generated by development in Indian River County. The County conducts trip counts annually for most but not all roads included in the major roadway system. The average daily trips (ADT) figures for 2006 (most recent counts) for each roadway segment are multiplied by the length of the segment in miles and summed to determine the total VMT on the major roadway system (see Appendix C). The results by roadway classification are summarized in Table 21 below. Current traffic counts were not available for all of the roadway segments. For segments without counts, VMT was estimated based on the average volume per lane for segments with counts (for collectors, average volumes were assumed to be only 75 percent of the volume for segments with counts). Total VMT is the sum of observed VMT on segments with counts and estimated VMT on segments without counts. Table 21. Vehicle-Miles of Travel on Major Roadway System Road Classification VMT LM w/ Count Avg. ADT LM w/o Counts Est. VMT Total VMT Principal Arterial 1,086, , ,175 1,116,356 Minor Arterial 670, , , ,226 Collector 713, , , ,285 Total 2,470, ,838 2,985,867 Source: VMT, lane-miles with counts and lane-miles without counts from Appendix C Table 133, Table 134 and Table 135; average ADT is ratio of VMT to lane-miles with counts; estimated VMT is the product of the average volume on segments with counts and lane-miles without counts (estimated VMT on collectors reduced by 25%); total VMT is the sum of VMT and estimated VMT. The next step is to multiply the existing quantities of each land use by the VMT per unit used in the previous study s impact fee schedule to determine the locally-generated VMT that is expected to be present on the major roadway system. Table 22 presents the VMT one would expect to see based on existing land use and the previous study s travel demand factors by land use. Impact Fee Update, Technical Memo #3 (Revised) Duncan Associates Indian River County, Florida 29 July 19, 2007
38 Table 22. Expected Local Vehicle-Miles of Travel Land Use Impact Unit 2007 Units VMT/ Unit Expected VMT Single-Family* Dwelling 51, ,403,069 Multi-Family Dwelling 18, ,280 Mobile Home Dwelling 7, ,779 Commercial 1,000 sf 23, ,464,972 Institutional/Misc. 1,000 sf 6, ,121 Government 1,000 sf 5, ,486 Total * includes single-family detached and single-family attached 3,849,707 Source: 2007 residential units based on 2000 Census and April 1, 2000 through December 31, 2006 building permits from IRC Community Development Department, "Building Permit Information for New Construction: Permits Issued," February 8, 2007 draft; 2007 nonresidential units from IRC Property Appraiser, January 2007; VMT/unit is product of ½ trip rate, major road trip length and percent new trips from Tindale-Oliver & Associates, Update of the Traffic Impact Fee Ordinance, 2004 (commercial is average of all retail, office and industrial categories expressed per 1,000 square feet, institutional is average of all miscellaneous categories except movie theater and government is average of all government categories). The expected system-wide VMT based on existing county-wide land uses and the travel demand factors in the fee schedule is significantly higher than the total system-wide VMT actually observed on the County s major roadways. Observed VMT is only 77.6 percent of expected VMT, as shown in Table 23. This calibration factor will be used to reduce the local trip lengths for individual land use categories used in the previous study. This will have the same effect as reducing total VMT per land use, and is appropriate because trip length is the most locally-variable travel demand factor. Table 23. Trip Length Calibration Factor Observed Local VMT 2,985,867 Expected Local VMT 3,849,707 Observed/Expected 77.6% Source: Observed local VMT from Table 21; expected VMT from Table 22. Travel Demand Schedule The result of combining trip generation rates, primary trip factors and average trip lengths is a travel demand schedule that establishes the VMT during the average weekday generated by various land use types per unit of development for Indian River County. Since each trip involves two trip ends, all trip rates are divided by two in calculating the daily VMT. This places the burden of travel equally between the origin and destination of the trip and eliminates double-charging for any particular trip. Two type of VMT are calculated. Major road VMT consists only of travel on the County s major road system and is used to determine the road improvement cost attributable to the land use. Total VMT includes travel on local roads and is used to determine the revenue credit attributable to the land use. Impact Fee Update, Technical Memo #3 (Revised) Duncan Associates Indian River County, Florida 30 July 19, 2007
39 Table 24. Travel Demand Schedule Daily Trip Length % VMT per Unit ITE Impact Trip Major All New Major All Code Land Use Unit Rate Roads Roads Trips Roads Roads Residential 210 Single Family Less than 1,500 sf Dwelling % ,500 to 2,499 sf Dwelling % ,500 sf or more Dwelling % Multi-Family/Accessory Dwelling % Mobile Home Dwelling % Hotel room % Motel room % Nursing Home bed % ACLF bed % Office and Financial 720 Medical Office 1,000 sf % Bank 1,000 sf % Bank w/drive-in 1,000 sf % Office up to 50,000 sf 1,000 sf % Office over 50,000 sf 1,000 sf % Research & Dev't Center 1,000 sf % Industiral 140 Manufacturing 1,000 sf % Warehouse 1,000 sf % Mini-Warehouse 1,000 sf % General Industrial 1,000 sf % N/A Concrete Plant acre % N/A Sand Mining acre % Retail 820 Retail under 50,000 sf 1,000 sf % Retail 50, ,000 sf 1,000 sf % Retail 100, ,000 sf 1,000 sf % Retail over 200,000 sf 1,000 sf % Gas Station* fuel position % New and Used Auto Sales 1,000 sf % Restaurant 1,000 sf % Fast Food Restaurant 1,000 sf % Supermarket 1,000 sf % Auto Repair 1,000 sf % Car Wash stall % Convenience Store 1,000 sf % Furniture Store 1,000 sf % Recreational 430 Golf Course hole % Racquet/Health/Dance 1,000 sf % County Park acres % Tennis Court court % Marina berth % Impact Fee Update, Technical Memo #3 (Revised) Duncan Associates Indian River County, Florida 31 July 19, 2007
40 Travel Demand Schedule (continued) Daily Trip Length % VMT per Unit ITE Impact Trip Major All New Major All Code Land Use Unit Rate Roads Roads Trips Roads Roads Governmental 732 Post Office 1,000 sf % Library 1,000 sf % Government Office 1,000 sf % Jail bed % Miscellaneous 565 Day Care Center 1,000 sf % Hospital 1,000 sf % N/A Veterinary Clinic 1,000 sf % Church 1,000 sf % Movie Theater 1,000 sf % School (Elementary) 1,000 sf % School (High) 1,000 sf % School (College) 1,000 sf % N/A Fire Station 1,000 sf % *A gas station has a kiosk of less than 1,000 square feet; otherwise, it is classified as a convenience store. Source: Tindale-Oliver & Associates, Update of the Traffic Impact Fee Ordinance Cost Estimate Variable, Indian River County, 2004, with exception that major roadway trip length has been multiplied by the calibration factor from Table 21 (total trip length is major road trip length plus 0.5 miles); major road VMT per unit is one-half of trip rate times major road trip length times percent new trips; total VMT is one-half trip rate times total trip length times percent new trips. Updated Fee Schedule The detailed impact fee calculations for each land use are included in Table 25. The updated fee schedule includes the addition of research and development center and auto repair to the major land use categories, combines accessory single-family with multi-family land uses and removes the quality restaurant land use category. The total impact cost calculation is the product of the daily VMT per land use on the major roadway system and the unit cost of a new road capacity (cost per VMC) calculated earlier in this report. The revenue credit is based on total VMT (travel on local roads as well as major roads) and the revenue credit per VMT calculated earlier in this report. It should be noted that the updated traffic impact fee includes an across-the-board reduction factor of 15 percent, which is the same factor that is included in the current road impact fee schedule. However, this reduction from the maximum fee is not required and is a policy issue to be decided by the governing body. It is included here only to be comparable to the fees derived from the 2004 study. Impact Fee Update, Technical Memo #3 (Revised) Duncan Associates Indian River County, Florida 32 July 19, 2007
41 Table 25. Updated Traffic Impact Fee Schedule VMT/Unit Cost/ Credit/ Total Total Net Updated ITE Impact Major All Major Total Cost/ Credit/ Cost/ Fee/ Code Land Use Unit Road Roads VMT VMT Unit Unit Unit Unit Residential 210 Single Family* Less than 1,500 sf Dwelling $527 $70 $7,394 $1,093 $6,301 $5,356 1,500 to 2,499 sf Dwelling $527 $70 $11,146 $1,648 $9,498 $8,073 2,500 sf or more Dwelling $527 $70 $12,511 $1,849 $10,662 $9, Multi-Family/Accessory Dwelling $527 $70 $6,113 $915 $5,198 $4, Mobile Home Dwelling $527 $70 $4,232 $647 $3,585 $3, Hotel room $527 $70 $6,999 $1,025 $5,974 $5, Motel room $527 $70 $3,815 $582 $3,233 $2, Nursing Home bed $527 $70 $1,238 $205 $1,033 $ ACLF bed $527 $70 $985 $158 $827 $703 Office and Financial 720 Medical Office 1,000 sf $527 $70 $33,459 $4,995 $28,464 $24, Bank 1,000 sf $527 $70 $36,047 $6,075 $29,972 $25, Bank w/drive-in 1,000 sf $527 $70 $61,090 $10,296 $50,794 $43, Office up to 50,000 sf 1,000 sf $527 $70 $15,847 $2,400 $13,447 $11, Office over 50,000 sf 1,000 sf $527 $70 $11,483 $1,739 $9,744 $8, Research & Dev't Center 1,000 sf $527 $70 $7,020 $1,063 $5,957 $5,063 Industiral 140 Manufacturing 1,000 sf $527 $70 $3,304 $501 $2,803 $2, Warehouse 1,000 sf $527 $70 $4,221 $640 $3,581 $3, Mini-Warehouse 1,000 sf $527 $70 $2,166 $328 $1,838 $1, General Industrial 1,000 sf $527 $70 $6,034 $914 $5,120 $4,352 N/A Concrete Plant acre $527 $70 $13,502 $2,045 $11,457 $9,738 N/A Sand Mining acre $527 $70 $1,729 $262 $1,467 $1,247 Retail 820 Retail under 50,000 sf 1,000 sf $527 $70 $22,276 $4,015 $18,261 $15, Retail 50, ,000 sf 1,000 sf $527 $70 $17,528 $3,120 $14,408 $12, Retail 100, ,000 sf 1,000 sf $527 $70 $15,357 $2,699 $12,658 $10, Retail over 200,000 sf 1,000 sf $527 $70 $15,441 $2,602 $12,839 $10, Gas Station** fuel position $527 $70 $15,020 $2,673 $12,347 $10, New and Used Auto Sales 1,000 sf $527 $70 $28,495 $4,303 $24,192 $20, Restaurant 1,000 sf $527 $70 $58,418 $9,424 $48,994 $41, Fast Food Restaurant 1,000 sf $527 $70 $95,640 $17,826 $77,814 $66, Supermarket 1,000 sf $527 $70 $29,696 $5,154 $24,542 $20, Auto Repair 1,000 sf $527 $70 $13,164 $2,062 $11,102 $9, Car Wash stall $527 $70 $38,092 $6,364 $31,728 $26, Convenience Store 1,000 sf $527 $70 $60,294 $11,238 $49,056 $41, Furniture Store 1,000 sf $527 $70 $3,404 $501 $2,903 $2,468 Recreational 430 Golf Course hole $527 $70 $28,310 $4,323 $23,987 $20, Racquet/Health/Dance 1,000 sf $527 $70 $14,182 $2,165 $12,017 $10, County Park acres $527 $70 $1,665 $254 $1,411 $1, Tennis Court court $527 $70 $24,585 $3,755 $20,830 $17, Marina berth $527 $70 $2,451 $374 $2,077 $1,765 Impact Fee Update, Technical Memo #3 (Revised) Duncan Associates Indian River County, Florida 33 July 19, 2007
42 Updated Traffic Impact Fee Schedule (continued) VMT/Unit Cost/ Credit/ Total Total Net Updated ITE Impact Major All Major Total Cost/ Credit/ Cost/ Fee/ Code Land Use Unit Road Roads VMT VMT Unit Unit Unit Unit Governmental 732 Post Office 1,000 sf $527 $70 $35,620 $5,394 $30,226 $25, Library 1,000 sf $527 $70 $43,177 $6,539 $36,638 $31, Government Office 1,000 sf $527 $70 $24,163 $3,659 $20,504 $17, Jail bed $527 $70 $970 $146 $824 $700 Miscellaneous 565 Day Care Center 1,000 sf $527 $70 $23,631 $4,152 $19,479 $16, Hospital 1,000 sf $527 $70 $13,481 $2,017 $11,464 $9,744 N/A Veterinary Clinic 1,000 sf $527 $70 $9,375 $1,647 $7,728 $6, Church 1,000 sf $527 $70 $6,545 $1,013 $5,532 $4, Movie Theater 1,000 sf $527 $70 $30,598 $5,253 $25,345 $21, School (Elementary) 1,000 sf $527 $70 $4,490 $799 $3,691 $3, School (High) 1,000 sf $527 $70 $10,208 $1,559 $8,649 $7, School (College) 1,000 sf $527 $70 $36,901 $5,334 $31,567 $26,832 N/A Fire Station 1,000 sf $527 $70 $2,556 $424 $2,132 $1,812 * includes single-family detached and single-family attached ** A gas station has a kiosk of less than 1,000 square feet; otherwise it is classified as a convenience store. Source: VMT per unit from Table 24; cost per major road VMT from Table 9; credit per total VMT from Table 20; total cost per unit is major road VMT per unit times cost per major road VMT; total credit per unit is total VMT per unit times credit per total VMT; net cost per unit is total cost less total credit per unit; updated fee is net cost reduced by a 15% discount factor as in the 2004 study. The updated fees and current fees are compared in Table 26. Based on the updated cost and credit assumptions utilized in this report, the traffic impact fee would increase by 55% for most land uses. Table 26. Comparison of Current and Updated Traffic Impact Fees ITE Impact Current Updated Percent Code Land Use Unit Fee Fee Difference Residential 210 Single Family* Less than 1,500 sf Dwelling $3,452 $5,356 55% 1,500 to 2,499 sf Dwelling $5,202 $8,073 55% 2,500 sf or more Dwelling $5,838 $9,063 55% 230 Multi-Family/Accessory Dwelling $2,842 $4,418 55% 240 Mobile Home Dwelling $1,957 $3,047 56% 310 Hotel room $3,271 $5,078 55% 320 Motel room $1,764 $2,748 56% 620 Nursing Home bed $560 $878 57% 252 ACLF bed $449 $703 57% Office and Financial 720 Medical Office 1,000 sf $15,553 $24,194 56% 911 Bank 1,000 sf $16,289 $25,476 56% 912 Bank w/drive-in 1,000 sf $27,607 $43,175 56% Impact Fee Update, Technical Memo #3 (Revised) Duncan Associates Indian River County, Florida 34 July 19, 2007
43 Comparison of Current and Updated Traffic Impact Fees (continued) ITE Impact Current Updated Percent Code Land Use Unit Fee Fee Difference 710 Office up to 50,000 sf 1,000 sf $7,348 $11,430 56% 710 Office over 50,000 sf 1,000 sf $5,326 $8,282 56% 760 Research & Dev't Center 1,000 sf NA $5,063 NA Industrial 140 Manufacturing 1,000 sf $1,533 $2,383 55% 150 Warehouse 1,000 sf $1,958 $3,044 55% 151 Mini-Warehouse 1,000 sf $1,003 $1,562 56% 110 General Industrial 1,000 sf $2,797 $4,352 56% N/A Concrete Plant acre $6,261 $9,738 56% N/A Sand Mining acre $803 $1,247 55% Retail 820 Retail under 50,000 sf 1,000 sf $9,837 $15,522 58% 820 Retail 50, ,000 sf 1,000 sf $7,813 $12,247 57% 820 Retail 100, ,000 sf 1,000 sf $6,860 $10,759 57% 820 Retail over 200,000 sf 1,000 sf $6,977 $10,913 56% 944 Gas Station fuel position $6,694 $10,495 57% 841 New and Used Auto Sales 1,000 sf $13,212 $20,563 56% 932 Restaurant 1,000 sf $26,646 $41,645 56% 934 Fast Food Restaurant 1,000 sf $41,971 $66,142 58% 850 Supermarket 1,000 sf $13,288 $20,861 57% 848 Auto Repair 1,000 sf NA $9,437 NA 947 Car Wash stall $17,232 $26,969 57% 853 Convenience Store 1,000 sf $26,459 $41,698 58% 890 Furniture Store 1,000 sf $1,592 $2,468 55% Recreational 430 Golf Course hole $13,090 $20,389 56% 492 Racquet/Health/Dance 1,000 sf $6,556 $10,214 56% 412 County Park acres $769 $1,199 56% 491 Tennis Court court $11,368 $17,706 56% 420 Marina berth $1,132 $1,765 56% Governmental 732 Post Office 1,000 sf $16,518 $25,692 56% 590 Library 1,000 sf $20,023 $31,142 56% 733 Government Office 1,000 sf $11,205 $17,428 56% 571 Jail bed $449 $700 56% Miscellaneous 565 Day Care Center 1,000 sf $10,555 $16,557 57% 610 Hospital 1,000 sf $6,267 $9,744 55% N/A Veterinary Clinic 1,000 sf $4,189 $6,569 57% 560 Church 1,000 sf $3,016 $4,702 56% 443 Movie Theater 1,000 sf $13,715 $21,543 57% 520 School (Elementary) 1,000 sf $2,003 $3,137 57% 530 School (High) 1,000 sf $4,723 $7,352 56% 540 School (College) 1,000 sf $17,319 $26,832 55% N/A Fire Station 1,000 sf $1,158 $1,812 * includes single-family detached and single-family attached 56% Source: Updated impact fee from Table 25; current fee from Indian River County, Ordinance Impact Fee Update, Technical Memo #3 (Revised) Duncan Associates Indian River County, Florida 35 July 19, 2007
44 Revenue Projections Potential impact fee revenue is difficult to project, since recent building trends do not necessarily reflect future building activity. The revenue estimates shown below should be used cautiously, as they are intended primarily to provide a weighted comparison between the current and updated fee schedules. Based on the average annual amount of development experienced over the last six years, it is estimated that the updated traffic impact fees will generate about 54 percent more revenue than would be generated under the current fee schedule, as shown in Table 27. Table 27. Traffic Impact Fee Revenue Estimates Avg. Annual Impact Fee Rates Impact Fee Revenues Percent Land Use Type Impact Units Current Updated Current Updated Change Single-Family* 2,384 $5,202 $8,073 $12,400,000 $19,243,000 55% Multi-Family 476 $2,842 $4,418 $1,353,000 $2,103,000 55% Mobile Home 57 $1,957 $3,047 $111,000 $173,000 56% Nonresidential (1000 sf) $10,164 $15,492 $7,952,000 $12,121,000 52% Total $21,816,000 $33,640,000 54% * includes single-family detached and single-family attached Source: Average annual impact units from 2001 to 2006 county-wide building permit data; impact fee rates from Table 26 (nonresidential fees are averages of all nonresidential land uses charged on a square footage basis). Impact Fee Update, Technical Memo #3 (Revised) Duncan Associates Indian River County, Florida 36 July 19, 2007
45 SCHOOLS This section of the study updates school impact fee calculations. The Indian River County Board of County Commissioners adopted an ordinance imposing school impact fees in The countywide ordinance requires all new residential development within Indian River County to pay applicable impact fees prior to the issuance of a building permit. Municipalities within the county collect the fees and turn them over to the County, which in turn transmits them to the School District to be spent on growth-related improvements according to the terms of an interlocal agreement between the County and the School District. The School District operates 21 public school facilities. The locations of the schools are shown in Figure 3. Current Level of Service A fundamental principle of impact fees is that new development should not be held to a higher standard than existing development. If the impact fees are based on a higher standard than currently exists, new development must not be required to pay both the impact fee and the taxes that are used to remedy the existing deficiency, unless credit against the fees is given for such tax payments. School Capacity The Florida Department of Education (DOE) maintains an inventory of student capacity in schools. This inventory is referred to as the Florida Inventory of School Houses (FISH). There are two official measures of school capacity: FISH Satisfactory Student Stations and Actual FISH Capacity. FISH Satisfactory Student Stations are computed by multiplying the corecurriculum classrooms by the maximum students per class by grade level (different capacities are specified for specialized classrooms). In the November 2002 election, Florida voters approved the Classroom Size Reduction Amendment (Amendment 9) to the Florida Constitution. Section 1 of Article IX of the State Constitution establishes, by the beginning of the 2010/2011 school year, the following maximum number of students in core curricula courses assigned to a teacher: (1) Prekindergarten through grade 3: 18 students; (2) grades 4 through 8: 22 students; and (3) grades 9 through 12: 25 students. Actual FISH Capacity takes into account DOE adopted utilization rates. The official utilization rates are: 100 percent of Satisfactory Student Stations for elementary schools, 90 percent for middle schools and 95 percent for high schools. Utilization rates give districts some flexibility at middle and high school levels to accommodate reasonable inefficiencies created with multiple class changes, electives and other activities. For the purposes of this report, actual FISH capacity is used. Impact Fee Update, Technical Memo #3 (Revised) Duncan Associates Indian River County, Florida 37 July 19, 2007

46 Figure 3. Locations of Existing Public Schools Impact Fee Update, Technical Memo #3 (Revised) Duncan Associates Indian River County, Florida 38 July 19, 2007
47 Existing School Inventory To determine the current level of service for educational facilities in Indian River County, an inventory was prepared of existing schools for the 2006/2007 school year. Table 28 shows the existing school inventory, including the name of each school, grade level, site area in acres, building square feet (permanent and portable) and student capacity (permanent and portable). Charter schools are not included in the inventory, because the District is not responsible for funding the capital costs of serving these students. The School District of Indian River County operates 21 public education facilities serving prekindergarten through the 12th grade. These facilities total more than 2.1 million square feet and have a capacity of almost 20,000 students. However, the District is in the process of eliminating or at least significantly reducing the use of relocatable classrooms. Consequently, the existing level of service will be based exclusively on permanent capacity. Table 28. Inventory of Public Schools, 2007 Building Square Feet Student Capacity Educational Facility Acres Perm. Port. Total Perm. Port. Total Beachland Elementary 26 63, , Citrus Elementary 20 74,775 5,096 79, Dodgertown Elementary 20 69,392 11,558 80, Fellsmere Elementary 10 66,147 9,584 75, Glendale Elementary 21 62,023 6,048 68, Highlands Elementary 18 59,945 1,664 61, Pelican Island Elementary 32 64,812 4,376 69, Rosewood Elementary 15 61, , Sebastian Elementary 20 73,307 1,728 75, Thompson Elementary 15 62, , Treasure Coast Elementary 20 90,095 4,320 94, Vero Beach Elementary 20 60,445 5,088 65, Liberty Magnet 20 87, , Osceola Magnet School 15 66,928 5,156 72, Subtotal, Elementary ,076 55,458 1,018,534 8,246 1,077 9,323 Gifford Middle ,215 13, ,695 1, ,591 Oslo Middle ,927 6, ,981 1, ,389 Sebastian River Middle ,685 22, ,752 1, ,739 Subtotal, Middle School ,827 41, ,428 3,322 1,027 4,719 Sebastian River Senior High ,858 14, ,226 1, ,308 Vero Beach Senior High ,903 25, ,255 2, ,333 Subtotal, High School ,761 39, ,481 4, ,641 Alternative Education Ctr 14 33, , Wabasso School 8 19, , Subtotal, Alternative 22 53, , Grand Total 549 2,034, ,779 2,171,606 16,672 2,879 19,921 Source: School District of Indian River County, January 2007 spreadsheet and February 12, 2007 teleconference. Impact Fee Update, Technical Memo #3 (Revised) Duncan Associates Indian River County, Florida 39 July 19, 2007
48 It should be noted that the School District also operates a number of administrative and support facilities. However, sufficient information on such facilities was not provided in time to be included in this draft. The cost of administrative and support facilities may be added in subsequent drafts of the school impact fee update. The existing level of service will be measured as the ratio of current students to Actual FISH Capacity in permanent buildings. As shown in Table 29, Indian River County provides more than one unit of capacity per student at the system-wide level. Table 29. Public School Enrollment and Capacity, Enrollment Perm. FISH Capacity School Oct 2006 Oct / /12 Beachland Elementary Citrus Elementary Dodgertown Elementary Fellsmere Elementary Glendale Elementary Highlands Elementary Liberty Magnet Osceola Magnet School Pelican Island Elementary Rosewood Elementary Sebastian Elementary Thompson Elementary Treasure Coast Elementary Vero Beach Elementary New Elementary School "C" New Elementary School "D" New Elementary School TBD Subtotal, Elementary 7,675 9,490 8,246 10,346 Gifford Middle 1,386 1,070 1,122 1,122 Oslo Middle 1,120 1,107 1,117 1,117 Sebastian River Middle 1,307 1,242 1,083 1,149 New Middle School "BB" 0 1, ,050 Subtotal, Middle School 3,813 4,547 3,322 4,438 Sebastian River Senior High 1,972 2,177 1,933 2,023 Vero Beach Senior High 2,742 2,848 2,933 2,771 Subtotal, High School 4,714 5,025 4,866 4,794 Alternative Education Center Wabasso School Subtotal, Alternative Grand Total 16,370 19,320 16,672 19,816 Source: School District of Indian River County, January 2007 spreadsheet and February 12, 2007 teleconference. Impact Fee Update, Technical Memo #3 (Revised) Duncan Associates Indian River County, Florida 40 July 19, 2007
49 Level of Service Summary The County s adopted level of service for schools is expressed in terms of building square feet per student station: 2 County wide level-of-service standard for Elementary Schools of building square feet per student station County wide level-of-service standard for Middle Schools of building square feet per student station County wide level-of-service standard for High Schools of building square feet per student station County wide weighted average level-of-service standard for all schools of building square feet per student station These level-of-service standards were adopted to be consistent with the previous impact fee study, not for concurrency purposes. The draft interlocal agreement between the School District, the County and the municipalities for school concurrency, as approved by the School Board on February 13, 2007, establishes the following standard (the School Service Areas are defined as elementary, middle and high school attendance zones): The adopted level of service for each year of the five year planning period and through the long term planning period for each School Service Area will be 100% of the FISH permanent capacity. Both the adopted standards in the Comprehensive Plan and the proposed concurrency standards apply at levels below the entire school system (grade level for the adopted non-concurrency standard and individual schools for the draft concurrency standard approved by the School Board). The adopted standard is more of a construction design standard (square feet per student station) than a ratio of demand (enrollment) to capacity. In the arena of school impact fees, the most appropriate level of service is expressed as the overall ratio of student enrollment to permanent school FISH capacity. As shown above, the School District currently provides one unit of permanent FISH capacity per enrolled student. The impact fees will be based on a one-to-one ratio of capacity to enrollment. This is not identical to the proposed concurrency standard, since it applies at the system-wide level and not to individual schools, but it is consistent with it. 2 Indian River County, 2020 Comprehensive Plan, Chapter 6: Capital Improvements Element, Policy 3.6 (non-concurrency management level-of-service standards), adopted December 12, Impact Fee Update, Technical Memo #3 (Revised) Duncan Associates Indian River County, Florida 41 July 19, 2007
50 Cost Component In determining the cost of providing public school facilities in Indian River County, the first step is to calculate the facility cost per student capacity. Several cost components must be considered when calculating the total cost of constructing a school facility. These cost components include construction costs, design and engineering costs associated with construction, public utility connection costs, furniture, fixtures and equipment (FF&E) costs and the cost of land. The weighted average construction cost per square foot for each of type of school is developed based on these cost components. The School District of Indian River County completed four construction projects in 2006: an elementary school, an alternative center, a middle school gym and a multipurpose building (see Table 30). The building cost per square foot for the Liberty Magnet Elementary School is the most recent available, and provides a reasonable cost per square foot for elementary construction. While the Gifford projects are not necessarily directly representative of middle schools or high schools, they do show significantly higher costs per square foot than for elementary schools. The total project costs provide reasonable estimates of the percent of building cost for architectural/engineering fees, utilities, road improvements and site work and furniture and equipment. Table 30. Recent School Construction Costs Liberty Magnet Elementary Gifford Alternative Center Gifford Middle Gym Rosewood Multipurpose Building Total % of Building Cost Building Cost $13,692,597 $7,447,343 $4,855,268 $924,524 $26,919,732 Architectural/Engin. Fees $671,796 $88,447 $240,794 $58,361 $1,059, % Utilities/Roads/Site Work $1,563,896 $6,390 $23,769 $0 $1,594, % Furniture and Equipment $1,756,373 $745,552 $63,443 $1,987 $2,567, % Total Cost $17,684,662 $8,287,732 $5,183,274 $984,872 $32,140,540 Square Feet 91,667 33,718 19,589 2, ,154 Student Stations NA Student Capacity NA Building Cost per Square Foot $ $ $ $ $ Total Cost per Square Foot $ $ $ $ $ Cost per Student Capacity $25,704 $28,190 $35,995 NA NA Square Feet per Capacity NA NA Source: School District of Indian River County, Report of Cost of Construction Forms submitted to Department of Education in Recent school construction costs for middle and high schools are not available. However, the District recently received an architect s construction cost estimate of $220 per square foot for a new middle school, excluding contingency, FF&E and professional fees and studies. While no recent local construction cost experience or estimate is available for high schools, it is reasonable to assume that the construction cost per square foot for high schools will be at least as high as the recent estimate for the new middle school. Impact Fee Update, Technical Memo #3 (Revised) Duncan Associates Indian River County, Florida 42 July 19, 2007
51 State school construction cost guidelines can be used as a reference point for recent local costs. The most recent guidelines were established by statute in 2006 and are intended to be adjusted annually, using the Consumer Price Index (CPI). The guidelines are in terms of costs per student station, and must be adjusted to convert to costs per FISH capacity. Dividing the current State construction cost guidelines per FISH capacity by the average local square feet per student capacity yields the equivalent State guideline costs per square foot. As can be seen in Table 31, the recent local cost of the Liberty Magnet Elementary School as about five percent lower than the State guideline, while the current estimate for the new middle school is about 15 percent higher. Table 31. Estimated Local School Building Costs per Square Foot Elem. Middle High State Guidelines, January 2006 $17,952 $19,386 $25,181 CPI Ratio, Jan to Jan Construction Cost per Student Station $18,325 $19,789 $25,705 Student Stations per FISH Capacity Construction Cost per FISH Capacity $18,325 $21,986 $27,067 Avg. Square Feet per Student Capacity State Cost Guidelines per Square Foot $ $ $ Recent or Planned Building Cost per Square Foot $ $ NA Ratio of Local Cost to State Guideline NA Estimated Local Costs per Square Foot $ $ $ Source: State legislative guidelines from Sec (6)(b)1; U.S. Consumer Price Index for All Items from Bureau of Labor Statistics, student stations per FISH capacity is inverse of DOE utilization rates of 1.00 for elementary, 0.90 for middle and 0.95 for high school; average square feet per student capacity derived from Table 28; recent or planned building cost is Liberty Elementary building cost per square foot from Table 30 and architect s estimate for Middle School BB prepared by SchenkelShultz Architecture on February 26, In addition to the actual cost of the school facility, design and engineering costs, public utility connection costs, FF&E costs and the cost of land are also determined for each type of school by taking a percentage of the total construction cost per facility. The various percentages used for each of these cost calculations are based on the costs of recently constructed school facilities in Indian River County. The cost of land must be considered. The land cost per student capacity for each school type is determined by using a cost per acre figure of $95,000, which is based on the District s most recent acquisition ( acre parcel for $14,456,150 in 2006). The cost of land per square foot of building by school type is determined by multiplying the per acre cost by the average number of acres for each type of school, then dividing by the average building square feet of that school type. Finally, ancillary facility costs should be considered. Information is available on the cost of buses used to transport students, and the bus fleet will need to be expanded as student enrollment increases. The replacement cost of the current bus fleet was not available. Based on original costs, bus costs amount to $366 per student, as shown in Table 32. Impact Fee Update, Technical Memo #3 (Revised) Duncan Associates Indian River County, Florida 43 July 19, 2007
52 Table 32. School Bus Cost per Student Year Model Unit Cost Number Total Cost 1992 Bluebird $71,194 3 $213, Bluebird $74,444 1 $74, International $38,252 8 $306, Bluebird $69,045 1 $69, International $42, $892, Thomas $42,487 1 $42, Thomas $43,321 2 $86, International $43,321 1 $43, Thomas $49,013 1 $49, International $49,013 2 $98, Thomas $72,086 1 $72, Thomas $51,329 2 $102, Thomas $55,267 2 $110, Thomas $48,745 1 $48, Freightliner $49, $588, Freightliner $68,562 1 $68, Freightliner $55, $552, Freightliner $72,955 1 $72, Freightliner $55,673 6 $334, Freightliner $68,207 1 $68, Thomas $52,494 4 $209, Thomas $71,793 1 $71, Thomas $56,399 6 $338, Thomas $75,950 1 $75, Thomas $58,700 6 $352, Thomas $77,731 1 $77, Bluebird $68, $816, Bluebird $77,269 2 $154,538 Total Cost $5,991,497 Students 16,370 Cost per Student $366 Source: Bus inventory and unit costs from School District of Indian River County, March 16, 2007 (costs are original historic costs, not replacement costs); current student enrollment from Table 29. Impact Fee Update, Technical Memo #3 (Revised) Duncan Associates Indian River County, Florida 44 July 19, 2007
53 Table 33 provides a summary of the cost per square foot and the cost per student capacity for each school type. The result is a weighted average cost of $30,012 per student capacity. Table 33. School Capital Cost per Student Elem. Middle High Wtd Avg. Avg. Square Feet per Student Capacity NA Avg. Square Feet per School 68, , ,881 NA Avg. Acres per School NA School Facility Cost Components: Construction Cost per Square Foot $ $ $ NA Arch./Engineering Cost per Square Foot $5.83 $8.58 $8.58 NA Utilities/Roads/SiteWork Cost per Square Foot $8.81 $12.98 $12.98 NA FF&E Cost per Square Foot $14.19 $20.90 $20.90 NA Subtotal, Non-Land Cost per Square Foot $ $ $ NA Land Cost per Square Foot $26.83 $23.58 $23.91 NA Total Facility Cost per Square Foot $ $ $ NA Bus Cost per Square Foot $3.13 $3.18 $2.80 Total Cost per Square Foot $ $ $ Percent of Projected Students (2010) 49.79% 23.85% 26.36% % Cost per Student Capacity $24,311 $33,330 $37,780 $30,012 Source: Average school characteristics derived from Table 28; construction cost per square foot from Table 31; design, engineering, utilities and FF&E costs based on percentages from Table 30; land costs based on $95,000 per acre based on District s most recent acquisition (option contract re-approved by School Board on September 27, 2005) and average square feet per student capacity, average square feet per school and average acres per school; bus cost per square foot is bus cost per student from Table 32 divided by square feet per student capacity; cost per student capacity is cost per sq. ft. times square feet per student capacity; weighted average cost per student capacity weighted by percent of projected October 2010 students by grade level from Table 29. The previous study also included the cost of interest associated with financing school construction with debt instruments such as Certificates of Participation (COPs). In this update, a different approach is taken to interest costs. Since interest costs are not included on the cost side of the equation, revenue credit is not provided for the interest portion of debt payments made by new development. Revenue Credits In addition to paying school impact fees, new development will also pay for school facilities through its future contributions to other capital funding sources that will be used to pay for expanding school capacity. The impact fees will be reduced by the present value of those future contributions expected to be made over the next 25 years in order to ensure that new development is not charged twice for the same facilities. Credit for future revenues, however, only needs to be given for funds that will be available for capacity-expanding improvements. The District s official five-year Capital Improvements Program (CIP) will be examined to estimate the percent of future capital funding likely to be received by the District over the next 25 years that will be available to pay for capacity-expanding improvements. The capital expenditures and revenues anticipated by the School Board over the next five years, as set forth in the District s five-year CIP, are summarized in Table 34. Since the District must bring existing schools up to Amendment 9 standards while also accommodating unprecedented growth, Impact Fee Update, Technical Memo #3 (Revised) Duncan Associates Indian River County, Florida 45 July 19, 2007
54 the five-year plan contemplates a massive program of new school construction. Most of capacityrelated improvements will be paid either with school impact fees or non-recurring revenues, including fund balance and debt proceeds. Non-earmarked recurring revenues, which consist primarily of the District s 2-mill Capital Improvements Tax, will be spent primarily on non-capacity improvements. Only 26.94% of non-earmarked recurring revenues will be spent on capacity improvements over the next five years. Table 34. Planned School Capital Expenditures and Revenues, Total Capacity Non-Capacity New Schools $141,000,000 $141,000,000 Additions $8,002,500 $8,002,500 Simon Mall Facility $325,000 $325,000 Site Acquisition $2,500,000 $2,500,000 Modernizations/Replacements $39,591,581 $39,591,581 Capital Maintenance $48,262,488 $48,262,488 Safety/Security/Environmental $9,089,000 $9,089,000 Relocatable Leasing/Renovation $10,450,000 $10,450,000 Educational Technology $12,316,931 $12,316,931 School Buses/Other Vehicles $8,824,000 $1,764,800 $7,059,200 Ancillary Facilities and Equipment $437,139 $437,139 COPs Debt Service $69,802,995 $19,028,296 $50,774,699 Works in Progress Carryover $39,491,795 $39,491,795 Total Expenditures $390,093,429 $224,866,461 $165,226,968 Impact Fees $13,200,000 $13,200,000 COPs Proceeds $100,838,434 $100,838,434 PECO New Construction $2,033,204 $2,033,204 PECO Maintenance $3,962,112 $3,962,112 CO&DS $1,500,000 $1,500,000 Classrooms for Kids $8,183,025 $8,183,025 Other State Sources $150,000 $150,000 Fund Transfer $39,491,795 $39,491,795 Paid w/non-earmarked Recurring Revenue $220,734,859 $59,470,003 $161,264,856 Percent % 26.94% 73.06% Source: School District of Indian River County, Capital Improvement Program, FY ; 20% of bus costs attributed to capacity, as replacement buses have about 20% more seats than existing buses, and COPs proceeds for new middle and high school, per School District, February 12, 2007 teleconference; non-capacity debt service includes interest payments and share of principal attributable to non-capacity projects based on review of official statements for 2005 COPs and 2003 GO bonds. The State of Florida provides limited funding for capital improvements. The two sources of regular annual State capital funding, Public Education Capital Outlay (PECO) and Capital Outlay and Debt Service (CO&DS), have diminished in recent years and are no longer significant sources of capital funding. PECO new construction revenues to school districts are actually the proceeds of bonds that are retired with revenue from a State surtax on telephone lines. Due to a decrease in phone lines caused by increased usage of cell phones and alternatives to dial-up internet access, among other trends, PECO funding is in decline. Based on budgeted revenues that will be available over the next five years, the total projected State revenues available for the expansion of student capacity is about $10.4 million. Thus, the annual PECO, CO&DS and Classroom for Kids funds are divided by the planned 4,395 new units of Impact Fee Update, Technical Memo #3 (Revised) Duncan Associates Indian River County, Florida 46 July 19, 2007
55 student capacity that, according to the School District, are expected to be constructed over the next five years to calculate a State revenue credit of $2,359 per student, as summarized in Table 35. Table 35. School State Revenue Credit PECO New Construction $2,033,204 Classrooms for Kids $8,183,025 Misc. State Sources $150,000 Total State Revenues $10,366,229 Planned New Student Capacity 4,395 State Revenue per New Student $2,359 Source: School District of Indian River County, Capital Improvements Program, FY ; planned student capacity from School District, Tentative Facilities Work Program submitted to Department of Education prior to Oct. 1, School districts in Florida are authorized to impose a maximum 2-mill property tax for capital improvements known as the Capital Improvement Tax (CIT). New residential developments that will send children to District schools will also pay the CIT. Therefore, it is necessary to calculate a credit to equitably reflect what new developments will pay toward their school capital needs through their CIT payments. The CIT millage rate assessed by the School District of Indian River County is at the maximum level of $2.00 per $1,000 of taxable value. As noted earlier, credit needs to be provided only for CIT revenue that will be used for capacityexpanding improvements. Applying the percentage of non-earmarked recurring capital funding available for capacity expansion to projected CIT revenues over the next five years, yields the CIT revenues available for capacity expansion. Dividing the annual CIT capacity funding by the average annual number of students during the period results in the annual capacity payment per student that can be expected from new development. The present value of this annual revenue per student over the next 25 years is determined based on current average long-term interest rates. This results in a present value credit of $10,421 per student, as shown in Table 36. Table 36. School Capital Improvements Tax Revenue Credit Total Five-Year Projected 2-Mill Revenues $216,424,770 Percent of Recurring Revenue used for Capital Expansion 26.94% Five-Year Projected 2-Mill Revenues to Capital Expansion $58,304,833 Years Projected 5 Average Annual Five-Year 2-Mill Revenue Used for Capital Expansion $11,660,967 Total Five-Year Average Annual Students 17,120 2-Mill Annual Revenue Per Student $ Present Value Factor (25 years at 4.2% discount rate) Present Value of Annual 2-Mill Revenue per Student $10,421 Source: Total five-year projected 2-mill revenues from the School District of Indian River County s 5-year work plan; percent of recurring, non-earmarked revenue for capacity from Table 34; average annual students for years 2006/07 to 2010/11 from page 8 of Tentative Facilities Work Program submitted to DOE prior to October 1, 2006; discount rate is average interest rate on tax-free municipal bonds for March through May 2007 from US Federal Reserve. It is the School District s intent to use impact fee revenues as the primary funding source for future capital expansion needs and to maintain or reduce the average annual dollar amount shown in this Impact Fee Update, Technical Memo #3 (Revised) Duncan Associates Indian River County, Florida 47 July 19, 2007
56 report toward capital expansion needs. In other words, the District intends to use non-impact fee revenue sources as the primary funding source for capital replacement, operations and maintenance expenses. As such, credit calculations for future expenditures do not include an escalation factor. The last credit is for past payments of property taxes for vacant land. The first step is to determine vacant land s share of total county-wide property value. This is multiplied by the percent of capacity expansion expenditures paid for with non-earmarked, recurring revenue sources, which is essentially the Capital Improvement Tax. This results in the percentage of the capital cost of schools that is paid for with property taxes from vacant land which when multiplied by the cost per student capacity gives a credit of $755 for past property taxes shown in Table 37. Table 37. School Past Property Tax Credit Percentage County-wide Vacant Land Property Value $2,419,297,960 County-wide Total Property Value $25,440,066,977 Vacant Land Value Percentage 9.51% % of Capital Expansion Funded with Property Tax 26.45% Effective Vacant Land Value Percentage 2.52% Cost per Student Capacity $30,012 Past Property Tax Credit per Student $755 Source: Property values from Indian River County Property Appraiser, January 22, 2007; % of capacity funding from property tax is derived from Table 34 (capacity expenditures paid for by non-earmarked recurring revenue divided by total capacity expenditures); cost per student capacity from Table 33; past property tax credit is the product of the effective vacant land value percentage and the weighted cost per student capacity. Reducing the capital cost per student by the amount of the credits for anticipated State funding, the present value of future property taxes that will be paid by new residential development and available to fund capital improvements and past property tax payments from vacant land results in the net cost per student of $16,477 (as shown in Table 38). Table 38. School Net Cost per Student Total Capital Cost per Student $30,012 State Revenue Credit per Student $2,359 Capital Improvement Tax Revenue Credit per Student $10,421 Past Property Tax Credit Per Student $755 Net Cost per Student $16,477 Source: Total cost per student from Table 33; state revenue credit from Table 35; CIT credit from Table 36; past property tax credit is percentage from Table 37 times total cost per student. Student Generation Rate The impact of new residential development on the demand for public school facilities is based on the average number of public school students generated per dwelling unit. The student generation rates are not calculated as the ratio of students to occupied units, since not all units are occupied at all times. To take into account less than full occupancy, the student generation rates are calculated as the ratio of students to total dwelling units. Impact Fee Update, Technical Memo #3 (Revised) Duncan Associates Indian River County, Florida 48 July 19, 2007
57 The best available data source on student generation rates by type of dwelling unit is the 2000 U.S. Census 5-percent Public-Use Microdata Samples (PUMS). The 2000 PUMS data for Indian River County are combined with Okeechobee County, although Indian River County accounts for 76 percent of the population in the sample area. The sample data consist of census enumerations for 3,963 occupied and vacant housing units. In using the census sample data, public school students are defined as persons enrolled in public school and attending preschool through 12th grade. The student generation rates from the 2000 census sample data by housing type are shown in Table 39. Table 39. Uncalibrated Student Generation Rates, 2000 Housing Type Students Units Students/Unit Single-Family* 16,337 40, Multi-Family 1,767 18, Mobile Home 3,661 14, Total 21,765 73, * includes single-family detached and single-family attached Source: 2000 US Census, weighted PUMS 5% sample data for Indian River and Okeechobee counties (students defined as public school students below college level). To ensure that the regional student generation rates derived from the 2000 sample data are representative of actual conditions in Indian River County in 2007, the expected total number of public school students based on the number of dwelling units estimated to exist in 2007 and the student generation rates derived from the 2000 census sample data is compared to the actual current public school enrollment in Indian River County. As Table 40 shows, the actual number of students enrolled in Indian River County Public Schools is only 67.6 percent of the expected number of students. It is difficult to know how much of this very large difference is due to sampling error, actual decline in student generation rates since 2000, or a temporary decline in housing occupancy rates since To be conservative, the rates for all housing types are reduced by this percentage to get the calibrated student generation rates shown in Table 40. Housing Type Table 40. Calibrated Student Generation Rates, 2007 Uncalibrated Students/Unit Units Expected Students Actual Students Calibrated Students/Unit Single-Family* ,451 20,606 13, Multi-Family ,091 1,773 1, Mobile Home ,232 1,845 1, Total ,774 24,224 16, * includes single-family detached and single-family attached Source: Uncalibrated students per unit from Table 39; existing units from Table 127; expected students is product of uncalibrated rates and existing units; total actual students is Oct enrollment from Table 29; actual students by grade level is expected students reduced by ratio of total actual to total expected students; calibrated students per unit is ratio of actual students to units. In 2006, the School District commissioned a study of student generation rates. 3 This study used GIS technology to assign the home address for every student enrolled in the School District in 2005 to the nearest residential parcel in the Property Appraiser s data base. Each student was assigned one of three housing types: single-family, multi-family or mobile home (the single-family category included condominiums, which makes the results of this analysis not strictly comparable with the 3 Fishkind and Associates, Indian River County Student Generation Rates by Housing Type, May Impact Fee Update, Technical Memo #3 (Revised) Duncan Associates Indian River County, Florida 49 July 19, 2007
58 housing types used in this report). Then the number of students in each housing type was divided by the existing number of dwelling units shown in the Property Appraiser data for that housing type, reduced by ten percent to reflect an average 90 percent vacancy rate. The student generation rates per occupied housing unit derived from the address-matching analysis are shown in Table 41. For impact fee purposes, however, it is not appropriate to assume that every unit will be occupied, since there is a need to account for normal turnover (periods of vacancy between when one household moves out and another moves in) as well as units held for seasonal use and not occupied on a permanent, year-round basis. Consequently, the students per occupied unit identified in the address-matching analysis have been reduced by ten percent to yield students per total unit. These are compared with the student generation rates derived from the 2000 US Census microdata and calibrated to October 2006 enrollment in the following table. The addressmatching multiplier is higher for single-family, even though it includes condominium units, which have been classified as multi-family in the Census multipliers and would be expected to lower, not increase, the single-family rate. The address-matching multipliers are lower for multi-family and mobile home. The weighted average rate derived from the address-matching analysis is about times the weighted average rated derived by dividing current enrollment by estimated total existing dwelling units. There are two major possibilities to account for this discrepancy -- either the Property Appraiser data under-estimate total units because of a lag between construction and entry onto the tax rolls, or the estimates calculated in this study based on 2000 U.S. Census counts and subsequent building permits over-estimate existing units by not accounting for demolitions or counting units that are under construction but not yet completed. Perhaps it is some combination of the two. In any case, the single-family rate derived from the address-matching process is not directly comparable to the one derived from the Census because it includes condominiums (the multi-family rates are also not comparable for the same reason). The problem with defining condominium as single-family is that condominium status is dependent on the type of ownership, which can change over time. In addition, condominiums are unlikely to have student generation rates similar to singlefamily detached or single-family attached (townhouse) structures, because they do not have private yards and tend to have fewer families with children. For these reasons, this study will rely on the student generation rates derived from the calibrated Census data. Table 41. Comparison of Student Generation Rates Address-Matching Analysis Census Data Ratio of Address-Matching Housing Type Students/ Occupied Unit Students/ Total Unit Students/ Total Unit to Census Single-Family* Multi-Family Mobile Home Total * includes condominiums in address-matching data, but not in census data Source: Address matching analysis results from Fishkind and Associates, Indian River County Student Generation Rates by Housing Type, May 2006; Census data results calibrated to October 2006 enrollment from Table 40. Impact Fee Update, Technical Memo #3 (Revised) Duncan Associates Indian River County, Florida 50 July 19, 2007
59 Updated Impact Fee Schedule The net cost per dwelling unit is the product of the number of public school students that, on average, can be expected to be generated from the type of unit and the net cost per student calculated in this report. The resulting net costs, which represent the maximum school impact fees that can be justified based on the analysis contained in this study, are shown in Table 42. Table 42. Updated School Impact Fee Schedule Residential Land Use Impact Unit Net Cost/ Student Students per Unit Net Cost/ Unit Single-Family* Dwelling $16, $4,459 Multi-Family/Accessory Dwelling $16, $1,091 Mobile Home Dwelling $16, $2,841 * includes single-family detached and single-family attached Source: Net cost per student from Table 38; students per unit from Table 40. The potential impact fees shown above represent a significant increase from the current fees, as shown in Table 43. The largest increase is for mobile homes, reflecting the relatively greater student generation rates documented in this study compared to the previous study. Residential Land Use Table 43. Comparative School Impact Fees Impact Unit Current Fee Updated Fee Percent Change Single Family Dwelling $1,756 $4, % Multi-Family/Accessory Dwelling $500 $1, % Mobile Home Dwelling $623 $2,841 Source: Updated fee from Table % Revenue Projections Table 44 presents the school demand forecast and associated capital cost estimates (in 2007 dollars) to the year As shown below, the County will need to accommodate an additional 8,694 students by This would require an investment of $264 million over the next 18 years. Impact fees alone will not be sufficient to provide the capital funding needed. Table 44. School Demand and Cost Analysis, Elementary Middle High School All Schools Projected Students By Year ,062 6,282 6,784 NA Current FISH Capacity (2006/07) 8,246 3,322 4,866 NA New Student Capacity Needed by ,816 2,960 1,918 8,694 Facility Cost per Student Capacity $24,311 $33,330 $37,780 NA Total Cost By School Type - Year 2025 $92,770,776 $98,656,800 $72,462,040 $263,889,616 Projected School Impact Fee Revenue $143,251,873 Source: Projected students for 2025/2026 from Tentative Facilities Work Program submitted to DOE prior to October 1, 2006; current capacity from Table 29; costs per student capacity from Table 33; projected revenue based on new student capacity needed times net cost per student from Table 38. Impact Fee Update, Technical Memo #3 (Revised) Duncan Associates Indian River County, Florida 51 July 19, 2007
60 Potential impact fee revenue is difficult to project, since recent building trends do not necessarily reflect future building activity. The revenue estimates shown below should be used cautiously, as they are intended primarily to provide a weighted comparison between the current and updated fee schedules. Based on the average annual amount of development experienced over the last six years, it is estimated that the updated school impact fees will generate about 154 percent more revenue than would be generated under the current fee schedule, as shown in Table 45. Table 45. School Impact Fee Revenue Estimates Avg. Annual Impact Fee Rates Impact Fee Revenues Percent Housing Type Impact Units Current Updated Current Updated Change Single-Family* 2,384 $1,756 $4,459 $4,186,000 $10,629, % Multi-Family 476 $500 $1,091 $238,000 $519, % Mobile Home 57 $623 $2,841 $35,000 $161, % Total $4,459,000 $11,309, % * includes single-family detached and single-family attached Source: Average annual impact units from 2001 to 2006 county-wide building permit data; impact fee rates from Table 43. Impact Fee Update, Technical Memo #3 (Revised) Duncan Associates Indian River County, Florida 52 July 19, 2007
61 PARKS Indian River County provides a number of park and recreational facilities for the benefit of unincorporated area residents (the municipalities in the county provide their own park facilities). The locations of existing County parks are illustrated in Figure 4. A detailed inventory of County parks, including name, park classification, acreage and improvements, is presented in Table 136 in Appendix D. Several of the park facilities operated by the County are on land that is owned by the State of Florida. In the previous study, these facilities were excluded in computing the existing level of service. However, the County has long-term, nominal leases (e.g., $1 per year) on these facilities, and for the purposes of this update, they will be treated the same as County-owned facilities. Figure 4. Location of Existing County Parks Impact Fee Update, Technical Memo #3 (Revised) Duncan Associates Indian River County, Florida 53 July 19, 2007
62 Current Level of Service The County provides parks and recreation facilities and services in the unincorporated areas of the county. The municipalities provide these facilities and services within their respective jurisdictions. As a result, the parks and recreation impact fee analysis will consider only unincorporated area population and parks and recreational facilities located within the unincorporated area. The adopted level of service in the 2020 Comprehensive Plan is 6.61 recreation acres/1,000 permanent plus weighted peak seasonal population county-wide. 4 The current impact fees are based on unincorporated population. Although the previous study purportedly used permanent plus weighted peak seasonal population, rather than the permanent population estimates used in this study, the permanent estimates used in this study are actually slightly higher for the unincorporated area. 5 The County may wish to consider modifying its adopted level of service for concurrency purposes to base it on the ratio of developed park acres owned or operated by the County to the permanent population residing in unincorporated areas of the county. The acreage should include State-owned land that is leased to the County on a long-term basis for a nominal rate. On this basis, the current actual LOS for parks is 6.29 acres per 1,000 residents, as shown in Table 46. This LOS is based on regional, community and neighborhood parks that are currently available to residents in the unincorporated areas of the county. However, it might be prudent for the County to make the concurrency standard somewhat lower than the existing ratio. Table 46. Current Parks and Recreation Level of Service Developed Regional Parks Acres Developed Community Park Acres 1.00 Developed Neighborhood Park Acres Total Developed Park Acres Unincorporated Area Population, ,856 Total Developed Park LOS (Acres per 1,000 Residents) 6.29 Possible Concurrency LOS (Developed Acres per 1,000 Residents) 6.00 Source: Regional, community and neighborhood parks acres from Table 136 in Appendix D; unincorporated area population from Table 127 in Appendix A. Regardless of what LOS is established for concurrency purposes, the updated park impact fees will be based on the current actual ratio of the replacement cost of existing park land (developed and undeveloped) and facilities to the unincorporated area residents served by these facilities. The total cost per person for parks and recreation facilities consists of two components: the cost of land for the parks and the cost of improvements to the parks. The cost of land for parks and recreation facilities includes more than just the purchase cost of the land. Landscaping/site improvement and utilities/paving costs also are considered, along with the cost to purchase the land. 4 Indian River County, 2020 Comprehensive Plan, Chapter 6: Capital Improvements Element, Policy 3.5 (concurrency management level-of-service standards), adopted December 12, For example, the 2005 Tindale-Oliver study used a permanent plus weighted peak seasonal population estimate of 88,710 in the unincorporated area for 2004, compared to a permanent population estimate of 95,361 for FY 2003/04 in this study (Table 54). Impact Fee Update, Technical Memo #3 (Revised) Duncan Associates Indian River County, Florida 54 July 19, 2007
63 The landscaping and site improvement cost per acre is calculated using historical expenditures for the North County Regional Park, which was recently constructed in two phases and reflects typical costs for parks in Indian River County. Phase I includes the construction of the pool complex and related facilities, while Phase II includes construction of the multi-purpose ball fields and related facilities. The calculation of the landscaping and site improvements cost per acre is shown in Table 47. Table 47. Landscaping and Site Improvements Cost per Acre Landscaping and Site Improvement Costs - Phase I: Fencing $50,000 Landscaping, Mitigation, and Grassing $225,000 Irrigation $100,000 Landscaping and Site Improvement Costs - Phase II: Fencing $125,000 Landscaping and Mitigation $100,000 Irrigation $100,000 Total Landscaping and Site Improvements Cost $700,000 North County Regional Park Developed Acres 100 Landscaping and Site Improvements Cost per Acre $7,000 Source: Improvement costs provided by the Parks and Recreation Department for the 2005 study. The utilities and paving cost per acre figure is also calculated using historical expenditures for the North County Regional Park. This cost per acre is presented in Table 48. Table 48. Utilities and Paving Cost per Acre Utilities and Paving Costs - Phase I: Drainage $550,000 Water and Wastewater Improvements $300,000 Parking Lot Drives $750,000 ERU Connection Fee $4,776 Utilities and Paving Costs - Phase II: Drainage $490,000 Water and Wastewater Improvements $25,000 Total Utilities and Paving Cost $2,119,776 North County Regional Park Acres 100 Utilities and Paving Cost per Acre $21,198 Source: Improvement costs provided by the Parks and Recreation Department for the 2005 study. The calculations from the two previous tables are combined with an average land acquisition cost to determine the total land cost per acre for parks and recreation facilities in unincorporated Indian River County. An average park land acquisition cost of $55,906 per acre is used. This figure is based on recent sales of vacant parcels in IRC of 40 to 160 acres, which can be found in Table 137 of Appendix D. As shown in Table 49, this results in a total land cost of $88,334 per developed park acre. Impact Fee Update, Technical Memo #3 (Revised) Duncan Associates Indian River County, Florida 55 July 19, 2007
64 Table 49. Total Land Cost per Developed Acre Land Acquisition Cost per Acre $55,906 Landscaping and Site Improvements Cost per Acre $7,000 Utilities and Paving Cost per Acre $21,198 Architecture, Engineering, and Inspection Cost per Acre 15%) $4,230 Total Land Cost per Developed Acre $88,334 Source: Land acquisition cost per acre is the average cost per acre for vacant land parcels of 40 to 160 acres sold in Indian River County in 2006 from Table 137; landscaping and site improvements costs from Table 47; utilities and paving costs from Table 48; architecture, engineering and inspection costs are 15% of sum of landscaping/site improvements costs and utilities/paving costs per IRC Public Works Department, February 28, The second component in determining the total cost per resident for parks and recreation facilities is to calculate the facility improvement cost per resident. Detailed facility replacement costs for various types of improvements are presented in Table 50. Golf courses often operate as enterprise funds and for this reason are excluded from the inventory. Impact Fee Update, Technical Memo #3 (Revised) Duncan Associates Indian River County, Florida 56 July 19, 2007
65 Table 50. Parks Facility Replacement Cost Facility Number Unit Cost Total Cost Restrooms 26 $150,000 $3,900,000 Basketball Court 10 $55,000 $550,000 Community Center (sf)* 24,981 $225 $5,620,725 Jogging Trails (miles) 6.5 $150,000 $975,000 Picnic Pavilion 48 $40,000 $1,920,000 Playground 14 $90,000 $1,260,000 Swimming Pool (Community) 1 $3,000,000 $3,000,000 Olympic Aquatic Center 1 $5,800,000 $5,800,000 Softball Field (lighted) 15 $515,892 $7,738,380 Softball Field (not lighted) 1 $365,892 $365,892 Tennis Courts 5 $50,000 $250,000 Volleyball Court 3 $20,000 $60,000 Soccer Field (lighted) 1 $400,000 $400,000 Soccer Field (not lighted) 1 $250,000 $250,000 Archery Range** 1 $0 $0 Boat Ramp 12 $100,000 $1,200,000 Canoe Launch 4 $188,000 $752,000 Fairground - Indoor Expo Pavillion 1 $1,105,052 $1,105,052 Fairground - Outdoor Expo Pavillion 2 $548,501 $1,097,002 Dune Walkover 11 $43,067 $473,737 Lifeguard Tower 5 $25,000 $125,000 Fishing Pier 12 $12,500 $150,000 Small Multi-Purpose Building (2,500 sf) 1 $562,500 $562,500 Shooting Range 1 $1,400,000 $1,400,000 Viewing Tower 1 $44,500 $44,500 Historical Information Center (400 sf) 1 $90,000 $90,000 Storage/Maintenance Facility (900 sf) 1 $202,500 $202,500 Parks Division Maintenance Facility 1 $850,000 $850,000 IRC Shooting Range Storage Building 1 $40,000 $40,000 IRC Shooting Range Sporting Clay Course 1 $85,000 $85,000 IRC Shooting Range Archery Course 1 $75,000 $75,000 IRC Shooting Range Lighting 1 $70,000 $70,000 Total * excludes the square footage occupied by the Gifford Library $40,412,288 **County owns land but not the equipment Source: Facilities and number from Table 136 in Appendix D; unit costs provided by IRC Recreation Department, January 18, 2007 Impact Fee Update, Technical Memo #3 (Revised) Duncan Associates Indian River County, Florida 57 July 19, 2007
66 Table 51 presents the total replacement costs of existing park facility improvements and existing park land. The total land and facility cost is divided by current population in the unincorporated area to determine the capital cost per person to maintain the existing park level of service. Table 51. Total Park Cost per Person Developed Undev'd Total Park Acres , Land Cost per Acre $88,334 $55,906 NA Park Land Cost $54,942,865 $28,165,443 $83,108,308 Park Facility Replacement Cost $40,412,288 $0 $40,412,288 Total Park Land and Facility Cost $95,355,153 $28,165,443 $123,520,596 Permanent Population in Unincorp. Area, ,856 Total Park Cost per Person $1,250 Source: Park acres from Table 136, land cost per acre from Table 49; facility costs from Table 50; 2007 permanent population in unincorporated area from Table 127. Revenue Credits As noted in the introduction to this report, impact fees should be reduced to account for future funding that will be generated by new development and used to remedy existing deficiencies or to retire outstanding debt of existing facilities that help provide the existing level of service to existing development. Since the updated fees are based on the existing levels of service, there are no deficiencies. In addition, Indian River County has no outstanding debt for parks and recreation facilities. For these reasons, no revenue credits are absolutely required. The previous study, however, took a more expansive view of revenue credits, providing for a past property tax credit as well as future revenue credit for all types of historical or planned funding used for capacity-expanding capital improvements. While the current consultant team does not agree that such credits are necessarily required, this draft will continue the approach to revenue credits followed in the previous study. An analysis of the historical and future park capital expenditures for the eleven-year period from FY 2001/02 to FY 2011/12 was completed in order to determine a typical amount of annual funding for capacity-expanding improvements. In the past, the County has relied primarily on the general fund and the optional sales tax for parks and recreation capital improvements, with limited contributions from other funding sources, such as the municipal service taxing unit (MSTU) fund, the tree fine fund, the parks improvement fund and the Florida Boating Improvement Program. Table 52 summarizes the capital expenditures over the last six fiscal years. This table also specifies whether the capital expenditure was a replacement or expansion of the existing parks and recreation capital inventory. Impact Fee Update, Technical Memo #3 (Revised) Duncan Associates Indian River County, Florida 58 July 19, 2007
67 Table 52. Historical Park Improvements, Improvement Type 2001/ / / / / /07 6-Year Total Storage buildings - equipment Expansion $9,672 $9,672 Maintenance Equipment Replacement $54,359 $68,484 $115,311 $104,744 $173,635 $144,995 $661,528 Maintenance Equipment Expansion $2,164 $25,484 $27,648 Round Island footbridge Replacement $45,235 $45,235 Other Buildings Replacement $51,046 $73,596 $124,642 Other Buildings Replacement $85,000 $85,000 West Wabasso Park-resurface tennis Replacement $50,000 $50,000 Subtotal, General Fund $54,359 $78,156 $117,475 $181,274 $292,466 $279,995 $1,003,725 Gifford Aquatic Center - Lighting Expansion $3,950 $3,950 North County Aquatic Center - Equip. Expansion $7,945 $7,945 other equipment (vehicles, etc.) Expansion $36,547 $26,794 $1,400 $64,741 other equipment (vehicles, etc.) Replacement $24,052 $12,579 $3,700 $40,331 storage building Expansion $4,999 $4,999 defibrillators Expansion $19,396 $5,090 $24,486 Computer Equipment Expansion $1,797 $881 $1,650 $4,328 Computer Equipment Replacement $1,360 $1,360 Subtotal, M.S.T.U. Fund $48,447 $66,111 $1,797 $29,035 $6,750 $152,140 Shooting Range Improvements Expansion $91,665 $91,665 Subtotal, Shooting Range Construction $0 $0 $91,665 $0 $0 $0 $91,665 Fairgrounds electronic sign Expansion $4,854 $14,445 $19,299 Agricultural Pavilion #2 Expansion $34,030 $329,878 $184,593 $548,501 North County Aquatic Center/ Park Expansion $5,073,929 $235,406 $5,309,335 Gifford Aquatic Center Expansion $1,750 $1,750 Soccer field water & sewer Expansion $134,946 -$100 $13,367 $148,213 West Wabasso Park Improvements Replacement $11,113 $81,750 $92,863 North County Park Phase II Expansion $1,391,936 $610,627 $2,002,563 Gifford Park Security Building Expansion $5,759 $325 $73,916 $80,000 Misc Parks Improvements Expansion $46,000 $35,064 $29,762 $110,826 AC Replacement Fairgrounds Replacement $127,538 $127,538 CR 510 Causeway Replacement $61,334 $61,334 Gifford Park SR Ballfield Lighting Replacement $194,825 $194,825 Hobart Park Ballfield Lighting Replacement $179,500 $179,500 Helen Hanson Ballfield Lighting Replacement $131,200 $131,200 Wabasso Beach Park Reconstruct Replacement $15,975 $15,975 IRC Parks Maint Complex Replacement $37,796 $1,162,204 $1,200,000 Playground Equipment Replacement $57,917 $57,917 South County Park - Phase III Expansion $2,300,000 $2,300,000 Tracking Station Replacement $48,972 $48,972 Misc Repairs Replacement $42,392 $229,803 $272,195 Subtotal, Optional Sales Tax $5,244,655 $570,038 $1,648,087 $1,576,878 $54,096 $3,809,052 $12,902,806 North County Aquatic Center Expansion $24,913 $24,913 Subtotal, Tree Fine Fund $0 $24,913 $0 $0 $0 $0 $24,913 North County Aquatic Center Expansion $120,611 $120,611 Subtotal, Park Improvement Fund $0 $120,611 $0 $0 $0 $0 $120,611 Sebastian Canoe Launch Expansion $74,398 $74,398 Schumann Lake Boat Ramp Replacement $7,800 $7,800 Misc Boating Facilities Expansion $15,000 $15,000 Oslo Boat Ramp Replacement $750 $1,270 $400,000 $402,020 Subtotal, FL Boating Impr. Program $82,198 $750 $0 $0 $1,270 $415,000 $499,218 Grand Total - Capital Expenditures $5,429,659 $860,579 $1,857,227 $1,759,949 $376,867 $4,510,797 $14,795,078 Total Capital Expansion Expenditures $5,343,448 $778,766 $1,730,803 $678,731 $28,000 $135,095 $8,694,843 Total Gen. Fund/MSTU Expansion $24,395 $63,204 $2,164 $27,281 $27,675 $3,050 $147,769 % GF/MSTU Expansion Expenditures 0.46% 8.12% 0.13% 4.02% 98.84% 2.26% 1.70% Source: IRC Office of Management and Budget, January 22, 2007 and May 1, Impact Fee Update, Technical Memo #3 (Revised) Duncan Associates Indian River County, Florida 59 July 19, 2007
68 Over the next five years, the County is planning to make improvements to West County Regional Park and the Oslo Boat Ramp and to acquire land for future parks. Approximately half of this funding could come from park impact fees, based on the revenue projections contained in the previous study. Table 53 summarizes these planned capital expenditures. Table 53. Planned Park Improvements, / / / / /12 5-Year Total West County Regional Park $500,000 $2,800,000 $0 $0 $0 $3,300,000 Oslo Boat Ramp and Parking $1,400,000 $0 $0 $0 $0 $1,400,000 Land for Future Parks $1,575,000 $1,575,000 $1,575,000 $1,575,000 $0 $6,300,000 Total Capital Expenditures $3,475,000 $4,375,000 $1,575,000 $1,575,000 $0 $11,000,000 Total Expansion Expenditures $2,075,000 $4,375,000 $1,575,000 $1,575,000 $0 $9,600,000 Projected Parks Impact Fees $902,580 $1,037,967 $1,193,662 $1,372,711 $1,578,618 $4,506,919 Non-Impact Fee Expansion Funding $1,172,420 $3,337,033 $381,338 $202,289 -$1,578,618 $5,093,081 *$800,000 added to Oslo Boat Ramp and Parking per Public Works Department, February 28, Source: IRC Office of Management and Budget, January 22, 2007; projected revenues from IRC OMB, February 28, The revenue credit per person for future capacity improvements is calculated using the average nonimpact fee capital expansion expenditures during the last six years and the future planned projects budgeted during the next five-years. The average annual capacity expenditure amount is divided by the average population over this eleven-year time period, resulting in an average non-impact fee capital expansion contribution of $11.23 per person. This information is presented in Table 54. Table 54. Park Annual Revenue Credit per Person Fiscal Year Non-Impact Fee Expansion Expenditures Unincorp. Population Annual Expend./ Person 2001/02 $5,343,448 92,056 $ /03 $778,766 93,416 $ /04 $1,730,803 94,776 $ /05 $678,731 96,136 $ /06 $28,000 97,496 $ /07 $135,095 98,856 $ /08 $1,172, ,216 $ /09 $3,337, ,576 $ /10 $381, ,936 $ /11 $202, ,296 $ /12 ($1,578,618) 105,656 -$14.94 Total $12,209,306 1,087,416 $11.23 Source: Non-impact fee capacity expenditures from Table 52 and Table 53; unincorporated area population from Table 128 (years prior to 2006/07 interpolated). It is the County s intent to use impact fee revenues as the primary funding source for future capital expansion needs of the parks and recreation program and to maintain or reduce the average annual dollar amount shown in this report toward capital expansion needs. In other words, the County intends to use non-impact fee revenue sources as the primary funding source for capital replacement, operations and maintenance expenses. As such, credit calculations for future expenditures do not include an escalation factor. Impact Fee Update, Technical Memo #3 (Revised) Duncan Associates Indian River County, Florida 60 July 19, 2007
69 A final credit component accounts for past payments of property taxes from vacant land. First, the share of total vacant land (residential, commercial and industrial) to total taxable value is determined. This percentage is adjusted to account for the portion of ad valorem taxes used toward capital expansion expenditures. Based on historical expenditures, 1.70% of park capital expansion was funded with ad valorem tax revenues over the past six years. Applying this percentage to the vacant land value percentage results in an effective vacant land value percentage of 0.19%, as shown in Table 55. This percentage is used to give credit for past property taxes paid by owners of vacant land. Table 55. Park Past Property Tax Percentage Unincorporated County Vacant Land Value $1,728,524,390 Unincorporated County Total Property Value $15,561,808,237 Vacant Land Value as a Percentage of Total Property Value 11.11% Percent of General Fund/MSTU Capital Expansion Projects 1.70% Effective Vacant Land Value Percentage 0.19% Source: Unincorporated county vacant land value and unincorporated county total property value from IRC Property Appraiser, January 22, 2007; percent of general fund/mstu capital expansion projects from Table 52. The net present value of the annual revenue credit over the next 25 years is calculated in the following table. Reducing the cost per person by the future revenue credit and the past property tax credit leaves a park net cost of $1,076 per person, as shown in Table 56. Table 56. Park Net Cost per Person Average Annual Funding Credit per Person $11.23 Net Present Value Factor (25 years at 4.2% discount rate) Future Revenue Credit per Person $172 Past Property Tax Credit per Person $2 Total Credit per Person $174 Total Park Cost per Person $1,250 Net Cost per Person $1,076 Source: Annual credit per person from Table 54; discount rate is average interest rate on state and local bonds in March through May 2007 from the Federal Reserve; future revenue credit is annual credit times net present value factor; past property tax credit is cost per person times vacant land percentage from Table 55; total cost per person from Table 51. Updated Impact Fee Schedule The maximum park impact fees that can be adopted by the County based on this study are derived by multiplying the number of persons represented by each impact unit by the net cost per person, as shown in Table 57. Impact Fee Update, Technical Memo #3 (Revised) Duncan Associates Indian River County, Florida 61 July 19, 2007
70 Housing Type Table 57. Updated Park Impact Fee Schedule Persons per Unit Net Cost/ Person Net Cost/ Unit Single-Family* Less than 1,500 sf (under air) $1,076 $2,226 1,500 to 2,499 sf (under air) $1,076 $2,488 2,500 sf or more (under air) $1,076 $2,705 Multi-Family/Accessory Unit $1,076 $1,344 Mobile Home $1,076 $1,584 * includes single-family detached and single-family attached Source: Persons per unit from Table 126; net cost per person from Table 56. The updated park impact fees are compared with current fees in Table 58. For all housing types, the fees could increase by more than 50 percent. Table 58. Comparative Park Impact Fees Impact Current Updated Unit Fee Fee Percent Change Housing Type Single-Family* Less than 1,500 sf (under air) Dwelling $1,302 $2,226 71% 1,500 to 2,499 sf (under air) Dwelling $1,463 $2,488 70% 2,500 sf or more (under air) Dwelling $1,587 $2,705 70% Multi-Family/Accessory Unit Dwelling $884 $1,344 52% Mobile Home Dwelling $942 $1,584 * includes single-family detached and single-family attached 68% Source: Updated fees from Table 57. Revenue Projections Potential impact fee revenue is difficult to project, since recent building trends do not necessarily reflect future building activity. The revenue estimates shown below should be used cautiously, as they are intended primarily to provide a weighted comparison between the current and updated fee schedules. Based on the average annual amount of development experienced in the unincorporated area over the last six years, it is estimated that the updated park impact fees will generate about 68 percent more revenue than would be generated under the current fee schedule, as shown in Table 59. Table 59. Park Impact Fee Revenue Estimates Avg. Annual Impact Fee Rates Impact Fee Revenues Percent Housing Type Impact Units Current Updated Current Updated Change Single-Family* 1,835 $1,463 $2,488 $2,685,000 $4,565,000 70% Multi-Family 346 $884 $1,344 $305,000 $464,000 52% Mobile Home 14 $942 $1,584 $14,000 $23,000 64% Total $3,004,000 $5,052,000 68% * includes single-family detached and single-family attached Source: Average annual impact units from 2001 to 2006 unincorporated building permit data; impact fee rates from Table 58. Impact Fee Update, Technical Memo #3 (Revised) Duncan Associates Indian River County, Florida 62 July 19, 2007

71 LIBRARIES Indian River County operates four libraries, which provide the only public library service within the county. The locations of the libraries are illustrated in Figure 5. The Main and North County Libraries are located on exclusive library sites. The Law Library is located in the County Courthouse. The Gifford Library is located in the Youth Activities Center in Gifford Park. Figure 5. Locations of Existing Library Facilities Current Level of Service The County s four existing library facilities, summarized in Table 60, contain a total building floor area of 80,340 square feet. Building and land replacement costs for existing facilities are estimated based on current estimates of building cost per square foot for future branch libraries and historical land acquisition costs for library sites. Impact Fee Update, Technical Memo #3 (Revised) Duncan Associates Indian River County, Florida 63 July 19, 2007
72 Table 60. Library Building and Land Replacement Cost Library Facility Address Acres Sq. Ft. Land Cost Bldg. Cost Main Library st St, Vero Beach ,286 $948,743 $14,588,656 North County Library 1001 CR 512, Sebastian ,445 $933,990 $7,531,720 Law Library th Ave, Vero Beach NA 3,993 NA $1,181,928 Gifford Youth Ctr Library rd Ave, Vero Beach NA 1,616 NA $478,336 Total ,340 $1,882,733 $23,780,640 Source: IRC General Services Department, Division of Library Services, January 22, 2007; land cost based on cost/acre from Table 62; building cost based on cost/sq. ft. from Table 61. The building replacement costs shown in the preceding table area based on current estimates to construct a new 30,000 square foot West County branch library. These cost estimates are detailed in Table 61. Table 61. Library Building Cost per Square Foot Facility Amount Square Feet Cost/ Sq. Foot Construction $6,300,000 30,000 $ Furniture, Fixtures and Equipment $2,580,000 30,000 $86.00 Total $8,880,000 30,000 $ Source: IRC General Services Department, Division of Library Services; estimated costs from Office of Management and Budget for future branch library, January 22, The land replacement costs shown in the earlier table are based on historical acquisition costs for library sites. These are shown in Table 62. Facility Table 62. Library Land Cost per Acre Year Acquired Land Cost Acres Cost per Acre North County Library 1988 $351, $112,376 North County Library 1997 $227, $230,203 Main Library 1989 $1,303, $311,880 Total $1,882, $226,972 Source: IRC Office of Management and Budget, January 22, 2007; original land costs escalated by U.S. Consumer Price Index to December 2006 dollars. A major capital cost for library services is the cost of the library collections, including books and other circulating and non-circulating materials. The replacement costs for existing library collections are presented in Table 63. Impact Fee Update, Technical Memo #3 (Revised) Duncan Associates Indian River County, Florida 64 July 19, 2007
73 Table 63. Library Collections Replacement Cost Description Items Unit Cost Total Cost Gifford Youth Activities Center Library 3,523 $25 $88,075 Law Library 16,600 $80 $1,328,000 Main & North Reference, Genealogy, Non-Fiction Books 159,295 $80 $12,743,600 Adult Fiction Books 95,859 $25 $2,396,475 Juvenile/YA Reference Books 1,011 $80 $80,880 Juvenile/YA Non-Fiction Books 81,069 $25 $2,026,725 Juvenile/YA Fiction 48,094 $20 $961,880 Paperbacks 16,200 $9 $145,800 Books On Tape/CD 12,683 $75 $951,225 Electronic Books 28,812 $0 $0 Subtotal, Books 463,146 $20,722,660 Music CDs 10,397 $15 $155,955 DVDs 9,446 $20 $188,920 Videos 18,512 $15 $277,680 Print Subscriptions 1,775 $39 $69,225 Other Print Materials 21,677 $50 $1,083,850 Subtotal, Other Materials 61,807 $1,775,630 Online Resource Subscriptions: 68 $4,094 $278,392 All Library Materials -- Total 525,021 $22,776,682 Source: IRC General Services Department, Division of Library Services, January 22, The current actual library level of service, expressed in terms of the capital cost per person, is shown in Table 64. The updated library impact fees will be based on this per capita cost to maintain the current level of service. Table 64. Library Cost per Person Library Building and Land Costs $23,780,640 Library Collections Costs $22,776,682 Total Library Costs $46,557,322 County-Wide Population, ,727 Library Cost per Person $ Source: Building and land costs and building square footage from Table 60; collections cost from Table 63; 2007 county-wide population from Table 127. Revenue Credits As noted in the introduction to this report, impact fees should be reduced to account for future funding that will be generated by new development and used to remedy existing deficiencies or to retire outstanding debt of existing facilities that help provide the existing level of service to existing development. Since the updated fees are based on the existing levels of service, there are no Impact Fee Update, Technical Memo #3 (Revised) Duncan Associates Indian River County, Florida 65 July 19, 2007
74 deficiencies. In addition, Indian River County has no outstanding debt for library facilities. For these reasons, no revenue credits are absolutely required. The previous study, however, took a more expansive view of revenue credits, providing for a past property tax credit as well as future revenue credit for all types of historical or planned funding used for capacity-expanding capital improvements. While the current consultant team does not agree that such credits are necessarily required, this draft will continue the approach to revenue credits followed in the previous study. An analysis of the historical and future public buildings capital expenditures for the eleven-year period from FY 2001/02 to FY 2011/12 was completed in order to determine a typical amount of annual funding for capacity-expanding improvements. In the past, the County has relied primarily on impact fees and the optional sales tax for library capital improvements, with limited contributions from other funding sources, such as the general fund and library bequests. Table 65 summarizes the capital expenditures over the last six fiscal years. This table also specifies whether the capital expenditure was a replacement or expansion of the existing library capital inventory. Note that capital expansion expenditures paid from the general fund amount to less than one percent of total expansion expenditures during the six-year period. Table 65. Historical Library Improvements, Project Description Type 2001/ / / / / /07 6-Year Total Main-Office Furn & Equip Replacement $13,002 $2,136 $3,330 $10,770 $29,238 Main-Office Furn & Equip Expansion $8,380 $8,380 Main-Computer Equip Expansion $6,297 $922 $7,219 Main-Computer Equip Replacement $6,753 $5,493 $13,154 $21,014 $46,414 North-Office Furn & Equip Expansion $0 North-Office Furn & Equip Replacement $3,830 $9,372 $3,000 $16,202 North-Computer Equip Expansion $0 North-Computer Equip Replacement $0 North-Bldg Improvements Expansion $12,132 $12,132 Subtotal, General Fund $31,431 $9,811 $8,823 $27,754 $38,766 $3,000 $119,585 North-Bldg Improvements Expansion $691,804 $691,804 North-Computer Equip Expansion $10,844 $508 $11,352 Subtotal, Library Bequests $702,648 $508 $0 $0 $0 $0 $703,156 Main-Additions & Upgrades Expansion $1,115,513 $3,518 $16,482 $40,000 $1,175,514 North County Library Expansion $1,321,421 $23,478 $11,000 $1,355,899 West County Library-IRCC Expansion $4,300,000 $200,000 $4,500,000 Subtotal, Optional Sales Tax $2,436,935 $3,518 $16,482 $4,323,478 $0 $251,000 $2,531,413 West County Library-IRCC Expansion $1,485,000 $4,500,000 Subtotal, Impact Fees $0 $0 $0 $0 $0 $1,485,000 $4,500,000 Total Capital Expenditures $3,171,014 $13,838 $25,305 $4,351,232 $38,766 $1,739,000 $7,854,155 Total Capacity Expenditures $3,158,012 $4,948 $16,482 $4,323,478 $8,380 $1,736,000 $12,262,300 Total Non-Impact Fee Expansion $3,158,012 $4,948 $16,482 $4,323,478 $8,380 $251,000 $7,762,300 Total General Fund Expansion $18,429 $922 $0 $0 $8,380 $0 $27,731 % General Fund Expansion 0.58% 18.63% 0.00% 0.00% % 0.00% Source: IRC Office of Management and Budget, January 22, % Impact Fee Update, Technical Memo #3 (Revised) Duncan Associates Indian River County, Florida 66 July 19, 2007
75 The County s Capital Improvements Element does not contain any planned improvements over the next five years beyond the completion of the new West County branch library that is currently underway. The revenue credit per person for future capacity improvements is calculated using the average capital expansion expenditures during the last six years and the future planned projects budgeted during the next five-years. The average annual capacity expenditure amount is divided by the average population during this eleven-year time period resulting in an average capital expansion contribution per person. This information is presented in Table 66. Table 66. Library Annual Revenue Credit per Person Fiscal Year Non-Impact Fee Expansion Expenditures County-Wide Population Annual Expend./ Person 2001/02 $3,158, ,012 $ /03 $4, ,355 $ /04 $16, ,698 $ /05 $4,323, ,041 $ /06 $8, ,384 $ /07 $251, ,727 $ /08 $0 152,070 $ /09 $0 154,413 $ /10 $0 156,756 $ /11 $0 159,099 $ /12 $0 161,442 $0.00 Total $7,762,300 1,646,997 $4.71 Source: Non-impact fee expansion expenditures from Table 65; countywide population for 2007 through 2012 from Table 128 (prior years interpolated). It should be noted that it is the County s intent to use impact fee revenues as the primary funding source for future capital expansion needs of libraries and to maintain or reduce the average annual dollar amount from non-impact fee revenue sources shown in this study toward capital expansion needs. In other words, the County intends to use non-impact fee revenue sources as the primary funding source for capital replacement, operations and maintenance expenses. As such, credit calculations for optional sales tax and ad valorem tax do not include an escalation factor. According to the Office of Management and Budget, the use of ad valorem taxes toward library capital expansion is limited and typically is directed to the replacement and possibly the addition of equipment. To be conservative, however, credit for past payments of property taxes for vacant land is given. The calculation of the percentage of capacity expansion improvements paid for with property taxes from vacant land is presented in Table 67. Impact Fee Update, Technical Memo #3 (Revised) Duncan Associates Indian River County, Florida 67 July 19, 2007
76 Table 67. Library Past Property Tax Percentage County-Wide Vacant Land Property Value $2,419,297,960 County-Wide Total Property Value $25,440,066,977 Vacant Land Value as % of Total Value 9.51% Percent General Fund Expansion 0.36% Effective Vacant Land Value Percentage 0.03% Source: Property values IRC Property Appraiser, January 22, 2007; percent of expansion funding from general fund from Table 65. The net present value of the annual revenue credit over the next 25 years is calculated in the following table. Reducing the cost per person by the future revenue credit and the past property tax credit leaves a library net cost of $ per person, as shown in Table 68. Table 68. Library Net Cost per Person Average Annual Funding Credit per Person $4.71 Net Present Value Factor (25 years at 4.2% discount rate) Future Revenue Credit per Person $72.06 Past Property Tax Credit per Person $0.09 Total Credit per Person $72.15 Total Library Cost per Person $ Library Net Cost per Person $ Source: Annual credit from Table 66; discount rate is average interest rate on state and local bonds in March through May 2007 from the Federal Reserve; past property tax credit is cost per person times vacant land percentage from Table 67; cost per person from Table 64. Impact Fee Update, Technical Memo #3 (Revised) Duncan Associates Indian River County, Florida 68 July 19, 2007
77 Updated Impact Fee Schedule Table 69 presents the updated library impact fee schedule, which is based on the existing level of service. Housing Type Table 69. Updated Library Impact Fee Schedule Persons/ Unit Net Cost/ Person Net Cost/ Unit Single-Family* Less than 1,500 sf (under air) $239 $494 1,500 to 2,499 sf (under air) $239 $552 2,500 sf or more (under air) $239 $600 Multi-Family/Accessory Unit $239 $298 Mobile Home $239 $352 * includes single-family detached and single-family attached Source: Persons per unit from Table 126; net cost per person from Table 68. The updated fees are compared with the current library impact fees in Table 70. The fees would go up modestly for most housing types. Table 70. Comparative Library Impact Fees Impact Unit Current Fee Updated Fee Percent Change Housing Type Single-Family Less than 1,500 sf (under air) Dwelling $430 $494 15% 1,500 to 2,499 sf (under air) Dwelling $483 $552 14% 2,500 sf or more (under air) Dwelling $524 $600 14% Multi-Family/Accessory Unit Dwelling $285 $298 4% Mobile Home Dwelling $349 $352 Source: Updated fees from Table 69. 1% Revenue Projections Potential impact fee revenue is difficult to project, since recent building trends do not necessarily reflect future building activity. The revenue estimates shown below should be used cautiously, as they are intended primarily to provide a weighted comparison between the current and updated fee schedules. Based on the average annual amount of development experienced in the county over the last six years, it is estimated that the updated library impact fees will generate about 13 percent more revenue than would be generated under the current fee schedule, as shown in Table 71. Table 71. Library Impact Fee Revenue Estimates Avg. Annual Impact Fee Rates Impact Fee Revenues Percent Housing Type Impact Units Current Updated Current Updated Change Single-Family* 2,384 $483 $552 $1,152,000 $1,316,000 14% Multi-Family 476 $285 $298 $136,000 $142,000 4% Mobile Home 57 $349 $352 $20,000 $20,000 0% Total $1,308,000 $1,478,000 13% * includes single-family detached and single-family attached Source: Average annual impact units from 2001 to 2006 county-wide building permit data; impact fee rates from Table 70. Impact Fee Update, Technical Memo #3 (Revised) Duncan Associates Indian River County, Florida 69 July 19, 2007

78 FIRE RESCUE The Fire Rescue Division of the Indian River County Emergency Services Department provides a wide range of services to development throughout the county, with the exception of Indian River Shores, which has its own fire department. These services include firefighting, basic life support and advanced life support medical response, special operations (marine firefighting, dive rescue, airport firefighting and rescue, high angle rescue, hazardous materials response and confined space rescue), fire prevention, arson investigation, pre-hospital emergency care and public education. The locations of existing fire stations are illustrated in Figure 6. Figure 6. Fire Station Locations Impact Fee Update, Technical Memo #3 (Revised) Duncan Associates Indian River County, Florida 70 July 19, 2007
79 Current Level of Service Indian River County currently has a total of eleven fire rescue stations. In addition, the County has funded two additional stations that are planned to be constructed in the next five years. Table 72 summarizes the County s existing fire rescue building and land inventory. Figure 6 illustrates the locations of the existing fire rescue stations. Table 72. Fire Rescue Building and Land Cost Facility Location Year Acquired/ Built Acres Building Sq. Ft. Land Cost Building Cost Station 1* 1500 Old Dixie Hwy, Vero Beach ,423 $921,155 $4,434,210 Station 2* 3301 Bridge Plaza Dr, Vero Beach ,956 $335,300 $2,686,800 Station 3* rd Ave, Vero Beach ,152 $501,108 $2,741,040 Station th St SW, Vero Beach ,886 $401,624 $2,129,220 Station US 1, Winter Beach ,886 $427,416 $2,129,220 Station South A1A, Vero Beach ,099 $405,308 $836,730 Station nd Ave, Vero Beach ,099 $92,116 $836,730 Station 8** 1115 Barber St, Sebastian ,620 $184,231 $1,517,400 Station US 1, Sebastian 1999/ ,880 $1,291,459 $2,127,600 Station North Broadway, Fellsmere, ,520 $88,431 $1,490,400 Station rd St, Vero Beach ,612 $278,189 $2,055,240 Total ,133 $4,926,337 $22,984,590 * Leased (acreage listed is based on estimated portion of the parcel occupied by the station) ** Sebastian Volunteer Fire Department operates out of Station 8. Source: IRC Emergency Services Department, January 22, 2007; land replacement cost based on average $184,231/acre of sales of four- to six-acre parcels in Indian River County in 2006 (see Appendix E); building replacement cost for Station 2 based on $300 cost per square foot from planned 2007 replacement cost of Station 2, all others based on $270 per square foot per Emergency Services Department, March 22, In addition to land and buildings, the County s fire rescue inventory includes the necessary vehicles to perform its fire rescue duties. The vehicle inventory replacement cost is summarized in Table 73. Table 73. Fire Rescue Vehicle Cost Description Units Unit Cost Total Cost Ladder Truck 1 $771,000 $771,000 Quint 1 $542,000 $542,000 Brush Truck 8 $135,000 $1,080,000 Dive Rescue Unit 1 $160,000 $160,000 CFR Airport Truck 1 $800,000 $800,000 3,000 Gallon Tanker Truck 1 $240,000 $240,000 Airport Rescue Truck 1 $165,000 $165,000 Hazardous Materials Vehicle 1 $150,000 $150,000 Marine Fire Boat 1 $180,000 $180,000 Rigid Hull Inflatable Boat 1 $40,000 $40,000 Fire Engine 14 $351,000 $4,914,000 Ambulance 14 $138,000 $1,932,000 Total $10,974,000 Source: IRC Emergency Services Department, January 22, 2007 and Finance Department, March 29, 2007 (cost of vehicle only-does not include vehicle equipment costs). Impact Fee Update, Technical Memo #3 (Revised) Duncan Associates Indian River County, Florida 71 July 19, 2007
80 In addition to vehicles, the equipment that goes on the vehicles, the equipment that goes in the stations and uniforms for fire rescue personnel are also capital costs related to growth. Replacement costs are not available for this equipment, so original costs are used. These costs are summarized in Table 74. Facility Description Table 74. Fire Rescue Capital Equipment Cost Uniforms Station Equipment Vehicle Equipment Total Equipment Fire/Rescue Station 1 $176,800 $139,600 $205,700 $522,100 Fire/Rescue Station 2 $52,000 $77,100 $198,100 $327,200 Fire/Rescue Station 3 $62,000 $87,100 $170,600 $319,700 Fire/Rescue Station 4 $52,000 $77,100 $139,100 $268,200 Fire/Rescue Station 5 $52,000 $77,100 $139,100 $268,200 Fire/Rescue Station 6 $41,600 $57,100 $138,100 $236,800 Fire/Rescue Station 7 $52,000 $57,100 $139,100 $248,200 Fire/Rescue Station 8 $52,000 $67,100 $244,400 $363,500 Fire/Rescue Station 9 $52,000 $77,100 $139,100 $268,200 Fire/Rescue Station 10 $52,000 $47,100 $139,100 $238,200 Fire/Rescue Station 11 $41,600 $57,100 $238,100 $336,800 Total $686,000 $820,600 $1,890,500 Source: IRC Emergency Services Department, January 22, $3,397,100 The total capital cost represented by existing fire rescue facilities and equipment is the sum of building, land, vehicle and capital equipment costs. This amounts to $42,282,027, as shown in Table 75. Dividing by existing service units in the fire rescue service area (entire county except for Indian River Shores) yields the cost per functional population. Table 75. Fire Rescue Cost per Functional Population Station Building Cost $22,984,590 Station Land Cost $4,926,337 Vehicle Cost $10,974,000 Equipment Costs $3,397,100 Total Replacement Cost $42,282,027 Functional Population, County-Wide less Indian River Shores 160,752 Cost per Functional Population $ Source: Building and land costs from Table 72; vehicle cost from Table 73; equipment cost from Table 74; county-wide functional population less Indian River Shores from Table 131. Impact Fee Update, Technical Memo #3 (Revised) Duncan Associates Indian River County, Florida 72 July 19, 2007
81 Revenue Credits As noted in the introduction, impact fees should be reduced to account for future funding that will be generated by new development and used to remedy existing deficiencies or to retire outstanding debt of existing facilities that help provide the existing level of service to existing development. Since the updated fees are based on the existing levels of service, there are no deficiencies. In addition, Indian River County has no outstanding debt for the types of facilities covered in this report. For these reasons, no revenue credits are absolutely required. The previous study, however, took a more expansive view of revenue credits, providing for a past property tax credit as well as future revenue credit for all types of historical or planned funding used for capacity-expanding capital improvements. While the current consultant team does not agree that such credits are necessarily required, this draft will continue the approach to revenue credits followed in the previous study. The Indian River County Fire Rescue Division has two primary sources for capital expenditures: emergency services district and optional sales tax (CDBG funding was used once to repair hurricane damage to Station 4). No general fund money has been spent on fire rescue capital improvements in recent years. An analysis of the historical and future fire rescue capital expenditures for the elevenyear period from FY 2001/02 to FY 2011/12 was completed in order to determine a typical amount of annual funding for capacity-expanding improvements. Table 76 summarizes the capital expenditures over the last six fiscal years. This table also specifies whether the capital expenditure was a replacement or expansion of the existing fire rescue capital inventory. Impact Fee Update, Technical Memo #3 (Revised) Duncan Associates Indian River County, Florida 73 July 19, 2007
82 Table 76. Historical Fire Rescue Improvements, Description Type 2001/ / / / / /07 6-Year Total Land - Sebastian Sta. Expansion $7,000 $7,000 $14,000 Building Projects Replacement $31,579 $25,850 $3,370 $60,799 Building Projects Expansion $12,393 $12,393 Station 10 Sewer Replacement $7,504 $7,504 Furn & Equipment Expansion $1,750 $23,000 $24,750 Furn & Equipment Replacement $7,869 $5,288 $14,000 $27,157 Fire Vehicles Replacement $35,548 $143,785 $1,627,024 $972,248 $715,839 $3,494,444 Fire Vehicles Expansion $24,158 $24,158 Fire Veh. (Sta. 12) Expansion $616,820 $616,820 Radios Expansion $15,714 $63,075 $27,500 $106,289 Radios Replacement $1,677 $14,993 $12,781 $13,419 $33,290 $76,160 Commun. Equip Replacement $125,159 $125,159 Computer Equip Expansion $7,928 $19,335 $2,200 $26,545 $56,008 Computer Equip Replacement $7,068 $32,679 $56,598 $14,916 $5,200 $116,461 Misc. Equipment Expansion $47,449 $3,295 $10,205 $30,435 $44,838 $169,878 $306,100 Misc. Equipment Replacement $25,207 $52,139 $95,798 $137,338 $131,483 $123,385 $565,350 Ambulances Replacement $348,000 $116,218 $399,044 $119,897 $290,000 $1,273,159 EMS Vehicles Replacement $37,165 $206,218 $243,383 Fire Station #2 Replacement $107,231 $44,431 $2,792,812 $2,944,474 Fire Station #3 Replacement $1,074,730 $717,981 $1,792,711 Fire Station #4 Replacement $211,121 $274,624 $485,745 Fire Station #5 Replacement $76 $903,741 $903,817 Fire Station #6 Replacement $287,568 $173,089 $52,036 $512,693 Fire Station #8 Replacement $191,307 $3,693 $195,000 Fire Station #9 Replacement $2,300 $2,450,389 $2,452,689 Fire Station #10 Replacement $24,047 $96,394 $120,441 Repair Boat Lift Hurricane $14,480 $14,480 Bldg Repairs/Equip Hurricane $42,061 $42,061 Furn & Equip Hurricane $37,707 $37,707 A/C Fire Station 1 Replacement $10,555 $10,555 Boston Whaler Replacement $181,245 $181,245 Intl Brush Truck Replacement $68,970 $129,610 $198,580 Vehicles Replacement $63,524 $91,568 $155,092 Training Tower Replacement $707,008 $707,008 Subtotal, Emergency Services Dist. $572,640 $479,780 $1,986,380 $1,286,965 $3,572,609 $10,006,019 $17,904,392 Disaster Recovery Replacement $97,899 $906,552 $1,107,600 $2,112,051 Subtotal, CDBG $97,899 $906,552 $1,107,600 $2,112,051 Fire Station 5 Replacement $87,328 $641,876 $327,653 $1,056,857 Fire Station 3 Replacement $28,703 $284,230 $184,230 $497,163 Fire Station 9 Replacement $3,115 $576,523 $579,638 Fire Station 12 Expansion $79,329 $1,420,671 $1,500,000 Subtotal, Optional Sales Tax $116,031 $1,008,550 $2,509,077 $3,633,658 Grand Total, Capital Expenditures $572,640 $479,780 $1,986,380 $1,500,895 $5,487,711 $13,622,696 $23,650,101 Total Capacity Expansion $78,091 $24,438 $29,540 $56,793 $187,242 $2,284,414 $2,660,518 Percent Capacity Expansion 13.64% 5.09% 1.49% 3.78% 3.41% 16.77% 11.25% Percent Capacity from Gen. Fund 0.00% 0.00% 0.00% 0.00% 0.00% 0.00% Source: IRC Office of Management and Budget, January 22, 2007 (FY 2006/07 amounts are budgeted, not actual). 0.00% Impact Fee Update, Technical Memo #3 (Revised) Duncan Associates Indian River County, Florida 74 July 19, 2007
83 The County is planning to construct two new stations over the next five years. Table 77 summarizes these planned capital expenditures. Table 77. Planned Fire Rescue Improvements, Improvement Type 2007/ / / / /12 5-Year Total New Station 13 Expansion $0 $1,144,705 $1,500,000 $0 $0 $2,644,705 New Station 14 Expansion $0 $0 $0 $0 $2,800,000 $2,800,000 Total Capital Expenditures $0 $1,144,705 $1,500,000 $0 $2,800,000 $5,444,705 Total Expansion Expenditures $0 $1,144,705 $1,500,000 $0 $2,800,000 $5,444,705 Projected Fire/Rescue Impact Fees $0 $0 $0 $0 $2,800,000 $2,800,000 Non-Impact Fee Expansion Funding $0 $1,144,705 $1,500,000 $0 $0 Source: IRC Office of Management and Budget, February 22, $2,644,705 The credit per functional population is calculated using the average capital expansion expenditures during the last six years and the future planned projects budgeted during the next five-years. The average annual capital expenditure amount is divided by the average functional population during this eleven-year time period, resulting in an average capital expansion contribution of $3.00 per functional resident. This information is presented in Table 78. Table 78. Fire Rescue Annual Credit per Functional Population Fiscal Year Non-Impact Fee Capacity Expenditures Functional Population Annual Expend./ Func. Pop. 2001/02 $78, ,822 $ /03 $24, ,408 $ /04 $29, ,994 $ /05 $56, ,580 $ /06 $187, ,166 $ /07 $2,284, ,752 $ /08 $0 164,338 $ /09 $1,144, ,924 $ /10 $1,500, ,510 $ /11 $0 175,096 $ /12 $0 178,682 $0.00 Total/Average $5,305,223 1,768,272 $3.00 Source: Non-impact fee capacity expenditures from Table 76 and Table 77; functional population is county-wide less Indian River Shores from Table 132 (years prior to 2006/07 interpolated). The net present value of the annual revenue credit over the next 25 years is calculated in the following table. Reducing the cost per functional population by the revenue credit leaves a fire rescue net cost of $ per functional population, as shown in Table 79. Impact Fee Update, Technical Memo #3 (Revised) Duncan Associates Indian River County, Florida 75 July 19, 2007
84 Table 79. Fire Rescue Net Cost per Functional Population Average Annual Funding Credit per Functional Pop. $3.00 Net Present Value Factor (25 years at 4.2% discount rate) Funding Credit per Functional Population $45.90 Cost per Functional Population] $ Net Cost per Functional Population $ Source: Annual credit from Table 78; discount rate is average interest rate on state and local bonds in March through May 2007 from the Federal Reserve; cost per functional population from Table 75. Updated Impact Fee Schedule The maximum fire rescue impact fees that can be adopted by the County based on this study are derived by multiplying the functional population represented by each impact unit by the net cost per functional population, as shown in Table 80. As with other fee types in this update, the updated fire rescue fee schedule includes the addition of research & development centers and auto repair to the major land use categories, combines accessory single-family with multi-family land uses and removes the quality restaurant and government office building land use categories. Table 80. Updated Fire Rescue Net Cost Schedule Impact Unit Functional Population Coefficient Net Cost/ Func. Pop. Net Cost/ Unit Land Use Residential Single-Family* Less than 1,500 sf (under air) Dwelling $ $292 1,500 to 2,499 sf (under air) Dwelling $ $326 2,500 sf or more (under air) Dwelling $ $355 Multi-Family/Accessory Unit Dwelling $ $176 Mobile Home Dwelling $ $208 Transient, Assisted, Group Hotel/Motel Room $ $197 Nursing Home/ACLF Bed $ $213 Office and Financial Medical Office 1,000 sf $ $370 Bank/Savings Walk-in 1,000 sf $ $421 Bank/Savings Drive-in 1,000 sf $ $372 Office 50,000 sf or less 1,000 sf $ $356 Office greater than 50,000 sf 1,000 sf $ $258 Research & Dev't Center 1,000 sf $ $158 Industrial Manufacturing 1,000 sf $ $109 Warehouse 1,000 sf $ $82 Mini-Warehouse 1,000 sf $ $16 General Industrial 1,000 sf $ $149 Concrete Plant Acre $ $328 Sand Mining Acre $ $42 Impact Fee Update, Technical Memo #3 (Revised) Duncan Associates Indian River County, Florida 76 July 19, 2007
85 Updated Fire Rescue Impact Fee Schedule (continued) Impact Unit Functional Population Coefficient Net Cost/ Func. Pop. Net Cost/ Unit Land Use Retail Retail 50,000 sf or less 1,000 sf $ $748 Retail 50,001 to 100,000 sf 1,000 sf $ $594 Retail 100,001 to 200,000 sf 1,000 sf $ $600 Retail over 200,000 sf 1,000 sf $ $504 Gas/Service Station Fuel pos $ $374 New and Used Car Sales 1,000 sf $ $417 Restaurant 1,000 sf $ $1,614 Fast Food Rest w/ Drive-Thru 1,000 sf $ $1,716 Supermarket 1,000 sf $ $481 Auto Repair 1,000 sf $ $107 Self Service Car Wash Bays $ $410 Convenience Store 1,000 sf $ $816 Furniture Store 1,000 sf $ $69 Recreational Golf Course Hole $ $530 Racquet/Health Club/Dance 1,000 sf $ $333 County Park Acre $ $31 Tennis Court Court $ $404 Marina Berths $ $33 Governmental Post Office 1,000 sf $ $385 Library 1,000 sf $ $373 Government Office 1,000 sf $ $294 Jail Bed $ $42 Miscellaneous Day Care Center 1,000 sf $ $219 Hospital 1,000 sf $ $325 Veterinary Clinic 1,000 sf $ $355 Church 1,000 sf $ $116 Movie Theater 1,000 sf $ $1,306 School (Elem. and Middle) 1,000 sf $ $229 School (High) 1,000 sf $ $196 School (College) 1,000 sf $ $518 Fire Station** 1,000 sf $0.00 * includes single-family detached and single-family attached $0 ** fire stations mitigate the need for fire rescue facilities. Source: Functional population coefficients from Table 129 and Table 130; net cost per functional population from Table 79. The updated fire rescue impact fees are compared with current fees in Table 81. For most land uses, the fees could go up modestly. The fee for multi-family units remains unchanged due to the somewhat lower persons/unit multiplier than was used in the 2005 study. Impact Fee Update, Technical Memo #3 (Revised) Duncan Associates Indian River County, Florida 77 July 19, 2007
86 Table 81. Comparative Fire Rescue Impact Fees Impact Unit Current Fee Updated Fee Percent Change Land Use Residential Single-Family* Less than 1,500 sf (under air) Dwelling $247 $292 18% 1,500 to 2,499 sf (under air) Dwelling $278 $326 17% 2,500 sf or more (under air) Dwelling $301 $355 18% Multi-Family/Accessory Unit Dwelling $176 $176 0% Mobile Home Dwelling $182 $208 15% Transient, Assisted, Group Hotel/Motel Room $160 $197 23% Nursing Home/ACLF Bed $172 $213 24% Office and Financial Medical Office 1,000 sf $299 $370 24% Bank/Savings Walk-in 1,000 sf $341 $421 23% Bank/Savings Drive-in 1,000 sf $280 $372 33% Office 50,000 GSF or less 1,000 sf $246 $356 45% Office greater than 50,000 GSF 1,000 sf $130 $258 98% Research & Dev't Center 1,000 sf NA $158 NA Industrial Manufacturing 1,000 sf $88 $109 24% Warehouse 1,000 sf $68 $82 21% Mini-Warehouse 1,000 sf $13 $16 20% General Industrial 1,000 sf $120 $149 24% Concrete Plant Acre $265 $328 24% Sand Mining Acre $34 $42 24% Retail Retail 50,000 sf or less 1,000 sf $503 $748 49% Retail 50,001 to 100,000 sf 1,000 sf $502 $594 18% Retail 100,001 to 200,000 sf 1,000 sf $513 $600 17% Retail over 200,000 sf 1,000 sf $351 $504 44% Gas/Service Station Fuel pos $303 $374 23% New and Used Car Sales 1,000 sf $300 $417 39% Restaurant 1,000 sf $1,289 $1,614 25% Fast Food Rest w/ Drive-Thru 1,000 sf $1,389 $1,716 24% Supermarket 1,000 sf $357 $481 35% Auto Repair 1,000 sf NA $107 NA Self Service Car Wash Bays $332 $410 24% Convenience Store 1,000 sf $746 $816 9% Furniture Store 1,000 sf $56 $69 23% Recreational Golf Course hole $429 $530 23% Racquet/Health Club/Dance 1,000 sf $417 $333-20% County Park Acre $27 $31 16% Tennis Court Court $408 $404-1% Marina Berths $27 $33 23% Governmental Post Office 1,000 sf $312 $385 24% Library 1,000 sf $302 $373 24% Government Office 1,000 sf $238 $294 23% Jail Bed $153 $42-73% Miscellaneous Day Care Center 1,000 sf $177 $219 23% Hospital 1,000 sf $275 $325 18% Veterinary Clinic 1,000 sf $287 $355 24% Church 1,000 sf $94 $116 24% Movie Theater 1,000 sf $759 $1,306 72% School (Elem. and Middle) 1,000 sf $242 $229-5% School (High) 1,000 sf $193 $196 2% School (College) 1,000 sf $309 $518 68% Fire Station 1,000 sf $0 $0 * includes single-family detached and single-family attached NA Source: Updated fees from Table 80. Impact Fee Update, Technical Memo #3 (Revised) Duncan Associates Indian River County, Florida 78 July 19, 2007
87 Revenue Projections Potential impact fee revenue is difficult to project, since recent building trends do not necessarily reflect future building activity. The revenue estimates shown below should be used cautiously, as they are intended primarily to provide a weighted comparison between the current and updated fee schedules. Based on the average annual amount of development experienced over the last six years, it is estimated that the updated fire rescue impact fees will generate about 18 percent more revenue than would be generated under the current fee schedule, as shown in Table 82. Table 82. Fire Rescue Impact Fee Revenue Estimates Avg. Annual Impact Fee Rates Impact Fee Revenues Percent Land Use Type Impact Units Current Updated Current Updated Change Single-Family* 2,338 $278 $326 $650,000 $762,000 17% Multi-Family 463 $176 $176 $82,000 $81,000-1% Mobile Home 57 $182 $208 $10,000 $12,000 20% Nonresidential (1000 sf) $359 $448 $281,000 $351,000 25% Total $1,023,000 $1,206,000 18% * includes single-family detached and single-family attached Source: Average annual impact units from 2001 to 2006 building permit data (county-wide less Indian River Shores); impact fee rates from Table 81 (nonresidential fees are averages of all nonresidential land uses charged on a square footage basis). Impact Fee Update, Technical Memo #3 (Revised) Duncan Associates Indian River County, Florida 79 July 19, 2007
88 LAW ENFORCEMENT The Indian River County Sheriff s Office provides law enforcement patrol in the unincorporated area of the county. Law enforcement patrol is provided by the Uniform Services Division, which includes the Uniform Deputies Unit, the Traffic Unit, Special Operations, Aviation Unit, K-9 Unit, Marine Unit and Ranch and Grove Unit and the Criminal Investigations Division, which includes the Detective Bureau and the Crime Scene Unit. Current Level of Service The Sheriff s Office performs a number of county-wide functions in addition to law enforcement patrol. These include corrections, judicial process and multi-agency dispatch. In addition, agencywide functions, such as the Sheriff s administrative, fiscal, legal and internal affairs staff, central records, information technology and human resources and training, support both county-wide and unincorporated county activities. Space in Sheriff s Office buildings directly occupied by unincorporated area law enforcement patrol and county-wide functions are allocated to their respective areas. Two-thirds of the space occupied by agency-wide functions is allocated to the unincorporated area, reflecting the share of officers devoted to law enforcement patrol. The main Sheriff s Office facility in Indian River County is the acre site occupied by the Sheriff s Administration Building and the Correctional Facility. The land is allocated between county-wide and unincorporated area functions based on the share of building square footage on the site devoted to them. In addition to the main complex, other Sheriff s Office functions that are off-site include judicial process, which is housed in the County Courthouse, and the Aviation Unit, which is housed in the helicopter hangar. The current cost to replace existing law enforcement facilities is based on the estimated average cost per building square foot of future improvements, including expansion of the Administration Building and replacement of the fleet maintenance garage and training facilities (see Table 84). These improvements have been dropped from the most recent Capital Improvements Element, but the estimated costs for the improvements are still considered representative of current expansion costs. The replacement cost of acreage attributable to unincorporated area law enforcement patrol is estimated based on the average cost per acre of four-to-six acre parcels purchased in the county in 2006 (see Table 138 in Appendix E). These building and land replacement costs are summarized in Table 83. Impact Fee Update, Technical Memo #3 (Revised) Duncan Associates Indian River County, Florida 80 July 19, 2007
89 Table 83. Law Enforcement Building and Land Cost Building Sq. Feet Law Enf. Facility Description Service Area Total Unincorp. Co.-Wide Cost Administration Building Sheriff, fiscal, legal, internal affairs Agency-Wide 3,534 1,921 1,613 $378,341 Information Technology Agency-Wide 1, $123,488 Central Records Agency-Wide 3,738 2,032 1,706 $400,202 Law Enforcement Patrol, CID Unincorporated 21,574 21,574 0 $4,248,999 Dispatch County-Wide 3, ,300 $0 Fleet Maintenance Garage Agency-Wide 9,856 5,357 4,499 $1,055,061 General Services Agency-Wide 2,100 1, $224,720 General Services-Deliveries Agency-Wide $53,964 Correctional Facility Human Resources/Training (Jail) Agency-Wide 4,446 2,417 2,029 $476,028 Corrections (Ph I-III less HR/Training) County-Wide 62, ,730 $0 Subtotal, On-Site Facilites 112,936 35,343 77,593 $6,960,803 Judicial Services (Court House) County-Wide 3, ,622 $0 Helicopter Hanger Unincorporated 6,050 6,050 0 $1,191,548 Subtotal, Off-Site Facilities 9,672 6,050 3,622 $1,191,548 Total, Sheriff's Office Facilities 122,608 41,393 81,215 $15,113,154 Admin. Building/Jail Site (Acres) $1,131,178 Source: IRC Sheriff's Office, January 18, 2007 transmittal and February 16, 2007 teleconference; agency-wide square footage allocated to unincorporated based on share of total officers (206/313); law enforcement cost is for unincorporated allocation; building cost based on estimated cost per square foot of planned improvements from Table 84; acres allocated based on building square footage of "on-site" facilities; land cost based on $184,231/acre average sale price of 4 to 6-acre non-agricultural parcels sold in Indian River County in 2006 (see Table 138 in Appendix E). Table 84. Law Enforcement Cost per Building Square Foot Facility Description Estimated Cost Building Sq. Feet Cost/ Sq. Foot Administration Building Expansion $4,274,200 21,500 $ Garage Facility Construction $3,894,000 20,000 $ Training Facilities $478,120 2,400 $ Total $8,646,320 43,900 $ Source: IRC 2020 Comprehensive Plan Capital Improvements Element, adopted September Impact Fee Update, Technical Memo #3 (Revised) Duncan Associates Indian River County, Florida 81 July 19, 2007
90 In addition to land and buildings, a variety of vehicles and equipment is used for law enforcement. Current replacement costs for existing vehicles and equipment was not available. However, Sheriff s Office staff reviewed fixed asset records to identify the original acquisition cost of existing vehicles and equipment utilized in support of the law enforcement patrol function. These costs are summarized in Table 85. Table 85. Law Enforcement Vehicle and Equipment Cost Vehicles $5,223,071 Radio Equipment $1,510,755 Vehicle Equipment $1,379,922 Weapons $193,870 Office Equipment $147,461 Specialty Vehicles/Equipment $116,052 Audio Equipment $149,092 Computer Equipment $2,874,995 Misc. Equipment $1,156,946 Total Equipment Cost Source: IRC Sheriff s Office, January 18, $12,752,164 The total capital cost represented by existing law enforcement facilities and equipment is the sum of building, land, vehicle and capital equipment costs. Dividing the total replacement cost by the existing number of service units in the unincorporated area results in the capital cost per functional population, shown in Table 86. Table 86. Law Enforcement Cost per Functional Population Building Replacement Cost $15,113,154 Land Replacement Cost $1,131,178 Vehicle and Equipment Cost $12,752,164 Total Capital Cost, Law Enforcement Patrol $28,996,496 Functional Population, Unincorporated Area, ,059 Cost per Functional Population $ Source: Building and land costs from Table 83; vehicle and equipment cost from Table 85; unincorporated area functional population from Table 131. Revenue Credits As noted in the introduction, impact fees should be reduced to account for future funding that will be generated by new development and used to remedy existing deficiencies or to retire outstanding debt of existing facilities that help provide the existing level of service to existing development. Since the updated fees are based on the existing levels of service, there are no deficiencies. In addition, Indian River County has no outstanding debt for the types of facilities covered in this report. For these reasons, no revenue credits are absolutely required. The previous study, however, took a more expansive view of revenue credits, providing for a past property tax credit as well as future revenue credit for all types of historical or planned funding used for capacity-expanding capital improvements. While the current consultant team does not agree that Impact Fee Update, Technical Memo #3 (Revised) Duncan Associates Indian River County, Florida 82 July 19, 2007
91 such credits are necessarily required, this update will continue the approach to revenue credits followed in the previous study. An analysis of the historical and future law enforcement capital expenditures for the eleven-year period from FY 2001/02 to FY 2011/12 was completed in order to determine a typical amount of annual funding for capacity-expanding improvements. In the past, the County has relied primarily on the general fund and the optional sales tax for law enforcement capital improvements. Table 87 summarizes the capital expenditures over the last six fiscal years. This table also specifies whether the capital expenditure was a replacement or expansion of the existing law enforcement capital inventory. Table 87. Historical Law Enforcement Improvements, Description Type 2001/ / / / / /07 6-Year Total IRC Sheriff HVAC Replace Replacement $12,778 $18,822 $1,037,506 $278,323 $1,347,429 Sheriff's Evidence Addition Expansion $132,486 $132,486 Sheriff's Parking Paving Replacement $28,229 $28,229 Subtotal, Optional Sales Tax Funding $132,486 $12,778 $47,051 $1,037,506 $278,323 $0 $1,508,144 Automobiles, Auto Equip Replacement $757,000 $504,000 $638,000 $523,000 $940,000 $3,362,000 Boats, Airboat, Etc Expansion $47,000 $60,000 $107,000 Radios, Radio Equip, Etc Replacement $342,000 $178,000 $200,000 $182,000 $71,000 $973,000 Radios, Radio Equip, Etc Expansion $32,000 $32,000 Computers, Laptops, In-Car Replacement $217,000 $255,000 $389,000 $249,000 $322,000 $1,432,000 Cameras, Radar, etc Expansion $51,000 $49,000 $310,000 $101,000 $286,000 $797,000 Communications Systems Replacement $951,927 $278,059 $1,229,986 HVAC Generator Expansion $195,750 $195,750 Subtotal, General Fund $1,414,000 $986,000 $1,537,000 $2,098,927 $1,897,059 $195,750 $8,128,736 Total Capital Expenditures $1,546,486 $998,778 $1,584,051 $3,136,433 $2,175,382 $195,750 $9,636,880 Total Capacity Expenditures $230,486 $49,000 $310,000 $193,000 $286,000 $195,750 $1,264,236 Capacity Expenditures with General Fund $98,000 $49,000 $310,000 $193,000 $286,000 $195,750 $1,131,750 Gen. Fund % of Capacity Expenditures 42.52% % % % % % Source: IRC Office of Management and Budget, January 22, 2007 (FY 2006/07 amounts are budgeted, not actual) % The County does not currently have any planned law enforcement improvements listed in the Capital Improvements Element. The credit per functional population was calculated using the average capital expansion expenditures during the last six years and the future planned projects budgeted during the next five-years. The average annual capital expenditure amount was divided by the average functional population during this eleven-year time period resulting in an average capital expansion contribution of $1.09 per functional resident. This information is presented in Table 88. Impact Fee Update, Technical Memo #3 (Revised) Duncan Associates Indian River County, Florida 83 July 19, 2007
92 Table 88. Law Enforcement Annual Credit per Functional Population Fiscal Year Non-Impact Fee Capacity Expenditures Functional Population Annual Expend./ Func. Pop. 2001/02 $230,486 93,339 $ /03 $49,000 95,683 $ /04 $310,000 98,027 $ /05 $193, ,371 $ /06 $286, ,715 $ /07 $195, ,059 $ /08 $0 107,403 $ /09 $0 109,747 $ /10 $0 112,091 $ /11 $0 114,435 $ /12 $0 116,779 $0.00 Total/Average $1,264,236 1,155,649 $1.09 Source: Non-impact fee capacity expenditures from Table 87; unincorporated area functional population from Table 132 (years prior to 2006/07 interpolated). Another component of the credit accounts for past payments of property taxes from vacant land. Here, the share of total vacant land (residential, commercial and industrial) to total taxable value is reviewed to develop the percentage of the vacant land value to the total unincorporated county taxable value. Table 89 indicates that the vacant land taxable value is 11.11% of total taxable value. This percentage is adjusted to account for the portion of ad valorem taxes used toward capital expansion expenditures. Based on historical expenditures, 89.52% of law enforcement capital expansion expenditures were funded with ad valorem tax revenues over the past six years. Applying this percentage to the vacant land value percentage results in an effective vacant land value percentage of 9.95%, which is used to give credit for past property taxes paid by property owners of vacant land. Table 89. Law Enforcement Past Property Tax Percentage Unincorporated County Vacant Land Value $1,728,524,390 Unincorporated County Total Property Value $15,561,808,237 Vacant Land Percentage of Total Property Value 11.11% General Fund Percent of Capacity Expenditures 89.52% Effective Vacant Land Value Percentage 9.95% Source: Indian River County Property Appraiser, January 2007; general fund percent of capacity expenditures from Table 87. The net present value of the annual revenue credit over the next 25 years is calculated in the following table. Reducing the cost per functional population by the future revenue credit and the past property tax credit leaves a law enforcement net cost of $ per functional population, as shown in Table 90. Impact Fee Update, Technical Memo #3 (Revised) Duncan Associates Indian River County, Florida 84 July 19, 2007
93 Table 90. Law Enforcement Net Cost per Functional Population Average Annual Funding Credit per Functional Pop. $1.09 Net Present Value Factor (25 years at 4.2% discount rate) Future Revenue Credit per Functional Population $16.68 Past Property Tax Credit per Functional Population $27.46 Cost per Functional Population $ Net Cost per Functional Population $ Source: Annual credit from Table 88; discount rate is average interest rate on state and local bonds in March through May 2007 from the Federal Reserve; past property tax credit is percentage from Table 89 times cost per functional population from Table 86. Updated Impact Fee Schedule The maximum law enforcement impact fees that can be adopted by the County based on this study are derived by multiplying the functional population represented by each impact unit by the net cost per functional population, as shown in the following table. As with other fee types, the updated law enforcement fee schedule includes the addition of research & development centers and auto repair to the major land use categories, combines accessory single-family with multi-family land uses and removes the quality restaurant and government office building land use categories. Impact Fee Update, Technical Memo #3 (Revised) Duncan Associates Indian River County, Florida 85 July 19, 2007
94 Table 91. Updated Law Enforcement Impact Fee Schedule Impact Unit Functional Population Coefficient Net Cost/ Func. Pop. Net Cost/ Unit Land Use Residential Single-Family* Less than 1,500 sf (under air) Dwelling $ $312 1,500 to 2,499 sf (under air) Dwelling $ $348 2,500 sf or more (under air) Dwelling $ $379 Multi-Family/Accessory Unit Dwelling $ $188 Mobile Home Dwelling $ $222 Transient, Assisted, Group Hotel/Motel Room $ $211 Nursing Home/ACLF Bed $ $227 Office and Financial Medical Office 1,000 sf $ $395 Bank/Savings Walk-in 1,000 sf $ $450 Bank/Savings Drive-in 1,000 sf $ $397 Office 50,000 sf or less 1,000 sf $ $380 Office greater than 50,000 sf 1,000 sf $ $276 Research & Dev't Center 1,000 sf $ $168 Industrial Manufacturing 1,000 sf $ $116 Warehouse 1,000 sf $ $88 Mini-Warehouse 1,000 sf $ $18 General Industrial 1,000 sf $ $159 Concrete Plant Acre $ $350 Sand Mining Acre $ $45 Retail Retail 50,000 sf or less 1,000 sf $ $799 Retail 50,001 to 100,000 sf 1,000 sf $ $635 Retail 100,001 to 200,000 sf 1,000 sf $ $641 Retail over 200,000 sf 1,000 sf $ $538 Gas/Service Station Fuel pos $ $399 New and Used Car Sales 1,000 sf $ $445 Restaurant 1,000 sf $ $1,724 Fast Food Rest w/ Drive-Thru 1,000 sf $ $1,832 Supermarket 1,000 sf $ $514 Auto Repair 1,000 sf $ $114 Self Service Car Wash Bays $ $438 Convenience Store 1,000 sf $ $872 Furniture Store 1,000 sf $ $74 Recreational Golf Course hole $ $566 Racquet/Health Club/Dance 1,000 sf $ $356 County Park Acre $ $33 Tennis Court Court $ $432 Marina Berths $ $35 Governmental Post Office 1,000 sf $ $411 Library 1,000 sf $ $398 Government Office** 1,000 sf $ $314 Jail Bed $ $44 Impact Fee Update, Technical Memo #3 (Revised) Duncan Associates Indian River County, Florida 86 July 19, 2007
95 Updated Law Enforcement Impact Fee Schedule (continued) Impact Unit Functional Population Coefficient Net Cost/ Func. Pop. Net Cost/ Unit Land Use Miscellaneous Day Care Center 1,000 sf $ $234 Hospital 1,000 sf $ $347 Veterinary Clinic 1,000 sf $ $379 Church 1,000 sf $ $123 Movie Theater 1,000 sf $ $1,395 School (Elem. and Middle) 1,000 sf $ $245 School (High) 1,000 sf $ $209 School (College) 1,000 sf $ $554 Fire Station 1,000 sf $ * includes single-family detached and single-family attached $147 ** no fee for law enforcement buildings, which mitigate the need for law enforcement facilities. Source: Functional population coefficients from Table 129 and Table 130; net cost per functional population from Table 90. The updated law enforcement impact fees are compared with current fees in the following table. Fees could increase by percent for most land uses. Impact Fee Update, Technical Memo #3 (Revised) Duncan Associates Indian River County, Florida 87 July 19, 2007
96 Table 92. Comparative Law Enforcement Fees Impact Unit Current Fee Updated Fee Percent Change Land Use Residential Single-Family* Less than 1,500 sf (under air) Dwelling $218 $312 43% 1,500 to 2,499 sf (under air) Dwelling $245 $348 42% 2,500 sf or more (under air) Dwelling $265 $379 43% Multi-Family/Accessory Unit Dwelling $148 $188 27% Mobile Home Dwelling $158 $222 41% Transient, Assisted, Group Hotel/Motel Room $140 $211 51% Nursing Home/ACLF Bed $151 $227 51% Office and Financial Medical Office 1,000 sf $262 $395 51% Bank/Savings Walk-in 1,000 sf $299 $450 51% Bank/Savings Drive-in 1,000 sf $245 $397 62% Office 50,000 sf or less 1,000 sf $216 $380 76% Office greater than 50,000 sf 1,000 sf $114 $ % Research & Dev't Center 1,000 sf NA $168 NA Industrial Manufacturing 1,000 sf $77 $116 50% Warehouse 1,000 sf $59 $88 48% Mini-Warehouse 1,000 sf $12 $18 54% General Industrial 1,000 sf $105 $159 51% Concrete Plant Acre $232 $350 51% Sand Mining Acre $30 $45 51% Retail Retail 50,000 sf or less 1,000 sf $441 $799 81% Retail 50,001 to 100,000 sf 1,000 sf $439 $635 45% Retail 100,001 to 200,000 sf 1,000 sf $450 $641 43% Retail over 200,000 sf 1,000 sf $307 $538 75% Gas/Service Station Fuel pos $265 $399 50% New and Used Car Sales 1,000 sf $263 $445 69% Restaurant 1,000 sf $1,129 $1,724 53% Fast Food Rest w/ Drive-Thru 1,000 sf $1,217 $1,832 51% Supermarket 1,000 sf $313 $514 64% Auto Repair 1,000 sf NA $114 NA Self Service Car Wash Bays $291 $438 51% Convenience Store 1,000 sf $653 $872 33% Furniture Store 1,000 sf $49 $74 51% Recreational Golf Course hole $376 $566 50% Racquet/Health Club/Dance 1,000 sf $366 $356-3% County Park Acre $23 $33 41% Tennis Court Court $357 $432 21% Marina Berths $24 $35 49% Governmental Post Office 1,000 sf $273 $411 51% Library 1,000 sf $265 $398 50% Government Office 1,000 sf $209 $314 50% Jail Bed $134 $44-67% Miscellaneous Day Care Center 1,000 sf $155 $234 51% Hospital 1,000 sf $241 $347 44% Veterinary Clinic 1,000 sf $251 $379 51% Church 1,000 sf $82 $123 50% Movie Theater 1,000 sf $664 $1, % School (Elem. and Middle) 1,000 sf $199 $245 23% School (High) 1,000 sf $166 $209 26% School (College) 1,000 sf $275 $ % Fire Station 1,000 sf $97 $147 * includes single-family detached and single-family attached 51% Source: Updated fees from Table 91. Impact Fee Update, Technical Memo #3 (Revised) Duncan Associates Indian River County, Florida 88 July 19, 2007
97 Revenue Projections Potential impact fee revenue is difficult to project, since recent building trends do not necessarily reflect future building activity. The revenue estimates shown below should be used cautiously, as they are intended primarily to provide a weighted comparison between the current and updated fee schedules. Based on the average annual amount of development experienced over the last six years, it is estimated that the updated law enforcement impact fees will generate about 43 percent more revenue than would be generated under the current fee schedule, as shown in Table 93. Table 93. Law Enforcement Impact Fee Revenue Estimates Avg. Annual Impact Fee Rates Impact Fee Revenues Percent Land Use Type Impact Units Current Updated Current Updated Change Single-Family* 1,835 $245 $348 $449,000 $639,000 42% Multi-Family 346 $148 $188 $51,000 $65,000 27% Mobile Home 14 $158 $222 $2,000 $3,000 50% Nonresidential (1000 sf) $307 $467 $150,000 $228,000 52% Total $652,000 $935,000 43% * includes single-family detached and single-family attached Source: Average annual impact units from 2001 to 2006 building permit data (county-wide less Indian River Shores); impact fee rates from Table 92 (nonresidential fees are averages of all nonresidential land uses charged on a square footage basis). Impact Fee Update, Technical Memo #3 (Revised) Duncan Associates Indian River County, Florida 89 July 19, 2007
98 CORRECTIONS Indian River County has one correctional facility, located at st Avenue. This site has a total of acres and is shared with the Sheriff s Administration Building. The correctional facilities at this site include the first three phases of the correctional facility and two guardhouses. In 2003, the County purchased an additional 26.7 acres next to the existing correctional facility site to be used for a future jail expansion. The first phase of that expansion (Phase IV) is currently underway and anticipated to be completed this year. It will replace the Hobart Complex, which is being used temporarily to house prisoners until Phase VI is completed. Current Level of Service The Sheriff s Office performs a couple of other county-wide functions in addition to corrections. These include judicial process and multi-agency dispatch. In this update, facilities associated with those county-wide functions will be incorporated into the corrections fee. In some Florida counties, such a fee is referred to as a justice facilities impact fee. Because the Sheriff s Office provides law enforcement services to the unincorporated area in addition to county-wide functions and agency-wide support functions, it is necessary to allocate the building space and associated land between county-wide and unincorporated area. This analysis was presented in the Law Enforcement section. To recap, space in Sheriff s Office buildings directly occupied by unincorporated area law enforcement patrol and county-wide functions are allocated to their respective areas. Two-thirds of the space occupied by agency-wide functions is allocated to the unincorporated area, reflecting the share of officers devoted to law enforcement patrol. The main Sheriff s Office facility in Indian River County is the acre site occupied by the Sheriff s Administration Building and the Correctional Facility. The land is allocated between county-wide and unincorporated area functions based on the share of building square footage on the site devoted to them. In addition to the main complex, other Sheriff s Office functions that are off-site include judicial process, which is housed in the County Courthouse, and the Aviation Unit, which is housed in the helicopter hangar. The current cost to replace existing correctional facilities is estimated based on the estimated cost per building square foot of the current Phase IV correctional facility expansion. The replacement cost of acreage attributable to corrections is estimated based on the average cost per acre of four-tosix acre non-agricultural parcels purchased in the county in 2006 (see Table 138 in Appendix E). These building and land replacement costs are summarized in Table 94. Impact Fee Update, Technical Memo #3 (Revised) Duncan Associates Indian River County, Florida 90 July 19, 2007
99 Table 94. Corrections Building and Land Cost Facility Description Year Acquired/ Built Acres Building Sq. Feet Land Costs Building Costs Correctional Facility, Ph I, II, III* ,759 $20,787,639 Phase IV Expansion ,179 $22,187,436 Sheriff's Office Admin Bldg (part) ,834 $4,119,714 Road Crew Programs Building $256,800 Guardhouse $32,100 Guardhouse $32,100 Share of Admin. Bldg/Jail Site $2,483,434 Hammond Site for Jail Expansion $4,771,583 Total ,772 $7,255,017 * excludes share of human resources/training facilities allocated to unincorporated area in Table 83 $47,415,789 Source: IRC Sheriff's Office, January 18, 2007 transmittal and February 16, 2007 teleconference; share of square feet in Phase I-III, share of administrative building square feet and share of administrative building/jail site acres from Table 83; land cost based on $184,231/acre average sale price of 4 to 6-acre non-agricultural parcels sold in Indian River County in 2006 (see Table 138 in Appendix E). In addition to land and buildings, a variety of vehicles and equipment is used for corrections. Current replacement costs for existing vehicles and equipment was not available. However, Sheriff s Office staff reviewed fixed asset records to identify the original acquisition cost of existing vehicles and equipment utilized in support of the corrections function. These costs are summarized in Table 95. Table 95. Corrections Vehicle and Equipment Cost Vehicles $424,110 Telecommunications $284,671 Vehicle Equipment $7,060 Weapons $48,658 Office Equipment $13,262 Information Technology Equipment $87,452 Audio Equipment $102,822 Other Equipment $467,165 Total Equipment Cost Source: IRC Sheriff s Office, January 18, $1,435,200 The total capital cost represented by existing corrections facilities and equipment is the sum of building, land, vehicle and capital equipment costs. Given that the current expansion of correctional facilities is just being completed this year, basing the fees on the existing level of service would commit the County to maintaining what may be an unrealistically high level of service. In discussions with County staff, it was agreed that it would be more appropriate to base the fees on the average level of service that would be in place midway between expansion projects. The halfway point to the next major expansion may be approximately Consequently, the fees will be based on the ratio of current facility replacement costs to projected 2012 county-wide functional population, as shown in Table 96. Impact Fee Update, Technical Memo #3 (Revised) Duncan Associates Indian River County, Florida 91 July 19, 2007
100 Table 96. Corrections Cost per Functional Population Building Replacement Cost $47,415,789 Land Replacement Cost $7,255,017 Vehicle and Equipment Cost $1,435,200 Total Capital Cost, Corrections $56,106,006 County-Wide Functional Population, ,442 Cost per Functional Population $ Source: Building and land costs and building square feet from Table 94; vehicle and equipment cost from Table 95; 2012 county-wide functional population from Table 132. Revenue Credits As noted in the introduction, impact fees should be reduced to account for future funding that will be generated by new development and used to remedy existing deficiencies or to retire outstanding debt of existing facilities that help provide the existing level of service to existing development. Since the updated fees are based on a level of service lower than the existing level of service, there are no deficiencies. In addition, Indian River County has no outstanding debt for the types of facilities covered in this report. For these reasons, no revenue credits are absolutely required. The previous study, however, took a more expansive view of revenue credits, providing for a past property tax credit as well as future revenue credit for all types of historical or planned funding used for capacity-expanding capital improvements. While the current consultant team does not agree that such credits are necessarily required, this draft will continue the approach to revenue credits followed in the previous study. An analysis of the historical and future corrections capital expenditures for the eleven-year period from FY 2001/02 to FY 2011/12 was completed in order to determine a typical amount of annual funding for capacity-expanding improvements. In the past, the County has relied primarily on the general fund and the optional sales tax for corrections capital improvements. Table 97 summarizes the capital expenditures over the last six fiscal years. This table also specifies whether the capital expenditure was a replacement or expansion of the existing corrections capital inventory. Impact Fee Update, Technical Memo #3 (Revised) Duncan Associates Indian River County, Florida 92 July 19, 2007
101 Table 97. Historical Corrections Improvements, Description Type 2001/ / / / / /07 6-Yr Total Automobiles, Auto Equipment Expansion $19,000 $19,000 Radios, Radio Equipment, etc. Expansion $10,000 $18,000 $28,000 Computers, Surveillance, etc. Replacement $18,000 $63,000 $6,000 $8,000 $23,000 $118,000 Computers, Surveillance, etc. Expansion $4,000 $19,000 $17,000 $40,000 Misc. Jail/Kitchen Equip., etc. Replacement $34,689 $24,000 $6,000 $64,689 Misc. Jail/Kitchen Equip., etc. Expansion $34,000 $62,000 $96,000 Total General Fund $66,689 $121,000 $44,000 $8,000 $126,000 $0 $365,689 IRC Jail Retrofit Phase I Replacement $36,785 $36,785 IRC Jail Re-roof Phase I Replacement $9,445 $185,401 $194,846 IRC Jail Phase II & III Roof Replacement $6,206 $691,040 $37,442 $734,688 IRC Jail Expansion Expansion $170,934 $7,568,231 $9,498,904 $17,238,069 IRC Jail Expansion-Land Expansion $3,500 $989,741 $85,034 $1,078,275 IRC Jail Intercom Replacement $134,145 $134,145 IRC Jail Showers Replacement $58,966 $58,966 IRC Jail Fire Sprinklers Replacement $60,000 $60,000 IRC Jail-Replace Bioler Replacement $25,905 $25,905 IRC Jail Roof/AC Replacement Replacement $127,159 $127,159 Total Optional Sales Tax $49,730 $1,368,253 $6,206 $861,974 $7,631,578 $9,771,097 $19,688,838 IRC Jail Expansion Expansion $3,351,096 $3,351,096 Subtotal, Impact Fees $3,351,096 $3,351,096 Video Visitation Expansion $800,000 $800,000 Subtotal, Inmate Welfare Fund $800,000 $800,000 Total Capital Improvements $116,419 $1,489,253 $50,206 $869,974 $7,757,578 $10,571,097 $20,854,527 Total Capacity Improvements $17,500 $1,023,741 $38,000 $170,934 $7,665,231 $13,735,034 $22,650,440 Capacity Expenditures with Non-Impact Fees $17,500 $1,023,741 $38,000 $170,934 $7,665,231 $10,383,938 $19,299,344 Capacity Expenditures with General Fund $14,000 $34,000 $38,000 $0 $97,000 $0 $183,000 Percent Capacity with Gen. Fund 80.00% 3.32% % 0.00% 1.27% 0.00% 0.81% Source: IRC Office of Management and Budget, January 22, 2007 (FY 2006/07 amounts are budgeted, not actual). The County does not currently have any planned corrections improvements listed in the Capital Improvements Element. The credit per functional population was calculated using the average capital expansion expenditures during the last six years and the future planned projects budgeted during the next five years. The average annual capital expenditure amount was divided by the average functional population during this eleven-year time period, resulting in an average capital expansion contribution of $10.63 per functional resident. This information is presented in Table 98. Impact Fee Update, Technical Memo #3 (Revised) Duncan Associates Indian River County, Florida 93 July 19, 2007
102 Table 98. Corrections Annual Credit per Functional Population Fiscal Year Non-Impact Fee Capacity Expenditures Functional Population Annual Expend./ Func. Pop. 2001/02 $17, ,622 $ /03 $1,023, ,304 $ /04 $38, ,986 $ /05 $170, ,668 $ /06 $7,665, ,350 $ /07 $10,383, ,032 $ /08 $0 168,714 $ /09 $0 172,396 $ /10 $0 176,078 $ /11 $0 179,760 $ /12 $0 183,442 $0.00 Total/Average $19,299,344 1,815,352 $10.63 Source: Non-impact fee capacity expenditures from Table 97; county-wide functional population from Table 132 (years prior to 2006/07 interpolated). Another component of the credit accounts for past payments of property taxes from vacant land. Here, the share of total vacant land (residential, commercial and industrial) to total taxable value is reviewed to develop the percentage of the vacant land value to the total county-wide taxable value. Table 99 indicates that the vacant land taxable value is 9.51% of total taxable value county-wide. This percentage is adjusted to account for the portion of ad valorem taxes used toward capital expansion expenditures. Based on historical expenditures, 0.81% of corrections capital expansion expenditures were funded with ad valorem tax revenues over the past six years. Applying this percentage to the vacant land value percentage results in an effective vacant land value percentage of 0.08%, which is used to give credit for past property taxes paid by property owners of vacant land. Table 99. Corrections Past Property Tax Percentage County-Wide Vacant Land Value $2,419,297,960 County-Wide Total Property Value $25,440,066,977 Vacant Land Percentage of Total Property Value 9.51% General Fund Percent of Capacity Expenditures 0.81% Effective Vacant Land Value Percentage 0.08% Source: Indian River County Property Appraiser, January 2007; general fund percent of capacity expenditures from Table 97. The net present value of the annual revenue credit over the next 25 years is calculated in the following table. Reducing the cost per functional population by the revenue credit leaves a corrections net cost of $ per functional population, as shown in Table 100. Impact Fee Update, Technical Memo #3 (Revised) Duncan Associates Indian River County, Florida 94 July 19, 2007
103 Table 100. Corrections Net Cost per Functional Population Average Annual Funding Credit per Functional Pop. $10.63 Net Present Value Factor (25 years at 4.2% discount rate) Future Revenue Credit per Functional Population $ Past Property Tax Credit per Functional Population $0.24 Cost per Functional Population $ Net Cost per Functional Population $ Source: Annual credit from Table 98; discount rate is average interest rate on state and local bonds in March through May 2007 from the Federal Reserve; past property tax credit is percentage from Table 99 times cost per functional population from Table 96. Updated Impact Fee Schedule The maximum corrections impact fees that can be adopted by the County based on this study are derived by multiplying the functional population represented by each impact unit by the net cost per functional population, as shown in Table 101. As with other fee types, the updated corrections fee schedule includes the addition of research & development centers and auto repair to the major land use categories, combines accessory single-family with multi-family land uses and removes the quality restaurant and government office building land use categories. Table 101. Updated Corrections Impact Fee Schedule Impact Unit Functional Population Coefficient Net Cost/ Func. Pop. Net Cost/ Unit Land Use Residential Single-Family* Less than 1,500 sf (under air) Dwelling $ $192 1,500 to 2,499 sf (under air) Dwelling $ $215 2,500 sf or more (under air) Dwelling $ $234 Multi-Family/Accessory Unit Dwelling $ $116 Mobile Home Dwelling $ $137 Transient, Assisted, Group Hotel/Motel Room $ $130 Nursing Home/ACLF Bed $ $140 Office and Financial Medical Office 1,000 sf $ $243 Bank/Savings Walk-in 1,000 sf $ $277 Bank/Savings Drive-in 1,000 sf $ $245 Office 50,000 sf or less 1,000 sf $ $234 Office greater than 50,000 sf 1,000 sf $ $170 Research & Dev't Center 1,000 sf $ $104 Industrial Manufacturing 1,000 sf $ $72 Warehouse 1,000 sf $ $54 Mini-Warehouse 1,000 sf $ $11 General Industrial 1,000 sf $ $98 Concrete Plant Acre $ $216 Sand Mining Acre $ $28 Impact Fee Update, Technical Memo #3 (Revised) Duncan Associates Indian River County, Florida 95 July 19, 2007
104 Updated Corrections Impact Fee Schedule (continued) Impact Unit Functional Population Coefficient Net Cost/ Func. Pop. Net Cost/ Unit Land Use Retail Retail 50,000 sf or less 1,000 sf $ $492 Retail 50,001 to 100,000 sf 1,000 sf $ $391 Retail 100,001 to 200,000 sf 1,000 sf $ $395 Retail over 200,000 Gsf 1,000 sf $ $332 Gas/Service Station Fuel pos $ $246 New and Used Car Sales 1,000 sf $ $274 Restaurant 1,000 sf $ $1,063 Fast Food Rest w/ Drive-Thru 1,000 sf $ $1,130 Supermarket 1,000 sf $ $317 Auto Repair 1,000 sf $ $70 Self Service Car Wash Bays $ $270 Convenience Store 1,000 sf $ $538 Furniture Store 1,000 sf $ $45 Recreational Golf Course hole $ $349 Racquet/Health Club/Dance 1,000 sf $ $220 County Park Acre $ $20 Tennis Court Court $ $266 Marina Berths $ $22 Governmental Post Office 1,000 sf $ $254 Library 1,000 sf $ $246 Government Office 1,000 sf $ $194 Jail** Bed $0.00 $0 Miscellaneous Day Care Center 1,000 sf $ $144 Hospital 1,000 sf $ $214 Veterinary Clinic 1,000 sf $ $233 Church 1,000 sf $ $76 Movie Theater 1,000 sf $ $860 School (Elem. and Middle) 1,000 sf $ $151 School (High) 1,000 sf $ $129 School (College) 1,000 sf $ $341 Fire Station 1,000 sf $ * includes single-family detached and single-family attached $90 ** no fee for jail buildings, which mitigate the need for correctional facilities. Source: Functional population coefficients from Table 129 and Table 130; net cost per functional population from Table 100. The updated corrections impact fees are compared with current fees in Table 102. Fees could increase moderately for most land uses. Impact Fee Update, Technical Memo #3 (Revised) Duncan Associates Indian River County, Florida 96 July 19, 2007
105 Table 102. Comparative Corrections Impact Fees Impact Unit Current Fee Updated Fee Percent Change Land Use Residential Single-Family* Less than 1,500 sf (under air) Dwelling $151 $192 27% 1,500 to 2,499 sf (under air) Dwelling $170 $215 26% 2,500 sf or more (under air) Dwelling $184 $234 27% Multi-Family/Accessory Unit Dwelling $100 $116 16% Mobile Home Dwelling $123 $137 12% Transient, Assisted, Group Hotel/Motel Room $99 $130 31% Nursing Home/ACLF Bed $107 $140 31% Office and Financial Medical Office 1,000 sf $186 $243 31% Bank/Savings Walk-in 1,000 sf $212 $277 31% Bank/Savings Drive-in 1,000 sf $174 $245 41% Office 50,000 sf or less 1,000 sf $153 $234 53% Office greater than 50,000 sf 1,000 sf $81 $ % Research & Dev't Center 1,000 sf NA $104 NA Industrial Manufacturing 1,000 sf $55 $72 32% Warehouse 1,000 sf $42 $54 28% Mini-Warehouse 1,000 sf $8 $11 33% General Industrial 1,000 sf $75 $98 31% Concrete Plant Acre $165 $216 31% Sand Mining Acre $21 $28 33% Retail Retail 50,000 sf or less 1,000 sf $312 $492 57% Retail 50,001 to 100,000 sf 1,000 sf $312 $391 25% Retail 100,001 to 200,000 sf 1,000 sf $319 $395 24% Retail over 200,000 sf 1,000 sf $218 $332 52% Gas/Service Station Fuel pos $188 $246 31% New and Used Car Sales 1,000 sf $186 $274 47% Restaurant 1,000 sf $801 $1,063 33% Fast Food Rest w/ Drive-Thru 1,000 sf $863 $1,130 31% Supermarket 1,000 sf $222 $317 43% Auto Repair 1,000 sf NA $70 NA Self Service Car Wash Bays $206 $270 31% Convenience Store 1,000 sf $463 $538 16% Furniture Store 1,000 sf $35 $45 30% Recreational Golf Course hole $267 $349 31% Racquet/Health Club/Dance 1,000 sf $259 $220-15% County Park Acre $17 $20 20% Tennis Court Court $253 $266 5% Marina Berths $17 $22 32% Governmental Post Office 1,000 sf $194 $254 31% Library 1,000 sf $188 $246 31% Government Office 1,000 sf $148 $194 31% Jail Bed $0 $0 NA Miscellaneous Day Care Center 1,000 sf $110 $144 31% Hospital 1,000 sf $171 $214 25% Veterinary Clinic 1,000 sf $178 $233 31% Church 1,000 sf $58 $76 31% Movie Theater 1,000 sf $471 $860 83% School (Elem. and Middle) 1,000 sf $142 $151 6% School (High) 1,000 sf $120 $129 8% School (College) 1,000 sf $189 $341 80% Fire Station 1,000 sf $69 $90 * includes single-family detached and single-family attached 30% Source: Updated fees from Table 101; fees do not include administrative charge. Impact Fee Update, Technical Memo #3 (Revised) Duncan Associates Indian River County, Florida 97 July 19, 2007
106 Revenue Projections Potential impact fee revenue is difficult to project, since recent building trends do not necessarily reflect future building activity. The revenue estimates shown below should be used cautiously, as they are intended primarily to provide a weighted comparison between the current and updated fee schedules. Based on the average annual amount of development experienced over the last six years, it is estimated that the updated corrections impact fees will generate about 27 percent more revenue than would be generated under the current fee schedule, as shown in Table 103. Table 103. Corrections Impact Fee Revenue Estimates Avg. Annual Impact Fee Rates Impact Fee Revenues Percent Land Use Type Impact Units Current Updated Current Updated Change Single-Family* 2,384 $170 $215 $405,000 $513,000 27% Multi-Family 476 $100 $116 $48,000 $55,000 15% Mobile Home 57 $123 $137 $7,000 $8,000 14% Nonresidential (1000 sf) $217 $288 $170,000 $225,000 32% Total $630,000 $801,000 27% * includes single-family detached and single-family attached Source: Average annual impact units from 2001 to 2006 county-wide building permit data; impact fee rates from Table 102 (nonresidential fees are averages of all nonresidential land uses charged on a square footage basis). Impact Fee Update, Technical Memo #3 (Revised) Duncan Associates Indian River County, Florida 98 July 19, 2007

107 PUBLIC BUILDINGS Indian River County provides a number of public building facilities that serve the entire county. These include the County Administration Building and Administrative Annex, the Health Department Building, the Judicial Complex, the Fleet Management Facility, the Traffic Engineering Facility and the Road and Bridge Engineering Facility. These facilities are centrally located in and around Vero Beach, as illustrated in Figure 7. Figure 7. Public Building Locations Map Impact Fee Update, Technical Memo #3 (Revised) Duncan Associates Indian River County, Florida 99 July 19, 2007
108 Current Level of Service The inventory and replacement values of existing County-owned and occupied buildings that are currently providing public services are summarized in Table 104. In addition to the facilities included in the table, the County also owns 67,200 square feet of building space that is not included because these facilities, or portions thereof, are leased to various organizations that do not provide County services. The leased-out facilities are either not properly structured or not properly located for providing County services. In addition, the County occupies another 9,107 square feet that it does not own, and these leased facilities, which house the Tax Collector and the North County Offices, are not included. Nor are enterprise fund facilities, such as the Utilities Complex, included. Finally, no facilities that are included in any other type of impact fee are included in the public buildings fee calculations. Facility Table 104. Public Buildings Facility and Land Cost Building Sq. Feet Building Value Acres Land Value New County Administration Building* 150,015 $33,877, $3,060,077 Health Department Building 37,250 $8,412, $584,012 Judicial Complex** 116,007 $26,197, $399,781 Administration Annex 8,400 $1,896, $149,227 Fleet Management Facility*** 15,400 $3,477, $937,736 Road & Bridge/Traffic Facilities 18,350 $4,143, $2,056,018 New Emergency Operations Center* 15,988 $3,610, $1,991,537 43rd Avenue Sub-Complex 31,186 $7,042, $764,559 Total 392,596 $88,659, $9,942,947 * scheduled to be completed early summer 2007 (excludes 23,381 sq. ft. shell portion per May 18, 2007 memo) ** excludes square feet occupied by the Law Library *** portions occupied by County Source: IRC General Services Department, January 22, 2007; building value based on cost per square foot of $225.83, which is the weighted average cost per square foot of actual and projected expenses associated with ongoing construction of the New County Administration Building ($231.87/s.f.), the 43rd Avenue Sub-complex buildings ($124.42) and the New County Emergency Operations Center ($358.22), including site work, design, furniture, fixture and equipment (FF&E), architectural and engineering costs and fee and permit expenses; land cost based on $184,231/acre average sale price of 4 to 6-acre non-agricultural parcels sold in Indian River County in 2006 (see Table 138 in Appendix E). The total capital cost represented by existing public buildings is the sum of building and land costs. Given that the new County administration building and Emergency Operations Center are just being completed this year, basing the fees on the existing level of service would commit the County to maintaining what may be an unrealistically high level of service. In discussions with County staff, it was agreed that it would be more appropriate to base the fees on the average level of service that would be in place midway between expansion projects. It is likely that it may be 2020 before the next major expansion project. The halfway point to the next major expansion, then, would be approximately Consequently, the fees will be based on the ratio of current facility replacement costs to projected 2014 county-wide functional population. Dividing the total replacement cost by projected county-wide service units in 2014 results in the capital cost per functional population, shown in Table 105. Impact Fee Update, Technical Memo #3 (Revised) Duncan Associates Indian River County, Florida 100 July 19, 2007
109 Table 105. Public Buildings Cost per Functional Population Building Replacement Cost $88,659,955 Land Replacement Cost $9,942,947 Total Capital Cost $98,602,902 County-Wide Functional Population, ,806 Cost per Functional Population $ Source: Building and land costs and building square feet from Table 104; 2014 county-wide functional population from Table 132 in Appendix B. Revenue Credits As noted in the introduction, impact fees should be reduced to account for future funding that will be generated by new development and used to remedy existing deficiencies or to retire outstanding debt on existing facilities that help provide the existing level of service to existing development. Since the updated fees are based on the existing levels of service, there are no deficiencies. In addition, Indian River County has no outstanding debt for the types of facilities covered in this report. For these reasons, no revenue credits are absolutely required. The previous study, however, took a more expansive view of revenue credits, providing for a past property tax credit as well as future revenue credit for all types of historical or planned funding used for capacity-expanding capital improvements. While the current consultant team does not agree that such credits are necessarily required, this draft will continue the approach to revenue credits followed in the previous study. An analysis of the historical and future public buildings capital expenditures for the eleven-year period from FY 2001/02 to FY 2011/12 was completed in order to determine a typical amount of annual funding for capacity-expanding improvements. In the past, the County has relied primarily on the general fund and the optional sales tax for public buildings capital improvements. Table 106 summarizes the capital expenditures over the last six fiscal years. This table also specifies whether the capital expenditure was a replacement or expansion of the existing public buildings capital inventory. Impact Fee Update, Technical Memo #3 (Revised) Duncan Associates Indian River County, Florida 101 July 19, 2007
110 Table 106. Historical Public Buildings Improvements, Description Type 2001/ / / / / /07 6-Yr Total New County Admin. Building* Expansion $2,142,096 $2,142,096 New County Admin. Building* Replacement $1,842,457 $1,842,457 Health Department Roof Replacement $74,867 $9,830 $84,696 Courthouse Washing/Painting Replacement $25,000 $25,000 Tax Collector Air Conditioning Replacement $14,613 $14,613 Courthouse Record Shelving Replacement $49,500 $49,500 Daisy Hope Ctr-water connect Expansion $14,240 $14,240 Courthouse X-Ray Machine Replacement $22,427 $22,427 Subtotal, General Fund $138,980 $34,830 $0 $0 $36,667 $3,984,553 $4,195,029 New County Admin. Building* Expansion $20,536,970 $20,536,970 New County Admin. Building* Replacement $17,664,239 $17,664,239 Emergency Operations Ctr** Expansion $4,326,402 $4,326,402 Fiber Optic Expansion $15,719 $180,911 $16,695 $102,786 $200,000 $516,110 Fleet Management Facility Replacement $36,567 $3,274,855 $3,311,422 Financial Software Replacement $530,099 $154,458 $684,557 Health Dept Dental Clinic Expansion $358,569 $358,569 New County Admin Building Replacement $7,422 $179,358 $185,413 $372,193 Misc. Land Purchases Expansion $914,966 $914,966 Misc. Building Alterations Replacement $58,426 $21,340 $60,166 $26,136 $180,752 $346,820 Courthouse Security Upgrade Expansion $140,000 $140,000 Other Machinery & Equipment Expansion $2,871 $50,453 $38,225 $50,392 $141,941 Health Department Reroof Replacement $10,000 $10,000 IRC Health Dept. Fire Alarms Replacement $25,000 $25,000 Courthouse Cameras & Vent Replacement $17,367 $17,367 Health Dept. HVAC Replacement $555,000 $555,000 School Board Reroof Replacement $139,809 $139,809 Subtotal, Optional Sales Tax & Other $1,006,802 $4,728,759 $296,032 $81,056 $102,786 $43,845,931 $50,061,366 New County Admin. Bldg Expansion $2,133,065 $2,133,065 Emergency Operations Ctr Expansion $1,599,798 $1,599,798 Subtotal, Impact Fees $0 $0 $0 $0 $0 $3,732,863 $3,732,863 Total Capital Improvements $1,145,782 $4,763,588 $296,032 $81,056 $139,453 $51,563,347 $57,989,258 Total Capacity Improvements $374,288 $1,098,748 $50,453 $54,920 $117,026 $31,128,723 $32,824,158 Non-Impact Fee Capacity Expenditures $374,288 $1,098,748 $50,453 $54,920 $117,026 $27,395,860 $29,091,295 Capacity Expenditures with General Fund $0 $0 $0 $0 $14,240 $2,142,096 $2,156,336 Percent Capacity with Gen. Fund 0.00% 0.00% 0.00% 0.00% 12.17% 6.88% 6.57% * replacement percentage based on relative size of old versus new building (76,304 sf/173,396 sf = 44.01%), after deducting impact fee revenues, non-impact fee replacement share is 46.24% ** includes $2.5 million in State funding Source: IRC Office of Management and Budget, January 22, 2007 (FY 2006/07 amounts are budgeted, not actual). The County does not currently have any planned public building improvements listed in the Capital Improvements Element. The credit per functional population was calculated using the average capital expansion expenditures during the last six years and the future planned projects budgeted during the next five-years. The average annual capital expenditure amount was divided by the average functional population during this eleven-year time period, resulting in an average capital expansion contribution of $16.03 per functional resident. This information is presented in Table 107. Impact Fee Update, Technical Memo #3 (Revised) Duncan Associates Indian River County, Florida 102 July 19, 2007
111 Table 107. Public Buildings Annual Credit per Functional Population Fiscal Year Non-Impact Fee Capacity Expenditures Functional Population Annual Expend./ Func. Pop. 2001/02 $374, ,622 $ /03 $1,098, ,304 $ /04 $50, ,986 $ /05 $54, ,668 $ /06 $117, ,350 $ /07 $27,395, ,032 $ /08 $0 168,714 $ /09 $0 172,396 $ /10 $0 176,078 $ /11 $0 179,760 $ /12 $0 183,442 $0.00 Total/Average $29,091,295 1,815,352 $16.03 Source: Non-impact fee capacity expenditures from Table 106; county-wide functional population from Table 132 (years prior to 2006/07 interpolated). Another component of the credit accounts for past payments of property taxes from vacant land. Here, the share of total vacant land (residential, commercial and industrial) to total taxable value is reviewed to develop the percentage of the vacant land value to the total county-wide taxable value. Table 108 indicates that the vacant land taxable value is 9.51% of total taxable value county-wide. This percentage is adjusted to account for the portion of ad valorem taxes used toward capital expansion expenditures. Based on historical expenditures, 6.57% of public buildings capital expansion expenditures were funded with ad valorem tax revenues over the past six years. Applying this percentage to the vacant land value percentage results in an effective vacant land value percentage of 0.62%, which is used to give credit for past property taxes paid by property owners of vacant land. Table 108. Public Buildings Past Property Tax Percentage County-Wide Vacant Land Value $2,419,297,960 County-Wide Total Property Value $25,440,066,977 Vacant Land Percentage of Total Property Value 9.51% General Fund Percent of Capacity Expenditures 6.57% Effective Vacant Land Value Percentage 0.62% Source: Indian River County Property Appraiser, January 2007; general fund percent of capacity expenditures from Table 106. The net present value of the annual revenue credit over the next 25 years is calculated in the following table. Reducing the cost per functional population by the revenue credit leaves a public buildings net cost of $ per functional population, as shown in Table 109. Impact Fee Update, Technical Memo #3 (Revised) Duncan Associates Indian River County, Florida 103 July 19, 2007
112 Table 109. Public Buildings Net Cost per Functional Population Average Annual Funding Credit per Functional Pop. $16.03 Net Present Value Factor (25 years at 4.2% discount rate) Future Revenue Credit per Functional Population $ Past Property Tax Credit per Functional Population $0.01 Cost per Functional Population $ Net Cost per Functional Population $ Source: Annual credit from Table 107; discount rate is average interest rate on state and local bonds in March through May 2007 from the Federal Reserve; past property tax credit is percentage from Table 108 times cost per functional population from Table 105. Updated Impact Fee Schedule The maximum public buildings impact fees that can be adopted by the County based on this study are derived by multiplying the functional population represented by each impact unit by the net cost per functional population, as shown in Table 110. As with other fee types, the updated public buildings fee schedule includes the addition of research & development centers and auto repair to the major land use categories, combines accessory single-family with multi-family land uses and removes the quality restaurant and government office building land use categories. Table 110. Updated Public Buildings Impact Fee Schedule Impact Unit Functional Population Coefficient Net Cost/ Func. Pop. Net Cost/ Unit Land Use Residential Single-Family* Less than 1,500 sf (under air) Dwelling $ $365 1,500 to 2,499 sf (under air) Dwelling $ $408 2,500 sf or more (under air) Dwelling $ $444 Multi-Family/Accessory Unit Dwelling $ $220 Mobile Home Dwelling $ $260 Transient, Assisted, Group Hotel/Motel Room $ $247 Nursing Home/ACLF Bed $ $266 Office and Financial Medical Office 1,000 sf $ $462 Bank/Savings Walk-in 1,000 sf $ $527 Bank/Savings Drive-in 1,000 sf $ $465 Office 50,000 sf or less 1,000 sf $ $445 Office greater than 50,000 sf 1,000 sf $ $323 Research & Dev't Center 1,000 sf $ $197 Industrial Manufacturing 1,000 sf $ $136 Warehouse 1,000 sf $ $103 Mini-Warehouse 1,000 sf $ $21 General Industrial 1,000 sf $ $186 Concrete Plant Acre $ $410 Sand Mining Acre $ $53 Impact Fee Update, Technical Memo #3 (Revised) Duncan Associates Indian River County, Florida 104 July 19, 2007
113 Updated Public Buildings Impact Fee Schedule (continued) Impact Unit Functional Population Coefficient Net Cost/ Func. Pop. Net Cost/ Unit Land Use Retail Retail 50,000 sf or less 1,000 sf $ $935 Retail 50,001 to 100,000 sf 1,000 sf $ $743 Retail 100,001 to 200,000 sf 1,000 sf $ $750 Retail over 200,000 sf 1,000 sf $ $630 Gas/Service Station Fuel pos $ $468 New and Used Car Sales 1,000 sf $ $521 Restaurant 1,000 sf $ $2,018 Fast Food Rest w/ Drive-Thru 1,000 sf $ $2,145 Supermarket 1,000 sf $ $601 Auto Repair 1,000 sf $ $134 Self Service Car Wash Bays $ $512 Convenience Store 1,000 sf $ $1,021 Furniture Store 1,000 sf $ $86 Recreational Golf Course hole $ $663 Racquet/Health Club/Dance 1,000 sf $ $417 County Park Acre $ $39 Tennis Court Court $ $505 Marina Berths $ $42 Governmental Post Office 1,000 sf $ $481 Library 1,000 sf $ $467 Government Office** 1,000 sf $ NA Jail Bed $ $52 Miscellaneous Day Care Center 1,000 sf $ $274 Hospital 1,000 sf $ $406 Veterinary Clinic 1,000 sf $ $443 Church 1,000 sf $ $145 Movie Theater 1,000 sf $ $1,634 School (Elem. and Middle) 1,000 sf $ $286 School (High) 1,000 sf $ $245 School (College) 1,000 sf $ $648 Fire Station 1,000 sf $ * includes single-family detached and single-family attached $172 ** no fee for government offices, which mitigate the need for public buildings facilities. Source: Functional population coefficients from Table 129 and Table 130; net cost per functional population from Table 109. The updated public buildings impact fees are compared with current fees in Table 111. For residential land uses, the fees nearly double. For most nonresidential land uses, the fees decline by about one-fourth to one-half. The reason for the decline in nonresidential fees is due to the switch from the 11-hour-per-day functional population used in the previous study to the 24-hour-per-day functional population used in this update. Impact Fee Update, Technical Memo #3 (Revised) Duncan Associates Indian River County, Florida 105 July 19, 2007
114 Table 111. Comparative Public Buildings Impact Fees Impact Unit Current Fee Updated Fee Percent Change Land Use Residential Single-Family* Less than 1,500 sf (under air) Dwelling $183 $ % 1,500 to 2,499 sf (under air) Dwelling $206 $408 98% 2,500 sf or more (under air) Dwelling $223 $444 99% Multi-Family/Accessory Unit Dwelling $121 $220 81% Mobile Home Dwelling $149 $260 75% Transient, Assisted, Group Hotel/Motel Room $229 $247 8% Nursing Home/ACLF Bed $312 $266-15% Office and Financial Medical Office 1,000 sf $1,275 $462-64% Bank/Savings Walk-in 1,000 sf $1,454 $527-64% Bank/Savings Drive-in 1,000 sf $1,191 $465-61% Office 50,000 sf or less 1,000 sf $1,050 $445-58% Office greater than 50,000 sf 1,000 sf $555 $323-42% Research & Dev't Center 1,000 sf NA $197 NA Industrial Manufacturing 1,000 sf $375 $136-64% Warehouse 1,000 sf $288 $103-64% Mini-Warehouse 1,000 sf $40 $21-48% General Industrial 1,000 sf $512 $186-64% Concrete Plant Acre $1,130 $410-64% Sand Mining Acre $145 $53-63% Retail Retail 50,000 sf or less 1,000 sf $1,531 $935-39% Retail 50,001 to 100,000 sf 1,000 sf $1,527 $743-51% Retail 100,001 to 200,000 sf 1,000 sf $1,562 $750-52% Retail over 200,000 sf 1,000 sf $1,067 $630-41% Gas/Service Station Fuel pos $921 $468-49% New and Used Car Sales 1,000 sf $913 $521-43% Restaurant 1,000 sf $3,923 $2,018-49% Fast Food Rest w/ Drive-Thru 1,000 sf $4,227 $2,145-49% Supermarket 1,000 sf $1,087 $601-45% Auto Repair 1,000 sf NA $134 NA Self Service Car Wash Bays $1,009 $512-49% Convenience Store 1,000 sf $2,270 $1,021-55% Furniture Store 1,000 sf $170 $86-49% Recreational Golf Course hole $1,307 $663-49% Racquet/Health Club/Dance 1,000 sf $1,270 $417-67% County Park Acre $81 $39-52% Tennis Court Court $1,241 $505-59% Marina Berths $82 $42-49% Governmental Post Office 1,000 sf $1,107 $481-57% Library 1,000 sf $919 $467-49% Government Office 1,000 sf NA NA NA Jail Bed $466 $52-89% Miscellaneous Day Care Center 1,000 sf $755 $274-64% Hospital 1,000 sf $838 $406-52% Veterinary Clinic 1,000 sf $1,223 $443-64% Church 1,000 sf $285 $145-49% Movie Theater 1,000 sf $2,309 $1,634-29% School (Elem. and Middle) 1,000 sf $994 $286-71% School (High) 1,000 sf $829 $245-70% School (College) 1,000 sf $1,340 $648-52% Fire Station 1,000 sf $339 $172 * includes single-family detached and single-family attached -49% Source: Updated fees from Table 110. Impact Fee Update, Technical Memo #3 (Revised) Duncan Associates Indian River County, Florida 106 July 19, 2007
115 Revenue Projections Potential impact fee revenue is difficult to project, since recent building trends do not necessarily reflect future building activity. The revenue estimates shown below should be used cautiously, as they are intended primarily to provide a weighted comparison between the current and updated fee schedules. Based on the average annual amount of development experienced over the last six years, it is estimated that the updated public buildings impact fees will generate about 3 percent more revenue than would be generated under the current fee schedule, as shown in Table 112. Table 112. Public Buildings Impact Fee Revenue Estimates Avg. Annual Impact Fee Rates Impact Fee Revenues Percent Land Use Type Impact Units Current Updated Current Updated Change Single-Family* 2,384 $206 $408 $490,000 $973,000 99% Multi-Family 476 $121 $220 $58,000 $105,000 81% Mobile Home 57 $149 $260 $8,000 $15,000 88% Nonresidential (1000 sf) $1,176 $540 $920,000 $422,000-54% Total $1,476,000 $1,515,000 3% * includes single-family detached and single-family attached Source: Average annual impact units from 2001 to 2006 county-wide building permit data; impact fee rates from Table 111 (nonresidential fees are averages of all nonresidential land uses charged on a square footage basis). Impact Fee Update, Technical Memo #3 (Revised) Duncan Associates Indian River County, Florida 107 July 19, 2007
.")
116 SOLID WASTE Indian River County provides solid waste disposal services to all residents and businesses in the county. These services are provided through a dependent special district, the Solid Waste Disposal District (SWDD). The physical assets of the SWDD include the landfill site located southeast of I- 95 and Oslo Road and five Customer Convenience Centers (CCCs) located throughout the county, as illustrated in Figure 8. Figure 8. Solid Waste Locations Impact Fee Update, Technical Memo #3 (Revised) Duncan Associates Indian River County, Florida 108 July 19, 2007
117 The Solid Waste Disposal District is a self-supporting operation. Its revenues consist primarily of an annual non-ad valorem assessment on improved property throughout the county and tipping fees charged at the landfill for construction and demolition (C&D) and land clearing debris and tires. Since 2005, the County has also charged a solid waste impact fee on new development throughout the county that is used to fund some solid waste capital improvements. This section is intended to provide the basis for updating the solid waste impact fee. The SWDD does not provide solid waste collection services directly to homes and businesses. It does authorize private franchise operations that provide such services on a voluntary basis for a monthly fee. The franchise operators also provide recycling service to all residential improved properties, funded by the District s non-ad valorem assessment. The franchise operators bring the solid waste and recycling materials to the landfill site, and are not charged a tipping fee. Residents who do not contract with the franchise operators for solid waste collection are responsible for bringing their solid waste to one of the five Customer Convenience Centers. Commercial solid waste is prohibited at the CCCs, although some is probably dropped off there. The District transports solid waste from the CCCs to the landfill. Residential and commercial recycling materials may be dropped off at the landfill. There are several distinct types of solid waste, including Class I (household garbage and similar), recyclable materials, hazardous materials, construction and demolition (C&D) debris, land clearing debris and yard waste. Of these, only Class I waste and C&D debris consume space in the landfill. The other types of waste are processed there and taken off-site for recycling, recovery or reuse. A tipping fee that nominally covers the cost of disposal is charged for C&D debris. That means that Class I waste is the only type of waste that consumes landfill capacity and is not paid for with a tipping fee. Service Unit The updated impact fee schedule is based on the Schedule of Waste Generation Units (WGU) by land use type included in Chapter 3C: Solid Waste Sub-Element of the 2020 Comprehensive Plan. A WGU is defined as a basic unit of waste generation equivalent to 1.0 ton per year. Land Use Table 113. Waste Generation Units by Land Use Type Impact Unit WGU Code Waste Generation Units Residential Single-Family* Lower than 1,500 sf (under air) Dwelling ,500 to 2,499 sf (under air) Dwelling ,500 sf or greater (under air) Dwelling Multi-Family/Accessory Unit Dwelling Mobile Home Dwelling Transient, Assisted, Group Hotel/Motel Room Nursing Home/ACLF Bed Impact Fee Update, Technical Memo #3 (Revised) Duncan Associates Indian River County, Florida 109 July 19, 2007
118 Impact Unit Waste Generation Units Land Use WGU Code Office and Financial Medical Office 1,000 sf Bank/Savings Walk-in 1,000 sf Bank/Savings Drive-in 1,000 sf Office 50,000 GSF or less 1,000 sf Office greater than 50,000 GSF 1,000 sf Research & Dev't Center 1,000 sf Industrial Manufacturing 1,000 sf Warehouse 1,000 sf 48.S 1.00 Mini-Warehouse 1,000 sf 48.C 0.40 General Industrial 1,000 sf Concrete Plant Acre Sand Mining Acre Retail, Gross Square Feet Retail 50,000 GSF or less 1,000 sf Retail 50,001 to 100,000 GSF 1,000 sf Retail 100,001 to 200,000 GSF 1,000 sf Retail over 200,000 GSF 1,000 sf Gas/Service Station Fuel pos New and Used Car Sales 1,000 sf Restaurant 1,000 sf Fast Food Rest w/ Drive-Thru 1,000 sf Supermarket 1,000 sf Auto Repair 1,000 sf Self Service Car Wash Bays 27.K 1.63 Convenience Store 1,000 sf Furniture Store 1,000 sf Recreational Golf Course hole Racquet/Health Club/Dance 1,000 sf County Park Acre Tennis Court Court Marina Berths Governmental Post Office 1,000 sf Library 1,000 sf Government Office 1,000 sf Jail Bed Miscellaneous Day Care Center 1,000 sf Hospital 1,000 sf Veterinary Clinic 1,000 sf Church 1,000 sf 71.V 0.70 Movie Theater 1,000 sf School (Elem. and Middle) 1,000 sf School (High) 1,000 sf School (College) 1,000 sf Fire Station 1,000 sf * includes single-family detached and single-family attached Source: Indian River County, 2020 Comprehensive Plan, Solid Waste Sub-Element (impact unit conversions based on review of data for developments in Indian River County). Impact Fee Update, Technical Memo #3 (Revised) Duncan Associates Indian River County, Florida 110 July 19, 2007
119 The total number of waste generation units in the county can be estimated by multiplying existing impact units by the WGU rate per impact unit identified in the Comprehensive Plan. The total number of WGUs are calculated in Table 114 below. Land Use Table 114. Total Existing Waste Generation Units Impact Unit 2007 Units WGUs/ Unit 2007 WGUs Single-Family* Dwelling 51, ,322 Multi-Family Dwelling 18, ,709 Mobile Home Dwelling 7, ,571 Subtotal, Residential 115,602 Commercial 1,000 sf 23, ,189 Institutional/Misc. 1,000 sf 6, ,737 Government 1,000 sf 5, ,356 Total, County-Wide * includes single-family detached and single-family attached 245,884 Source: 2007 units from Table 131 in Appendix B; WGUs per unit from Table 113. Current Level of Service The 2005 impact fee study based the solid waste impact fees on a level of service expressed in terms of tons per capita per year. All types of waste were included in determining the tonnage rate of 2.2 tons per capita per year. However, this kind of measure is really a demand generation rate, rather than a level of service. The relevant question, in terms of impact fee analysis, is what ratio of facilities to development has existing development paid for? New development can legitimately be asked to pay for that same level of service through impact fees. The Solid Waste Disposal District provides two types of infrastructure capacity. The convenience centers provide capacity to accommodate a flow of material. The portions of the landfill devoted to Class I and C&D disposal, on the other hand, provide the capacity to accommodate a finite volume of waste. These two types of capacity must be analyzed separately. The convenience centers are perhaps the clearest example of the County s investment in infrastructure that provides throughput capacity. They serve only residential customers, and are supported by a non-ad valorem assessment on improved properties throughout the county. The centers are all at least 30 years old. With the exception of the 1.2-acre Fellsmere center, they are all located on the site of old closed landfills. The typical configuration is a raised oval access road that allows cars, pick-up trucks and trailers to be pulled up to a concrete tipping wall that is about three feet high to prevent falls. The grade is lower on the other side of the wall, where containers are located to receive the waste. At some of the centers, a grapple truck is used to transfer waste to a second row of containers during peak periods. The SWDD is in the process of replacing one of the existing convenience centers, for a total cost of about $2 million. In FY 2006, approximately 12.8 Impact Fee Update, Technical Memo #3 (Revised) Duncan Associates Indian River County, Florida 111 July 19, 2007
120 percent of the Class I waste stream was transferred through the Customer Convenience Centers. The centers also accept yard waste and recyclable materials. The centers are at or close to capacity, and major improvements are being planned to increase their capacity. Some of the improvements are necessary to accommodate the switch from roll-off containers to larger walking-floor transfer trailers, which hold approximately 2.5 times the volume of a roll-off container. Other improvements involve lengthening the tipping wall to accommodate additional containers or lengthening the access road to accommodate longer vehicle queues. The relevant level of service is the replacement cost of existing convenience center facilities and improvements to existing residential development in the county. The replacement cost of improvements at the five existing convenience centers is not available at this time. The cost of a current project to replace one of the existing centers is about $2 million. Until better cost estimates are available, one-fourth of this cost, or $500,000 per convenience center, will be used as an approximation of the replacement cost of existing improvements, including access roads, tipping walls, container pads, fencing and lighting. The total replacement cost of convenience center improvements and vehicles per residential Waste Generation Unit (WGU) is calculated in Table 115. Table 115. Convenience Center Cost per Residential WGU Facility/Equipment Units Cost/Unit Total Cost Customer Convenience Center Improvements (each) 5 $500,000 $2,500,000 GMC 1-Ton sierra (Hazardous Waste) 1 $30,000 $30,000 Roll-Off Container 8 $165,000 $1,320,000 Ford 18-Foot Trash Dump 1 $180,000 $180,000 Volvo Roll-Off Truck 1 $165,000 $165,000 4x4 Pick-Up Truck 2 $30,000 $60,000 Peterbilt Semi-Tractor 2 $110,000 $220,000 53' Walking Floor Trailer 10 $53,000 $530,000 Total Convenience Center Replacement Costs $5,005,000 Current Residential Waste Generation Units (WGUs) 115,602 Convenience Center Cost per WGU $43.30 Source: CCC improvement cost per center assumed; vehicle counts and replacement costs from Solid Waste Disposal District, March 12, Recycling vehicles stationed at the landfill process recyclable materials dropped off at the convenience centers or directly at the landfill. While use of the convenience centers is restricted to residential customers and while free recycling pick-up is provided only for residential properties, nonresidential customers can drop off recyclable materials at the landfill. Consequently, the cost of recycling vehicles can be attributed to both residential and nonresidential development, as shown in Table 116. Impact Fee Update, Technical Memo #3 (Revised) Duncan Associates Indian River County, Florida 112 July 19, 2007
121 Table 116. Recycling Cost per WGU Vehicles Units Cost/Unit Total Cost Ford Explorer SUV 1 $32,000 $32,000 Case 621C Wheel Loader 1 $200,000 $200,000 Bobcat Loader 1 $30,000 $30,000 3/4 Ton Pick-Up Truck 1 $30,000 $30,000 Roll-Off Container 1 $165,000 $165,000 Forklift 1 $27,000 $27,000 Hydraulic Side-Shift Attachment 1 $6,000 $6,000 Container Truck 1 $68,000 $68,000 Skid Steer Loader 1 $35,000 $35,000 Front End Loader 1 $200,000 $200,000 Total, Recycling Department Vehicles $793,000 Current Total Waste Generation Units (WGUs) 245,884 Recycling Vehicle Cost per WGU $3.23 Source: Vehicle counts and replacement costs from Solid Waste Disposal District, March 12, The landfill represents a different type of capacity, what might be called consumable capacity. The layout of the existing landfill site is illustrated in Figure 9. The consumable capacity consists of land that is designated for Class I or C&D waste disposal and has not reached maximum allowable height. The impact fee will be based on Class I capacity, since tipping fees charged for C&D debris should, at least in theory, cover the costs associated with C&D waste disposal. However, since the landfill contains both types of capacity, the total main landfill site must be analyzed. Class I disposal areas must be lined and must have a landfill gas emission system. Cells are constructed incrementally as they are needed. The major upfront investment is the acquisition of the land and heavy equipment. The analysis of landfill costs will be limited to the main 225-acre landfill site, since it is the only site that has been master planned. The District also owns 219 mostly-vacant acres north of the main site, 66 vacant acres south of the main site and 29 vacant acres west of I-95 that may eventually be used, in whole or in part, for Class I disposal. There is also a 37-acre C&D landfill located southeast of the main landfill site. Impact Fee Update, Technical Memo #3 (Revised) Duncan Associates Indian River County, Florida 113 July 19, 2007

122 Figure 9. Layout of the Existing Landfill Site Impact Fee Update, Technical Memo #3 (Revised) Duncan Associates Indian River County, Florida 114 July 19, 2007
123 The master-planned capacity (in cubic yards) of the primary 225-acre landfill site is summarized in Table 117. Table 117. Landfill Acreage and Capacity Landfill Area Acres Capacity (CY) CY/Acre Segments 1 & 2 (used)* n/a 2,950,500 n/a Segments 1 & 2 (remaining) n/a 1,000,000 n/a Segments 1 & 2 (total) 59 3,950,500 n/a Segment 3A 22 2,400,000 n/a Segment 3B 22 2,400,000 n/a Segment 3/N C&D Infill n/a 2,300,000 n/a Segment 3/N C&D Infill n/a 1,300,000 n/a Subtotal, Class I ,350, ,908 Cell 1 (used)* n/a 1,293,500 n/a Cell 1/Segment 1 (remaining) n/a 600,000 n/a Cell 2 (total) 22 1,893,500 n/a Cell ,500,000 n/a Subtotal, C&D 55 5,393,500 98,064 Total, Direct Landfill ,744, ,304 Stormwater Management 33 n/a n/a Administrative/Support/Buffer 34 n/a n/a Total ,744,000 * estimate as of March 2006 based on aerial photography 78,862 Source: Solid Waste Disposal District, November The portion of the solid waste impact fee for the landfill will be in the nature of a recoupment fee, since the land and heavy equipment that constitute the upfront capital costs have already been incurred in anticipation of growth. In general, recoupment fees should be based on historical costs (adjusted to current dollars), rather than on replacement costs, because it is not necessary, at least in the short term, to acquire additional land or equipment. However, at this point, the available cost data are in terms of replacement costs. Until better information is available, one-fourth of replacement costs will be used as an approximation of historical costs. The cost of existing main landfill site and heavy equipment is summarized in Table 118 below. Impact Fee Update, Technical Memo #3 (Revised) Duncan Associates Indian River County, Florida 115 July 19, 2007
124 Table 118. Landfill Land and Vehicle Cost Units Cost/Unit Total Cost Main Landfill Site (acres) 225 $55,906 $12,578,850 Utility Tractor w/sweeper 1 $26,000 $26,000 Grader 1 $163,000 $163,000 4x4 Pick-Up Truck 1 $17,000 $17,000 Disposal Tanker 3,000 Gallons 1 $6,000 $6,000 Trailer 15 Foot 1 $2,500 $2,500 Dump Truck 1 $90,000 $90,000 1/2 Ton Pick-Up Truck 1 $20,000 $20,000 1-Ton Flatbed Dump Truck 1 $30,000 $30,000 3/4-Ton Diesel Pick-Up Truck 1 $23,000 $23,000 Track-Type Excavator 1 $150,000 $150,000 Offroad Dump Truck 1 $230,000 $230,000 Commercial Mower 1 $8,000 $8,000 3/4-Ton Pick-Up Truck 1 $23,000 $23,000 Compactor 1 $650,000 $650,000 Wastehandler Dozer 1 $560,000 $560,000 Dump Trailer 2 $30,000 $60,000 Lube Truck 1 $150,000 $150,000 Loader 2 $200,000 $400,000 Tractor 1 $28,000 $28,000 Rotary Mower 1 $15,000 $15,000 1-Ton Truck with Crane 1 $28,000 $28,000 Track-Type Tractor 1 $140,000 $140,000 Welder with Gun 1 $6,000 $6,000 Track-Type Excavator 1 $240,000 $240,000 Total Landfill Cost $15,644,350 Landfill Acres 225 Cost per Acre (Land and Vehicles) $69,530 Historical Cost per Acre (assumed 1/4) $17,383 Source: Solid Waste Disposal District, March 12, 2007; land acquisition cost per acre is the average cost per acre for vacant land parcels of 40 to 160 acres sold in Indian River County in 2006; historical cost per acre assumed one-fourth of replacement cost. The relevant level of service for impact fee purposes is the number of years that existing land can accommodate the projected waste stream from existing development. As shown in the following table, the current stream of Class I waste could be accommodated on the main landfill site for approximately 49 years if there was no additional growth. New development may reasonably be required to pay through impact fees the cost to provide the land needed to accommodate an equivalent number of years of the waste stream it will generate. In this way, new development would be placed on an equal footing with existing development, and would not be asked to pay for a higher level of service than existing development has already paid for. However, to be conservative, the landfill cost per service unit will be based on 29 years, which is the Class I disposal capacity of the main landfill site based on projected growth. In addition, given that additional land and equipment may not be needed for some years, this portion of the fee must be structured as a recoupment fee. Revenues from the recoupment fee could be put in the SWDD s general fund and used to fund capital or operating costs. Multiplying the estimated historical cost of Class I capacity by the cubic yards of Class I waste expected to be generated by a new Waste Generation Unit (WGU) over the life expectancy of the present and Impact Fee Update, Technical Memo #3 (Revised) Duncan Associates Indian River County, Florida 116 July 19, 2007
125 planned Class I disposal facilities yields the Class I recoupment cost per WGU, as shown in Table 119. Table 119. Landfill Class I Recoupment Cost per WGU Remaining Class I Capacity (Cubic Yards) 9,400,000 Annual Class I Cubic Yards Generated 190,396 Years of Capacity Remaining for Existing Dev't Years of Capacity for Existing and New Dev't 29 Est. Class I Cubic Yards Generated, ,396 Estimated Waste Generation Units, ,884 Annual Class I Cubic Yards per WGU Existing LOS (Years of Class I Capacity) 29 Annual Cubic Yards per WGU Total Cubic Yards per WGU Total Class I Capacity (Cubic Yards) 12,350,500 Average Cubic Yards per Acre 78,862 Acres Atributable to Class I Capacity Historical Cost per Acre (Land and Vehicles) $17,383 Recoupment Cost of Class I Capacity $2,722,352 Total Class I Capacity (Cubic Yards) 12,350,500 Cost per Cubic Yard of Class I Capacity $0.22 Total Class I Cubic Yards per WGU Class I Disposal Cost per Waste Generation Unit $4.94 Source: Remaining and total Class I capacity and average cubic yards per acre from Table 117; annual cubic yards generated is estimate for 2007 from SWDD, November 2006; years of capacity for existing and new development from SWDD, November 2006; 2007 WGUs from Table 114; historical cost per acre from Table 118. The solid waste costs per service unit are summarized in Table 120. Convenience center costs are attributed entirely to residential development, while recycling and landfill costs are attributed to both residential and nonresidential development. Table 120. Solid Waste Cost Summary per WGU Residential Nonresidential Convenience Center Cost per WGU $43.30 NA Recycling Cost per WGU $3.23 $3.23 Landfill Cost per WGU $4.94 $4.94 Total Cost per WGU $51.47 $8.17 Source: Convenience center cost from Table 115; recycling cost from Table 116; landfill cost from Table 119. Revenue Credits As discussed in the introduction to this study, impact fees should be reduced to account for future funding that will be generated by new development and used to remedy existing deficiencies or to retire outstanding debt of existing facilities that help provide the existing level of service to existing development. Since the updated fees are based on the existing levels of service, there are no Impact Fee Update, Technical Memo #3 (Revised) Duncan Associates Indian River County, Florida 117 July 19, 2007
126 deficiencies. In addition, the Indian River County Solid Waste Disposal District has no outstanding debt for the types of facilities covered in this report. For these reasons, no revenue credits are absolutely required. The previous study, however, took a more expansive view of revenue credits, providing for a past property tax credit as well as future revenue credit for all types of historical or planned funding used for capacity-expanding capital improvements. A credit for past property taxes paid by vacant land is not appropriate for the solid waste fee, since the District s main funding source is a non-ad valorem assessment on improved property. Similarly, no credit is warranted for the Class I landfill component, which is a recoupment fee. Some credit could be provided for non-ad valorem assessment revenues that might be used in the future for capacity-expanding improvements to the convenience centers. However, the intent in charging an impact fee is to put the burden of those costs on new development and to pay for such costs with impact fee revenues. Assessment revenues would be used only to the extent that impact fee revenues are insufficient to fully fund needed growth-related costs. In this context, no revenue credits are warranted, and the costs per WGU calculated earlier are the same as the net costs per WGU. Updated Impact Fee Schedule The maximum solid waste impact fees that can be adopted by the County based on this study are derived by multiplying the Waste Generation Units (WGUs) represented by each impact unit by the net cost per WGU, as shown in Table 121. As with other fee types, the updated solid waste fee schedule includes the addition of research & development centers and auto repair to the major land use categories, combines accessory single-family with multi-family land uses and removes the quality restaurant and government office building land use categories. Table 121. Updated Solid Waste Impact Fee Schedule Impact Unit WGUs/ Unit Net Cost/ WGU Net Cost/ Unit Land Use Residential Single-Family* Dwelling 1.60 $51.47 $82 Multi-Family/Accessory Unit Dwelling 1.20 $51.47 $62 Mobile Home Dwelling 1.60 $51.47 $82 Transient, Assisted, Group Hotel/Motel Room 0.45 $8.17 $4 Nursing Home/ACLF Bed 0.88 $8.17 $7 Office and Financial Medical Office 1,000 sf 2.50 $8.17 $20 Bank/Savings Walk-in 1,000 sf 2.50 $8.17 $20 Bank/Savings Drive-in 1,000 sf 2.50 $8.17 $20 Office 50,000 sf or less 1,000 sf 2.00 $8.17 $16 Office greater than 50,000 sf 1,000 sf 2.00 $8.17 $16 Research & Dev't Center 1,000 sf 2.00 $8.17 $16 Industrial Manufacturing 1,000 sf 5.00 $8.17 $41 Warehouse 1,000 sf 1.00 $8.17 $8 Mini-Warehouse 1,000 sf 0.40 $8.17 $3 General Industrial 1,000 sf 5.00 $8.17 $41 Concrete Plant Acre 4.00 $8.17 $33 Sand Mining Acre 4.00 $8.17 $33 Impact Fee Update, Technical Memo #3 (Revised) Duncan Associates Indian River County, Florida 118 July 19, 2007
127 Updated Solid Waste Impact Fee Schedule (continued) Impact Unit WGUs/ Unit Net Cost/ WGU Net Cost/ Unit Land Use Retail Retail 50,000 sf or less 1,000 sf 5.00 $8.17 $41 Retail 50,001 to 100,000 sf 1,000 sf 5.00 $8.17 $41 Retail 100,001 to 200,000 sf 1,000 sf 5.00 $8.17 $41 Retail over 200,000 sf 1,000 sf 5.00 $8.17 $41 Gas/Service Station Fuel pos 0.83 $8.17 $7 New and Used Car Sales 1,000 sf 2.50 $8.17 $20 Restaurant 1,000 sf 7.00 $8.17 $57 Fast Food Rest w/ Drive-Thru 1,000 sf $8.17 $106 Supermarket 1,000 sf 9.00 $8.17 $74 Auto Repair 1,000 sf 2.50 $8.17 $20 Self Service Car Wash Bays 1.63 $8.17 $13 Convenience Store 1,000 sf 9.00 $8.17 $74 Furniture Store 1,000 sf 5.00 $8.17 $41 Recreational Golf Course hole 0.80 $8.17 $7 Racquet/Health Club/Dance 1,000 sf 2.50 $8.17 $20 County Park Acre 1.80 $8.17 $15 Tennis Court Court 0.39 $8.17 $3 Marina Berths 0.96 $8.17 $8 Governmental Post Office 1,000 sf 2.00 $8.17 $16 Library 1,000 sf 2.00 $8.17 $16 Government Office 1,000 sf 2.00 $8.17 $16 Jail Bed 0.33 $8.17 $3 Miscellaneous Day Care Center 1,000 sf 5.00 $8.17 $41 Hospital 1,000 sf 1.76 $8.17 $14 Veterinary Clinic 1,000 sf 2.50 $8.17 $20 Church 1,000 sf 0.70 $8.17 $6 Movie Theater 1,000 sf 2.50 $8.17 $20 School (Elem. and Middle) 1,000 sf 2.00 $8.17 $16 School (High) 1,000 sf 2.00 $8.17 $16 School (College) 1,000 sf 2.00 $8.17 $16 Fire Station 1,000 sf 2.00 $8.17 $16 * includes single-family detached and single-family attached Source: WGUs per unit from Table 113; net costs per WGU are costs per WGU from Table 120. The updated solid waste impact fees are compared with current fees in Table 122. For residential land uses, the fees could go up slightly. The nonresidential fees should go down to about one-fifth the current fee levels. Impact Fee Update, Technical Memo #3 (Revised) Duncan Associates Indian River County, Florida 119 July 19, 2007
128 Table 122. Comparative Solid Waste Impact Fees Impact Unit Current Fee Updated Fee Percent Change Land Use Residential Single-Family* Dwelling $75 $82 9% Multi-Family/Accessory Unit Dwelling $57 $62 10% Mobile Home Dwelling $75 $82 9% Transient, Assisted, Group Hotel/Motel Room $21 $4-81% Nursing Home Bed $33 $7-79% ACLF Bed $62 $7-89% Office and Financial Medical Office 1,000 sf $118 $20-83% Bank/Savings Walk-in 1,000 sf $118 $20-83% Bank/Savings Drive-in 1,000 sf $118 $20-83% Office 50,000 sf or less 1,000 sf $94 $16-83% Office greater than 50,000 sf 1,000 sf $94 $16-83% Research & Dev't Center 1,000 sf NA $16 NA Industrial Manufacturing 1,000 sf $236 $41-83% Warehouse 1,000 sf $47 $8-83% Mini-Warehouse 1,000 sf $19 $3-84% General Industrial 1,000 sf $236 $41-83% Concrete Plant Acre $213 $33-85% Sand Mining Acre $213 $33-85% Retail Retail 50,000 sf or less 1,000 sf $236 $41-83% Retail 50,001 to 100,000 sf 1,000 sf $236 $41-83% Retail 100,001 to 200,000 sf 1,000 sf $236 $41-83% Retail over 200,000 sf 1,000 sf $236 $41-83% Gas/Service Station Fuel pos $39 $7-82% New and Used Car Sales 1,000 sf $118 $20-83% Restaurant 1,000 sf $330 $57-83% Fast Food Rest w/ Drive-Thru 1,000 sf $330 $106-68% Supermarket 1,000 sf $424 $74-83% Auto Repair 1,000 sf NA $20 NA Self Service Car Wash Bays $77 $13-83% Convenience Store 1,000 sf $424 $74-83% Furniture Store 1,000 sf $236 $41-83% Recreational Golf Course hole $38 $7-81% Racquet/Health Club/Dance 1,000 sf $118 $20-83% County Park Acre $85 $15-82% Tennis Court Court $18 $3-84% Marina Berths $45 $8-82% Governmental Post Office 1,000 sf $94 $16-83% Library 1,000 sf $94 $16-83% Government Office 1,000 sf $94 $16-83% Jail Bed $16 $3-81% Miscellaneous Day Care Center 1,000 sf $236 $41-83% Hospital 1,000 sf $83 $14-83% Veterinary Clinic 1,000 sf $118 $20-83% Church 1,000 sf $33 $6-82% Movie Theater 1,000 sf $96 $20-79% School (Elem. and Middle) 1,000 sf $170 $16-91% School (High) 1,000 sf $120 $16-87% School (College) 1,000 sf $223 $16-93% Fire Station 1,000 sf $94 $16 * includes single-family detached and single-family attached -83% Source: Updated fees from Table 121. Impact Fee Update, Technical Memo #3 (Revised) Duncan Associates Indian River County, Florida 120 July 19, 2007
129 Revenue Potential Overall solid waste impact fee revenues would decline by about 27 percent from what they would otherwise be under the current fee schedule, as shown in Table 123. Table 123. Solid Waste Impact Fee Revenue Estimates Avg. Annual Impact Fee Rates Impact Fee Revenues Percent Land Use Type Impact Units Current Updated Current Updated Change Single-Family* 2,384 $75 $82 $180,000 $195,000 8% Multi-Family 476 $57 $62 $27,000 $30,000 11% Mobile Home 57 $75 $82 $4,000 $5,000 25% Nonresidential (1000 sf) $173 $31 $135,000 $24,000-82% Total $346,000 $254,000-27% * includes single-family detached and single-family attached Source: Average annual impact units based on building permit data for ; impact fee rates from Table 122 (nonresidential rate per 1,000 sq. ft. is average of all nonresidential categories with an impact unit of 1,000 sq. ft.) Impact Fee Update, Technical Memo #3 (Revised) Duncan Associates Indian River County, Florida 121 July 19, 2007
130 APPENDIX A: POPULATION AND DEMOGRAPHICS For residential land uses, the impact of a dwelling unit on the need for capital facilities is generally proportional to the number of persons residing in the dwelling unit. This can be measured for different housing types in terms of either average household size (average number of persons per occupied dwelling unit) or persons per unit (average number of persons per dwelling unit, including both vacant and occupied units). In this analysis, persons per unit is used. The housing types used in Indian River County s impact fees are single-family, multi-family and mobile home. The single-family category includes single-family detached and single-family attached (or townhouse) units. The multi-family category includes duplexes, tri-plexes, four-plexes, apartments and condominiums. The mobile home category includes mobile homes and recreational vehicles located in a mobile home or recreational vehicle park (a manufactured home or mobile home located on a separate lot is treated as a single-family detached dwelling). Table 124 presents the total number of housing units, household population and average number of residents per housing unit for the residential categories identified above within the entire county. These county-wide average multipliers will be used for all of the impact fee facility updates. This is a change from the previous study, which used slightly different multipliers for fees that applied county-wide and in the unincorporated area. While the average persons per unit do vary slightly between these geographic areas, using a slightly different set of multipliers will not result in new development being over-charged, since the total populations of the respective service area used in the updated fee calculations are estimated based on the county-wide multipliers. In essence, it is not the absolute value of the person per unit multipliers that affects the fees, but rather the relative number of occupants in different types of housing. Since the relative differences are very similar for both service areas, the choice of multipliers to use makes little difference to the fee calculations. In sum, the use of county-wide multipliers for all service areas and impact fee types vastly simplifies the impact fee analysis with little or no loss of accuracy in the fee calculations. Housing Type Table 124. Persons per Unit, 2000 Housing Units Population Persons/ Unit Single Family* 36,240 82, Multi-Family 14,792 18, Mobile Home 6,870 10, Total, County-Wide 57, , * includes single-family detached and single-family attached Source: Total housing units and household population from 2000 U.S. Census for Indian River County (single-family includes single-family attached). To develop single-family fees that vary by the size of the dwelling unit, national data were reviewed to determine the relative differences in persons per unit for various square footage categories. Data from the 2003 American Housing Survey is presented in Table 125 for three different house sizes. Impact Fee Update, Technical Memo #3 (Revised) Duncan Associates Indian River County, Florida 122 July 19, 2007
131 Table 125. Person per Single-Family Unit by Size, U.S Housing Unit Size Persons Housing Units Persons/ Unit Ratio to Avg. Unit Less than 1,500 sf 64,529 26, ,500 sf to 2,499 sf 81,180 29, ,500 sf or more 44,049 14, All Units 189,758 69, Source: 2003 American Housing Survey for single-family detached units To calculate the tiering for the three different categories, national residents per unit ratios for each housing unit category were applied to the county s total residents per housing unit ratios for singlefamily homes, as shown in Table 126. Table 126. Persons per Unit, with Single-Family Tiering Housing Type Untiered Persons/ Unit Ratio to All Units Tiered Persons/ Unit Single Family* Less than 1,500 sf ,500 sf to 2,499 sf ,500 sf or more Multi-Family Mobile Home Total, County-Wide * includes single-family detached and single-family attached Source: Untiered persons/unit from Table 124; single-family ratios by unit size from Table 125. In order to determine the existing levels of service for the various facilities, it is necessary to estimate the existing total population, both county-wide and in the unincorporated area. This is because schools and libraries provide service county-wide, while parks serve primarily the unincorporated area of the county. The existing population for each service area is estimated by multiplying the person-per-unit multipliers that will be used in the impact fee schedules by the estimated existing number of dwelling units. The resulting total population estimates are shown in Table 127. Housing Type Table 127. Existing Housing Units and Population, Census New Units 2007 Units Pop./ Unit 2007 Est. Pop. Single-Family Units* 22,384 11,631 34, ,010 Multi-Family Units 8,536 2,473 11, ,750 Mobile Homes 5, , ,096 Subtotal, Unincorporated 36,317 14,207 50,524 98,856 Single-Family Units* 36,240 15,211 51, ,485 Multi-Family Units 14,792 3,299 18, ,596 Mobile Homes 6, , ,646 Total, County-wide 57,902 18,872 76,774 * Single-family category includes single-family detached and single-family attached. 149,727 Source: New units are units permitted from April 1, 2000 through Dec. 31, 2006 from IRC, "Building Permit Information for New Construction: Permits Issued," February 8, 2007 draft; 2007 units are sum of 2000 Census and New Units; persons per unit from Table 124. Impact Fee Update, Technical Memo #3 (Revised) Duncan Associates Indian River County, Florida 123 July 19, 2007
132 This straight-forward approach to estimating total population ensures that there is a strong relationship between the population multipliers used in the impact fee schedules and the cost per person derived from the existing level of service (essentially by dividing the cost of existing facilities by the existing development served by those facilities, expressed in terms of total population). The previous study relied on a much more complex analysis that might come closer to approximating true population, but did not provide a strong relationship between the fee schedule multipliers and the fee per person. Since total population is simply an intervening variable that relates existing facilities to existing development served by the facilities, it is more important that the method of determining total population does not distort the relationship than that the population estimates accurately reflect the presence of people. For example, there may be higher vacancy rates today than there were in 2000, so that population estimates derived by multiplying 2007 units by 2000 persons per unit may overstate 2007 population. However, what is more important is the potential of those existing units to demand service in the future. When occupancy rates return to normal, there will be no opportunity to charge additional impact fees. In addition, using a more accurate population estimate could result in the fees being too high. For example, if the sum of the products of existing units and person-per-unit multipliers used in the fee schedules is higher than the total population estimate derived from other means, then use of the lower, more accurate population estimate would result in a higher fee (dividing existing facility value by a smaller population estimate, other things equal, will result in a higher cost per person). Population projections have been derived in this analysis simply by using the projected county-wide population growth rate. These projections are shown for each of the two service areas in Table 128. Table 128. Permanent, Year-Round Population, Year Co.-Wide Uninc. % Uninc ,727 98, % , , % , , % , , % , , % , , % , , % , , % , , % , , % , , % , , % , , % , , % , , % , , % , , % , , % , , % Source: 2007 estimates from Table 127; 2025 county-wide and unincorporated area projections from 2020 Comprehensive Plan (rest interpolated). Impact Fee Update, Technical Memo #3 (Revised) Duncan Associates Indian River County, Florida 124 July 19, 2007
133 APPENDIX B: FUNCTIONAL POPULATION For four of the eight impact fee program areas (fire rescue, law enforcement, corrections and public buildings), it is appropriate to apply a concept referred to as functional population in the impact fee literature. It should be noted that Indian River County uses the term functional population in the 2020 Comprehensive Plan, but with a different definition (referring to permanent plus seasonal population). This concept, as used in the impact fee analysis, is a generally-accepted methodology for these impact fee areas and is based on the assumption that demand for certain facilities is generally proportional to the presence of people. To a large extent, the demand for general government services and public safety functions, including fire rescue, law enforcement, corrections and public buildings, is proportional to the presence of people. The functional population concept is analogous to the concept of full-time equivalent employees. It represents the number of full-time equivalent people present at the site of a land use. Functional population is the equivalent number of people occupying a building or land use site on a 24-hours-per-day, 7-days-per-week basis. The previous impact fee study used two kinds of functional population, one based on 24 hours per day, 7 days per week and the other based on 11 hours per day, 5 days per week. The rationale was that fire rescue, law enforcement and corrections impact fees are related to services that are provided around the clock, while most public buildings are only open during daylight weekday hours. While an argument can be made for this approach, it has the result of putting most of the responsibility for public buildings on nonresidential development, since few people are at home during the daylight hours on a weekday. Yet, intuitively, residential development would seem to be just as responsible for the need for public buildings as nonresidential development. In addition, use of another type of functional population seems unnecessarily complicated. For these reasons, this update uses the 24 hours per day, 7 days per week functional population for all four facility types. Determining residential functional population multipliers is considerably simpler than the nonresidential component. It is generally assumed that people spend one-half to two-thirds of their time at home and the rest of each 24-hour day away from their place of residence. In developing the residential component of 24-hour functional population, the previous study estimated that people, on average, spend 15.6 hours, or 65 percent, of each 24-hour day at their place of residence and the other 35 percent away from home. This estimate is also used in this update. For residential uses, then, functional population per unit is calculated by multiplying average household size by 65 percent. In addition to single family, multi-family and mobile home units, residential uses also include hotels, motels, nursing homes and adult congregate living facilities (ACLF). Assumptions and secondary sources, such as ITE s Trip Generation manual, are used to develop functional population per unit for hotels, motels, nursing homes and ACLF land uses. The resulting functional population multipliers for residential land uses are presented in Table 129. Impact Fee Update, Technical Memo #3 (Revised) Duncan Associates Indian River County, Florida 125 July 19, 2007
134 Residential Land Use Table 129. Functional Population per Unit for Residential Land Uses Impact Unit Residents/ Occupants Per Unit Occup. Rate Adj. Pop./ Unit Hours at Place Wrkr/ Unit Work Day Hours Days Per Week Func. Pop./ Unit Residential Single-Family (average)* Dwelling Less than 1,500 sf Dwelling ,500 to 2,499 sf Dwelling ,500 sf or more Dwelling Multi-Family/Accessory Unit Dwelling Mobile Home Dwelling Transient, Assisted, Group Hotel / Motel Room % Nursing Home / ACLF Bed % * includes single-family detached and single-family attached Source: Residents per unit from Table 126 (hotel/motel and nursing home assumed); occupancy rate for hotel/motel based on 9 months of the peak season at 90% occupancy and 3 months off-peak season at 50% (nursing home assumed); hours at place assumed; workers per unit adapted from ITE Trip Generation, 7th Ed.; hours/day assumed; functional population per unit is 65% of persons/unit for residential, and for others = [(Residents/Occupants per Unit x Hours at Place x Days per Week) + (Workers x Work Hours per Day x Days Per Week)]/(24 Hours per Day x 7 Days per Week). The functional population methodology for nonresidential uses is based on national trip generation data compiled by the Institute of Transportation Engineers (ITE). Functional population per 1,000 square feet is derived by dividing the total number of hours spent by employees and visitors during a week by 168 hours (24 hours/day times 7 days/week). Employees are assumed to spend nine hours per day at their place of employment, and visitors are assumed to spend 0.15 to 3.5 hours per visit depending on land use. The formula used to derive the nonresidential functional population estimates is summarized in Figure 10. Figure 10. Nonresidential Functional Population Formula Functional population/1000 sf = (employee hours/1000 sf + visitor hours/1000 sf) x days/week 168 hours/week Where: Employee hours/1000 sf = employees/1000 sf x hours/day Visitor hours/1000 sf = visitors/1000 sf x hours/visit Visitors/1000 sf = weekday ADT/1000 sf x avg. vehicle occupancy employees/1000 sf Weekday ADT/1000 sf = one way average daily trips (total trip ends 2) Using this formula and information on trip generation rates from the ITE manual, vehicle occupancy rates from the National Household Travel Survey and other sources and assumptions, nonresidential functional population estimates per 1,000 square feet of gross floor area are calculated. Table 130 presents the results of these calculations for a number of nonresidential land use categories. Impact Fee Update, Technical Memo #3 (Revised) Duncan Associates Indian River County, Florida 126 July 19, 2007
135 Table 130. Functional Population per Unit for Nonresidential Land Uses Impact Unit ITE Code Trips/ Unit 1-Way Trips Trips/ Wrker Wrkr/ Unit Wrkr Hrs/ Day Occ/ Trip Visits/ Day Land Use Office and Financial Medical Office 1,000 sf Bank/Savings Walk-in 1,000 sf Bank/Savings Drive-in 1,000 sf Office 50,000 sf or less 1,000 sf Office greater than 50,000 sf 1,000 sf Research & Dev't Center 1,000 sf Industrial Manufacturing 1,000 sf Warehouse 1,000 sf Mini-Warehouse 1,000 sf General Industrial 1,000 sf Concrete Plant Acre N/A Sand Mining Acre N/A Retail Retail 50,000 sf or less 1,000 sf N/A Retail 50,001 to 100,000 sf 1,000 sf N/A Retail 100,001 to 200,000 sf 1,000 sf N/A Retail over 200,000 sf 1,000 sf N/A Gas/Service Station Fuel pos N/A New and Used Car Sales 1,000 sf Restaurant 1,000 sf N/A Fast Food Rest w/ Drive-Thru 1,000 sf N/A Supermarket 1,000 sf Auto Repair 1,000 sf Self Service Car Wash Bays N/A Convenience Store 1,000 sf N/A Furniture Store 1,000 sf Recreational Golf Course Hole Racquet/Health/Dance Studio 1,000 sf N/A County Park Acre N/A Tennis Court court Marina Berths Governmental Post Office 1,000 sf Library 1,000 sf Government Office 1,000 sf Jail Bed Miscellaneous Day Care Center 1,000 sf Hospital 1,000 sf Veterinary Clinic 1,000 sf N/A Church 1,000 sf N/A Movie Theater with Matinee 1,000 sf Elementary School 1,000 sf High School 1,000 sf Junior/Community College 1,000 sf Fire Station 1,000 sf N/A N/A Source: Trips per unit from Table 25; trips per worker is trip ends on a weekday from Institute of Transportation Engineers (ITE), Trip Generation, 7th Ed., 2003; workers per unit is ratio of trips/unit to trips/worker, or is derived from ITE manual or other sources; 1-way factor and worker hours/day assumed; occupants per trip from Federal Highway Administration, Nationwide Household Travel Survey, 2001; visitors/day is 1-way trips times occupants/trip minus workers/unit; hours/week and days/week assumed; functional population per unit = (workers/unit x worker hours/day + visitors x hours/visit x days/week)/(24 hours/day x 7 days/week). Hrs/ Visit Days a Wk Func. Pop./ Unit Impact Fee Update, Technical Memo #3 (Revised) Duncan Associates Indian River County, Florida 127 July 19, 2007
136 In order to determine the existing levels of service for the various facilities, it is necessary to estimate the existing total functional population in each of the service areas. As noted earlier, there are three different areas served by the facilities addressed in this report. The existing functional population for each service area is estimated by multiplying the functional population per unit multipliers that will be used in the impact fee schedules by the estimated existing number of dwelling units or nonresidential square feet (in thousands). The resulting total functional population estimates are shown in Table 131. Table 131. Total Functional Population by Service Area, 2007 Land Use Impact Unit 2007 Units Func. Pop./ Unit 2007 Func. Pop. Single-Family* Dwelling 51, ,736 Multi-Family Dwelling 18, ,690 Mobile Home Dwelling 7, ,921 Commercial 1,000 sf 23, ,781 Institutional/Misc. 1,000 sf 6, ,536 Government 1,000 sf 5, ,368 Total, County-Wide 165,032 Single-Family* Dwelling 49, ,982 Multi-Family Dwelling 16, ,577 Mobile Home Dwelling 7, ,921 Commercial 1,000 sf 23, ,509 Institutional/Misc. 1,000 sf 6, ,434 Government 1,000 sf 5, ,329 Total, County-Wide less IR Shores 160,752 Single-Family* Dwelling 34, ,070 Multi-Family Dwelling 11, ,939 Mobile Home Dwelling 5, ,264 Commercial 1,000 sf 14, ,373 Institutional/Misc. 1,000 sf 3, ,058 Government 1,000 sf 2, ,355 Total, Unincorporated 105,059 * includes single-family detached and single-family attached Source: 2007 residential units based on 2000 Census and April 1, 2000 through December 31, 2006 building permits from IRC Community Development Department, "Building Permit Information for New Construction: Permits Issued," February 8, 2007 draft; 2007 nonresidential units from IRC Property Appraiser, January 2007; residential functional population per unit from Table 129; nonresidential functional population per unit from Table 130 (commercial is average of all retail, office/financial and industrial categories, institutional/misc. is average of all miscellaneous categories and government is average of all government categories). This straight-forward approach to estimating total functional population ensures that there is a strong relationship between the functional population multipliers used in the impact fee schedules and the cost per functional population derived by from the existing level of service (essentially by dividing the cost of existing facilities by the existing development served by those facilities, expressed in terms of total functional population). The previous study relied on a much more complex analysis that might come closer to approximating true functional population, but did not provide a strong relationship between the fee schedule multipliers and the fee per functional population. Since functional population is simply an intervening variable that relates existing facilities to existing development served by the facilities, it is more important that the method of Impact Fee Update, Technical Memo #3 (Revised) Duncan Associates Indian River County, Florida 128 July 19, 2007
137 determining total functional population does not distort the relationship than that the functional population estimates accurately reflect the presence of people. For example, there may be higher vacancy rates today than there were in 2000, so that residential functional population estimates derived by multiplying 2007 units by 2000 persons per unit may overstate 2007 population. However, what is more important is the potential of those existing units to demand service in the future. When occupancy rates return to normal, there will be no opportunity to charge additional impact fees. On the other hand, if the sum of the products of existing units and functional population multipliers used in the fee schedules is higher than the total functional population estimate derived from population and employment estimates and assumptions, then arguably the resulting impact fees would be too high (dividing existing facility value by a larger functional population estimate, other things equal, will result in a lower fee). Functional population projections have been derived in this analysis simply by using the projected population growth rate. These projections are shown for each of the three service areas in Table 132. Table 132. Functional Population, Year County- Wide Co.-Wide less IRS Unincorp , , , , , , , , , , , , , , , , , , , , , , , , , , , , , , , , , , , , , , , , , , , , , , , , , , , , , , , , ,246 Source: 2007 estimates from Table 131; 2025 county-wide and unincorporated area projections based on county-wide population growth rate from 2020 Comprehensive Plan (other years interpolated). Impact Fee Update, Technical Memo #3 (Revised) Duncan Associates Indian River County, Florida 129 July 19, 2007
138 APPENDIX C: MAJOR ROADWAY INVENTORY Table 133. Existing Major Roadway Inventory Principal Arterial Roads Roadway Segment Length Lns Type ADT Cap. LM w/ct VMT VMC U.S. 1 S. County Line to Oslo Rd D 31,034 35, ,378 82,110 U.S. 1 Oslo Rd to 4th IR Blvd D 35,966 35, ,107 55,692 U.S. 1 4th IR Blvd to 8th St D 22,120 35, ,060 17,850 U.S. 1 8th St to 12th St D 23,722 35, ,861 17,850 U.S. 1 12th St to S. VB City L D 26,599 35, ,300 17,850 U.S. 1 S. VB City L to 17th St D 26,518 35, ,259 17,850 U.S. 1 17th St to S.R D 25,947 35, ,974 17,850 U.S. 1 S.R. 60 to Royal Palm Pl D 20,988 35, ,494 17,850 U.S. 1 Royal Palm Pl to Atlantic Blvd D 21,663 35, ,832 17,850 U.S. 1 Atlantic Blvd to Aviation D 27,469 35, ,537 14,994 U.S. 1 Aviation to 37th St D 33,835 35, ,316 22,491 U.S. 1 37th St. to Old Dixie Hwy D 28,834 35, ,417 17,850 U.S. 1 Old Dixie Hwy to 41st St D 27,566 35, ,783 17,850 U.S. 1 41st St to 45th St D 24,846 35, ,423 17,850 U.S. 1 45th St to 49th St D 22,367 35, ,184 17,850 U.S. 1 49th St to 65th St D 27,742 35, , ,100 U.S. 1 65th St to 69th St D 27,113 35, ,557 17,850 U.S. 1 69th St to Old Dixie Hwy D 26,588 35, ,176 71,400 U.S. 1 Old Dixie Hwy to Schumann Dr D 24,498 35, , ,950 U.S. 1 Schumann Dr to C.R D 25,643 35, ,465 53,550 U.S. 1 C.R. 512 to N. Seb City L D 28,503 35, ,006 71,400 U.S. 1 N. Seb City L to Roseland Rd D 30,551 35, ,276 17,850 U.S. 1 Roseland Rd to N. County Line D 24,044 35, ,044 35,700 S.R. 60 W. County Line to C.R U 6,033 16, , ,600 S.R. 60 C.R. 512 to 98th Ave U 6,602 16, , ,928 S.R th Ave to I U 7,924 16, ,430 19,516 S.R. 60 I-95 to 82nd Ave D 32,486 35, ,972 71,400 S.R nd Ave to 66th Ave D 33,860 35, ,720 71,400 S.R th Ave to 58th Ave D 39,840 53, ,840 53,500 S.R th Ave to 43rd Ave D 32,079 53, ,079 53,500 S.R rd Ave to 27th Ave D 31,939 53, ,939 53,500 S.R th Ave to W. of 20th Ave D 27,654 53, ,827 26,750 S.R. 60 (EB) W. of 20th Ave to Old Dixie O 25,724 32, ,862 16,050 S.R. 60 (EB) Old Dixie Hwy to 10th Ave O 24,029 32, ,209 9,630 S.R. 60 (EB) 10th Ave to U.S O 19,559 32, ,868 9,630 S.R. 60 (EB) U.S. 1 to W. of 6th Ave O 13,019 32, ,510 16,050 S.R. 60 (WB) W. of 20th Ave to Old Dixie O N/A 40, ,492 S.R. 60 (WB) Old Dixie Hwy to 10th Ave O N/A 40, ,238 S.R. 60 (WB) 10th Ave to U.S O N/A 40, ,170 S.R. 60 (WB) U.S. 1 to W. of 6th Ave O N/A 40, ,763 Subtotal, Principal Arterials ,086,181 1,660,554 Source: Roadway segments, lengths, number of lanes, roadway type and ADT from Table of the Transportation Element of the 2020 Indian River County Comprehensive Plan; road types are divided (D), undivided (U) or one-way (O); capacities from Florida Department of Transportation, Highway Capacity Manual; lane-miles are the product of segment length and number of lanes; VMT is the product of length and ADT; VMC is the product of length and capacity. Impact Fee Update, Technical Memo #3 (Revised) Duncan Associates Indian River County, Florida 130 July 19, 2007
139 Table 134. Existing Major Roadway Inventory Minor Arterial Roads Roadway Segment Length Lns Type ADT Cap. LM w/ct VMT VMC S.R. A1A S. County Line to S. VB City L U 7,999 16, ,595 77,080 S.R. A1A S. VB City L to 17th St D 20,029 17, ,038 22,386 S.R. A1A 17th St to S.R D 13,960 17, ,940 25,830 S.R. A1A S.R. 60 to N. VB City L D 19,887 17, ,831 25,830 S.R. A1A N. VB City L to Fred Tuerk Rd D 19,887 17, ,887 17,220 S.R. A1A Fred Tuerk to Old Winter Bch U 11,142 16, ,426 49,200 S.R. A1A Old Winter Bch to N. IRS L U 10,117 16, ,117 16,400 S.R. A1A N. IRS L to C.R U 10,117 16, ,176 24,600 S.R. A1A C.R. 510 to N. County Line U 7,727 16, , ,720 S.R. 60 W of 6th Av to Indian Rvr Bvd D N/A 35, ,138 S.R. 60 Indian River Blvd to ICWW D 18,097 35, ,907 39,270 S.R. 60 ICWW to S.R. A1A D 17,057 35, ,529 17,850 8th St 27th Ave to 20th Ave U N/A 11, ,840 8th St 20th Ave to Old Dixie Hwy U N/A 11, ,680 8th St Old Dixie Hwy to U.S U N/A 11, ,504 8th St U.S. 1 to Indian River Blvd U N/A 11, ,680 16th St 58th Ave to 43rd Ave U N/A 11, ,680 16th St 43rd Ave to 27th Ave U N/A 11, ,680 16th St 27th Ave to 20th Ave U N/A 11, ,840 16th St 20th Ave to Old Dixie Hwy U N/A 11, ,840 16th/17th St Old Dixie Hwy to U.S D N/A 31, ,550 17th St U.S. 1 to Indian River Blvd D 11,401 31, ,701 15,550 17th St Indian River Blvd to S.R. A1A D 22,141 31, ,282 62,200 12th St 82nd Avenue to 58th Ave U N/A 11, ,040 12th St 58th Ave to 43rd Ave U N/A 11, ,680 12th St 43rd Ave to 27th Ave U N/A 11, ,680 12th St 27th Ave to 20th Ave U N/A 11, ,840 12th St 20th Ave to Old Dixie Hwy U N/A 11, ,680 12th St Old Dixie Hwy to U.S U N/A 29, ,723 12th St U.S. 1 to IR Blvd U N/A 29, ,256 26th St 66th Ave to 43rd Ave U N/A 14, ,200 20th Ave 12th St to S. VB City L D N/A 31, ,550 20th Ave S. VB City L to 16th St D N/A 31, ,550 20th Ave 16th St to S.R D N/A 31, ,550 20th Ave S.R. 60 to Atlantic Blvd U N/A 11, ,840 27th Ave Oslo Rd to 4th St U 13,183 14, ,366 29,200 27th Ave 4th St to 8th St U 13,086 14, ,543 7,300 27th Ave 8th St to 12th St U 12,736 14, ,368 7,300 27th Ave 12th St to S. VB City L U 13,183 14, ,955 4,380 27th Ave S. VB City L to 16th St U 13,183 14, ,273 5,840 27th Ave 16th St to S.R U 10,910 14, ,455 7,300 27th Ave S.R. 60 to Atlantic Blvd U 6,381 11, ,914 3,504 27th Ave Atlantic Blvd to Aviation Blvd U 12,326 11, ,698 3,504 43rd Ave 12th St to 16th St U 13,363 11, ,682 5,840 43rd Ave 16th St to S.R U 14,531 11, ,266 5,840 43rd Ave S.R. 60 to 26th St U 10,557 11, ,279 5,840 58th Ave 16th St to S.R D 24,807 31, ,404 15,550 58th Ave S.R. 60 to 26th St D 23,805 31, ,141 15,861 58th Ave 26th St to 41st St U 15,498 11, ,247 17,520 Impact Fee Update, Technical Memo #3 (Revised) Duncan Associates Indian River County, Florida 131 July 19, 2007
140 Existing Major Roadway Inventory Minor Arterial Roads (Continued) Roadway Segment Length Lns Type ADT Cap. LM w/ct VMT VMC Indian River Bd. 4th Us 1 to 12th St D 23,124 31, ,124 31,100 Indian River Bd. 12th St. to S. VB City L D 26,556 31, ,029 10,574 Indian River Bd. S. VB City L to 17th St D 26,556 31, ,498 9,952 Indian River Bd. 17th St to 20th St D 27,876 31, ,872 12,129 Indian River Bd. 20th St to 21st St D 26,868 31, ,105 5,909 Indian River Bd. 21st St to Royal Palm D 34,983 31, ,944 11,507 Indian River Bd. Royal Palm to MB Bridge D 34,161 31, ,714 14,306 Indian River Bd. MB Bridge to 37th St D 26,475 31, ,797 22,081 Indian River Bd. 37th St. to U.S. 53rd St D 16,153 31, ,998 80,860 Schumann Dr CR 510 at 66th Ave to Barber U 10,133 11, ,309 9,578 Old Dixie Hwy Oslo Rd to 4th St U 7,399 11, ,538 24,528 Old Dixie Hwy 4th St to 8th St U 10,471 11, ,236 5,840 Old Dixie Hwy 8th St to 12th St U 11,977 11, ,989 5,840 Old Dixie Hwy 12th St to S. VB City L U 7,269 11, ,181 3,504 Old Dixie Hwy S. VB City L to 16th St U 7,269 11, ,635 5,840 Old Dixie Hwy 16th St to S.R U 5,098 11, ,549 5,840 Old Dixie Hwy U.S. 1 to 41st Ave U 3,500 11, ,225 4,088 Oslo Rd 27th Ave to 20th Ave U N/A 11, ,840 Oslo Rd 20th Ave to Old Dixie Hwy U 12,515 11, ,030 23,360 Oslo Rd Old Dixie Hwy to U.S D N/A 31, ,330 6th Ave 12th St to 17th St U N/A 11, ,475 6th Ave 17th St to S. VB City L U N/A 11, ,518 6th Ave S. VB City L to S.R U N/A 11, ,840 Subtotal, Minor Arterials ,200 1,250,775 Source: Roadway segments, lengths, number of lanes, roadway type and ADT from Table of the Transportation Element of the 2020 Indian River County Comprehensive Plan; road types are divided (D), undivided (U) or one-way (O); capacities from Florida Department of Transportation, Highway Capacity Manual; lane-miles are the product of segment length and number of lanes; VMT is the product of length and ADT; VMC is the product of length and capacity. Impact Fee Update, Technical Memo #3 (Revised) Duncan Associates Indian River County, Florida 132 July 19, 2007
141 Table 135. Existing Major Roadway Inventory Collector Roads Roadway Segment Length of Laoad Ty ADT Cap. LM w/ct VMT VMC Schumann Dr Barber St to Englar Dr U 3,418 11, ,478 15,301 Schumann Dr Englar Dr to U.S U 2,087 11, ,463 13,782 Roseland Rd C.R. 512 to N. Seb City L U 6,979 11, ,937 35,040 Roseland Rd N. Seb City L to U.S U 7,362 11, ,724 23,360 C.R. 512 Fellsmere City Limits to I U 9,562 11, ,423 42,048 C.R. 512 I-95 to C.R U 15,388 11, ,164 35,040 C.R. 512 C.R. 510 to Roseland Rd U 15,207 11, ,009 14,600 C.R. 512 Roseland Rd to Barber St D 10,942 31, ,267 12,129 C.R. 512 Barber St to Fleming St D 13,777 31, ,919 22,392 C.R. 512 Fleming St to Easy St D 13,754 31, ,252 18,660 C.R. 512 Easy St to Delaware St D 20,669 31, ,340 6,531 C.R. 512 Delaware St to U.S D 14,077 31, ,106 26,746 C.R. 510 C.R. 512 to 87th St U 11,892 14, ,573 25,258 C.R th St to 66th Ave U 11,287 14, ,330 36,646 C.R th Ave to 58th Ave U 11,368 14, ,368 14,600 C.R th Ave to U.S U 13,597 14, ,799 7,300 C.R. 510 U.S. 1 to S.R. A1A U 14,246 14, ,615 36,500 S.R. 60 S.R. A1A to Ocean Dr D 10,963 31, ,631 7,464 Old Dixie Hwy S. County Line to Oslo Rd U 7,790 11, ,138 25,696 Old Dixie Hwy 41st St to 45th St U 4,300 11, ,236 6,074 Old Dixie Hwy 45th St to 49th St U 2,445 11, ,223 5,840 Old Dixie Hwy 49th St to 65th St U 2,756 11, ,512 23,360 Old Dixie Hwy 65th St to 69th St U 2,133 11, ,067 5,840 Old Dixie Hwy 69th St to C.R U 1,318 11, ,295 29,200 27th Ave S. County Line to Oslo Rd U 13,932 11, ,864 23,360 Oslo Rd I-95 to 82nd Ave U N/A 11, ,686 Oslo Rd 82nd Ave to 58th Ave U N/A 11, ,360 Oslo Rd 58th Ave to 43rd Ave U 10,475 11, ,475 11,680 Oslo Rd 43rd Ave to 27th Ave U 14,585 11, ,585 11,680 10th Ave 17th St to S.R U N/A 11, ,022 10th Ave S.R. 60 to Royal Palm Blvd U N/A 11, ,453 43rd Ave S. County Line to Oslo Rd U 6,874 11, ,748 23,360 43rd Ave Oslo Rd to 4th St U 10,213 11, ,426 23,360 43rd Ave 4th St to 8th St U 12,412 11, ,206 5,840 43rd Ave 8th St to 12th St U 12,940 11, ,470 5,840 43rd Ave 26th St to 41st St U 10,288 11, ,576 23,360 43rd Ave 41st St to 45th St U 6,125 11, ,063 5,840 43rd Ave 45th St to 49th St U 3,258 11, ,629 5,840 58th Ave Oslo Rd to 4th St U 8,299 11, ,598 23,360 58th Ave 4th St to 8th St U 15,076 11, ,538 5,840 58th Ave 8th St to 12th St U 20,711 11, ,356 5,840 58th Ave 12th St to 16th St U 21,768 11, ,884 5,840 58th Ave 41st St to 45th St U 11,585 11, ,793 5,840 58th Ave 45th St to 49th St U 10,390 11, ,195 5,840 58th Ave 49th St to 65th St U 9,097 11, ,194 23,360 58th Ave 65th St to 69th St U 8,040 11, ,020 5,840 58th Ave 69th St to C.R U 6,881 11, ,203 29,200 66th Ave Oslo Road to 4th St U N/A 11, ,637 66th Ave S.R. 60 to 26th St U 9,663 11, ,832 5,840 66th Ave 26th St to 41st St U 9,717 11, ,576 17,520 66th Ave 41st St to 45th St U 9,389 11, ,695 5,840 66th Ave 45th St to 65th St U 8,682 11, ,705 29,200 66th Ave 65th St to 69th St U 7,145 11, ,715 6,074 66th Ave 69th St to C.R U 8,503 11, ,006 23,360 82nd Ave Oslo Rd to 4th St U N/A 11, ,360 82nd Ave 4th St to 12th St U 3,989 11, ,989 11,680 82nd Ave 12th St to S.R U 3,894 11, ,947 5,840 82nd Ave S.R. 60 to 65th St U , ,416 60,152 82nd Ave 65th St to 69th St U , ,205 Impact Fee Update, Technical Memo #3 (Revised) Duncan Associates Indian River County, Florida 133 July 19, 2007
142 Existing Major Roadway Inventory Collector Roads (Continued) Roadway Segment Length Lns Type ADT Cap. LM w/ct VMT VMC 98th Ave 26th St to S.R U , ,256 98th Ave S.R. 60 to 16th St U , ,840 98th Ave 16th St to 12th St U , ,840 98th Ave 12th St to 8th St U , ,840 69th St 82nd Ave to 66th Ave U , ,360 69th St 66th Ave to 58th Ave U , ,680 69th St 58th Ave to Old Dixie Hwy U 1,042 11, ,126 35,040 69th St Old Dixie Hwy to U.S U , ,840 45th St 66th Ave to 58th Ave U 2,419 11, ,419 11,680 45th St 58th Ave to 43rd Ave U 3,898 11, ,898 11,680 45th St 43rd Ave to Old Dixie Hwy U 8,559 11, ,957 40,880 45th St Old Dixie Hwy to U.S U 4,783 11, ,051 45th St U.S. 1 to Indian River Blvd U 4,266 11, ,024 2,803 41st St 66th Ave to 58th Ave U 2,015 11, ,015 11,680 41st St 58th Ave to 43rd Ave U 3,658 11, ,658 11,680 41st St 43rd Ave to Old Dixie Hwy U 4,062 11, ,217 40,880 41st St Old Dixie Hwy to U.S U 1,994 11, st St U.S. 1 to Indian River Blvd U 1,329 11, ,424 37th St U.S. 1 to Indian River Blvd U 10,423 11, ,465 12,848 4th St 82nd Ave to 58th Ave U N/A 11, ,680 4th St 58th Ave to 43rd Ave U N/A 11, ,680 4th St 43rd Ave to 27th Ave U N/A 11, ,680 4th St 27th Ave to 20th Ave U N/A 11, ,840 4th St 20th Ave to Old Dixie Hwy U N/A 11, ,680 4th St Old Dixie Hwy to U.S U N/A 23, ,665 Fred Tuerk Dr A1A to W of Coconut Dr U N/A 11, ,680 Winter Beach Rd A1A to Jungle Trail U N/A 11, ,840 Atlantic Blvd S.R. 60 to 27th Ave U 2,061 11, ,205 12,498 Atlantic Blvd 27th Ave to 20th Ave U 3,003 11, ,502 5,840 Atlantic Blvd 20th Ave to U.S U 2,832 11, ,416 5,840 Aviation Blvd U.S. 1 to 27th Ave U N/A 14, ,286 Royal Palm Blvd Royal Palm Pl to IR Blvd U N/A 11, ,680 Royal Palm Pl U.S. 1 to Indian River Blvd U N/A 11, ,680 53rd St U.S. 1 to Old Dixie Hwy U N/A 11, th Ave S.R. 60 to 8th St U N/A 11, ,987 C.R. 507 S. Carolina to County Line U N/A 11, ,056 5th Street SW 27th Ave to 43rd Ave U N/A 11, ,914 5th Street SW 20th Ave to 27th Ave U N/A 11, ,840 Highlands Dr. 6th Ave SW to Old Dixie U N/A 11, ,592 Highlands Dr. Old Dixie to U.S U N/A 11, C.R. 512 S.R. 60 to Fellsmere City Lmt U N/A 11, ,011 I.R. Drive North U.S.1 to Main Street U 1,937 11, ,075 30,602 I.R. Drive South U.S.1 to Main Street U 1,605 11, ,311 16,819 Englar Dr Barber St to George St U 1,942 11, ,672 Englar Dr George St to Schumann Dr U 3,361 11, ,790 9,694 Fleming St Easy St to C.R U 1,257 11, ,125 Fleming St C.R. 512 to Main St U 2,060 11, ,493 14,133 Main St Fleming St to Wimbrow U 1,248 11, ,826 Main St U.S. 1 to Fleming St U 4,095 11, ,446 15,534 Barber St U.S. 1 to Schumann Dr U N/A 11, ,885 Barber St Schumann Dr to Englar Dr U N/A 11, ,542 Barber St Englar Dr to C.R U N/A 11, ,461 Barber St C.R. 512 to Wimbrow U N/A 11, ,600 Ocean Dr Greytwig to Beachland U N/A 11, ,139 Ocean Dr Beachland to Riomar U N/A 11, ,358 21st St Indian River Blvd to U.S U N/A 11, ,074 21st St U.S. 1 to 20th Ave U N/A 11, ,307 23rd St 20th Ave to U.S U N/A 11, ,490 23rd St U.S. 1 to Royal Palm Blvd U N/A 11, ,438 Impact Fee Update, Technical Memo #3 (Revised) Duncan Associates Indian River County, Florida 134 July 19, 2007
143 Existing Major Roadway Inventory Collector Roads (Continued) Roadway Segment Length Lns Type ADT Cap. LM w/ct VMT VMC 14th Ave Old Dixie Hwy to 16th St U N/A 11, ,621 14th Ave 16th St to S.R U N/A 11, ,957 14th Ave S.R. 60 to U.S U N/A 11, ,606 Victory Atlantic to Cordova U N/A 11, ,504 Victory Cordova to 20th Ave U N/A 11, ,037 Subtotal, Collectors ,648 1,809,904 Source: Roadway segments, lengths, number of lanes, roadway type and ADT from Table of the Transportation Element of the 2020 Indian River County Comprehensive Plan; road types are divided (D), undivided (U) or one-way (O); capacities from Florida Department of Transportation, Highway Capacity Manual; lane-miles are the product of segment length and number of lanes; VMT is the product of length and ADT; VMC is the product of length and capacity. Impact Fee Update, Technical Memo #3 (Revised) Duncan Associates Indian River County, Florida 135 July 19, 2007
144 APPENDIX D: PARK INVENTORY Table 136. Existing Park Inventory Facility Name Dev'd Acres Total Acres Owner Class Restrooms Picnic Pavilion Playgrnd Ambersand Beach Park County R Boat Island FIND R 1 Blue Cypress Lake Park County R 1 1 Dale Wimbrow Park County R Donald MacDonald Park County R IRC Fairgrounds County R th Street Complex County R 1 Gifford Park County R Golden Sands Park County R Basketball Court Community Center Grovenor Estates Park County N Helen Hanson Park County N 1 1 Hosie-Schumann Park County N 1 1 IRC Shooting Range State R 1 Joe S. Earman Park County R 2 Kiwanis-Hobart Park County R MLK Park County N 1 Moore's Point County N 2 North County Regional Park State R Oslo Road Boat Ramp County R Pine Hill (Lone Pine) County N 1 1 Roseland Community Center County N Round Island Beach Park County R Round Island Park West County R Seagrape Beach Access County R Sebastian Canoe Launch Park County C 1 South County Regional Park County R Tracking Station Beach Park County R 1 Turtle Trail Beach Access County R Treasure Shores Park County R Wabasso Beach Park County R 1 2 West Wabasso Park County N Wabasso School Park County N 1 1 Wabasso Causeway Park County R th Street Dock County R Jogging Trail Neighborhood Parks Community Parks Regional Parks , Total , Source: IRC Recreation Department, January 18, 2007 (FIND stands for Florida Inland Navigation District). Impact Fee Update, Technical Memo #3 (Revised) Duncan Associates Indian River County, Florida 136 July 19, 2007
145 Existing Park Inventory (continued) Olympic Aquatic Center Volleyball Court Facility Name Swim Pool Softball Field Tennis Courts Soccer Field Ambersand Beach Park Boat Island Blue Cypress Lake Park Dale Wimbrow Park Donald MacDonald Park IRC Fairgrounds th Street Complex 2 Gifford Park Golden Sands Park Grovenor Estates Park Helen Hanson Park 1 Hosie-Schumann Park IRC Shooting Range Joe S. Earman Park Kiwanis-Hobart Park 2 2 MLK Park Moore's Point North County Regional Park 1 4 Oslo Road Boat Ramp Pine Hill (Lone Pine) Roseland Community Center Round Island Beach Park Round Island Park West Seagrape Beach Access Sebastian Canoe Launch Park South County Regional Park Tracking Station Beach Park Turtle Trail Beach Access Treasure Shores Park Wabasso Beach Park West Wabasso Park 1 1 Wabasso School Park Wabasso Causeway Park 45th Street Dock Archery Range Neighborhood Parks Community Parks Regional Parks Total Impact Fee Update, Technical Memo #3 (Revised) Duncan Associates Indian River County, Florida 137 July 19, 2007
146 Existing Park Inventory (continued) Dune Walkover Lifeguard Tower Facility Name Boat Ramp Golf Course Canoe Launch Fairground Ambersand Beach Park 1 Boat Island Blue Cypress Lake Park 2 Dale Wimbrow Park 1 Donald MacDonald Park 1 IRC Fairgrounds 1 16th Street Complex Gifford Park Golden Sands Park 1 1 Grovenor Estates Park Helen Hanson Park Hosie-Schumann Park IRC Shooting Range Joe S. Earman Park Kiwanis-Hobart Park MLK Park Moore's Point North County Regional Park Oslo Road Boat Ramp 1 Pine Hill (Lone Pine) Roseland Community Center Round Island Beach Park 1 1 Round Island Park West 4 1 Seagrape Beach Access 1 Sebastian Canoe Launch Park 1 South County Regional Park Tracking Station Beach Park 3 1 Turtle Trail Beach Access 1 Treasure Shores Park 1 1 Wabasso Beach Park 2 1 West Wabasso Park Wabasso School Park Wabasso Causeway Park th Street Dock Neighborhood Parks Community Parks Regional Parks Total Impact Fee Update, Technical Memo #3 (Revised) Duncan Associates Indian River County, Florida 138 July 19, 2007
147 Existing Park Inventory (continued) Facility Name Fishing Pier Clay Range Archery Course Rifle Range Pistol Range Multi- Purpose Building Ambersand Beach Park Boat Island 4 Blue Cypress Lake Park 1 Dale Wimbrow Park Donald MacDonald Park 1 2,500 IRC Fairgrounds 60,000 16th Street Complex Gifford Park Golden Sands Park Grovenor Estates Park Helen Hanson Park Hosie-Schumann Park IRC Shooting Range ,500 Joe S. Earman Park 1 Kiwanis-Hobart Park MLK Park Moore's Point North County Regional Park 400 Oslo Road Boat Ramp Pine Hill (Lone Pine) Roseland Community Center 1 Round Island Beach Park Round Island Park West 1 Seagrape Beach Access Sebastian Canoe Launch Park South County Regional Park 900 Tracking Station Beach Park Turtle Trail Beach Access Treasure Shores Park Wabasso Beach Park West Wabasso Park Wabasso School Park Wabasso Causeway Park 2 45th Street Dock 1 Neighborhood Parks Community Parks Regional Parks ,300 Total ,300 Impact Fee Update, Technical Memo #3 (Revised) Duncan Associates Indian River County, Florida 139 July 19, 2007
148 APPENDIX E: AVERAGE LAND COSTS Table 137. Average Land Cost, 40-to-160-Acre Parcels, 2006 Parcel Identification No. City Sale Date Sale Price Acres Cost/Acre Vero Beach 2/ Vero Beach 2/ Vero Beach 2/2006 $6,471, $79, Vero Beach 2/ Vero Beach 2/ Vero Beach 3/2006 $6,500, $50, Vero Beach 3/2006 $6,500, $50, Vero Beach 3/2006 $6,500, $50,913 Total $25,971, $55,906 Source: IRC Property Appraiser, February 26, 2007 Table 138. Average Land Cost, 4-to-6-Acre Parcels, 2006 Parcel Identification No. City Sale Date Sale Price Acres Cost/Acre Sebastian 5/2006 $800, $195, Vero Beach 11/2006 $412, $86, Vero Beach 6/2006 $180, $39, Vero Beach 1/ Vero Beach 1/ Vero Beach 1/2006 $1,891, $433, Vero Beach 1/2006 Total $3,283, $184,231 Source: IRC Property Appraiser, February 26, 2007 Impact Fee Update, Technical Memo #3 (Revised) Duncan Associates Indian River County, Florida 140 July 19, 2007
149 Impact Fee Task Force Report and Recommendations Report from the Impact Fee Task Force to Indian River County Board of Commissioners January 22, 2008
150 Index Page Background 2 Facilitator Remarks 3 Executive Summary & Recommendations 4 Task Force Members 5 Process 6 Sub-Committee Reports Traffic/Transportation 7 Schools 8-9 Parks 10 Libraries 11 Law Enforcement 12 Quantifying the Impacts General Comments Terry Torres Peter Robinson Dan McIntyre 22 Honey Minuse 23 Minutes August 28, September 11, September 25, October 9, October 23, October 30, November 13, November 27, December 4, December 18, January 8, Articles, Publications and Reports 50 Correspondence INDIAN RIVER COUNTY IMPACT FEE TASK FORCE 1
151 Background On June 29, 2007 the agenda for the Indian River County Board of Commissioners included a county memo to establish an Impact Fee Task Force. That day the Commissioner voted not to adopt a draft resolution to assemble an Impact Fee Committee under the auspices of the County but, instead, asked that the Indian River County and Sebastian River Area Chambers of Commerce would initiate and facilitate an Impact Fee Task Force. On July 30, 2007 a diverse cross-section of people were identified and invited to participate on the Impact Fee Task Force being organized by the chambers. Groups and government officials receiving the letter of invitation to participate were asked to designate a person to serve as their representative. For the sake of continuity, those asked to serve were requested to select an individual who was able to commit to the process and not send alternate representatives to meetings. The Impact Fee Task Force was not a Sunshine Law committee. It was anticipated that the Task Force would carry out its functions within a six month period of time. The first meeting took place on August 28, The Task Force was asked to review and make recommendations to the County Commission in regard to the recent impact fee report and recommendations set forth by Duncan & Associates as commissioned by the County. The Indian River County Community Development and Duncan & Associates were asked to work with the task force as additional resources. INDIAN RIVER COUNTY IMPACT FEE TASK FORCE 2
152 DATE: January 16, 2008 TO: County Commission FROM: Beth Mitchell, Sebastian River Area Chamber of Commerce Penny Chandler, Indian River County Chamber of Commerce In July 2007, the Commission requested that the two Chambers of Commerce put together and facilitate a task force to review the impact fee report and recommendations of Duncan & Associates as had been commissioned by the Commission. We accepted that job at a public Commission meeting, put a diverse group of individuals together and began meetings in late August We thank and commend all the members of this task force for their time, energy and commitment to get the job done in a meaningful manner and present recommendations back to the Commissioners as had been requested. Meetings, typically, were over two hours in length and meetings averaged every two weeks. Hundreds of volunteer man hours went into full task force and sub-committee meetings. The group openly discussed the representation that had been invited to participate and at their first meeting on August 28, 2007 identified Habitat For Humanity as an additional group that should be represented. No others were identified to add to the task force at that, or any other, meeting. Process and procedure were discussed at each meeting and a schedule discussed and distributed at meetings. Although there were a variety of opinions discussed, the group was respectful of one another and all opinions were heard. Minutes were taken at each meeting, and distributed to each Task Force member for their input and corrections. While the minutes were not verbatim, they do provide a record of all of the discussions, comments, concerns, ideas and opinions from the Task Force members. At no time during the process was anyone contacted by the public or the media to attend any meetings and no one would ever have been denied access to any meetings. On November 1, 2007 we sent a letter to the Commission that we would complete a draft by the end of November and provide that draft to staff for their review and comment. That was sent to staff prior to the December Holiday. We also noted in that letter we anticipated that our final document with recommendations would be completed in December and a report made to the Commission in early January We are pleased to say the group was able to remain on schedule and provide that report to you. Task force members were pleased to have the opportunity to study the report and proud to serve you on this task force. Many on the task force are inclined to maintain a meeting structure, perhaps quarterly or semi-annually, to remain updated on impact fee issues. On behalf of the entire task force, thank you for the opportunity to serve the County. INDIAN RIVER COUNTY IMPACT FEE TASK FORCE 3
153 Executive Summary & Recommendations During a series of meetings from August 28, 2007 through January 8, 2008 the Impact Fee Task Force reviewed the recent impact fee report and recommendations set forth by Duncan & Associates. Sub-committees reviewed sections of the Duncan report using whatever means appropriate and available to them to gather additional data where needed, analyze findings and develop a consensus for individual subcommittee recommendations. Those section recommendations were voted upon by the entire task force at their final meeting January 8, The sections reviewed were: Traffic, Schools, Parks, Libraries and Law Enforcement. The following sections of the report were not addressed as the recommendations were determined to be of less significance at this time: Corrections, Public Buildings, Solid Waste and Fire Rescue. An additional section was created by the task force entitled Quantifying the Impact. Final Recommendation: At the final meeting of the Impact Fee Task Force, the task force voted that the Commission should maintain the current rate for impact fees. The motion passed nine to two, with two abstentions. For each section covered, the task force voted as follows: Section Motion Yes No Abstain Transportation Maintain the current rate for impact fees Schools Maintain the current rate for impact fees Parks Maintain the current rate for impact fees Libraries Maintain the current rate for impact fees Law Enforcement To accept the consultants report and increase fees Quantifying the Impact accordingly To look at not only the recommended increase of fees, but also the current impact fees and how they impact creation of jobs and the profitability of new commercial facilities. Notes: 1. The City of Vero Beach representative abstained on each vote. 2. Only twelve members remained for the final two section votes INDIAN RIVER COUNTY IMPACT FEE TASK FORCE 4
154 Task Force Members The group organized by the chambers for this task force included: Maria Aguilar, Town Manager, representing the Town of Orchid (in November replaced by Deb Branwell, interim Town Manager) Chris Bieber, representing Commercial Banking, Indian River National Bank Andy Bowler, representing affordable housing, Habitat For Humanity Robert Bradshaw, Town Manager, representing the Town of Indian River Shores Brian Curley, representing a Commercial Developer, P & S Properties Cheri Fitzgerald, City of Vero Beach Planning Office, representing the City of Vero Beach Robert Keating, Indian River County Community Development, representing Indian River County government Chip Landers, residential broker representing the Realtors Association of Indian River County, The Professionals Realty Dr. Dan McIntyre, representing the Indian River County School Board Chuck Mechling, representing the India River County Chamber, Pointe West Al Minner, City Manager, City of Sebastian Honey Minuse, representing the Indian River Neighborhood Association Jason Nunemaker, City Manager, City of Fellsmere Nancy Offutt, representing the Treasure Coast Builders Association Joseph Paladin, representing the Growth Awareness Committee Peter Robinson, representing the Indian River County Economic Development Council, Laurel Homes Terry Torres, commercial broker representing the Realtors Association of Indian River County, Bird Realty Group Don Wright, representing the Sebastian River Area Chamber of Commerce Frank Watanabe, a Certified Traffic Engineer employed by Neel-Schaffer Impact Fee Task Force Facilitators: Beth Mitchell, Sebastian River Area Chamber of Commerce Penny Chandler, Indian River County Chamber of Commerce INDIAN RIVER COUNTY IMPACT FEE TASK FORCE 5
155 Process Initially, meetings of the task force took place every other week beginning on August 28, Eleven meetings took place from that date through January 8, During that time, the task force had presentations by: Clancy Mullen, Duncan Associates: impact fee consulting firm engaged by Indian River County. Bob Keating, Indian River County Community Development Jason Brown, Indian River County Budget Office Joe Baird, County Administrator, Indian River County Wayne Kleinsteiver, CCIM, Kleinsteiver & Associates Kirk Sorenson, Financial Economist, Government Solutions The task force was broken into sub-committees that reviewed sections of the July 2007 Duncan Associates Impact Fee Study and Recommendations, commissioned by the County. The sub-committees used whatever means appropriate and available to them to gather additional data where needed, analyze findings and develop a consensus for individual sub-committee recommendations. The task force reviewed and addressed the sections of the report they believed to be most significant. Those sections addressed by a sub-committee were presented back to the full task force for comment. Sub-committees addressed the following sections of the report: Traffic Schools Parks Libraries Law Enforcement The following sections of the report were not addressed. Corrections Public Buildings Solid Waste Fire Rescue An additional section was created entitled Quantifying the Impact. INDIAN RIVER COUNTY IMPACT FEE TASK FORCE 6
156 Sub-Committee Reports Memorandum To: Indian River County Impact Fee Task Force From: Traffic/Transportation Sub Committee Date: 1/16/ :12:49 AM The Subcommittee for the Transportation/Traffic section of the report met a number of times and included Chuck Mechling, Joe Paladin, Frank Watanbe, Honey Minuse and Nancy Offut. Comments/Discussion The group discussed and recommended that a study on Synchro (a traffic model) and other methods of transportation methodology should be explored prior to adjustment of impact fees. As part of the discussion on level of service, the group comments included the idea that as the outlay of capital expenses needed to be wisely used in the current economic time, and they believe a planned balance of needs will best serve the community. The group believes that with an exploration of Synchro there would be redefinition of the level of service required in the transportation element. Recommendation: There was a consensus that the Commission should keep the current rate for impact fees, and that Synchro and other methods of transportation should be explored prior to adjustment of any fees. INDIAN RIVER COUNTY IMPACT FEE TASK FORCE 7
157 M E M O R A N D U M TO FROM Indian River County Impact Fee Review Task Force School Subcommittee: Chip Landers, Nancy Offutt DATE November 13, 2007 (revised November 16, 2007) We met with Dan McIntyre and Susan Olson several times to review the impact fee figures contained in the Duncan and Associates Report (July 2007). We appreciate Dr. McIntyre s and Ms. Olson s cooperation and willingness to provide information and insight into how the proposed school impact fees were determined. Questions / Observations 1. School generation rate is based on actual enrollment at a specific date and may not represent net enrollment. 2. Land costs have fallen since the School Board land purchase of $95,000/acre, upon which fees are based. In replying to our previous concern regarding this, the Consultant s October 19 letter indicates that reducing the $95,000 would only reduce fees by 7 percent, or $320. Our reaction is that every percentage point is significant and seven percent is substantial to those paying the fee. This causes concern about the methodology. 3. Since actual school construction projects have been limited, there may not be sufficient data to determine an accurate district-wide cost of construction. A broader sampling would be desirable, (i.e. A $400/per square foot for the 2,180 sq.ft. multi-purpose building was included to determine the average construction costs; smaller projects typically reflect a higher cost per square foot than larger projects.) 4. Schools should be multi-purpose facilities, maximized for public use and wired for technology. 5. Concretables are included toward permanent capacity. 6. Is square footage the logical criteria for Level of Service? The Comprehensive Plan indicates levels of service at 145 sq. ft. per student station at elementary level; 117 sq. ft. at middle level; 147 sq ft. at upper level. Comparisons The School Board established its first impact fee in 2005 at $1,756 for a 2,000 sq ft single-family dwelling. The proposed fee of $4,459 is an increase of 154 percent. The multi-family fee was $500; proposed to increase 118 percent to $1,091. The Consultant attributes these huge increases to land and construction costs. INDIAN RIVER COUNTY IMPACT FEE TASK FORCE 8
158 School Impact Fees Based On Current Proposed Increase 2000 sq ft $1,756 $ 4, % Multi-family $ 500 $ 1, % Total Residential Fee: Under 1,500 sq ft $ 7,815 $13,778 76% 1,500sq ft to 2,499 $ 9,878 $16,951 72% Above 2,500 $10,754 $18,321 70% Multi-family $ 5,114 $ 7,913 55% Issues with Duncan and Associates Revised Memo #3 July 19, 2007 Page 45, referring to Table 34 Since the District must bring existing schools up to Amendment 9 standards while also accommodating unprecedented growth, the five-year plan contemplates a massive program of new school construction. We are no longer experiencing unprecedented growth and the School District does not anticipate a massive program of new school construction. Page 47: The cost of administrative and support facilities may be added in subsequent drafts of the school impact fee update. What does this mean? It sounds open-ended; are there additional costs? Page 47-48: It is the School District s intent to use impact fee revenues as the primary funding source for future capital expansion needs and to maintain or reduce the average annual dollar amount shown in this report toward capital expansion needs. Not true. The School District recognizes that impact fees are unreliable and does not considered them to be a primary funding source. Levels of Service: The use of square footage as a Level of Service is questionable and has been trumped by the Class Size Amendment. Conclusions/Recommendations 1. This two-year study reflects data that is no longer applicable to the current market and, therefore should not be used to project future growth and needs. 2. School officials agree that impact fees are not a substantial or significant revenue stream. However, proportionately to those who must pay them, school impact fees are substantial and significant and add to the cost of housing. Anything that inflates costs and hinders recovery and stabilization of the real estate market should be discouraged. 3. The proposed impact fee increase will place additional burdens on an already challenged housing market. Therefore, we respectfully recommend that the School Board and the County Commission not implement the increase of the proposed impact fees. INDIAN RIVER COUNTY IMPACT FEE TASK FORCE 9
159 Memorandum To: From: Indian River County Task Force Parks Subcommittee: Don Wright, Dates 11/14/07 General Comments: 1. The level of service is based on the permanent population in the unincorporated areas of 98,856. It might be more reasonable to use the entire population of Indian River County since use is not limited to individuals that live in the unincorporated areas. This would result in a significantly lower number of acres needed per resident. Would this really be a reduction in the level of service? 2. The consultant advises on page 54 that it might be prudent for the County to make the concurrency standard somewhat lower than the existing ratio. Considering that the ratio calculated is 6.29 acres per 1,000 residents, that seems like a very good suggestion. 3. The park cost per person is based on: Park land and facility cost of $123,520,596 divided by 98,856 residents for a fee of $1250 per person less a funding credit of $174=$1076 and To establish an Impact Fee per residence, it is then multiplied by the average number of persons per unit. 4. The impact fee for parks as proposed would place Indian River County as the second highest impact fee in FL. 5. Using the total replacement costs of existing park facility improvements and adding the park land cost to measure the dollar value of level of service concurrency just doesn t seem right. It ignores real facts about whether the facilities are being fully used or have excess capacity. It ignores the fact that some of these areas are natural resources that can t be duplicated. It ignores how this land was originally acquired. 6. New park facilities benefit the entire community such as lights for playing fields and funding should be shared. Recommendation: Impact fees in this area should either remain the same or be reduced. Level of Service: The existing level of service appears to provide excess capacity in many areas. Therefore, a reduction in level of service if the methodology is accepted would not reduce the ability of our residents to enjoy these facilities. INDIAN RIVER COUNTY IMPACT FEE TASK FORCE 10
160 Memorandum To: Indian River County Impact Fee Review Task Force From: Library Impact Fee Sub Committee Date: October 30, 2007 On Friday, October 19, 2007 Peter Robinson and Al Minner met to discuss the proposed increase of the Indian River County Library Impact Fee. While there is a need to provide quality library service in Indian River County, several points should be considered before said increase is imposed. Question/Comments: 1. Current Fund Balance of Library Impact Fees 2. Urgency/Need of proposed projects 3. Implementation of a more realistic Library Capital Improvement Plan. Recommendation: In summation, the consensus was to recommend to the Impact Fee Task Force a recommendation to delay an increase in the Library Impact Fee. INDIAN RIVER COUNTY IMPACT FEE TASK FORCE 11
161 INDIAN RIVER COUNTY IMPACT FEE TASK FORCE LAW ENFORCEMENT ELEMENT I. Recommendation to agree to increase, agree to keep fees at their current rate, or recommend reductions. The recommendation is to accept the consultants report and increase fees accordingly. II. Any appropriate comments on methodology. As presented to the Task Force group and later confirmed by staff, the methodology used by the consulting firm is consistent with practice used throughout Florida. Any challenge in this regard must remain between professionals well versed in their field of expertise. III. A discussion of level of service. These services are provided both county-wide and in the unincorporated county on a round-theclock basis. The updated fees are based on existing levels of service. A significant majority of Capital Expansion has been paid for by ad valorem taxes and the 1 percent sales tax. Submitted by Honey Minuse, IRNA November 22, 2007 INDIAN RIVER COUNTY IMPACT FEE TASK FORCE 12
162 To: Impact Fee Review Committee From: Chris Bieber, Commercial Banking Re: Economic Impact/ Quantifying Impacts on fee increase Date: December 4, 2007 I have taken the data provided by Duncan and Associated quantified the economic effects of the current impact fees, as well as an increase of impact fees. While there are many moving parts in breaking down the proposed fees, I have taken the approach of using basic constants as to try to provide a more apples to apples comparison. When looking at a commercial project, as an initial cost or with a cash approach, the increase has a much greater effect on the project. The effect of the increase is less apparent when the project calls for financing. The additional cost associated with the impact fees can often be diluted over the span of 20 to 25 years. I believe the issue lies more in the initial impact fees. Businesses need to look at the economic benefit of any cost associated with a proposed project. There is a limit as to what the market will bear for square footage pricing and at some point the project becomes no longer economically viable. Increasing an already high impact fee structure will only drive the break even point higher for a new project. Attached is a breakdown of costs associated with commercial development. Break even, debt service, and vacancy rates are included. These numbers do not include insurance, taxes, maintenance fees, reserves, etc. Typically CAM will cover these costs but in today s market there is a severe shortfall in the initial debt service. In the case of residential homes, there is a broader scope that needs to be addressed. Tightening of financing restrictions by banks and mortgage lenders coupled with rising costs (be it through material cost or fee related costs) make it near impossible for full time residents to afford any housing within the county. Attached is a breakdown, using realistic guidelines and figures for typical residents within the county. There are factors in the methodology and/ or policy which need to be addressed in terms of effects on the county as a whole. The increases in impact fees are to sustain a certain level of service. What has not been questioned: what level of service is acceptable to the citizens of the county; is that level of service at capacity; is there a need to address a service in where the level of service is acceptable or too high? At the current pace, Indian River County will be the best place no one can afford to live. Another point to be addressed is some of the information that is contained in the report. While it would take a larger review than this committee, there have been some concerns with price of replacement of services, price of land acquisition, calculation of students/ population, and other factors in determining the need for an increase in fees. INDIAN RIVER COUNTY IMPACT FEE TASK FORCE 13
163 In summation, there needs to be a hard look at not only the increase of fees, but also the current impact fees. The current state of the economy, both nationally and locally, have forced business to look harder at the bottom line. Incentives and cost play a major role in the decision process for companies. We have seen over the last few years that trying to sustain a source of income and jobs for the county is a difficult for individuals and businesses. I feel that the county needs to focus on creation of jobs to strengthen our community, providing a level of service for roads, parks, etc. that is driven not only by replacement, but need, and adopt an economic position that is economically viable for the long term. INDIAN RIVER COUNTY IMPACT FEE TASK FORCE 14
164 December 4, 2007 Key Points on Economic Impact of fees Tightening of financial institutions guidelines make it more difficult to afford residential housing. Current vacant properties and inventory (both residentially and commercially). Increased costs to businesses make break even analysis above the current market rates. Additional factors (cost of materials, insurance, taxes, etc.) are current deterrents. Additional fees adding to current problem. Other surrounding counties incentive plans give alternative to Indian River County. Affordability of current residential market. Headline impact of being #1 in impact fees, raising impact fees, etc. INDIAN RIVER COUNTY IMPACT FEE TASK FORCE 15
165 Current Construction Cost ($225/ft) Impact (current) Commercial Property Water/ Sewer Total Debt Service/ yr B/E per sq. ft. Vacancy 1.2 DSCR Actual Sq. Ft. Land Cost Office Space (<50M) $4,500,000 $800,000 $182,140 $29,372 $5,511,512 $ 399,603 $19.98 $22.20 $23.98 $ Office Space $104,90 (>50M) $16,875,000 $3,000,000 $472,500 0 $20,452,400 $ 1,482,868 $19.77 $21.97 $23.73 $ Manufacturing $9,000,000 $1,600,000 $94,560 $58,744 $10,753,304 $ 779,650 $19.49 $21.66 $23.39 $ Retail (<50M) $4,500,000 $800,000 $257,200 $20,980 $5,578,180 $ 404,436 $20.22 $22.47 $24.27 $ Retail (>50M) $16,875,000 $3,000,000 $812,175 $67,136 $20,754,311 $ 1,504,757 $20.06 $22.29 $24.08 $ Proposed Square Feet Construction Cost ($225/ft) Impact (proposed) Total Debt Service/ yr B/E per sq. ft. Vacancy 1.2 DSCR Actual Land Cost Office Space (<50M) $4,500,000 $800,000 $257,220 $29,372 $5,586,592 $404,321 $20.22 $22.46 $24.26 $ Office Space $104,90 (>50M) $16,875,000 $3,000,000 $699,375 0 $20,679,275 $1,499,317 $19.99 $22.21 $23.99 $ Manufacturing $9,000,000 $1,600,000 $114,280 $58,744 $10,773,024 $781,080 $19.53 $21.70 $23.43 $ Retail (<50M) $4,500,000 $800,000 $370,740 $20,980 $5,691,720 $412,668 $20.63 $22.93 $24.76 $ Retail (>50M) $16,875,000 $3,000,000 $1,098,825 $67,136 $21,040,961 $1,525,540 $20.34 $22.60 $24.41 $ Debt service is figured at a 20 year amortization at a rate of 7.25%. Taxes, insurance, and other operating costs have been left out, as typically covered by CAM. Loan to Value is at 75%. Land cost is figured at $10/ foot at a 25% coverage ratio Debt Service figured at 75% LTV- 20 year amortization- at $7.25% Vacancy rate at 10%. Figures are based without taxes/ ins/ maint, etc. as 'typically' covered by CAM. INDIAN RIVER COUNTY IMPACT FEE TASK FORCE 16
166 General Comments Some members of the task force also contributed their own formal personal opinions and general comments to the process. Those pages follow here. INDIAN RIVER COUNTY IMPACT FEE TASK FORCE 17
167 Are Impact Fees the Answer? Do Impact Fees provide a long-term alternative for financing future capital needs generated by growth? Impact Fees are a way for local governments to require new development to pay a proportionate share of the infrastructure cost they impose on a community. The issue is whether or not the Impact Fee imposed on new development is proportional to the benefit to that development. If the imposed Impact Fees are unjustly high, resulting in new development providing a higher level of service than is provided to existing development, then we have both a violation in the letter of the law and the intent of the Impact Fee Ordinance. In principal, Impact Fees appear to be the utopian answer for funding future infrastructure needs. Impact Fees were adopted by local jurisdictions several decades ago as a method for funding infrastructure needs generated by new development. This method of funding was deemed most appropriate for areas that were experiencing rapid growth. Consequently, one of the key parameters employed in the methodology utilized to calculate Impact Fees is Functional Population. This concept is based on the assumption that demand for facilities is generally proportional to the presence of people. Functional Population is the equivalent number of people occupying a building or land use site on a 24-hours-per-day, 7-days-per-week basis. Arriving at the Functional Population multipliers for nonresidential uses is quite complicated and is based on national trip generation data compiled by the Institute of Transportation Engineers (ITE). This calculation uses four additional parameters, three of which are variables. Using these formulas and trip generation rates from ITE we arrive at a figure for functional population per unit for nonresidential uses that takes in 43 categories under six different non-residential land uses. The formula is also based on vehicle occupancy rates from the National Household Travel Survey as well as other sources and assumptions. Herein lies the problem. Obviously the study is complex and makes numerous assumptions incorporating many variables. We are attempting to quantify with a great deal of accuracy an absolute quantity based on numerous formulas, each containing multiple variables and assumptions. Regardless of the methodology, how accurate are the answers derived from the data and methodology currently used to determine Impact Fees? For example, let s assume that a linear equation contains one constant and three variables represented by R = M x A x B x C, where R is the result, A, B, and C are variables and M is a constant. Assuming that each of the variables has a margin of error of 10% and that A, B, and C each are equal to 10, then the result R =1000 X C. If we add a 10% error to each variable then R = 1331 X C. The difference between the two results is 331 or 33.1%, far greater than the 10% error in each variable. Assuming that the error is plus or minus 10% the result can range from 729 X C to 1,331 X C a difference between the maximum and minimum values of the result of over 82%. Small errors in the variables are compounded in linear equations giving potential results with errors that may be compounded exponentially in the final answer. Garbage in, garbage out! Since functional population is an intervening variable that is intended to establish accurately the relationship between existing facilities to the existing development served by the facilities, it is easy to see why these calculations utilizing three variables can derive potentially a wide range of solutions and resulting error. This is the fundamental flaw in evaluating Impact Fees. Regardless of the methodology, many assumptions are made, numerous algorithms with multiple variables are incorporated, and the results can often be skewed by an exponential error. As an Engineer and State Certified General Contractor, many of us in the industry have often felt that impact fees disproportionately put the burden of new infrastructure on new development and that is the crux of the argument. The law is based on proportionate share. Public Officials and their respective staffs bow to no growth special interest groups in adopting impact fees and then increasing these fees exponentially to fund the future growth needs of the entire community. Consultants then adopt a methodology to support the ever-increasing notion that the Impact Fees that we have in place or are considering adopting or increasing are just and proportional. We need to ask ourselves two questions: How did we fund infrastructure needs before introduction of Impact Fees? And why nearly half (32) of the Counties and many more jurisdictions nationally do not assess Impact Fees and how do they provide for future needs? INDIAN RIVER COUNTY 18 IMPACT FEE TASK FORCE
168 Many examples can be given for the inadequacy and lack of proportionality of our current and proposed Impact Fees. An example frequently heard by our committee was that of replacing a two-lane road with a four-lane road and not properly crediting the capacity of the existing two-lane road in determining the proper impact fee. This is a question of proportionate share and goes against the principle rooted in case law and norms of equity that Impact Fees should not charge new development more than its proportionate share to provides levels of service higher than is provided to existing development. A number of years ago the Fire District built a new fire station on the south barrier island. As an existing resident, I was pleased to see the new Fire Station in my neighborhood. Did this Fire station benefit only new development or did all of the residents of the south barrier island equally benefit by having a Fire and Rescue Station located literally in their back yards? This again raises the question of proportionate share. Because new development will pay impact fees to provide the existing level of service for itself, it is reasonable to consider that new development may also be paying for the facilities that provide that level of service for existing development. If this is the case, then new development is paying for more than its proportionate share. Generally, Impact Fee studies do not give sufficient credit for past property tax payments for vacant land that is now being developed or for future general fund expenditures for capacity-expanding improvements. Level of Service (LOS) standards are crucial to proper determination of Impact Fees. Many LOS standards oversimplify these complicated ratios by relying on a single element of a capital facility such as acres of land for parks or square feet for library buildings. This implies only additional land acquisition or building more libraries can enhance the level of service. This ignores that parks can be enhanced by improvements to existing land and libraries can be expanded by electronic means. We must do something to alleviate the disproportionate shift in allocating these costs to new development providing for a wider base of funding and a more equitable contribution from all who benefit from enhanced infrastructure. This can be accomplished by increasing or adding user fees for parks and boat ramps. Increase the local gas tax by an additional ($.06) six cents. Increase sources of revenue wherever possible. Federal gas tax has been fixed for 20 or more years at 18.4 cents/gallon. An increase in this tax specifically allocated to fund future road improvements would spread the burden among the many who do not live in our community, but frequently use our roads. Impact Fees have the effect of impeding growth and dull the ability to create a competitive economic environment. This discourages business development and consequently restricts economic growth and the flow of revenues to public entities. Currently we are in an economic downturn and the imposition of higher Impact Fees will exacerbate growth in the future and make it more difficult to attract badly needed clean industry and business to our community. Impact Fees are an inefficient, inequitable, and inaccurate method of funding future needs resulting in an undue burden on new development and a free ride to all of the other beneficiaries of the enhanced services provided. Continuing down this path will result in under funding for future needs and elevate costs for all future new residential and commercial developments. These new projects, with their higher costs, will no longer be on a level playing field and will have a difficult time competing. Going forward we can stabilize capital requirements for future needs by less dependence on new construction and spreading the funding of infrastructure over a greater percentage of the public receiving benefits. Indian River County Impact Fee Task Force Terry T. Torres, President, Broker Bird Realty Group Treasure Coast, Inc th Place Vero Beach, FL PH , FAX INDIAN RIVER COUNTY IMPACT FEE TASK FORCE 19
169 INDIAN RIVER COUNTY IMPACT FEE TASK FORCE 20
170 INDIAN RIVER COUNTY IMPACT FEE TASK FORCE 21
171 INDIAN RIVER COUNTY IMPACT FEE TASK FORCE 22
172 Impact Fee Study Group Final Report Dissenting Opinion by Honey Minuse Representative from Indian River Neighborhood Association January 10, 2008 From the onset it was recognized my participation was as the lone minority representative of the taxpaying public. All other members studying this matter, with the exception of those employed by the cities, county and school board, are affiliated with the development community. At no time during our study was there error shown in the accuracy of the numbers or the correctness of the methodology used by Duncan Associates, the consultants to the County. Their report recommends that County impact fees be increased in order to keep pace with the cost of providing the infrastructure required by future population growth. The accuracy of the facts, numbers and methodology are matters to be addressed by other professionals and were acknowledged to be beyond the scope of this Study Group. (We are informed the Treasure Coast Builders Association does raise a challenge to the Duncan Report via a December 2007 consultant study commissioned by the Builders Association. It is understood this report will be presented separately. This challenge should be addressed by the County s consultants and the County s Professional staff. ) Therefore it is recommended that the Board of County Commissioners, without further delay, accept the Duncan Associates report, Impact Fee Update, dated September 11, To do otherwise would place the increased costs of future infrastructure growth upon the taxpayer, placing the taxpayer into the position of subsidizing development and the building industry. One last comment must be made at this time and that is in reference to the fact this Study Group, which had active participation of senior county staff, was conducted outside of the Florida Sunshine Law. It is unfortunate the public was denied access to the flow of information as it was presented for it would have created greater understanding of how and why impact fees are generated. It is strongly recommended that future Study Groups be conducted in the Sunshine. INDIAN RIVER COUNTY IMPACT FEE TASK FORCE 23
173 Minutes Impact Fee Task Force August 28, 2007 MINUTES Location: Indian River County Chamber of Commerce Board Room, Vero Beach 1. Attending- Beth Mitchell, Penny Chandler, Donald Wright, Brian Curley, Cheri Fitzgerald, Honey Minuse, Dan McIntryre, Chris Bieber, Maria Aguilar, Chip Landers, Chuck Mechling, Joe Paladin, Nancy Offutt. County staff: Stan Boling, Joe Baird. Absent: Jason Nunemaker, Al Minner, Frank Watanabe, Peter Robinson, Robert Keating, Terry Torres, Robert Bradshaw Ms. Mitchell noted that she hoped everyone would be involved and committed to the effort. She pointed out a draft schedule of activities and stated, unless otherwise noticed, meetings would be held at the Indian River County Chamber on the designated dates at 3:30 p.m. Self introductions were made. Ms. Mitchell reported she and Ms. Chandler had met earlier in the day with Joe Baird who suggested interim task force reports to the Commissioners. He also indicated staff from the County as well as Duncan and Associates could be made available to attend where needed and provide an overview of the report. Ms. Mitchell suggested the group break the report into segments with volunteers working on each section and then reporting their findings back to the full group. She noted there are 9 areas of interest. 2. Additional Members: Ms. Chandler reported that being added to the original document that was distributed are a Commercial Developer represented by Brian Curley, and Andy Bowler representing Habitat For Humanity. A task force roster is part of the agenda packet. 3. Discussion of documents Ms. Chandler described the agenda packet documents as reference and background. Those docs are: Ordinance to adopt Title X, Impact Fees and Amend Roadway Improvement; June 29, 2007 county memo to establish task force; Accompanying Resolution. A copy of the revised Duncan report is also provided. 4. Timeline Ms. Mitchell reviewed the timeline showing there will be working meetings, an interim report and a final to Commissioners. Ms. Chandler stated she had spoken to several Commissioners about the task force who reported the task force was open to inspect the process as well as the document by Duncan. There was a lengthy discussion about individual expectations and many questions asked about the report. Ms. Offutt reported that the Builders organization had hired Kirk Sorenson to help them analyze the materials. She asked if level of service was on the table for discussion. Mr. Baird said yes it is. There was a discussion about what this group might analyze vs. information we may have to assume is correct. Mr. Baird pointed out that impact fees may not be used to catch up construction projects. Impact fees may only be used for additional capacity. It was raised that we may need to discuss what the county is willing to pay for quality of life? At what point do quality of life issues like additional restaurants, services including medical, become out of reach due to cost and the impact that has on the citizens, business community? If new ideas for growth are not affordable, how do we continue to grow as a community? At what point do we no longer receive a return? How much government can we afford? INDIAN RIVER COUNTY IMPACT FEE TASK FORCE 24
174 Mr. Baird stated school fees were the highest and that we would want to look at how the school fees are used. He was specific that the Commissioners may, by law, set a percentage at which projects are funded. He stated this does not need to be at 100% but is at the discretion of the Commission. Anything not covered would be taken from general tax base, grants, etc. He suggested he arrange for the County Budget Officer Jason Brown to provide reports to the group about how the money has been used in the past. He added captured trips should be revisited. There were suggestions at how to look at level of service. Mr. Baird cautioned to be careful when looking at level of service. Just because a project is slated does not mean that residents won t stop the project. It was agreed certain assumptions would need to be made. Mr. Bieber suggested we accept numbers until such time when a number stands out as incorrect and then we should question and raise it as a point. Mr. Wright stated numbers should later justify any recommendations. A-1-A was provided as an example of a road where level of service peaked but where residents choose not to increase lanes. There was a brief discussion about the meaning of peak season, peak hour and if formulas now used work properly in describing where we are with capacity. Double counting, inflation of numbers, removing trips from roads and other issues were mentioned. Mr. Boling will work to bring staff and consultants to the next meeting. Mr. Baird stated that implementation is a choice. He also suggested the various break-out groups set up their own meetings with county staff where needed to save time. Mr. Curley suggested we also need to address the impacts to developers and other means of funding to the County; quantifying the impacts. Mr. Baird noted that all impact fees are not county-wide. For instance parks in the City of Vero Beach are not included. He also noted that these impact fees can be regressive and that we ask the question if they may hurt the community. There was brief discussion about deferring fees and decreasing levels of service. Baird also suggested we look at what the state requires us to do for impact fees. (Stan Boling will provide) Ms. Aguilar discussed how housing is out of reach for many blue collar workers. Ms. Minuse suggested including someone on the task force from the health field. 5. Review of consultants report, volunteers by section- Traffic Section, pages Joe Paladin, Chuck Mechling, Honey Minuse, Don Wright, Nancy Offutt, Frank Watanabe. Chuck will coordinate meeting for this group. Schools Section, pages Dan McIntyre, Chip Landers, Nancy. Dan will coordinate meeting for this group. Quantifying the impacts- Mr. Curley, Mr. Bieber, Mr. Bowler Parks Section, pages Cheri Fitzgerald, Don Wright Law Enforcement, pages Honey Minuse (corrected) All members of the group are urged to read the entire report before the next meeting. It was agreed that other assignments for those not in attendance may be made by Ms. Chandler. We will try to have an interim report to the Commissioners October 16. It was agreed we will meet at 3:00 p.m. rather than 3:30 p.m. 6. Next Meeting- September 11, 3:00 p.m., Chamber of Commerce- Agenda will include reports from all subcommittees; possibly staff and Duncan & Associates representatives. 7. Adjourn INDIAN RIVER COUNTY IMPACT FEE TASK FORCE 25
175 Sub-committee assignments: Libraries Section, pages Peter Robinson, Al Minner. Peter Robinson will coordinate meeting for this group. Fire Rescue Section, pages Terry Torres, Jason Nunemaker, Robert Bradshaw. Terry Torres will coordinate meeting for this group. Recommended to set appointment with John King, County Emergency Services Law Enforcement Section, pages to be determined in second round of study Honey Minuse (corrected) Corrections Section, pages to be determined in second round of study Public Buildings Section, pages to be determined in second round of study Solid Waste Section, pages to be determined in second round of study INDIAN RIVER COUNTY IMPACT FEE TASK FORCE 26
176 Impact Fee Task Force September 11, 2007 Minutes Location: Indian River County Chamber of Commerce Board Room, Vero Beach Facilitators Penny Chandler, Indian River County chamber and Beth Mitchell, Sebastian River Area Chamber. Attendees: Al Minner, City of Sebastian, Kirk Sorenson, Nancy Offutt, TCBA, Chip Landers, RAIRC, Andy Bowler, IR Habitat, Frank Watanabe, Neil Schaffer, Cheri Fitzgerald, COVB, Maria Aguilar, Town of Orchid, Chris Bieber, IRNB, Jason Nunemaker, City of Fellsmere, Don Wright, SRAC Chamber, Susan Olson, SDIRC, Honey Minuse, IRNA, Terry Torres, RAIRC, Bob Keating, Rachel Clyne, Sasan Rohani, IRC Community Development, Brian Curley, P & S, Dan McIntyre, SDIRC, Joe Paladin, Growth Task Force, Peter Robinson, IRC Chamber, Jason Brown, IRC Finance Dept. Also in attendance were representatives from the consulting firm, Duncan & Associates, Clancy Mullen and Tom Wright, Esq. Ms Chandler welcomed everybody and explained that this was a semi- informal group, that Task Force members had previously met, and sections of the Impact Fee Update Report were being reviewed by members in the room with some independent meetings outside of today s meeting. She encouraged dialogue and questions from all parties present. Ms. Chandler then introduced the representatives for Duncan & Associates, Clancy Mullen and Tom Wright. Mr. Clancy provided a power point presentation which included an overview of each section of the most recently updated Duncan report. During his presentation members of the Task Force asked questions. His overview included a description of the approach to this study, and that it continued the philosophy initiated in the original Impact Fee Study including the credit approach in calculations. The principles behind the report were that impact fees were a regulatory fee, and there was a dual rational behind the collection of these fees. Government must show a need for services and also must show a benefit provided by the collection of these fees. By law, government cannot charge more for service than it is providing and collected impact fees must be used for services required by additional growth. Traffic Section: Mr. Clancy then began a discussion on the Traffic Section of the Report. There were a long discussion concerning the use of impact fees to met concurrency needs, and the report is not based on that premise. The recommendations for increased fees are based upon existing level of service. Several questions were raised regarding the factors used in the report including trip lengths, and whether trip lengths have been compared on different types of roadways, what special characteristics of Indian River County were considered, existing inventory, land mile costs, etc. Issues regarding reconstruction vs. new construction were raised and Mr. Duncan explained that costs of reconstruction were not factored out. Mr. Keating agreed that the methodology, in looks at traffic counts including the IT rates, may be too high. It was suggested that the VMT may be off by as much as 24%, and should be reduced to consider real world information. It was also suggested that the roadways used in the report were not clearly identified. Other issues discussed included issues with a lack of data on existing roads and real current costs. Additionally it was discussed that the need for traffic fees did not reflect other types of revenue collected for road improvements, and that state roads were included in the analysis and should be adjusted out, or credited. Another subject was the 512 project, which INDIAN RIVER COUNTY IMPACT FEE TASK FORCE 27
177 was included as a six lane project. Finally it was suggested that the analysis should look at real, existing roads and the county s actual participation in the road projects. Bob Keating discussed the quandary of basing the impact fee structure on either a plan based fee or a consumptive fee structure. He explained that the plan fee structure would be difficult because there are other sources of revenue blended into the plan. Additionally he explained the distribution of fees among the existing districts, and that originally there were nine districts in the county, and now those districts have been consolidated, and there are three. He also discussed the existing ordinance will be revised based upon the final report. He spoke about the discretionary gas tax, the State allows up twelve cents ($.12) per gallon and the county is currently collecting $.06 per gallon. The County s MPO is considering an incremental increase over the next four to five years to help generate revenue for road projects. School Impact Fees Section: The next section discussed was the School Impact Fees. The premise in the report was that the level of service was one permanent station per student, and this premise served as the foundation for the increase in fees. A discussion about the predicted land costs for building new schools took place, and it was pointed out the projected land costs were based upon a single data point, the School Board s consideration of purchasing land at $95, per acre. There was strong disagreement whether this data point was appropriate to establish land costs. One point was the existing portables and whether or not a credit should be included in this analysis for the number of portables. It was mentioned that 24percent of the students are now in portables. It was suggested that unsold inventory and vested holdings should also be included in the calibration of the model. Also pointed out, the enrollment numbers and the issue of empty homes in the County. It was determined that there was a net increase of 1% enrollment for the school population and it was suggested that the downward trends in student population should also be considered. At this point in the presentation the Task Force members requested that the consultant provide copies of the power point presentation, which included comparison charts of the proposed impact fees compared to other counties in the State. There was a comparison slide for each section of the report, and a slide of the total proposed fee schedule compared to other counties. Mr. Mullen agreed to do this. Parks Section: Mr. Mullen then discussed the Parks section of the report. He mentioned that if the fee scheduled was adopted by the Commission it would put us on par with Collier County. Bob Keating offered that purchased made with impact dollars would have to be maintained with general funds. Mr. Keating explained the difficulties in establishing a park inventory, and defining a park, active versus non active. He also explained that none of the conservation land purchased through the LACC committee were included in the inventory. Currently the County has approximately $ 5.5 million in the Parks account and $600,000 is set aside for infrastructure improvements, which will increase capacity, at the soccer fields at Hobart Park. He also discussed the challenge of accumulating fees over time and implementing a parks plan. There was a question regarding the replacement costs on Table 50, and whether credits for grants should be factored into the model. A suggestion was made that the reoccurring theme in parks is the need for $150,000 per mile for a jogging trail. Mr. Mullen offered that $1,250 per person in the county was used to establish the costs for a level of service. It was also suggested that if the School Board and the County could come to an agreement about sharing facilities there could be a reduction in the need for additional fees. The study was based upon the maximum fees to be collected. INDIAN RIVER COUNTY IMPACT FEE TASK FORCE 28
178 Fee Sections: The last fee sections of the report were reviewed briefly. There were comments about the library fees and the increased level of service. The Solid Waste Fee increase was very small, and no further discussion was held on that section. Further discussion was held and general comments about the purpose of fees, the need for an increase, and the current economic status of the county were made. The members asked Jason Brown to briefly provide the balances in each account for these sections, and it was agreed he could come back for a more in depth discussion on the finances and plans for each section. Jason provided the following: Traffic account $ 64,000, Corrections 955, Law Enforcement 862, Fire 1,600, Solid Waste 500, Parks 5,500, Library 1,700, Public Buildings 1,800, The meeting was adjourned at 5:15 p.m. The next Task Force meeting at the Indian River County Chamber building is scheduled for September 25, INDIAN RIVER COUNTY IMPACT FEE TASK FORCE 29
179 Impact Fee Task Force September 25, 2007 Minutes Location: Indian River County Chamber of Commerce Board Room, Vero Beach Facilitator Beth Mitchell, Sebastian River Area Chamber of Commerce Attendees: Nancy Offutt, TCBA; Chip Landers, RAIRC; Andy Bowler, IR Habitat; Frank Watanabe, Neel- Schaffer; Cheri Fitzgerald, COVB; Chris Bieber, IRNB; Honey Minuse, IRNA; Terry Torres, RAIRC; Bob Keating, IRC Community Development; Brian Curley, P & S Properties; Dan McIntyre, SDIRC; Joe Paladin, Growth Awareness Task Force; Peter Robinson, IRC Chamber; Jason Brown, IRC Finance Dept.; Joe Baird, IRC Admin.; Chuck Mechling, Pointe West Ms. Mitchell opened the meeting at 3:05pm. When asked, members confirmed that they are all now receiving the s. As Jason Brown was setting up his presentation, Beth referred members to Question 4, regarding inviting Wayne Kleinstiver to a future meeting, asking for feedback. The general consensus is that the economy is not in good shape, and Mr. Kleinstiver s information could quantify this fact. Bob Keating pointed out that Mr. Kleinstiver does not compile county statistics the same way the County does. It was agreed to invite Mr. Kleinstiver to a future meeting; Ms. Mitchell will ask Ms. Penny Chandler to schedule him. Ms. Mitchell then turned the meeting over to Jason Brown, to give an overview of the county s finances as related to impact fee fund balances, via a PowerPoint presentation. A question was raised if funds are set aside for projects that have already been approved, such as the widening of 43 rd Avenue. Answer: yes, in most cases; however, if it is a long-term project, the funding may be spread over several fiscal years. A follow-up question was raised: many projects have been planned as a result of past growth; are impact fees the appropriate source of funding? Answer: the county can only use impact fee funds based on current demand; the county has the obligation to continue work on projects in anticipation of future demand. When asked, the balance in the 1-cent sales tax account is $15 million, which is down due to the new county administration building and the new jail. When asked, Bob Keating explained the role of the MPO and its annual priority list. The MPO typically receives $10 million annually from federal gas tax money. He also explained the issues on currency, that fees are tied to the land, and reserved trips come back on line if the project is abandoned. He discussed the planning concept and that a proposed project takes approximately 13 years, from concept to concrete. Joe Baird discussed in detail the current financial condition of the County, the cash flow issues that the County deals with annually, and the fact that revenues have flat lined, particularly since the number of homes being built has significantly dropped. Mr. Keating also pointed out that in all of the categories, traffic, recreation etc., projects are financed with a blend of revenue sources. Ms. Mitchell pointed to Mr. Mechling s hand-out and the questions his committee have, especially as related to the county s impact fee formula. It was explained that the formula itself does not differentiate between residential and commercial development, but the trip variables will vary. Joe Baird explained that gas tax funds can be used for road maintenance and maintenance buildings, but the county opted to use these funds only for road construction. He added that the county will borrow money if necessary to complete road projects, pledging the gas tax as a revenue stream. INDIAN RIVER COUNTY IMPACT FEE TASK FORCE 30
180 Mr. Brown went through his presentation, explaining the fund balances and future capital improvement plans for roads, public parks, libraries, and emergency services. Balances did not show School Board impact fee balance of $7 million; Mr. McIntyre confirmed that the funds have not been spent. The total fund balance is $94,797,080. Discussion ensued on the SR60 projects. Mr. Baird explained these projects may get pulled as the state may delay payback. He added that SR60 is not included in impact fee calculations. A slide showed several major road projects on the 5-year CIP totaling $176.6 million, financed by a mix of impact fees, gas tax funds, and the optional sales tax. Approximately $9.9 million was shown in major park projects, not including future land purchases for active parks, and $20 million in major fire/ems projects. Mr. Brown then discussed the Parks and Recreation category. The slide provided did not include another $9 million in proposed parks and recreation land acquisition, and it was agreed that Mr. Brown would follow up the meeting with a further explanation on the proposed projects and future funding. One of the final slides showed the proposed increases to each impact fee type, possibly increasing the cost to construction of a single family home by 72%. As Mr. Brown finished, Ms. Mitchell suggested tabling committee reports to the next meeting, scheduled for two weeks. Members were reminded that the Task Force will be giving a status report to the county commission on Oct. 16. The meeting was adjourned at 5:00 p.m. The next Task Force meeting at the Indian River County Chamber building is scheduled for October 9, INDIAN RIVER COUNTY IMPACT FEE TASK FORCE 31
181 Impact Fee Task Force October 9, 2007 Minutes Location: Indian River County Chamber of Commerce Board Room, Vero Beach Facilitators Penny Chandler, Indian River County Chamber of Commerce and Beth Mitchell, Sebastian River Area Chamber of Commerce Attendees: Jason Nunemaker, Fellsmere; Chris Bieber, IRNB; Don Wright, SRACofC; Dan McIntyre, SDIRC; Joe Paladin, Growth Awareness Committee; Peter Robinson, IRC Chamber; Bob Keating, IRC Community Development; Nancy Offitt, TCBA; Chip Landers, Realtors Association; Cheri Fitzgerald, COVB; Maria Aguilar, Town of Orchid; Al Minner, City of Sebastian; Brian Curley, P & S Properties; Terry Torres, RAIRC; Frank Watanabe, Neel-Schaffer; Honey Minuse, IRNA Ms. Chandler opened the meeting at 3:05 p.m. and explained that several members had scheduling conflicts, Ms. Minuse would be arriving later, and Dr. McIntyre requested that the School impacts fees be discussed first on the agenda. The committee agreed to accommodate everybody s requests. School Section: Dr. McIntyre presented a memorandum (attached to these minutes) outlining three different approaches to crafting a recommendation to the County Commissioners on the proposed increase in impact fees for the school system. There was discussion on the three paragraphs. The general consensus was that the first suggested approach, endorse the consultants recommendation was not acceptable to the committee. It was opined that other consultants could provide different proposals, with different methodology. There was also discussion regarding the interpretation of the number, ie. land values. A question regarding the relationship between the School Board and the IRC Commission was asked, and it was stated that ultimately the County Commission controls the implementation of impact fees, but it was noted that the entities have had a good working relationship over the years. Members of the committee discussed whether to make recommendations on the numbers, costs and methodology, or to focus on the economy as the biggest concern for commissioners to consider. It was recommended that whatever the result of the committee s efforts, it needed to be based on knowledge and fact. A discussion ensued regarding the purpose for impact fees, and the school board s five year capital improvement plan, which will be provided to the committee. Dr. McIntyre added that the amount of money received from the impact fees was a small portion of the school board budget. There was continuing discussion on issues with the study, and a need for a chart showing data comparisons of the number of homes and students was suggested as a means of understanding the consultant s recommendations. Quantifying Impacts: Chris Bieber discussed the concerns of his sub-committee members with the impacts to business if the Commission implements the recommendations of the consultant. Chris provided an example of commercial development, using a new building project that was 20,000 sq. ft. His review of the project concluded that using a construction rate of $ 18/$30 per foot, and adding the increased impact fee, would make a project cost prohibitive. He stated that the proposed increase would prevent a project from being feasible, it would prohibit cash flow, and the return on investment could not be justified. A discussion regarding the issue of supply and demand, and economic development was continued. A comment was made that the increased fee schedule, and in fact the current fee schedule, could be creating a disincentive for commercial INDIAN RIVER COUNTY IMPACT FEE TASK FORCE 32
182 development. There was a consensus that real life stories should be researched to help describe the negative impacts that the commercial developers are currently faced with in their projects. A written report will be provided. Parks Section: Don Wright discussed the memo he presented at a previous meeting (a copy is attached to these minutes. He opined that he was not comfortable with the methodology utilized by the consultants and that it was not logical. He expressed concern about computing fees with an assigned monetary value and level of service. Don questioned what level of service is needed? It was also mentioned that Jason Brown would be providing additional information regarding the park improvement plan, and the other sources of revenue and expenses that the County considered. Committee members again discussed the exclusion of public lands in the consultant s report, and it was noted that there is no park credit assigned for the State parks located in our county. Another issue discussed was that impact fees could only be utilized in the acquisition of parks, and that future maintenance would be an additional expense not covered by impact fees. Library Section: There was no report given, but a discussion was held regarding the future of libraries. The current impact fees for the library system were to finance the master plan created by the Public Library Advisory Board. Comments were provided about the changing needs for brick and mortar projects, and how the expansion of internet services may reduce the need for actual buildings in the future. Bob Keating will provide a copy of the master plan for the committees review. Fire Rescue: While there were not many comments regarding this section of the report, concerns were expressed on the building costs for new fire stations. A written report will be provided later. Generally, the committee agreed that fire rescue, which actually impacted the health, welfare and safety of the residents, was not an area where impact fees should be reduced. Comments included hot zoning, where clusters of services in one area could reduce the costs of building and acquisition of land. At this time in the meeting a discussion was held regarding the appropriateness of using impact fees for future projects, and the need to look at other revenue sources for funding future projects. Another comment was made that different projects are funding from a blending of revenue sources, and it is difficult to discern whether or not impact fees are actually being utilized in the legally described manner. Transportation: Sub committee submitted several questions regarding the transportation section of the consultant s report, a copy of those questions are attached to these minutes. Honey Minuse provided an overview of the questions, and requests for review of other counties date. She also discussed the need to review the feasibility of adopting a new system for county wide traffic system, such as Synchro. While it was agreed that not every county in the state is currently experiencing growth pressures, the committee members agreed that looking at the approach of other counties regarding transportation needs could be helpful. A discussion continued regarding the sampling sizes, software system and formulas utilized in establishing traffic impact fees. Bob Keating emphasized that the impact fees were not based upon concurrency issues. It was suggested that a new approach in looking at the operational side of traffic included the concept of intersection failure. Additional comments were made regarding the lowering of speed limits as a method to help increase traffic flow. Questions remain on the formulas used to calculate traffic impact fees. Bob agreed to provide information on other MPOs. It was agreed that the committees would provide their reports via electronic transmission to facilitate easy distribution of information. Penny and Beth will be providing a status report to the County Commissioners next week, and at our next meeting we will be reviewing the remaining sections of the report. The meeting was adjourned by Ms. Chandler at 5:15 p.m. INDIAN RIVER COUNTY IMPACT FEE TASK FORCE 33
183 Impact Fee Task Force October 23, 2007 Minutes Location: Indian River County Chamber of Commerce Board Room, Vero Beach Facilitators Penny Chandler, Indian River County Chamber and Beth Mitchell, Sebastian River Area Chamber of Commerce Attendees: Chuck Mechling, Cheri Fitzgerald, COVB, Chris Bieber, IRNB, Don Wright, SRAC Chamber, Honey Minuse, IRNA, Bob Keating, IRC Community Development, Dan McIntyre, SDIRC, Joe Paladin, Growth Task Force, Peter Robinson, IRC Chamber, Frank Wantanbe, Neel Schafer, Chip Launders, Realtors Association Ms. Chandler opened the meeting at 3:05p.m. Before the agenda for the meeting was addressed, a discussion was held regarding scheduling of the next few meetings. It was decided that the Task Force would start meeting on a weekly basis, in order to finalize the task force efforts before the Thanksgiving Holiday. A discussion was held on the possible return of the County s consultants, Duncan and Associates, and Mr. Keating offered that Mr. Clancy was scheduled to return to the committee on Nov. 6. Ms. Chandler also suggested that Wayne Kleinstiver would be available to discuss the current status of the economy. After lengthy discussion the members of the task force directed Ms. Chandler to invite Mr. Kleinstiver for the Oct. 30 th meeting, and that it was not necessary for the county s consultant to return for further discussion. The Task Force then began discussion on the day s agenda. Law Enforcement Section was reviewed, the members of the sub-committee had not yet met, however there were several questions directed towards Mr. Keating regarding methodology. Mr. Keating explained that the calculated fees were based upon staffing, the statistics and need for law enforcement and how those numbers effect the possible expansion and renovation of facilities. He further commented that the fees were for unincorporated areas only, were not for replacement costs, only capital needs. A verbal report was delivered on the Library Section. All members of the Task Force received copies of the Master Plan. Comments on the plan were concerned with a lack of a priority list for library buildings, and it was not easy to determine when the next library would be built or where. There was general consensus that the master plan needed to be updated with a more specific plan. The Task Force members would like to have input from Tom Frame, IRC General Services on the long term capital plan. Chris Bieber handed out a draft document with a discussion on the financial impact of the increased fees. He explained that it was difficult to assess the real life, apple to apple, impacts of the proposed increases. He expressed the idea of reviewing the level of services that were proposed, and strongly expressed concern for the local economy. He commented on the psychological impact of an impact increase, and the anticipated giant headline, and how that would effect potential business and investors. At this point the Task Force held a general discussion on the direction that the Task Force would take in making recommendations to the committee. Several members spoke regarding their concerns from different perspectives, including the idea that this was not really a technical issue, that if the County imposed higher fees, they would not be collecting anything, because in the words of one member Nothing from nothing equals nothing. INDIAN RIVER COUNTY IMPACT FEE TASK FORCE 34
184 Don Wright asked What decisions are we going to make? and he felt that there were 8-10 scenarios, he didn t believe we could refute the consultants, but pointed out that the fees were based upon undefined needs and plans. Other comments were made regarding the current state of economy, and that adding additional impact fees on top of other issues, like taxes, insurance, etc. would bring our local economy to a grinding halt. It was suggested that one recommendation should be a reduction of impact fees, as a means of providing incentives for business. Also discussed was the possibility that the County would delay implementation of the increased fee schedule until the economy showed signs of recovery. The possibility of phasing in a percentage of the fee schedule was also discussed. The use of impacts fees to fund projects was reviewed, and there are some members of the Task Force who felt that there are other methods of finding revenue besides impact fees. After much discussion Ms. Mitchell called for a consensus from the group on how they wanted to proceed. She asked the Task Force if they wanted to just go ahead and make a recommendation to the Commission based on the current economic status of the County, and the potential deleterious impacts to the business climate or if we should proceed with the sub groups, and a review of the recommendations of the consultant. Ultimately, the group decided to go forward in the following manner: the sub groups will provide a report on each section of the consultant s report, and will include their recommendation to the full Task Force. The sub group s report will consider whether to recommend an increase, decrease or a do nothing action item. The sub groups report will also include any other recommendations that might be appropriate. Example: the Library Section would include a comment that stated the Master Plan needs to include a list of capital projects. Ultimately the full Task Force will vote on each recommendation, and any dissenting opinions will be included in the final report to the Commission. There was further discussion on the roles of each participant on the Task Force, and Ms. Chandler explained that each person was selected based upon their interest, background, or as a stakeholder. While some of the participants may only be there for information, it was important that all participants continued to participate in the discussions. The meeting was adjourned at 5:15 p.m. INDIAN RIVER COUNTY IMPACT FEE TASK FORCE 35
185 Impact Fee Task Force Agenda October 30, :00 pm Location: Indian River County Chamber of Commerce Board Room, Vero Beach Facilitators: Penny Chandler, Indian River County Chamber and Beth Mitchell, Sebastian River Area Chamber 1. Call to Order- The following people were in attendance- Frank Watanabe, Al Minner, Cheri Fitzgerald, Chris Bieber, Joseph Paladin, Peter Robinson, Dr. Dan McIntyre, Honey Minuse, Chip Landers, Terry Torres, Don Wright, Nancy Offutt, Kurt Sorenson, Jason Brown, Deb Branwell, Maria Aguilar, Penny Chandler, Beth Mitchell. Absent were: Jason Nunemaker, Andy Bowler, Brian Curley, Chuck Mechling, Robert Keating, Robert Bradshaw Ms. Mitchell reported a 2006 state impact fee task force report can be found at It was reported some legislative action resulted from this report. The report recommends that impact fee ordinance must address affordable housing issues. She urged members to review this report on-line and the item will be discussed at the next meeting reminding members that whatever we do has an impact on affordable housing. Ms. Aguilar introduced Deb Branwell who will be attending the impact fee task force meetings on behalf of the City of Orchid. 2. Presentation- Wayne Kleinsteiver presented information about land values as they relate to impact fees. He began by providing data reflecting a local developer plan to construct a commercial building. He stated results of the plan would determine if the developer will lease space or sell the building. All plans include an investor yield. In his example, Kleinsteiver provided different data to prove that land values are reduced if market variables do not change but impact fees are introduced. In all instances, increases in fees reduces land values and reduces collectible taxes. Residential construction was also discussed and data reflecting current construction costs met with the same results as commercial examples. It was noted by the group that you would need significant improvements to the economy to see different results. Timing is an issue. Kleinsteiver accepted and input varying data from committee members with results begin the same with land value decreased. Members of the group commented that the actual impact fee increase to the value may be minimal but that the debt service becomes the killer. Taxes and insurance added to the mix increases the inability for a project to break even. Paladin, Robinson and others reported that developers are now subsidizing common area maintenance just to get a tenant. Some developers and property owners are providing incentives like 1 year free rent or reduction in cost per square foot to attract tenants. Others, with large anchor tenants, incent the anchor which is the draw to the facility while passing along the costs to the smaller occupants. It was stated that commercial development has yet to see the impact of the consumer meltdown. We need to see changes in the marketplace since we are not now in a healthy economy. When discussing the residential model, it was stated that builders are giving away the land (land they own) on each deal just to remain in business. The yearly carrying costs, when annual sales are down, is when the bleeding begins. National builders are able in some circumstances to recoup their costs associated with lower sales process while small builders are not able to absorb those costs. No developer ever paid too much for the land... he just died too soon. The current severe downturn in construction has created a loss of funds for infrastructure in the county. INDIAN RIVER COUNTY IMPACT FEE TASK FORCE 36
186 3. Further sub-committee reports: Libraries: The report from Mr. Robinson and Mr. Minner states that there is a current large balance of library impact fees and no project on the books that will be completed in the next 7 years. It was stated there is a need for the implementation of a realistic library improvement program. There should be a delay in increasing the library impact fees. There was a suggestion that perhaps now is the time to locate land on which future libraries might be constructed. Also, there is thought that the County should invest more thought in additional multi-purpose buildings, maximized with technology. Law Enforcement: Ms. Minuse reported she felt there was not much that could be done in this area. She pointed out that this is a highly politically charged issue and would be inflammatory if impact fees are reduced or delayed as it would be perceived to impact the delivery of services. Her recommendation is that the task force accept the recommendation for this element of the report. Ms. Offutt introduced Mr. Sorenson who is a consultant working on impact fee issues for Treasure Coast Builders. Sorenson reported that under normal, typical conditions you do not see fees that double unless factors are manipulated accordingly. All consultants have their own methodology. As consultants are hired, consistency and methodology changes county to county. Sorenson is looking at how Duncan s methodology has changed and how that had changed from the Tindale Oliver report. For instance, Tindale Oliver included finance charges on debt for schools and that is not reported in the Duncan report. He also noted that capacity related expenses are creditable. He noted that if credits are used, it reduces school impact fees significantly. There was brief discussion about road costs as they relate to impact fees. Sorenson is hoping to have a draft report in days on all elements and will provide this group with that report. There was general discussion about the process to develop a final report and recommendations. After some discussion, it was recommended that we stay with the idea that sub-committee reports on each element will include on of three recommendations: increase, decrease or do nothing. It was noted we should make sure the assumptions are reasonable and if not, bring that forward so that data can no be manipulated. We need the most recent data. Mr. Brown noted that new development should pay for itself and the burden not be placed on existing residents. Any recommended changes should be directed at the current economic state and be reasonable based on reality and adjusted accordingly. Mr. Torres stated that impact fees are not the most equitable method to address future needs when much of what is addressed through those fees benefit everyone in the community. Torres will provide a report on possible other solutions such as raising the gas tax or introducing user fees for specific services. The costs need to be spread over the entire population when all benefit. New growth is now subsidizing old growth. It was also noted that Save Our Homes had not been introduced when impact fees were first introduced. It was stated by Mr. Kleinsteiver that 50% of all county construction was built before impact fees were introduced. On November 13 th we will see reports from Mr. Sorenson and Mr. Torres. There will not be a November 6 meeting. What are others doing in the counties that do not have impact fees? That should be explored. 4. Level of Service- There was discussion about level of service. Ms. Mitchell suggested in each sub-committee report there should be a discussion about the level of service. The group agreed this will be included. Subcommittees who have already delivered reports are asked to go back and add to their reports how level of service impacts that particular element. INDIAN RIVER COUNTY IMPACT FEE TASK FORCE 37
187 5. General Discussion about final report- From each section, specific comments will be gathered for specific comments in the final report. Each comment must be justified. Alternative recommendations will be offered. A request for further study may be made. 6. How do we handle remaining report sections? Public Buildings Section, pages Nancy Offutt, Peter Robinson will provide a report at the next meeting. Solid Waste Section, pages and Corrections Section, pages It was decided these areas are minimal and comments will be placed under a general comment heading. A letter to the Commissioners will be sent reporting that the Task Force is now meeting weekly and that the coming holiday season will play a role in how quickly our final report and recommendations will be completed. A presentation is more realistic in the new year. We will plan to complete a draft by the end of November and provide that to county staff for their review and comment. A final report and recommendations will be completed in December and a report to the Commission in early January Next meeting- November 13, 3:00 pm at the Chamber. Agenda to include any comments on state task force report viewed on-line; remaining sub-committee reports; alternative recommendations from Mr. Torres and report from Mr. Sorenson. All sub-committees are reminded to review their submitted reports and add an area addressing how the level of service impacts that particular element. No November 6 meeting. 8. Adjournment- The meeting was adjourned at 5:00 p.m. INDIAN RIVER COUNTY IMPACT FEE TASK FORCE 38
188 Impact Fee Task Force Minutes November, 13, :00 P.M. Location: Indian River County Chamber Board, Room, Vero Beach Facilitators: Penny Chandler, Indian River County Chamber, and Beth Mitchell, Sebastian River Area Chamber 1. Call to Order: The following people were in attendance Bob Keating, IRC Planning, Deb Braswell, Town of Orchid, Honey Minuse, IRNA, Don Wright, SRACofC, Cheri Fitzgerald, COVB, Joe Paladin, GAC, Chuck Mechling, IRC Chamber, Chip Launders, Real Estate Assc., Nancy Offutt, TCBA, Chris Bieber, IRNB, Dr. McIntyre, IRC School Board. Absence were: Jason Nunemaker, Andy Bowler, Brian Curley, Frank Watanabe, Al Minner, Peter Robinson, Terry Torres. Additionally, Kurt Sorenson was not present. Ms. Chandler called the meeting to order at 3:10 p.m. and asked for any comments on the State Task Force on Impact Fees Report, Hearing no comments on the report, the Task Force continued with the agenda for the day. Updated sub-committee reports: Law Enforcement: Ms. Minuse reported she would like to discuss this section with Jason Nunemaker, City of Fellsmere and would update this report after that discussion. Transportation: Chuck Mechling presented a new draft of the sub committee s report, following the format suggested. He reported that it was the consensus of the sub committee, while some members had additional comments. The recommendations included a demo of Synchro, and a discussion ensued on the possibility of doing a presentation for the County Commissions at the Task Force Presentation. Bob Keating commented that the County s Traffic Engineer, Chris Mora s opinion was different than the program as was presented to the sub-committee by Frank Wantanbe. Chuck felt that reviewing Synchro would be helpful and instructive in learning how methods of moving traffic are determined. After more discussion, it was agreed that the report s recommendations should stand, and that the presentation of Synchro to IRC Commissioners, could be considered by the Commissioners at a later time. Quantifying Impacts: The next report considered was from Chris Bieber, who provided revisions to the report on quantifying impact fees on commercial and residential development. Chris discussed the issue of level of service in all sections, and the disincentives of impact fees on economic development. A lengthy discussion on the affect of impact fees on economic development took place, and the Task Force considered methods of encouraging economic development by waiving or crediting impact fees. It was suggested that there could be reduction in fees for commercial/industrial projects, and that the County s P & Z Board had supported reducing fees to create jobs. Bob Keating noted that legally the county may not provide relief from impact fees to special projects or categories. He suggested that instead of trying to provide direct relief by waiving fees, fees could be paid from another source. He said that the law required that everybody be treated that same, and that it is not possible to have different fee among fee payers. Discussion continued and Bob suggested that recommending a percentage of the fee increase overall might be a better method of providing relief and encouraging economic development. He also suggested some impact fee categories could be eliminated. Chris continued to comment on level of service issues, and particularly the Parks section of the report. He will include a more in depth discussion in his report on the impacts to economic development. Parks Section: Don Wright reviewed his report of 11/6 and will revise the memo on Parks to match the format the committee has requested. He strongly recommended that the impact fees for the Parks section needed to be adjusted for INDIAN RIVER COUNTY IMPACT FEE TASK FORCE 39
189 current excess capacity, and that the parks currently were built above the needs of the existing population. There was considerable discussion about parks and level of service required and how to quantify that number. Schools: Nancy Offutt provided a report on the School Impact Fees, with recommendations and discussion. Dr. McIntyre reported that most recent action of the School Board was that there was a consensus that because of the conditions of the economy and market, the Board will not be raising impact fees. He also discussed the current tax situation and that there may be an issue next year regarding funding sources. He stated that while the impact fees for schools were really not the primary source of funding for capital projects, depending upon the actions of the State, there may be a need to rely on impacts fees in the future. McIntyre stated a letter stating the same would be sent from the School Board to the Commissioners. Ms. Chandler then reviewed the Impact Fee Task Force process, and asked the members to discuss how the final report would be presented and what it should look like. She urged the group that the final recommendations should reflect facts and opinions that can be supported by the facts. The Task Force then considered how to present, and Chris Bieber and Chuck Mechling agreed to work on a power point presentation. Each section of the report would be presented by a member of that sub committee to the County Commission. Ms. Chandler noted that she and Ms. Mitchell felt this would be most appropriate because there should not be any misinterpretation that the report was coming from the chambers of commerce. A further discussion was held on Kurt Sorenson s work, and how it would be presented. Mr. Sorenson was waiting on information from the county, and would be finalized in the next couple of weeks. Mr. Keating stated Sorenson had been informed that most of this info was now available for him. It was agreed that due to the holiday schedule, the next meeting of the Impact Fee Task Force would be November 27, Adjournment the meeting was adjourned at 5:15 pm. INDIAN RIVER COUNTY IMPACT FEE TASK FORCE 40
190 Impact Fee Task Force Minutes November 27, :00 PM Location: Indian River County Chamber Board Room, Vero Beach Facilitators: Penny Chandler, IRC Chamber and Beth Mitchell, Sebastian River Area Chamber Ms. Chandler called the meeting to order at 3:15pm. The following people were in attendance: Chuck Mechling, Terry Torres, Don Wright, Dan McIntyre, Peter Robinson, Chip Landers, Nancy Offutt, Joseph Paladin, Brian Curley and Chris Bieber. Absent were: Al Minner, Jason Nunemaker, Debb Branwell, Honey Minuse, Cheri Fitzgerald, Frank Watanabe The Task Force members discussed methods of presentation to the County Commission. It was agreed that the Final School Subcommittee Report would serve as an example for the format of the written reports. It was also agreed that there would be a presentation to the Commissioners in the following format: Overview of Task Force and Description of Process Recommendations from Sub-Committees Final Recommendations from Task Force Further discussion was held on the presentation format, Chuck Mechling and Chris Bieber agreed to work on a power point presentation and Penny suggested that her staff could also help. Beth will review the sub committee reports to reduce them to bullets, or some other method to condense the material for power point application. Penny reviewed all of the reports that have been transmitted electronically. A discussion followed on the law enforcement recommendations submitted by Ms. Minuse. Concerns were expressed that the sub committee report was created by one member, however the Task Force will consider the report, and vote on its recommendations in the future. Regarding voting procedures, it was agreed that following process would take place: Create a draft report, and submit it to County staff for their comments. At a specific date, when all Task Force members had been notified of the action, the Task Force would take a formal vote on each sub committee report, and then make final recommendations of action to the County Commission in January. It was agreed that as many Task Force members as possible should participate in the final voting and recommendation procedures. It was also agreed that while there may or may not be a consensus on all of the various sub committee levels, that each sub committee s recommendation would be submitted to the entire Task Force. There was an observation that there may be different viewpoints on issues that the Task Force has considered, and these viewpoints will be included in the final report to the County Commission. There will be a section in the report for general comments from the Task Force Members, if they wish to submit additional comments. Following the discussion on procedure, the Task Force members considered the most recent report from Terry Torres. Mr. Torres memorandum broadened the points of the discussion of the Task Force, by raising the issue of the validity of Impact Fees in general. The Task Force continued to discuss other sources of revenue to replace impact fees. There were several examples discussed including user fees, bonding, sales and gas tax, INDIAN RIVER COUNTY IMPACT FEE TASK FORCE 41
191 CRA s and CDD s. Several members made comments regarding the issue of level of service and suggested that the County should consider lowering the expectations about what the county taxpayer could pay for and the level of service that is required for the County s citizens. Additionally it was pointed out that the School Board policy of recognizing that impact fees are not a reliable funding source for long term projects should also be adopted by the County Commission. Further discussion was held about the scheduling of the Task Force activities and the following schedule was agreed upon: Dec. 4, 3:00 pm Dec. 18, 3:00 pm Jan. 8, 3:00 pm Jan. 9, 2008 Agenda item Presentation from Kurt Sorenson Agenda item Draft report reviewed by Task Force, and transmitted to County Staff Vote on Final Report, all Task Force members participate Final Report scheduled at Commission meeting. The meeting was adjourned at 4:20 pm. INDIAN RIVER COUNTY IMPACT FEE TASK FORCE 42
192 Impact Fee Task Force Minutes December 4, :00 PM Location: Indian River County Chamber Board Room, Vero Beach Facilitators: Penny Chandler, IRC Chamber and Beth Mitchell, Sebastian River Area Chamber Attending: Ms. Mitchell called the meeting to order at 3:15pm. The following people were in attendance: Bob Keating, Chuck Mechling, Chris Bieber, Don Wright, Cheri Fitzgerald, Peter Robinson, Chip Landers, Nancy Offutt, Joseph Paladin. Absent were: Terry Torres, Al Minner, Jason Nunemaker, Brian Curley, Debb Branwell, Honey Minuse, Frank Watanabe, Dan McIntyre, Robert Bradshaw. Guest: Kirk Sorenson Ms. Mitchell reviewed the schedule as follows: Dec. 18, meeting at IRNB to review the draft report; Jan. 8, final report on draft and vote on recommendations, Jan. 22, meeting with County Commission to present report and recommendations. Sorenson Report: Ms. Offutt noted that Dr. Sorenson was available to review and comment on any subcommittee reports if needed. Dr. Sorenson stated his report is part of the overall report as he represents the Builders. He said he reviews documented costs, fees, local conditions and more. Some places have reductions in fees while others move up but that fees must be consistent with each other. Costs are uniform within the study residential and commercial. The economic component is different and reflects what the cost will be for a family to afford a home and a business person to afford new commercial construction. He stated there is a misconception that impact fees impacts only those moving to an area when, in fact, it impacts those already living in an area who hope to buy a home or build a business. Sorenson stated we do not want the Commissioners to adopt any report which is flawed as that would mean they accept those findings. The committee may determine to recommend not to accept the Duncan report and not to change fees from their current rates then the info we provide should be clear in content so Duncan might ask further questions resulting in appropriate changes/corrections to their document. He stated each of the report sections will be reviewed and reported upon in a clear manner so that this might take place. Where we should end is with a report with accurate figures and recommendations based on good material. Transportation recommendations based on Tindale Oliver only reflects numbers that are too high. Sorenson stated he has worked in many different counties and has never seen lane mile costs as high as reflected in this report. He stated figures such as $2.1 or $2.2 million per lane mile more accurately reflects actual costs. He said this does include acquisition fees for right of way in the other counties he has studied. He noted figures should also reflect new construction vs reconstruction and appropriate adjustments should be made for those figures. He stated numbers also probably included state road projects. If funded incrementally, the percentage should be demonstrated so not to appear all is funded with county impact fees or gas taxes. A report should also remove the credits and remove the traffic on state roads. If the road is not being constructed with impact fees then the road should not be included in fee calculations. He reported his review and recommendations will be final in time to to this group prior to the next meeting. Ms. Offutt will to the Chamber. He also noted he would not review sections of the report that this task force did not review. INDIAN RIVER COUNTY IMPACT FEE TASK FORCE 43
193 In discussion about the school fees Sorenson stated we should look at historic costs of classrooms and not bringing schools up to par based on the class reduction. A 5-yr work program should provide information based on permanence of classrooms not portables. That deficit can not be charged to impact fees. Sorenson stated he looks back at the work a consultant has done in other places and reviews methodology to see if it remains the same. If there are changes, they will become part of his report. School projections may be inaccurate but never the less, accepted. It was noted that Terry Torres was going to look into how they paid for roads in Jacksonville. Mr. Keating noted some road costs are now decreasing and are coming in under engineering cost estimates because circumstances have changed. He stated staff wants the best information used in the report and recommendations. Sorenson noted that decreased demand will indicate no legitimate demand for impact fees. Quantifying the Numbers: Mr. Bieber provided his report on Quantifying the Numbers. His overview looked at the viability of residents in varying wage structures purchasing a home. It was pointed out his figures do not include water and sewer costs which are significant. He used current figures only and used the same $225 per square foot construction cost as used by Duncan. Realistic figures on construction would be $280-$300 per square foot, There was discussion about commercial property current rental rates being so low the practicality of construction was made impossible. On a conservative level, low end 100% leased is not breaking even today. Mr. Paladin noted that he and other builders are selling product at much reduced costs and that the same homes can not be built for the same price. People are cutting their losses. Mr. Bieber will adjust his report with some new real numbers to demonstrate the difference between the report and reality. Kleinsteiver: It was decided that Wayne Kleinsteiver will be asked to be part of the final presentation to the County. Ms. Offutt will the Sorenson report. Mr. Bieber will his final report copy. Next meeting: December 18 at IRNB, 3:00 p.m. INDIAN RIVER COUNTY IMPACT FEE TASK FORCE 44
194 Impact Fee Task Force Minutes December 18, :00 PM Location: Indian River National Bank, Board Room, Vero Beach Facilitators: Penny Chandler, IRC Chamber and Beth Mitchell, SRA Chamber Ms. Chandler called the meeting to order at 3:10pm. The following people were in attendance: Frank Watanabe, Don Wright, Cheri Fitzgerald, Chip Landers, Peter Robinson, Chuck Mechling, Dan McIntyre, Chris Bieber, Jason Nunemaker, Terry Torres Absent were Al Minner, Honey Minuse, Debb Branwell, Brian Curley, Joseph Paladin, Nancy Offutt Ms Chandler discussed the information provided by Nancy Offutt, and Kirk Sorenson. They were unable to attend today s meeting because they were appearing at the Martin County Commission meeting on the Impact Fee issue there. Mr. Sorenson has provided his report on Indian River County Impact Fees and it will be e- mailed to all members with the minutes. Chris Bieber reported that he had made adjustments to his report, and the focus was on the economic impacts of raising the fees, he analyzed the increased costs versus the current economic viability of our county. There was a discussion on whether or not to compare the numbers, as provided by Duncan report, or to add the costs of sewer and water to a project, which were not included in the Duncan report. Also mentioned was the actually construction costs, and Chris explained that he wanted analysis to match the Duncan report, which used $225/ft. Chuck Mechling offered that the real costs of construction were more realistically $ 280/$300/ft. Chris will consider adding that information to his report. Penny reported that Wayne Kleinstiver will not be available for a presentation to the County Commission on Jan. 22 if it is scheduled. She asked Terry Torres to contact Wayne to see if they could work something out for a presentation. Peter Robinson provided a two page report with a number of issues that he felt the Task Force should be researching. His report will be sent via so that it can be included in the Draft Report to the Commissioners. He offered that an option to the impact fees could be bond issue to help pay for infrastructure improvements, which would be tax deductible for the county s property owners. He further discussed the issue of a seven year time frame for impact fees to be spent, which is included in the County s ordinance for impact fees. He also would like to see research on what other counties are doing, and how they are financing their projects. At this time in the meeting a draft report to the commissioners, prepared by Ms. Chandler and Ms. Mitchell was circulated to the Task Force members. Suggestions were made that the Final recommendations be inserted in the front of the report in an Executive Summary format. Further discussion included the methods to reach final consensus on the recommendations. The final discussion on recommendations will be held on January 8, 2008, and either Penny or Beth will schedule an agenda item for the Commissioners on January 22, 2008, if possible. Every member present agreed that there would be a final vote on each sub section, and then further consideration of issue that have been brought forth through the ongoing discussions, i.e.: Terry Torres memorandum. It will be important for all Task Force members to be present at this final meeting on the 8 th so INDIAN RIVER COUNTY IMPACT FEE TASK FORCE 45
195 that all opinions may be considered. It was agreed that the majority vote on each issue will be presented to the Commissioners. The Draft report will be sent electronically, in PDF format, to the County staff prior to the holiday, as was originally decided in November. Further discussion included comments about the Task Force, and whether or not the issues would be closed out, or if the Task Force should continue meeting to participate in discussions with the County. There was a consensus that the Task Force would be productive if it met on a quarterly basis in the future. There being no further discussion the meeting was adjourned at 4:30 p.m. INDIAN RIVER COUNTY IMPACT FEE TASK FORCE 46
196 Impact Fee Task Force Minutes Jan. 8, 2008 Location: Indian River National Bank, Board Room, Vero Beach, Florida Attendees: Frank Watanabe, Don Wright, Cheri Fitzgerald, Chip Landers, Peter Robinson, Chuck Mechling, Dan McIntyre, Chris Bieber, Jason Nunemaker, Terry Torres, Honey Minuses, Joseph Paladin, Nancy Offutt, Robert Keating, Joe Baird Absent were: Al Minner, Brian Curley, Robert Bradshaw, Debb Branwell Facilitators: Penny Chandler and Beth Mitchell Ms. Chandler called the meeting to order at 3:30pm. Handouts to task force members included the agenda for the meeting, and a proposed resolution from St. Lucie County, referencing the exemption of impact fees for economic development purposes. Also handed out was a printout of the most updated version of the draft Impact Fee Task Force Report and Recommendations. A brief discussion was held on the legality of the St. Lucie resolution. Ms. Chandler then reviewed the process of reviewing and voting on each of the subsections of the Report. The procedure, which had been determined early in the Task Force meetings, was that the Sub Committee Reports would be included in the final report, and that the entire Task Force would vote on each recommendation, as a whole. Traffic/Transportation was the first sub-committee report to be discussed. Bob Keating requested clarification on the meaning of part of the recommendation, specifically Synchro and other methods of transportation should be explored prior to adjustment of any fees. A discussion ensued about requesting County staff to look at other software or methodology, a comment was made that Synchro and other software components could be used to revise capacity requirements. Further comments included Mr. Keating and Mr. Baird s concerns about the review process and Joe Baird explained that there had been a year of review. It was mentioned that the report from Kurt Sorenson had just recently been made available to the Task Force, and the subcommittee s recommendations were developed without that input. After more discussion Don Wright suggested that the recommendation be amended to read There was a consensus that the Commission should keep the current rate for impact fees. A motion was made by Joe Paladin seconded by Chip Landers that for transportation the recommendation to the Commission be to keep the current rate for impact fees. The recommendation was put to a vote, and the motion was passed with all ayes, except one abstention from Cheri Fitzgerald. The next sub committee report to be considered was the school report. After some discussion, including comments that the consultant had suggested a new method of calculating fees, a motion was made by Don Wright and Terry Torres that the recommendation would be consistent with the recommendation from Traffic Sub committee. The recommendation was amended to read There was a consensus that the Commission should keep the current rate for impact fees. The motion was then put to a vote, and the motion passed with all ayes, except one abstention from Cheri Fitzgerald. At this time there were comments about the voting procedure, and Ms. Chandler explained that early on in our meetings, it was agreed by everyone that members of the Task Force who were employed by municipalities were not required to vote on the recommendations of the Task Force. INDIAN RIVER COUNTY IMPACT FEE TASK FORCE 47
197 The Parks Sub Section was then reviewed, and a motion was made by Nancy Offutt seconded by Joe Paladin to recommend There was a consensus that the Commission should keep the current rate for impact fees. The recommendation was then put to a vote, and the motion passed with all ayes, except one abstention from Cheri Fitzgerald. The next sub committee report to be considered was the Library report. Again, to remain consistent, the motion was made by Joe Paladin seconded by Chuck Mechling to recommend There was a consensus that the Commission should keep the current rate for impact fees. The motion passed with all ayes, except two abstentions from Cheri Fitzgerald and Bob Keating. The Law Enforcement report was then discussed and there were mixed comments about the sub-committee recommendation. Several members did not agree with the recommendation. Ms. Minuse then commented that on behalf of the IRNA, she would be preparing a final report separately. A motion was made by Nancy Offutt seconded by Terry Torres to not accept the recommendation and more discussion was held. Jason Nunemaker commented that since the increases in both fire and law enforcement were not substantial, and that they directly related to core services to the public he agreed with the initial recommendation. Terry Torres commented that he felt the impact fees for law enforcement and fire were substantial and not equitably applied to non residential projects. Further comments were made, and Joe Baird mentioned that the outcome of the tax reform issue at the end of January may determine whether levels of service in a number of categories would be reduced. Since the impact fees could only be used for capital improvements, and that operating revenue may be reduced, there may not be a need to increase the impact fees. It was again pointed out that there had been no review of the Sorenson report to aid in the discussion. The question was called, and the motion to NOT accept the recommendation failed by a vote of four to six. Another motion was made by Don Wright to accept the final recommendation from the sub committee, The recommendation is to accept the consultants report and increase fees accordingly. This motion passed by a vote of six to four. The Task Force then received an updated report from Chris Bieber regarding the Economic Development Impact of Increased Impact Fees. Chris s recommendation was read to the Task Force, and on a motion by Peter Robinson and Don Wright it was to put to a vote. The motion passed with all ayes, except two abstentions from Cheri Fitzgerald and Bob Keating. Ms Chandler then asked the Task Force if there were any additional personal opinions that Task Force members wanted to have included in the final report. Honey Minuse indicated that she would provide a personal opinion to be included in the report. A discussion continued on the Sorenson report, and there was a consensus that the report should not be attached to the Task Force Report, because the Task Force did not have an opportunity to review or discuss it. It was agreed that it could be taken up in the future if the Task Force continued meeting. Ms. Minuse suggested perhaps there should be discussion between the two consultant firms of Duncan & Associates and Sorenson. Ms. Offutt stated the Sorenson report was intended to be used as a resource but for the sake of this task force, should go separately. At this time Don Wright requested that the Task Force come up with an overall recommendation to the County Commissioners, and moved that it should be The County Commissioners should not consider any increase to impact fees. Terry Torres seconded the motion, and the motion passed nine to two, with two abstentions. INDIAN RIVER COUNTY IMPACT FEE TASK FORCE 48
198 The Executive Summary will include the updated report of Chris Bieber. Mr. Baird agreed to place the Impact Fee Task Force on the agenda for the Jan. 22 meeting under Presentations, and explained that the final Report should be delivered to the Administrator s office by the 16 th. One last item for discussion was the letter regarding the issues between the school board and the county commission. Mr. Baird explained that he sent it to Ms. Chandler because he wanted the Task Force to be aware of his position. It was stated that the Task Force was not a part of that issue, and Mr. Baird agreed. Ms. Offutt stated when the School Board made the request to consider impact fees, the economy was very different. There being no further discussion the meeting was adjourned at 5:15pm. NOTE: For the record it should be noted that since he is not a task force member but an invited guest, Mr. Baird did not vote on any of the recommendations. INDIAN RIVER COUNTY IMPACT FEE TASK FORCE 49
199 Articles, Publications, Reports The Impact Fee Task Force also distributed and considered articles and other publications pertinent to the subject of impact fees including: Duncan Associates July 2007 Impact Fee Update Indian River County, Florida; Technical Memorandum #3 (Revised) Indian River County, Florida Impact Fee Ordinance Impact Fee Update Indian River County, Florida; September 11, 2007 Presentation 2006 Florida Impact Fee Task Force report Indian River County Library, Master Facilities Plan, Wall Street Journal; November 21, 2007; Rising Use of 'Impact' Fees Rankles New-Home Buyers, Kris Hudson News Journal Online News, West Volusia; November 24, 2007; Volusia Says No to Impact Fees, James Miller Indian River County Impact Fee Analysis, Kirk Sorenson, Financial Economist, Government Solutions St. Lucie County Impact Fee Ordinance INDIAN RIVER COUNTY IMPACT FEE TASK FORCE 50
200 Correspondence 1. Copies of letters and memorandums as sent to or by the Task Force follow. 2. The schools section of the report was considered by a task force sub-committee. The report and determination from the School Board is not part of the task force findings but is a separate document. Their letter from the School Board to the task force is included in our final report as is the letter received by the task force from the County Administrator in regard to the School Board determination. INDIAN RIVER COUNTY IMPACT FEE TASK FORCE 51
201 July 31, 2007 The Indian River County and Sebastian River Area Chambers of Commerce are initiating and facilitating an Impact Fee Committee. Your organization is included in a broad based group being invited to participate on the Committee. We are requesting that your organization designate a person who will serve as your representative. In July, the Commissioner voted NOT to adopt a draft resolution to assemble an Impact Fee Committee under the auspices of the County but, instead, asked that this be done by the Chambers. As a result, this is not a Sunshine Law committee. We plan to hold regularly scheduled meetings beginning on Tuesday, August 28 th and every other Tuesday thereafter at 3:30 p.m. at the Indian River County Chamber building. We expect to function for about six months. The committee will review and make recommendations to the County Commission in regard to the recent impact fee report and recommendations set forth by Duncan & Associates as commissioned by the County. As resources, the County Community Development and Duncan & Associates will work with us. Community Development will also work with us to schedule workshops. For your information, we have identified the groups on the next page to participate in this committee. Also, the dates of all meetings are also named for your convenience. Please fill out the attached form and fax that back to us by Friday, August 17 th as your confirmation of participation. For the sake of continuity, we ask that who you select can commit and will not send alternates to meetings. Thanks in advance for your interest in this committee and task. Sincerely, Penny Chandler President Indian River County Chamber Beth Mitchell Executive Director Sebastian River Area Chamber INDIAN RIVER COUNTY IMPACT FEE TASK FORCE 52
202 INVITED PARTICIPANT GROUPS Indian River County Chamber of Commerce one representative Indian River County Economic Development Council one representative Indian River County School Board one representative Indian River Neighborhood Association one representative Certified Traffic Engineer (Current Certification) - one person Commercial Banking one person County government (elected or staff; their choice; non-voting member) one person Each municipality (elected or staff, their choice; voting member) one person Realtors Association of Indian River County- one commercial & one residential broker Sebastian River Area Chamber of Commerce one representative Treasure Coast Builders Association one representative Growth Awareness Committee- one representative August 28 September 11 September 25 October 9 October 23 November 6 November 20 December 4 December 18 DATES OF MEETNGS Tuesdays at 3:30 p.m. at the Indian River County Chamber INDIAN RIVER COUNTY IMPACT FEE TASK FORCE 53
203 CONFIRMATION IMPACT FEE COMMITTEE Organization: Name of Representative: Address: City: Zip: Phone: Address: Please note: we will be using as the primary delivery method for meeting notices, minutes, materials or other information. We will appreciate your RSVP no later than Friday, August 17 th by faxing this confirmation form to INDIAN RIVER COUNTY IMPACT FEE TASK FORCE 54
204 DATE: October 16, 2007 TO: FROM: RE: Board of County Commissioners Beth Mitchell, Penny Chandler Impact Fee Task Force On June 29, 2007 your agenda included a county memo to establish an impact fee task force. That day you decided that the Indian River County and Sebastian River Area Chambers of Commerce would initiate and facilitate an Impact Fee Task Force. The group organized by the chambers for this task force include: Maria Aguilar, Town Manager, representing the Town of Orchid Chris Bieber, representing Commercial Banking, Indian River National Bank Andy Bowler, representing affordable housing, Habitat For Humanity Robert Bradshaw, Town Manager, representing the Town of Indian River Shores Brian Curley, representing a Commercial Developer, P & S Properties Cheri Fitzgerald, City of Vero Beach Planning Office, representing the City of Vero Beach Robert Keating, Indian River County Community Development, representing Indian River County government Chip Landers, residential broker representing the Realtors Association of Indian River County, The Professionals Realty Dr. Dan McIntyre, representing the Indian River County School Board Chuck Mechling, representing the India River County Chamber, Pointe West Al Minner, City Manager, City of Sebastian Honey Minuse, representing the Indian River Neighborhood Association Jason Nunemaker, City Manager, City of Fellsmere Nancy Offutt, representing the Treasure Coast Builders Association Joseph Paladin, representing the Growth Awareness Committee Peter Robinson, representing the Indian River County Economic Development Council, Laurel Homes Terry Torres, commercial broker representing the Realtors Association of Indian River County, Bird Realty Group Don Wright, representing the Sebastian River Area Chamber of Commerce Frank Watanabe, a Certified Traffic Engineer employed by Neel-Schaffer INDIAN RIVER COUNTY IMPACT FEE TASK FORCE 55
205 We have held 4 meetings to date beginning on Tuesday, August 28. We meet every other week and so far have had presentations by Duncan Associates, and County Staff members Bob Keating, Jason Brown and Joe Baird. It appears we may meet through November 2007 or about six months. The task force has broken into sub-committees that are in the process of reviewing each section of the July 2007 Duncan Associates impact fee study and recommendations as was commissioned by the County. Our plan is to review each of those sections of the report, gather additional data where needed, analyze our findings and develop a consensus for our recommendations. At this time, we are looking at November 27, 2007 to return to you with the final report and the recommendations of the task force. INDIAN RIVER COUNTY IMPACT FEE TASK FORCE 56
206 DATE: November 1, 2007 TO: CC: FROM: RE: County Commissioners Joe Baird, County Administrator Penny Chandler, Indian River County Chamber of Commerce Beth Mitchell, Sebastian River Area Chamber of Commerce Impact Fee Task Force Update This is to inform you that the Impact Fee Task Force is now meeting weekly in an effort to address all sections of the Duncan impact fee study recommendations, come to consensus and develop the final recommendations we bring forth to the Commission. We are cognizant that the coming holiday season will play a role in how quickly our final report will be completed as well as our ability to provide you a presentation from the task force of the final report and its recommendations. At this time, we plan to complete a draft by the end of November and provide that draft to staff for their review and comment. We anticipate that our final document with recommendations will be completed in December and a report made to the Commission in early January If you have any questions or comments, please feel free to cal either of us at your convenience. INDIAN RIVER COUNTY IMPACT FEE TASK FORCE 57
207 INDIAN RIVER COUNTY IMPACT FEE TASK FORCE 58
208 INDIAN RIVER COUNTY IMPACT FEE TASK FORCE 59
209 INDIAN RIVER COUNTY IMPACT FEE TASK FORCE 60

210 DRAFT Indian River County Impact Fees Analysis (Note: This analysis is based on the Final Duncan & Associates TIF Update dated July, 2007) Indian River County, Florida January 16, 2008 Prepared For Treasure Coast Builders Association Prepared By GOVERNMENT SOLUTIONS Kirk Sorenson, Ph.D., Financial Economist Economic and Fiscal Planning 5596 SE Lamay Dr. Stuart, FL (772) Cell: (561) Fax (772)
211 1 - Executive Summary - Executive Summary Government Solutions (GS) has conducted a comprehensive evaluation of the proposed 2007 Indian River County Impact Fee Update Study (Update), prepared by Duncan & Associates (DA), Incorporated and provides the following alternative transportation impact fee report. The Government Solutions Analysis (GS Analysis) identifies several concerns with the proposed 2007 Indian River County Impact Fee Update. County staff met with representatives of the Treasure Coast Builders Association and Duncan & Associates to review the Update in an attempt to clarify several data components and assumptions of the DA report. In general, impact fees are one-time payments that may be assessed by a jurisdiction to offset costs to the County associated with providing necessary public infrastructure. The County s impact fee methodology should also identify the extent to which newly developed properties are entitled to various types of revenue credits to avoid potential double payment of capital costs. The following are overarching legal principles for the calculation of impact fees that should guide the selection of data, the parameters and assumptions contained in any impact fee model, and the assessment of impact fees as part of both the County s Capital Improvement Plan and Capital Improvement Element of the Comprehensive plan are: (1) State law requires that Indian River County s impact fee program should proportionately fund the infrastructure needs created by new development according to the philosophy that growth should pay its fair share. This principle is codified in State Statutes and is an adopted objective and policy in the County s Comprehensive Plan. IRC Draft Impact Fee Analysis 2
212 (2) State law requires that impact fees be calculated based upon the most recent and localized data available. (3) Impact Fees can only be used to pay for capacity projects needed by new growth; this excludes replacing existing capacity, funding deficiencies in capacity, and paying for non-capacity related improvements such as sidewalks, landscaping, lighting, drainage facilities, curb and gutter, bike lanes and the like, that have a shared benefit to the community at large and not the mandated special benefit imposed by the Court doctrine known as the dual rational nexus test. Determining a proportionate impact fee requires understanding the complexities of community financing and usually involves determining the following: o the cost of existing facilities; o the means by which existing facilities have been financed; o the extent to which new development has already contributed, through tax assessments, to the cost of providing existing capacity; o the extent to which new development will, in the future, contribute to the cost of constructing new and existing facilities used by everyone in the community or by people who do not occupy the new development (i.e. by paying taxes in the future to pay off bonds used to build those facilities in the past); o the time-price differential inherent in fair comparisons of amounts paid at different times. The subsequent text and tables describes the data sources used in the GS analysis and the calculation steps taken to arrive at the proposed alternative impact fee calculations and the revised impact fee schedule. The methodology used by DA has remained substantially the same in the GS analysis. The recommended fee schedule adjustments are not due to methodological changes but rather reflect the most accurate and current data available. In addition, some assumptions were changed based on industry standards and localized conditions in Indian River County. IRC Draft Impact Fee Analysis 3
213 Economic Impact Indian River County s economy is similar to many emerging rural Florida communities in that the County s economic prosperity is largely based on the building industry and its ability to offer affordable housing. Higher housing costs due to impact fees will have a negative effect on the building industry s ability to market affordable housing for several key employment sectors in IRC, such as health care, education, and public safety. The County s future fiscal and economic health will be driven by existing market conditions as well as the regulatory cost of doing business in the County. The community will experience a degree of fiscal stress as the government places additional regulatory taxes and fees on the cost of new and expanding residential dwelling units and commercial enterprises, particularly small local business and healthcare services interested in establishing a presence in Indian River County. The provision of affordable housing is critical in many communities throughout Florida. Table 1.1 shows that over 63% of the families living in IRC would have to dedicate more than 79% of their annual net income to the payment of the proposed DA impact fees. Families earning less than $30,000 would have to allocate over 90% of their annual salary toward impact fees before they could realize the Great American Dream of owning their own home. With a nominal interest rate of 7% over a typical 30-year mortgage, a homeowner would be required to pay more than $150 per month to cover the added cost of the DA impact fees. Essentially, the DA impact fees would eliminate a significant number of Indian River County s families from the housing market as the price of new homes increase and existing home values rise due to the capitalization of the proposed fees into the existing residential market. This dramatic increase in regulatory costs does not include the other existing utility assessments of over $10,000 per home. With mortgage or home rental IRC Draft Impact Fee Analysis 4
214 increases of $150 to $200 per month it is estimated that over 7,000 Indian River County families will be unable to continue their residence in the County. The additional fiscal stress of impact fees on families in IR County would force many families to continue renting homes and require many others, having outgrown their existing homes, but unable to purchase a new home due to higher housing cost, in part, resulting from potentially overstated impact fees. The future fiscal impact imposed on new business considering locating in IRC and existing business planning to expand, is considerable under the proposed DA impact fee schedule. Impact fees are most harmful to the small business and the startup company, often owned and managed by long-term county residents. These companies not only employ local workers but reinvest their earnings back into IRC. The large corporate chain type stores (i.e. Wal-Mart, CVS, 7-Eleven) would most likely locate in municipalities which offered lower upfront investment costs, as high upfront investment costs may take many years to recoup. Although, if any commercial growth does occurs in IRC, it will most likely be the chain stores, whose corporate resources may allow for little or no profit during the initial years of operation and earnings are diverted to other regions of the Country. Without adequate economic growth and diversity, the County will experience stagnation, high unemployment, more and longer travel demands, less affordable housing, and a higher cost of living. IRC Draft Impact Fee Analysis 5

215 Table 1.1 Median Family Income Allocation to DA Proposed Impact Fee Schedule Source: 2005 US Census Projection
216 2 Traffic Impact Fees The primary flaw identified in the DA Update involves the significant overstatement of lane mile cost by including non-capacity cost factors within the lane-mile costs. There is also empirical evidence indicating that the residential trip rates used in the Update are overstated by 15% based on the Indian River County s unique demographic characteristics consisting of a large contingency of mature drivers, whose trip rates and lengths are less than national averages used by DA. Table 2.1 below provides a summary of the key issues and concerns noted in the DA Update and further discussed in this Analysis. DA should prepare a written reply to each of these concerns so the BOCC and the public can better ascertain the assumptions and data validity of the DA Update. These issues primarily relates to the legal requirement that only new development s proportionate share of the capacity generating transportation infrastructure cost should be assessed an impact fee based on the need and benefit of the planned capital improvements. In summary, the GS Analysis concludes with a revised traffic impact fee schedule based on the same land use categories reflected in the DA Update. The data components used by DA and GS during these summary calculations are also provided in this section. The fees reflected in Table 2.2 represent a sample of several non-residential impact fees based on the typical building size of various business types located in Indian River County. It is important to note that the GS alternative calculations would provide a realistic fee schedule based on the existing trip characteristics, roadway cost data, and other revenue sources available to IRC.
217 Based on the DA TIF recommendations, the following examples were extracted 1. A typical 10,000 sq.ft. small retail store will exceed $155, A 5,000 sq. ft. convenience store will exceed $831,000 and a typical 4K sq. ft. bank will exceed more than $208,000. Table 2.3 shows an impact fee comparison for a typical sample of businesses and residential units for IRC and other Florida Counties. This table reflects the significant disparity in fees, and may render Indian River County unable to compete for new businesses to grow its economy in a competitive manner. This will interfere with the recovery of the construction industry, the primary industry in Indian River County. Other county revenue sources will also decline (i.e. sales tax, permit fees, revenue sharing, gas taxes and impact fees) which will compound the existing fiscal stress experienced by IR County jurisdictions. IRC Draft Impact Fee Analysis 8
218 Program Area Roads TIF Concern Summary Road costs are overstated by excluding current local cost data and including 100% of the state road costs as the bases for the estimated lane mile cost component. State road cost should be excluded since impact fees generally do not fund these roadways. State road construction costs are typically higher than county roads due primarily to a higher level of design standards and a need to maintain traffic capacity. Where roadway widening and reconstruction occurs the cost per lane mile should include the total lane miles to account for replacing existing road capacity and non-capacity roadway improvements. DA allocates all reconstruction and non-capacity improvements to new development, which results in an overstated and disproportionate new lane-mile cost estimate. Trip length data includes travel on local, state, and interstate roads, which are not funded with impact fees. The trip length should be reduced to account for travel on this type of roadway. DA should reduce the trip length by 26% due to travel on non-impact fee funded roadways. Table 2.1 Key Concerns in DA TIF Update Table 2.2 below provides the projected impact fees for typical non-residential land use designations in IRC. These non-residential impact fee increases will surely have a depressing effect on the local economy. IRC Draft Impact Fee Analysis 9
 is than multiplied by the estimated area. Table 2.")
219 Notes: Unit/Area column reflects estimated area for each type of land use. This is multiplied by 1,000 sq.ft. to total area per land use. The impact fees (per 1,000 sq. ft.) is than multiplied by the estimated area. Table 2.2 TIF Comparisons of Select Non-Residential Land Use Categories
220 Table 2.3 Traffic Impact Fee in Florida Counties 11
221 Transportation Costs Government Solutions examined the construction costs associated with county roads with respect to transportation capacity improvements. For this purpose, the County s 2007/08 Transportation Improvement Program (TIP) and supplementary data from the County s Engineering Department and previous actual cost records should be used to identify and provide supporting cost data for roadway improvements. The average cost of new roadway capacity is commonly expressed as a cost per new lane-mile. As the name implies, the number of new lane-miles added by a roadway improvement can be calculated by multiplying the number of new lanes times the length of the roadway improvement in miles. The cost is then divided by the total number of lane-miles constructed to determine the cost per lane-mile. While the cost per lane-mile will differ depending on the nature of each project, the average cost derived from recently completed roadway improvements provides the best available indicator of road improvement costs in Indian River County. The DA Update used planned roadway improvements reflected in the County s 2030 Plan. While the above description accurately describes how IR County s approach calculates the cost per lane-mile for a new road, a more accurate approach should be used for widening projects, which constitutes many of the County s capacity-expanding road projects. In the case of widening projects, the cost per lane-mile is determined by dividing the total improvement cost by the total number of lane-miles of improved roadway, rather than by only the new lane-miles added by the improvement. Thus, a $4 million project to widen one mile of roadway from 2 to 4 lanes is projected to cost $1 million per improved lane-mile, instead of $2 million per new lane-mile, as calculated in the DA Update. The County should elect to use the total lane-miles when calculating the lane-mile cost in the Impact Fee Update to ensure new development pays only their proportionate share. This practice is common throughout the state of Florida. 12

222 Figure 2.1 shows a typical 2-lane road prior to a 4-lane widening road improvement project. During typical road widening projects the County purchases additional ROW, demolishes existing roadways, and constructs replacement lanes and new lanes. The County has adopted new road improvement standards that include adding storm water systems, medians with landscaping, and bicycle and pedestrian pathways. Figure Lane Prior to Widening Figure 2.2 shows a typical 4-lane road widening project with 100 feet of right-of-way and 88 feet of ROW. The DA impact fee update suggests that all associated widening costs should be captured in the cost of a new lane. This assumption is economically unstable and will ultimately increase the estimated cost of future new lane miles by 75% to 100%. The cost of a new lane-mile should not include the cost of replacing existing roadways and the entire cost of any non-capacity improvements during roadway widening projects. 13

223 Similarly, the cost of resurfacing and/or replacing existing roadway (without expanding capacity) is not eligible for impact fee funding and therefore are not be included in impact fee calculations. Figure Lane Road Widening Project 14

224 DA used a combination of FDOT, County, and City road improvement projects to calculate the weighted new lane-mile cost. The DA selected county road improvement projects estimated that a new road lane-mile cost of $2 million while the widening road cost is estimated by DA to be over $3.5 million per new lane mile. The road widening project added the reconstruction and non-capacity improvement into the cost of a new lane-mile. In addition to replacing existing lanes when roads are widened, other non-capacity improvements also take place such as utility improvements, bike lanes, sidewalks, landscaping, and decorative lighting, which benefits both new and existing development and should be funded in proportion by impact fees and general or special revenues. To compensate for this additional cost and to ensure that new development pays a pro rata and fair share transportation impact fee, the total lane-miles should be used to calculate the lane-mile cost. To remain conservative, GS used a reconstruction factor of 75% to ensure the lane-mile cost remain proportionate. Source: Table 2.4 FDOT Estimated Lane Mile Costs 15
225 Appendix 2 of this Analysis provides the detailed estimated 2006 FDOT lane-mile costs. Table 2.4 summarizes the FDOT estimated lane-mile cost based on typical roadways found in IR County. The average county rural new lane-mile cost ranges $946,000 while the average urban lane-mile cost approximately $1,600,000. The DA Update recommends a lane-mile construction cost of over $3.6 million for county roadways or over 100% greater than the FDOT recommended estimates. The GS weighted lane-mile construction cost is estimated at less than $2.1 million if only the new roadways projects reflected in the Cost Feasible Plan were used to calculate the new lane-mile cost. A comparison of roadway costs in several Florida jurisdictions is provided in Table 2.5. The DA proposed cost to construct one lane-mile in IR County is $3.9 million compared to the average cost of $1.58 million. Highly urbanized jurisdictions, such as Orlando and Palm Beach County, where ROW and construction expenditures are anticipated to be high, actually cost only 30% to 40% of the proposed DA lane mile costs. In other words, DA is suggesting that it cost over twice as much to build a road in IR County than it does in Orange County. Considering the geographic and demographic characteristics of IR County, the GS alternative impact fee analysis proposes a $2.3 million lane-mile cost, based on a preliminary analysis, which is higher than the average state costs. 16

226 Table 2.5 Lane-Mile Costs in Florida Jurisdictions Table 2.6 below provides a summary of the lane-mile cost based on total lane miles and total roadway improvements. The DA Update included several road construction projects that not only added new lane miles but reconstructed existing lanes and made non-capacity improvements which were inappropriately included as a cost component of a new lane-mile. 17
 with a calculated lane-mile cost of $2.08 million.")
227 Table 2.6 IRC Lane-Mile Cost Tables 2.7 and 2.8 provide the planned road projects used to calculate the DA lanemile costs. The GS Analysis reviewed the lane-mile cost of only new roads (less outlier) with a calculated lane-mile cost of $2.08 million. A non-capacity and reconstruction factor of 75% was used to increase the total miles and reduce the lane-mile cost. This factor was applied due to the capacity added to each expansion road project (see Table 2.8). Table 2.7 Weighted Average Cost per Lane-Mile 18

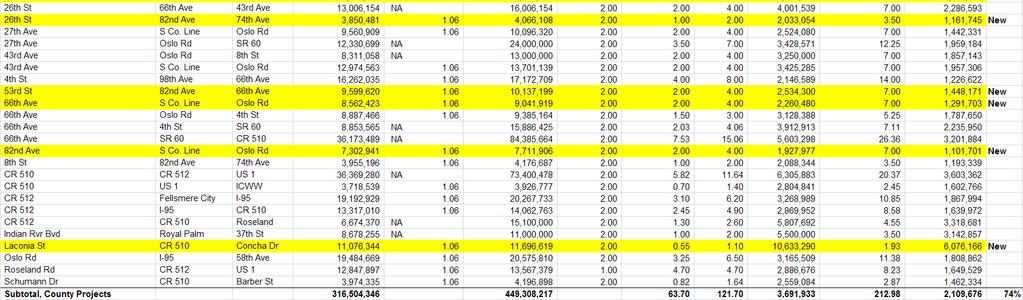
228 Table 2.8 Planned Improvement Costs 19


229 Table 2.9 Capacity Added by Planned Road Projects 20


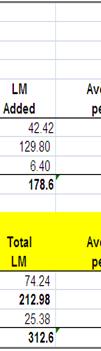
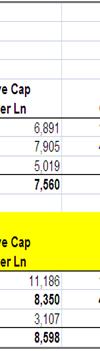
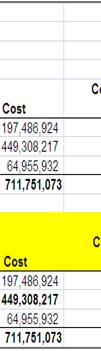
230 Table 2.10 Road Cost per Vehicle Mile 21
231 Table 2.10 provides the calculated cost per vehicle mile, which is a function of the total road project costs and the total added capacity. Trip Characteristics The DA Update uses trip rate characteristic data obtained primarily from the Institute of Transportation Engineers (ITE) Trip Generation Reference Handbook (7th edition). This database is widely used by communities throughout Florida and provides reasonably accurate estimates of trip rate volume by specific land uses. The trip rate volume based on the land use categories provided in the DA Update is acceptable and has not been modified in the GS Analysis. Revenue Credit In order to avoid overcharging development for the various impact fees, a review of the capital financing program for public facilities was completed. The purpose of this review was to determine any potential revenue credits that should be considered for revenues generated by new development that could be used for road construction, land, and design requirements. 1. The County must evaluate the revenue credit that each unit of new development generates and could be used to fund new capital facilities (i.e. gas tax, sales tax, etc.). At the time of this report we have not reviewed specific capital improvement data at the project level to validate the appropriations of local and state revenue sources. 2. The present value of these revenues per unit of land use that historically have been used or projected in the future to be used for capital facility expansion is subtracted from the cost per unit of land use of providing capital expansion facilities (i.e., the revenue credit). 3. The revenue credit ensures that new development does not pay more than its proportionate share of future capital costs. When calculating impact fee credits it is important to consider any funds that have been available in the past to pay part of infrastructure costs and can be expected to be 22

232 available in the future. While the exact availability in the future cannot be known, it is accepted herein that funds will be available in the future as they have been in the recent past. Many jurisdictions attempt to overstate impact fee assessments by simply suggesting these revenue sources will no long be used to fund new capacity. Without a documented historical record of this fiscal policy, there should be no artificial reduction in the availability of non-impact fee revenues used for capacity projects. The legal objective of using revenue credits is to shift to new developments no more than a pro rata share of infrastructure costs. How this is achieved for each facility will vary but the goal should be the same for all facilities. The pro rata share principle promotes the proportionality theory by: 1. Ensuring cost are not overstated 2. All credits are applied 3. The demand component is accurate Table 2.11 Road Credits per Vehicle Mile 23
233 The GS Analysis reduced the credits substantially by removing the revenue credits for State roads and Federal roads. The state road credits were removed because the impacts of state roads were reduced in the cost calculations. Other than these changes, DA accurately reflects the total gas tax credit calculations, based on data reviewed as of this date. Traffic Impact Fee Schedule Table 2.12 reflects the revised IR County transportation impact fee schedule. These tables also allow for the understanding of the relative impact of each component that is subject to revision. These tables also provide the combined effect of changed individual components as previously suggested in the text of this analysis. In other words, there is a ripple effect as various costs, credits, and trip characteristic data are adjusted. The GS analysis reduced the revenue credit from.21 to.08; reduces the lane-mile cost from $3.9 million to $2.2 million, and maintained the same trip characteristics. Based on these adjustments, a revised fee schedule is provided in Table It is important to note that the GS schedule is subject to modification should additional validating data become available. 24
234 Intentionally Blank 25


235 DA Proposed Traffic Impact Fee Schedule 26


236 GS Proposed Traffic Impact Fee Schedule Government Solutions Draft IRC IF Analysis 27
237 3 School Impact Fees The GS analysis outlines several concerns with the proposed 2007 DA School Impact Fee (SIF) Update under consideration by the Indian River County Public Schools (IRCPS) and the Indian River County Board of County Commissioners (BOCC). These include: 1. The DA Update used an inadequate sample of school construction projects to estimate the student station (SS) costs. 2. The DA Update understated the available 2-Mill revenue for new capacity based on the IRCPS 5-Year Facility Work Program, which result in an inaccurate future ad valorem revenue credit 3. The Update failed to include the existing use of portable classrooms in the LOS or SS cost calculations. 4. The Update overstated the demand for new student stations by using 2006 enrollment data to project 2011 capacity requirements. Based on the same methodology employed by Duncan and Associates, the Government Solutions Analysis indicates an impact fee substantially less than that recommended in the DA Update. The IRC BOCC may choose to approve the fees at a reduced level of the recommended fee but this action would require the Board to accept a flawed report based on unsubstantiated assumptions and inaccurate data. Until the BOCC is satisfied with the data used in the Update they should not accept the recommendations of the DA School Impact Fee Update. We suggest the Board reject the proposed DA School Impact Fee schedule and recalculate the impact fees based on current and accurate data. This will ensure the County is assessing a fair-share and pro-rata school impact fee based on sound methodology. Staff should review and update the data annually to ensure the impact fees remain current and accurate as the County s demographic and economic conditions change. 28
238 Impact fees are one-time payments that may be assessed by a county to offset costs to the county associated with providing necessary public infrastructure. School impact fees must be proportionate and reasonably related to the capital facility service demands required of new development. In addition, the fee methodology should establish that the fees would substantially benefit new growth. The District s impact fee methodology should also identify the extent to which newly developed properties are entitled to various types of revenue credits to avoid potential double payment of capital costs. The DA Update calculated a total weighted average student station cost of $30,012 while the GS Analysis calculates a weighted average SS cost of $21,227. Due to insufficient school construction data, the GS Analysis review the 2006 FDOE facility cost data for the Treasure Coast school districts. The total plant costs are provided in Table 3.1. The IRC 2007 Facilities Work Program indicates a total weighted SS cost of $25,992, as reflected in Table 3.2. The weighted student station costs are presented in Table 3.3. The GS analysis is calculating the impact fee based on the permanent facility construction cost for each type of student station, as reflected in the FDOE official Cost of Construction reports. The 2007 school construction costs used in the DA Update were based on a small non-representative sample of IRC facility construction project costs of additions and non-traditional facilities. There was no historical cost data to support the MS or HS plant cost projections. Government Solutions Draft IRC IF Analysis 29

239 Table FDOE School Construction Cost Source: Florida Department of Education 30

240 Table IRC Work Program Projected Total Student Station Costs Government Solutions Draft IRC IF Analysis 31

241 Table IRC Weighted Cost per Student Station Government Solutions Draft IRC IF Analysis 32
242 In addition to paying school impact fees, new development is also required to pay for school facilities through its future contributions to other capital funding sources that will be used to pay for expanding school capacity. The impact fees should be reduced by the present value of those future contributions expected to be made over the next 20 to 25 years in order to ensure new development is not charged twice for the same facilities. Credit for future revenues, however, only needs to be given for funds that will be available for capacity-expanding improvements. The District s official Year Facility Work Program was examined to estimate the percent of future capital funding likely to be received by the District that will be available to pay for capacity-expanding improvements. Table 3.4 provides the calculations used in Table 34 of the DA Update. The Update included capacity projects (i.e. COPS proceeds) as a non-capacity expenditure. The revenue available for new capacity is therefore calculated to be 58.62% rather than the DA Updates estimate of 26.94%. This revision will result is a significantly increased future CIT revenue credit. Consequently, the local tax credit is increased from the Updates proposed $10,421 to a revised credit of $22,670. The State revenue credit is also understated due to the use of incorrect projected enrollment data. The DA Update indicates an increase of 4,395 students over the next 5-years while the 2007 WP clearly shows a modest enrollment increase of 2,175. More recent enrollment data will further exasperate the declining enrollment trend. Table 3.6 provided the revised State revenue credit. The DA projected past property credit was unchanged in our analysis. Tables 3.7 and 3.8 provide the net SS cost and the revised impact fee schedule. The GS Analysis used the DA recommended student generation rates to calculate the net SS cost per dwelling unit (Table 3.8). 33
243 The calculations represented in the final two tables reflect three (3) alternatives, each using valid cost and credit data: 1. Uses the revised cost and credit data to calculate an impact fee of ($1,884). 2. Based on revised cost data and the recommended DA credit proposal to calculate a SF DU fee of $1, Based on the DA student station cost and the revised credit calculation to generate an impact fee of $493. The DA proposed fees and the GS calculated school impact fee alternatives are provided in Table 3.8. The GS calculations are based on the use of the current data and existing trends. Each table reflects the updated variables so that the calculated impact fee is a function of the specific variables used in each scenario. Each of the 3.8 tables shows a flat or reduced impact fee when compared to the existing fees. There is no valid and quantifiable data to support an impact fee increase; in fact the data shows that an impact fee reduction is warranted. Government Solutions Draft IRC IF Analysis 34


244 Table WP Capital Improvement Tax (CIT) Revenue Available for New Capacity 35


245 Table 3.5 Capital Improvement Tax Credit Table 3.6 State Revenue Credit 36

246 Table 3.7 Calculated Net Cost per Student Government Solutions Draft IRC IF Analysis 37
247 Table 3.8 Revised School Impact Fee Schedule Government Solutions Draft IRC IF Analysis 38
248 4 Parks Impact Fees The following text indicates that the alternative Parks Impact Fees are substantially lower than that proposed in the DA Update Study. The primary discrepancy observed was the use of permanent population rather than permanent and peak weighted population to determine the level of service standards. This is not consistent with the comprehensive plan and will not constitute a legally defensible parks impact fee assessment. The following comments were provided at the Stakeholders meetings and the BOCC workshops. The building industry is interested in fair and accurate fees base on sound data and analysis. We feel that this study does not meet that threshold and if adopted, as proposed, could not be legally defensible, impose an overstated impact fee on new development, and strain the long-term economic prosperity of the residents of Indian River County. The Commission would never consider imposing a property tax rate based on faulty data. Impact fees, as with all fees and taxes, should be treated in the same way. In a previously impact fee study conducted in 2005, Tindale-Oliver (TOA) was asked to increase the level of service standard to a weighted population level and thereby account for the influx of seasonal residents in IRC during the months of November through March. The level of service standards reflected in the comprehensive plan must be adhered to and if the LOS is changed in the Comprehensive Plan then the subsequent impact fee study would recognize this change. 39


249 Figure 4.1 reflects the legal interpretation, as provided by TOA. New development cannot be expected to correct an existing deficiency created by increasing the LOS in the impact fee study or the comprehensive plan. Figure 4.1 Recognized Stated LOS Standards Table 4.1 below provides the revised 2007 LOS based on a 12% weighted population factor. The weighted unincorporated population is 110,400. Table 4.1 Calculated Weighted Level of Service Government Solutions Draft IRC IF Analysis 40


250 The DA Update failed to use the entire acreage of the North County Regional Park when calculating the landscaping and site improvement costs. The correct site improvement costs are reflected in Table 4.2. Table 4.2 Site Improvement Costs Table 4.3 provides the total park cost per person. The main variable contributing to the GS reduction is the revised LOS based on the weighted peak population, as required in the IRC Comprehensive Plan. Table 4.3 Park Cost per Person Government Solutions Draft IRC IF Analysis 41
251 Table 4.4 and 4.5 reflects the revised parks cost per person and the revised impact fee calculations. The persons per dwelling unit did not change from the DA Update. As a result, the GS alternative parks impact fee assessment increased by 22% since 2005 while the DA proposed fees increased by 70%. Table 4.3 Net Park Cost per Person Government Solutions Draft IRC IF Analysis 42
252 Table 4.4 Parks Impact Fee Schedule 43
253 5 IRC Consolidated Impact Fee Schedule Table 5.1 provides the revised consolidated impact fees recommended by Government Solutions. There were only three impact fee categories adjusted at this time: Traffic, Schools, and Parks. The average GS increase over the 2005 Update is 5% for residential land use categories compared to a 72% increase proposed by Duncan & Associates. 44

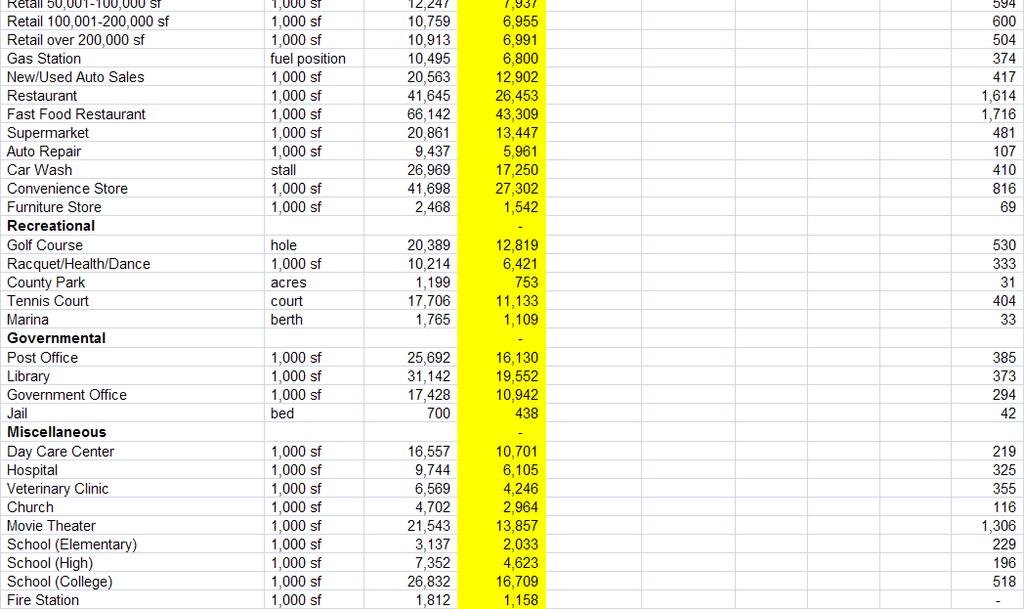
254 Table 5.1 Consolidated Impact Fee Schedule 45


255 Table 5.1 Consolidated Impact Fee Schedule Government Solutions Draft IRC IF Analysis 46


256 Appendix 1 Level of Service This following legal interpretation of how the level of service interfaces with the establishment of impact fee cost was prepared by Freilich, Leitner & Carlisle, in conjunction with Tindale Oliver & Associates and Growth Management Analysts, Inc. for the 2005 Indian River County Impact Fee Study. This text is taken verbatim from the impact fee study. 47
 acres per 1,000 pe-rsoos, it wiu thereby create a gap between what it bas provided to existing development (4 acresfl,ooo persons) and the burden it is asking new development to bear.")
257 If the County wishes to adopt higher LOS in coojunction with tl>e impleme-ntation of its park impact fee, for e.xample~ five (5) acres per 1,000 pe-rsoos, it wiu thereby create a gap between what it bas provided to existing development (4 acresfl,ooo persons) and the burden it is asking new development to bear. This gap is known as an.. existing deficiency: Specif1e1Uy, if the t-'\'ltk imp.:1ct fee is of an amount that,.;u ensure fu ture development is provided with five (5} acres of parkin:! per 1,000 persoos, then the County must budget and pbn for the acquisition of enousb parkland to raise 1he LOS for existing development from four (4} acres to five (5) acres per 1,000 4 S~ f"'..-.mpo>hmsiw Plan Cbapt«1, '1nl:n'141ctory Elanent, - p The LOS for.s<!lid w3ste ud pacts is adopwrd aod sec forth in tbe Com.peOOnsive Plao. Su Cnnxgh;:osiR Plan Cbap. 6, c.apiuij lmprownten.ts EJi'!lllelll.- pp. 2~5. ~I persons. In order ro ensure new development pays no more than its proponion:ue share or partdands, e.xjsting deficiencies must be eliminated through funds other than imp.:tcl fees. Dunedin, 329 So. 2d ot 32 t ("The cost of new f cilities should be borne by new users 10 the extent new use requires new facilities, but only to thai extent... ). Government Solutions Draft IRC IF Analysis 48

258 Government Solutions Draft IRC IF Analysis 49

259 Appendix 2 Florida Department of Transportation Road Construction Cost Estimates State Specifications and Estimates Office Estimates Section Generic Cost Per Mile Models Statewide Average Unit Prices* for Jan December 2006 Disclaimer: These models are generic in nature, and not based on actual construction projects. They are for reference purposes only, and are not intended to predict future costs * Unit prices are based on an algorithm unique to LRE... Government Solutions Draft IRC IF Analysis 50
260 Urban Projects: New Con struction, Undivided, 2 Lane Urban A.rterial New Con struction, Undivided, 3 Lane Urban A.rterial with Center Turn Lane & 4' Bike Lanes New Con struction, Undivided, 4 Lane Urban A.rterial New Con struction, Undivided, 5 Lane Urban A.rterial with Center Turn Lane New Con struction, Divided, 4 Lane Urban Road with 5' Sidew alk New Con struction, Divided, 6 Lane Urban Road with 5' Sidew alk, 4' Bike Lanes New Con struction, Additional Lane for Urban A.rterial New Con struction, Divided, Urban 4 Lane Interstate New Con struction, Divided, Urban 6 Lane Interstate New Con struction, Additional Lane for Urban Interstate Mill & Resurface 2 Lane Urban Road Mill & Resurface 3 Lane Urban Road with Center Turn Lane Mill & Resurface 4 Lane Undivided Urban Road Mill & Resurface 5 Lane Urban Road with Center Turn Lane Mill & Resurface, Divided, 4 Lane Urban Roadway Mill & Resurface, Divided, 6 Lane Urban A.rterial Mill & Resurface.A.dditional Lane Mill & Resurface 4 Lane Urban Interstate with 10' Inside & Outside Shoulders Mill & Resurface 6 Lane Urban Interstate with 10' Inside & Outside Shoulders Widen Ex isting 6 Lane Urban Interstate with 22' Closed Median to 8 Lanes Widen Ex isitng 2 Lane Urban A.rte rial to 4 Lane Divided with 22' Median Widen Ex isting 2 Lanes to 4 Lane Undivided A.rterial Widen Ex isitng 3 Lanes to 5 Lane Undivided A.rterial with Center Turn Lane e ' $ f % ,798,427 2,047,900 1,647,263 1,491,585 2,056,025 1,526,807 2,818,761 2,100,064 5,340,246 2,882,470 2,442,340 2,529,571 ' Unit prices are based on an algorithm unique to LRE.. Government Solutions Draft IRC IF Analysis 51
261 Impact Fee Update Indian River County, Florida Dr. James C. Nicholas Thomas G. Wright, Esq. March 6, 2008

262 Introducing Our Team James B. Duncan, FAICP 44 Years Planning and Impact Fee Experience Former Director, Austin, Hollywood and Broward County Manager, Nation s First Multi-Facility Impact Fee System Co-Author, Nation s First Impact Fee Enabling Act Clancy J. Mullen 20 years planning and impact fee experience Infrastructure Financing Director, Duncan Associates Author of over 250 development impact fee studies Founding Officer, National Impact Fee Roundtable


263 Introducing Our Team James C. Nicholas, PhD 30 Years Urban Economics and Finance Experience Pioneer in development of Florida impact fee methodologies Former Law School Professor, University of Florida Impact fee consultant to numerous Florida counties and cities Thomas G. Wright, Esq. 30 years land use and exaction law experience Former Assistant t County Attorney for Broward County Former Senior Counsel for WCI Communities Law Degrees from Stetson University and University of Miami


264 Impact Fee Experience
265 Overview of Presentation Legal Principles Overview of the Study Response to Criticisms Updated Maximum Fees Comparisons with Other Florida Counties Revenue-Neutral Option
266 Legal Principles Dual Rational Nexus Test Fee Proportional to Need Fees Spent to Provide Benefit Proportionate Share Principles Don t Charge for Higher Level of Service (Existing Deficiencies) Don t Charge Twice for Same Level of Service (Through Impact Fees and Taxes) State Law Base Fees on Most Recent and Localized Data
267 Study Overview Last Updated in 2004 Traffic Originally Adopted in 2005 Schools Parks Librariesi Fire Rescue Law Enforcement Corrections Public Buildings Solid Waste
268 Service Areas County-Wide Traffic Schools Libraries Fire Rescue (except Indian River Shores) Corrections Public Buildings Solid Waste Unincorporated Parks Law Enforcement
269 Single-Family Fee Summary Type of Fee Current Updated Increase SF % Wtd % Traffic $5,202 $8,073 $2,871 55% 54% Schools $1,756 $4,459 $2, % 154% Parks $1,463 $2,488 $1,025 70% 68% Libraries $483 $552 $69 14% 13% Fire Rescue $278 $326 $48 17% 18% Law $245 $348 $103 42% 43% Corrections $170 $215 $45 26% 27% Public Buildings $206 $408 $202 98% 3% Solid Waste $75 $82 $7 9% -26% Total $9,878 $16,951 $7,073 72% ----
270 Traffic Impact Fees Used Most Current Cost/Capacity Estimates Average Cost/Lane-Mile Up 63% Average Capacity/Lane Down 11% Average Cost per VMC Up 83% Used Previous Travel Demand Factors Calibrated Trip Lengths (reduced d by 24.1%) Retained 15% Reduction Factor (Policy Issue) Fees Increase 55-58% for All Land Uses
271 Critique of Traffic Methodology Cost of Lane Reconstruction in Road Widenings Necessary part of many growth-related improvements Included in 2004 update Included d in most FL road fees Inclusion of State Road Improvement Costs State roads integral to road system; concurrency County problem Fees reduced by credit for gas taxes spent on State roads Increases the average cost per lane-mile; included last update $3.98 million/lane-mile not out-of-line: Lee 2006 = $4.38 million; Clay 2007 = $3.73 million; Lake 2006 = $3.71 million; Citrus 2006 = $4.26 million; Palm Beach 2007 = $3.72 million
272 Florida County Road Fees
273 School Impact Fees Updated Cost per Student Update Uses Most Recent School Expansion Costs Land Cost Increased from $35,000 to $95,000 per Acre Update Includes Bus Costs Cost per Student Increased 67% ($18,000-$30,000) Updated Credit per Student Declining State Credit Offset Increase in Tax Credit Net Cost per Student Increased 210% ($5,300-$16,500) Calibrated Student t Generation Rates (down 19%) Fees Increased 154% ($1,756-$4,459 per SF unit)
274 Critique of School Methodology Student Generation Rates are Declining Temporary, due to lots of unsold and vacant units Sample of Local School Projects is Limited Inherent trade-off between number of projects and most recent and local requirement School Land Costs Based on One Acquisition Most recent and local data ; land costs only 7% of increase Portable Buildings are an Existing Deficiency Existing district-wide provision: 1 permanent station per student Property Tax Credit Excludes Debt Service Debt service was credited, except for interest portion and principal portion attributable to past rehabilitation projects
275 Florida County School Fees
276 Park Impact Fees Total Cost per Person Increased 35% Acres/1000 Increased 71% ( , due largely to inclusion of State-owned land used for County parks) Land/Site Imp. Cost Increased 31% ($67,000-$88,000/acre) $88 000/acre) Credit per Person Decreased 46% Fees Increased 70% (for typical single-family unit) From $1,463 to $2,488 per unit Without State Land, Fees Increase Only 22% From $1,463 to $1,795
277 Critique of Park Methodology Fees Should be Based on Planned Improvements Determining existing LOS using replacement costs does not mean fees will be spent on replacements None of County s other fees based on plan-based approach Fees Should be Based on Permanent plus Weighted Peak Population Makes no difference in fee calculation (lower cost per person, but more people per unit during peak season) Comprehensive plan can be amended to be consistent
278 Florida County Park Fees
279 Revenue-Neutral Fees Percent of Maximum Updated Fees Advantage over no update: Fees are based on most recent study.
280 Florida County Total Non-Utility Fees
281 Final Thoughts Impact fees did not cause building slowdown, and freezing fees will not stimulate growth Existing inventory of unsold homes have already paid impact fees Prioritize fee increases: Existing school fees very low Parks and law enforcement merit consideration Update fee schedules, even if revenue-neutral (adopt fees at percent of maximum) Fees will be based on most recent and local data Fees by land use will be proportional to impact by land use
282 Impact Fee Update Indian River County, Florida Dr. James C. Nicholas Thomas G. Wright, Esq. March 6, 2008
283 Library Impact Fees Construction Cost Based on Cost of New West County Branch ($296/sf) Land Cost Based on Historical Costs ($227,000/ac.) Fees Going Up About 15%
284 Florida County Library Fees
285 Functional Population Methodology Methodology Used For: Fire Rescue (7 days/24 hours) Law Enforcement (7 days/24 hours) Corrections (7 days/24 hours) Public Buildings (5 days/11 hours) Simplified and Calibrated Used 7 Days/24 Hours for All Facilities
286 Fire Rescue Impact Fees Fees Based on Existing LOS Construction Cost Based on Current Project Vehicle Cost Based on Replacement Cost Equipment Cost Based on Original Costs Fees Increase about 18% on Average
287 Florida County Fire Fees
288 Law Enforcement Impact Fees Excluded County-Wide Functions Dispatch, Judicial Services, Corrections Excluded Share of Agency-Wide Functions Attributable to County-Wide Functions Internal Affairs, IT, HR, Records, Fleet Maintenance, Gen. Svcs Construction Costs based on Planned Expansions Vehicle/Equipment Costs based on Original Costs Fees Increase About 43% on Average


289 Florida County Law Enforcement Fees
290 Corrections Impact Fees Construction Cost based on Current Expansion Vehicles/Equipment Cost based on Original Cost LOS Based on Existing Cost/2012 Population Fees Increase About 27% on Average


291 Florida County Correctional Fees
292 Public Buildings Impact Fees LOS Includes New Admin Bldg. and Emergency Operations Center Now Under Construction LOS Based on 2014 Development (assumes some excess capacity created by current projects) LOS Based on 7 Days/24 Hours Func, Population, Rather than 5 Days/11 Hours Residential Fees About Double Nonresidential Fees Decline by 40-60% Overall Revenues Increase by 3%
293 Florida County Public Building Fees
294 Solid Waste Impact Fees Methodology Shift from Incremental Expansion Costs to Existing LOS Approach Collections Centers = Flow Capacity Landfill = Consumable Capacity (Years) Collection Ctr. Costs Attributed Only to Residential Class I Landfill Capacity (C&D pays tipping fee) 49 Years of Waste from Existing Development if No Growth Fee Based on 29 Years (Anticipated Life Based on Growth Rate) Fees Based on Recoupment Costs (assume 25%) Overall Revenue Decline (-26%) Residential Fees up Slightly (9%)


295 Florida County Solid Waste Fees
 and the")
296 MEMORANDUM TO: Bob Keating, Planning Director, Indian River County, Florida FROM: Clancy Mullen, Duncan Associates DATE: January 25, 2008 RE: Response to Impact Fee Task Force and Building Industry Association Reports This memorandum addresses specific criticisms of our July 2007 impact fee update study 1 made in reports by the Chambers of Commerce s Impact Fee Task Force (IFTF) and the Treasure Coast Building Industry Association (BIA). 2 GENERAL REMARKS Neither report mentions fire/rescue, corrections, public buildings or solid waste fees. The updated solid waste fees would actually go down for most nonresidential uses and overall revenues would decline. The updated public building fees would also go down significantly for nonresidential uses. The IFTF report addresses only traffic, school, park, library and law enforcement fees, and actually recommends the proposed increases to the law enforcement fees. The only issue raised with respect to libraries is the desire to have a list of planned improvements. The BIA report addresses only traffic, school and park impact fees. Consequently, the focus of this response is really on the three major impact fee categories: traffic, schools and parks. We stand behind the soundness of our study. Florida Statutes require the impact fees be based on the most recent and localized data. The current fees are based on studies completed in 2004 and Even if the County does not wish to increase impact fees, it would be preferable to adopt each of the updated fees based on a percentage of the maximum fees calculated in our study, rather than leave the current fees based on older studies in place indefinitely. The following percentages would result in fees remaining the same for a typical 1,500-to-2,500 square foot single-family unit (BIA report recommendations are shown in parentheses, along with the IFTF recommendation for law enforcement fees): 1 Duncan Associates, et. al., Impact Fee Update, Indian River County, Florida: Technical Memorandum #3 (revised), July 19, Impact Fee Task Force Report and Recommendations, January 22, 2008 and Government Solutions, Indian River County Impact Fee Analysis, January 16, research #208 # austin tx # x204 # fax # clancy@duncanplan.com
ORDINANCE WHEREAS, this title is intended to implement and be consistent with the county comprehensive plan; and
 ORDINANCE 2005-015 AN ORDINANCE OF THE BOARD OF COUNTY COMMISSIONERS OF INDIAN RIVER COUNTY, FLORIDA, ADOPTING TITLE X, IMPACT FEES, AND AMENDING CODE SECTION 953, FAIR SHARE ROADWAY IMPROVEMENTS, OF THE
Development Impact Fee Study
 Development Impact Fee Study Prepared for: Tega Cay, South Carolina July 8, 2018 4701 Sangamore Road Suite S240 Bethesda, MD (301) 320-6900 www.tischlerbise.com [PAGE INTENTIONALLY LEFT BLANK] Development
Volusia County Public Information Presentation Thoroughfare Road Impact Fee
 Volusia County Public Information Presentation Thoroughfare Road Impact Fee Volusia County Public Information Presentation Thoroughfare Road Impact Fee 1. Welcome and overview 2. Presentation summary:
LEE COUNTY ORDINANCE 08-24
 LEE COUNTY ORDINANCE 08-24 AN ORDINANCE AMENDING THE LEE COUNTY LAND DEVELOPMENT CODE (LDC) TO AMEND CHAPTER 2 (ADMINISTRATION), ARTICLE VI (IMPACT FEES), DIVISION TWO (ROADS IMPACT FEE); AMENDING COMPUTATION
Capital Improvement Plans and Development Impact Fees
 Capital Improvement Plans and Development Impact Fees City of Submitted to: City of September 29, 2011 Prepared by: 4701 Sangamore Road Suite S240 Bethesda, Maryland 20816 800.424.4318 www.tischlerbise.com
Cedar Hammock Fire Control District
 Cedar Hammock Fire Control District FY 2015 Fire/Rescue Impact Fee Study February 24, 2016 Prepared by: February 24, 2016 Mr. Jeff Hoyle Fire Chief 5200 26 th St W Bradenton, FL 34207 Re: FY 2015 Impact
School Impact Fee Study and Capital Improvement Plan
 and Capital Improvement Plan Prepared for: April 18, 2018 4701 Sangamore Road Suite S240 Bethesda, MD (301) 320-6900 www.tischlerbise.com [PAGE INTENTIONALLY LEFT BLANK] School Impact Fee Study TABLE OF
ORDINANCE 495 CONCURRENCY MANAGEMENT AND PROPORTIONATE FAIR-SHARE MITIGATION TABLE OF CONTENTS
 ORDINANCE 495 CONCURRENCY MANAGEMENT AND PROPORTIONATE FAIR-SHARE MITIGATION TABLE OF CONTENTS 168.02 CONCURRENCY MANAGEMENT SYSTEM (CMS)... 2 168.02.1: PURPOSE AND INTENT... 2 168.02.2: CONSISTENCY WITH
4. BUDGET OVERVIEW BY COUNTY ADMINISTRATOR, JASON E. BROWN
 BOARD OF COUNTY COMMISSIONERS INDIAN RIVER COUNTY, FLORIDA AGENDA 2017/2018 FINAL BUDGET HEARING WEDNESDAY, SEPTEMBER 20, 2017 5:01 P.M. County Commission Chamber Indian River County Administration Complex
Proposed Brownfield Area
 NOTICE OF BROWNFIELD AREA DESIGNATION PUBLIC HEARING The Board of County Commissioners of Indian River County, Florida gives notice of its intent to consider adopting a resolution establishing a Brownfield
OVERVIEW OF IMPACT FEE ORDINANCE
 OVERVIEW OF IMPACT FEE ORDINANCE This is a compilation of information obtained from numerous articles and existing impact ordinances from throughout the country. This outline is not intended to be exhaustive
Assembly Bill No. 489 Committee on Growth and Infrastructure CHAPTER...
 Assembly Bill No. 489 Committee on Growth and Infrastructure CHAPTER... AN ACT relating to the taxation of property; providing for the partial abatement of the ad valorem taxes imposed on property; directing
ORDINANCE NO
 ORDINANCE NO. 05-06-44 AN ORDINANCE TO BE KNOWN AS THE HIGHLANDS COUNTY IMPACT FEE ORDINANCE; PROVIDING DEFINITIONS, RULES OF CONSTRUCTION AND FINDINGS; ADOPTING A CERTAIN IMPACT FEE STUDY; PROVIDING FOR
SECTION 1 INTRODUCTION TO THE PANAMA CITY BEACH COMPREHENSIVE GROWTH DEVELOPMENT PLAN
 1. PURPOSE SECTION 1 INTRODUCTION TO THE PANAMA CITY BEACH COMPREHENSIVE GROWTH DEVELOPMENT PLAN The purpose of the City of Panama City Beach's Comprehensive Growth Development Plan is to establish goals,
WHEREAS, Land Development Code Section requires update of the mobility fee regulations every three years, and
 BY BOARD OF COUNTY COMMISSIONERS ORDINANCE NO. AN ORDINANCE BY THE PASCO COUNTY BOARD OF COUNTY COMMISSIONERS AMENDING SECTION 1302.2 (MOBILITY FEES) AND APPENDIX A (MOBILITY FEE DEFINITIONS) OF THE PASCO
4. Parks and Recreation Fee Facility Needs and Cost Estimates Fee Calculation Nexus Findings 24
 TABLE OF CONTENTS CHAPTER PAGE 1. Introduction and Summary of Calculated Fees 1 1.1 Background and Study Objectives 1 1.2 Organization of the Report 2 1.3 Calculated Development Impact Fees 2 2. Fee Methodology
Lee County Board Of County Commissioners DATE CRITICAL Agenda Item Summary
 Lee County Board Of County Commissioners DATE CRITICAL Agenda Item Summary Blue Sheet No. 1. ACTION REQUESTED/PURPOSE: Conduct a public hearing; adopt an ordinance amending the Land Development Code to
Regional Road Capital Improvements Plan and Impact Fee Methodology
 Regional Road Capital Improvements Plan and Impact Fee Methodology Regional Transportation Commission Washoe County/Reno/Sparks, Nevada August 28, 2014 Prepared by: RTC Board Approved 9/19/14 5 th Edition
LAND DEVELOPMENT REGULATIONS Article 6 - IMPACT FEES BEFORE THE BOARD OF COUNTY COMMISSIONERS MARTIN COUNTY, FLORIDA ORDINANCE NUMBER 995
 BEFORE THE BOARD OF COUNTY COMMISSIONERS MARTIN COUNTY, FLORIDA ORDINANCE NUMBER 995 AN ORDINANCE AMENDING ARTICLE 6, IMPACT FEES, LAND DEVELOPMENT REGULATIONS, MARTIN COUNTY CODE INCLUDING FIGURE 6.1.
City of Puyallup. Parks Impact Fee Study
 City of Puyallup Parks Impact Fee Study August 23, 2005 Prepared by Financial Consulting Solutions Group, Inc. 8201 164 th Avenue NE, Suite 300 Redmond, WA 98052 tel: (425) 867-1802 fax: (425) 867-1937
Student Generation Rate and School Impact Fee Study Update
 Student Generation Rate and School Impact Fee Study Update DRAFT REPORT October 3, 2017 Prepared for: 600 SE 3 rd Avenue Ft. Lauderdale, FL 33301 ph (754) 321-0000 Prepared by: 1000 N. Ashley Dr., #400
ASSEMBLY BILL No. 904
 AMENDED IN SENATE JULY, 0 AMENDED IN SENATE JUNE, 0 AMENDED IN SENATE JUNE, 0 AMENDED IN ASSEMBLY JANUARY, 0 AMENDED IN ASSEMBLY MAY 0, 0 AMENDED IN ASSEMBLY APRIL, 0 AMENDED IN ASSEMBLY MARCH, 0 california
SOUTH DAVIS METRO FIRE AGENCY FIRE IMPACT FEE FACILITIES PLAN (IFFP) AND IMPACT FEE ANALYSIS (IFA)
 AND IMPACT FEE ANALYSIS (IFA)") SOUTH DAVIS METRO FIRE AGENCY FIRE IMPACT FEE FACILITIES PLAN (IFFP) AND IMPACT FEE ANALYSIS (IFA) JULY 2012 PREPARED BY LEWIS YOUNG ROBERTSON & BURNINGHAM, INC. IMPACT FEE FACILITIES PLAN AND IMPACT FEE
SOUTH DAVIS METRO FIRE AGENCY FIRE IMPACT FEE FACILITIES PLAN (IFFP) AND IMPACT FEE ANALYSIS (IFA) JULY 2012 PREPARED BY LEWIS YOUNG ROBERTSON & BURNINGHAM, INC. IMPACT FEE FACILITIES PLAN AND IMPACT FEE
RATE STUDY IMPACT FEES ROADS
 RATE STUDY FOR IMPACT FEES FOR ROADS CITY OF PUYALLUP, WASHINGTON November 8, 2007 TABLE OF CONTENTS Executive Summary............................................ 1 1. Statutory Basis and Methodology for
Section 150, Impact Fees, Pinellas County Land Development Code
 Section 150, Impact Fees, Pinellas County Land Development Code As Amended, April 19, 2005 Section 150, Impact Fees, Pinellas County Land Development Code Sec. 150-36. Definitions The following words,
Kane County. Division of Transportation. Technical Specifications Manual for Road Improvement Impact Fees Under Kane County Ordinance #07-232
 Kane County Division of Transportation Technical Specifications Manual for Road Improvement Impact Fees Under Kane County Ordinance #07-232 Table of Contents Section 1: Introduction to the Impact Fee and
FACILITIES DEVELOPMENT POLICIES NUMBER 614 EDUCATIONAL FACILITIES IMPACT FEE
 EDUCATIONAL FACILITIES IMPACT FEE Section 614-1. Authority; interpretation In accordance with County of Volusia Ordinance 2008-04, this policy shall exercise the authority delegated to the school board
Development Impact & Capacity Fees
 City of Petaluma, CA Development Impact & Capacity Fees October 2018 City of Petaluma City Manager s Office 11 English Street Petaluma, CA 94952 Web Page http://www.ci.petaluma.ca.us Revision Date : October
City of Casselberry Public Works Department
 City of Casselberry Public Works Department 95 Triplet Lake Drive, Casselberry, Florida 32707 Telephone (407) 262-7725 Fax (407) 262-7767 July 31, 2018 RE: Informational Guide for Impact Fees Dear Builder/Owner:
Impact Fee Reductions as Incentives. How Do They Work?
 Impact Fee Reductions as Incentives How Do They Work? Impact Fee Incentives GIC Conference October 20, 2017 Sarasota, Florida David Goldstein Pasco County Nilgün Kamp, AICP Tindale-Oliver 2 Presentation
GENERAL ASSEMBLY OF NORTH CAROLINA SESSION 2017 SESSION LAW HOUSE BILL 436
 GENERAL ASSEMBLY OF NORTH CAROLINA SESSION 2017 SESSION LAW 2017-138 HOUSE BILL 436 AN ACT TO PROVIDE FOR UNIFORM AUTHORITY TO IMPLEMENT SYSTEM DEVELOPMENT FEES FOR PUBLIC WATER AND SEWER SYSTEMS IN NORTH
RATE STUDY IMPACT FEES PARKS
 RATE STUDY FOR IMPACT FEES FOR PARKS CITY OF KENMORE, WASHINGTON May 15, 2001 TABLE OF CONTENTS Executive Summary................................................... 1 1. Statutory Basis and Methodology
3. FISCAL IMPACT ANALYSIS FISCAL IMPACT ANALYSIS 29
 3. FISCAL IMPACT ANALYSIS FISCAL IMPACT ANALYSIS 29 The purpose of fiscal impact analysis is to estimate the impact of a development or a land use change on the budgets of governmental units serving the
DRAFT. Development Impact Fee Model Ordinance. Mount Pleasant, SC. Draft Document. City Explained, Inc. J. R. Wilburn and Associates, Inc.
 City Explained, Inc. J. R. Wilburn and Associates, Inc. Development Impact Fee Model Ordinance Mount Pleasant, SC Draft Document January 11, 2017 ARTICLE I. TITLE This ordinance shall be referred to as
Capital Improvements Plan and Impact Fee Study
 Capital Improvements Plan and Impact Fee Study Prepared for: Hendersonville, Tennessee January 4, 2019 4701 Sangamore Road Suite S240 Bethesda, MD (301) 320-6900 www.tischlerbise.com TABLE OF CONTENTS
Fiscal Impact Analysis Evergreen Community
 Evergreen Community July 16, 2015 Evergreen Community Prepared for: Evergreen Community (Burlington) Ltd. Prepared by: 33 Yonge Street Toronto Ontario M5E 1G4 Phone: (416) 641-9500 Fax: (416) 641-9501
Fire/EMS Impact Fee Study for Lee County, Florida. prepared by
 for Lee County, Florida prepared by January 2012 Table of Contents EXECUTIVE SUMMARY... 1 Major Findings... 1 Comparative Fees... 2 LEGAL FRAMEWORK... 4 The Need Test... 4 The Benefit Test... 6 Florida
Impact Fees. Section 1 Purpose and Intent.
 Impact Fees 1 Purpose and Intent 2 Definitions 3 Establishment of Impact Fees 4 Documentation Required 5 Segregated Accounts Required 6 Time Within Which To Use Impact Fees 7 Payment of Impact Fees 8 Appeals
(Ord. No , 1, )
") ARTICLE VIII. - EDUCATIONAL SYSTEM IMPACT FEE Sec. 70-291. - Short title. This article shall be known and cited as the "Sarasota County Educational System Impact Fee Ordinance." Sec. 70-292. - Findings.
ARTICLE VIII. - EDUCATIONAL SYSTEM IMPACT FEE Sec. 70-291. - Short title. This article shall be known and cited as the "Sarasota County Educational System Impact Fee Ordinance." Sec. 70-292. - Findings.
City of Banks TRANSPORTATION SYSTEM DEVELOPMENT CHARGE. Methodology Report. February 2016 FCS GROUP. Prepared by:
 TRANSPORTATION SYSTEM DEVELOPMENT CHARGE Methodology Report February 2016 Prepared by: 4000 Kruse Way Place, Bldg 1, Ste 220 Lake Oswego, OR 97035 T: 503.841.6543 www.fcsgroup.com February 2016 page i
Orange County Law Enforcement
 Law Enforcement Impact Fee Update Study FINAL REPORT August 22, 2017 Prepared for: 201 South Rosalind Avenue Orlando, FL 32801 ph (407) 836-5884 Prepared by: 1000 N. Ashley Dr., #400 Tampa, Florida, 33602
RATE STUDY IMPACT FEES TRANSPORTATION
 RATE STUDY FOR IMPACT FEES FOR TRANSPORTATION CITY OF SHORELINE, WASHINGTON April 24, 2014 TABLE OF CONTENTS EXECUTIVE SUMMARY...1 1. STATUTORY BASIS AND METHODOLOGY...5 2. ROAD SYSTEM IMPROVEMENT COSTS
CITY OF OAKLAND COUNCIL AGENDA REPORT
 CITY OF OAKLAND COUNCIL AGENDA REPORT TO: Office of the City Manager ATTN: Robert C. Bobb FROM: Community and Economic Development Agency DATE: July 23, 2002 RE: AN ORDINANCE AMENDING THE OAKLAND MUNICIPAL
Proposed Future Land Use Plan Open House
 City of Port August Aransas, 30 th, 2006 Texas Proposed Future Plan Open House Wednesday, Background The City of Port Aransas does not have an adopted Future Plan (FLUP). The last Future Plan for the City
(Res. No R003, ) NON-REGIONAL ROAD CAPITAL EXPANSION FEE [2] Footnotes: --- (2) Findings.
![(Res. No R003, ) NON-REGIONAL ROAD CAPITAL EXPANSION FEE [2] Footnotes: --- (2) Findings.](/thumbs/90/101801632.jpg "(Res. No R003, ) NON-REGIONAL ROAD CAPITAL EXPANSION FEE [2] Footnotes: --- (2) Findings.") 9.5. - NON-REGIONAL ROAD CAPITAL EXPANSION FEE [2] Footnotes: --- (2) --- Editor's note Res. No. 12262006R003, adopted Dec. 26, 2006, deleted former 9.5, and enacted a new 9.5 as set out herein. The former
9.5. - NON-REGIONAL ROAD CAPITAL EXPANSION FEE [2] Footnotes: --- (2) --- Editor's note Res. No. 12262006R003, adopted Dec. 26, 2006, deleted former 9.5, and enacted a new 9.5 as set out herein. The former
TOWN OF PAYSON DEVELOPMENT FEE STUDY LAND USE ASSUMPTIONS, INFRASTRUCTURE IMPROVEMENTS PLAN, AND DEVELOPMENT FEE REPORT
 TOWN OF PAYSON DEVELOPMENT FEE STUDY LAND USE ASSUMPTIONS, INFRASTRUCTURE IMPROVEMENTS PLAN, AND DEVELOPMENT FEE REPORT Prepared for: May 15, 2014 4701 Sangamore Road, Suite S240 Bethesda, MD 301.320.6900
Development Program Report for the Alamo Area of Benefit
 Julia R. Bueren, Director Deputy Directors Brian M. Balbas, Chief Mike Carlson Stephen Kowalewski Carrie Ricci Joe Yee ADOPTED BY BOARD OF SUPERVISORS ON Development Program Report for the Alamo October,
NASSAU COUNTY, FLORIDA MOBILITY FEE ORDINANCE
 NASSAU COUNTY, FLORIDA MOBILITY FEE ORDINANCE ADOPTED, 2014 TABLE OF CONTENTS Page ARTICLE I GENERAL SECTION 1.01. DEFINITIONS.... 1 SECTION 1.02. RULES OF CONSTRUCTION.... 7 SECTION 1.03. FINDINGS....
CODING: Words stricken are deletions; words underlined are additions. hb er
 1 2 3 4 5 6 7 8 9 10 11 12 13 14 15 16 17 18 19 20 21 22 23 24 25 26 An act relating to local government environmental financing; providing a short title; amending s. 212.055, F.S.; expanding the uses
MUNICIPAL SERVICE BENEFIT UNIT (MSBU) CREATION AND ADMINISTRATION POLICY 16-01
 CREATION AND ADMINISTRATION POLICY 16-01") MUNICIPAL SERVICE BENEFIT UNIT (MSBU) CREATION AND ADMINISTRATION POLICY 16-01 PURPOSE: POLICY: The purpose of this policy is to provide an orderly and efficient method for utilizing the statutory authority
MUNICIPAL SERVICE BENEFIT UNIT (MSBU) CREATION AND ADMINISTRATION POLICY 16-01 PURPOSE: POLICY: The purpose of this policy is to provide an orderly and efficient method for utilizing the statutory authority
CHAPTER Committee Substitute for Committee Substitute for House Bill No. 447
 CHAPTER 2016-225 Committee Substitute for Committee Substitute for House Bill No. 447 An act relating to local government environmental financing; providing a short title; amending s. 212.055, F.S.; expanding
TOWN OF PALM BEACH Information for Town Council Meeting on: July 12, 2017
 TOWN OF PALM BEACH Information for Town Council Meeting on: July 12, 2017 To: Via: Mayor and Town Council Thomas G. Bradford, Town Manager From: Jane Struder, Director of Finance Re: Town-wide Undergrounding
Ordinance No. WHEREAS, in RCW the Legislature has authorized counties to adopt an ordinance imposing impact fees; and
 Ordinance No. AN ORDINANCE of Thurston County, Washington, adding Title 25 of the Thurston County Code to authorize transportation and parks impact fees. WHEREAS, the Board of County Commissioners of Thurston
RD17 Area: Interim Urban Level of Flood Protection Levee Impact Fee
 2450 Venture Oaks Way, Suite 240 Sacramento, CA 95833 RD17 Area: Interim Urban Level of Flood Protection Levee Impact Fee NEXUS STUDY Adopted by City of Lathrop Ordinance No. 17-374 (Fee Effective April
CHICO/CARD AREA PARK FEE NEXUS STUDY
 REVISED FINAL REPORT CHICO/CARD AREA PARK FEE NEXUS STUDY Prepared for: City of Chico and Chico Area Recreation District (CARD) Prepared by: Economic & Planning Systems, Inc. December 2, 2003 EPS #12607
ORDINANCE NO.1 4. and. Page 1
 ORDINANCE NO.1 4 AN ORDINANCE OF THE BOARD OF COUNTY COMMISSIONERS OF MARION COUNTY, FLORIDA AMENDING ARTICLE XI OF CHAPTER 10 OF THE MARION COUNTY CODE OF ORDINANCES, UPDATING STATUTORY AND CODE CROSS-REFERENCES;
SCHOOL FINANCE: IMPACT FEES and a COUPLE OF OTHER THINGS. First Things. How Do We Pay? What Are We Talking About? How Do We Pay?
 SCHOOL FINANCE: IMPACT FEES and a COUPLE OF OTHER THINGS Theodore B. DuBose Haynsworth Sinkler Boyd, P.A. Presented to: SC School Boards Association 2016 School Law Conference Charleston, South Carolina
Parks & Recreation Impact Fee Update
 Board of County Commissioners Parks & Recreation Impact Fee Update January 9, 2018 Presentation Overview Purpose and Background Calculation of Impact Fees Findings of Technical Study Ordinance Review Public
ORDINANCE NO AN ORDINANCE AMENDING THE CODE OF ORDINANCES OF THE CITY OF PORT ARANSAS, TEXAS, BY ADOPTING A NEW CHAPTER
 ORDINANCE NO. 2008-09 AN ORDINANCE AMENDING THE CODE OF ORDINANCES OF THE CITY OF PORT ARANSAS, TEXAS, BY ADOPTING A NEW CHAPTER TWENTY-SIX CONCERNING IMPACT FEES FOR ROADWAY FACILITIES; INCORPORATING
Town of Prescott Valley 2013 Land Use Assumptions
 Town of Prescott Valley 2013 Land Use Assumptions Raftelis Financial Consultants, Inc. November 22, 2013 Table of Contents Purpose of this Report... 1 The Town of Prescott Valley... 2 Summary of Land Use
Chapter CONCURRENCY
 Chapter 20.180 CONCURRENCY Sections: 20.180.001 Purpose. 20.180.002 Authority. 20.180.003 Definitions 20.180.004 Exempt development. 20.180.005 Capacity evaluation required for a change in use. 20.180.006
COMMUNITY DEVELOPMENT DEPARTMENT
 AGENDA ITEM I-1 COMMUNITY DEVELOPMENT DEPARTMENT Council Meeting Date: June 3, 2014 Agenda Item #: I-1 INFORMATIONAL ITEM: Update on Multi-City Affordable Housing Nexus Study and Impact Fee Feasibility
TASK 2 INITIAL REVIEW AND ANALYSIS U.S. 301/GALL BOULEVARD CORRIDOR FORM-BASED CODE
 TASK 2 INITIAL REVIEW AND ANALYSIS U.S. 301/GALL BOULEVARD CORRIDOR FORM-BASED CODE INTRODUCTION Using the framework established by the U.S. 301/Gall Boulevard Corridor Regulating Plan (Regulating Plan),
Fiscal Impact Analysis Multi-family Development 20 Corporate Drive Burlington, Massachusetts
 Fiscal Impact Analysis Multi-family Development 20 Corporate Drive Burlington, Massachusetts July 10, 2015 Prepared by Connery Associates Melrose Massachusetts Table of Contents Section Page 1.0 Preface
CHAPTER Committee Substitute for Committee Substitute for Senate Bill No. 2188
 CHAPTER 2004-372 Committee Substitute for Committee Substitute for Senate Bill No. 2188 An act relating to land development; amending s. 197.502, F.S.; providing for the issuance of an escheatment tax
"#$%!&'()*+,'-(-.,)! /(+.-(0!12+()*.,)!
*+,'-(-.,)! /(+.-(0!12+()*.,)!") "#$%&'()*+,'-(-.,) /(+.-(012+()*.,)344 5-678 9'4+('47:,'; /.-8,:3,'-/,00.)*#$5()?(@,'4A,(7 56.-45"=# B4-C4*7(
"#$%&'()*+,'-(-.,) /(+.-(012+()*.,)344 5-678 9'4+('47:,'; /.-8,:3,'-/,00.)*#$5()?(@,'4A,(7 56.-45"=# B4-C4*7(
Prince George s County Zoning Ordinance and Subdivision Regulations Rewrite March 13, 2017
 Prince George s County Zoning Ordinance and Subdivision Regulations Rewrite March 13, 2017 The Maryland National Capital Park & Planning Commission 1 Worksessions Schedule Topic Date Zone Structure January
Sec Definitions. [Note: the long list of definitions related to Mobility will appear in the Handbook.]
![Sec Definitions. [Note: the long list of definitions related to Mobility will appear in the Handbook.]](/thumbs/81/82623295.jpg "Sec Definitions. [Note: the long list of definitions related to Mobility will appear in the Handbook.]") PART 5. - MOBILITY FEE SYSTEM Footnotes: --- (3) --- Editor's note Ord. 2011-536-E, 1, amended the Code by repealing former Pt. 5, 655.501, in its entirety, and adding a new Pt. 5, 655.501 655-512. Former
PART 5. - MOBILITY FEE SYSTEM Footnotes: --- (3) --- Editor's note Ord. 2011-536-E, 1, amended the Code by repealing former Pt. 5, 655.501, in its entirety, and adding a new Pt. 5, 655.501 655-512. Former
CASTROVILLE COMMUNITY PLAN - FINANCING COMMUNITY PLAN IMPROVEMENTS
 CASTROVILLE COMMUNITY PLAN - FINANCING COMMUNITY PLAN IMPROVEMENTS INTRODUCTION As described in the other sections of this community plan, implementation of the Plan will require various site, infrastructure
APA National Conference Monday, May 8 10:30 a.m. -11:45 a.m. Room: Hall 1E09 (JCC)
") APA National Conference Monday, May 8 10:30 a.m. -11:45 a.m. Room: Hall 1E09 (JCC) Dr. Linda Tomaselli, GIS Research and Development Consultants (GISRDC) Ms. Vasudha Pinnamaraju, Executive Director, McLean
APA National Conference Monday, May 8 10:30 a.m. -11:45 a.m. Room: Hall 1E09 (JCC) Dr. Linda Tomaselli, GIS Research and Development Consultants (GISRDC) Ms. Vasudha Pinnamaraju, Executive Director, McLean
Expiration of Transportation Certificate of Concurrency for Application for Minor or Major Development; Approval
 Page 1 of 12 CHAPTER 3. CONCURRENCY 3.00.00. GENERALLY 3.00.01. Purpose and Intent The purpose of this chapter is to describe the requirements and procedures necessary to implement the concurrency provisions
IMPACT OF PROPOSED ROLL BACK OF AD VALOREM TAX REVENUES ON FLORIDA S COUNTIES
 IMPACT OF PROPOSED ROLL BACK OF AD VALOREM TAX REVENUES ON FLORIDA S COUNTIES Prepared for Florida Association of Counties 100 South Monroe Street Tallahassee, Florida 32301 Prepared by Fishkind & Associates,
On the Horizon: Leases and Fiduciary Responsibilities
 On the Horizon: Leases and Fiduciary Responsibilities Dean Michael Mead, Research Manager Florida School Finance Officers Association November 11, 2015 The views expressed in this presentation are those
Orange Water and Sewer Authority Water and Sewer System Development Fee Study
 Orange Water and Sewer Authority Water and Sewer System Development Fee Study March 6, 2018 March 6, 2018 Mr. Stephen Winters Director of Finance and Customer Service 400 Jones Ferry Road Carrboro, NC
ESTES VALLEY STORMWATER MANAGEMENT PROGRAM
 ESTES VALLEY STORMWATER MANAGEMENT PROGRAM Phase I. Stormwater Master Plan Phase II. Stormwater Utility Feasibility Study Board of Realtors Meeting May 3, 2018 Stormwater Master Plan Summary Stormwater
TRANSPORTATION AND CAPITAL IMPROVEMENTS IMPACT FEES
 Effective September 1, 2016 Chapter 15.74 TRANSPORTATION AND CAPITAL IMPROVEMENTS IMPACT FEES Article I General Provisions 15.74.010 Purpose. 15.74.020 Findings. 15.74.030 Definitions. 15.74.040 Applicability.
The Villages Master Planned Development Development Agreement. Exhibit F. Traffic Monitoring Plan
 Traffic Monitoring Plan TRAFFIC MONITORING PLAN The transportation mitigation measures imposed on The Villages MPD include projects that address the potential full transportation impacts of complete build
Indian River County Revenue Manual. Prepared by Office of Management & Budget Staff 2017
 " Indian River County Revenue Manual Prepared by Office of Management & Budget Staff 2017 TABLE OF CONTENTS INTRODUCTION... 1 FUND BREAKDOWN... 2 MATRIX... 3 GENERAL FUND Ad Valorem Property Taxes... 4
ORDINANCE AN ORDINANCE TO AMEND SPRING HILL MUNICIPAL CODE, CHAPTER 5, IMPACT FEE-PURPOSES AND ADMINISTRATION
 ORDINANCE 15-04 AN ORDINANCE TO AMEND SPRING HILL MUNICIPAL CODE, CHAPTER 5, IMPACT FEE-PURPOSES AND ADMINISTRATION WHEREAS, the Board of Mayor and Aldermen for the City of Spring Hill may, pursuant to
FINANCE DEPARTMENT M E M O R A N D U M
 FINANCE DEPARTMENT M E M O R A N D U M TO: FROM: BY: Honorable Mayor and City Commission Ambreen Bhatty, City Manager Steven Chapman II, Finance Director DATE: June 25, 2013 SUBJECT: Solid Waste Assessment
CHAPTER 4 IMPACT FEES
 Change 1, March 11, 2014 12-6 SECTION 12-401. Title, authority, applicability. 12-402. Definitions. 12-403. Intent and purposes. 12-404. Basis for fees. 12-405. Use of fees. 12-406. Fee calculations. 12-407.
Development Program Report for the Bethel Island Area of Benefit
 Julia R. Bueren, Director Deputy Directors R. Mitch Avalon Brian M. Balbas Stephen Kowalewski Stephen Silveira ADOPTED BY BOARD OF SUPERVISORS ON Development Program Report for the Bethel Island August,
RECITALS STATEMENT OF AGREEMENT. Draft: November 30, 2018
 MEMORANDUM OF AGREEMENT TO FACILITATE THE EXPANSION, RENOVATION, AND EFFICIENT AND SAFE OPERATION OF THE ALBEMARLE CIRCUIT COURT, THE ALBEMARLE GENERAL DISTRICT COURT, AND THE CHARLOTTESVILLE GENERAL DISTRICT
Impact Fees in Illinois
 f Impact Fees in Illinois 191 6 Advocacy Educat ion Ethics 201 6 The Purpose of this Report...is to provide information and guidance to aid in the discussion and consideration of impact fees at the local
FINAL SCHOOL IMPACT FEES
 FINAL SCHOOL IMPACT FEES Prepared for: February 10, 2015 4701 Sangamore Road, Suite S240 Bethesda, MD 301.320.6900 www.tischlerbise.com i TABLE OF CONTENTS EXECUTIVE SUMMARY... 1 APPROACH AND METHODOLOGY...
Law Enforcement Impact Fee Update
 Board of County Commissioners Law Enforcement Impact Fee Update January 9, 2018 Presentation Overview Purpose and Background Calculation of Impact Fees Findings of Technical Study Ordinance Review Public
Gadsden County Planning Commission Agenda Report
 Gadsden County Planning Commission Agenda Report Date of Meeting: June 16, 2016 To: From: Subject: Honorable Chairperson and Members of the Planning Commission Allara Mills Gutcher, AICP, Planning & Community
A G E N D A SUISUN CITY COUNCIL CHAMBERS CIVIC CENTER BOULEVARD -- SUISUN CITY, CALIFORNIA
 CITY COUNCIL Pedro Pete M. Sanchez, Mayor Lori Wilson, Mayor Pro-Tem Jane Day Michael J. Hudson Michael A. Segala A G E N D A CITY COUNCIL MEETING First and Third Tuesday Every Month SPECIAL MEETING OF
COMMUNITY OPTION STUDY
 CASEY KEY COMMUNITY OPTION STUDY December 3, 2008 Prepared for Mr. George Scantland Casey Key Committee to Study Incorporation Prepared by Fishkind & Associates, Inc. 12051 Corporate Boulevard Orlando,
TREASURE COAST REGIONAL PLANNING COUNCIL M E M O R A N D U M. To: Council Members AGENDA ITEM 10A
 TREASURE COAST REGIONAL PLANNING COUNCIL M E M O R A N D U M To: Council Members AGENDA ITEM 10A From: Date: Subject: Staff April 20, 2007 Council Meeting Local Government Comprehensive Plan Review Draft
1. Make the following projections by year, including the first and last year in which any construction and/or development takes place:
 11. REVENUE GENERATION SUMMARY A. Project the funds anticipated to be generated by the project. This projection should include any source or use of funds which could have any reasonable connection to the
ORIGINATED BY: Reuben J. Arceo, Community Development Director
 PUBLIC HEARING City Council October 11, 2011 TO: FROM: City Council Thomas E. Robinson, City Manager ORIGINATED BY: Reuben J. Arceo, Community Development Director SUBJECT: RESOLUTION NO. 11-37 ADOPTING
DRAFT REPORT. Boudreau Developments Ltd. Hole s Site - The Botanica: Fiscal Impact Analysis. December 18, 2012
 Boudreau Developments Ltd. Hole s Site - The Botanica: Fiscal Impact Analysis DRAFT REPORT December 18, 2012 2220 Sun Life Place 10123-99 St. Edmonton, Alberta T5J 3H1 T 780.425.6741 F 780.426.3737 www.think-applications.com
AN ORDINANCE AMENDING AND SUPPLEMENTING THE REVISED GENERAL ORDINANCES OF THE CITY OF BAYONNE THE, CHAPTER 33 PLANNING AND DEVELOPMENT REGULATIONS
 AN ORDINANCE AMENDING AND SUPPLEMENTING THE REVISED GENERAL ORDINANCES OF THE CITY OF BAYONNE THE, CHAPTER 33 PLANNING AND DEVELOPMENT REGULATIONS WHEREAS, pursuant to N.J.S.A. 40:48-2, the Legislature
Panama City Beach Fire Service Assessment Information
 Panama City Beach Fire Service Assessment Information On November 9, 2017, the City of Panama City Beach scheduled a public hearing for January 11, 2018 to consider the adoption of a special assessment
POWAY UNIFIED SCHOOL DISTRICT ADMINISTRATION REPORT FISCAL YEAR 2017/2018 IMPROVEMENT AREA NO. 1 OF COMMUNITY FACILITIES DISTRICT NO.
 POWAY UNIFIED SCHOOL DISTRICT ADMINISTRATION REPORT FISCAL YEAR 2017/2018 IMPROVEMENT AREA NO. 1 OF COMMUNITY FACILITIES DISTRICT NO. 2 JUNE 29, 2017 PREPARED FOR: Poway Unified School District Planning
Settlement Pattern & Form with service costs analysis Preliminary Report
 Settlement Pattern & Form with service costs analysis Preliminary Report Prepared for Regional Planning Halifax Regional Municipality by Financial Services, HRM May 15, 2004 TABLE OF CONTENTS INTRODUCTION...
Board Meeting Handout ACCOUNTING FOR CONTINGENCIES September 6, 2007
 PURPOSE Board Meeting Handout ACCOUNTING FOR CONTINGENCIES September 6, 2007 At today s meeting, the Board will discuss whether to add to its technical agenda a project considering whether to revise the
Table 1: Maximum Allowable PIFs Under Industry Standard Calculation Methods (3/4" Connection Size)
") MEMO To: From: Chris Matkins, General Manager, South Fort Collins Sanitation District John Wright, Project Manager Rick Giardina, Project Director Date: Re: Plant Investment Fee Technical Memorandum I.
MEMO To: From: Chris Matkins, General Manager, South Fort Collins Sanitation District John Wright, Project Manager Rick Giardina, Project Director Date: Re: Plant Investment Fee Technical Memorandum I.
Cabarrus County, NC Adequate Public Facilities Ordinance. Contents
 Contents Section 15. Adequate Public Facilities Standards.... 2 Section 15-1. Introduction.... 2 Section 15-2. How to Use this Chapter.... 3 Section 15-3. Basic Terms and Definitions... 4 Section 15-4.